financial ratios approach to evaluating financial...
TRANSCRIPT

International Journal of Academic Research in Business and Social Sciences June 2016, Vol. 6, No. 6
ISSN: 2222-6990
150 www.hrmars.com
Financial Ratios Approach to Evaluating Financial Performance of Cal Bank Ghana from 2010 to 2014
Eric Kwaku Attefah Department of Accountancy and Accounting Information Systems
Faculty of Business and Management Studies Kumasi Polytechnic
Email: [email protected]
Ernest Appiah Darko Department of Accountancy and Accounting Information Systems
Faculty of Business and Management Studies Kumasi Polytechnic
Email: [email protected]
DOI: 10.6007/IJARBSS/v6-i6/2190 URL: http://dx.doi.org/10.6007/IJARBSS/v6-i6/2190
ABSTRACT This study was undertaken to evaluate financial performance of Cal Bank Limited. Its main objective was to examine empirically the financial performance of the bank in terms of its financial healthiness, liquidity, profitability, credit risk and solvency and efficiency for the period of 2010-2014. The study employed Altman Z-Score which combines five common ratios in a multivariate formula for predicting financial healthiness, financial ratios such as Return on Asset (ROA), Return on Equity (ROE), Profit Expense Ratio (PER), Loan to Deposit ratio (LDR), Cash To Deposit Ratio (CDR), Loan to Assets Ratio (LAR), Debt to Equity Ratio (DER), Debt to Total Asset Ratio (DTAR), Equity Multiplier (EM), Asset Utilization (AU), Income to Expense ratio (IER) and Operating Efficiency (OE). This study found that the bank had been financially healthy within the five years under study and all results of profitability ratios indicate that Cal Bank was profitable. Cal Bank was consistently improving and performing better in making good returns on Investment (assets), satisfying their shareholders in offering competitive or even better returns, making good returns customers’ deposits and also managing their operating expenses over the years. Besides, an overall analysis of all liquidity, efficiency, and risk and solvency measures reveals that Cal Bank was less liquid, efficient in asset utilization, income generation, and managing its expenses and less risky and more solvent. However, the results also show that Cal Bank is improving overtime considerably in these liquidity, efficiency and risk & solvency measures during the period under the study.
International Journal of Academic Research in Business and Social Sciences June 2016, Vol. 6, No. 6
ISSN: 2222-6990
151 www.hrmars.com
INTRODUCTION Assessing the health of an economy can be accomplished by studying the financial performance of its banks, (Ahmad & Hassan, 2007). The banking and financial industry has become a reality in today's economy, as it is witnessing a growing both in terms of the number of such institutions, or in terms of the amount of money managed by or diversity activities (Bashir, 2001). In spite of this progress and successes achieved by the banking and financial institutions, they still have challenges which require further intensive efforts on the part of these institutions (Fratiani & Francesco, 2009). Such efforts enhance the quality of its products and services and diversity and to keep pace with the rapid developments taking place in the world in this field. According to Iqbal and Molyneux (2005), banks play very useful and dynamic role in the economic life of every modern state. A study of the economic history of western country shows that without the evolution of commercial banks in the 18th and 19th centuries, the industrial revolution would not have taken place in Europe (Hassan, 2005). Banks afford facilities for saving and, thus encourage the habits of thrift and industry in the community. They mobilize the ideal and dormant capital of the country and make it available for productive purposes (Benton & James, 2005). Banking crises have developed many times throughout history, when one or more risks have materialized for a banking sector as a whole. Prominent examples include the Japanese banking crisis during the 1990s, and the sub-prime mortgage crisis in the 2000s and the Merchant Bank of Ghana now Universal Merchant Bank in the early 2013. Usually, the governments bail out the bank through rescue plan or individual public intervention (Farooq, 2003). Moreover, Rising and stiff competition, deregulation, globalization, and continuous innovation to provide acceptable financial services to customers have given rise to the interest of all the concerned and interested parties in detailed critical evaluation of banks (Banking, 2010). Unlike in the past, banks can no longer earn legally mandated yield spreads between the average interest rates earned on sources and uses of funds. Nor can banks continue to reap monopoly rents from bank charters that naturally endowed them with a considerable degree of market power (Saleh & Rami, 2006). Instead, today’s more competitive banking environment is causing banking institutions to evaluate carefully the risks and returns involved in serving the needs of the public (Benton & James, 2005). Various groups of individuals are particularly interested in evaluating banks financial performance. First and foremost, Samad et al. (2000) mention that bank shareholders are directly affected by bank performance. Investors take advantage of bank information to develop expectations concerning future performance that can be used to help price common shares (in addition to capital notes and debentures that may be issued by the bank). Second, bank management traditionally is evaluated on the basis of how well the bank performs relative to previous years and compared with similar (or peer group) banks. Hence, employees’ salaries and promotions are frequently tied to the performance of the bank. Bankers also need to be informed about the condition of other banks with which they have business dealings (Abdus, 2004). Third, regulators, concerned about the safety and soundness of the banking system and the preservation of public confidence, monitor banks using on site examinations and computer
International Journal of Academic Research in Business and Social Sciences June 2016, Vol. 6, No. 6
ISSN: 2222-6990
152 www.hrmars.com
based “early warning systems” to keep track of bank performance (Bhushan, 2008). Fourth, depositors may also be interested in evaluating the performance of the bank, as the nominal values of their deposits are not guaranteed. Fifth, and last the business community and general public should be concerned about their banks’ performance to the extent that their access to credit and other financial services is linked to the success or failure of their bank (Benton & James, 2005). Furthermore, numerous studies argue that the efficiency of financial intermediation affects economic growth while others indicate that bank insolvencies can result in systemic crises, which have adverse consequences for the economy as a whole (Gitman, 2004). Thus, the performance of banks has been an issue of major interest for various stakeholders such as depositors, regulators, customers, and investors. However, for both existing and potential shareholders to be able to make more informed economic decisions there is the need to assess the financial performance of an organization over a period of time to reveal the trend of various performance indicators (Hempel & Simonson, 1999). This research therefore seeks to evaluate the performance of Cal Bank Limited over the past five years to enable shareholders make informed economic decisions. Objectives of the Study The overall objective of the study is to evaluate the financial performance of Cal Bank. Specific Objectives The specific objectives of the study are: To assess the trend of Cal Bank’s financial health using Z-score analysis. To analyze the risk and solvency position of Cal bank. To examine the overall profitability of Cal bank. To find out the liquidity position of Cal bank. To evaluate how effectively and efficiently the bank is utilizing its assets. REVIEW OF RELATED LITRATURE The theoretical framework part presents meaning of financial statements, Presentation of Bank Financial Statements, Meaning of Financial Statement Analysis, Objective of Financial Statement Analysis, and Tools for Financial Analysis used in the financial performance evaluation of banks. The empirical studies part presents various related researches and their results. Theoretical Framework The problem of banking and financial system soundness has become more important in all countries over the recent years (Jagels & Coltman, 2003). The financial sector, and especially the banking system, is vulnerable to systemic crises which has led to the creation of costly safety nets, as depositor insurance schemes with well-known moral hazard problem (Neely & Wheelock, 1997). It is argued that there is increasing evidence that banks are “black boxes” due to the week transparency and banks’ unwillingness to disclose information (Peters et al., 2004).
International Journal of Academic Research in Business and Social Sciences June 2016, Vol. 6, No. 6
ISSN: 2222-6990
153 www.hrmars.com
To measure banks’ creditworthiness and risk exposures is a complicated issue and it is not easy to interpret banks’ accounting data. Kosmidou (2008), argued that “Indicators of business failures and nonperforming loans are also usually available only at low frequencies, if at all; the latter are also made less informative by banks desire to hide their problems for as long as possible.” This means that it is needed to use as fully and complexly as possible all available financial information from the official financial statements of banks for making financial analysis of banks’ performance (Westerfield & Jaffe, 2005). Currently, bank regulators commonly use the traditional method of financial indices based on the financial statements to evaluate banks’ financial performance (Abdus, 2004). Altman’s Z–Score Financial Analysis Tool The Z-score formula for predicting bankruptcy by Edward I. Altman is a multivariate formula that measures the financial health of a company and a powerful diagnostic tool that forecasts and predicts the probability of bankruptcy within two years. Studies measuring the effectiveness of the Z-score have shown the model to be accurate with over 70% reliability (Eidleman, 1995). The Z-score combines five common business ratios using a weighting system calculated by Altman using eight variables from a company’s financial statements – working capital (current assets less current liabilities), earnings before interests and tax, retained earnings, sales, market value of equity, total assets and total liabilities to determine the likelihood of bankruptcy (Gentry, 1985). The weighting system was originally based on data from publicly held manufacturers, but has since been modified for private manufacturing, non-manufacturing and service companies (Ohlson, 1980). Z-scores attempt to replace various independent and often unreliable and misleading historical ratios and subjective rule-of-thumb tests with scientifically analyzed ratios which can reliably predict future events by identifying benchmarks above which ‘all’s well’ and below which there is imminent danger (Gentry, 1984). Z-scores provide a single-value score to describe the combination of a number of key characteristics of a company. Some of the most important predictive ratios are weighted according to perceived importance and then summed to give the single Z-score which is then evaluated against the identified yardstick or benchmark (Elliott & Elliott, 2006). Breaking down the Z Altman (1968) examines why the following particular ratios are included in the Z-score formula for predicting the corporate health of an organization and their significance: A working capital/total asset (WC/TA) is a ratio that is a good test for corporate distress. A firm with negative working capital is likely to experience problems meeting its short-term obligations - because there are simply not enough current assets to cover them. By contrast, a firm with significantly positive working capital rarely has trouble paying its bills. Retained earnings/total assets (RE/TA) measures the amount of reinvested earnings or losses, which reflects the extent of the company's leverage. Companies with low RE/TA are financing

International Journal of Academic Research in Business and Social Sciences June 2016, Vol. 6, No. 6
ISSN: 2222-6990
154 www.hrmars.com
capital expenditure through borrowings rather than through retained earnings. Companies with high RE/TA suggest a history of profitability and the ability to stand up to a bad year of losses. Earnings before interest and tax/total assets (EBIT/TA ) is a version of return on assets (ROA), an effective way of assessing a firm's ability to squeeze profits from its assets before factors like interest and tax are deducted. Market value of equity/total liabilities (ME/TL) is a ratio that shows - if a firm were to become insolvent - how much the company's market value would decline before liabilities exceed assets on the financial statements. This ratio adds a market value dimension to the model that isn't based on pure fundamentals. In other words, a durable market capitalization can be interpreted as the market's confidence in the company's solid financial position. Sales/total assets (S/TA) tells investors how well management handles competition and how efficiently the firm uses assets to generate sales. Failure to grow market share translates into a low or falling S/TA. Interpretation of the Z-Score According to Altman (2002), the lower the score, the higher are the odds of bankruptcy. A Z-score of lower than 1.8 indicates that the probability of financial embarrassment is very high and that the company is likely heading for bankruptcy. Companies with scores above 3 are safe and unlikely to enter into bankruptcy. Scores in between 1.8 and 3 lie in a gray area where scores from 1.8 and 2.7 indicate good chances of the company going bankrupt within two years of operations from the date of financial figures given and from 2.7 to 2.9 is an alert zone. This zone is an area where a company should exercise great caution (Altman, 1968). Review of Empirical Studies Below are a summary of previous Empirical studies on financial performance analysis in the context of different countries. Hempel and Simonson (1998) have made a study on bank's financial performance and managerial efficiency in Taiwan. The study found that the higher the ROA, the higher is the financial performance or profitability of the banks. Abdus (2004) and Samad et al. (2000) in their papers examine the comparative performance of Bahrain’s interest-free Islamic banks and the interest-based conventional commercial banks during the Post-Gulf War period 1991-2001. Using nine financial ratios in measuring the performances with respect to profitability, liquidity risk, and credit risk, and applying Student’s t-test to these financial ratios, the paper concludes that there exists a significant difference in credit performance between the two sets of banks. However, the study finds no major difference in profitability and liquidity performances between Islamic banks and conventional banks. Ahmad and Hassan (2007) analyzed the asset quality, capital ratios, operational ratios such as net profit margin, net interest income, income to asset ratio, non-interest income to asset ratio and liquidity ratios for five years from 2010 to 2014. Islamic banks on an average were the preeminent performer in terms of lowest non-performing to gross loan ratio, capital funds to total asset ratio, capital funds to net loans ratio, capital funds to short-term loan ratio, capital funds to liabilities ratio, non-interest expense to average asset ratio and most of the liquidity ratios. Therefore, it can be concluded that Islamic

International Journal of Academic Research in Business and Social Sciences June 2016, Vol. 6, No. 6
ISSN: 2222-6990
155 www.hrmars.com
banks are outperforming others in capital adequacy and adequate liquidity. Except Return on Equity Ratio, Islamic Banks were at par with the industry in all other cases. METHODOLOGY This chapter presents the methodological concerns used in conducting this research and provides a justification for steps taken. It covers the general research perspectives, data collection summary, statistical measurement methods. Research Paradigm This study was a quantitative research because it involved measurement of variables and the delivery of findings in numerical form and also of trend analysis approach. Research Design According to time dimension, research can be cross-sectional study or longitudinal study. This study employed a cross-sectional because it was carried out at one point in time only and also of trend analysis approach. The trend of financial performance in terms of profitability, liquidity, efficiency, risk and solvency in their respective ratios were used. Source and Instruments of Data collection The source of data for this study was predominantly from secondary sources. However, the data needed for this study were gathered from both Secondary and primary sources. The audited annual financial reports for the selected bank during the year 2010 to 2014 were used as a source of secondary data. Help of other sources like literature from various books, journals, newspapers, reports of the Bank of Ghana and various websites, were also used as a source of secondary data. Secondary data was collected through personal review of the above listed sources and types of data. In this study, the accounting based financial ratios were used as a measure of financial performance. Sampling The issue of sampling in this study has little significance, as the main aim of this study was a study to evaluate the financial performance of Cal Bank as sample for the study using non-probability design based on subjective judgment (purposive sampling). Data Analysis The collected data through the above tools was analyzed using the techniques of ratio analysis to find out the true picture of the financial performance of Cal Bank Limited over the recent five years. Finally, trend analysis was made. The analyzed data was presented using tables and diagrams that are appropriate to explain the facts.
International Journal of Academic Research in Business and Social Sciences June 2016, Vol. 6, No. 6
ISSN: 2222-6990
156 www.hrmars.com
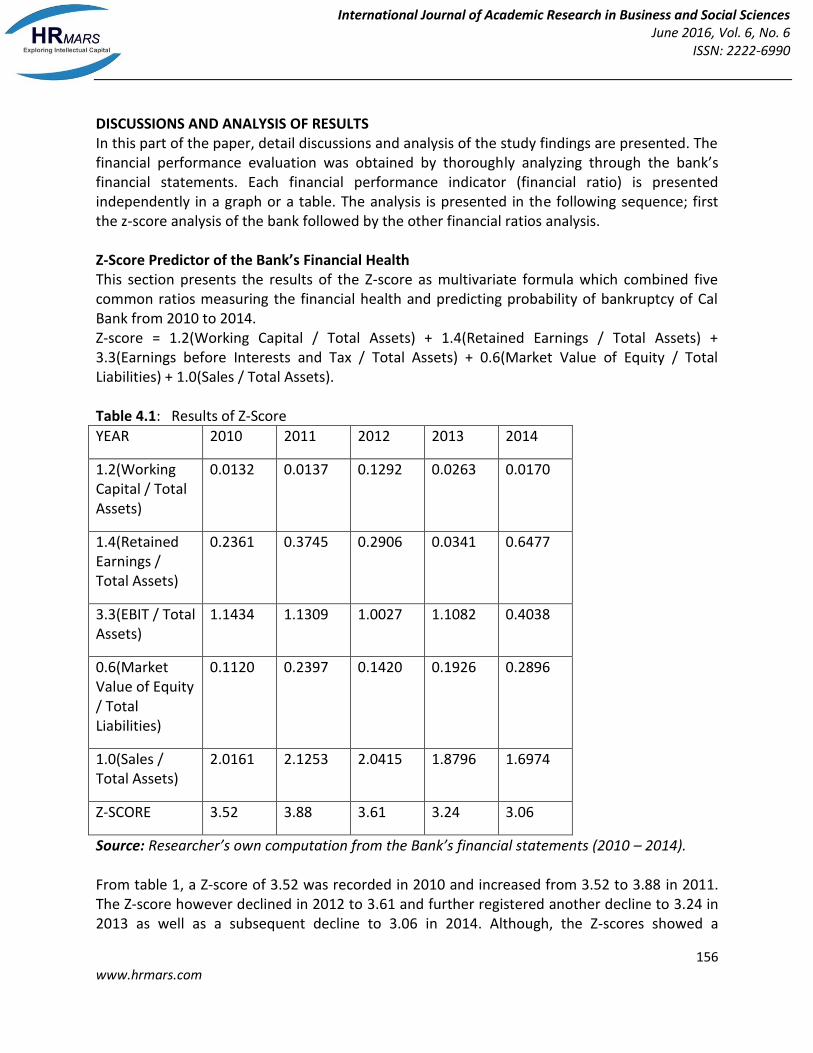
DISCUSSIONS AND ANALYSIS OF RESULTS In this part of the paper, detail discussions and analysis of the study findings are presented. The financial performance evaluation was obtained by thoroughly analyzing through the bank’s financial statements. Each financial performance indicator (financial ratio) is presented independently in a graph or a table. The analysis is presented in the following sequence; first the z-score analysis of the bank followed by the other financial ratios analysis. Z-Score Predictor of the Bank’s Financial Health This section presents the results of the Z-score as multivariate formula which combined five common ratios measuring the financial health and predicting probability of bankruptcy of Cal Bank from 2010 to 2014. Z-score = 1.2(Working Capital / Total Assets) + 1.4(Retained Earnings / Total Assets) + 3.3(Earnings before Interests and Tax / Total Assets) + 0.6(Market Value of Equity / Total Liabilities) + 1.0(Sales / Total Assets). Table 4.1: Results of Z-Score
YEAR 2010 2011 2012 2013 2014
1.2(Working Capital / Total Assets)
0.0132 0.0137 0.1292 0.0263 0.0170
1.4(Retained Earnings / Total Assets)
0.2361 0.3745 0.2906 0.0341 0.6477
3.3(EBIT / Total Assets)
1.1434 1.1309 1.0027 1.1082 0.4038
0.6(Market Value of Equity / Total Liabilities)
0.1120 0.2397 0.1420 0.1926 0.2896
1.0(Sales / Total Assets)
2.0161 2.1253 2.0415 1.8796 1.6974
Z-SCORE 3.52 3.88 3.61 3.24 3.06
Source: Researcher’s own computation from the Bank’s financial statements (2010 – 2014). From table 1, a Z-score of 3.52 was recorded in 2010 and increased from 3.52 to 3.88 in 2011. The Z-score however declined in 2012 to 3.61 and further registered another decline to 3.24 in 2013 as well as a subsequent decline to 3.06 in 2014. Although, the Z-scores showed a

International Journal of Academic Research in Business and Social Sciences June 2016, Vol. 6, No. 6
ISSN: 2222-6990
157 www.hrmars.com
consistent reduction from 2011 up to 2014, each year in the five year period from 2010 to 2014, the Z-score recorded above 3.0 – a revelation of the fact that financial performance of Cal Bank was very healthy and financially safe devoid of the likelihood of any sign of bankruptcy (Altman, 1968). Profitability Ratios From conceptual point of view, profitability represents the modality to achieve the major goal of bank's activity, respectively the maximization of profit in minimization risk conditions. In order to see how Cal bank has profitable over five years under the study, the study uses three profitability ratios namely, Return on assets (ROA), Return on Equity (ROE) and Profit Expense Ratio (PER). Return on Assets (ROA) ROA according to Van Horne and Wachowics (2005) is the ratio of profit after tax to total asset. It reflects the efficiency with which banks deploy their assets. The higher the ROA, the most profitable is the bank. The result indicates several important facts. As it can be seen from Figure 4.5, First, ROA of Cal bank in 2010 and 2011 were in a constant trend but increased drastically during the year 2012 and 2013, by 0.04%, and 0.06% respectively. This is as a result of the control of business expenses and also an investment of the business assets. Furthermore in 2014, ROA of Cal bank decreased the trend to 0.05% under the study as a result of percentage increase in the total Assets in that year. Above all the profitability trend of the bank was good. Table 4.2 Return on Assets (ROA)
Year 2010 2011 2012 2013 2014
% 0.02 0.02 0.04 0.06 0.05
Source: Researcher’s own computation from the Bank’s financial statements (2010 – 2014) Figure 4.1: Return on Assets (ROA) Trend
Profit Expense

International Journal of Academic Research in Business and Social Sciences June 2016, Vol. 6, No. 6
ISSN: 2222-6990
158 www.hrmars.com
Ratio (PER) This ratio indicates profitability of the firm with regard to its total expenses. A high value of this ratio indicates that bank could make high profit with a given expenses (Gitman, 2004). The analysis of PER of Cal Bank indicates that the bank have generated consistently higher profit of every year. As per the analysis the Cal bank was 0.43 in 2010 which increase by 1.45% from 0.43 in 2010 to 1.88% in 2014. This is as a result of a constants expenses or a decrease in expenses within the period under study. This study shows that the bank is making profit. Table 4.3: Profit to Expense Ratio (PER)
Year 2010 2011 2012 2013 2014
% 0.43 0.73 1.35 1.74 1.88
Source: Researcher’s own computation from the Bank’s financial statements (2010 – 2014). Figure 4.2 Profit to Expense Ratio (PER) Trends
Return on Equity (ROE) This ratio indicates how bank can generate profit with the money shareholders have invested. The higher value of this ratio shows higher financial performance. This ratio is also an indicator for managerial efficiency (Bernstein & Wild, 1998). Similar to ROA from the study ROE of the bank under the study, the researcher underpin some important points to consider. The results in table 4.3 shows that the ROE of Cal bank has been of more increase from 0.12% in 2010 to 0.20% in 2012 as compare in 2013 and 2014 which ROE was slightly less from 0.33% in 2013 to 0.36% in 2014. This is as a result of an increase in sales turnover by selling more business product or services. Again it may be seen that the company increase profit margin between the years 2010 to 2012. However the trend of ROE of Cal bank indicates that the bank is generating profit on Shareholders investment.

International Journal of Academic Research in Business and Social Sciences June 2016, Vol. 6, No. 6
ISSN: 2222-6990
159 www.hrmars.com
Table 4.4 Return on Equity (ROE)
Year 2010 2011 2012 2013 2014
% 0.12 0.20 0.24 0.33 0.36
Source: Researcher’s own computation from Bank’s financial statements (2010 – 2014). Figure 4.3. Return on Equity (ROE).
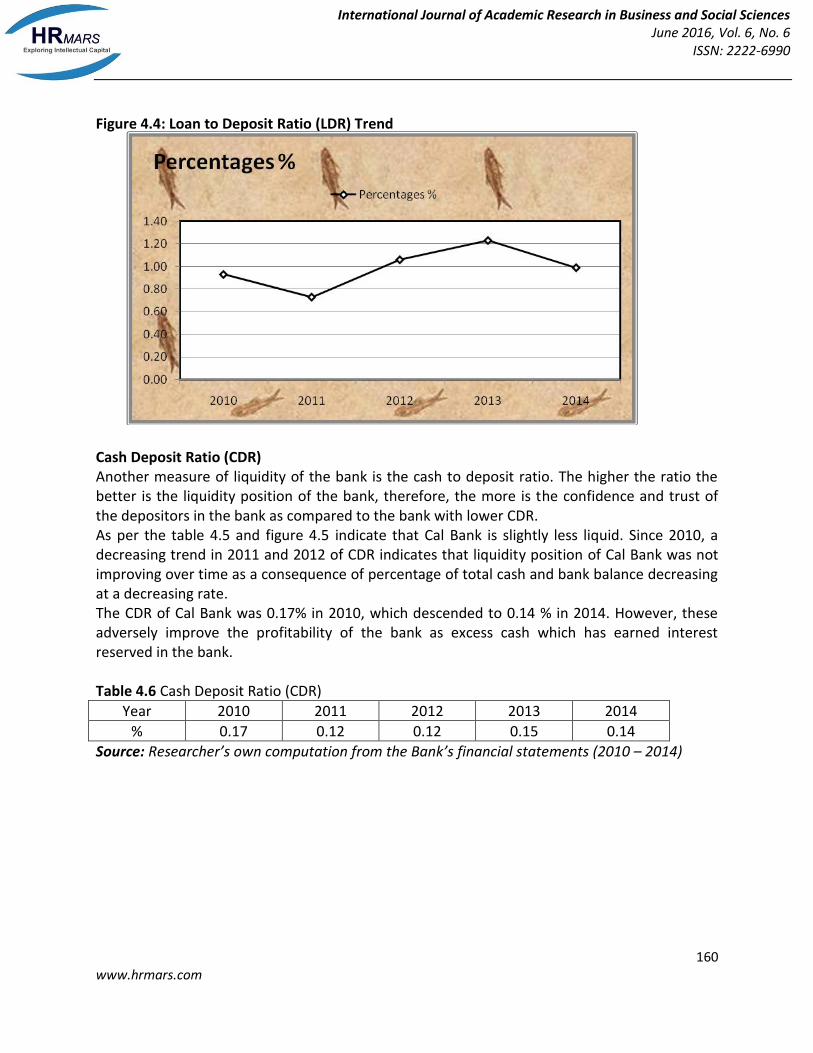
Liquidity Ratio The liquidity ratios measure the capability of bank to meet its short-term obligations. Generally, the higher value of this ratio indicates that firm has larger margin safety to cover its short-term obligations (Fabozzi & Peterson, 2003). Among the various liquidity measures, the study uses the following three liquidity ratios. Loan to Deposit Ratio High loan to deposit ratio for Cal bank during 2010-2014 indicates that Cal bank has been comparatively less liquid (see table 4.4 and Fig.4.4). LDR of Cal bank decreased from 0.93% in 2010 to 0.73% in 2014. This overall declining trend in LDR of Cal bank indicates the tendency of comparatively more increase in deposits than loans and further emphasizes improved liquidity position of Cal bank. Alternatively, LDR of Cal bank decreased from 1.23% in 2013 to 0.99 in 2014 as a consequence of the National Bank of Ghana set a maximum outstanding loan limit to all banks in the country to control inflation. Moreover, this reveals that the bank may not be earning as much as they could be. Table 4.5: Loan to Deposit Ratio (LDR)
Year 2010 2011 2012 2013 2014
% 0.93 0.73 1.06 1.23 0.99
Source: Researcher’s own computation from the Bank’s financial statements (2010 – 2014).
International Journal of Academic Research in Business and Social Sciences June 2016, Vol. 6, No. 6
ISSN: 2222-6990
160 www.hrmars.com
Figure 4.4: Loan to Deposit Ratio (LDR) Trend
Cash Deposit Ratio (CDR) Another measure of liquidity of the bank is the cash to deposit ratio. The higher the ratio the better is the liquidity position of the bank, therefore, the more is the confidence and trust of the depositors in the bank as compared to the bank with lower CDR. As per the table 4.5 and figure 4.5 indicate that Cal Bank is slightly less liquid. Since 2010, a decreasing trend in 2011 and 2012 of CDR indicates that liquidity position of Cal Bank was not improving over time as a consequence of percentage of total cash and bank balance decreasing at a decreasing rate. The CDR of Cal Bank was 0.17% in 2010, which descended to 0.14 % in 2014. However, these adversely improve the profitability of the bank as excess cash which has earned interest reserved in the bank. Table 4.6 Cash Deposit Ratio (CDR)
Year 2010 2011 2012 2013 2014
% 0.17 0.12 0.12 0.15 0.14
Source: Researcher’s own computation from the Bank’s financial statements (2010 – 2014)

International Journal of Academic Research in Business and Social Sciences June 2016, Vol. 6, No. 6
ISSN: 2222-6990
161 www.hrmars.com
Figure 4.5: Cash to Deposit Ratio (CDR) Trend
Loan to Asset Ratio (LAR) The loan to assets ratio measures the total loans outstanding as a percentage of total assets. The higher this ratio indicates a bank is loaned up and its liquidity is low. The higher the ratio, the more risky a bank may be to higher defaults (Mikhan & Jain, 2007). Table 4.6 and Figure 4.6 shows that, LAR of Cal bank is on increasing trend over the years under the study except it increase in 2013 to 2014. This increasing trend of Cal Bank LAR during the period is palpable evidence of more financial stress, which Cal Bank is taking by making excessive loans and holding less liquid assets during the periods. However, this is an indication of potential betterment in profitability and conforms to my results drawn from profitability ratios of Cal Bank for the period. Therefore, overall result of LAR indicates that Cal Bank is less liquid during the five years (2010 -2014) under study. Table 4.7: Loan to Asset Ratio (LAR)
Year 2010 2011 2012 2013 2014
% 0.51 0.52 0.64 0.63 0.49
Source: Researcher’s own computation from the Bank’s financial statements (2010 – 2014)

International Journal of Academic Research in Business and Social Sciences June 2016, Vol. 6, No. 6
ISSN: 2222-6990
162 www.hrmars.com
Figure 4.6: Loans to Asset Ratio (LAR) Trend
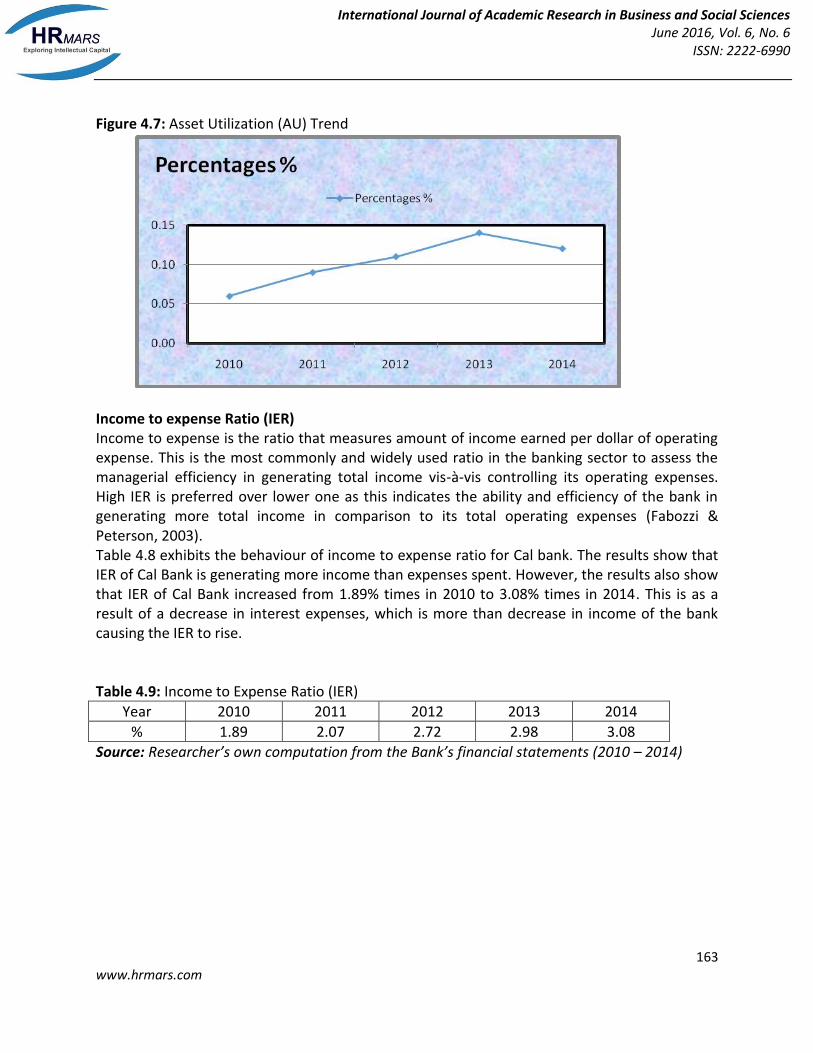
Efficiency Ratios These ratios measure how effectively and efficiently the firm is managing and controlling its assets. A firm is technically efficient if it produces a given set of outputs using the smallest possible amount of inputs (Gitman, 2004). Outputs could be loans or total balance of deposits, while inputs include labour, capital and other operating costs. Ratios used to measure efficiency of the Cal bank are Asset Utilization (AU), Income to Expense Ratio (IER), and Operating efficiency (OE). Asset Utilization (AU) This ratio measures capability of firm to generate revenue with its asset. The high value of this ratio indicates the high productivity of firm’s asset. The behaviour of the line in Table 4.7 and Fig 4.7 reveals some useful information about AU of Cal Bank. Having increase from 0.06% in 2010 to 0.14% in 2013, AU of Cal Banks showed a downward trend of 0.12 % in 2014. Specifically this may be due to an increasing trend of net interest income of the bank during the period under study. This proves that Cal bank is more efficient in utilization of the assets in generating total income (revenue). Table 4.8: Asset Utilization (AU)
Year 2010 2011 2012 2013 2014
% 0.06 0.09 0.11 0.14 0.12
Source: Researcher’s own computation from the Bank’s financial statements (2010 – 2014)
International Journal of Academic Research in Business and Social Sciences June 2016, Vol. 6, No. 6
ISSN: 2222-6990
163 www.hrmars.com
Figure 4.7: Asset Utilization (AU) Trend
Income to expense Ratio (IER) Income to expense is the ratio that measures amount of income earned per dollar of operating expense. This is the most commonly and widely used ratio in the banking sector to assess the managerial efficiency in generating total income vis-à-vis controlling its operating expenses. High IER is preferred over lower one as this indicates the ability and efficiency of the bank in generating more total income in comparison to its total operating expenses (Fabozzi & Peterson, 2003). Table 4.8 exhibits the behaviour of income to expense ratio for Cal bank. The results show that IER of Cal Bank is generating more income than expenses spent. However, the results also show that IER of Cal Bank increased from 1.89% times in 2010 to 3.08% times in 2014. This is as a result of a decrease in interest expenses, which is more than decrease in income of the bank causing the IER to rise. Table 4.9: Income to Expense Ratio (IER)
Year 2010 2011 2012 2013 2014
% 1.89 2.07 2.72 2.98 3.08
Source: Researcher’s own computation from the Bank’s financial statements (2010 – 2014)

International Journal of Academic Research in Business and Social Sciences June 2016, Vol. 6, No. 6
ISSN: 2222-6990
164 www.hrmars.com
Figure 4.8: Income to expense Ratio (IER) Trend
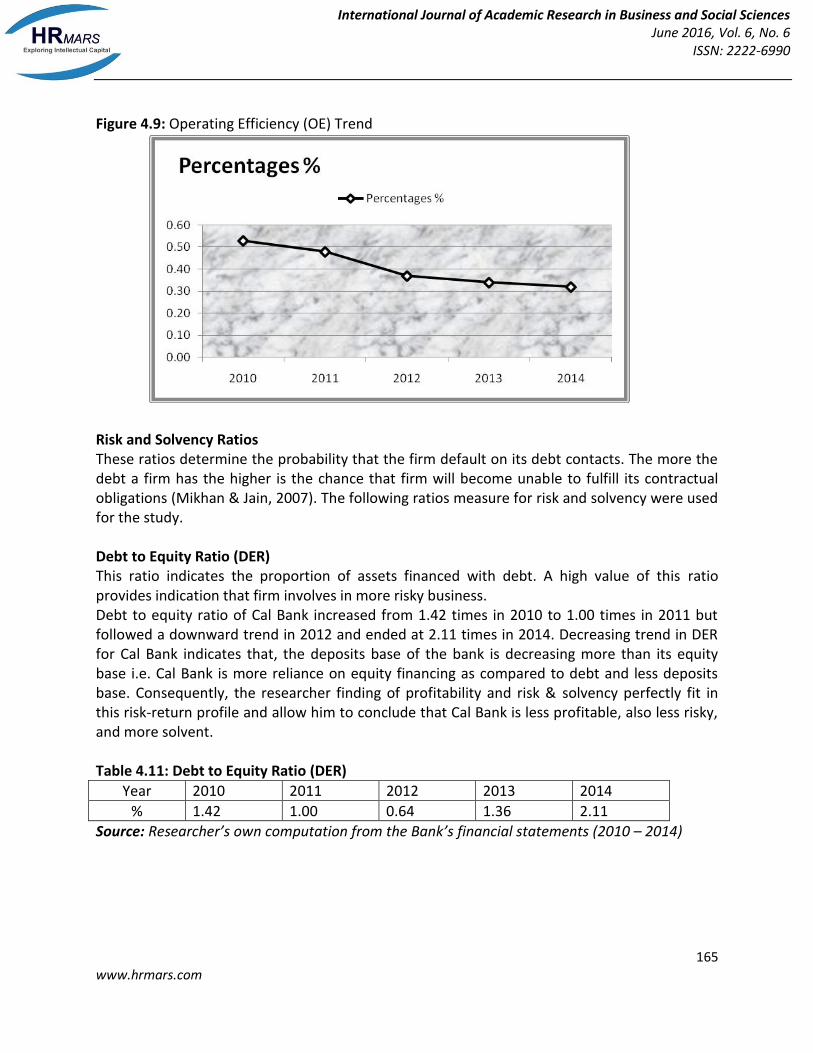
Operating Efficiency (OE) Operating efficiency is the ratio that measures the amount of operating expense per dollar of operating revenue. It measures managerial efficiency in generating operating revenues and controlling its operating expenses. In other words, how efficient is the bank in its operations. Lower OE is preferred over higher OE as lower OE indicates that operating expenses are lower than operating revenues. Operating efficiency analysis strengthens IER result that Cal Bank is less efficient in managing its operating expenses and generating less operating revenues. Particularly, in 2010, the difference in performance was huge which, however, reduced drastically in 2014. This may be a high increase of inflation during the period under study. However this study is evidence that Cal Bank is improving considerably in managing its operations expenses over the years. Table 4.10 Operating Efficiency (OE)
Year 2010 2011 2012 2013 2014
% 0.53 0.48 0.37 0.34 0.32
Source: Researcher’s own computation from the Bank’s financial statements (2010 – 2014)
International Journal of Academic Research in Business and Social Sciences June 2016, Vol. 6, No. 6
ISSN: 2222-6990
165 www.hrmars.com
Figure 4.9: Operating Efficiency (OE) Trend
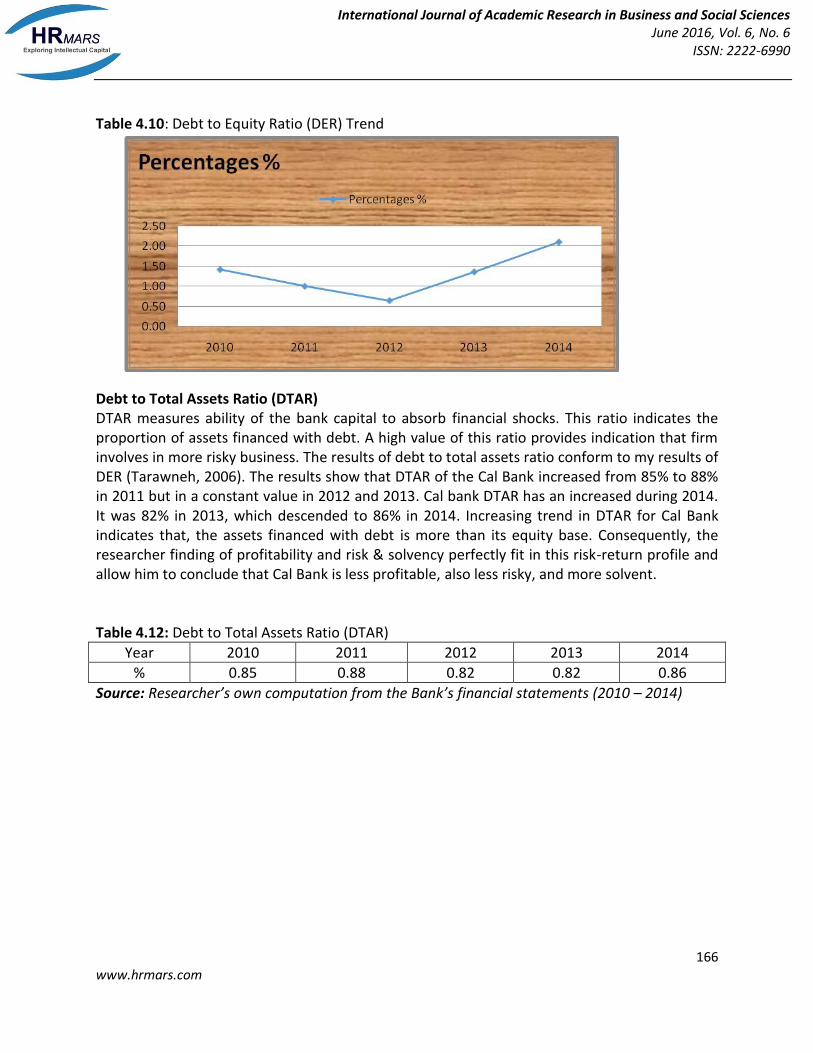
Risk and Solvency Ratios These ratios determine the probability that the firm default on its debt contacts. The more the debt a firm has the higher is the chance that firm will become unable to fulfill its contractual obligations (Mikhan & Jain, 2007). The following ratios measure for risk and solvency were used for the study. Debt to Equity Ratio (DER) This ratio indicates the proportion of assets financed with debt. A high value of this ratio provides indication that firm involves in more risky business. Debt to equity ratio of Cal Bank increased from 1.42 times in 2010 to 1.00 times in 2011 but followed a downward trend in 2012 and ended at 2.11 times in 2014. Decreasing trend in DER for Cal Bank indicates that, the deposits base of the bank is decreasing more than its equity base i.e. Cal Bank is more reliance on equity financing as compared to debt and less deposits base. Consequently, the researcher finding of profitability and risk & solvency perfectly fit in this risk-return profile and allow him to conclude that Cal Bank is less profitable, also less risky, and more solvent. Table 4.11: Debt to Equity Ratio (DER)
Year 2010 2011 2012 2013 2014
% 1.42 1.00 0.64 1.36 2.11
Source: Researcher’s own computation from the Bank’s financial statements (2010 – 2014)
International Journal of Academic Research in Business and Social Sciences June 2016, Vol. 6, No. 6
ISSN: 2222-6990
166 www.hrmars.com
Table 4.10: Debt to Equity Ratio (DER) Trend
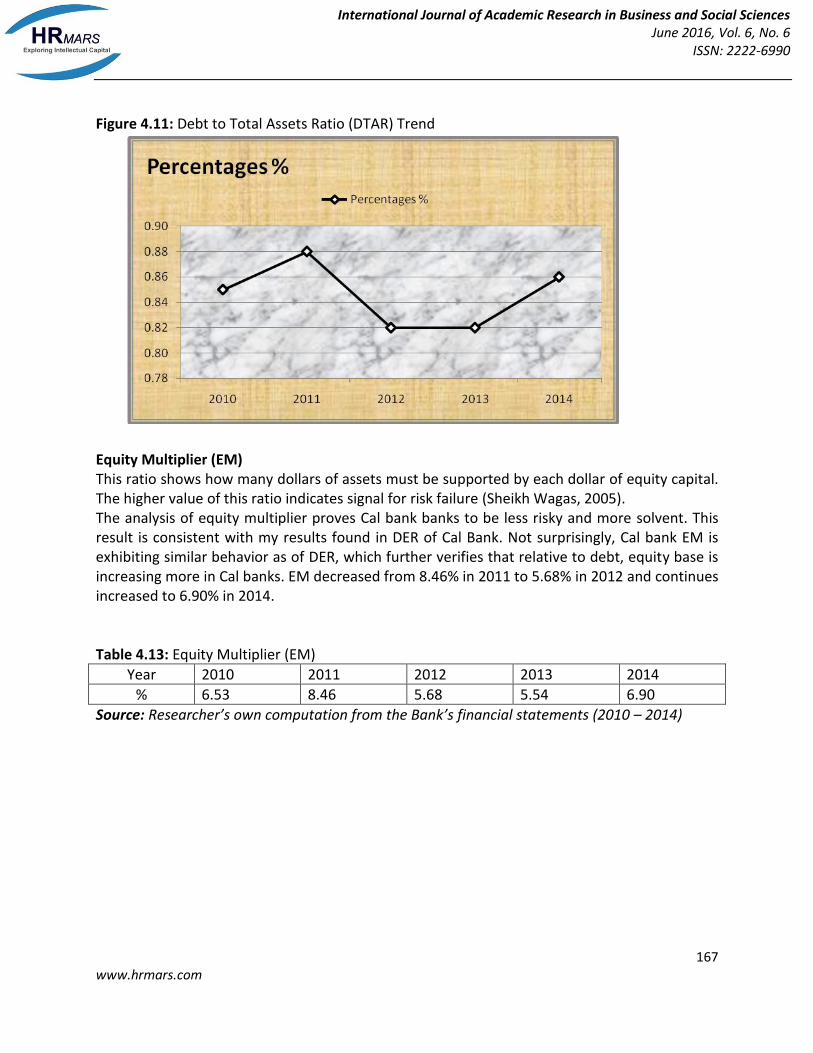
Debt to Total Assets Ratio (DTAR) DTAR measures ability of the bank capital to absorb financial shocks. This ratio indicates the proportion of assets financed with debt. A high value of this ratio provides indication that firm involves in more risky business. The results of debt to total assets ratio conform to my results of DER (Tarawneh, 2006). The results show that DTAR of the Cal Bank increased from 85% to 88% in 2011 but in a constant value in 2012 and 2013. Cal bank DTAR has an increased during 2014. It was 82% in 2013, which descended to 86% in 2014. Increasing trend in DTAR for Cal Bank indicates that, the assets financed with debt is more than its equity base. Consequently, the researcher finding of profitability and risk & solvency perfectly fit in this risk-return profile and allow him to conclude that Cal Bank is less profitable, also less risky, and more solvent. Table 4.12: Debt to Total Assets Ratio (DTAR)
Year 2010 2011 2012 2013 2014
% 0.85 0.88 0.82 0.82 0.86
Source: Researcher’s own computation from the Bank’s financial statements (2010 – 2014)
International Journal of Academic Research in Business and Social Sciences June 2016, Vol. 6, No. 6
ISSN: 2222-6990
167 www.hrmars.com
Figure 4.11: Debt to Total Assets Ratio (DTAR) Trend
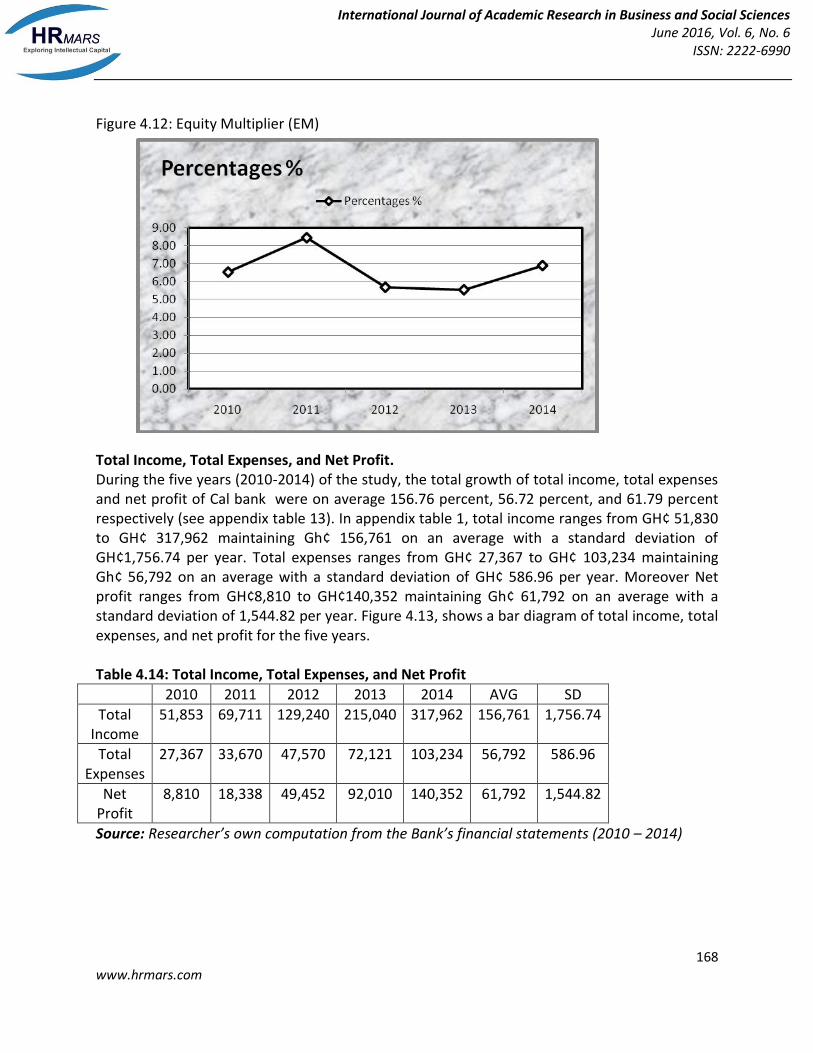
Equity Multiplier (EM) This ratio shows how many dollars of assets must be supported by each dollar of equity capital. The higher value of this ratio indicates signal for risk failure (Sheikh Wagas, 2005). The analysis of equity multiplier proves Cal bank banks to be less risky and more solvent. This result is consistent with my results found in DER of Cal Bank. Not surprisingly, Cal bank EM is exhibiting similar behavior as of DER, which further verifies that relative to debt, equity base is increasing more in Cal banks. EM decreased from 8.46% in 2011 to 5.68% in 2012 and continues increased to 6.90% in 2014. Table 4.13: Equity Multiplier (EM)
Year 2010 2011 2012 2013 2014
% 6.53 8.46 5.68 5.54 6.90
Source: Researcher’s own computation from the Bank’s financial statements (2010 – 2014)
International Journal of Academic Research in Business and Social Sciences June 2016, Vol. 6, No. 6
ISSN: 2222-6990
168 www.hrmars.com
Figure 4.12: Equity Multiplier (EM)
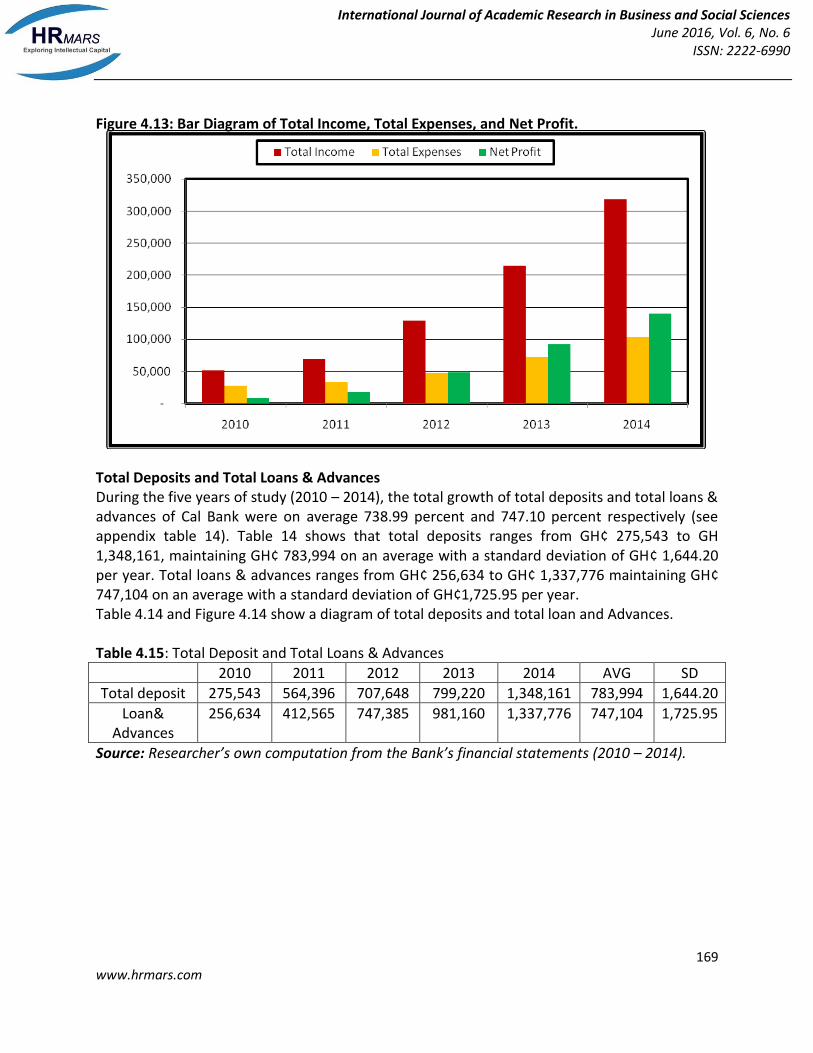
Total Income, Total Expenses, and Net Profit. During the five years (2010-2014) of the study, the total growth of total income, total expenses and net profit of Cal bank were on average 156.76 percent, 56.72 percent, and 61.79 percent respectively (see appendix table 13). In appendix table 1, total income ranges from GH¢ 51,830 to GH¢ 317,962 maintaining Gh¢ 156,761 on an average with a standard deviation of GH¢1,756.74 per year. Total expenses ranges from GH¢ 27,367 to GH¢ 103,234 maintaining Gh¢ 56,792 on an average with a standard deviation of GH¢ 586.96 per year. Moreover Net profit ranges from GH¢8,810 to GH¢140,352 maintaining Gh¢ 61,792 on an average with a standard deviation of 1,544.82 per year. Figure 4.13, shows a bar diagram of total income, total expenses, and net profit for the five years. Table 4.14: Total Income, Total Expenses, and Net Profit
2010 2011 2012 2013 2014 AVG SD
Total Income
51,853 69,711 129,240 215,040 317,962 156,761 1,756.74
Total Expenses
27,367 33,670 47,570 72,121 103,234 56,792 586.96
Net Profit
8,810 18,338 49,452 92,010 140,352 61,792 1,544.82
Source: Researcher’s own computation from the Bank’s financial statements (2010 – 2014)
International Journal of Academic Research in Business and Social Sciences June 2016, Vol. 6, No. 6
ISSN: 2222-6990
169 www.hrmars.com
Figure 4.13: Bar Diagram of Total Income, Total Expenses, and Net Profit. GH GG
Total Deposits and Total Loans & Advances During the five years of study (2010 – 2014), the total growth of total deposits and total loans & advances of Cal Bank were on average 738.99 percent and 747.10 percent respectively (see appendix table 14). Table 14 shows that total deposits ranges from GH¢ 275,543 to GH 1,348,161, maintaining GH¢ 783,994 on an average with a standard deviation of GH¢ 1,644.20 per year. Total loans & advances ranges from GH¢ 256,634 to GH¢ 1,337,776 maintaining GH¢ 747,104 on an average with a standard deviation of GH¢1,725.95 per year. Table 4.14 and Figure 4.14 show a diagram of total deposits and total loan and Advances. Table 4.15: Total Deposit and Total Loans & Advances
2010 2011 2012 2013 2014 AVG SD
Total deposit 275,543 564,396 707,648 799,220 1,348,161 783,994 1,644.20
Loan& Advances
256,634 412,565 747,385 981,160 1,337,776 747,104 1,725.95
Source: Researcher’s own computation from the Bank’s financial statements (2010 – 2014).

International Journal of Academic Research in Business and Social Sciences June 2016, Vol. 6, No. 6
ISSN: 2222-6990
170 www.hrmars.com
Figure 4. 14: Bar Diagram of Total Deposit and Total Loans & Advance. ggg
Interest Income, Interest Expense, and Net Interest Income During the five years of study (2010 – 2014), the total growth of interest income, interest expense and net interest income of Cal bank were on average 181.76 percent, 84.70 percent and 97.05 percent respectively (see appendix table 4.15). In appendix table 3, interest income ranges from GH¢ 69,635 to GH¢ 352,266 maintaining GH¢181,755 on an average with a standard deviation of GH¢ 1,651.39 per year. Interest expense ranges from Gh¢ 32,800 to GH¢ 171,634 maintaining GH¢ 84,704 on an average with a standard deviation of GH¢ 1,721.79 per year. Net interest income ranges from GH¢ 36,835 to GH¢ 180,632 maintaining GH¢ 97,052 on an average with a standard deviation of GH¢ 1,788.52 per year. Figure 4.15 shows a bar diagram of interest income, interest expenses and net interest income for five years. Table 4.16: Interest Income, Interest Expenses, and Net Interest Income
2010 2011 2012 2013 2014 AVG SD
Interest Income
69,635 75,138 145,991 265,747 352,266 181,755 1,651.39
Interest Expenses
32,800 34,477 61,209 123,398 171,634 84,704 1,721.79
Net int. Income
36,835 40,661 84,782 142,349 180,632 97,052 1,788.52
Source: Researcher’s own computation from the Bank’s financial statements (2010 – 2014)

International Journal of Academic Research in Business and Social Sciences June 2016, Vol. 6, No. 6
ISSN: 2222-6990
171 www.hrmars.com
Figure 4.15: Bar Diagram of Interest Income, Interest Expense, and Net Interest Income.
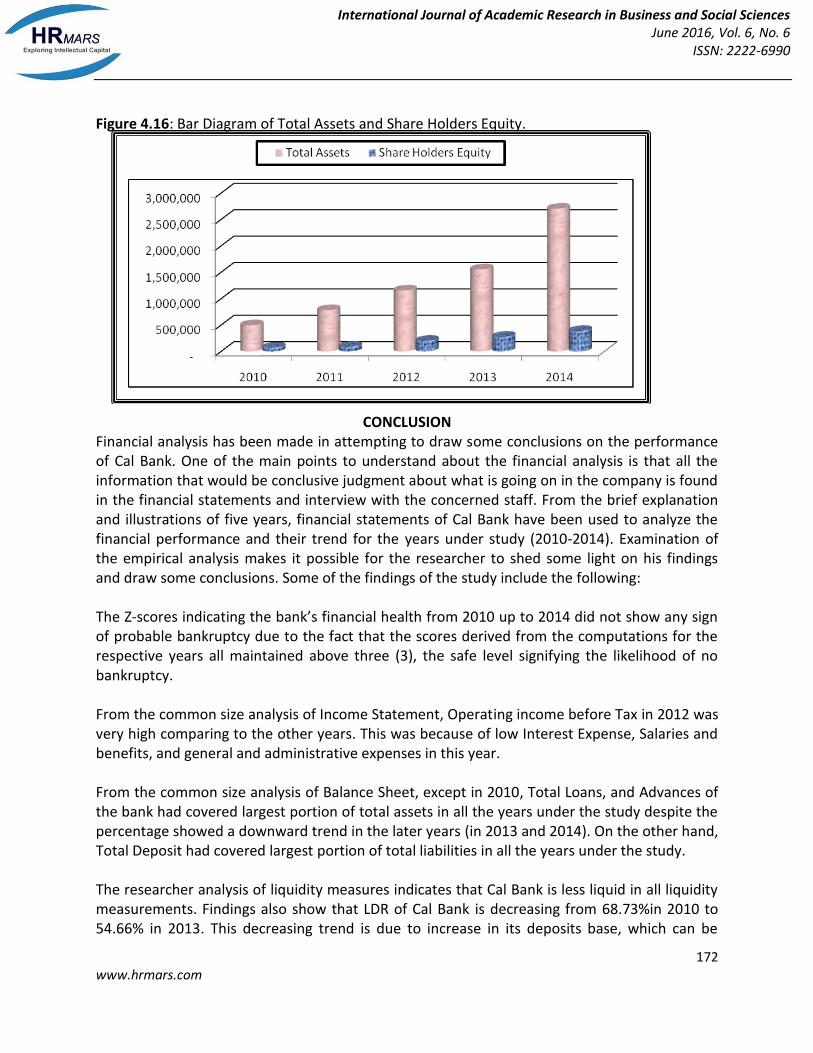
Total Assets and Shareholders’ Equity During the five years of study (2010- 2014) the total growth of total assets and shareholders’ equity of Cal bank were on average 1348.33 percent, and 209.40 percent respectively (see appendix table 4.16). Table 4.16 tot shows that assets ranges from GH¢ 499,751 to GH¢ 2,707,542 maintaining GH¢ 1,342,333 on an average with a standard deviation of GH¢ 19,401.19 per year. Shareholders’ equity ranges from GH¢ 76,519 to GH¢ 392,320 maintaining GH¢ 209,399 on an average with a standard deviation of GH¢1, 525.02 per year. Figure 4.16 shows a bar diagram of total assets and shareholders’ equity for five years. Table 4.17: Total Assets and Shareholders’ Equity
2010 2011 2012 2013 2014 AVG SD
Total Assets 499,751 786,063 1,159,345 1,558,963 2,707,542 1,342.333 19,401.19
Share H. Equity
76,519 92,921 204,044 281,193 392,320 209,399 1,525.02
Source: Researcher’s own computation from the Bank’s financial statements (2010 – 2014)
International Journal of Academic Research in Business and Social Sciences June 2016, Vol. 6, No. 6
ISSN: 2222-6990
172 www.hrmars.com
Figure 4.16: Bar Diagram of Total Assets and Share Holders Equity.
CONCLUSION
Financial analysis has been made in attempting to draw some conclusions on the performance of Cal Bank. One of the main points to understand about the financial analysis is that all the information that would be conclusive judgment about what is going on in the company is found in the financial statements and interview with the concerned staff. From the brief explanation and illustrations of five years, financial statements of Cal Bank have been used to analyze the financial performance and their trend for the years under study (2010-2014). Examination of the empirical analysis makes it possible for the researcher to shed some light on his findings and draw some conclusions. Some of the findings of the study include the following: The Z-scores indicating the bank’s financial health from 2010 up to 2014 did not show any sign of probable bankruptcy due to the fact that the scores derived from the computations for the respective years all maintained above three (3), the safe level signifying the likelihood of no bankruptcy. From the common size analysis of Income Statement, Operating income before Tax in 2012 was very high comparing to the other years. This was because of low Interest Expense, Salaries and benefits, and general and administrative expenses in this year. From the common size analysis of Balance Sheet, except in 2010, Total Loans, and Advances of the bank had covered largest portion of total assets in all the years under the study despite the percentage showed a downward trend in the later years (in 2013 and 2014). On the other hand, Total Deposit had covered largest portion of total liabilities in all the years under the study. The researcher analysis of liquidity measures indicates that Cal Bank is less liquid in all liquidity measurements. Findings also show that LDR of Cal Bank is decreasing from 68.73%in 2010 to 54.66% in 2013. This decreasing trend is due to increase in its deposits base, which can be
International Journal of Academic Research in Business and Social Sciences June 2016, Vol. 6, No. 6
ISSN: 2222-6990
173 www.hrmars.com
considered a positive, and a good sign for the Cal Bank in that it is making inroads into the society. Moreover, this shows that level of trust and confidence of the people is increasing in Cal Bank with the passage of time. Examination of all profitability measures, Return on assets (ROA), Return on Equity (ROE), and Profit Expense Ratio (PER) indicates that Cal Bank profitability ratios are consistently less increased in profit during the period under the study except year 2014 in which Cal Bank profitability ratio on (ROA), decreased trend during the period under study. Overall, the trend of all profitability ratios are found rising for Cal Bank over the years. Having found Cal Bank to be less profitable, what we expect when it comes to risk and solvency measures is according to the basic rule of finance “the higher the expected return the higher the risk”. Our findings of profitability and risk and solvency perfectly fit in this risk-return profile and allow me to conclude that Cal bank is of less profitable, also less risky, and more solvent. Analysis of the results of all the risk and solvency measures, Debt Equity Ratio (DER), Debt to Total Assets ratio (DTAR), and Equity Multiplier (EM), indicates Cal Bank to be less risky and more solvent. Like in profitability, and risk & solvency measures, Cal bank is found to be less efficient in terms of generating income or Income Expense Ratio (IER) and managing their expenses or Operating Efficiency (OE). In contrast, Cal Bank is more efficient in terms of utilization of their assets or Asset Utilization (AU) ratio. Although, Income Expense Ratio (IER), and Operating Efficiency (OE) suggest that Cal Bank is significantly less efficient but increasingly converging, during 2010 - 2014. This gives me some insight regarding Cal Bank’s improvement in generating income, utilization of assets, and effective management in controlling expenses.
RECOMMENDATION The following recommendations, based on the above research findings, are forwarded below in order to enhance the financial performance of commercial banks: Loan to deposit ratio of Cal Bank decreased from 0.93% in 2010 to 0.73% in 2011 and also in 2013 it decreased from 1.06% to 0.99% in 2014. This overall declining trend in LDR of Cal bank indicates the tendency of comparatively more increase in deposits than loans. This may indicate that Cal Bank has conservative lending policy over the period under the study. This may be solved by revising the lending policy of the bank, such as maximizing the approval limit of branches and districts, appointing trained managers and loan officers. Since 2011, Loans and advances of Cal Bank decreased because the Bank of Ghana set a maximum outstanding loan limit to all banks in the country to control inflation. If this continues, the bank may become more liquid and be obliged to discourage deposit to decrease their interest expenses and this will adversely affect the overall economy. The regulatory body has to think over it and take a corrective action.

International Journal of Academic Research in Business and Social Sciences June 2016, Vol. 6, No. 6
ISSN: 2222-6990
174 www.hrmars.com
Overall, all profitability measures results indicate that Cal Bank is of less profitable, therefore the bank should work on it and move towards good return because this is the means to assure its survival in the market. The number of commercial banks has been increasing from time to time. The intensive and continuous increasing competition in the financial service market creates a need for an access to information that would allow evaluating commercial banks operating in this market. In Ghana there is no adequately compiled data and bench marks to evaluate the performance of commercial banks. The regulatory body (Bank of Ghana) or other concerned bodies have to take the responsibility. Finally, the financial performance indicators, i.e. financial ratios, independently are not enough to measure the performance of commercial banks. Thus, alternative financial measures such as Data Envelopment Analysis and other sophisticated financial performance tools shall be considered by further researchers.
REFERENCES Abdus, S. (2004). Bahrain's Commercial Bank Performance from 1994 2001. International Journal of Business and Social Sciences. Vol. 21. No. 14. Nov. 2009. Pp. 216. Ahmad, A. U. F., & Hassan, M. K. (2007). Regulation and Performance of Islamic Banking in Bangladesh. Thunderbird International Business Review. 49(2), retrieved from www.ccsenet.org/journal.html. Altman, E. I. (1968). Financial Ratios, Discriminant Analysis and the Prediction of Corporate Bankruptcy. Journal of Finance Pp. 189–209. Altman, E. I. (2002). Revisiting Credit Scoring Models in a Basel II Environment. Prepared for Credit Rating: Methodologies, Rationale, and Default Risk. London Risk Books 2002. Bashir, (2001). Determinants of Islamic banks’ performance across eight Middle Eastern countries between 1993 and 1998. Sudan. September 2001. Retrieved from. http://www.eurojournals.com/finance.htm. Benton, E. G., & James, W. K. (2005). Commercial Banking, the management of risk. 3rd Edition, Text, John wiley and sons. Bernstein, L., & Wild, J. (1998). Financial Statement Analysis: Theory, Application and Interpretation. New York: McGraw-Hill Companies, Inc. Bhushan, B. (2008). A Comprehensive Study on Financial Analysis: a case of H.D.F.C. bank. Retrieved from http://www.mpra.ub.uni-muenchen.de/4983. Cal bank Limited, (2012). A Brief overview on Cal Bank Achievements. Accra, Ghana, Brochure December 2012.

International Journal of Academic Research in Business and Social Sciences June 2016, Vol. 6, No. 6
ISSN: 2222-6990
175 www.hrmars.com
Eidleman, G. J. (1995). Z-Scores - A Guide to Failure Prediction. The CPA Journal Online, <http://www.nysscpa.org/cpajournal/old/16641866.htm> Elliott, B., & Elliott, J. (2006). Financial Accounting, Reporting and Analysis. International Edition, 2nd Edition, Pearson Education, FT Prentice Hall. Fabozzi, F. J., & Peterson, P. (2003). Financial Management and Analysis. 2nd Edition. S. l. John Wiley and sons, Inc, 83. Farooq, A. M. (2003). Structure and performance of commercial Banks in Pakistan, Munich personal from Omani Commercial Banks. International Research Journal of Finance and Economics, ISSN Kurukshetra, April, 2008 Retrieved from http://www.english.amikom.ac.id/category. Fratianni, M., & Francesco, M. (2009). Rescuing Banks from the Effects of the Financial Crisis. SSRN Working Paper. Retrieved from http://papers.ssrn.com/sol3/Delivery.cfm/SSRN_ID1476786_code942286.pdf?abstract id=1476786&mirid=1. Gentry, J. (1985). Classifying Bankrupt Firms with Funds Flow Component. Journal of Accounting Research, 23, (Spring), Pp. 146-160. Gentry, J. (1984). Bankruptcy, Working Capital and Funds Flow Components. Urbana, Ill, Bureau of Economics and Business Research. Gitman, L. J. (2004). Principles of Managerial Finance. 10th Edition. S. l. Pearson Education. Hasan, Z. (2005). Evaluation of Islamic banking performance on the current use of econometric models. Munich Personal RePEc Archive Paper No. 6461, posted 27. Hempel, G. H., & Simonson, D. G. (1999). Bank Management: Text and Cases. Wiley and Sons, 5th Ed. Iqbal, M., & Molyneux, P. (2005). Thirty Years of Islamic Banking, History, Performance and Prospects. New York, Palgrave Macmillan. Jagels, M. G., & Coltman, M. M. (2003). Hospitality Management Accounting. 8th Edition. S. l., John wiley and sons. Kosmidou, K. (2008). The determinants of banks profit in Greece during the period of EU financial integaration. Managerial Finance.

International Journal of Academic Research in Business and Social Sciences June 2016, Vol. 6, No. 6
ISSN: 2222-6990
176 www.hrmars.com
Mikhan, P., & Jain, K. (2007). Financial Management, Text, Problems and Cases. 5th Edition. Tata. Mc Graw-Hill Publishing Company Limited. Neely, M. C., & Wheelock, D. C. (1997). Why Does Bank Performance Vary Across States?. Federal Reserve Bank of St. Louis Review, Vol. 79, No. 2, March – April. Ohlson, J. A. (1980). Financial Ratios and the Probabilistic Prediction of Bankruptcy. Journal of Accounting Research 18, (Spring), Pp. 109-131. Peters, D., Raad, E., & Sinkey F. (2004). The performance of banks in postwar Lebanon. International Journal of Business, 9(3), 259-28 Ross, S. A., Westerfield, R. W., & Jaffe, J. (2005). Corporate Finance. McGraw-Hill Inc., 7th Ed. Saleh, A. S., & Rami, Z. (2006). Islamic Banking Performance in the Middle East. A Case Study of Jordan. Working Paper 06-21, Department of Economics, University of Wollongong. Samad, Abdus, Kabir, & Hassan, (2000). The Performance of Malaysian Islamic Bank During 1984-1997. An Exploratory Study. Thoughts on Economics 10, no. 1 & 2: Sheikh Waqas, A. (2005). Financial Statement Analysis of Bank Falah. Virtual University Pakistan, Pakistan; June 2005. Tarawneh, M. (2006). A comparison of financial performance in the banking sector, some evidence from Omani commercial banks. International Research Journal of Finance and Economics. Van Horne, J., & Wachowicz, J. (2005). Fundamentals of Financial Management. Pearson Education Limited, 12th Ed.