financial report 06.30.2011
DESCRIPTION
Financial Report for the quarter ending 06.30.2011TRANSCRIPT

REVENUES Combined YTD revenues of the General & Utility Funds are $351,495 more than pro-jections. ▲Property Tax Collections 1% over projections ▲Sales Taxes 12% over projections ▲Building Permits 7% over projections ▲Water Sales 100% of projections EXPENDITURES Expenditures & encum-brances of the General and Utility Funds are 72% of the annual budget & are $834,228 under YTD projec-tions. CASH AND INVESTMENTS The Town’s cash & invest-ments remain at favorable levels.
Town of Highland Park, Texas FINANCIAL REPORT
FOR THE PERIOD ENDING JUNE 30, 2011
OVERVIEW AT JUNE 30TH (75% OF BUDGET YEAR)
GENERAL FUND 6/30 YTD GENERAL FUND 6/30 YTDProperty Tax AdministrationSales Tax Public SafetyOther Taxes - StreetFranchise Fees - Street LightingLicenses & Permits LibraryCharges for Serv ice ParksFines & Forfeitures PoolInvestment Earnings CourtMiscellaneous Finance -
Building InspectionUTILITY FUND 6/30 YTD Serv ice Center -
Water Non-DepartmentalSewerSanitation UTILITY FUND 6/30 YTDCharges for Serv ice Utility AdministrationLicenses & Permits WaterFines & Forfeitures SewerInvestment Earnings SanitationMiscellaneous Engineering
> 100% of Projected < 100% of Budget 95% - 100% of Projected 100% - 102% of Budget < 95% of Projected > 102% of Budget
- No Activity or Projection - No Activity or Budget
REVENUES EXPENDITURESP E R F O R M A N C E I N D I C A T O R S
2
G E N E R A L F U N D
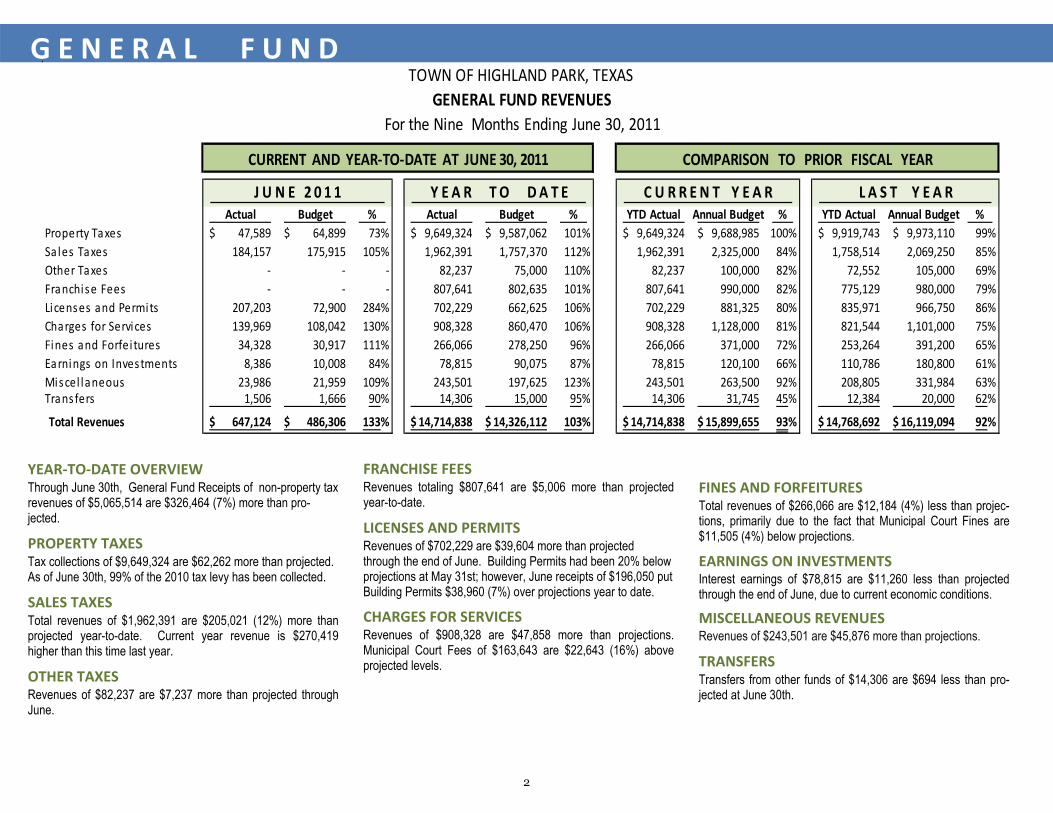
YEAR‐TO‐DATE OVERVIEW Through June 30th, General Fund Receipts of non-property tax revenues of $5,065,514 are $326,464 (7%) more than pro-jected.
PROPERTY TAXES Tax collections of $9,649,324 are $62,262 more than projected. As of June 30th, 99% of the 2010 tax levy has been collected.
SALES TAXES Total revenues of $1,962,391 are $205,021 (12%) more than projected year-to-date. Current year revenue is $270,419 higher than this time last year.
OTHER TAXES Revenues of $82,237 are $7,237 more than projected through June.
FRANCHISE FEES Revenues totaling $807,641 are $5,006 more than projected year-to-date. LICENSES AND PERMITS Revenues of $702,229 are $39,604 more than projected through the end of June. Building Permits had been 20% below projections at May 31st; however, June receipts of $196,050 put Building Permits $38,960 (7%) over projections year to date.
CHARGES FOR SERVICES Revenues of $908,328 are $47,858 more than projections. Municipal Court Fees of $163,643 are $22,643 (16%) above projected levels.
FINES AND FORFEITURES Total revenues of $266,066 are $12,184 (4%) less than projec-tions, primarily due to the fact that Municipal Court Fines are $11,505 (4%) below projections.
EARNINGS ON INVESTMENTS Interest earnings of $78,815 are $11,260 less than projected through the end of June, due to current economic conditions.
MISCELLANEOUS REVENUES Revenues of $243,501 are $45,876 more than projections.
TRANSFERS Transfers from other funds of $14,306 are $694 less than pro-jected at June 30th.
TOWN OF HIGHLAND PARK, TEXASGENERAL FUND REVENUES
For the Nine Months Ending June 30, 2011
CURRENT AND YEAR‐TO‐DATE AT JUNE 30, 2011 COMPARISON TO PRIOR FISCAL YEAR
J U N E 2 0 1 1 Y E A R T O D A T E C U R R E N T Y E A R L A S T Y E A RActual Budget % Actual Budget % YTD Actual Annual Budget % YTD Actual Annual Budget %
Property Taxes 47,589$ 64,899$ 73% 9,649,324$ 9,587,062$ 101% 9,649,324$ 9,688,985$ 100% 9,919,743$ 9,973,110$ 99%Sales Taxes 184,157 175,915 105% 1,962,391 1,757,370 112% 1,962,391 2,325,000 84% 1,758,514 2,069,250 85%Other Taxes ‐ ‐ ‐ 82,237 75,000 110% 82,237 100,000 82% 72,552 105,000 69%Franchise Fees ‐ ‐ ‐ 807,641 802,635 101% 807,641 990,000 82% 775,129 980,000 79%Licenses and Permits 207,203 72,900 284% 702,229 662,625 106% 702,229 881,325 80% 835,971 966,750 86%Charges for Services 139,969 108,042 130% 908,328 860,470 106% 908,328 1,128,000 81% 821,544 1,101,000 75%Fines and Forfei tures 34,328 30,917 111% 266,066 278,250 96% 266,066 371,000 72% 253,264 391,200 65%Earnings on Investments 8,386 10,008 84% 78,815 90,075 87% 78,815 120,100 66% 110,786 180,800 61%Miscel laneous 23,986 21,959 109% 243,501 197,625 123% 243,501 263,500 92% 208,805 331,984 63%Transfers 1,506 1,666 90% 14,306 15,000 95% 14,306 31,745 45% 12,384 20,000 62%
Total Revenues 647,124$ 486,306$ 133% 14,714,838$ 14,326,112$ 103% 14,714,838$ 15,899,655$ 93% 14,768,692$ 16,119,094$ 92%
3
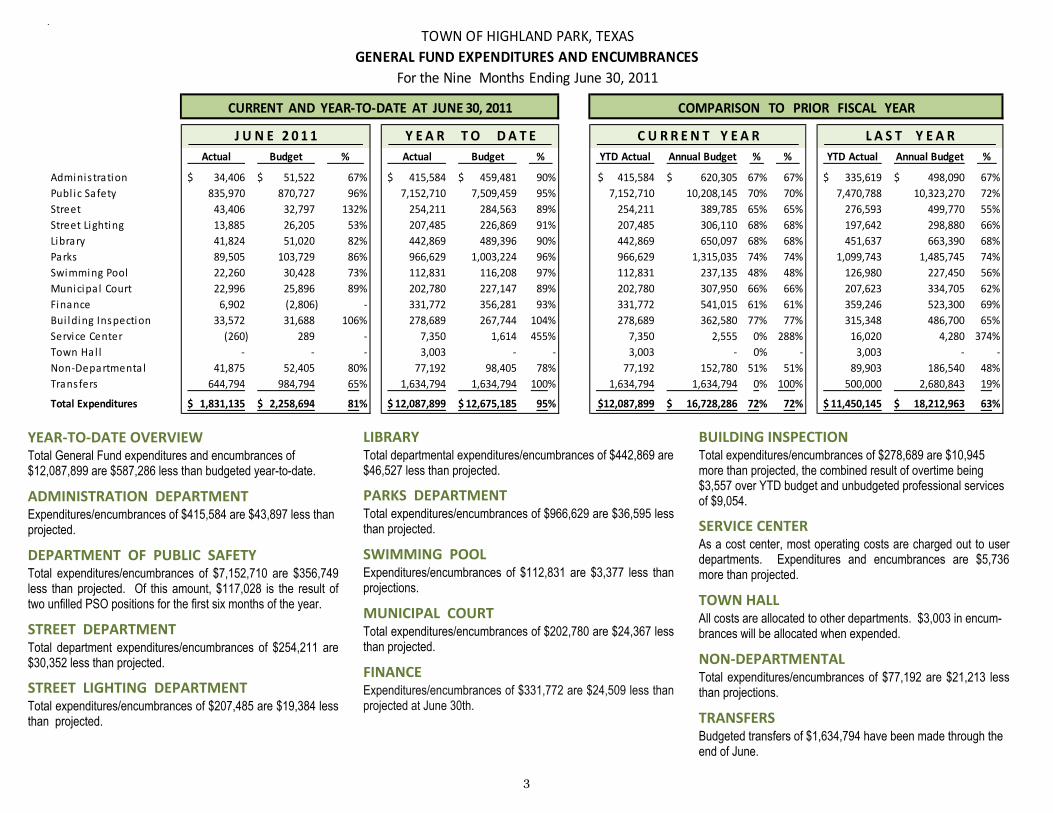
YEAR‐TO‐DATE OVERVIEW Total General Fund expenditures and encumbrances of $12,087,899 are $587,286 less than budgeted year-to-date.
ADMINISTRATION DEPARTMENT Expenditures/encumbrances of $415,584 are $43,897 less than projected.
DEPARTMENT OF PUBLIC SAFETY Total expenditures/encumbrances of $7,152,710 are $356,749 less than projected. Of this amount, $117,028 is the result of two unfilled PSO positions for the first six months of the year.
STREET DEPARTMENT Total department expenditures/encumbrances of $254,211 are $30,352 less than projected.
STREET LIGHTING DEPARTMENT Total expenditures/encumbrances of $207,485 are $19,384 less than projected.
LIBRARY Total departmental expenditures/encumbrances of $442,869 are $46,527 less than projected.
PARKS DEPARTMENT Total expenditures/encumbrances of $966,629 are $36,595 less than projected.
SWIMMING POOL Expenditures/encumbrances of $112,831 are $3,377 less than projections.
MUNICIPAL COURT Total expenditures/encumbrances of $202,780 are $24,367 less than projected.
FINANCE Expenditures/encumbrances of $331,772 are $24,509 less than projected at June 30th.
BUILDING INSPECTION Total expenditures/encumbrances of $278,689 are $10,945 more than projected, the combined result of overtime being $3,557 over YTD budget and unbudgeted professional services of $9,054.
SERVICE CENTER As a cost center, most operating costs are charged out to user departments. Expenditures and encumbrances are $5,736 more than projected.
TOWN HALL All costs are allocated to other departments. $3,003 in encum-brances will be allocated when expended.
NON‐DEPARTMENTAL Total expenditures/encumbrances of $77,192 are $21,213 less than projections.
TRANSFERS Budgeted transfers of $1,634,794 have been made through the end of June.
TOWN OF HIGHLAND PARK, TEXAS GENERAL FUND EXPENDITURES AND ENCUMBRANCES
For the Nine Months Ending June 30, 2011
CURRENT AND YEAR‐TO‐DATE AT JUNE 30, 2011 COMPARISON TO PRIOR FISCAL YEAR
J U N E 2 0 1 1 Y E A R T O D A T E C U R R E N T Y E A R L A S T Y E A RActual Budget % Actual Budget % YTD Actual Annual Budget % % YTD Actual Annual Budget %
Adminis tration 34,406$ 51,522$ 67% 415,584$ 459,481$ 90% 415,584$ 620,305$ 67% 67% 335,619$ 498,090$ 67%Publ ic Safety 835,970 870,727 96% 7,152,710 7,509,459 95% 7,152,710 10,208,145 70% 70% 7,470,788 10,323,270 72%Street 43,406 32,797 132% 254,211 284,563 89% 254,211 389,785 65% 65% 276,593 499,770 55%Street Lighting 13,885 26,205 53% 207,485 226,869 91% 207,485 306,110 68% 68% 197,642 298,880 66%Library 41,824 51,020 82% 442,869 489,396 90% 442,869 650,097 68% 68% 451,637 663,390 68%Parks 89,505 103,729 86% 966,629 1,003,224 96% 966,629 1,315,035 74% 74% 1,099,743 1,485,745 74%Swimming Pool 22,260 30,428 73% 112,831 116,208 97% 112,831 237,135 48% 48% 126,980 227,450 56%Municipal Court 22,996 25,896 89% 202,780 227,147 89% 202,780 307,950 66% 66% 207,623 334,705 62%Finance 6,902 (2,806) ‐ 331,772 356,281 93% 331,772 541,015 61% 61% 359,246 523,300 69%Bui lding Inspection 33,572 31,688 106% 278,689 267,744 104% 278,689 362,580 77% 77% 315,348 486,700 65%Service Center (260) 289 ‐ 7,350 1,614 455% 7,350 2,555 0% 288% 16,020 4,280 374%Town Hal l ‐ ‐ ‐ 3,003 ‐ ‐ 3,003 ‐ 0% ‐ 3,003 ‐ ‐Non‐Departmenta l 41,875 52,405 80% 77,192 98,405 78% 77,192 152,780 51% 51% 89,903 186,540 48%Transfers 644,794 984,794 65% 1,634,794 1,634,794 100% 1,634,794 1,634,794 0% 100% 500,000 2,680,843 19%
Total Expenditures 1,831,135$ 2,258,694$ 81% 12,087,899$ 12,675,185$ 95% 12,087,899$ 16,728,286$ 72% 72% 11,450,145$ 18,212,963$ 63%

4
U T I L I T Y F U N D
YEAR‐TO‐DATE OVERVIEW Total Utility Fund revenues of $6,388,061 are $37,231 less than projected and $997,500 more than this time last year. WATER SALES Revenues totaling $3,450,495 are slightly over projections, at $14,344 more than projected. Although the volume of water billed customers is right on target, this volume is an increase of 28% over the volume of water sold this time last year. SANTARY SEWER CHARGES Revenues of $1,874,447 are $23,331 less than projections through the end of June.
SANITATION COLLECTION CHARGES Total revenues of $867,327 are $5,861 less than projections. OTHER CHARGES FOR SERVICES Year-to-date revenues of $87,856 are $1,681 more than projected through the end of June. LICENSES AND PERMITS Total revenues (Plumbing Permits) of $24,025 are $1,475 less than projections.
FINES AND FORFEITURES Revenues (Penalty Charges for Late Payment) of $56,869 are $619 more than projected. EARNINGS ON INVESTMENTS Interest earnings of $15,778 are $21,722 (58%) less than projected year-to-date. MISCELLANEOUS REVENUE Revenues of $11,264 are $1,486 less than projected.
TOWN OF HIGHLAND PARK, TEXAS UTILITY FUND REVENUES
For the Nine Months Ending June 30, 2011
CURRENT AND YEAR‐TO‐DATE AT JUNE 30, 2011 COMPARISON TO PRIOR FISCAL YEAR
J U N E 2 0 1 1 Y E A R T O D A T E C U R R E N T Y E A R L A S T Y E A RActual Budget % Actual Budget % YTD Actual Annual Budget % YTD Actual Annual Budget %
Water Sales 492,274$ 472,694$ 104% 3,450,495$ 3,436,151$ 100% 3,450,495$ 5,368,295$ 64% 2,574,265$ 4,912,500$ 52%Sanitary Sewer Charges 236,517 243,080 97% 1,874,447 1,897,778 99% 1,874,447 2,745,475 68% 1,742,766 2,864,160 61%Sanitation Col lection Fees 96,334 97,021 99% 867,327 873,188 99% 867,327 1,164,250 74% 841,315 1,124,790 75%Other Charges for Service 10,441 9,575 109% 87,856 86,175 102% 87,856 114,900 76% 82,519 114,900 72%Licenses and Permits 3,440 2,833 121% 24,025 25,500 94% 24,025 34,000 71% 24,260 34,000 71%Fines and Forfei tures 5,726 6,250 92% 56,869 56,250 101% 56,869 75,000 76% 53,607 55,000 97%Earnings on Investments 718 4,167 17% 15,778 37,500 42% 15,778 50,000 32% 68,023 105,000 65%Miscel laneous 15 1,416 1% 11,264 12,750 88% 11,264 17,000 66% 3,806 17,000 22%
Total Revenues 845,465$ 837,036$ 101% 6,388,061$ 6,425,292$ 99% 6,388,061$ 9,568,920$ 67% 5,390,561$ 9,227,350$ 58%

5
YEAR‐TO‐DATE OVERVIEW Total Utility Fund expenditures plus encumbrances of $6,714,790 are $246,942 less than budgeted at June 30th. UTILITY ADMINISTRATION Expenditures/encumbrances totaling $772,153 are $139,082 less than projected.
WATER DEPARTMENT Departmental expenditures/encumbrances of $2,019,833 are $28,442 less than projected. SEWER DEPARTMENT Expenditures/encumbrances of $884,767 are $48,706 less than projections at the end of June SANITATION DEPARTMENT Total expenditures and encumbrances of $767,948 are $8,103 less than expected year-to-date.
ENGINEERING DEPARTMENT Expenditures/encumbrances of $459,050 are $22,128 less than projections. TRANSFERS Transfers of $1,811,039 to the Capital Projects Fund have been made so far this year.
TOWN OF HIGHLAND PARK, TEXAS UTILITY FUND EXPENSES AND ENCUMBRANCES
For the Nine Months Ending June 30, 2011
CURRENT AND YEAR‐TO‐DATE AT JUNE 30, 2011 COMPARISON TO PRIOR FISCAL YEAR
J U N E 2 0 1 1 Y E A R T O D A T E C U R R E N T Y E A R L A S T Y E A RActual Budget % Actual Budget % YTD Actual Annual Budget % % YTD Actual Annual Budget %
Uti l i ty Adminis tration 121,204$ 153,385$ 79% 772,153$ 911,235$ 85% 772,153$ 1,231,255$ 63% 63% 809,127$ 1,154,100$ 70%Water 338,404 305,924 111% 2,019,833 2,048,275 99% 2,019,833 3,064,525 66% 66% 1,591,466 2,752,180 58%Sewer 103,923 104,824 99% 884,767 933,473 95% 884,767 1,248,205 71% 71% 903,248 1,386,290 65%Sanitation 77,474 86,228 90% 767,948 776,051 99% 767,948 1,034,735 74% 74% 852,877 1,142,310 75%Engineering 52,060 55,149 94% 459,050 481,178 95% 459,050 651,995 80% 70% 511,377 631,135 81%Transfers 614,317 614,320 100% 1,811,039 1,811,520 100% 1,811,039 2,276,510 80% 80% 3,208,169 5,157,150 62%
Total Expenditures 1,307,382$ 1,319,830$ 99% 6,714,790$ 6,961,732$ 96% 6,714,790$ 9,507,225$ 71% 71% 7,876,264$ 12,223,165$ 64%
6
C A S H A N D I N V E S T M E N T S
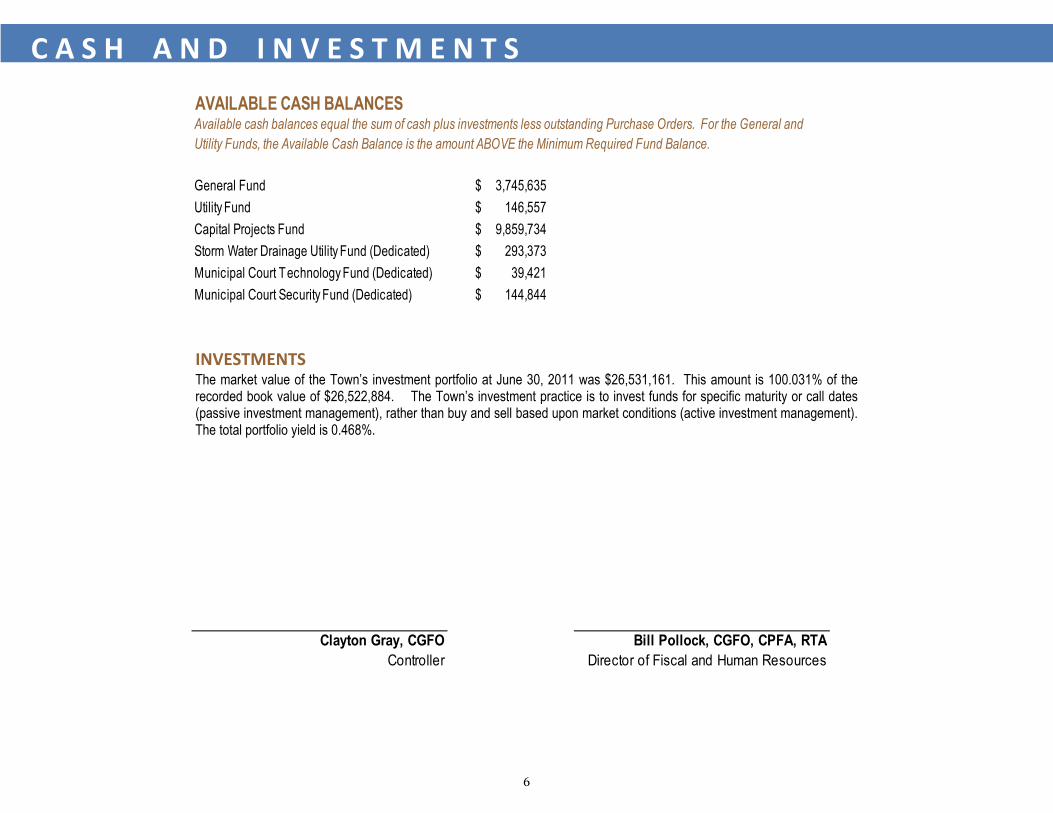
INVESTMENTS The market value of the Town’s investment portfolio at June 30, 2011 was $26,531,161. This amount is 100.031% of the recorded book value of $26,522,884. The Town’s investment practice is to invest funds for specific maturity or call dates (passive investment management), rather than buy and sell based upon market conditions (active investment management). The total portfolio yield is 0.468%.
Clayton Gray, CGFO Bill Pollock, CGFO, CPFA, RTAController Director of Fiscal and Human Resources
AVAILABLE CASH BALANCESAvailable cash balances equal the sum of cash plus investments less outstanding Purchase Orders. For the General andUtility Funds, the Available Cash Balance is the amount ABOVE the Minimum Required Fund Balance.
General Fund 3,745,635$ Utility Fund 146,557$ Capital Projects Fund 9,859,734$ Storm Water Drainage Utility Fund (Dedicated) 293,373$ Municipal Court Technology Fund (Dedicated) 39,421$ Municipal Court Security Fund (Dedicated) 144,844$