financial report 2001 - connecting repositories · financial report-2001 i page 6 . jean-pierre...
TRANSCRIPT

C\J
LU co -LU LU (.)
Financial Report 2001
'" European Investment Bank Group

E/8 Group Financial Report 2001
European Commission Delegation library 2300 M Street, NW Washington, DC 20037
Ill European Investment Bank Group

EIB Group: key data
European Investment Bank Activity in 2001
Loans signed __________________ _ European Union Accession Countries Partner Countries
Loansapproved _________________ __ European Union Accession Countries Partner Countries
Loans disbursed From the Bank's resources From budgetary resources
Resources raised (after swaps) ____________ _ Community currencies Non-Community currencies
Situation as at 31.12.2001
Outstandings Loans from the Bank's resources Guarantees provided Financing from budgetary resources Short, medium and long-term borrowings
Own funds Balance sheet total Net profit for year Subscribed capital
of which paid in
European Investment Fund Activity in 2001
Contracts signed Venture capital (57 funds) Guarantees (39 operations)
Situation as at 31.12.2001
Operational portfolio Venture capital (153 funds) Guarantees (86 operations)
Subscribed capital of which paid in
Net profit for year including extraordinary profit of 60.5 million
Reserves and provisions
(fUR million)
36 776 31 184
2 659 2 933
41 424 35 163 3 376 2 884
31 573 31 368
205
32172 28 597
3 575
221 116 543
2 558 176 027
23 296 209 376
1 311 100 000
6 000
1 758 800 958
5 340 2 005 3 335 2 000
400 76
100

Contents
Page
Message from the President 4
EIB Governing Bodies 6
EIB Lending Activity 8
EIB Borrowing Activity 10
ElF Governing Bodies 14
ElF Activity 15
EIB Group
Financial Statements 18
Results for the Year 40
Report of the Auditor 41
Statement by the Audit Committee 42
EIB
Financial Statements 44
Liquidity Management 66
Liquidity Management Results 67
Results for the Year 68
Report of the Auditor 69
Statement by the Audit Committee 70
ElF
Financial Statements 72
Results for the Year 79
Report of the Auditor 80
Report of the Audit Board 81
Control and Evaluation 83
Addresses 87

Message from the President
The EIB is no ordinary bank: it was created specifically to provide financial support
for the European Union's objectives. I describe this special character with the term
"policy-driven public bank" -namely a bank which, in synergy with the other EU
institutions and without burdening the public purse, contributes to the realisation of
projects giving concrete expression to the economic, social and, ultimately, political
priorities of the Union.
In 2001, the EIB lent 36.8 billion euro, over 31 billion of this within the Union, and
raised funds totalling 32.3 billion in 13 currencies. At the same time, our specialised
subsidiary, the European Investment Fund, substantially stepped up its support for
small and medium-sized enterprises (SMEs) by providing more than 800 million in
venture capital and 960 million in guarantees. Beyond the sheer scale of our activity,
however, I wish to underline its qualitative focus. Over two thirds- some 22 billion
of the Group's operations served to foster wealth creation in the less advanced
regions of the Union or its future member states. Ranging across all sectors of the
economy from basic infrastructure to SMEs, these operations exerted a major catalyt
ic effect in mobilising other sources of finance, whether from banks or from the
Community Structural Funds.
Our second objective is modernising the European economy to enable the Union,
now underpinned by its new currency, to play its full part in a globalised economy.
The Innovation 2000 Initiative (i2i), launched by the EIB Group in the wake of the
Lisbon European Council of March 2000, works towards this goal by nurturing the
development of a knowledge-based and innovation-driven economy. In 2001, i2i
surged ahead, bringing the grand total of approved financing for the Union's
Member States and seven Accession Countries to over 10.3 billion. Hence the Group
has already made great strides towards achieving the objective - set for it by the
Lisbon European Council- of investing 12-15 billion under the i2i banner by the end
of 2003.
Over the course of the year, we backed no fewer than twelve research and develop
ment projects of major importance for boosting Europe's economy, while nearly
100 000 smaller businesses benefited from EIB or ElF assistance in various forms.
Additionally, in response to requests from the Ghent European Council, the Bank
recently decided to step up its support for sectors particularly hard hit by the eco
nomic slowdown: to this end, it will deploy the full gamut of the Group's financial
engineering resources, especially with a view to risk-sharing with project promoters.
The Bank cannot maintain this high level of activity without paying heed to the
legitimate demand from the peoples of the Union for environmentally responsible
development. Accordingly, as well as factoring environmental considerations into all
project appraisals, the EIB devotes nearly one quarter of its financing to schemes
page 4

aimed at protecting the natural environment, rectifying environmental degradation - notably in the Accession
Countries - and enhancing the quality of urban life. With this objective, the Bank continually reviews its meth
ods and has overhauled its internal organisation in this area, further increasing its ability to underpin the
Union's commitments on sustainable development and climate change.
Outside the Union, the EIB Group focuses particularly on two regions of vital importance for tomorrow's Europe:
Central and Eastern Europe and the Mediterranean. Operating in these parts of the world under European
Union mandates or under dedicated financial facilities set up on its own initiative and at its own risk, the EIB
ranks as by far the leading source of banking finance for project development in the countries flanking the
Union to the South and East. Its efforts centre on fostering economic liberalisation, encouraging the transfer of
capital and know-how through foreign direct investment and promoting projects with a regional dimension. In
this sphere, too, the Bank's whole-hearted commitment to furthering the Union's policies has ensured its close
involvement with the Commission in the current deliberations under the Union's Spanish Presidency on the
means of revitalising the Euro-Mediterranean Partnership launched in Barcelona in 1995.
The Bank's quest for operational efficiency must be pursued within a framework of transparency and account
ability that will bring our institution closer to Europe's citizens- the ultimate beneficiaries of our activities. In
2001, the EIB therefore intensified its political dialogue with the European Parliament and forged links with the
Union's Economic and Social Committee. It also implemented a new policy of transparency, characterised by a
recast information policy and closer dialogue with civil society via NGOs.
As is widely known, the EIB Group funds its operations by tapping capital markets across the globe. Thanks to
the calibre of its shareholders, the quality of its loan book and the judicious mix of prudence and innovation in
its borrowing policies, the EIB enjoys a benchmark status on the markets akin to that of a sovereign borrower, as
universally recognised by its AAA rating.
As at 31 December 2001, the Bank's outstanding loan book stood at 221 billion euro, close to the maximum of
250 billion permissible under the EIB's Statute. The demands of our objectives led me to propose to our share
holders a 50% capital increase. The work done by the Board of Directors on the multiannual operational priori
ties and on the practical aspects of implementing a self-financed capital increase prepared the way for the deci
sion taken by the Governors on 4 June 2002. On that occasion, the Bank once again received confirmation of the
solid and unanimous backing of its shareholders, the EU Member States. To them, I proffer my thanks.
Philippe Maystadt EIB Group President
page 51 MESSAGE FROM THE PRESIDENT

Belgium Denmark
Germany Greece
Spain France
Ireland Italy
Luxembourg Netherlands
Austria Portugal
Finland Sweden
United Kingdom
EIB Governing Bodies Board of Governors Chairman Bendt BENDTSEN (Denmark)
Didier REYNDERS, Ministre des Finances Bendt BENDTSEN, 0konomi- og erhvervsminister samt minister for nordisk samarbejde,
vicestatsminister Hans EICHEL, Bundesminister der Finanzen Nikolaos CHRISTODOULAKIS, Ministre de I'Economie nationale et des finances Rodrigo DE RATO Y FIGAREDO, Vicepresidente Segundo del Gobierno y Ministro de Economfa Laurent FABIUS, Ministre de I'Economie, des Finances et de l'lndustrie
Charles McCREEVY, Minister for Finance Giulio TREMONT!, Ministro dell' Economia e delle Finanze Jean-Claude JUNCKER, Premier Ministre, Ministre d'Etat, Ministre des Finances
Gerrit ZALM, Minister van Financi~n Karl-Heinz GRASSER, Bundesminister fur Finanzen
Manuela FERREIRA LEITE, Ministra de Estado e das Financ;as Suvi-Anne SliMES, Ministeri, Valtiovarainministerio Bosse RINGHOLM, Finansminister Gordon BROWN, Chancellor of the Exchequer
Audit Committee Chairman
Emidio MARIA. Subinspector-Geral de Financ;as, lnspecc;ao-Geral de Financ;as~ Lisbon
Members Caj NACKSTAD, Partner, KPMG, Stockholm
Marc COLAS, Premier Conseiller de Gouvernement, Luxembourg
Observer Michael P. HARALABIDIS, Senior Associate, Group Risk Management, National Bank of Greece, Athens
Management Committee President Philippe MAYSTADT
Vice-Presidents Wolfgang ROTH Massimo PONZELLINI Ewald NOWOTNY Francis MAYER Peter SEDGWICK Isabel MARTiN CASTELLA Michael G. TUTIY
The EIB's President also chairs the Bank's Board of Directors.
Situation at 31 March 2002
FINANCIAL REPORT- 2001 I page 6
Jean-Pierre ARNOLDI Lorenzo BINI SMAGHI
Sinbad J.D. COLERIDGE Isabel CORREIA BARATA
Wedige Hanns von DEWITZ
Tony FAINT Inigo FERNANDEZ DE MESA
Kurt HALL Jan Willem van der KAAIJ
Rainer MASERA Constantinos MASSOURAS
Ingrid MATTHAUS-MAIER Noel Thomas O'GORMAN
Stephane-Emmanuelle PALLEZ
Maria PEREZ RIBES
Vincenzo PONTOLILLO Kaarina RAUTALA
Klaus REGLING
Gaston REINESCH Pierre RICHARD
Walter RILL
Ivan ROGERS Gerd SAUPE
Jean-Michel SEVERINO Lars TYBJERG
Marc AUBERGER
Stefania BAZZONI
Gerhard BOEHMER
Gianpaolo BOLOGNA
Paul CHILCOTT Guy CRAUSER
Bjorn FRITJOFSSON Rudolf de KORTE
Nacer MEDDAH
Ralph MOLLER Luis ORGAZ GARCIA
Philip RUTNAM
Board of Directors Directors: Administrateur general de Ia Tresorerie, Ministere des Finances, Brussels Dirigente Generale, Capo della Direzione Ill, Dipartimento del Tesoro, Ministero deii'Economia e delle Finanze, Rome Project Finance Director, Private Financial Holdings Limited, EFG Private Bank, London Consultora da Diree<;ao, Departamento de Rela<;oes lnternacionais, Banco de Portugal, Lisbon Ministerialdirektor, Leiter der Abteilung Aussenwirtschafts- und Europapolitik, Bundesministerium fur Wirtschaft und Technologie, Berlin Director, International Division, Department for International Development, London Subdirector General de Coordinaci6n de Organismos Monetarios lnternacionales, Ministerio de Economfa, Madrid Finansrad lnternationella avdelningen, Finansdepartementet, Stockholm Plaatsvervangend Directeur van de Directie Buitenlandse Financiele Betrekkingen, The Hague Presidente, SanPaolo IMI, Turin Director for Financial and Fiscal Policy Affairs, Ministry for National Economy, Athens Mitglied des Vorstandes der Kreditanstalt fur Wiederaufbau, FrankfurUMain Second Secretary, Finance Division, Department of Finance, Dublin Chef du Service des Affaires europeennes et internationales, Direction du Tresor, Ministere de I'Economie, des Finances et de l'lndustrie, Paris Consejero Tecnico, Direcci6n General de Financiaci6n lnternacional, Ministerio de Economfa, Madrid Direttore Centrale, Banca d'ltalia, Rome Hallitusneuvos, Valtiovarainministerio, Helsinki Director-General for Economic and Financial Affairs, European Commission, Brussels Directeur general, Ministere des Finances, Luxembourg Administrateur delegue, DEXIA, Paris Abteilungsleiter fur internationale Finanzinstitutionen, Bundesministerium fur Finanzen, Vienna Director Europe, HM Treasury, London Ministerialdirigent, Bundesministerium der Finanzen, Berlin Directeur general, Groupe Agence Fran<;aise de Developpement, Paris Direkt0r, 0konomi- og Erhvervsministeriet, Copenhagen
Alternates: Directeur general de Ia Societe fran<;aise de garantie des financements des PME (groupe BDPME), Paris Dirigente, Direzione Rapporti Finanziari lnternazionali, Dipartimento del Tesoro, Ministero deii'Economia e delle Finanze, Rome Ministerialdirigent, Bundesministerium fur wirtschaftliche Zusammenarbeit und Entwicklung, Bonn Dirigente, Direzione del Contenzioso Comunitario, Dipartimento del Tesoro, Ministero deii'Economia e delle Finanze, Rome Chief Manager, Reserves Management, Bank of England, London Director-General for Regional Policy, European Commission, Brussels Departementsrad, lnternationella avdelningen, Finansdepartementet, Stockholm Alternate Member of the Board of Directors of the EIB, Wassenaar Chef du Bureau des Affaires Europeennes, Direction du Tresor, Ministere de I'Economie, des Finances et de l'lndustrie, Paris Regierungsdirektor, Ministerialrat Referat E A3, Bundesministerium der Finanzen, Berlin Subdirector General de Analisis Financiero y Estrategico, Ministerio de Economfa, Madrid Head of Enterprise Team, HM Treasury, London
Situation at 31 March 2002
page 71 EIB GOVERNING BODIES

EIB Lending Activity
In 2001, total EIB lending amounted to 36.8 billion (1) compared with 36 billion the
previous year. This figure reflects the approach adopted by the Bank in 2000, namely
focusing its activity on fields in which it provides maximum value added, whilst fur
thering European Union policy objectives in accordance with the Treaties, its Statute,
the decisions of the European Council and its Corporate Operational Plan. Financing
for projects in the EU Member States came to 31.2 billion. Additionally, the EIB made
available 2.7 billion for capital investment paving the way for enlargement and
2.9 billion in the Partner Countries.
During the year, the EIB pressed ahead with implementing its overriding operational
priorities as set out in its Corporate Operational Plan in order to fulfil the Bank's
remits under Article 267 of the Treaty establishing the European Community.
• The EIB's top operational priority continues to be strengthening the economic and
social cohesion of the EU. Within the Union, 70% of individual loans (14.5 billion)
and around 50% of global loans were located in less favoured regions. If loans in
the Accession Countries, the future target of EU regional policy, are included, the
EIB provided some 22 billion for projects in less advanced regions during 2001.
• Financing under the "Innovation 2000 Initiative" grew markedly in 2001: loans
worth 5 billion, including 1.7 billion for research and development, were signed,
of which 448 million in the Accession Countries. Since its launch in May 2000, this
initiative, aimed at underpinning the creation of a knowledge-based, innovation
driven economy, has already accounted for loans totalling over 7 billion.
• The EIB stepped up its activity in favour of the environment and quality of life,
signing loans for some 7 billion in all during the year, of which 6 billion within the
European Union, 484 million in the Accession Countries and 580 million in the
Euro-Mediterranean Partnership Countries. In addition, environmental invest
ment funded through global loan allocations can be estimated at 2 billion.
• The Accession Countries attracted 2.7 billion, over half of which (56%) was devot
ed to basic infrastructure. The environment, absorbing 20% of loans, also
remained a major concern for the region's development. Lastly, the Bank extend
ed its field of operations to the health and education sectors in the Accession
Countries, with 75 million already signed last year.
(1) Unless otherwise indicated, amounts in this report are expressed in EUR.
page 8

• The Bank's support for implementation of the EU's development aid and cooperation poli
cy in the Partner Countries ran to 2.9 billion in 2001.
Providing 1.4 billion in the Mediterranean Partner Countries, the EIB represented the leading
source of bank finance for projects in this region. This performance illustrates the Bank's pre
eminent role in ensuring the success of the Union's objectives in these countries.
Financing in the Balkans totalled 319 million. The Bank boosted its support for reconstruction
and launched its first global loans in favour of SMEs via intermediary banks in Croatia and
the Former Yugoslav Republic of Macedonia, so assisting modernisation of the banking sector
and SME investment in the region. It also resumed operations in the Federal Republic of
Yugoslavia.
Other Partner Countries received EIB finance amounting to 520 million in the African,
Caribbean and Pacific (ACP) Countries, 150 million in South Africa and 543 million in Asia and
Latin America.
The Corporate Operational Plan continues to target other sectors, namely SMEs, TENs and
health and education.
• In 2001, support for SME investment through EIB global loans reached 5.2 billion. The ElF,
for its part, invested 800 million in venture capital funds, as well as concluding 39 SME
portfolio guarantee operations worth 958 million.
• Lending for trans-European networks and major infrastructure of Community interest
came to 7.9 billion within the Union and 1.2 billion in the Accession Countries.
• Financing for the development of human capital, encompassing health and education,
totalled 2.1 billion within the Union and in the Accession Countries, where the EIB
launched its maiden operations.
As in the previous year, aggregate activity across all countries in 2001 continued to be domi
nated by loans for transport and telecommunications infrastructure, as well as backing for
SMEs and small-scale local infrastructure (32%). There was also a marked upturn in the vol
ume of lending to the health and education sectors.
page 91 EIB LENDING ACTIVITY

EIB Borrowing Activity
In 2001, the EIB raised EUR 32.3 billion on the international capital markets through
148 transactions in 13 currencies before swaps (and 11 currencies after swaps). The
EIB continued to reinforce its role as a European Union institution in supporting the
euro. While the USD was the prime currency of funding, reflecting favourable bor
rowing conditions, the euro substantially increased its share as compared to the year
2000.
Resources borrowed before swaps in the three major currencies accounted for 94%
of the total: 41% USD, 32% EUR and 21% GBP. Funds raised after swaps in the three
major currencies broke down as to: 67% EUR, 21% GBP and 8% USD, the USD having
heavily generated euro via currency swaps. Non-structured operations amounted to
EUR 31 billion (representing 96% of total funds raised) in 94 transactions. Structured
operations totalled EUR 1.3 billion (representing 4% of total funds raised) in
54 transactions.
Optimisation of the funding cost on a sustainable basis and enhancement of sec
ondary market liquidity constitute the pillars of the Bank's funding strategy. This
strategy is designed to maintain the EIB's position as a leading AAA-rated non
sovereign benchmark borrower, enabling it to grant loans on the best possible terms
and thus continue to serve the policies of the European Union.
This has been implemented through a combination of strategic and market-driven
approaches.
A key feature has been the issuance of large liquid benchmark bonds in EUR, USD
and GBP. The EIB is the largest supranational borrower and the only benchmark
issuer offering liquid benchmark yield curves in all the core currencies. This funding
strategy is aimed at broadening the EIB's investor base and strengthening market
penetration while offering investors highly liquid and electronically traded products.
Particular emphasis has been attached to transparency through the use of book
buildings and the pot syndication methodology. These techniques constituted an
integral part of the largest single bond issue ever launched by the EIB, the EUR 5 bil
lion Global EARN 2007. At the end of 2001, the EARNs curve comprised nine bench
marks covering maturities from 2003 to 2010, with an outstanding volume of almost
EUR 40 billion, all of which are traded on the MTS electronic trading network.
page 10

In USD, the Bank offered large sized issues, which, whilst enhancing liquidity perception,
permitted less frequent calls on the market, eventually generating a beneficial effect on both
performance and funding cost. Four Global bond issues were brought to the market with an
increasing share of placement with US investors. The USD 4 billion 2006 Global issue consti
tutes the largest outstanding USD issue of the Bank.
Sterling funding accounted for 8.2% of total sterling non-Gilt fixed income issuance in 2001.
EIB bonds represent over 12% of the non-Gilt sterling fixed income index, the Bank thus
remaining the benchmark non-Gilt issuer.
Moreover, recourse has been had in issuance activity to customised products targeted at spe
cific investor needs in all available currencies. The requirements of retail and institutional
investors for specific investment instruments were catered for by the launch of tailor-made
and innovative issues which often included elements such as calls, caps and floors as well as
the linking of coupons and redemption amounts to movements in share indices and curren
cies. Structured funding included the launch of a GBP constant annuity RPI (UK Retail Price
Index) issue with a 33-year maturity for on lending on a back-to-back basis to the Dudley
Hospital PPP. In the context of EIB risk management policy, the Bank remained vigilant by rig
orously analysing and hedging against the various types of risk embedded in these issues.
The EIB pursued its efforts to borrow in the currencies of the Accession Countries, both on
domestic markets and the Euromarket. By virtue of its top credit rating, the Bank continues
to be able to issue longer-term bonds denominated in such currencies, thereby contributing
to the development of deeper capital markets. The EIB made a major contribution to the
development of the Polish market as the first issuer to launch a domestic debt issuance pro
gramme with the signature of its PLN 3 billion Debt Issuance Programme, followed by the
first PLN issue on the domestic market. Funds raised in such currencies are on-lent to project
promoters in the region concerned and, by eliminating foreign exchange risks, provide a
strong incentive for investment, ultimately fostering integration.
page 111 EIB BORROWING ACTIVITY

The EIB's role as an important international issuer is also reflected in its currency
diversification. This is demonstrated by its strong presence notably in Japan, the
Asian I Pacific region and the South African market. In Hong Kong, the EIB estab
lished itself as the largest international issuer and launched the first transaction of
the millennium in the form of a HKD 2.5 billion issue.
A comprehensive and effective marketing programme has addressed both the insti
tutional and retail investor communities. This has been carried out via numerous
investor roadshows in the world's financial centres with a view to enhancing the
EIB's distribution channels and further familiarising investors with its product range.
Borrowings signed in 2001 (EUR million)
Number of transactions Before swaps After swaps
EUR 14 10 398 32.2% 21 535 66.9%
GBP 44 6 862 21.2% 6 971 21.7%
USD 27 13 092 40.5% 2 484 7.7%
85 30 353 94.0% 30 991 96.3%
Other currencies 63 1 952 6.0% 1 181 3.7%
TOTAL 148 (*) 32 305 100% 32172 100%
of which EU 58 17 261 53% 28 597 89%
(*) Effectively 146 operations, given that some are split into several transactions.
page 12


ElF Governing Bodies
The ElF is managed and administered by the following three authorities:
• the General Meeting of shareholders (EIB, European Union, 28 financial institutions);
• the Board of Directors;
• the Chief Executive, Mr Walter CERNOIA.
Board of Directors Chairman
Giovanni RAVASIO Former Director General for Economic and Financial Affairs, European Commission, Brussels
Guy CRAUSER
Inigo FERNANDEZ DE MESA
Detlef LEINBERGER Francis MAYER
Peter SEDGWICK Lars TYBJERG
Jean-Pierre ARNOLDI Terry BROWN
Mauro CICCHINE Isabel CORREIA BARATA
Remy JACOB
Members
Director General for Regional Policy, European Commission, Brussels
Subdirector General de Coordinaci6n de Organismos Monetarios internacionales, Ministerio de Economia, Madrid Mitglied des Vorstandes, Kreditanstalt fOr Wiederaufbau, Frankfurt Vice-President. European Investment Bank Vice-President, European Investment Bank Direkt0r, 0konomi- og Erhvervsministeriet, Copenhagen
Alternates
Administrateur general de Ia Tresorerie, Ministere des Finances, Brussels Director-General Europe, European Investment Bank President, DEXIA CREDIOP, Rome Consultora da Direc~ao, Departamento de Rela~oes lnternacionais, Banco de Portugal, Lisbon Director of General Administration, European Investment Bank
Audit Board
Chairman
Michael HARALABIDIS Senior Associate, National Bank of Greece, Athens
Henk KROEZE Sylvain SIMONETTI
Members
Group Controller Holding- NIB Capital NV, The Hague Head of Unit, Accounting and Administration, European Commission, DG ECFIN, Luxembourg
Situation at 29 April 2002
FINANCIAL REPORT- 2001 I page 14

European Investment Fund Activity The ElF is now the European Union's financial institution specialising in venture capital and
SME guarantees. Since June 2000, the EIB has held a majority stake in the Fund, which never
theless remains a tripartite institution (EIB 61%, European Commission 30%, 28 banks 9%).
This distinctive feature is reflected in the ElF's principal goals, namely contributing to the pur
suit of "Community objectives" (Article 2 of its Statutes) whilst generating an "appropriate
return" for its shareholders (Article 24).
Venture capital operations
As at 1 January 2002, the ElF managed a portfolio of 153 funds corresponding to 2 billion. In
2001, it concluded 57 operations worth 800 million in the 15 Member States and 5 Accession
Countries, making it a major player on the European venture capital market. The bulk of its
resources are provided by the EIB under the "Innovation 2000 Initiative". The Commission
makes available additional sums under the Multiannual Programme for Enterprise 2001/2005.
The ElF's investment strategy revolves around three key areas:
• support for European high technology;
• the development of funds active on Europe's southern flank and in the Accession
Countries;
• the expansion of funds operating on a pan-European basis, thus providing them with criti
cal mass comparable to the large US funds.
SME guarantees
The other pillar of ElF activity is guaranteeing portfolios of bank loans to SMEs. This involves
credit enhancement, reinsurance and counter-guarantee operations and is based on a net
work of 86 financial intermediaries. The ElF's total guarantee commitments amount to more
than 3.3 billion. In 2001, the ElF concluded 39 SME portfolio guarantee operations, involving
a total of 958 million.
The majority of these operations (64% of the portfolio) were concluded under the SME
Facility, financed from Community budgetary resources, which has just been extended to
guaranteeing micro-credit operations, equity participations and investment by smaller busi
nesses in the information technology field. These ElF guarantee operations have a particularly
strong leverage effect and constitute an advantageous means of optimising budgetary
resources. The ElF also manages the "Growth and Environment" programme, which guaran
tees SME investment in the environmental protection sphere. Lastly, the volume of guarantee
operations mounted by the ElF from its own resources has grown substantially.
page 151 ElF ACTIVITY


EIB Group. ·a/ Statements F1nanc1
page 171

CONSOLIDATED BALANCE SHEET AS AT 31 DECEMBER 2001
ASSETS
1. Cash in hand, balances with central banks and post office banks .......................................... .
2. Treasury bills eligible for refinancing with central banks (Note B) ..................................... . Fair value adjustment ........................... .
3. Loans and advances to credit institutions a) repayable on demand ........................ . b) other loans and advances (Note C) .............. . c) loans (Note D) .............................. .
4. Loans and advances to customers Loans (Note D) ................................ . Specific provisions (Note A.4) ..................... . Fair value adjustment ........................... .
5. Debt securities including fixed-income securities (Note B) a) issued by public bodies ....................... . b) issued by other borrowers ..................... . Fair value adjustment ........................... .
6. Shares & other variable-yield securities (Note E) ..... . Fair value adjustment- shares .................... .
7. Intangible assets (Note F) ....................... .
8. Tangible assets (Note F) ........................ .
9. Other assets a) receivable in respect of EMS interest subsidies paid in
advance (Note G) ............................ . b) sundry debtors (Note H) ...................... . c) currency swap contracts adjustment account ...... . d) fair value adjustment- derivatives .............. .
10. Prepayments and accrued income (Note I) .......... .
In EUR '000
1 519 621 106
181 292 9 917 933
84 654 699
101 085 284 -175 000
33179
3 262 797 3 418 574
-46
838 530 5 642
1 236 663 6 948 150
31.12.2001
22180
1519 727
94 753 924
100 943 463
6 681325
844172
7788
84528
3528 538 779
8 184 813
2 378477
215 962 704
OFF-BALANCE-SHEET ITEMS
Commitments - EBRD capital (Note E) . Uncalled ....................................... . . To be paid in .................................... . - Undisbursed loans (Note D) . Credit institutions ................................ . . Customers ...................................... .
- Undisbursed venture capital operations ............... . Guarantees . In respect of loans granted by third parties ............ . . In respect of venture capital operations ............... . Fiduciary operations (Note A) ....................... . Assets held on behalf of third parties (Note A) -Growth and environment .......................... . - SME Guarantee Facility ............................ . - European Technology Facility ....................... .
8 523 766 25 729 446
16 091 54 762 59 892
31.12.2001
442 500 33 750
34 253 212 1067 531
1562 167 57946
2 070 512
130 745
The bracketed notes refer to the Notes to the Consolidated Financial Statements.
FINANCIAL REPORT- 2001 I page 18
1 474 510 0
135 178 11 257 184 75 647 232
93 101 379 -175000
0
1 543 467 2 310 668
0
632 408 0
7 636 902 504
1 003 224 0
7 741 032 22 308 598
22 481 60 832 59 310
31.12.2000
24 726
1 474 510
87 039 594
92 926 379
3 854 135
632 408
10 018
83 459
1 913 364
3444117
191 402 710
31.12.2000
442 500 42 188
30 049 630 565 763
1 718 226 57 946
1 526 977
142 623
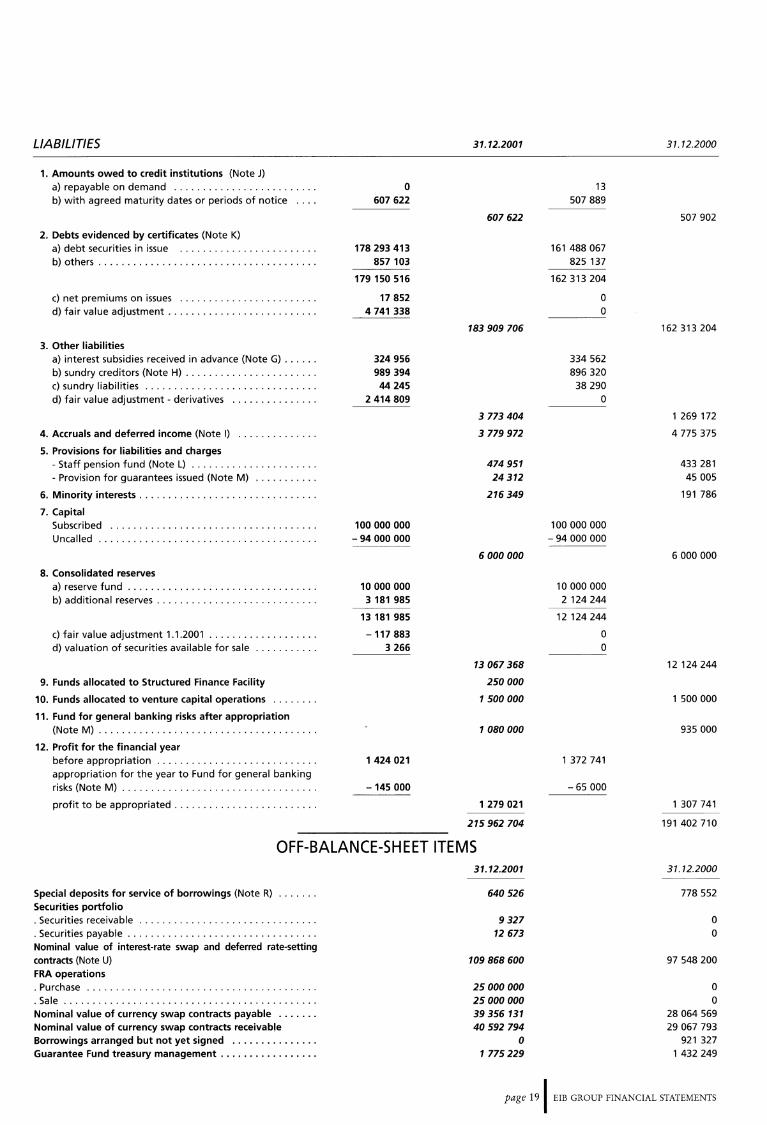
LIABILITIES
1. Amounts owed to credit institutions (Note J) a) repayable on demand ........................ . b) with agreed maturity dates or periods of notice
2. Debts evidenced by certificates (Note K) a) debt securities in issue ....................... . b) others ..................................... .
c) net premiums on issues ....................... . d) fair value adjustment ......................... .
3. Other liabilities a) interest subsidies received in advance (Note G) ..... . b) sundry creditors (Note H) ...................... . c) sundry liabilities ............................. . d) fair value adjustment- derivatives .............. .
4. Accruals and deferred income (Note I)
5. Provisions for liabilities and charges - Staff pension fund (Note L) ..................... . - Provision for guarantees issued (Note M) .......... .
6. Minority interests .............................. .
7. Capital Subscribed ................................... . Uncalled ..................................... .
8. Consolidated reserves a) reserve fund ................................ . b) additional reserves ........................... .
c) fair value adjustment 1.1.2001 .................. . d) valuation of securities available for sale .......... .
9. Funds allocated to Structured Finance Facility
10. Funds allocated to venture capital operations
11. Fund for general banking risks after appropriation (Note M) ..................................... .
12. Profit for the financial year before appropriation ........................... . appropriation for the year to Fund for general banking risks (Note M) ................................. .
profit to be appropriated ........................ .
0 607 622
178 293 413 857 103
179 150 516
17 852 4 741 338
324 956 989 394 44 245
2 414 809
100 000 000 -94 000 000
10 000 000 3 181 985
13 181 985
-117 883 3 266
1 424 021
-145 000
31.12.2001
607 622
183 909 706
3 773404
3 779972
474 951 24312
216 349
6 000 000
13 067 368
250 000
1500 000
1080 000
1 279 021
215 962 704
13 507 889
161 488 067 825 137
162 313 204
0 0
334 562 896 320
38 290 0
100 000 000 -94 000 000
10 000 000 2 124 244
12 124 244
0 0
1 372 741
-65 000
31.12.2000
507 902
162 313 204
1 269 172
4 775 375
433 281 45 005
191 786
6 000 000
12 124 244
1 500 000
935 000
1 307 741
191402710
OFF-BALANCE-SHEET ITEMS
Special deposits for service of borrowings (Note R) ...... . Securities portfolio . Securities receivable .............................. . . Securities payable ................................ . Nominal value of interest-rate swap and deferred rate-setting contracts (Note U) FRA operations . Purchase ....................................... . . Sale ........................................... . Nominal value of currency swap contracts payable ...... . Nominal value of currency swap contracts receivable Borrowings arranged but not yet signed .............. . Guarantee Fund treasury management ................ .
31.12.2001
640526
9327 12 673
109 868 600
25 000 000 25 000 000 39 356131 40 592 794
0 1775 229
31.12.2000
778 552
0 0
97 548 200
0 0
28 064 569 29 067 793
921 327 1 432 249
page 191 EIB GROUP FINANCIAL STATEMENTS

STATEMENT OF SPECIAL SECTION<1l AS AT 31 DECEMBER 2001 In EUR '000
(amounts at historic cost in foreign currency converted at exchange rates prevailing on 31 December 2001)
ASSETS
Member States
From resources of the European Community
(New Community Instrument for borrowing and lending) Disbursed loans outstanding <2> ••••....••••••••......••••••••••....••••••••••••..
Turkey
From resources of Member States Disbursed loans outstanding <3> ••••••••..••••••••••••.•••••••••••••••••••••••••••
Mediterranean Countries
From resources of the European Community
Disbursed loans outstanding ................................................... .
Risk capital operations
- amounts to be disbursed
-amounts disbursed ......................................................... .
African, Caribbean and Pacific States and Overseas Countries and Territories
From resources of the European Community
Yaounde Conventions
Total <•>
Loans disbursed ............................................................ .
Contribution to the formation of risk capital
Amounts disbursed
Total <s>
Lome Conventions
Operations from risk capital resources:
-amounts to be disbursed .................................................... .
-amounts disbursed .......................................................... .
Operations from other resources:
- amounts to be disbursed .................................................... .
Total <•>
Grand total
For information:
31.12.2001
80 959
58 953
211 121
96 582
192 572
289 154
500 275
44 810
419
45 229
666 171
1198479
1 864 650
8 000
1 872 650
2 558 066
31.12.2000
106 191
72 041
220 434
129 842 157 381
287 223
507 657
46 364
419
46 783
503 993 1 141 646
1 645 639
8 000
1 653 639
2386311
Total amounts disbursed and not yet repaid on loans on special conditions made available by the Commission in respect of which the Bank has accepted an EC mandate for recovering principal and interest: a) Under the First, Second and Third Lome Conventions: at 31.12.2001: 1 402 697; at 31.12.2000: 1 447 378. b) Under Financial Protocols signed with the Mediterranean Countries: at 31.12.2001: 158 245; at 31.12.2000: 164 050.
(1) The Special Section was set up by the Board of Governors on 27 May 1963: under a Decision taken on 4 August 1977 its purpose was redefined as being that of recording operations carried out by the European Investment Bank for the account of and under mandate from third parties.
(2) Initial amount of contracts signed under Council Decisions 78/870/EEC of 16 October 1978 (New Community Instrument), 82/169/EEC of 15 March 1982, 83/200/EEC of 19 April 1983 and 87/182/EEC of 9 March 1987 for promoting investment within the Community, as well as 81/19/EEC of 20 January 1981 for reconstructing areas of Campania and Basilicata (Italy) stricken by an earthquake on 23 November 1980 and 81/1013/EEC of 14 December 1981 for reconstructing areas stricken by earthquakes in Greece in February and March 1981, under mandate, for the account and at the risk of the European Community: 6 399 145 add: exchange adjustments + 127 897 less: cancellations 201 991
repayments 6 244 092 - 6 446 083
80 959
FINANCIAL REPORT- 2001 I page 20
(3) Initial amount of contracts signed for financing projects in Turkey under mandate, for the account and at the risk of Member States: 405 899 add: exchange adjustments + 24 955 less: cancellations 215
repayments 371 686 - 371 901
58 953
(4) Initial amount of contracts signed for financing projects in the Maghreb and Mashreq countries, Malta, Cyprus, Turkey and Greece (EUR 10 million lent prior to accession to EC on 1 January 1981) under mandate, for the account and at the risk of the European Community: 635 007 add: exchange adjustments + 3 less: cancellations 30 867
repayments 103 868 - 134 735
500 275

LIABILITIES
Funds under trust management Under mandate from the European Communities
- New Community Instrument
- Financial Protocols with the Mediterranean Countries
-Yaounde Conventions
- Lome Conventions . . . . . . . . . . . . . . . . . . . .
Under mandate from Member States
Funds to be disbursed On loans and risk capital operations in the Mediterranean Countries
On operations from risk capital resources under the Lome Conventions
On operations from other resources under the Lome Conventions
(5) Initial amount of contracts signed for financing projects in the Associated African States, Madagascar and Mauritius and the Overseas Countries, Territories and Departments (AASMM-OCTD) under mandate, for the account and at the risk of the European Community:
-loans on special conditions 139 483 - contributions to the formation
of risk capital 2 503 141 986
add: -capitalised interest 1 178 - exchange adjustments 9 839 + 11 017
less: - cancellations 1 574 - repayments 106 200 - 107 774
45 229
31.12.2001 31.12.2000
80 959 106 191 403 693 377 815
45 229 46 783 1 198 479 1 141 646
1 728 360 1 672 435
58 953 72 041
Total 1 787 313 1 744 476
96 582 129 842
666 171 503 993
8 000 8 000
Total 770 753 641 835
Grand total 2 558 066 2 386 311
(6) Initial amount of contracts signed for financing projects in the African, Caribbean and Pacific States and the Overseas Countries and Territories (ACP-OCT) under mandate, for the account and at the risk of the European Community:
Loans from risk capital resources: -conditional and subordinated loans 2 711 347 - equity participations 117 634 2 828 981
add: - capitalised interest + 1 663
less: - cancellations 347 411 - repayments 601 882 - exchange adjustments 16 701 -965 994
1 864 650 Loans from other resources: 8 000
1 872 650
page 211 EIB GROUP FINANCIAL STATEMENTS

CONSOLIDATED PROFIT AND LOSS ACCOUNT For the year ended 31 december 2001
In EUR '000
1. Interest receivable and similar income (Note N)
2. Interest payable and similar charges ......................... .
3. Income from participating interests .......................... .
4. Commission receivable (Note 0) ............................ .
5. Commission payable ...................................... .
6. Result on financial operations (Note N) ....................... .
7. Other operating income ................................... .
8. General administrative expenses (Note P): .................... .
a) staff costs ............................................ . 158 669 b) other administrative costs ................................ . 52 869
9. Value adjustments in respect of (Note F): ..................... .
a) intangible assets ....................................... . 4 951 b) tangible assets ........................................ . 10 786
10. Value adjustment on venture capital operations ................ .
11. Extraordinary income (Note Q) .............................. .
12. Extraordinary charges (Note Q) ............................. .
13. Transfer to provision for guarantees issued (Note M) ............ .
14. Minority interests ........................................ .
15. Profit for the financial year ................................ .
16. Appropriation to Fund for general banking risks (Note M) ........ .
17. Profit to be appropriated .................................. .
FINANCIAL REPORT- 2001 I page 22
31.12.2001
10 757 180
-9 072 365
0
32 529
-1 771
-47 739
26 357
-211 538
-15 737
-22 137
40 000
-11 364
- 19 665
-29 729
1 424 021
-145 000
1 279 021
31.12.2000
10 654 762
-9 086 590
4 800
35 198
-5 650
-3 887
18 611
-185411 140 607 44 804
- 12 068 2 802 9 266
35 213
-67 428
-7 452
-7 355
1 372 741
-65 000
1 307 741

STATEMENT OF MOVEMENTS IN CONSOLIDATED OWN FUNDS AS AT 31 DECEMBER 2001 (In EUR '000)
Capital -subscribed - uncalled
Reserves: - reserve fund -additional reserves
-fair value adjustment as at 01.01.2001 (lAS 39) - increase for the year in valuation of securities available for sale
Fund for general banking risks (Note M)
Funds allocated to Structured Finance Facility
Funds allocated to venture capital operations
Profit for the financial year
• Commitment to purchase the remaining 785 ElF shares at a fixed future price.
Under the terms of this put option, the El8 is offering to buy these shares from the ElF's other shareholders within a remaining period of
Situation at 31.12.2000
100 000 000 -94 000 000
6 000 000
10 000 000 2 124 244
12 124 244
12 124 244
870 000
0
1 500 000
20 494 244
1 372 741
21 866 985
Appropriation of profit for the 2000
financial year
1 057 741
1 057 741
1 057 741
65 000
250 000
0
1 372 741
- 1 372 741
Situation at 31.12.2001
100 000 000 -94 000 000
6 000 000
10 000 000 3 181 985
13 181 985
- 117 883 3 266
13 067 368
935 000
250 000
1 500 000
21 752 368
1 424 021
23 176 389
four years for a price of EUR 315 000 per share. This purchase price represents annual appreciation of 3% compared with the purchase offer made in 2000.
page 231 EIB GROUP FINANCIAL STATEMENTS

CONSOLIDATED CASH FLOW STATEMENT AS AT 31 DECEMBER 2001 In EUR '000
A. Cash flows from operating activities: Profit for the financial year ...... . Adjustments: Transfer to provision for guarantees issued Value adjustments ............ . Exchange adjustment not subject to Article 7 Decrease in accrued interest and commissions payable and interest received in advance (Decrease)/increase in accrued interest and commissions receivable Investment portfolio amortisation lAS 39 adjustments ..... .
Profit on operating activities: Net loan disbursements Repayments . . . . . . . . . . lAS 39 loan adjustments . . . Net balance on NCI operations (Note H) Increase in operational portfolio Increase in venture capital operations Increase in securitised loans ..... .
B. Cash flows from investing activities: EBRD shares paid up (Note E) Sales of securities ........... . Purchases of securities ........ . Increases in land, buildings and furniture (Note F) Increases in intangible fixed assets Other (decreases)/increases in assets Purchase of ElF shares Reclassification of ElF portfolio ..
Net cash from operating activities
Net cash from investing activities
C. Cash flows from financing activities: Issue of borrowings . . . . . . . . . . Redemption of borrowings (Decrease)/increase in currency swaps lAS 39 borrowings adjustments . Net increase in commercial paper .. lAS 39 derivatives adjustments . . . . Net increase in amounts owed to credit institutions Other increases in liabilities Hedging portfolio sales Hedging portfolio purchases
Summary statement of cash flows
Net cash from financing activities
Cash and cash equivalents at beginning of the financial year (before consolidation). ElF - initial consolidation ............................... .
Net cash from: (1) operating activities (2) investing activities (3) financing activities Effects of exchange rate changes on cash and cash equivalents
Cash and cash equivalents at end of the financial year .....
Cash analysis (excluding investment and hedging portfolios) Cash in hand, balances with central banks and post office banks Bills maturing within three months of issue .......... . Loans and advances to credit institutions: - accounts repayable on demand -term deposit accounts
31.12.2001
1 424 021
-20 693 15 737
905 -995 403 1 065 640
-2 711 -114617
1 372 879 -30 485 314
15772177 -33 179
16 298 -1 526 000
-196 909 -1 003 287
-16 083 335
-8437 316 149
-356 768 - 11 855 -2 721 118 394
0 66 526
121 288
32 531 378 -19 000 043
-233 439 4 759 190
670.303 -4 533 341
99 720 155 656
0 0
14 449 424
13 302 774
-16 083 335 121 288
14 449 424 583 257
12 373 408
22 180 2 252 003
181 292 9 917 933
12 373 408
(*) For the first year of consolidation, the closing balances for the ElF's accounts have been incorporated in the movements for 2000.
FINANCIAL REPORT- 2001 I page 24
31.12.2000
1 372 741
(*) 45 005 11 865
1 049 -142 932 - 143 621
-5 225 0
1 138 882 -29 714 485
15 590 952 0
33 859 -81 683
-284 026 -120 000
-13 436 501
-8 438 337 126
-763 465 - 11 651 -5 583
-309 430 -57 004
0
-818 445
28 770 713 -17 102 100
516 441 0
589 973 0
171 276 467 412
1 293 081 -27 216
14 679 580
12 200 160 (*)
408 790
12608950
-13 436 501 -818 445
14 679 580 269 190
13 302 774
24 726 1 885 686
135 178 11 257 184
13 302 774

EUROPEAN INVESTMENT BANK GROUP NOTES TO THE CONSOLIDATED FINANCIAL STATEMENTS AS AT 31 DECEMBER 2001
Note A - Significant accounting policies
1. Consolidation principles and accounting standards
a) The Group's consolidated financial statements have been prepared in accordance with international accounting standards (lAS). The Group's consolidated financial statements have been drawn up, for the first time, in compliance with lAS 39, the main features of which are as follows:
1- Currency swaps receivable and payable are no longer entered on the balance sheet for nominal amounts but are recorded at their fair value.
2- The majority of the Group's swaps are concluded with a view to hedging specific bond issues. These derivatives as well as borrowings hedged are measured at their fair value using internal valuation tools. This has no impact on the Group's own funds or surplus as value adjustments cancel each other out.
3- Macro-hedging swaps used as part of asset/liability management are marked to market (fair value) using internal valuation tools.
4- Gains or losses, following fair value variations in respect of securities available for sale, are recorded as a separate item of own funds until the actual sale of such securities. Only the gain or loss, in the event of sale of these securities, is entered in the profit and loss account.
5- Net premiums (discounts) on borrowings are added to (deducted from) the book value of borrowings on the liabilities side of the balance sheet.
6- Financial assets are accounted for using the settlement date basis.
The accounting policies applied are in conformity, in all material respects, with the general principles of the Directive of the Council of the European Communities of 8 December 1986 (as amended by Directive 2001/65/EC of 27 September 2001) on the annual accounts and consolidated accounts of banks and other financial institutions (the "Directive"), except as explained in the relevant notes on accounting policies. On a proposal from the Management Committee, the Board of Directors decided, on 26 February 2002, to submit the consolidated financial statements to the Governors for approval at their meeting on 4 June 2002.
b) The Group's consolidated accounts comprise the accounts of the European Investment Bank ("the Bank") and those of its subsidiary, the European Investment Fund ("the ElF"), having its registered office at 43, avenue J.F. Kennedy, Luxembourg, as from 1 July 2000.
The gain arising from the elimination of the Bank's majority (60.75%) shareholding in the ElF is recorded, in accordance with lAS 22, as extraordinary income. Minority interests are disclosed separately.
c) Restatement and intra-group transactions.
Prior to consolidation, the ElF's accounts have been restated in order to ensure conformity with the following accounting policies. After aggregation of the balance sheets and profit and loss accounts, intra-group balances and profits or losses arising on transactions between the two entities have been eliminated.
2. Conversion of currencies
The Group uses the euro, the single currency of the Member States participating in the third stage of Economic and Monetary Union, as the unit of measure for the capital accounts and for presenting its financial statements.
The Group conducts its operations in the currencies of its Member States, in euro and in non-Community currencies.
Its resources are derived from its capital, borrowings and accumulated earnings in various currencies and are held, invested or lent in the same currencies.
The Group's assets and liabilities are converted into euro on the basis of the exchange rates obtaining at the balance sheet date. The gain or loss arising from such conversion is credited or charged to the profit and loss account.
The profit and loss accounts are converted into euro monthly on the basis of the exchange rates obtaining at the end of each month.
3. Treasury bills and other bills eligible for refinancing with central banks and debt securities including fixed-income securities
With a view to clarifying management of its liquid assets and consolidating its solvency, the Group has decided to establish the following types of portfolio:
3.1. Investment portfolio
The investment portfolio consists of securities purchased with the intention of holding them until final maturity in order to ensure the Group's solvency. These securities are issued or guaranteed by:
-governments of the European Union, G10 countries and their agencies;
-supranational public institutions, including multinational development banks.
The entry cost of securities in this portfolio is the purchase price or more exceptionally the transfer price. The difference between entry price and redemption value is accounted for pro rata temporis over the remaining life of the securities held.
3.2. Operational portfolio
The operational portfolio comprises listed securities issued and guaranteed by financial establishments. Securities held in this portfolio are marked to market in the balance sheet.
Realised and unrealised gains and losses are entered in the profit and loss account.
3.3. Short-term securities
In order to maintain an adequate level of liquidity the Group purchases money market products, in particular Treasury bills and negotiable debt securities issued by credit institutions. The securities are held until their final maturity and presented in the accounts at their nominal value.
Treasury bills appear on the assets side of the balance sheet under item 2) Treasury bills eligible for refinancing with central banks.
Negotiable debt securities issued by credit institutions appear on the assets side of the balance sheet under item 5) Debt securities including fixed-income securities- b) issued by other borrowers.
3.4. Available for sale portfolio
Securities are classified as available for sale where they do not appropriately belong to one of the other categories of portfolio. The securities are measured at fair value and changes in value are recorded under own funds.
4. Loans and advances to credit institutions and customers
4.1. Loans are included in the assets of the Group at their net disbursed amounts. Where loans are hedged by derivatives, they are measured at their fair value.
Specific provisions have been made for loans and advances outstanding at the end of the financial year and presenting risks of non-recovery of all or part of their amounts. These provisions are entered on the profit and loss account as "Value adjustments in respect of loans and advances".
Value adjustments with regard to interest on these loans are determined on a case-bycase basis by the Bank's Management.
4.2. Interest on loans
Interest on loans is recorded in the profit and loss account on the accruals basis, i.e. over the life of the loans.
4.3. Reverse repurchase and repurchase operations (reverse repos and repos).
A reverse repurchase (repurchase) operation is one under which the Group lends (borrows) liquid funds to (from) a credit institution which provides (receives) collateral in the form of securities. The two parties enter into an irrevocable commitment to complete the operation on a date and at a price fixed at the outset.
The operation is based on the principle of delivery against payment: the borrower (lender) of the liquid funds transfers the securities to the Group's (counterparty's) custodian in exchange for settlement at the agreed price, which generates a return (cost) for the Group linked to the money market.
This type of operation is considered for the purposes of the Group to be a loan (borrowing) at a guaranteed rate of interest and is entered on the assets side of the balance sheet under item 3) Loans and advances to credit institutions - b) other loans and advances (on the liabilities side of the balance sheet under item 1) Amounts owed to credit institutions - b) with agreed maturity dates or periods of notice). The securities received (provided) as collateral are accounted for off balance sheet (are maintained in the balance sheet accounts).
5. Shares, other variable-yield securities and participating interests
Shares are classified as available for sale. They are measured at fair value and changes in value are recorded under own funds.
Venture capital operations and participating interests held represent medium and longterm investments and are accounted for at cost in accordance with lAS 39 which stipulates that financial instruments for which a fair value cannot be established shall be so valued. The estimated fair value of a risk capital investment may vary significantly in the course of the holding period and the nature of such investments is such that an accurate fair value can be determined only upon realisation of the investment. The estimation by the Group of a fair value for risk capital investments for which the method and timing of realisation have not yet been determined is therefore considered to be inappropriate. Value impairments are accounted for where these are other than temporary.
6. Tangible assets
Land and buildings are stated at cost less both initial write-down of the Kirchberg headquarters and accumulated depreciation. Depreciation is calculated to write off the value of the Bank's Luxembourg-Kirchberg headquarters and its office in Lisbon on the straight-line basis over 30 and 25 years respectively. Office furniture and equipment were, until end-1997, depreciated in full in the year of acquisition. With effect from 1998, permanent equipment, fixtures and fittings, furniture, office equipment and vehicles have been recorded in the balance sheet at their purchase price, less accumulated depreciation. Depreciation is calculated on the straight-line basis over the estimated life of each item purchased, as set out below:
- permanent equipment, fixtures and fittings
-furniture
-office equipment and vehicles
Works of art are depreciated in full in the year of acquisition.
7. Intangible assets
10years
5 years
3 years
a) Intangible assets comprise investment in software developed internally, depreciated on the straight-line basis over three years as from completion.
lAS 38 stipulates, inter alia, that for recognition as an asset the following criteria must be met:
1- the product or process is clearly defined and the costs attributable to the product or process can be separately identified and measured reliably;
2- the technical feasibility of the product or process can be demonstrated.
b) Software purchases are depreciated on the straight-line basis over their estimated life (2 to 5 years).
page 251 EIB GROUP FINANCIAL STATEMENTS

8. Staff pension fund and health insurance scheme
a) Pension fund
1- The EIB's main pension scheme is a contributory defined benefit pension scheme which covers all employees of the Bank. All contributions of the Bank and its staff are invested in the assets of the Bank. These annual contributions are set aside and accumulated as a specific provision on the liabilities side of the Bank's balance sheet, together with annual interest.
Commitments for retirement benefits are valued at least every three years in accordance with lAS 19 using the projected unit credit method, in order to ensure that the provision entered in the accounts is adequate. The main actuarial assumptions used by the actuary are set out in Note L. Actuarial surpluses and deficits are spread forward over a period based on the average expected remaining service lives of staff.
2- The Elf's pension scheme is a contributory defined benefit pension scheme, managed externally.
b) Health insurance scheme
1- The EIB has set up its own health insurance scheme for the benefit of staff, financed by contributions from the Bank and its employees. The health insurance scheme is currently managed on the basis of equal benefits and contributions.
2- The Elf's staff health insurance scheme is managed externally.
9. Fund for general banking risks and provision for guarantees issued
a) Fund for general banking risks
This item includes those amounts which the Group decides to put aside to cover risks associated with loans and other financial operations, having regard to the particular risks attaching to such operations.
International accounting standards require that the transfer to this reserve form part of the appropriation of the profit. The Directive requires that amounts transferred to this item feature separately in the profit and loss account as "Transfer to Fund for general banking risks".
b) Provision for guarantees issued
This provision is intended to cover risks inherent in the Group's activity of issuing guarantees in favour of financial intermediaries.
10. Funds allocated to venture capital operations and to the Structured Finance Facility
a) Funds allocated to venture capital operations
This item comprises the amount of appropriations from the annual result of the EIB, determined each year by the Board of Governors to facilitate instruments providing venture capital in the context of implementing the European Council Resolution on Growth and Employment.
b) Funds allocated to the Structured Finance Facility
This item comprises the amount of appropriations from the annual result of the EIB, determined each year by the Board of Governors to facilitate implementation of operations with a greater degree of risk for this new type of instrument.
Value adjustments on these operations will be deducted from these items when allocating future results.
11. Taxation
The Protocol on the Privileges and Immunities of the European Communities, appended to the Treaty of 8 April 1965 establishing a Single Council and a Single Commission of the European Communities, stipulates that the assets, revenues and other property of the Group are exempt from all direct taxes.
12. Currency and interest rate swaps
The Group enters into currency swaps, in which the proceeds of a borrowing may be converted into a different currency, mainly as part of its resource-raising operations.
Note B- Securities portfolio (in EUR '000}
Treasury bills eligible for refinancing with central banks (of which EUR 12 661 unlisted in 2001 and EUR 12 651 in 2000)
Debt securities including fixed-income securities (listed):
Simultaneously, a forward exchange operation is conducted in order to obtain the amounts needed to service the borrowing in the original currency. The amounts corresponding to these operations are entered off balance sheet (see Note U).
The Group also enters into interest rate swaps as part of its hedging operations. The corresponding interest is accounted for on a pro rata temporis basis. The nominal amounts of interest rate swaps are accounted for off balance sheet.
13. Prepayments and accrued income -Accruals and deferred income
These accounts comprise:
Prepayments and accrued income: Expenditure incurred during the financial year but relating to a subsequent financial year, together with any income which, though relating to the financial year in question, is not due until after its expiry (principally interest on loans);
Income received before the balance sheet date but relating to a subsequent financial year, together with any charges which, though relating to the financial year in question, will be paid only in the course of a subsequent financial year (principally interest on borrowings).
Accruals and deferred income:
14. Interest receivable and similar income
In addition to interest and commission on loans, deposits and other revenue from the securities portfolio, this heading includes the indemnities received by the Bank in respect of prepayments made by its borrowers. With a view to maintaining equivalent accounting treatment between income on loans and the cost of borrowings, the Bank amortises prepayment indemnities received over the remaining life of the loans concerned.
15. Assets held for third parties
Assets held for third parties represent three trust accounts established by the Elf.
The first one was set up for the administration of the budgetary contributions made by the European Commission in relation to the "Growth and Environment" pilot project. Sums held in this account remain the property of the Commission so long as they are not disbursed for the purposes of the abovementioned project.
The second trust account is opened and maintained in the name of the Elf, but for the benefit of the Commission, for the administration of the "SME Guarantee Facility". Under this scheme, the Elf is empowered to issue guarantees in its own name but on behalf and at the risk of the Commission.
The third trust account is established for the administration of the "ETF Start-up Facility" (see below), under which the Elf is empowered to acquire, manage and dispose of investments in fledgling technology-sector enterprises with high growth potential, in its own name but on behalf and at the risk of the Commission.
16. Fiduciary operations
Pursuant to Article 28 of its Statutes, the Elf acquires, manages and disposes of investments in venture capital enterprises, in its own name but on behalf and at the risk of the European Community, according to Fiduciary and Management Agreements concluded with the European Community ("ETF Start-up Facility").
The Elf is also empowered to issue guarantees in its own name but on behalf and at the risk of the European Community according to the Fiduciary and Management Agreement concluded with the European Community ("SME Guarantee Facility").
17. Guarantee Fund treasury
The Commission entrusted financial management of the Fund to the EIB under an agreement signed between the two parties in November 1994.
18. Certain prior-year figures have been reclassified to conform with the current year's presentation.
31.12.2001 31.12.2000
1 519 727 1 474 510
6 681 325 3 854 135
8 201 052 5 328 645
Amortisation Purchase
price Amortisation
for the period Book value
to be accounted for
Value at final Market maturity value
Investment portfolio ................... .
Operational money market portfolio: - Money market securities with a max.
3-month maturity .................... . - Money market securities with a max.
12-month maturity ................... .
Operational bond portfolio 81 Credit Spread ........................ .
Operational portfolio 83 Global Fixed Income ................... .
Loan Securitisation Portfolio (Note D) ..... .
2 866 643
2 252 003
1 348 120
381 668
195 453
1 123 287
8 167 174
33 934
-56
33 878 • including reduction in market value of EUR- 73. •• including increase in market value of EUR 133.
FINANCIAL REPORT- 2001 I page 26
2 900 577 -44 642 2 855 935 2 926 969
2 252 003 2 252 003 2 252 003
1 348 120 1 348 120 1 348 120
381 479 * -128 381 484 381 479
195 586 ** 190 800 195 586
1 123 287 1 123 287 1 123 287
8 201 052 8 151 629

Note C - Loans and advances to credit institutions (other loans and advances) (in EUR '000)
Term deposits ............... .
Reverse repos(*) .............. .
31.12.2001
6 588 593
3 329 340
9 917 933
31.12.2000
6 525 201
4 731 983
11 257 184
(*) These operations comprise those carried out with a third-party custodian who undertakes, on the basis of a framework contract, to guarantee compliance with the contractual terms and conditions, notably with respect to: -delivery against payment; -verification of collateral; -the collateral margin required by the lender which must always
be available and adequate, with the market value of the securities being verified daily by the said custodian;
Analysis of aggregate loans granted:
- Disbursed portion ........................................ . - Undisbursed portion ...................................... .
Aggregate loans granted ................................... .
-organisation of substitute collateral provided that this meets all the contractual requirements.
Note D- Summary statement of loans as at 31 December 2001
(in EUR '000)
Aggregate loans granted (*)
Aggregate historical amount of loans calculated on the basis of the parities applied on the date of signature 360 315 577 Add: debt adjustment 270 250
exchange adjustments 12 891 752 + 13 162 002
Less: terminations and cancellations 9 250 399 principal repayments 144 233 985
-153 484 384
Aggregate loans granted 219 993 195
Loans granted
to intermediary directly to final credit institutions beneficiaries Total 2001 Total 2000
84 654 699 101 085 284 185 739 983 168748611 8 523 766 25 729 446 34253212 30 049 630
93 178 465 126 814 730 219 993 195 198 798 241
(*)Aggregate loans granted comprise both the disbursed portion of loans and the portion still to be disbursed.
Aggregate loans granted ....... . Securitised loans (Note B) ....... .
Aggregate loans (Note V) ...... .
31.12.2001
219 993 195 1 123 215
221 116 410
Note E - Shares and other variable-yield securities
This item comprises (in EUR '000):
2001
Venture capital operations-after write-down of EUR 19 213 (2000: 0) 683 809
EBRD shares 123 750
Shares acquired with a view to guaranteeing recovery of loans and advances 30 970
lAS 39 value adjustment 5 642
36 613
844172
in EUR '000 %held
EBRD (31.12.2000) 3.04
31.12.2000
198 798 241 120 000
198 918 241
2000
486 900
115 312
30 196
632 408
The amount of EUR 123 750 500 (2000: 115 312 500) corresponds to the capital paid in by the Group at 31 December 2001 in respect of its subscription of EUR 600 000 000 to the capital of the EBRD.
The Group holds 3.04% of the subscribed capital.
Neither the Group's result nor its own funds would have been materially affected had these shares been accounted for using the equity method.
Total own funds Total net result Balance sheet total
3511178 152 792 21290010
The market value of shares acquired with a view to guaranteeing recovery of loans and advances amounts to EUR 36 613 076 (2000: 32 499 160).
Note F- Tangible and intangible assets (in EUR '000)
Total Total Kirchberg Lisbon Furniture and tangible intangible
Land buildings building equipment assets assets
Net book value at beginning of the year 3 688 70 833 139 8 799 83 459 10 018 Acquisitions during the year 11 855 11 855 2 721 Depreciation during the year 3 991 14 6 781 10 786 4 951
3 688 66 842 125 13 873 84 528 7 788
All of the land and buildings are used by the Group for its own activities.
page 271 EIB GROUP FINANCIAL STATEMENTS

Note G - Interest subsidies paid and received in advance
a) Part of the amounts received from the European Commission through EMS (European Monetary System) arrangements has been made available as a long-term advance which is entered on the assets side under item 9.(a) as "Receivable in respect of EMS interest subsidies paid in advance".
b) On the liabilities side (item 3.(a)), "Interest subsidies received in advance" comprise:
- amounts in respect of interest subsidies for loans granted for projects outside the Union, under Conventions signed with the ACP States and Protocols concluded with the Mediterranean Countries;
Note H -Other balance sheet accounts (in EUR '000)
Sundry debtors:
- Staff housing loans and advances
-Net balance of amounts dis-bursed in respect of borrowings and amounts received in respect of loans under NCI operations managed for the account of the European Community (Special Section) .................... .
- Borrowing proceeds to be received
- Swap receivables ............ .
- Loan instalments receivable .... .
-Other ..................... .
Sundry creditors:
European Community accounts:
. for Special Section operations and related unsettled amounts
. deposit accounts ........... .
-Swap payables .............. .
-Borrowing instalments payable ..
- Optional Supplementary Provident Scheme (Note L) ..... .
-Other ..................... .
31.12.2001
82 173
107 116
0
0
299 010
50 480
538 779
167 241
296 053
0
172 066
133 689
220 345
989 394
FINANCIAL REPORT- 2001 I page 28
31.12.2000
89 035
123 413
226 723
227 393
140 148
95 792
902 504
160 692
200 426
226 723
0
127 693
180 786
896 320
- interest subsidies, concerning certain lending operations mounted within the Union from the Bank's own resources, made available in conjunction with the EMS under Council Regulation (EEC) No 1736179 of 3 August 1979 and in conjunction with the financial mechanism established by the EFTA Countries under the EFTA Agreement signed on 2 May 1992;
- amounts received in respect of interest subsidies for loans granted from EC resources under Council Decisions 78/870/EEC of 16 October 1978 (New Community Instrument), 82/169/EEC of 15 March 1982 and 83/200/EEC of 19 April 1983 and under Council Regulation (EEC) No 1736/79 of 3 August 1979 as amended by Council Regulation (EEC) No 2790/82 of 18 October 1982.
Note I - Prepayments and accrued income - Accruals and deferred income (in EUR '000)
Prepayments and accrued income:
Interest and commission receivable
Deferred borrowing charges .... .
Other ...................... .
Accruals and deferred income:
Interest and commission payable ..
Deferred loan proceeds ........ .
Deferred borrowing proceeds ... .
HIPC initiative(*) ............. .
Personnel costs payable (*) ..... .
External mobility costs(*) ...... .
Other ...................... .
31.12.2001
2 377 198
0
1 279
2 378 477
3 181 619
461 868
0
67 912
7 100
7 500
53 973
3 779 972
31.12.2000
2 627 403
815716
998
3444117
3 348 393
505 733
714 868
70 000
6 939
0
129 442
4 775 375
(*) Included in item 12. of the profit and loss account: extraordinary charges (Note Q) .
Note J - Amounts owed to credit institutions (in EUR '000)
31.12.2001
Repayable on demand
-Credit institutions ........ . 0
With agreed maturity dates or periods of notice
-Short-term borrowings . . . . . 597 497
- Promissory notes issued in respect of paid-in capital of EBRD ................... 10125
- Repos . . . . . . . . . . . . . . . . . . 0
607 622
607 622
426 658
9 113
72 118
31.12.2000
13
507 889
507 902

Note K- Summary statement of debts evidenced by certificates as at 31 December 2001 (in EUR '000)
Borrowings Currency swaps
Amounts payable (+) or receivable (-)
Net amount
Payable in
Outstanding Average Outstanding Average Due dates
Average Average Outstanding at Outstanding at at 31.12.2000 rate at 31.12.2001 rate 31.12.2000 rate 31.12.2001 rate 31.12.2000 31.12.2001
EUR
DEM
FRF
ITL
BEF
NLG
IEP
LUF
ESP
PTE
FIM
GRD
47 344 105 5.38 72 131 851
2 153 413 6.20
4 923 660 6.54
7 478 250 7.50
68171 7.50
2 932 860 6.68
61 392 7.75
679 304 7.05
4 199 933 7.23
942 091 6.11
67 275 6.29
616 287 6.29
IN-CURRENCIES 71 466 741 72 131 851
GBP
DKK
SEK
USD
CHF
JPY
NOK
CAD
AUD
CZK
HKD
NZD
ZAR
HUF
EEK
PLN
TWD
SKK
TOTAL
lAS 39
TOTAL
40 713 384 6.46 48 004 134
482 373 4.94
211181 5.70
484 099
200 512
34 505 658
3 627 232
6.11 45145774
4.32 3 213 298
4 570 277 3.42
255 055 5.56
1 841 031 8.13
636 553 7.88
296 248 9.03
1 811 844 7.74
142 045 7.17
761 152 13.68
73 585 11.77
9 587 10.00
94 242
746 729
68 286
162 313 203
162 313 203
14.54
5.66
15.58
3 429 706
314 406
1 474 036
462 963
247 891
1 767 967
94 273
609 566
161 106
326 416
1 035 766
46 752
179 150 516
4759190
183 909 706
5.48 2001/2030 6 313 851 + 4.73 24 174 809 +
5.63 0.00 4 633 060 +
0.00 263 927 + 5.06
0.00
0.00
0.00
0.00
0.00
0.00
0.00
0.00
0.00
42 102 + 4.58
119 342 + 8.25
1 557 764 - 4.73
316135 + 5.64
210 709 - 6.54
1 789 206 + 4.72
1 291 307 + 4.76
157 349 + 4.74
205 429 - 4.85
6.34 2001/2040 2 993 749 - 6.39 4 046 143 -
5.17 2002/2005 32 243 +
765 695 + 5.70 2003/2007
5.50
3.99
3.04
5.67
7.98
6.28
7.55
7.12
6.50
12.88
10.02
2001/2026 4 420 494 -
2001/2014 181 657 + 2001/2031 1 649 598 -
2004/2007 177 324 -
2001/2008 1 769 424 -
2001/2005 636 553 -
2001/2015 57 066 -
2001/2010 1 811 844 -
2002/2004 142 045 -
2001/2018 447 906 -
2003/2004
3.96
3.93
141 865 +
864 306 +
6.45 15 983 627 -
7.11 54 960 -
1.45 944 455 -
7.22 213 796 -
9.00 1 402 998 -
7.88 462 963 -
5.10 101 167 +
7.74 1 767 967 -
7.17 94 273 -
13.44 371 124 -
81 573 -
0.00 2001/2001 9 587 - 10.00
12.52
5.00
15.63
2003/2006
2003/2008
2001/2002
42 291
746 729 -
68 286 -
14.84
5.66
15.58
118105 -
1 035 766 -
63 114 +
5.50 53 657 956 96 306 660
0.00 6 786 473
0.00 5 187 587
0.00 7 520 352
0.00 187 513
0.00 1 375 096
0.00 377 527
0.00 468 595
0.00 5 989 139
0.00 2 233 398
0.00 224 624
0.00 410 858
6.35 37 719 635 43 957 991
5.17
5.70
514 616
976 876
5.56 30 085 164
4.00 3 808 889
3.04
5.67
7.98
6.28
7.55
7.12
6.50
12.88
10.02
0.00
12.52
5.00
15.63
2 920 679
77 731
71 607
239 182
313 246
73 585
51 951
625 964
1 064 818
29 162 147
3 158 338
2 485 251
100 610
71 038
349 058
238 442
79 533
208 311
109 866
The redemption of certain borrowings is indexed to stock exchange indexes (historical value: 2 672 million). All such borrowings are hedged in full through swap operations.
Note L - Provisions for liabilities and charges (staff pension fund) (in EUR '000)
Commitments in respect of retirement benefits were valued at 30 June 2000 by an independent actuary using the projected unit credit method. The calculations were based on the following assumptions:
-a discount rate of 7% for determining the actuarial present value of benefits accrued;
- a retirement age of 62;
- a combined average impact of the increase in the cost of living and career progression estimated at 4%;
- a rate of adjustment of pensions of 1.5%;
-probable resignation of 3% up to age 55;
- use of the EVK!PRASA 90 actuarial tables.
Following this valuation, the Group's commitments have been found to be covered.
The movements in the pension fund provision were as follows:
- provision at 31 December 2000 ............. .
-payments made during the year ............. .
- annual cost ............................ .
-provision at 31 December 2001 ............. .
433 281
- 17 039
+58 709
474 951
The above figures do not include the liability towards members of staff in respect of the Optional Supplementary Provident Scheme (a contributory defined benefit pension scheme). The corresponding amount of EUR 133.7 million (2000: EUR 127.7 million) is entered under "Sundry creditors/other" (Note H).
The ElF's pension scheme is a contributory defined benefit pension scheme, managed externally.
page 291 EIB GROUP FINANCIAL STATEMENTS

Note M - Fund for general banking risks and provision for guarantees furnished (in EUR '000)
a) Movements in the Fund for general banking risks are tabulated below:
Fund at beginning of the year Appropriated for the year .. .
Fund at end of the year .... .
31.12.2001
935 000 145 000
1 080 000
31.12.2000
870 000 65 000
935 000
An amount of EUR 145 million has been appropriated from the profit for the 2001 financial year (see Note A 9.a).
b) Movements in the provision for guarantees issued are tabulated below:
Provision at beginning of the year .................... . Transfer for the year ....... . Reversal of TENs' guarantee provision (Note Q) ........ . Written off .............. .
31.12.2001
45 005 19 665
-40 000 -358
24 312
31.12.2000
37 573 7 452
0 -20
45 005
Note N - Geographical analysis of "Interest receivable and similar income" (item 1 of the profit and loss account) (in EUR '000)
Germany ................ . France .................. . Italy .................... . United Kingdom .......... . Spain ................... . Belgium ................. . Netherlands .............. . Sweden ................. . Denmark ................ . Austria .................. . Finland ................. . Greece .................. . Portugal ................ . Ireland .................. . Luxembourg ............. .
Outside the European Union
Income not analysed (1) .....
(1) Income not analysed:
Revenue from investment portfolio securities ........ . Revenue from hedging port-folio securities ............ . Revenue from short-term securities ................ . Revenue from money-market operations ............... . ElF guarantee commission (EIB counterguarantee) ..... .
31.12.2001
1 552 900 1 227 998 1 369 824 1 377 507 1 219 248
213 288 149 850 177 804 247 954 152 647 115 649 389 539 525 726 113 859 26 829
8 860 622
1 061 294
9 921 916
835 264
10 757 180
180 039
87 931
556 761
10 533
835 264
31.12.2000
1 444 343 1 229 088 1 315 449 1 452 315 1 242 882
231 762 153 771 189 422 284 546 135 974 101 487 354 670 506 674 135 521 23 816
8 801 720
944 305
9 746 025
908 737
10 654 762
155 475
16 514
60 607
676 141
0
908 737
- Result on financial operations: (item 6 of the profit and loss account)
The result comprises the following components (in EUR '000):
Net result on ALM swaps .... Net result on fair value hedg-ing operations ........... . Operational portfolio ...... .
Other financial operations ...
2001
-60 756
6 124 133
-54 499 6 760
-47 739
FINANCIAL REPORT - 2001 I page 30
2000
0
0 0
0 -3 887
-3 887
Note 0 - Geographical analysis of "Commission receivable" (item 4 of the profit and loss account): (in EUR '000)
31.12.2001 31.12.2000
France .................. . 0 9 Italy .................... . 2 s United Kingdom .......... . 59 54 Spain ................... . 0 0 Denmark ................ . 1 8 Greece .................. . 0 0 Ireland .................. . 20 27
82 103 Community institutions ..... . 22 506 18 824 Results not analysed (ElF) ... . 9 941 16 271
32 529 35 198
Note P- General administrative expenses (in EUR '000)
31.12.2001 31.12.2000
Salaries and allowances • 0 ••• 106 813 97 723 Welfare contributions and other social costs ........... 51 856 42 884
Staff costs ................ 158 669 140 607 General and administrative expenses ................. 52 869 44 804
211 538 185 411
The number of persons employed by the Group was 1 132 at 31 December 2001 (1 070 at 31 December 2000).
Note Q - Extraordinary income and charges
a) Extraordinary income
This item comprises:
At 31.12.2000:
o An amount corresponding to the sale of warrants received in conjunction with a loan restructuring operation.
o The difference arising on consolidation of EUR 15.5m between the book value of the EIB's participation and the portion of ElF own funds attributable to the Bank. This has been recorded as extraordinary income in the consolidated profit and loss account.
At 31.12.2001:
o An amount of EUR 40m corresponding to reversal of the ElF TENs' guarantee provision following the counterguarantee furnished by the Bank.
b) Extraordinary charges (in EUR '000)
Staff costs payable ........ . Provision for external mobility Special conversion rates .... . HIPC initiative ............ . Other ................... .
31.12.2001
0 7 500 3 864
0 0
11 364
Note R - Special deposits for service of borrowings
31.12.2000
6 939 0 0
60 000 489
67 428
This item represents the amount of coupons and bonds due, paid by the Bank to the paying agents, but not yet presented for payment by the holders of bonds issued by the Bank.
Note S - Estimated present value of financial instruments
The Group records balance sheet financial instruments on the basis of their historical cost in foreign currency (apart from the operational portfolio) representing the amount received in the case of a liability or the amount paid to acquire an asset. The present value of the financial instruments (mainly loans, treasury, securities and borrowings after long-term interest rate or currency swaps) entered under assets and liabilities compared with their accounting value is shown in the table below:

Assets Liabilities
(EUR million) net accounting present accounting present 31 December 2001 value value value value
-Loans 186 863 192 470 - -
- Investment portfolio 2 901 2 927 - -
-Liquid assets 10 282 10 974 - -
-Borrowings after swaps - - 174 794 180198
Total 200 046 206 371 174 794 180198
Note T - Risk management
The significant risks which have to be managed by the Group are:
* credit risk
* interest rate risk
* liquidity risk
* exchange risk.
Credit risk
Credit risk concerns mainly the Group's lending activity and, to a lesser extent, treasury instruments such as fixed-income securities held in the investment, hedging and operational portfolios, certificates of deposit
-within the European Union:
and interbank term deposits.
The credit risk associated with the use of derivatives is also analysed hereafter in the "Derivatives" section (Note U).
Management of credit risk is based, firstly, on the degree of credit risk vis-a-vis counterparties and, secondly, on an analysis of the solvency of counterparties.
As regards lending, treasury and derivatives operations, credit risk is managed by an independent Credit Risk Department under the direct responsibility of the Management Committee. The Group has thus established an operationally independent structure for determining and monitoring credit risk.
Loans
In order to limit the credit risk on its loan portfolio, the Group lends only to counterparties where it has been possible to demonstrate their creditworthiness over the longer term and who can offer guarantees deemed sufficiently sound.
In order efficiently to measure and manage credit risk on loans, the Group has graded its lending operations according to generally accepted criteria, based on the quality of the borrower, the guarantee and, where appropriate, the guarantor.
The structure of guarantees attaching to the portfolio of loans granted as at 31 December 2001 is analysed below (EUR million):
Guarantor
Member Public "Zone A" Without formal states institutions <n banks Corporates <•> guarantee <2> Total
Member States 13 509 13 509
Public institutions 19147 8 991 1 870 899 1 133 32 040
Borrower Zone "A" banks 13 716 27 063 9472 15 174 13 472 78 897
Corporates 8 682 914 21 247 28 957 6 695 66495
Total 2001 41 545 36 968 32 589 45 030 34 809 190 941
Total2000 37 873 32 672 30 528 41 168 30 857 173 098
(1) Loans secured by assignment of rights by category of final beneficiary.
(2) Loans for which no formal guarantee was required, the borrower's level of solvency itself representing adequate security. In the event of certain occurrences, appropriate contractual clauses ensure the Bank's right of access to independent security.
-outside the European Union:
2001 2000
Secured by:
Member States 1 881 1 843
Community budget 21 530 (*} 19 506 (*}
Pre-Accession Facility 6 765 4 471
Total 30 176 25 820
(*}of which 2 969 million in risk-sharing operations as explained below (2000: 2 387 million).
Loans outside the Community (apart from those under the PreAccession Facility) are, in the last resort, secured by guarantees of the
Community budget or the Member States (loans in the ACP Countries and the OCT). In all regions (South Africa, non-member Mediterranean Countries, Central and Eastern Europe, Asia and Latin America), apart from the ACP Countries and the OCT, in the case of loans secured by a sovereign guarantee, all risks are, in the last resort, covered by the Community budget.
The agreements decided by the Council of the European Union on 14 April 1997 (Decision 97/256/EC) introduced the concept of risk sharing whereby certain Bank loans are secured by third-party guarantees with respect to the commercial risk, the budgetary guarantee applying in the case of political risks solely arising from currency non-transfer, expropriation, war and civil disturbance. To date, finance contracts for EUR 2 966 million in risk-sharing loans have been signed under these agreements.
Loans granted under the Pre-Accession Facility (EUR 6765 million) are not secured by guarantees of the Community budget or the Member States.
page 31 I EIB GROUP FINANCIAL STATEMENTS

LOANS FOR PROJECTS OUTSIDE THE UNION
Breakdown of loans by guarantee as at 31 December 2001 (in EUR '000)
Convention/agreement Outstanding Outstanding Convention/agreement Outstanding Outstanding 31.12.01 31.12.00 31.12.01 31.12.00
Member States guarantee 70% Community budget guarantee ACP/OCT Group 8 924 17 361 South Africa - 375m - Decision 29.01.97 327 031 363 257 2nd Lome Convention ALA II- 900m 995 196 963 759 ACP/OCT Group 177 225 227 943 ALA interim (70% guarantee: risk sharing) 3rd Lome Convention -122m 135 063 136 196 ACP/OCT Group 867 832 968 061 Bosnia-Herzegovina - 1OOm 99/2001 100 122 60 000 4th Lome Convention Euromed (EIB)- 2 310m- Decision 29.01.97 2 385 402 2 421 834 ACP/OCT Group 826 818 629 489 FYROM - 150m - 1998/2000 150 000 130 000 4th Lome Convention/2nd Financial Protocol CEEC - 3 520m - Decision 29.01.97 3 360 841 3 425 935
Total Member States guarantee 1880 799 1842 854 Total: 70% Community budget guarantee 7 453 655 7 500 981
100% Community budget guarantee South Africa - 300m - 65% Community budget guarantee BG Decision 19.06.95 205 887 285 714 South Africa- 825m- 7/2000-7/2007 202 533 50 000 ALA 1- 750m 587 466 603 804 ALA Ill - 2/2000-7/2007 941 255 391 601 ALA interim (1 00% guarantee) - 153m 115 711 168 477 Euromed II- 2/2000-7/2007 1 905 885 700 574 CEEC- 1 bn - BG Decision 29.11.89 582 878 659 114 CEEC- 8 680m- 2/2000-7/2007 1 979 920 1 347 000 CEEC- 3bn - BG Decision 02.05.94 2 491 321 2 663 977 Turkey-TERRA-11/1999-11/2002 450 000 375 000 CEEC- 700m- BG Decision 18.04.91 329 195 366 338
Total: 65% Community budget Total: 100% Community budget guarantee 5 479 593 2 864 175 guarantee 4 312 458 4 747 424
Total: Community budget guarantee 21530 142 19 505 716 75% Community budget guarantee
Total: Pre-Accession Facility 6 764 930 4 471112 Mediterranean Protocols 3 903 857 3 964 057 Yugoslavia - Art. 18 (1984) 21 159 26 253 Grand total 30 175 871 25 819 682 Yugoslavia - 1st Protocol 34 555 48 360 Yugoslavia - 2nd Protocol 193 597 215 237 Slovenia - 1st Protocol 131 268 139 229
Total: 75% Community budget guarantee 4 284 436 4 393 136
A breakdown of disbursed loans outstanding (in EUR million) at 31 December 2001 according to the sectors in which borrowers are engaged is set out below:
Sector not more than
1 year
Energy 2 173
Transport 2 554
Telecommunications 1 915
Water, sewerage 1 255
Miscellaneous infrastructure 454
Agriculture, forestry, fisheries 24
Industry 1 636
Services 216
Global loans 3 935
Health, education 89
14 251
Treasury
The credit risk associated with treasury (the securities portfolio, commercial paper, term accounts, etc.) is rigorously managed through selecting first-class counterparties and issuers.
Limits governing the structure of the securities portfolio and outstanding treasury instruments have been laid down by Management, in particular on the basis of the ratings awarded to counterparties by the rating agencies (these limits are reviewed regularly by the Credit Risk Department).
The following table provides a percentage breakdown of the credit risk associated with the securities portfolio and treasury instruments in terms of the credit rating of counterparties and issuers:
FINANCIAL REPORT- 2001 I page 32
Maturity
1 year to 5 years more than 5 years
10 014 11 564
11 704 37 238
7 884 4 581
4 770 6 713
3 180 4 509
196 146
9 067 4429
1 433 769
19 835 30 727
529 3 324
68 612 104 000
% as at 31 December 2001
Moody's or equivalent rating
AAA
P1
AA1 to AA3
A1
Below A1
Non-rated
Total
TOTAL 2001 TOTAL 2000
23 751 22 217
51 496 47 423
14 380 14 204
12 738 13 000
8 143 7 561
366 325
15 132 12 742
2 418 1 684
54 497 47 301
3 942 2 413
186 863 168 869
Securities Treasury portfolio % instruments %
62 11
0 12
32 64
1 9
4 3
1 1
100 100

Interest rate risk
The Bank has established an organisational structure for the assetliability function, applying best practices in the financial industry, and, in particular, an Asset-Liability Management Committee (ALCO) under the direct responsibility of the Bank's Management Committee. Accordingly, it has decided on an asset-liability management strategy which involves maintaining an own funds duration of around 5 years, thereby safeguarding the Bank against substantial fluctuations in its long-term revenue.
Given a notional own funds portfolio in line with the above objective
Reindexation interval (EUR million):
not more than 3 months 6 months 3 months to 6 months to 1 year
Assets -
Loans (gross) 91 274 2 878 5 710
Net liquidity 9 033 458 1 086 --- --- ---100 307 3 336
Liabilities -
Borrowings and swaps 99 950 1 981
Interest rate risk 357 1 355
Liquidity risk
The table hereafter analyses assets and liabilities by maturity on the basis of the period remaining between the balance sheet date and the contractual maturity date.
Liquidity risk (EUR million)
6 796
4 313
2 483
of an own funds duration equal to around 5 years, an increase in interest rates of 0.01% on all currencies would result in a fall of EUR 1 227 000 in the differential between the net present value of the Bank's own funds and the net present value targeted by the ALM Strategy.
The following table illustrates the Group's exposure to interest rate risk. It presents the nominal amounts according to maturities affected by the incidence of interest rate changes, as regards the main balance sheet items subject to reindexation:
1 year to more than Total Total 5 years 5 years 31.12.2001 2000
40 000 47 001 186 863 168 869
1 355 1 251 13 183 13 459 --- --- --- ---
41 355 48 252 200 046 182 328
32 900 35 650 174 794 158 817
8 455 12 602
Assets and liabilities for which there is no contractual maturity date are classified under "Maturity undefined".
Maturity Not more More than 3 months More than 1 year More than Maturity Total than 3 months but not more than but not more than 5 years undefined
1 year 5 years
Assets
Cash in hand, central banks and post office banks 22 22
Treasury bills eligible for refinancing with central banks 20 288 630 582 1 520
Other loans and advances:
Current accounts 181 181
Others 9 918 9 918 --- --- ---10 099 10 099
Loans:
Credit institutions 1 740 4 502 31 582 46 831 84 655
Customers 1 684 6 325 36 862 56 214 101 085
lAS 39 adjustment 33 33 --- --- ---
3 424 10 827 68444 103 045 33 185 773
Debt securities including fixed-income securities 2 576 1 202 901 2 002 6 681
Currency swap contracts adjustment 35 388 881 -67 1 237
lAS 39 adjustment 6 948 6 948 --- --- ---
35 388 881 -67 6 948 8 185
Other assets 3 683 3 683
Tot a I assets 16 176 12 705 70 856 105 562 10 664 215 963
Liabilities
Amounts owed to credit institutions 598 4 6 608
Debts evidenced by certificates 7 461 15 544 83 779 72 367 179 151
lAS 39 adjustment 4 759 4 759 --- --- ---
7 461 15 544 83 779 72 367 4 759 183 910
Capital, reserves and profit 23 176 23 176
Other liabilities 8 269 8 269
Total liabilities 8 059 15 548 83 785 72 367 36 204 215 963
page 331 EIB GROUP FINANCIAL STATEMENTS

A securities portfolio, termed an "investment portfolio" (Note B), has also been created in order to ensure the Group's solvency and to contend with unforeseen liquidity needs. This securities portfolio consists of mainly fixed-income securities issued by first-class counterparties, largely bonds issued by Member States, with the intention of holding them until final maturity.
Exchange position (EUR million)
Currency euro
Assets
Cash in hand, central banks and post office banks 14
Treasury bills eligible for refinancing with central banks 1 520
Other loans and advances:
Current accounts 120
Others 6 574
6 694
Loans:
Credit institutions 48 615
Customers 61339
lAS 39 adjustment 33
109 987
Debt securities including fixed-income securities 4 558
Currency swap contracts adjustment -24 672
lAS 39 adjustment 6 948
- 17 724
Other assets 2 272
Total assets 107 321
Liabilities
Amounts owed to credit institutions 593
Debts evidenced by certificates:
Debt securities in issue 71977
Others 155
lAS 39 adjustment 4 759
76 891
Capital, reserves and profit 23 176
Other liabilities 6 678
Total liabilities 107 338
Off balance sheet 2
Net position as at 31.12.2001 -15
Net position as at 31.12.2000 -193
(1) of which GRD: 172 (euro-in currency as from 01.01.2001)
Note U - Derivatives
Derivatives are contractual financial instruments, the value of which fluctuates according to trends in the underlying assets, interest rates, exchange rates or indexes.
1. As part of funding activity
The Group uses derivatives mainly as part of its funding strategy in order to bring the characteristics, in terms of currencies and interest
FINANCIAL REPORT - 2001 I page 34
Exchange risk
The sources of exchange risk are to be found in the margins on operations and in general expenses incurred in non-euro currencies. The Group's objective is to eliminate exchange risk by reducing net positions per currency through operations on the international foreign exchange markets.
Pound United States Other Total Grand sterling dollar currencies excl. euro total
7 1 8 22
1 520
8 26 27 61 181
726 2 322 296 3344 9 918
734 2 348 323 3405 10 099
22 576 11 798 1 666 36 040 84 655
19 357 13 898 6 491 39 746 101 085
33
41 933 25 696 8 157 75 786 185 773
665 1 432 26 2 123 6 681
4 579 15 903 5 427 25 909 1 237
6 948
4 579 15 903 5 427 25 909 8185
903 321 187 1 411 3 683
48 821 45 700 14 121 108 642 215 963
12 3 15 608
47 758 45 146 13413 106 317 178 294
247 455 702 857
4 759
48 005 45 146 13 868 107 019 183 910
23176
812 538 241 1 591 8 269
48 817 45 696 14 112 108 625 215 963
-2
2 4 9
7 5 181 (I)
rates, of the funds raised into line with those of loans granted and also to reduce funding costs.
The derivatives most commonly used are:
* Currency swaps
* Interest rate swaps
* Deferred rate-setting (DRS) agreements.

Currency swaps
Currency swaps are contracts under which it is agreed to convert funds raised through borrowings into another currency and, simultaneously, a forward exchange contract is concluded to re-exchange the two currencies in the future in order to be able to repay the funds raised on the due dates.
Interest rate swaps
Interest rate swaps are contracts under which it is generally agreed to exchange floating-rate interest for fixed-rate interest or vice versa.
Deferred rate-setting (DRS) agreements
This derivative is similar to an interest rate swap contract (fixed rate/floating rate or vice versa). However, it is used more specifically by long-term financing institutions such as the EIB, which raises substantial amounts on the capital markets.
Interest rate or currency swaps allow the Group to modify the interest rates and currencies of its borrowing portfolio in order to accommodate requests from its clients and also make it possible to access certain capital markets by exchanging with counterparties their advantageous conditions of access to these markets, so reducing funding costs.
Long-term derivatives transactions are used only for fund-raising and for the reduction of market risk exposure but not for trading.
All interest rate and currency swaps linked with the borrowing portfolio have maturities identical to the borrowings concerned and are therefore long term.
Derivatives credit risk hedging policy
The credit risk with respect to derivatives lies in the loss which the Group would incur were a counterparty unable to honour its contractual obligations.
In view of the special nature and complexity of the derivatives transactions, a series of procedures was put in place to safeguard the Group against loss arising out of the use of this instrument.
Contractual framework:
All Group long-term derivatives transactions are concluded in the contractual framework of Master Swap Agreements and, where non-standard structures are covered, Credit Support Annexes, which specify the
Currency swaps (EUR million)
conditions of exposure collateralisation. These are generally accepted and practised contract types.
Counterparty selection:
Minimum rating A 1 at the outset, the Group having the right of early termination if the rating drops below a certain level.
Limits:
-total net market value of derivatives exposure with a counterparty;
- unsecured exposure to a counterparty;
-furthermore, specific concentration limits expressed as nominal amounts.
All limits are dynamically adapted to the credit quality of the counterparty.
Monitoring:
The derivatives portfolio is regularly valued and compared against limits.
Collateralisation:
- Derivatives exposure exceeding the limit for unsecured exposure is collateralised by cash and first-class bonds.
-Very complex and illiquid transactions require collateralisation over and above the present market value.
- Both the derivatives portfolio with individual counterparties and the collateral received are regularly valued, with a subsequent call for additional collateral or release.
The credit risk associated with derivatives varies according to a number of factors (such as interest and exchange rates) and generally corresponds to only a small portion of their notional value. In the Group's case, where only mutually agreed derivatives are negotiated, the credit risk is evaluated on the basis of the "current exposure" method recommended by the Bank for International Settlements (BIS). Hence, the credit risk is expressed in terms of the positive replacement value of the contracts, increased by the potential risks, contingent on the duration and type of transaction, weighted by a coefficient linked to the category of counterparty (BIS 2 weighted risk).
The following tables show the maturities of currency swaps and interest rate swaps plus DRS combined, sub-divided according to their notional amount and the associated credit risk:
less than 1 year to 5 years to more than Total Total 1 year 5 years 10 years 10 years 31.12.2001 2000
Notional amount 4 233 29 185 3 182 1 967 38 567 28 126
Net discounted value 516 1 695 13 58 2 282 1 732
Credit risk (BIS 2 weighted) 148 959 105 145 1 357 1 103
The notional amounts receivable or payable in respect of currency swaps are disclosed off balance sheet (see 2. below for short-term swaps).
Interest rate swaps and DRS (EUR million)
less than 1 year to 1 year 5 years
Notional amount 11 967 50 175
Net discounted value 366 1 739
Credit risk (BIS 2 weighted) 99 635
The Group does not generally enter into any options contracts in conjunction with its risk hedging policy. However, as part of its strategy of raising funds on the financial markets at least cost, the Bank enters
5 years to more than Total Total 10 years 10 years 31.12.2001 2000
21 119 26 607 109 868 97 548
617 2 095 4 817 2 974
343 655 1 732 1 380
into borrowing contracts encompassing notably interest rate or stock exchange index options. Such borrowings are covered by swap contracts to hedge the corresponding market risk.
page 351 EIB GROUP FINANCIAL STATEMENTS

Tabulated below are the number and notional amount of the various types of option attaching to borrowings:
Special Embedded Stock structure
option exchange coupon index or similar
Number of transactions 99 33 30
Notional amount (EUR million} 7 505 2 672 3 641
Net discounted value 126 167 277
All options contracts embedded in, or linked with, borrowings are negotiated by mutual agreement.
Generally, there is no credit risk on these options, except in some cases where they are based on a stock exchange index, but for which security exists in the form of regularly monitored collateral.
Ratings exposure table
All new transactions are concluded with counterparties rated at least A1. Consequently, most of the portfolio is concentrated on counterparties rated A 1 or above.
% Net market Credit risk Rating of nominal exposure & BIS2
Aaa 10.5 549 1 397
Aa1 to Aa3 83.5 1 014 7 464
A1 4.4 33 546
A2 to Baa3 0.9 14 108
Non-rated 0.7 0 154
Total 100 1 610 9 669
Table of hedging derivatives (in EUR million}
2. As part of liquidity management
The Group also enters into short-term currency swap contracts in order to adjust currency positions in its operational treasury in relation to its benchmark currency, the euro, and to cater for demand for currencies in conjunction with loan disbursements.
The notional amount of short-term currency swaps stood at EUR 2 025 million at 31 December 2001 as against EUR 981 million at 31 December 2000.
3./AS 39
o ALM derivatives
The Bank's policy aims to maintain a high and stable level of income as well as to safeguard the economic value of the Bank. Accordingly, the Bank:
- has adopted an own funds investment profile ensuring a stable and high flow of income,
- manages residual interest rate risks in relation to this investment profile.
With a view to managing residual interest rate risks, the Bank operates natural hedges in respect of loans and borrowings or concludes global hedging operations (interest rate swaps}.
Macro-hedging swaps used as part of asset/liability management are marked to market (fair value} in accordance with lAS 39.
Changes in "fair value" are entered in the profit and loss account.
o Hedging derivatives
The vast majority of the Bank's swaps are concluded with the aim of hedging bond issues. These derivatives as well as borrowings hedged are measured at fair value.
Description Fair Cost Risk being Hedging Positive Negative of hedged item value hedged instrument fair value fair value
Debts evidenced by certificates 183 909 179 168 Fair value Interest rate 4 741 and currency swaps
Loans and advances to customers 100 943 100 910 Fair value Interest rate swaps 33
Note V- Geographical breakdown of lending by country in which projects are located
Aggregate Countries and territories Number loans Undisbursed Disbursed % %fin. in which projects are located of loans granted portion portion of total year 2000
1. Loans for projects within the Union and related loans Germany 739 32 228 163 755 710 31 472 453 14.58% 13.71% France ...... 385 25 318 051 2 542 954 22 775 097 11.45% 11.18% Italy . . . . . . . 1 231 29 828 077 3 275 444 26 552 633 13.49% 14.04% United Kingdom 303 25 049 052 3 510 566 21 538 486 11.33% 12.17% Spain .... 443 27 346 806 2 452 300 24 894 505 12.37% 12.86% Belgium .. 88 4 128 141 394 841 3 733 300 1.87% 2.11% Netherlands 48 3 055 414 793 523 2 261 890 1.38% 1.49% Sweden 116 4 393 271 821 598 3 571 673 1.99% 1.90% Denmark 111 5 580 093 613 113 4 966 980 2.52% 2.41% Austria 105 3 569 121 0 3 569 121 1.61% 1.45% Finland . 53 2 859 620 331 035 2 528 584 1.29% 1.21% Greece 205 8 915 099 1 466 871 7 448 228 4.03% 3.77% Portugal 214 13 556 906 3 467 993 10 088 914 6.13% 6.22% Ireland 98 2 486 418 875 581 1 610 837 1.12% 1.19% Luxembourg 33 605 738 109 308 496 430 0.27% 0.30% Related loans (*} 22 2 020 569 200 000 1 820 569 0.91% 1.01%
Total 4194 190 940 539 21 610 837 169 329 700 86.35% 87.02%
(*)Loans authorised under the second paragraph of Article 18 (1) of the Statute for projects located outside the territory of Member States of the Union but offering benefits for the Union are considered as related to loans within the Union.
FINANCIAL REPORT- 2001 I page 36

Note V- Geographical breakdown of lending by country in which projects are located (continued)
Aggregate Countries and territories Number loans Undisbursed Disbursed % %fin. in which projects are located of loans granted portion portion of total year 2000
2. Loans for projects outside the Union 2.1. ACP Countries/OCT Namibia 10 161 461 45 225 116 236 Kenya .. 10 146 987 54 376 92 610 Jamaica 11 135 479 15 337 120 143 Mauritius 11 129 587 61 755 67 832 ACP Group 3 113 373 48 450 64 923 Zimbabwe 12 102 371 18 030 84 341 Trinidad and Tobago 5 91 638 499 91 139 Barbados 6 80 254 50 173 30 081 Ghana .... 5 78 980 22 629 56 351 Senegal 3 75 330 42 977 32 353 Mozambique 4 70 321 3 500 66 821 Botswana .. 8 66 065 0 66 065 Regional - Central Africa 1 53 713 44 636 9 077
Lesotho ...... 3 52 940 27 414 25 526 Mauritania ..... 3 51 612 30 000 21 612 Papua New Guinea 6 41 749 0 41 749 Bahamas .. 4 39 737 0 39 737 Cameroon 3 38 688 29 903 8 785 Cote-d' lvoi re 8 37 299 0 37 299 Nigeria ... 2 32 829 0 32 829 Dominican Republic 4 31 634 16 375 15 259 Regional -Africa 1 30 033 0 30 033 Gabon ....... 3 21 545 15 500 6 045 Regional - Caribbean 20 814 6 024 14 790 Regional -West Africa 19 849 8 350 11 499 Swaziland 2 17 500 7 500 10 000 Saint Lucia 4 17 414 5 000 12 414
Uganda 2 15 828 0 15 828
Guinea .. 2 10 391 0 10 391 Malawi .. 4 10 100 0 10100 Dominica 1 10 000 10 000 0 French Polynesia 3 9 715 3 000 6 715 British Virgin Islands 3 7 805 0 7 805 Cayman Islands ... 3 6 775 0 6 775 Saint Vincent and the Grenadines 2 5 342 0 5 342 Mali 0 ••••••••••••••• 5 093 0 5 093 OCT Group ............ 5 000 4 845 155 New Caledonia and Dependencies 2 4 992 0 4 992 Chad .. 4 982 4 415 567 Surinam 4 419 0 4 419 Grenada 3 993 0 3 993 Tonga 2 3 257 0 3 257 Falkland Islands 2 3 255 0 3 255 Netherlands Antilles 3 3 223 0 3 223 Aruba 3 2 828 2 000 828 Belize 2 826 0 2 826
Fiji .. 1 774 0 1 774
Sub-total 173 1 880 800 577 913 1 302 887 0.85% 0.93%
2.2. South Africa Sub-total 23 735 452 256 180 479 272 0.33% 0.35%
2.3. Euro-Mediterranean Partnership Countries and the Balkans Egypt .. 34 1 552 165 575 925 976 240 Morocco 35 1 509 609 739 500 770 109 Turkey 23 1 508 292 684 712 823 581 Algeria . 28 1 484 851 385 650 1 099 201 Tunisia 39 1 081 415 489 200 592 215 Lebanon 12 446 645 147 000 299 645 Jordan 28 409 844 103 000 306 844 Croatia . 10 215 748 146 000 69 748 Syria .. 3 210 725 190 000 20 725 Gaza-West Bank 10 197 509 106f'Z70 91 239 FYROM ..... 8 174 358 89 000 85 358
page 371 EIB GROUP FINANCIAL STATEMENTS

Note V- Geographical breakdown of lending by country in which projects are located (continued)
Aggregate Countries and territories Number loans Undisbursed Disbursed % %fin. in which projects are located of loans granted portion portion of total year 2000
Bosnia-Herzegovina .... 3 160 123 156 350 3 773
Albania .......... 6 131 092 91 349 39 743
Federal Republic of Yugoslavia 11 122 360 66 000 56 360
Israel ............. 3 44 758 0 44 758
Sub-total 253 9 249 494 3 969 956 5 279 539 4.18% 3.64%
2.4. Accession Countries Poland ..... 58 4 655 602 2 253 603 2 402 000
Czech Republic 28 2 513 895 940 800 1 573 095
Romania .... 33 2 227 071 1 315 330 911 741
Hungary .... 42 1 838 956 642 700 1 196 256
Slovak Republic 24 1 136 039 194 991 941 049
Slovenia 24 1 063 270 512 585 550 685
Bulgaria 22 918 140 632 000 286 140
Cyprus 17 486 525 265 194 221 331
Lithuania 17 294 838 121 442 173 397
Latvia 11 201 740 107 987 93 753
Estonia 13 161 554 65 415 96 139
Malta 4 37 806 25 000 12 806
Sub-total 293 15 535 436 7 077 047 8 458 392 7.03% 6.92%
2.5. Asian and Latin American Countries Brazil ... 16 763 403 68 912 694 491
Argentina 10 496 013 92 136 403 876
Philippines 7 281 549 88 725 192 824
Indonesia 5 253 143 207 279 45 865
Thailand 4 175 129 35 650 139 479
China .. 3 151 558 56 167 95 391
Panama 2 111 974 18 438 93 536
Peru .. 2 99 913 0 99 913
Mexico 3 96 445 36 307 60 138
Vietnam 55 000 55 000 0
India .. 54 489 27 096 27 393
Costa Rica 48 818 0 48 818
Pakistan 2 44 902 34 035 10 867
Regional -Andean Pact 42 166 0 42 166
Bangladesh ...... 36 202 36 202 0
Regional - Central America 35 034 5 333 29 701
Chile .. 16 500 0 16 500
Uruguay .......... 12 451 0 12 451
Sub-total 62 2 774 689 761 280 2 013 409 1.25% 1.14%
Total 804 30 175 871 12 642 376 17 533 499 13.65% * 12.98%
Grand total 4 998 221 116 410 ** 34 253 213 186 863 199 100.00% 100.00%
(*) 10.6% excluding Pre-Accession Facility. (**) including securitised loans (Note B).
FINANCIAL REPORT- 2001 I page 38

Note W - lAS 14 - Segment reporting • secondary determining factor: lending in terms of geographical spread.
In accordance with the determining factors set out in revised lAS 14, the Group considers that lending constitutes its main business segment; its organisation and entire management systems are given over to developing and providing loans for its customers.
Information to be disclosed under the heading of geographical segment reporting is given in the following notes:
Consequently, pursuant to the above standard, the determining factors for segment reporting are:
• interest receivable and similar income by geographical area (Note N);
• lending by country in which projects are located (Note V);
• primary determining factor: lending as the main business segment; • tangible and intangible assets by country of location (Note F).
Note X- Conversion rates
The following conversion rates were used for drawing up the balance sheets at 31 December 2001 and at 31 December 2000:
1 euro =
EUR0-12: Rates fixed irrevocably
Deutsche Mark French francs Italian lire Spanish pesetas Belgian francs Netherlands guilders Austrian Schillings Finnish markka Drachmas Irish pounds Luxembourg francs Portuguese escudos
PRE-IN:
Pounds sterling Danish kroner Swedish kronor
NON-COMMUNITY CURRENCIES:
United States dollars Swiss francs Lebanese pounds Japanese yen Canadian dollars Australian dollars CFA francs Czech koruny Hong Kong dollars New Zealand dollars South African rand
31.12.2001
0.608500 7.43650 9.30120
0.881300 1.48290
1359.01 115.330
1.40770 1.72800
655.957 31.9620
6.87230 2.12150
10.4302
1.95583 6.55957
1936.27 166.386 40.3399
2.20371 13.7603
5.94573 340.750
0.787564 40.3399
200.482
31.12.2000
0.624100 7.46310 8.83130
0.930500 1.52320
1351.02 106.9200
1.39650 1.67700
655.957 35.0470
7.25780 2.11200 7.03920
page 391 EIB GROUP FINANCIAL STATEMENTS

Results for the Year
Profit for the 2001 financial year came to 1 279 million compared with 1 308 million in 2000,
representing a fall of 2.2%. Before transfers to provisions and extraordinary profit (after
deduction of minority interests), the operating surplus worked out at 1 415 million in 2001,
or 0.2% higher than the 2000 figure of 1 412 million.
This increase is attributable mainly to the growth of the EIB Group's balance sheet. On the
interest rate front, movements were modest with the average rate on loans falling from
6.06% in 2000 to 5.64% in 2001 and the average rate on borrowings down over the same
period from 5.86% to 5.34%.
Receipts of interest and commission on loans in 2001 totalled 9 921 million as against
9 746 million in 2000, while interest and commission on borrowings amounted to 8 995 mil
lion (8 857 million in 2000).
Overall, treasury operations yielded net income of 690 million in 2001, or 28 million below
the 2000 figure of 718 million, producing an average overall return of 4.83% in 2001 com
pared with 5.57% in 2000.
The decline in interest income from treasury operations in 2001 stemmed chiefly from the
lower return on operational portfolios, down by 30 million on 2000. This dip was due to
falling short-term interest rates but remained limited by the impact of increased holdings.
General administrative expenses together with depreciation of tangible and intangible assets
amounted to 205 million in 2001, or 8.5% more than in 2000 (189 million).
EIB GROUP RESULTS FOR THE YEAR I page 40

Report of the Auditor
The Chairman of the Audit Committee
EUROPEAN INVESTMENT BANK
Luxembourg
We have audited the consolidated financial statements, as identified below, of the European
Investment Bank for the year ended 31 December 2001. These consolidated financial state
ments are the responsibility of the management of the European Investment Bank. Our respon
sibility is to express an opinion on these consolidated financial statements based on our audit.
We conducted our audit in accordance with International Standards on Auditing. Those stan
dards require that we plan and perform the audit to obtain reasonable assurance about
whether the consolidated financial statements are free of material misstatement. An audit
includes examining, on a test basis, evidence supporting the amounts and disclosures in the
consolidated financial statements. An audit also includes assessing the accounting principles
used and significant estimates made by management, as well as evaluating the overall finan
cial statements presentation. We believe that our audit provides a reasonable basis for our
opinion.
In our opinion, the consolidated financial statements identified below give, in accordance with
International Accounting Standards and with the general principles of the Directives of the
European Union on the annual accounts and consolidated accounts of banks and other finan
cial institutions except as explained in the relevant notes on accounting policies, a true and fair
view of the financial position of the European Investment Bank as at 31 December 2001 and of
the results of its operations and its cash flows for the year then ended.
The consolidated financial statements on which our opinion is expressed comprise:
• Consolidated balance sheet
• Statement of Special Section
• Consolidated profit and loss account
• Statement of movements in consolidated own funds
• Consolidated cash flow statement
• Notes to the consolidated financial statements.
Luxembourg, 26 February 2002
ERNST & YOUNG Societe Anonyme
Kenneth A. HAY
page 411 REPORT OF THE AUDITOR

The Audit Committee
The Audit Committee reports to the Board of Governors, the following statement being com
municated to the Governors prior to their approval of the Annual Report and the consoli
dated financial statements for the past financial year.
Statement by the Audit Committee
The Committee, instituted in pursuance of Article 14 of the Statute and Article 25 of the
Rules of Procedure of the European Investment Bank for the purpose of verifying that the
operations of the Bank are conducted and its books kept in a proper manner, having
- designated Ernst & Young as external auditors, reviewed their audit planning process,
examined and discussed their reports and noted that their opinion on the consolidated
financial statements is unqualified,
- convened on a regular basis with the heads of Directorates and relevant services, met regu
larly the Head of Internal Audit and discussed the relevant internal audit reports, and stud
ied the documents which it deemed necessary to examine in the discharge of its duties,
- received assurance from the Management Committee concerning the effectiveness of the
internal control structure and internal administration,
and considering
- the consolidated financial statements for the financial year ending on 31 December 2001
as drawn up by the Board of Directors at its meeting on 26 February 2002,
- that the foregoing provides a reasonable basis for its statement and,
- Articles 22, 23 & 24 of the Rules of Procedure,
to the best of its knowledge and judgement:
confirms that the consolidated financial statements, comprising the consolidated balance
sheet, the statement of special section, the consolidated profit and loss account, the consol
idated own funds, the consolidated cash-flow statement and the notes to the consolidated
financial statements give a true and fair view of the financial position of the Bank as at
31 December 2001 and of the results of its operations and cash flows for the year then ended.
Luxembourg, 19 March 2002
The Audit Committee
E. MARIA
AUDIT COMMITTEE I page 42
'+. C'-;...l 1
M. COLAS

EIB Financial Statements
page 431

BALANCE SHEET AS AT 31 DECEMBER 2001
ASSETS
1. Cash in hand, balances with central banks and post office banks ....................................... .
2. Treasury bills eligible for refinancing with central banks (Note B) ..................................... .
3. loans and advances to credit institutions a) repayable on demand ........................ . b) other loans and advances (Note C) .............. . c) loans (Note D) .............................. .
4. loans and advances to customers Loans (Note D) ................................ . Specific provisions (Note A.4) ..................... .
5. Debt securities including fixed-income securities (Note B) a) issued by public bodies ....................... . b) issued by other borrowers ..................... .
6. Shares and other variable-yield securities (Note E) .... .
7. Participating interests (Note E) ................... .
8. Intangible assets (Note F) ....................... .
9. Tangible assets (Note F) ......................... .
10. Other assets a) receivable in respect of EMS interest
subsidies paid in advance (Note G) .............. . b) sundry debtors (Note H) ...................... . c) currency swap contracts adjustment account*
11. Prepayments and accrued income (Note I) .......... .
In EUR '000
142 213 9 907 933
84 654 699
101 085 284 -175 000
3 099 397 3 222 928
3 528 586 790
1 236 663
31.12.2001
22180
1377 061
94 704 845
100 910 284
6 322 325
788 992
269 942
7 687
79460
1826 981
3 066 660
209 376 417
OFF-BALANCE-SHEET ITEMS
Commitments - EBRD capital (Note E) . Uncalled ....................................... . . To be paid in .................................... .
- ElF capital (Note E) . Uncalled ....................................... . - Undisbursed loans (Note D) . Credit institutions ................................ . . Customers ...................................... .
- Undisbursed venture capital operations .............. .
Guarantees (Note D) . In respect of loans granted by third parties ............ . . In respect of venture capital operations .............. .
ElF treasury management .......................... .
Guarantee Fund treasury management ................ .
(*) The amount of currency swap contracts has not been included in the balance sheet.
8 523 766 25 729 446
Figures as at 31 December 2000 have consequently been recast for the purposes of comparison.
The bracketed notes refer to the notes to the financial statements
FINANCIAL REPORT- 2001 I page 44
31.12.2001
442 500 33 750
972 000
34 253 212
1 015 800
484 936 57 946
525 051
1775 229
130 668 11235552 75 647 232
93 101 379 -175 000
1 374 787 2 075 684
7 635 899 491
1 003 224
7 741 032 22 308 598
31.12.2000
24 726
1 410 978
87 013 452
92 926 379
3 450 471
605 934
269 942
9 863
78 327
1910350
3 430 962
191 131 386
31.12.2000
442 500 42 188
972 000
30 049 630
549 952
223 187 57 946
485 700
1 432 249

LIABILITIES
1. Amounts owed to credit institutions (Note J) a) repayable on demand ........................ . b) with agreed maturity dates or periods of notice ... .
2. Debts evidenced by certificates (Note K) a) debt securities in issue ........................ . b) others ..................................... .
3. Other liabilities a) interest subsidies received in advance (Note G) b) sundry creditors (Note H) ...................... . c) sundry liabilities ............................. .
4. Accruals and deferred income (Note I)
5. Provisions for liabilities and charges Staff pension fund (Note L) ...................... .
6. Fund for general banking risks (Note M) ........... .
7. Capital subscribed ................................... . uncalled ..................................... .
8. Reserves a) reserve fund ................................ . b) additional reserves ........................... .
9. Funds allocated to structured finance facility ........ .
10. Funds allocated to venture capital operations ....... .
11. Profit for the financial year ...................... .
0 607 622
178 293 413 857 103
324 956 989 394
42 230
100 000 000 -94 000 000
10 000 000 3 154 706
31.12.2001
607622
179 150 516
1356 580
4490 597
474 951
1080 000
6 000 000
13154 706
250000
1500 000
1311445
209 376 417
0 507 889
161 488 067 825 137
334 562 896 320
37 482
100 000 000 -94 000 000
10 000 000 2 124 244
31.12.2000
507 889
162 313 203
1 268 364
4 768 943
433 281
935 000
6 000 000
12 124 244
1 500 000
1 280 462
191 131 386
OFF-BALANCE-SHEET ITEMS
Special deposits for service of borrowings (Note R)
Securities portfolio . Securities receivable .............................. . . Securities payable ................................ .
Nominal value of interest-rate swap and deferred rate-setting contracts (Note U)
FRA operations . Purchase ....................................... . . Sale ........................................... .
Nominal value of currency swap contracts payable •......
Nominal value of currency swap contracts receivable
Borrowings arranged but not yet signed .............. .
31.12.2001
640526
9327 12 673
109 868 600
25 000 000 25 000 000
39 356131
40592 794
0
31.12.2000
778 552
0 0
97 548 200
0 0
28 064 569
29 067 793
921 327
page 451 EIB FINANCIAL STATEMENTS

STATEMENT OF SPECIAL SECTIQN(1l AS AT 31 DECEMBER 2001 In EUR '000
(amounts in foreign currency converted at exchange rates prevailing on 31 December 2001)
ASSETS
Member States From resources of the European Community (New Community Instrument for borrowing and
lending)
Disbursed loans outstanding <2> ••••••••••••••••••••••••••••••••••••••••••••••••••
Turkey From resources of Member States
Disbursed loans outstanding <3> •••••••••••••••••••••••••••••••••••••....•••••••••
Mediterranean Countries
From resources of the European Community
Disbursed loans outstanding ................................................... .
Risk capital operations
- amounts to be disbursed ..................................................... . - amounts disbursed ......................................................... .
African, Caribbean and Pacific States and Overseas Countries and Territories
From resources of the European Community
Yaounde Conventions
Total <•>
Loans disbursed ............................................................. .
Contributions to the formation of risk capital
Amounts disbursed
Total <s>
Lome Conventions Operations from risk capital resources:
- amounts to be disbursed ..................................................... .
- amounts disbursed ......................................................... .
Operations from other resources:
- amounts to be disbursed ..................................................... .
Total <6>
Grand total
For information:
31.12.2001
80 959
58 953
211 121
96 582 192 572
289 154
500 275
44 810
419
4S 229
666 171
1 198 479
1 864 650
8 000
1 872 650
2 558 066
31.12.2000
106 191
72 041
220 434
129 842
157 381
287 223
507 657
46 364
419
46 783
503 993
1 141 646
1 645 639
8 000
1 653 639
2 386 311
Total amounts disbursed and not yet repaid on loans on special conditions made available by the Commission in respect of which the Bank has accepted an EC mandate for recovering principal and interest: a) Under the First, Second and Third Lome Conventions: at 31.12.2001: 1 402 697; at 31.12.2000: 1 447 378 b) Under Financial Protocols signed with the Mediterranean Countries: at 31.12.2001: 158 245; at 31.12.2000: 164 050
(1) The Special Section was set up by the Board of Governors on 27 May 1963: under a Decision taken on 4 August 1977 its purpose was redefined as being that of recording operations carried out by the European Investment Bank for the account of and under mandate from third parties.
(2) Initial amount of contracts signed under Council Decisions 78/870/EEC of 16 October 1978 (New Community Instrument), 82/169/EEC of 15 March 1982, 83/200/EEC of 19 April 1983 and 87/182/EEC of 9 March 1987 for promoting investment within the Community, as well as 81/19/EEC of 20 January 1981 for reconstructing areas of Campania and Basilicata (Italy) stricken by an earthquake on 23 November 1980 and 81/1013/EEC of 14 December 1981 for reconstructing areas stricken by earthquakes in Greece in February and March 1981, under mandate, for the account and at the risk of the European Community: 6 399 145 add: exchange adjustments + 127 897 less: cancellations 201 991
repayments 6 244 092 - 6 446 083
80 959
FINANCIAL REPORT- 2001 I page 46
(3) Initial amount of contracts signed for financing projects in Turkey under mandate, for the account and at the risk of Member States:
add: less:
exchange adjustments cancellations repayments
215 371 686
405 899 + 24 955
- 371 901
58 953
(4) Initial amount of contracts signed for financing projects in the Maghreb and Mashreq countries, Malta, Cyprus, Turkey and Greece (EUR 10 million lent prior to accession to EC on 1 January 1981) under mandate, for the account and at the risk of the European Community: 635 007 add: exchange adjustments + 3 less: cancellations 30 867
repayments 103 868 - 134 735
500 275

LIABILITIES 31.12.2001 31.12.2000
Funds under trust management Under mandate from the European Communities - New Community Instrument ................................................. . 80 959 106 191 - Financial Protocols with the Mediterranean Countries ............................. . 403 693 377 815
- Yaounde Conventions ....................................................... . 45 229 46 783 - Lome Conventions .......................................................... . 1 198 479 1 141 646
1 728 360 1 672 435
Under mandate from Member States 58 953 72 041
Total 1 787 313 1 744 476
Funds to be disbursed On loans and risk capital operations in the Mediterranean countries ................... . 96 582 129 842 On operations from risk capital resources under the Lome Conventions ................. . 666 171 503 993 On operations from other resources under the Lome Conventions ..................... . 8 000 8 000
Total 770 753 641 835
Grand total 2 558 066 2 386 311
(5) Initial amount of contracts signed for financing projects in the Associated African States, Madagascar and Mauritius and the Overseas Countries, Territories and Departments (AASMM-OCTD) under mandate, for the account and at the risk of the European Community:
(6) Initial amount of contracts signed for financing projects in the African, Caribbean and Pacific States and the Overseas Countries and Territories (ACP-OCT) under mandate, for the account and at the risk of the European Community:
- loans on special conditions 139 483 Loans from risk capital resources: - contributions to the formation -conditional and subordinated loans 2 711 347
of risk capital 2 503 141 986 -equity participations 117 634 2 828 981
add: add: - capitalised interest 1 178 - capitalised interest + 1 663 - exchange adjustments 9 839 + 11 017
less: less: - cancellations 347 411 - cancellations 1 574 - repayments 601 882 - repayments 106 200 -107 774 - exchange adjustments 16 701 -965 994
45 229 1 864 650 Loans from other resources: 8 000
1 872 650
page 471 EIB FINANCIAL STATEMENTS

PROFIT AND LOSS ACCOUNT FOR THE YEAR ENDED 31 DECEMBER 2001
In EUR '000
1. Interest receivable and similar income (Note N)
2. Interest payable and similar charges ......................... .
3. Income from participating interests ......•....•............•..
4. Commission receivable (Note 0) ............................ .
5. Commission payable ...................................... .
6. Result on financial operations .............................. .
7. Other operating income ................................... .
8. General administrative expenses (Note P): .................... . a) staff costs ............................................ . 152 903 b) other administrative costs ................................ . 50 861
9. Value adjustments in respect of (Note F): ..................... . a) intangible assets ....................................... . 4 872 b) tangible assets ........................................ . 10 487
10. Value adjustment on venture capital operations (Note E) ......... .
11. Extraordinary income (Note Q) .............................. .
12. Transfer to Fund for general banking risks (Note M) ............. .
13. Extraordinary charges (Note Q)
14. Profit for the financial year ................................ .
FINANCIAL REPORT- 2001 I page 48
31.12.2001 31.12.2000
10 729 506 10 644 426
-9 072 365 -9 086 590
7 333 4 800
22 841 18 927
-8110 -6 588
6 903 -5 082
20 037 16 220
-203 764 - 181 057 137 435 43 622
-15 359 - 11 865 2 760 9 105
-19 213 0
0 19 699
-145 000 -65 000
-11 364 -67 428
1 311 445 1 280 462

OWN FUNDS AND APPROPRIATION OF PROFIT
On 5 June 2001 the Board of Governors decided to appropriate the balance of the profit and loss account for the year ended 31 December 2000, which, after transfer of EUR 65 000 000 to the Fund for general banking risks, amounted to EUR 1 280 461 896, as follows:
• an amount of EUR 250 000 000 for addition to the funds allocated to the Structured Finance Facility;
Own funds at 31 December 2001 (EUR '000)
Capital -subscribed - uncalled
Reserves - Reserve Fund -Additional Reserves
Fund for general banking risks (Note M)
Funds allocated to venture capital operations
Funds allocated to Structured Finance Facility
Profit to be appropriated
Profit for the financial year
• the balance, i.e. EUR 1 030 461 896, for appropriation to the Additional Reserves.
Appropriation Transfer Situation at of profit for the for the 2001 Situation at 31.12.2000 2000 financial year financial year 31.12.2001
100 000 000 100 000 000 -94 000 000 -94 000 000
6 000 000 6 000 000
10 000 000 10 000 000 2 124 244 + 1 030 462 3 154 706
12 124 244 13 154 706
935 000 145 000 1 080 000
1 500 000 1 500 000
+ 250 000 250 000
1 280 462 -1 280 462 0
21 839 706 145 000 21 984 706
1311445
23296151
STATEMENT OF SUBSCRIPTIONS TO THE CAPITAL OF THE BANK AS AT 31 DECEMBER 2001 In EUR
Subscribed Uncalled Paid-in Member States capital capital 1•1 capital
Germany 17 766 355 000 16 699 382 842 1 066 972 158
France 17 766 355 000 16 699 382 842 1 066 972 158
Italy 17 766 355 000 16 699 382 842 1 066 972 158
United Kingdom 17 766 355 000 16 699 382 842 1 066 972 158
Spain 6 530 656 000 6 140 003 092 390 652 908
Belgium 4 924 710 000 4 630 122 198 294 587 802
Netherlands 4 924 710 000 4 630 122 198 294 587 802
Sweden 3 267 057 000 3 071 033 586 196 023 414
Denmark 2 493 522 000 2 344 363 695 149 158 305
Austria 2 444 649 000 2 297 970 078 146 678 922
Finland 1 404 544 000 1 320 271 348 84 272 652
Greece 1 335 817 000 1 255 909 988 79907012
Portugal 860 858 000 809 362 903 51 495 097
Ireland 623 380 000 586 090 514 37 289 486
Luxembourg 124 677 000 117 219 032 7 457 968
1 00 000 000 000 94 000 000 000 6 000 000 000
(*)Could be called by decision of the Board of Directors to such extent as may be required for the Bank to meet its obligations towards those who have made loans to it.
page 491 EIB FINANCIAL STATEMENTS

CASH FLOW STATEMENT AS AT 31 DECEMBER 2001 In EUR '000
A. Cash flows from operating activities:
Profit for the financial year ...... .
Adjustments:
Transfer to Fund for general banking risks
Value adjustments ............ .
Exchange adjustment not subject to Article 7
Decrease in accrued interest and commissions payable and interest received in advance
(Decrease)/lncrease in accrued interest and commissions receivable
Investment portfolio amortisation
Profit on operating activities:
Net loan disbursements
Repayments . . . . . . . . . . Net balance on NCI operations (Note H)
Increase in treasury portfolios ....
Increase in venture capital operations
Increase in securitised loans .....
B. Cash flows from investing activities:
EBRD shares paid up (Note E)
Sales of securities ........... .
Purchases of securities ........ .
Increases in land, buildings and furniture (Note F)
Increases in intangible fixed assets
Other (decreases)/increases in assets
Purchase of ElF shares
C. Cash flows from financing activities:
Issue of borrowings .......... .
Redemption of borrowings ..... . lncrease/(decrease) in currency swaps receivable
Net increase in commercial paper ....... .
Net cash from operating activities
Net cash from investing activities
Net increases in amounts owed to credit institutions
Other increases in liabilities
Hedging portfolio sales
Hedging portfolio purchases
Net cash from financing activities
Summary statement of cash flows
Cash and cash equivalents at beginning of financial year
Net cash from:
(1) operating activities
(2) investing activities (3) financing activities
Effects of exchange rate changes on cash and cash equivalents
Cash and cash equivalents at end of financial year
Cash analysis (excluding investment and hedging portfolios)
Cash in hand, balances with central banks and post office banks
Bills maturing within three months of issue .......... .
Loans and advances to credit institutions:
- accounts repayable on demand
-term deposit accounts
FINANCIAL REPORT- 2001 I page 50
31.12.2001
1 311 445
145 000 15 359
905 -278 346
364 302 -4 597
1 554 068
-30 485 314 15 772 177
16 298 - 1 483 626
- 173 846 - 1 003 287
- 15 803 530
-8 437 281 949
-290 489 - 11 620 -2 696 73 015
0
41 722
32 531 378 -19 000 043
-233 439 670 303
99 733 129 886
0 0
14 197 818
13 242 058
- 15 803 530 41 722
14 197 818
583 257
12 261 325
22 180 2 188 999
142 213 9 907 933
12 261 325
31.12.2000
1 280 462
65 000 11 865
1 049 - 149 364 -130 466
-5 225
1 073 321
-29 714 485 15 590 952
33 859 -81 683
-257 551 -120000
-13 475 587
-8 438 337 126
-330 843 -6 519 -5 428
-306 420 -109 942
-430 464
28 770 713 -17 102 100
516 441 589 973 171 263 466 604
1 293 081 -27 216
14 678 759
12 200 160
-13 475 587 -430 464
14 678 759
269 190
13 242 058
24 726 1 851 112
130 668 11 235 552
13 242 058
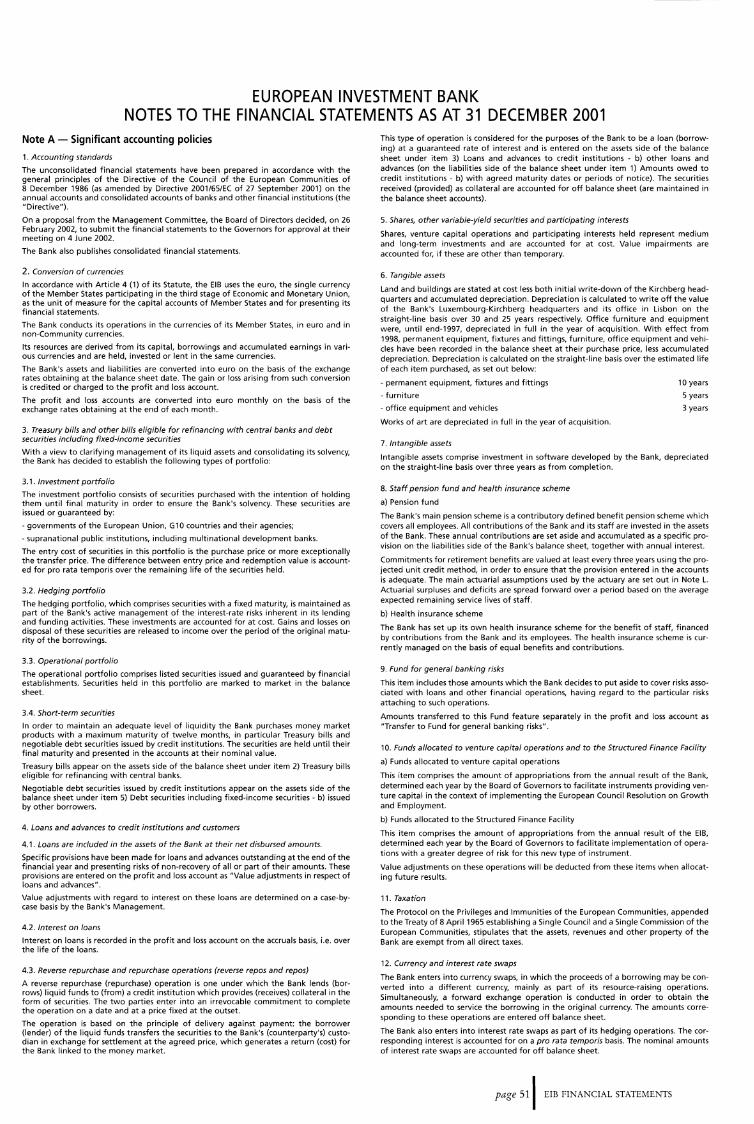
EUROPEAN INVESTMENT BANK NOTES TO THE FINANCIAL STATEMENTS AS AT 31 DECEMBER 2001
Note A - Significant accounting policies
1. Accounting standards
The unconsolidated financial statements have been prepared in accordance with the general principles of the Directive of the Council of the European Communities of 8 December 1986 (as amended by Directive 2001/65/EC of 27 September 2001) on the annual accounts and consolidated accounts of banks and other financial institutions (the "Directive").
On a proposal from the Management Committee, the Board of Directors decided, on 26 February 2002, to submit the financial statements to the Governors for approval at their meeting on 4 June 2002.
The Bank also publishes consolidated financial statements.
2. Conversion of currencies
In accordance with Article 4 (1) of its Statute, the EIB uses the euro, the single currency of the Member States participating in the third stage of Economic and Monetary Union, as the unit of measure for the capital accounts of Member States and for presenting its financial statements.
The Bank conducts its operations in the currencies of its Member States, in euro and in non-Community currencies.
Its resources are derived from its capital, borrowings and accumulated earnings in various currencies and are held, invested or lent in the same currencies.
The Bank's assets and liabilities are converted into euro on the basis of the exchange rates obtaining at the balance sheet date. The gain or loss arising from such conversion is credited or charged to the profit and loss account.
The profit and loss accounts are converted into euro monthly on the basis of the exchange rates obtaining at the end of each month.
3. Treasury bills and other bills eligible for refinancing with central banks and debt securities including fixed-income securities
With a view to clarifying management of its liquid assets and consolidating its solvency, the Bank has decided to establish the following types of portfolio:
3.1. Investment portfolio
The investment portfolio consists of securities purchased with the intention of holding them until final maturity in order to ensure the Bank's solvency. These securities are issued or guaranteed by:
-governments of the European Union, G10 countries and their agencies;
-supranational public institutions, including multinational development banks.
The entry cost of securities in this portfolio is the purchase price or more exceptionally the transfer price. The difference between entry price and redemption value is accounted for pro rata temporis over the remaining life of the securities held.
3.2. Hedging portfolio
The hedging portfolio, which comprises securities with a fixed maturity, is maintained as part of the Bank's active management of the interest-rate risks inherent in its lending and funding activities. These investments are accounted for at cost. Gains and losses on disposal of these securities are released to income over the period of the original maturity of the borrowings.
3.3. Operational portfolio
The operational portfolio comprises listed securities issued and guaranteed by financial establishments. Securities held in this portfolio are marked to market in the balance sheet.
3.4. Short-term securities
In order to maintain an adequate level of liquidity the Bank purchases money market products with a maximum maturity of twelve months, in particular Treasury bills and negotiable debt securities issued by credit institutions. The securities are held until their final maturity and presented in the accounts at their nominal value.
Treasury bills appear on the assets side of the balance sheet under item 2) Treasury bills eligible for refinancing with central banks.
Negotiable debt securities issued by credit institutions appear on the assets side of the balance sheet under item 5) Debt securities including fixed-income securities - b) issued by other borrowers.
4. Loans and advances to credit institutions and customers
4.1. Loans are included in the assets of the Bank at their net disbursed amounts.
Specific provisions have been made for loans and advances outstanding at the end of the financial year and presenting risks of non-recovery of all or part of their amounts. These provisions are entered on the profit and loss account as "Value adjustments in respect of loans and advances".
Value adjustments with regard to interest on these loans are determined on a case-bycase basis by the Bank's Management.
4.2. Interest on loans
Interest on loans is recorded in the profit and loss account on the accruals basis, i.e. over the life of the loans.
4.3. Reverse repurchase and repurchase operations (reverse repos and repos)
A reverse repurchase (repurchase) operation is one under which the Bank lends (borrows) liquid funds to (from) a credit institution which provides (receives) collateral in the form of securities. The two parties enter into an irrevocable commitment to complete the operation on a date and at a price fixed at the outset.
The operation is based on the principle of delivery against payment: the borrower (lender) of the liquid funds transfers the securities to the Bank's (counterparty's) custodian in exchange for settlement at the agreed price, which generates a return (cost) for the Bank linked to the money market.
This type of operation is considered for the purposes of the Bank to be a loan (borrowing) at a guaranteed rate of interest and is entered on the assets side of the balance sheet under item 3) Loans and advances to credit institutions - b) other loans and advances (on the liabilities side of the balance sheet under item 1) Amounts owed to credit institutions - b) with agreed maturity dates or periods of notice). The securities received (provided) as collateral are accounted for off balance sheet (are maintained in the balance sheet accounts).
5. Shares, other variable-yield securities and participating interests
Shares, venture capital operations and participating interests held represent medium and long-term investments and are accounted for at cost. Value impairments are accounted for, if these are other than temporary.
6. Tangible assets
Land and buildings are stated at cost less both initial write-down of the Kirchberg headquarters and accumulated depreciation. Depreciation is calculated to write off the value of the Bank's Luxembourg-Kirchberg headquarters and its office in Lisbon on the straight-line basis over 30 and 25 years respectively. Office furniture and equipment were, until end-1997, depreciated in full in the year of acquisition. With effect from 1998, permanent equipment, fixtures and fittings, furniture, office equipment and vehicles have been recorded in the balance sheet at their purchase price, less accumulated depreciation. Depreciation is calculated on the straight-line basis over the estimated life of each item purchased, as set out below:
- permanent equipment, fixtures and fittings
-furniture
-office equipment and vehicles
Works of art are depreciated in full in the year of acquisition.
7. Intangible assets
10 years
5 years
3 years
Intangible assets comprise investment in software developed by the Bank, depreciated on the straight-line basis over three years as from completion.
8. Staff pension fund and health insurance scheme
a) Pension fund
The Bank's main pension scheme is a contributory defined benefit pension scheme which covers all employees. All contributions of the Bank and its staff are invested in the assets of the Bank. These annual contributions are set aside and accumulated as a specific provision on the liabilities side of the Bank's balance sheet, together with annual interest.
Commitments for retirement benefits are valued at least every three years using the projected unit credit method, in order to ensure that the provision entered in the accounts is adequate. The main actuarial assumptions used by the actuary are set out in Note L. Actuarial surpluses and deficits are spread forward over a period based on the average expected remaining service lives of staff.
b) Health insurance scheme
The Bank has set up its own health insurance scheme for the benefit of staff, financed by contributions from the Bank and its employees. The health insurance scheme is currently managed on the basis of equal benefits and contributions.
9. Fund for general banking risks
This item includes those amounts which the Bank decides to put aside to cover risks associated with loans and other financial operations, having regard to the particular risks attaching to such operations.
Amounts transferred to this Fund feature separately in the profit and loss account as "Transfer to Fund for general banking risks".
10. Funds allocated to venture capital operations and to the Structured Finance Facility
a) Funds allocated to venture capital operations
This item comprises the amount of appropriations from the annual result of the Bank, determined each year by the Board of Governors to facilitate instruments providing venture capital in the context of implementing the European Council Resolution on Growth and Employment.
b) Funds allocated to the Structured Finance Facility
This item comprises the amount of appropriations from the annual result of the EIB, determined each year by the Board of Governors to facilitate implementation of operations with a greater degree of risk for this new type of instrument.
Value adjustments on these operations will be deducted from these items when allocating future results.
11. Taxation
The Protocol on the Privileges and Immunities of the European Communities, appended to the Treaty of 8 April1965 establishing a Single Council and a Single Commission ofthe European Communities, stipulates that the assets, revenues and other property of the Bank are exempt from all direct taxes.
12. Currency and interest rate swaps
The Bank enters into currency swaps, in which the proceeds of a borrowing may be converted into a different currency, mainly as part of its resource-raising operations. Simultaneously, a forward exchange operation is conducted in order to obtain the amounts needed to service the borrowing in the original currency. The amounts corresponding to these operations are entered off balance sheet.
The Bank also enters into interest rate swaps as part of its hedging operations. The corresponding interest is accounted for on a pro rata temporis basis. The nominal amounts of interest rate swaps are accounted for off balance sheet.
page 51 I EIB FINANCIAL STATEMENTS

13. Prepayments and accrued income -Accruals and deferred income
These accounts comprise:
Prepayments and accrued income:
Accruals and deferred income:
Expenditure incurred during the financial year but relating to a subsequent financial year, together with any income which, though relating to the financial year in question, is not due until after its expiry (principally interest on loans).
Income received before the balance sheet date but relating to a subsequent financial year, together with any charges which, though relating to the financial year in question, will be paid only in the course of a subsequent financial year (principally interest on borrowings).
14. Interest receivable and similar income
In addition to interest and commission on loans, deposits and other revenue from the securities portfolio, this heading includes the indemnities received by the Bank in respect
Note B- Securities portfolio (in EUR '000)
Treasury bills eligible for refinancing with central banks (of which 12 661 unlisted in 2001 and 12 651 in 2000)
Debt securities including fixed-income securities (listed):
of prepayments made by its borrowers. With a view to maintaining equivalent accounting treatment between income on loans and the cost of borrowings, the Bank a mortises prepayment indemnities received over the remaining life of the loans concerned.
15. Management of third-party funds
a) ElF treasury
The ElF treasury is managed by the Bank in accordance with the treasury management agreement signed between the two parties in December 2000.
b) Guarantee Fund treasury
The Commission entrusted financial management of the Fund to the EIB under an agreement signed between the two parties in November 1994.
16. Certain prior-year figures have been reclassified to conform with the current year's presentation, particularly as regards currency swap contracts, which are entered off balance sheet instead of under "other assets" and "other liabilities".
31.12.2001 31.12.2000
1 377 061 1 410 978
6 322 325 3 450 471
7 699 386 4 861 449
Amortisation Value Purchase
price Amortisation
for the period Book value
to be accounted for
at final Market maturity value
Investment portfolio ..................... .
Operational money market portfolio: - Money market securities with a max. 3-month maturity ................. . - Money market securities with a max. 12-month maturity ................ .
Operational bond portfolio B 1 Credit Spread
Operational portfolio 83
2 466 639
2 188 999
1 330 120
357 294
Global Fixed Income . . . . . . . . . . . . . . . . . . . . . . 195 453
Loans securitisation portfolio (Note D) . . . . . . . . 1 123 287
37 650
-56
2 504 289 - 39 573 2 464 716 2 525 770
2 188 999 2 188 999 2 188 999
1 330 120 1 330 120 1 330 120
357 238 - 154 357 084 357 165
195 453 190 800 195 453
1 123 287 1 123 287 1 123 287 ------------------------------------------------------------------------
7 661 792
Note C - Loans and advances to credit institutions (other loans and advances) (in EUR '000)
Term deposits
Reverse repos (*) ............. .
31.12.2001
6 578 593
3 329 340
9 907 933
31.12.2000
6 503 569
4 731 983
11 235 552
(*)These operations comprise those carried out with a third-party custodian who undertakes, on the basis of a framework contract, to guarantee compliance with the contractual terms and conditions, notably with respect to: -delivery against payment, -verification of collateral, -the collateral margin required by the lender which must always
be available and adequate, with the market value of the securities being verified daily by the said custodian,
Analysis of aggregate loans granted:
- Disbursed portion ........................................ . - Undisbursed portion ...................................... .
Aggregate loans granted ................................... .
37 594 7 699 386 7 655 006
-organisation of substitute collateral provided that this meets all the contractual requirements.
Note D - Summary statement of loans and guarantees as at 31 December 2001 (in EUR '000)
1, Aggregate loans granted (*)
Aggregate historical amount of loans calculated on the basis of the parities applied on the date of signature 360 315 577 Add: debt adjustment 270 250
exchange adjustments 12 891 752 + 13 162 002
Less: terminations and cancellations principal repayments
9 250 399 144 233 985
Aggregate loans granted
Loans granted
to intermediary credit directly to final
institutions beneficiaries Total 2001
84 654 699 101 085 284 185 739 983 8 523 766 25 729 446 34 253 212
93 178 465 126 814 730 219 993 195
-153 484 384
219 993 195
Total 2000
168 748 611 30 049 630
198 798 241
(*) Aggregate loans granted comprise both the disbursed portion of loans and the portion still to be disbursed.
FINANCIAL REPORT- 2001 I page 52

Aggregate loans granted ....... . Securitised loans (Note B) ....... .
Aggregate loans (Note V) ...... .
31.12.2001
219 993 195 1 123 215
221 116 410
2. Statutory ceiling on lending and guarantee operations
31.12.2000
198 798 241 120 000
198 918 241
Under the terms of Article 18 (5) of the Statute, the aggregate amount outstanding at any time of loans and guarantees granted by the Bank must not exceed 250% of its subscribed capital.
The present level of capital implies a ceiling of EUR 250 billion in relation to aggregate loans and guarantees furnished currently totalling EUR 223 328 million and broken down as follows:
Aggregate loans granted:
Venture capital operations:
Aggregate guarantees furnished in respect of loans granted by third parties: ........................ .
Aggregate securitised loans: ..................... .
219 993
1 669
543
1 123
223 328
Note E - Shares and other variable-yield securities and participating interests
Shares and other variable-yield securities
This item comprises (in EUR '000):
Venture capital operations - after write-down of EUR 19 213 (2000: 0) ................. .
EBRD shares .......................... .
Shares acquired with a view to guaranteeing recovery of loans and advances .......... .
2001
634 272
123 750
30 970
788 992
2000
460 426
115 312
30 196
605 934
The amount of EUR 123 750 000 (2000: EUR 115 312 500) corresponds to the capital paid in by the Bank as at 31 December 2001 in respect of its subscription of EUR 600 000 000 to the capital of the EBRD.
The Bank holds 3.04% of the subscribed capital.
Neither the Bank's result nor its own funds would have been materially affected had these shares been accounted for using the equity method.
In EUR '000 %held Total own funds Total net result Balance sheet total
EBRD (31.12.2000) 3.04 3511178 152 792 21290010
The market value of shares acquired with a view to guaranteeing recovery of loans and advances amounts to EUR 36 613 076 (2000: 32 499 160).
Participating interests
This item for EUR 269 941 795 corresponds to the capital paid in by the Bank in respect of its subscription (EUR 1 215 000 000) to the capital of the European Investment Fund (ElF), with its registered office in Luxembourg.
Note F- Tangible and intangible assets (in EUR '000)
The Bank holds 60.75% of the subscribed capital.
Under the terms of a put option in respect of the remaining 785 ElF shares, the EIB is offering to buy these shares from the ElF's other shareholders within a remaining period of four years for a price of EUR 315 000 per share. This purchase price represents annual appreciation of 3% compared with the purchase offer made in 2000. The ElF's financial situation as at 31 December 2001 does not require any provision to be made by the Bank as a result of this commitment.
Total Total Kirchberg Lisbon Furniture and tangible intangible
Land buildings building equipment assets assets
Net book value at beginning of the year 3 358 Acquisitions during the year Depreciation during the year
3 358
All of the land and buildings are used by the Bank for its own activities.
Note G- Interest subsidies paid and received in advance
a) Part of the amounts received from the European Commission through EMS (European Monetary System) arrangements has been made available as a long-term advance which is entered on the assets side under item 10.(a) as "Receivable in respect of EMS interest subsidies paid in advance".
b) On the liabilities side (item 3.(a)), "Interest subsidies received in advance" comprise:
- amounts in respect of interest subsidies for loans granted for projects outside the Union, under Conventions signed with the ACP States and Protocols concluded with the Mediterranean Countries;
66 528 139 8 302 78 327 9 863 11 620 11 620 2 696
3 830 14 6 643 10 487 4 872
62 698 125 13 279 79 460 7 687
-interest subsidies, concerning certain lending operations mounted within the Union from the Bank's own resources, made available in conjunction with the EMS under Council Regulation (EEC) No 1736/79 of 3 August 1979 and in conjunction with the financial mechanism established by the EFTA Countries under the EFTA Agreement signed on 2 May 1992;
- amounts received in respect of interest subsidies for loans granted from EC resources under Council Decisions 78/870/EEC of 16 October 1978 (New Community Instrument), 82/169/EEC of 15 March 1982 and 83/200/EEC of 19 April 1983 and under Council Regulation (EEC) No 1736/79 of 3 August 1979 as amended by Council Regulation (EEC) No 2790/82 of 18 October 1982.
page 531 EIB FINANCIAL STATEMENTS

Note H -Other balance sheet accounts (in EUR '000)
Sundry debtors:
- Staff housing loans and advances
- Net balance of amounts disbursed in respect of borrowings and amounts received in respect of loans under NCI operations managed for the account of the European Community (Special Section) ............ .
- Borrowing proceeds to be received
- Swap receivables ............ .
-Loan instalments receivable ... .
-Other ..................... .
Sundry creditors:
- European Community accounts:
. for Special Section operations and related unsettled amounts
. deposit accounts ........... .
- Swap payables .............. .
-Borrowing instalments payable
- Optional Supplementary Provident Scheme (Note L) ............ .
-Other ..................... .
31.12.2001
82 173
107 116
0
0
299 010
98 491
586 790
167 241
296 053
0
172 066
133 689
220 345
989 394
FINANCIAL REPORT- 2001 I page 54
31.12.2000
89 035
123 413
226 723
227 393
140 148
92 779
899 491
160 692
200 426
226 723
0
127 693
180 786
896 320
Note I - Prepayments and accrued income - Accruals and deferred income (in EUR '000)
31.12.2001
Prepayments and accrued income:
Interest and commission receivable 2 356 774
Deferred borrowing charges . . . . . 708 607
Other . . . . . . . . . . . . . . . . . . . . . . . 1 279
3 066 660
Accruals and deferred income:
Interest and commission payable 3 165 785
Deferred loan proceeds . . . . . . . . . 461 868
Deferred borrowing proceeds . . . . 726 459
HIPC initiative . . . . . . . . . . . . . . . . 67 912
Staff costs payable ............ .
External mobility costs
Other ...................... .
7 100
7 500 (*)
53 973
4 490 597
31.12.2000
2 614 248
815 716
998
3 430 962
3 341 800
505 733
714 868
70 000 (*)
6 939 (*)
0
129 603
4 768 943
{*) Included in item 13 of the profit and loss account: extraordinary charges (Note Q) .
Note J - Amounts owed to credit institutions (with agreed maturity dates or periods of notice) (in EUR '000)
31.12.2001
- Short-term borrowings . . . . . . . . 597 497
-Promissory notes issued in respect of paid-in capital of EBRD . . . . . 10 125
- Repos ...................... ____ _co
607 622
31.12.2000
426 658
9 113
72 118
507 889

NOTE K- SUMMARY STATEMENT OF DEBTS EVIDENCED BY CERTIFICATES AS AT 31 DECEMBER 2001 (in EUR '000)
Borrowings
Outstanding Average Outstanding Average Due Average
Currency swaps
Amounts payable (+) or receivable (-)
Net amount
Average Outstanding at Outstanding at Payable in at 31.12.2000 rate at31.12.2001 rate dates 31.12.2000 rate 31.12.2001 rate 31.12.2000 31.12.2001
EUR
OEM
FRF
ITL
BEF
NLG
IEP
LUF
ESP
PTE
FIM
GRD
47 344105 5.38 72 131 851
2 153 413 6.20 0
4 923 660 6.54
7 478 250 7.50
68171 7.50
2 932 860 6.68
61 392 7.75
679 304 7.05
4 199 933 7.23
942 091 6.11
67 275 6.29
616 287 6.29
0
0
0
0 0
0
0
0
0
0
IN-CURRENCIES 71 466 741 72 131 851
GBP
DKK
SEK
USD
CHF
JPY
NOK
CAD
AUD
CZK
HKD
NZD
ZAR
HUF
EEK
PLN
TWD
SKK
TOTAL
40 713 384 6.46 48 004 134
482 373 4.94
211181 5.70
484 099
200 512
34 505 658 6.11 45 145 774
3 627 232 4.32
4 570 277 3.42
255 055 5.56
1 841 031
636 553
296 248
1 811 844
8.13
7.88
9.03
7.74
142 045 7.17
761 152 13.68
73585 11.77
9 587 10.00
94 242 14.54
746 729 5.66
68 286 15.58
162 313 203
3 213 298
3 429 706
314 406
1 474 036
462 963
247 891
1 767 967
94 273
609 566
161 106
0
326 416
1 035 766
46 751
179 150 515
5.48 2001/2030 6 313 851 +
0.00 4 633 060 +
4.73 24174 809 +
5.63
0.00
0.00
0.00
0.00
0.00
0.00
0.00
0.00
0.00
0.00
263 927 + 5.06
42 102 + 4.58
119 342 + 8.25
1 557 764 - 4.73
316 135 + 5.64
210 709 - 6.54
1 789 206 + 4.72
1 291 307 + 4.76
157 349 + 4.74
205 429 - 4.85
6.34 2001/2040 2 993 749 - 6.39 4 046 143 -
5.17 2002/2005
5. 70 2003/2007
32 243 +
765 695 +
5.50 2001/2026 4 420 494 -
3.99 2001/2014 181 657 +
3.04 2001/2031 1 649 598 -
5.67 2004/2007 177 324 -
7.98
6.28
7.55
7.12
6.50
12.88
10.02
0.00
12.52
5.00
15.63
2001/2008 1 769 424 -
2001/2005
2001/2015
636 553 -
57 066 -
2001/2010 1 811 844 -
2002/2004
2001/2018
2003/2004
2001/2001
2003/2006
2003/2008
2001/2002
142 045 -
447 906 -
9 587 -
42 291
746 729 -
68 286 -
3.96
3.93
141 865 +
864 306 +
6.45 15 983 627 -
7.11
1.45
7.22
54 960 -
944 455 -
213 796 -
9.00 1 402 998 -
7.88 462 963 -
5.10 101 167 +
7.74 1 767 967 -
7.17
13.44
0.00
10.00
14.84
5.66
15.58
94 273 -
371 124 -
81 573 -
118 105 -
1 035 766 -
63 114 +
5.50 53 657 956 96 306 660
0.00 6 786 473
0.00 5 187 587
0.00 7 520 352
0.00 187 513
0.00 1 375 096
0.00 377 527
0.00 468 595
0.00 5 989 139
0.00 2 233 398
0.00 224 624
0.00 410 858
6.35 37 719 635 43 957 991
5.17
5.70
514 616
976 876
625 964
1 064 818
5.56 30 085 164 29 162 147
4.00 3 808 889
3.04 2 920 679
5.67 77 731
7.98
6.28
7.55
7.12
6.50
12.88
10.02
0.00
12.52
5.00
15.63
71 607
239 182
313 246
73 585
51 951
3 158 338
2 485 251
100 610
71 038
349 058
238 442
79 533
208 311
109 865
The redemption of certain borrowings is indexed to stock exchange indexes (historical value: 2 672 million). All such borrowings are hedged in full through swap operations.
Note L - Provisions for liabilities and charges (staff pension fund) (in EUR '000)
Commitments in respect of retirement benefits were valued at 30 June 2000 by an independent actuary using the projected unit credit method. The calculations were based on the following assumptions:
- a discount rate of 7% for determining the actuarial present value of benefits accrued;
- a retirement age of 62;
-a combined average impact of the increase in the cost of living and career progression estimated at 4%;
-a rate of adjustment of pensions of 1.5%;
-probable resignation of 3% up to age 55;
- use of EVKIPRASA 90 actuarial tables.
Following this valuation, the EIB's commitments have been found to be covered.
The movements in the pension fund provision were as follows:
-provision at 31 December 2000 ............. .
- payments made during the year ............ .
- annual cost ............................ .
-provision at 31 December 2001 ............. .
433 281
- 17 039
+58 709
474 951
The above figures do not include the liability towards members of staff in respect of the Optional Supplementary Provident Scheme (a contributory defined benefit pension scheme). The corresponding amount of EUR 133.7 million (2000: EUR 127.7 million) is entered under "Sundry creditors/other" (Note H).
page 551 EIB FINANCIAL STATEMENTS

Note M - Fund for general banking risks (in EUR '000)
Movements in the Fund for general banking risks are tabulated below:
Fund at beginning of the year Transfer for the year ...... .
Fund at end of the year .... .
31.12.2001
935 000 145 000
1 080 000
31.12.2000
870 000 65 000
935 000
Note N - Geographical analysis of "Interest receivable and similar income" (item 1 of the profit and loss account) (in EUR '000)
31.12.2001 31.12.2000
Germany ............... . 1 552 900 1 444 343 France .................. . 1 227 998 1 229 088 Italy ................... . 1 369 824 1 315 449 United Kingdom ......... . 1 377 507 1 452 315 Spain .................. . 1 219 248 1 242 882 Belgium ................ . 213 288 231 762 Netherlands ............. . 149 850 153 771 Sweden ................ . 177 804 189 422 Denmark ............... . 247 954 284 546 Austria ................. . 152 647 135 974 Finland ................. . 115 649 101 487 Greece ................. . 389 539 354 670 Portugal ................ . 525 726 506 674 Ireland ................. . 113 859 135 521 Luxembourg ............. . 26 829 23 816
8 860 622 8 801 720
Outside the European Union . 1 061 294 944 305
9 921 916 9 746 025
Income not analysed (1) ..... 807 590 898 401
10 729 506 10 644 426
(1) Income not analysed:
Revenue from investment portfolio securities ........ . 158 125 146 523 Revenue from hedging portfolio securities ........ . 0 16 514 Revenue from short-term securities ................ . 85 696 59 253 Revenue from money-market operations .............. . 556 133 676 111 ElF guarantee commission (*) (EIB counterguarantee) ..... . 7 636 0
807 590 898 401
(*) Net of annual amortisation.
Note 0- Geographical analysis of "Commission receivable" (item 4 of the profit and loss account) (in EUR '000)
31.12.2001 31.12.2000
F~nre .................. . 0 9 Italy ................... . 2 5 United Kingdom ......... . 59 54 Spain .................. . 0 0 Denma~ ............... . 1 8 Greece ................. . 0 0 Ireland ................. . 20 27
82 103 Community institutions ..... 22 759 18 824
22 841 18 927
FINANCIAL REPORT- 2001 I page 56
Note P- Administrative expenses and charges (in EUR '000)
Salaries and allowances ..... Welfare contributions and other social costs ......... .
Staff costs ............... . General and administrative expenses ................ .
31.12.2001
101 849
51 054
152 903
50 861
203 764
31.12.2000
94 924
42 511
137 435
43 622
181 057
The number of persons employed by the Bank was 1 097 at 31 December 2001 (1 033 at 31 December 2000).
Note Q - Extraordinary income and charges
a) Extraordinary income (in EUR '000)
The amount as at 31 December 2000 corresponded to the sale of warrants received in conjunction with a loan restructuring operation.
b) Extraordinary charges (in EUR '000)
Staff costs payable ........ . Provision for external mobility Special conversion rates .... . HIPC Initiative ........... . Other .................. .
31.12.2001
0 7 500 3 864
0 0
11 364
Note R - Special deposits for service of borrowings
31.12.2000
6 939 0 0
60 000 489
67 428
This item represents the amount of coupons and bonds due, paid by the Bank to the paying agents, but not yet presented for payment by the holders of bonds issued by the Bank.
Note S- Estimated present value of financial instruments
The Bank records balance sheet financial instruments on the basis of their historical cost in foreign currency (apart from the operational portfolio) representing the amount received in the case of a liability or the amount paid to acquire an asset. The present value of the financial instruments (mainly loans, treasury, securities and borrowings after long-term interest rate or currency swaps) entered under assets and liabilities compared with their accounting value is shown in the table below:
Assets Liabilities
(EUR million) net accounting present accounting present 31 December 2001 value value value value
Loans 186 863 192 470 - -
Investment portfolio 2 504 2 608 - -
Liquid assets 10 128 10 820 - -
Borrowings after swaps - - 174 794 180 198
Total 199 495 205 898 174 794 180 198
Note T- Risk management
The significant risks which have to be managed by the Bank are:
* credit risk
* interest rate risk

* liquidity risk
* exchange risk.
Credit risk
Credit risk concerns mainly the Bank's lending activity and, to a lesser extent, treasury instruments such as fixed-income securities held in the investment, hedging and operational portfolios, certificates of deposit and interbank term deposits.
The credit risk associated with the use of derivatives is also analysed hereafter in the "Derivatives" section (Note U).
Management of credit risk is based, firstly, on the degree of credit risk vis-a-vis counterparties and, secondly, on an analysis of the solvency of counterparties.
As regards lending, treasury and derivatives operations, credit risk is managed by an independent Credit Risk Department under the direct
-within the European Union:
responsibility of the Management Committee. The Bank has thus established an operationally independent structure for determining and monitoring credit risk.
Loans
In order to limit the credit risk on its loan portfolio, the Bank lends only to counterparties where it has been possible to demonstrate their creditworthiness over the longer term and who can offer guarantees deemed sufficiently sound.
In order efficiently to measure and manage credit risk on loans, the Bank has graded its lending operations according to generally accepted criteria, based on the quality of the borrower, the guarantee and, where appropriate, the guarantor.
The structure of guarantees attaching to the portfolio of loans granted as at 31 December 2001 is analysed below (EUR million):
Guarantor
Member Public Zone "A" Without formal States institutions 111 banks
Corporates 111 guarantee 121 Total
Member States 13 509 13 509
Public institutions 19 147 8 991 1 870 899 1 133 32 040
Borrower Zone "A" banks 13 716 27 063 9472 15 174 13 472 78 897
Corporates 8 682 914 21 247 28 957 6 695 66 495
Total 2001 41 545 36 968 32 589 45 030 34 809 190 941
Total 2000 37 873 32 672 30 528 41 168 30 857 173 098
(1) Loans secured by assignment of rights by category of final beneficiary.
(2) Loans for which no formal guarantee was required, the borrower's level of solvency itself representing adequate security. In the event of certain occurrences, appropriate contractual clauses ensure the Bank's right of access to independent security.
-outside the European Union:
2001 2000
Secured by:
Member States 1 881 1 843
Community budget 21 530 (*) 19 506 (*)
Pre-Accession Facility 6 765 4 471
Total 30 176 25 820
(*)of which 2 969 million in risk-sharing operations as explained below (2000: 2 387 million).
Loans outside the Community (apart from those under the PreAccession Facility) are, in the last resort, secured by guarantees of the
Community budget or the Member States (loans in the ACP Countries and the OCT). In all regions (South Africa, non-member Mediterranean Countries, Central and Eastern Europe, Asia and Latin America), apart from the ACP Countries and the OCT, in the case of loans secured by a sovereign guarantee, all risks are, in the last resort, covered by the Community budget.
The agreements decided by the Council of the European Union on 14 April 1997 (Decision 97/256/EC) introduced the concept of risk sharing whereby certain Bank loans are secured by third-party guarantees with respect to the commercial risk, the budgetary guarantee applying in the case of political risks solely arising from currency non-transfer, expropriation, war and civil disturbance. To date, finance contracts for EUR 2 966 million in risk-sharing loans have been signed under these agreements.
Loans granted under the Pre-Accession Facility (EUR 6 765 million) are not secured by guarantees of the Community budget or the Member States.
page 571 EIB FINANCIAL STATEMENTS

LOANS FOR PROJECTS OUTSIDE THE UNION Breakdown of loans by guarantee as at 31 December 2001
(in EUR '000)
Convention/agreement Outstanding Outstanding Convention/agreement Outstanding Outstanding 31.12.01 31.12.00 31.12.01 31.12.00
Member States guarantee ACP/OCT Group 2nd Lome Convention 8 924 17 361
70% Community budget guarantee ACP/OCT Group 3rd Lome Convention 177 225 227 943 ACP/OCT Group 4th Lome Convention 867 832 968 061 South Africa - 375m - Decision 29.01.97 327 031 363 257
ALA II- 900m 995 196 963 759
ACP/OCT Group 4th Lome Convention 826 818 629 489 ALA interim (70% guarantee: risk sharing)
/2nd Financial Protocol -122m 135 063 136 196 Bosnia-Herzegovina- 100m- 99/2001 100 122 60 000
Total Member States guarantee 1880 799 1842 854 Euromed (EIB)- 2 310m- Decision 29.01.97 2 385 402 2 421 834
100% Community budget guarantee FYROM - 150m - 1998/2000 150 000 130 000
South Africa - 300m -CEEC- 3 520m - Decision 29.01.97 3 360 841 3 425 935
BG Decision 19.06.95 205 887 285 714 Total: 70% Community budget ALA l-750m 587 466 603 804 guarantee 7 453 655 7 500 981 ALA interim (1 00% guarantee) - 153m 115 711 168 477
65% Community budget guarantee CEEC- 1 bn - BG Decision 29.11.89 582 878 659 114 CEEC- 3bn - BG Decision 02.05.94 2 491 321 2 663 977 South Africa - 825m - 7/2000-7/2007 202 533 50 000
CEEC- 100m- BG Decision 18.04.91 329 195 366 338 ALA Ill- 2/2000-7/2007 941 255 391 601 Euromed II- 2/2000-7/2007 1 905 885 700 574
Total: 100% Community budget CEEC- 8 680m- 2/2000-7/2007 1 979 920 1 347 000 guarantee 4 312 458 4 747 424 Turkey-TERRA- 11/1999-11/2002 450 000 375 000
75% Community budget guarantee Total: 65% Community budget Mediterranean Protocols 3 903 857 3 964 057 guarantee 5 479 593 2 864 175 Yugoslavia- Art. 18 (1984) 21 159 26 253
Total: Community budget guarantee 21530142 Yugoslavia - 1st Protocol 34 555 48 360 19 505 716
Yugoslavia - 2nd Protocol 193 597 215 237 Total: Pre-Accession Facility 6 764930 4471112 Slovenia - 1st Protocol 131 268 139 229
Grand Total 30 175 871 25 819 682 Total: 75% Community budget guarantee 4 284 436 4 393 136
A breakdown of disbursed loans outstanding (in EUR million) at 31 December 2001 according to the sectors in which borrowers are engaged is set out below:
Sector not more than 1 year
Energy 2 173
Transport 2 554
Telecommunications 1 915
Water, sewerage 1 255
Miscellaneous infrastructure 454
Agriculture, forestry, fisheries 24
Industry 1 636
Services 216
Global loans 3 935
Health, education 89
14 251
Treasury
The credit risk associated with treasury (the securities portfolio, commercial paper, term accounts, etc.) is rigorously managed through selecting first-class counterparties and issuers.
Limits governing the structure of the securities portfolio and outstanding treasury instruments have been laid down by Management, in particular on the basis of the ratings awarded to counterparties by the rating agencies (these limits are reviewed regularly by the Credit Risk Department).
The table below provides a percentage breakdown of the credit risk associated with the securities portfolio and treasury instruments in terms of the credit rating of counterparties and issuers:
FINANCIAL REPORT- 2001 I page 58
Maturity
1 year to more than 5 years 5 years
10 014 11 564
11 704 37 238
7 884 4 581
4 770 6 713
3 180 4 509
196 146
9 067 4 429
1 433 769
19 835 30 727
529 3 324
68 612 104 000
% as at 31 December 2001
Moody's or equivalent rating
AAA
P1
AA1 to AA3
A1
Below A1
Non-rated
Total
TOTAL 2001 TOTAL 2000
23 751 22 217
51 496 47 423
14 380 14 204
12 738 13 000
8143 7 561
366 325
15 132 12 742
2 418 1 684
54497 47 301
3 942 2 413
186 863 168 869
Securities Treasury portfolio% instruments %
63 11
- 12
32 64
1 9
3 3
1 1
100 100
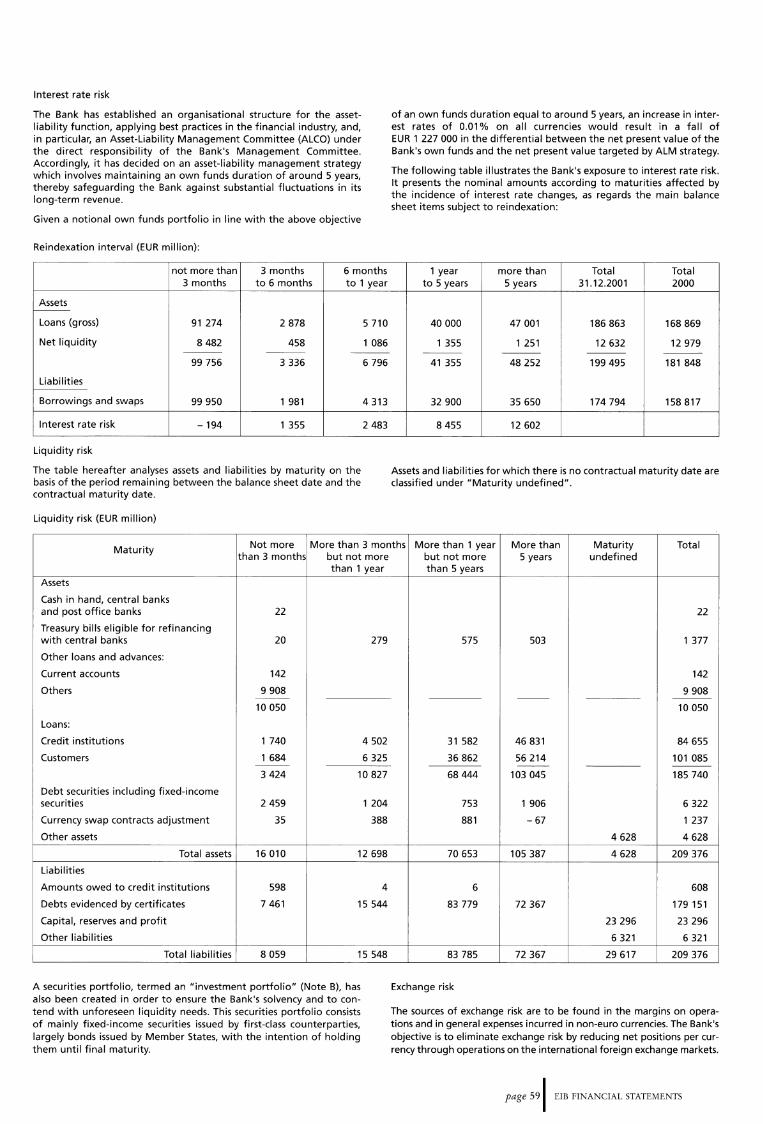
Interest rate risk
The Bank has established an organisational structure for the assetliability function, applying best practices in the financial industry, and, in particular, an Asset-Liability Management Committee (ALCO) under the direct responsibility of the Bank's Management Committee. Accordingly, it has decided on an asset-liability management strategy which involves maintaining an own funds duration of around 5 years, thereby safeguarding the Bank against substantial fluctuations in its long-term revenue.
Given a notional own funds portfolio in line with the above objective
Reindexation interval (EUR million):
not more than 3 months 6 months 3 months to 6 months to 1 year
Assets -
Loans (gross) 91 274 2 878 5 710
Net liquidity 8 482 458 1 086 --- --- ---
99 756 3 336
Liabilities
Borrowings and swaps 99 950 1 981
Interest rate risk -194 1 355
Liquidity risk
The table hereafter analyses assets and liabilities by maturity on the basis of the period remaining between the balance sheet date and the contractual maturity date.
Liquidity risk (EUR million)
6 796
4 313
2 483
of an own funds duration equal to around 5 years, an increase in interest rates of 0.01% on all currencies would result in a fall of EUR 1 227 000 in the differential between the net present value of the Bank's own funds and the net present value targeted by ALM strategy.
The following table illustrates the Bank's exposure to interest rate risk. It presents the nominal amounts according to maturities affected by the incidence of interest rate changes, as regards the main balance sheet items subject to reindexation:
1 year more than Total Total to 5 years 5 years 31.12.2001 2000
40 000 47 001 186 863 168 869
1 355 1 251 12 632 12 979 --- --- --- ---
41 355 48 252 199 495 181 848
32 900 35 650 174 794 158 817
8455 12 602
Assets and liabilities for which there is no contractual maturity date are classified under "Maturity undefined".
Maturity Not more More than 3 months More than 1 year More than Maturity Total than 3 months but not more
than 1 year Assets
Cash in hand, central banks and post office banks 22
Treasury bills eligible for refinancing with central banks 20 279
Other loans and advances:
Current accounts 142
Others 9 908 ---10 050
Loans:
Credit institutions 1 740 4 502
Customers 1 684 6 325 ---
3 424 10 827
Debt securities including fixed-income securities 2 459 1 204
Currency swap contracts adjustment 35 388
Other assets
Total assets 16 010 12 698
Liabilities
Amounts owed to credit institutions 598 4
Debts evidenced by certificates 7 461 15 544
Capital, reserves and profit
Other liabilities
Total liabilities 8 059 15 548
A securities portfolio, termed an "investment portfolio" (Note B), has also been created in order to ensure the Bank's solvency and to contend with unforeseen liquidity needs. This securities portfolio consists of mainly fixed-income securities issued by first-class counterparties, largely bonds issued by Member States, with the intention of holding them until final maturity.
but not more 5 years undefined than 5 years
22
575 503 1 377
142
9 908 --- ---
10 050
31 582 46 831 84 655
36 862 56 214 101 085 --- ---
68 444 103 045 185 740
753 1 906 6 322
881 -67 1 237
4 628 4 628
70 653 105 387 4 628 209 376
6 608
83 779 72 367 179 151
23 296 23 296
6 321 6 321
83 785 72 367 29 617 209 376
Exchange risk
The sources of exchange risk are to be found in the margins on operations and in general expenses incurred in non-euro currencies. The Bank's objective is to eliminate exchange risk by reducing net positions per currency through operations on the international foreign exchange markets.
page 591 EIB FINANCIAL STATEMENTS

Exchange position (EUR million)
Currency Euro
Assets
Cash in hand, central banks and post office banks 14
Treasury bills eligible for refinancing with central banks 1377
Other loans and advances:
Current accounts 90
Others 6 564
6654
Loans:
Credit institutions 48 615
Customers 61339
109 954
Debt securities including fixed-income securities 4 199
Currency swap contracts adjustment -24 672
Other assets 3 213
Total Assets 100 739
Liabilities
Amounts owed to credit institutions 593
Debts evidenced by certificates:
Debt securities in issue 71977
Others 155
72 132
Capital, reserves and profit 23296
Other liabilities 4 735
Total Liabilities 100 756
Off balance sheet 2
Net position as at 31.12.2001 -15
Net position as at 31.12.2000 -189
(1) of which GRD: 172 (euro-in currency as from 01.01.2001)
Note U - Derivatives
Derivatives are contractual financial instruments, the value of which fluctuates according to trends in the underlying assets, interest rates, exchange rates or indexes.
1. As part of funding activity
The Bank uses derivatives mainly as part of its funding strategy in order to bring the characteristics, in terms of currencies and interest rates, of the funds raised into line with those of loans granted and also to reduce funding costs.
The derivatives most commonly used are:
*Currency swaps
* Interest rate swaps
* Deferred rate-setting (DRS) agreements.
Currency swaps
Currency swaps are contracts under which it is agreed to convert funds raised through borrowings into another currency and, simultaneously,
FINANCIAL REPORT- 2001 I page 60
Pound United States Other Total Grand sterling dollar currencies excl. euro total
7 1 8 22
1 377
2 23 27 52 142
726 2 322 296 3344 9 908
728 2 345 323 3 396 10 050
22 576 11 798 1 666 36040 84 655
19 357 13 898 6 491 39 746 101 085
41 933 25 696 8 157 75 786 185 740
665 1 432 26 2 123 6 322
4 579 15 903 5 427 25 909 1 237
905 323 187 1 415 4 628
48 817 45 699 14121 108 637 209 376
12 3 15 608
47 758 45 146 13413 106 317 178 294
247 455 702 857
48 005 45 146 13 868 107 019 179 151
23 296
808 537 241 1 586 6 321
48 813 45 695 14 112 108 620 209 376
-2
2 4 9
4 5 180'')
a forward exchange contract is concluded to re-exchange the two currencies in the future in order to be able to repay the funds raised on the due dates.
Interest rate swaps
Interest rate swaps are contracts under which it is generally agreed to exchange floating-rate interest for fixed-rate interest or vice versa.
Deferred rate-setting (DRS) agreements
This derivative is similar to an interest rate swap contract (fixed rate/floating rate or vice versa). However, it is used more specifically by long-term financing institutions such as the EIB, which raises substantial amounts on the capital markets.
Interest rate or currency swaps allow the Bank to modify the interest rates and currencies of its borrowing portfolio in order to accommodate requests from its clients and also make it possible to access certain capital markets by exchanging with counterparties their advantageous conditions of access to these markets, so reducing funding costs.
Long-term derivatives transactions are used only for fund-raising and for the reduction of market risk exposure, but not for trading.

All interest rate and currency swaps linked with the borrowing portfolio have maturities identical to the borrowings concerned and are therefore long-term.
Derivatives credit risk hedging policy
The credit risk with respect to derivatives lies in the loss which the Bank would incur were a counterparty unable to honour its contractual obligations.
In view of the special nature and complexity of the derivatives transactions, a series of procedures was put in place to safeguard the Bank against loss arising out of the use of this instrument.
Contractual framework:
All the EIB's long-term derivatives transactions are concluded in the contractual framework of Master Swap Agreements and, where nonstandard structures are covered, Credit Support Annexes, which specify the conditions of exposure collateralisation. These are generally accepted and practised contract types.
Counterparty selection:
Minimum rating A 1 at the outset, the EIB having the right of early termination if the rating drops below a certain level.
Limits:
-total net market value of derivatives exposure with a counterparty;
- unsecured exposure to a counterparty;
-furthermore, specific concentration limits expressed as nominal amount.
Currency swaps (EUR million)
All limits are dynamically adapted to the credit quality of the counterparty.
Monitoring:
The derivatives portfolio is regularly valued and compared against limits.
Collateral isation:
-Derivatives exposure exceeding the limit for unsecured exposure is collateralised by cash and first-class bonds.
-Very complex and illiquid transactions require collateralisation over and above the present market value.
-Both the derivatives portfolio with individual counterparties and the collateral received are regularly valued, with a subsequent call for additional collateral or release.
The credit risk associated with derivatives varies according to a number of factors (such as interest and exchange rates) and generally corresponds to only a small portion of their notional value. In the Bank's case, where only mutually agreed derivatives are negotiated, the credit risk is evaluated on the basis of the "current exposure" method recommended by the Bank for International Settlements (BIS). Hence, the credit risk is expressed in terms of the positive replacement value of the contracts, increased by the potential risks, contingent on the duration and type of transaction, weighted by a coefficient linked to the category of counterparty (BIS 2 weighted risk).
The following tables show the maturities of currency swaps and interest rate swaps plus DRS combined, sub-divided according to their notional amount and the associated credit risk:
less than 1 year to 5 years to more than Total Total 1 year 5 years 10 years 10 years 31.12.2001 2000
Notional amount 4 233 29 185 3 182 1 967 38 567 28 126
Net discounted value 516 1 695 13 58 2 282 1 732
Credit risk (BIS 2 weighted) 148 959 105 145 1 357 1 103
The notional amounts receivable or payable in respect of currency swaps are disclosed off balance sheet (see 2. below for short-term swaps).
Interest rate swaps and DRS (EUR million)
less than 1 year to 1 year 5 years
Notional amount 11 967 50 175
Net discounted value 366
Credit risk (BIS 2 weighted) 99
The Bank does not generally enter into any options contracts in conjunction with its risk hedging policy. However, as part of its strategy of raising funds on the financial markets at least cost, the Bank enters into borrowing contracts encompassing notably interest rate or stock exchange index options. Such borrowings are covered by swap contracts to hedge the corresponding market risk.
Tabulated below are the number and notional amount of the various types of option attaching to borrowings:
1 739
635
5 years to more than Total Total 10 years 10 years 31.12.2001 2000
21 119 26 607 109 868 97 548
617 2 095 4 817 2 974
343 655 1 732 1 380
Special Embedded Stock structure
option exchange coupon index or similar
Number of transactions 99 33 30
Notional amount ( EUR million) 7 505 2 672 3 641
Net discounted value 126 167 277
page 611 EIB FINANCIAL STATEMENTS

All options contracts embedded in, or linked with, borrowings are negotiated by mutual agreement.
Generally, there is no credit risk on these options, except in some cases where they are based on a stock exchange index, but for which security exists in the form of regularly monitored collateral.
Ratings exposure table
% Net market Credit risk Rating of nominal risk & BIS2
Aaa 10.5 549 1 397
Aa1 to Aa3 83.5 1 014 7 464
A1 4.4 33 546
A2 to Baa3 0.9 14 108
Non-rated 0.7 0 154
Total 100 1 610 9 669
All new transactions are concluded with counterparties rated at least A 1. Consequently, most of the portfolio is concentrated on counterparties rated A 1 or above.
2. As part of liquidity management
The Bank also enters into short-term currency swap contracts in order to adjust currency positions in its operational treasury in relation to its benchmark currency, the euro, and to cater for demand for currencies in conjunction with loan disbursements.
The notional amount of short-term currency swaps stood at EUR 2 025 million at 31 December 2001, as against EUR 981 million at 31 December 2000.
Note V- Geographical breakdown of lending by country in which projects are located
Aggregate Countries and territories Number loans Undisbursed Disbursed % %fin. in which projects are located of loans granted portion portion of total year 2000
1. Loans for projects within the Union and related loans
Germany 739 32 228 163 755 710 31 472 453 14.58% 13.71%
France ..... 385 25 318 051 2 542 954 22 775 097 11.45% 11.18%
Italy ...... 1 231 29 828 077 3 275 444 26 552 633 13.49% 14.04%
United Kingdom 303 25 049 052 3 510 566 21 538 486 11.33% 12.17%
Spain .... 443 27 346 806 2 452 300 24 894 505 12.37% 12.86%
Belgium .. 88 4 128 141 394 841 3 733 300 1.87 o/o 2.11%
Netherlands 48 3055414 793 523 2 261 890 1.38% 1.49%
Sweden 116 4 393 271 821 598 3 571 673 1.99% 1.90%
Denmark 111 5 580 093 613 113 4 966 980 2.52% 2.41%
Austria 105 3 569 121 0 3 569 121 1.61% 1.45%
Finland . 53 2 859 620 331 035 2 528 584 1.29% 1.21%
Greece 205 8 915 099 1 466 871 7 448 228 4.03% 3.77%
Portugal 214 13 556 906 3 467 993 10088914 6.13% 6.22%
Ireland 98 2 486 418 875 581 1610837 1.12% 1.19%
Luxembourg 33 605 738 109 308 496 430 0.27% 0.30%
Related loans (*) 22 2 020 569 200 000 1 820 569 0.91% 1.01%
Total 4194 190 940 539 21 610 837 169 329 700 86.35% 87.02%
2. Loans for projects outside the Union
2. 1. ACP Countries/OCT
Namibia 10 161 461 45 225 116 236
Kenya 10 146 987 54 376 92 610
Jamaica 11 135 479 15 337 120 143
Mauritius 11 129 587 61 755 67 832
ACP Group 3 113 373 48 450 64 923
Zimbabwe 12 102 371 18 030 84 341
Trinidad and Tobago 5 91 638 499 91 139
Barbados 6 80 254 50 173 30 081
Ghana .... 5 78 980 22 629 56 351
Senegal 3 75 330 42 977 32 353
Mozambique 4 70 321 3 500 66 821
Botswana 8 66 065 0 66 065
(*)Loans authorised under the second paragraph of Article 18 (1) of the Statute for projects located outside the territory of Member States of the Union but offer-ing benefits for the Union are considered as related to loans within the Union.
FINANCIAL REPORT- 2001 I page 62

Note V- Geographical breakdown of lending by country in which projects are located (continued)
Aggregate Countries and territories Number loans U nd isbu rsed Disbursed % %fin. in which projects are located of loans granted portion portion of total year 2000
Regional - Central Africa 1 53 713 44 636 9 077
Lesotho ...... 3 52 940 27 414 25 526
Mauritania ..... 3 51 612 30 000 21 612
Papua New Guinea 6 41 749 0 41 749
Bahamas .. 4 39 737 0 39 737
Cameroon 3 38 688 29 903 8 785
Cote-d'lvoire 8 37 299 0 37 299
Nigeria ... 2 32 829 0 32 829
Dominican Republic 4 31 634 16 375 15 259
Regional- Africa 1 30 033 0 30 033
Gabon ....... 3 21 545 15 500 6 045
Regional - Caribbean 20 814 6 024 14 790
Regional -West Africa 19 849 8 350 11 499
Swaziland 2 17 500 7 500 10 000
Saint Lucia 4 17 414 5 000 12 414
Uganda 2 15 828 0 15 828
Guinea 2 10 391 0 10 391
Malawi . 4 10 100 0 10 100
Dominica 1 10 000 10 000 0
French Polynesia 3 9 715 3 000 6 715
British Virgin Islands 3 7 805 0 7 805
Cayman Islands ... 3 6 775 0 6 775
Saint Vincent and the Grenadines 2 5 342 0 5 342
Mali ................ 5 093 0 5 093
OCT Group ............ 5 000 4 845 155
New Caledonia and Dependencies 2 4 992 0 4 992
Chad .. 4 982 4 415 567
Surinam 4 419 0 4 419
Grenada 1 3 993 0 3 993
Tonga 2 3 257 0 3 257
Falkland Islands 2 3 255 0 3 255
Netherlands Antilles 3 3 223 0 3 223
Aruba 3 2 828 2 000 828
Belize 2 826 0 2 826
Fiji .. 1 774 0 1 774
Sub-total 173 1 880 800 577 913 1 302 887 0.85% 0.93%
2.2. South Africa Sub-total 23 735 452 256 180 479 272 0.33% 0.35%
2.3. Euro-Mediterranean Partnership Countries and the Balkans
Egypt .. 34 1 552 165 575 925 976 240
Morocco 35 1 509 609 739 500 770 109
Turkey 23 1 508 292 684 712 823 581
Algeria . 28 1 484 851 385 650 1 099 201
Tunisia 39 1 081 415 489 200 592 215
Lebanon 12 446 645 147 000 299 645
Jordan 28 409 844 103 000 306 844
Croatia . 10 215 748 146 000 69 748
Syria .. 3 210 725 190 000 20 725
Gaza-West Bank 10 197 509 106 270 91 239
FYROM ..... 8 174 358 89 000 85 358
Bosnia-Herzegovina 3 160 123 156 350 3 773
Albania ...... 6 131 092 91 349 39 743
Federal Republic of Yugoslavia 11 122 360 66 000 56 360
Israel ............. 3 44 758 0 44 758
Sub-total 253 9 249 494 3 969 956 5 279 539 4.18% 3.64%
page 631 EIB FINANCIAL STATEMENTS

Note V- Geographical breakdown of lending by country in which projects are located (continued)
Aggregate Countries and territories Number loans Undisbursed Disbursed % %fin. in which projects are located of loans granted portion portion of total year 2000
2.4. Accession Countries Poland ..... 58 4 655 602 2 253 603 2 402 000
Czech Republic 28 2 513 895 940 800 1 573 095
Romania . . . . 33 2 227 071 1 315 330 911 741
Hungary .... 42 1 838 956 642 700 1 196 256
Slovak Republic 24 1 136 039 194 991 941 049
Slovenia 24 1 063 270 512 585 550 685
Bulgaria 22 918 140 632 000 286 140
Cyprus 17 486 525 265 194 221 331
Lithuania 17 294 838 121 442 173 397
Latvia 11 201 740 107 987 93 753
Estonia 13 161 554 65 415 96 139
Malta 4 37 806 25 000 12 806
Sub-total 293 15 535 436 7 077 047 8 458 392 7.03% 6.92%
2.5. Asia and Latin American Countries
Brazil ... 16 763 403 68 912 694 491
Argentina 10 496 013 92 136 403 876
Philippines 7 281 549 88 725 192 824
Indonesia 5 253 143 207 279 45 865
Thailand 4 175 129 35 650 139 479
China .. 3 151 558 56 167 95 391
Panama 2 111 974 18 438 93 536
Peru .. 2 99 913 0 99 913
Mexico 3 96 445 36 307 60 138
Vietnam 55 000 55 000 0
India .. 54 489 27 096 27 393
Costa Rica 48 818 0 48 818
Pakistan 2 44 902 34 035 10 867
Regional -Andean Pact 42 166 0 42 166
Bangladesh ...... 36 202 36 202 0
Regional - Central America 35 034 5 333 29 701
Chile .. 16 500 0 16 500
Uruguay .......... 12 451 0 12 451
Sub-total 62 2 774 689 761 280 2 013 409 1.25% 1.14%
Total 804 30 175 871 12 642 376 17 533 499 13.65% (*} 12.98%
Grand total 4 998 221 116 410 (**} 34 253 213 186 863 199 100.00% 100.00%
(*) 10.6% excluding Pre-Accession Facility. (**) including securitised loans (Note B).
Note W - Segment reporting
The Bank considers that lending constitutes its main business segment;
its organisation and entire management systems are given over to
developing and providing loans for Bank customers.
Consequently, the determining factors for segment reporting are:
• primary determining factor: lending as the main business segment;
FINANCIAL REPORT- 2001 I page 64
• secondary determining factor: lending in terms of geographical spread.
Information to be disclosed under the heading of geographical segment reporting is given in the following notes:
• interest receivable and similar income by geographical area (Note N);
• lending by country in which projects are located (Note V};
• tangible and intangible assets by country of location (Note F).

Note X - Conversion rates
The following conversion rates were used for drawing up the balance sheets at 31 December 2001 and 31 December 2000:
1 euro = EUR0-12: Rates fixed irrevocably
Deutsche Mark French francs Italian lire Span ish pesetas Belgian francs Netherlands guilders Austrian Schillings Finnish markka Drachmas Irish pounds Luxembourg francs Portuguese escudos
PRE-IN:
Pound sterling Danish kroner Swedish kronor
NON-COMMUNITY CURRENCIES:
United States dollars Swiss francs Lebanese pounds Japanese yen Canadian dollars Australian dollars CFA francs Czech koruny Hong Kong dollars New Zealand dollars South African rand
31.12.2001
0.608500 7.43650 9.30120
0.881300 1.48290
1359.01 115.330
1.40770 1.72800
655.957 31.9620
6.87230 2.12150
10.4302
1.95583 6.55957
1936.27 166.386 40.3399
2.20371 13.7603 5.94573
340.750 0.787564
40.3399 200.482
31.12.2000
0.624100 7.46310 8.83130
0.930500 1.52320
1351.02 106.9200
1.39650 1.67700
655.95 35.0470 7.25780 2.11200 7.03920
page 651 EIB FINANCIAL STATEMENTS

Liquidity management
Operational bond portfolio
3%
; '
Investment bond
portfolio 15%
Operational money market portfolio 82%
Liquidity Management
Liquid funds, at 31 December 2001, totalled some 16.6 billion, i.e. 12.6 billion net of short
term commitments; these funds were held in 13 currencies, including the euro. In 2001, the
euro accounted for 49% of short-term investments. EU currencies represented 65% of aggre
gate liquid funds. The level of the Bank's overall liquidity must fall within 25 to 40% of annu
al net cash flows. The breakdown of liquid funds was as follows:
The operational money market portfolio of 13.6 billion (9.6 billion net of short-term com
mitments) constituted the bulk of liquid funds.
This portfolio consists primarily of borrowing proceeds and surplus cash flow. Its chief pur
pose is to cover the Bank's day-to-day liquidity needs. These holdings must be sufficient to
meet the Bank's future loan disbursements.
By definition, the operational money market portfolio comprises liquid instruments with
short-dated maturities. At end-2001, the bulk of this portfolio was placed in first-class prod
ucts and invested with top-flight issuers and counterparties.
The purpose of the operational bond portfolio comprising two sub-portfolios- credit spread
and fixed rate bond management - is to diversify money market placements within the first
line of liquidity. This portfolio amounted to 0.5 billion.
The investment bond portfolio represents the second line of liquidity (2.5 billion), compris
ing bonds issued by EU Member States and other first-class public institutions. Over 99% of
the total volume of securities held in the portfolio are rated AA 1 or issued by EU Member
States.
LIQUIDITY MANAGEMENT I page 66
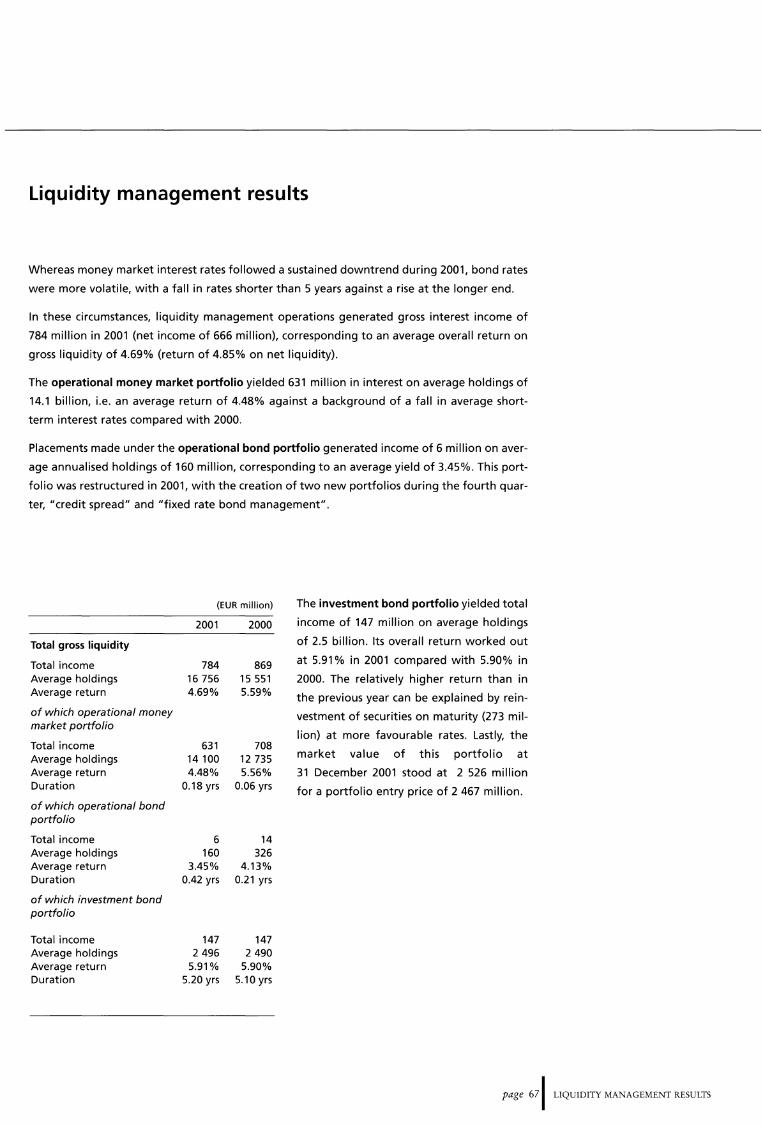
liquidity management results
Whereas money market interest rates followed a sustained downtrend during 2001, bond rates
were more volatile, with a fall in rates shorter than 5 years against a rise at the longer end.
In these circumstances, liquidity management operations generated gross interest income of
784 million in 2001 (net income of 666 million), corresponding to an average overall return on
gross liquidity of 4.69% (return of 4.85% on net liquidity).
The operational money market portfolio yielded 631 million in interest on average holdings of
14.1 billion, i.e. an average return of 4.48% against a background of a fall in average short
term interest rates compared with 2000.
Placements made under the operational bond portfolio generated income of 6 million on aver
age annualised holdings of 160 million, corresponding to an average yield of 3.45%. This port
folio was restructured in 2001, with the creation of two new portfolios during the fourth quar
ter, "credit spread" and "fixed rate bond management".
Total gross liquidity
Total income Average holdings Average return
of which operational money market portfolio
Total income Average holdings Average return Duration
of which operational bond portfolio
Total income Average holdings Average return Duration
of which investment bond portfolio
Total income Average holdings Average return Duration
(EUR million)
2001
784 16 756 4.69%
631 14 100 4.48%
0.18 yrs
6 160
3.45% 0.42 yrs
147 2 496
5.91% 5.20 yrs
2000
869 15 551 5.59%
708 12 735 5.56%
0.06 yrs
14 326
4.13% 0.21 yrs
147 2 490
5.90% 5.10 yrs
The investment bond portfolio yielded total
income of 147 million on average holdings
of 2.5 billion. Its overall return worked out
at 5.91% in 2001 compared with 5.90% in
2000. The relatively higher return than in
the previous year can be explained by rein
vestment of securities on maturity (273 mil
lion) at more favourable rates. Lastly, the
market value of this portfolio at
31 December 2001 stood at 2 526 million
for a portfolio entry price of 2 467 million.
page 671 LIQUIDITY MANAGEMENT RESULTS

Results for the Year
Profit for the 2001 financial year came to
1 311 million compared with 1 280 million in
2000, representing an increase of 2.42%.
Before transfers to provisions and extraordi
nary profit, the operating surplus worked out
at 1 468 million in 2001, as against 1 393 mil
lion in 2000, up 5.38%.
This increase is attributable mainly to the
growth of the EIB Group's balance sheet. On
the interest rate front, movements were mod
est with the average rate on loans falling
from 6.06% in 2000 to 5.64% in 2001 and the
average rate on borrowings down over the
same period from 5.86% to 5.34%.
Receipts of interest and commission on loans
in 2001 totalled 9 921 million as against
9 746 million in 2000, while interest and com
mission on borrowings amounted to
8 895 million (8 857 million in 2000).
Overall, treasury operations yielded net
income of 666 million in 2001, or 31 million
below the 2000 figure of 698 million, produc
ing an average overall return of 4.85% in
2001 compared with 5.60% in 2000.
The decline in the absolute level of interest
income from treasury operations in 2001
stemmed chiefly from the lower return on
operational portfolios, down by 30 million on
2000. This dip was due to falling short-term
rates but remained limited by the impact of
increased holdings.
A detailed breakdown of the Bank's treasury
by compartment is presented on page 67 of
the Financial Report.
General administrative expenses together
with depreciation of tangible and intangible
assets amounted to 202.4 million in 2001, or
8.5% more than in 2000 (186.5 million).
EIB RESULTS FOR THE YEAR I page 68
On 5 June 2001, the Board of Governors
decided to appropriate the balance of the
profit and loss account for the year ended
31 December 2000, which, after transfer of
EUR 65 000 000 to the Fund for general bank
ing risks, amounted to EUR 280 461 896, as
follows: (i) an amount of E"UR 250 000 000 for
addition to the funds allocated to the
Structured Finance Facility, and (ii) the bal
ance, i.e. EUR 1 030 461 896, for appropriation
to the Additional Reserves.
Acting on a proposal from the Management
Committee, the Board of Directors is recom
mending that the Governors appropriate the
balance of the profit and loss account for the
year ended 31 December 2001, which,
after transfer of EUR 145 000 000 to the Fund
for general banking risks, amounted to
EUR 1 311 444 923, as follows:
- EUR 750 000 000 to the new special supple
mentary reserve for venture capital opera
tions and operations under the Structured
Finance Facility. Transfers, in whole or in part,
from this reserve to the funds allocated to
venture capital operations and to the
Structured Finance Facility will be effected on
a decision by the Governors, it then being pos
sible, on a decision by the Governors, to
appropriate the amounts not transferred to
these funds to another use and/or to the
Additional Reserves.
- deduction of EUR 908 728 from the funds
allocated to venture capital operations fol
lowing transfer of the net result on these
operations as at 31 December 2001.
- the balance of EUR 562 353 651 to the
Additional Reserves.

Report of the Auditor
The Chairman of the Audit Committee
EUROPEAN INVESTMENT BANK
Luxembourg
We have audited the financial statements, as identified below, of the European Investment
Bank for the year ended 31 December 2001. These financial statements are the responsibility
of the management of the European Investment Bank. Our responsibility is to express an opin
ion on these financial statements based on our audit.
We conducted our audit in accordance with International Standards on Auditing. Those stan
dards require that we plan and perform the audit to obtain reasonable assurance about
whether the financial statements are free of material misstatement. An audit includes examin
ing, on a test basis, evidence supporting the amounts and disclosures in the financial state
ments. An audit also includes assessing the accounting principles used and significant estimates
made by management, as well as evaluating the overall financial statements presentation. We
believe that our audit provides a reasonable basis for our opinion.
In our opinion, the financial statements identified below give, in accordance with the general
principles of the Directives of the European Union on the annual accounts and consolidated
accounts of banks and other financial institutions, a true and fair view of the financial position
of the European Investment Bank as at 31 December 2001 and of the results of its operations
and its cash flows for the year then ended.
The financial statements on which our opinion is expressed comprise:
• Balance sheet
• Statement of Special Section
• Profit and loss account
• Own funds and appropriation of profit
• Statement of subscriptions to the capital of the Bank
• Cash flow statement
• Notes to the financial statements.
Luxembourg, 26 February 2002
ERNST & YOUNG Societe Anonyme
Kenneth A. HAY
page 691 REPORT OF THE AUDITOR

The Audit Committee
The Audit Committee reports to the Board of Governors, the following statement being com
municated to the Governors prior to their approval of the Annual Report and the financial
statements for the past financial year.
Statement by the Audit Committee
The Committee, instituted in pursuance of Article 14 of the Statute and Article 25 of the
Rules of Procedure of the European Investment Bank for the purpose of verifying that the
operations of the Bank are conducted and its books kept in a proper manner, having
- designated Ernst & Young as external auditors, reviewed their audit planning process,
examined and discussed their reports and noted that their opinion on the financial state
ments is unqualified,
- convened on a regular basis with the heads of Directorates and relevant services, met regu
larly the Head of Internal Audit and discussed the relevant internal audit reports, and stud
ied the documents which it deemed necessary to examine in the discharge of its duties,
- received assurance from the Management Committee concerning the effectiveness of the
internal control structure and internal administration,
and considering
- the financial statements for the financial year ending on 31 December 2001 as drawn up
by the Board of Directors at its meeting on 26 February 2002,
- that the foregoing provides a reasonable basis for its statement and,
- Articles 22, 23 & 24 of the Rules of Procedure,
to the best of its knowledge and judgement:
has verified that the Bank's operations have been carried out in compliance with the for
malities and procedures laid down by the Statute and Rules of Procedure;
confirms that the financial statements, comprising the balance sheet, the statement of spe
cial section, the profit and loss account, the statement of own funds and appropriation of
profit, the statement of subscriptions to the capital of the Bank, the cash-flow statement and
the notes to the financial statements give a true and fair view of the financial position of the
Bank as at 31 December 2001 and of the results of its operations and cash flows for the year
then ended.
E. MARIA
AUDIT COMMITTEE I page 70
Luxembourg, 19 March 2002
The Audit Committee
M. COLAS

ElF Financial Statements
page 711

BALANCE SHEET as at 31 December 2001 (expressed in euro)
ASSETS Notes 31.12.2001 31.12.2000
Current assets Cash at bank and in hand
current accounts .............................................. . 39 079 199 4 510 054 term deposits . . . . . . . . . . . . . . . . . . . . . . . . . . . . . . . . . . . . . . . . . . . . . . . . . 3.1 10 000 000 21 632 123
49 079199 26 142 177
Debtors . . . . . . . . . . . . . . . . . . . . . . . . . . . . . . . . . . . . . . . . . . . . . . . . . . . . . . . . . . 3.2 2 255 558 4 332 505
Fixed-income securities Commercial paper . . . . . . . . . . . . . . . . . . . . . . . . . . . . . . . . . . . . . . . . . . . . . . 3.3 52 578 086 34 574164
103 912 843 65 048 846
Fixed assets . . . . . . . . . . . . . . . . . . . . . . . . . . . . . . . . . . . . . . . . . . . . . . . . . . . . . . . . . . 3.6 Debt securities and other fixed-income securities held as fixed assets . . . . . . . . . 3.4 452 321 997 438 437 881 Investments in venture capital enterprises . . . . . . . . . . . . . . . . . . . . . . . . . . . . . . . 3.5 48428 308 39 822 926 Intangible assets .................................................. . 100 622 154 503 Tangible and other fixed assets ...................................... . 5 068425 5 131 195
505 919 352 483 546 505
Prepayments and accrued income 3.7 15 202 680 14 352 081
Total assets 625 034 875 562 947 432
FINANCIAL REPORT- 2001 I page 72

LIABILITIES Notes 31.12.2001 31.12.2000
Creditors . . . . . . . . . . . . . . . . . . . . . . . . . . . . . . . . . . . . . . . . . . . . . . . . . . . . . . . . . . . . 4.1 31 863 938 15 562 700
Accruals and deferred income . . . . . . . . . . . . . . . . . . . . . . . . . . . . . . . . . . . . . . . . . . . 4.2 15 545 636 13 168 799
Provisions for liabilities and charges Provision relating to guarantees . . . . . . . . . . . . . . . . . . . . . . . . . . . . . . . . . . . . . . 4.3 24 311 610 45 005 169
Other provisions .................................................. . 1444167 585 110
25 755 777 45 590 279
Capital . . . . . . . . . . . . . . . . . . . . . . . . . . . . . . . . . . . . . . . . . . . . . . . . . . . . . . . . . . . . . 4.4
Subscribed ....................................................... . 2 000 000 000 2 000 000 000
Uncalled ........................................................ . (1 600 000 000) (1 600 000 000)
400 000 000 400 000 000
Share premium account . . . . . . . . . . . . . . . . . . . . . . . . . . . . . . . . . . . . . . . . . . . . . . . . 4.4 12 770 142 12 770 142
Statutory reserve . . . . . . . . . . . . . . . . . . . . . . . . . . . . . . . . . . . . . . . . . . . . . . . . . . . . . . 4.5 39 464 505 32 924 425
Profit brought forward . . . . . . . . . . . . . . . . . . . . . . . . . . . . . . . . . . . . . . . . . . . . . . . . . 4.5 23 892 297 10 230 688
Profit for the financial year 4.5 75 742 580 32 700 399
Total liabilities 625 034875 562 947 432
OFF-BALANCE SHEET ITEMS
Guarantees in respect of loans granted by third parties ...................... . 5.1 Drawn ......................................................... . 2 260 093 563 1 925 416 649 Undrawn ....................................................... . 529 552 812 920 806 399
2 789 646 375 2 846 223 048
Commitments on Venture Capital operations .............................. . 5.3 51 777 298 15 801 078
Assets held for third parties ............................................ . 5.4 130 745 377 142 623 375
Fiduciary operations .................................................. . 5.5 3 852 182 292 2 594 036 680
6 824 351 342 5 598 684 181
The accompanying notes form an integral part of these annual accounts.
page 731 ElF FINANCIAL STATEMENTS

PROFIT AND LOSS ACCOUNT for the year ended 31 December 2001 (expressed in euro)
Notes 2001 2000
Net interest and similar income . . . . . . . . . . . . . . . . . . . . . . . . . . . . . . . . . . . . . . . . . . 6.1 24 759424 21 094149
Income from securities Income from investments in venture capital enterprises ...................... . 6 332 804 4084116
Commission income . . . . . . . . . . . . . . . . . . . . . . . . . . . . . . . . . . . . . . . . . . . . . . . . . . . 6.2 15 872 131 26 392 563
Net profit I (loss) on financial operations . . . . . . . . . . . . . . . . . . . . . . . . . . . . . . . . . . . 6.3 (491187) 554 842
Other operating income ............................................... . 3 897 130 939
General administrative expenses: Staff costs: - wages and salaries . . . . . . . . . . . . . . . . . . . . . . . . . . . . . . . . . . . . . . . . . . . . . . . . 6.4 (5 691120) (4 915 177) -social security costs of which: EUR 244 706 relating to pensions (2000: EUR 362 580) ............. . (298 743} (443 054)
(5 989 863) (5 358 231)
Other administrative expenses ....................................... . (2 277 584) (1 807 359)
(8 267 447) (7 165 590)
Value adjustments in respect of tangible and intangible assets (377 774) (396 324}
Value adjustment in respect of financial assets . . . . . . . . . . . . . . . . . . . . . . . . . . . . . . 3.5 (2 924 364}
Transfer to/from the provision relating to guarantees . . . . . . . . . . . . .. . . . . . . . . . . . . 4.3 20 335 096 (11 994 296)
Extraordinary result ...............................................•... 20 500 000
Profit for the financial year ............................................ . 75 742 580 32 700 399
The accompanying notes form an integral part of these annual accounts.
FINANCIAL REPORT- 2001 I page 74

1 General
The EUROPEAN INVESTMENT FUND (hereafter the "Fund"} was incorporated on 14 June 1994 as an international financial institution.
The primary task of the Fund is to contribute to the pursuit of European Community objectives through:
- the provision of guarantees;
-the acquisition, holding, managing and disposal of equity participations and
-the administration of special resources entrusted by third parties.
The Fund operates as a partnership, the members of which are the European Investment Bank (hereafter "the EIB"}, the European Union, represented by the Commission of the European Communities ("The Commission"}, and a group of financial institutions of Member States of the European Union. The members of the Fund shall be liable for the obligations of the Fund only up to the amount of their share of the capital subscribed and not paid in.
As a consequence of the reform of the Fund in 2000, the EIB carries out on the Fund's behalf the management of the TEN guarantee portfolio, with the commitments amounting to EUR 1 695 213 950 as at 31 December 2001. The EIB assumed the advantages as well as the risks of this portfolio and paid in January 2001 the Fund a lump sum amount of EUR 20.5 million in consideration thereof. The total risk provision for TEN guarantee operations which amounted to some EUR 40 000 000 at 31 December 2000 has been released to profit and loss as at 1 January 2001.
The EIB and the Fund entered into a Treasury management agreement on 7 December 2000 under which the EIB will manage the Fund's treasury portfolio on its behalf.
The financial year of the Fund runs from 1 January to 31 December each year.
As detailed in note 4.4, the EIB has a majority shareholding in the Fund. Consequently the Fund is included in the consolidated accounts of the EIB Group. The consolidated accounts may be obtained from the registered office of the EIB at 100, boulevard Konrad Adenauer, L-2950 Luxembourg.
2 Accounting policies and presentation of annual accounts
2.1 Presentation of annual accounts
These annual accounts have been prepared in accordance with the historical cost convention, employing the accounting policies set out below.
The Fund's accounting policies are in accordance with the Council Directives of the European Union where applicable.
Although the comparative figures in these financial statements have not been restated following the changes in accounting policies as indicated in notes 2.3, 2.4, 2.6 and 2.9, the related financial impact of these changes has been disclosed in the relevant notes.
2.2 Valuation of foreign currency balances and transactions
The share capital of the Fund is expressed in euro ("EUR"} and the accounting records are maintained in that currency.
Non-monetary items denominated in a foreign currency are reported using the exchange rate at the date of the transaction (historical cost}.
Monetary items, which include all other assets, liabilities, and off-balance sheet items expressed in a currency other than EUR are reported using the closing foreign exchange rate as issued by the European Central Bank.
Income and charges in foreign currencies are translated into EUR at the exchange rate ruling on the date of the transaction.
The positive exchange difference arising on the revaluation of investments in venture capital enterprises are not recognised until disposal of the related assets.
Other exchange differences arising from the translation of monetary items are recognised in the profit and loss account in the period in which they arise.
2.3 Debt securities and other fixed-income securities
Debt securities and other fixed-income securities intended for use on a continuing basis in the Fund's activities and normally held until final maturity are deemed to be fixed assets. Other debt securities and other fixed-income securities with initial maturity of less than one year are disclosed as current assets.
Debt securities and other fixed-income securities have been re-categorised and valued as follows:
- the floating rate notes have been dedicated to the portfolio considered as "Available for Sale" and consequently valued at market value;
-the fixed rate notes remained in the Investment Portfolio Held to Maturity and valued at cost.
Premiums paid over the maturity value are amortised by equal instalments over the remaining period to maturity. The cumulative amortisation from the date of acquisition is included in "Accruals and deferred income" on the liability side of the balance sheet.
Discounts received in comparison to the maturity value of securities are taken to the profit and loss account in equal instalments over the remaining period to maturity. The cumulative amortisation from the date of acquisition is included in "Prepayments and accrued income" on the asset side of the balance sheet.
2.4/nvestments in venture capital enterprises
Investments in venture capital enterprises represent shares and other variable-yield securities and participating interests acquired for the longer term in the normal course of the Fund's activities and are shown in the balance sheet at their original purchase cost. Unrealised gains arising from the restatement of these investments at the year-end closing rates are not recognised until disposal of the investment.
Value adjustments are made following a line-by-line review of attributable net assets based on valuations provided by funds managers of the equity participations to the extent that such valuations are lower than the original purchase costs of the equity participations.
Any unrealised capital gains arising from the revaluation of venture capital investments are excluded from the value adjustment calculation and are not recognised until disposal of the underlying investment.
2.5 Valuation of intangible and tangible assets
Intangible and tangible assets are valued at purchase price, reduced by accumulated value adjustments calculated to write off the value of such assets on a straight line basis over their expected useful life as follows:
Intangible assets Software ......................................... .
Tangible assets Buildings ......................................... . Fixtures and fittings .. _. ............................. . Office equipment .................................. . Computer equipment and vehicles ..................... .
2.6 Provision relating to guarantees
Useful life
2 to 5 years
30 years 10 years
3 to 5 years 3 years
The provisions for the guarantees have been calculated in line with the methodology set out in the Credit Policy Guidelines. This results in a rating based, transaction-by-transaction, evaluation of the provisioning requirements. This represents a change to the previous accounting policy, which was to allocate each year two thirds of gross utilisation commission to the provision relating to guarantees.
2.7 Guarantees in respect of loans granted by third parties
The amount disclosed in respect of issued guarantees represents the total commitment which refers to both the drawn and undrawn principal amounts of the underlying loans and, if relevant, to the present value of the flow of future interest payments covered by the guarantees.
2.8 Commission income
Up-front commissions received for arranging and granting guarantees are recognised when a binding obligation has been entered into.
Guarantee commissions received are recognised on a time proportion basis over the life of the guarantee.
2.9 Net interest and similar income
Interest and similar income are recognised on a time proportion basis taking account of the effective yield on the asset.
Premiums on fixed-income securities held as fixed assets amortised during the financial year, and interest and similar expenses paid are deducted from the gross amount of interest and similar income received.
3 Detailed disclosures relating to asset headings
3. 1 Term deposits
The remaining life of term deposits is detailed as follows:
Up to three months ........................ .
2001 EUR
10 000 000
2000 EUR
21 632 123
The remaining life for amounts repayable by instalments is defined as the period from the balance sheet date to the repayment date of each instalment. The remaining life of other amounts due is the period from the balance sheet date to the date of repayment.
The above amount includes EUR 0 advanced by EIB as at 31 December 2001 (2000: EUR 13 632 123} (See note 4.1}.
3.2 Debtors
Debtors include an amount of EUR 1 049 612 representing management fees to be received from the EIB with regards to the "Risk Capital Mandate".
3.3 Commercia/ paper
The market value of commercial paper amounts to EUR 52 797 700 as at 31 December 2001 (2000: EUR 32 660 100}.
page 751 ElF FINANCIAL STATEMENTS

3.4 Debt securities and other fixed-income securities held as fixed assets
The securities held by the Fund are all quoted on a recognised market.
Debt securities and other fixed-income securities held as fixed assets are analysed as follows:
Held to Maturity Available for Sale
2001 EUR
428 007 727 24 314 270
452 321 997
2000 EUR
420073 531 18 364 350
438 437 881
The Available for Sale portfolio as at 31 December 2000 has not been restated to market value due to the immateriality of the amount concerned.
Securities with a remaining duration to maturity of less than one year amount to EUR 62 916 035 (2000: EUR 80 340 339).
Securities issued by the EIB amount to EUR 0 (2000: EUR 3 132 000).
The market value of debt securities held as fixed assets and normally held to maturity amounts to EUR 453 509 860 (2000: EUR 431 656 109).
The Fund participates as lender in a Securities Lending and Borrowing Programme with Euroclear and Clearstream. The market value of securities lent at the year-end amounts to EUR 4 257 802 (2000: EUR 3 816 008).
3.6 Movements in fixed assets (expressed in EUR)
Purchase price at the
beginning Headings of the year
Debt securities and other fixed income 438 437 881 securities held as fixed assets
Investments in venture capital enterprises 39 822 926
Intangible assets (software) 305 982
Tangible and other fixed assets 6 224 176 of which: a) Land and buildings 5 161 380 b) Fixtures and fittings 157 538 c) Office equipment 435 844 d) Computer equipment 386 471 e) Vehicles 74178 f) Other fixed assets 8 765
3. 5 Investments in venture capital enterprises
Investments in venture capital enterprises are analysed as follows:
Net disbursed amount at cost ...... . Value adjustment
Net book value
2001 EUR
51 352 671 (2 924 364)
48 428 308
2000 EUR
39 822 926
39 822 926
Investments in venture capital enterprises represent equity investments and related financing structures.
The net attributable value (calculated as indicated in note 2.4) of the investments in venture capital enterprises amounts to EUR 65 716 961.
The unrealised foreign exchange gain arising from the revaluation of venture capital enterprises at year-end closing rates amounts to EUR 1 109 446 (2000: EUR 1 070 448). In accordance with the Fund's accounting policy this amount is not recognised until the related investment is either sold or repaid.
Cumulative value Carrying
Purchase price adjustments amount at the end at the end at the end
Additions Disposals of the year of the year of the year
94 283 444 80 340 339 452 380 986 58 989 452 321 997
16 083 144 4 553 398 51 352 672 2 924 364 48 428 308
25 000 - 330 982 230 361 100 622
258 075 359 288 6 122 963 1 054 538 5 068 426
- - 5 161 380 687 502 4 473 878 76 662 - 234 203 85 849 148 355
6 489 - 442 330 190 276 252 053 165 030 359 288 192 213 29 814 162 399
9 894 - 84072 61 097 22 976 - - 8 765 - 8 765
Total 484 790 965 110 649 663 85 253 025 510 187 603 4 268 252 505919353
3. 7 Prepayments and accrued income
Prepayments and accrued income are analysed as follows:
Interest receivable on debt securities Income receivable on commercial paper Interest receivable on term deposits ...... . Accrued discount on debt securities ...... . Accrued commission on guarantees ....... . Prepaid expenses and others ............ .
2001 EUR
10915316 213 763
7 929 1 531 320 2 533 840
512
15 202 680
2000 EUR
10 056 405 298 224
2 138 758 387
3212534 24 393
14 352 081
The total amount of the discount to be accrued on the remaining life of fixed-income securities amounted to EUR 3 957 694 as at 31 December 2001 (2000: EUR 4 281 719).
4 Detailed disclosures relating to liability headings
4. 1 Creditors
Creditors are analysed as follows:
Trade creditors Current account Staff costs payable Amounts owed to credit institutions
2001 EUR
1 686 501 30 177 396
41
31 863 938
2000 EUR
71 003 15 326 640
151 515 13 542
15 562 700
The current account largely represents funds advanced by the EIB for additional investments in venture capital enterprises managed for the EIB, which is also included in the Fund's current accounts reported in Cash at Bank.
FINANCIAL REPORT- 2001 I page 76
4.2 Accruals and deferred income
Accruals and deferred income are analysed as follows:
Deferred income on issued guarantees Premium amortised on debt securities
2001 EUR
10 296 926 5 248 710
15 545 636
2000 EUR
6 593 388 6 575 411
13168799
The total amount of the premium to be amortised on the remaining life of debt securities amounts to EUR 9 029 153 (2000: EUR 10 025 611).
4.3 Provision relating to guarantees
The movements relating to provisions in respect of contingent losses which may arise from the guarantee portfolio are set out below:
Balance at the beginning of the financial year ... Release with regards to TEN portfolio ..... Transfer to the provision relating to guarantees Utilisation ..................... .
Balance at the end of the financial year
2001 EUR
45 005 169 (40 000 000)
19 664 904 (358 463)
24 311 610
2000 EUR
33 030 932
11 994 296 (20 059)
45 005 169
The balance of EUR 24 311 610 now solely pertains to the Fund's SME guarantee portfolio. The previous year's balance of EUR 45 005 169 pertains to the Fund's SME guarantee portfolio (EUR 5 005 169) and its TEN guarantee portfolio (EUR 40 million); the risks and rewards of the latter portfolio were transferred to the EIB effective 1 January 2001 (see note 1).
Had the risk grading approach to SME guarantee provisioning been adopted in 2000, the related provision of EUR 5 005 169 (included in the total of EUR 45 005 169) would have been increased by EUR 7 409 765 as at 31 December 2000. This would have had the impact of increasing the total transfer relating to guarantees during 2000 to EUR 19 404 061 and increasing the year-end balance to EUR 52 414 934.

4.4 Capital
The authorised capital amounts to EUR 2 billion, divided into 2 000 shares with a nominal value of EUR 1 000 000 each.
The subscribed share capital of EUR 2 000 000 000 representing 2 000 shares is called for an amount of EUR 400 000 000 representing 20% of the subscribed share capital.
The subscribed share capital is detailed as follows:
Subscribed and paid in (20%} ...... . Subscribed but not yet called (80%} ..
2001 EUR
400 000 000 1 600 000 000
2000 EUR
400 000 000 1 600 000 000
2 000 000 000 2 000 000 000
The capital is subscribed as follows:
2001 2000 Number of shares
European Investment Bank ........... . European Commission ................ . Financial institutions ................. .
4.5 Statutory reserve and profit brought forward
1 215 600 185
2 000
1 215 600 185
2 000
Under the terms of Article 27 of its Statutes, the Fund is required to appropriate to a statutory reserve at least 20% of its annual net profit until the aggregate reserve amounts to 10% of subscribed capital. Such reserve is not available for distribution.
A minimum amount of EUR 15 148 516 is required to be appropriated in 2002 with respect to the financial year ended 31 December 2001.
Movements in reserves and profit brought forward are detailed as follows (expressed in EUR}:
Statutory Profit Profit for the reserve brought forward financial year
Balance at the beginning of the financial year .. . . . .. . .. .. . .. .. 32 924 425 10 230 688 32 700 399 Dividend paid ................. (12 498 710} Other allocation of last financial year profit ..... 6 540 080 13 661 609 (20 201 689} Profit for the financial year 75 742 580
Balance at the end of the financial year ................. 39 464 505 23 892 297 75 742 580
The General Meeting of members of 22 May 2001 approved the distribution of a dividend amounting to EUR 6 580 per share in respect of the 1 799 shares with entitlement for the full financial year 2000 and EUR 3 290 per share for the 201 shares previously unallocated (2000: EUR 6 000 per share}, amounting to EUR 12 498 710.
5 Disclosures relating to off-balance sheet items
5.1 Guarantees
Guarantees issued in respect of loans drawn down and those not yet drawn down by the obligor are analysed with reference to their maturity as follows:
Total Total Drawn Undrawn 2001 2000
EUR EUR EUR EUR
Up to five years 767 934 062 66 655 296 834 589 358 287 318 121 From five to ten years 960 408186 349 809 210 1 310 217 396 1688112112 From ten to fifteen years ............ 268 464179 29 288 113 297 752 292 445 730 516 Over fifteen years .. 263 287 136 83800193 347 087 329 425 062 299
2 260 093 563 529552812 2 789 646 375 2 846 223 048
Ofthe above total amount, EUR 1 322 531 700 (2000: EUR 1 351 184 430} has been issued in favour of the EIB.
Also included in the above total is an amount of EUR 1 695 213 950 representing the TEN guarantees operations managed by the EIB on behalf of the Fund with effect from 1 January 2001.
The drawn-down portion ofthe guarantees issued includes an amount of EUR 67 461129 (2000: EUR 80 558 581} representing the present value of future interest covered by guarantees.
5.2 Statutory ceiling on the overall commitments for operations
As regards guarantee operations, under the terms of Article 26 of the Fund's Statutes, the overall commitment of the Fund, excluding commitments made by the Fund on behalf of third parties, may not exceed, three times the amount of its subscribed capital for guarantee operations.
The present level of capital establishes a ceiling of EUR 6 000 000 000 in relation to total guarantees outstanding currently totalling EUR 2 789 646 375 (2000: EUR 2 846 223 046}.
In accordance with Article 12 and in conjunction with Article 26 of the Statutes, the ceiling presently applied in respect of the Fund's own venture capital operations is 50% of own funds. Taking into account the 2001 results, the ceiling stands at EUR 268 134 762 whilst the commitments in respect of the venture capital operations amount to EUR 126 246 832 (2000: EUR 74 907 083}.
5.3 Commitments
Commitments represent investments in venture capital enterprises committed and not yet disbursed amounting to EUR 51 777 298 (2000: EUR 15 801 078}.
5.4 Assets held for third parties
Assets held for third parties, as set out below, represent three trust accounts opened and maintained in the name of the Fund but for the benefit of the Commission of the European Communities ("the Commission"}. Sums held in these accounts remain the property of the Commission so long as they are not disbursed for the purposes set out in relation to each project.
Under the Growth and Environment Pilot Project, the Fund provides a free guarantee to the financial intermediaries for loans extended to SMEs with the purpose of financing environmentally friendly investments. The ultimate risk from the guarantee rests with the Fund and the guarantee fee is paid out of European Union budget funds.
Under the SME Guarantee Facility, the Fund is empowered to issue guarantees in its own name but on behalf of and at the risk of the Commission.
Under the ETF Start-Up Facility, the Fund is empowered to acquire, manage and dispose of ETF start-up investments, in its own name but on behalf of and at the risk of the Commission.
2001 2000 EUR EUR
Growth and Environment Pilot Project .... . 16091609 22 480 915 SME Guarantee Facility ........... . 54 762 256 60 831 838 ETF Start-Up Facility ..................... . 59 891 512 59 310 622
130 745 377 142 623 375
The ETF Start-Up Facility balance also includes net investments of EUR 34 466 483 (2000: EUR 21 887 927} .
5.5 Fiduciary operations
Pursuant to Article 28 of its Statutes, the Fund acquires, manages and disposes of investments in venture capital enterprises, in its own name but on behalf of and at the risk of the EIB and of the Commission, according to Fiduciary and Management Agreements concluded with the EIB ("European Technology Facility", "European Technology Facility 2" and "Transfer, Implementation and Management of Risk Capital Investments" (Risk Capital Mandate)} and with the Commission ("ETF Start-Up Facility"}.
The Fund is also empowered to issue guarantees in its own name but on behalf of and at the risk of the Commission according to the Fiduciary and Management Agreement concluded with the Commission ("SME Guarantee Facility"}.
Fiduciary operations concluded pursuant to the Fiduciary and Management Agreements are analysed as follows:
Guarantees signed on behalf of the European Community under the SME Guarantee Facility
Drawn ....................... . Undrawn ...... .
Investments made: European Technology Facility ETF- Start-Up Facility ............ . EIB Risk Capital Mandate ......... .
Investment commitments not yet drawn: European Technology Facility .......... . ETF - Start-Up Facility ......... . EIB Risk Capital Mandate ............... .
2001 EUR
1 302 384 060 662 955 077
106 063 926 50106275
629 059 524
129 583 971 55 066 686
916 986 370
3 852 205 889
6 Detailed information on the profit and loss account
6.1 Net interest and similar income
Net interest and similar income comprises:
Interest on debt securities ................... . Interest on term deposits ........... . Accrued discount on debt securities . Interest on bank current accounts Premium amortised on debt securities Interest and similar charges
2001 EUR
25 405 315 708 218 819 505 628 186
(2 701 123} (100 678}
24 759 423
2000 EUR
604 533 627 874 419 383
66164846 21 887 927
412 396 810
78 637 603 26 135 858
509 860 626
2 594 036 680
2000 EUR
23 222 252 744 273 561 264 123 267
(3 494 427} (62 480}
21 094 149
page 771 ElF FINANCIAL STATEMENTS

6.2 Commission income
Commission income is detailed as follows:
Commissions on guarantees issued in respect of loans drawn down .............................. . Commissions on guarantees issued in respect of loans not yet drawn down ..................... . Up-front commissions in respect of guarantees issued Commission on European Technology Facility ... Commission on ETF Start-Up Facility Commission on SME Guarantee Facility Commission on EIB Risk Capital Mandate Other commissions ........ .
6.3 Net profit I (foss) on financial operations
2001 2000 EUR EUR
4 519 522 18 431 594
134 257 1417724 958 786 1 792 744
2 291 875 1 875 000 1 400 521 1 178 208 2 928 326 1 258 395 3 607 843 438 898
31 000
15 872 130 26 392 563
Net profit/(loss) on financial operations represents losses of EUR 491 187 arising from:
- Foreign exchange gains for EUR 150 700 (2000 includes gain of EUR 554 842);
-Value adjustment of EUR 58 989 in respect of Available for Sale portfolio;
-Realised loss of EUR 582 898 on sales of securities.
Unit of account
6.4 Wages and salaries
Wages and salaries include costs of EUR 2 162 345 incurred in relation to staff seconded from the EIB.
7 Personnel
The number of persons (including the Chief Executive and 15 EIB secondees) employed at the year-end was as follows:
Chief Executive Employees ......... .
Total .....
Average during the year
8 Taxation
2001
51
52
47
2000
1 46
47
44
The Protocol on the Privileges and Immunities of the European Communities, appended to the Treaty of 8 April1965 establishing a Single Council and a Single Commission of the European Communities, applies to the Fund, which means that the assets, revenues and other property of the Fund are exempt from all direct taxes.
The Fund's unit of account is the euro (EUR) adopted by the European Union. Unless otherwise indicated in the Annual Report and Financial Statements, all amounts are expressed in euro. The following conversion rates were used for drawing up the balance sheet of 31 December 2001.
1 euro =
Pound sterling Danish kroner . Swedish kronor .. US dollar .
Statistical note
31 December 2001
0.60850 7.4365 9.3012 0.8813
Unless otherwise indicated, amounts in EUR shown in this Annual Report are based on conversion rates published by the European Central Bank on the 28 December 2001.
FINANCIAL REPORT- 2001 I page 78

Results for the Year
The ElF recorded a net profit in 2001 of EUR 75 742 580, compared with EUR 32 700 399 in 2000.
Of gross operating income of EUR 46 964 357, 52.7% stemmed from income on treasury invest
ments, 33.8% from commissions on guarantee operations and 13.5% from income on venture
capital operations. A net amount of EUR 20 335 096 was released from the provision relating
to guarantees. Extraordinary income of EUR 20 500 000 was generated by the transfer of the
risks and advantages related to the TENs guarantee portfolio.
The profit on treasury activities of EUR 24 million in 2001 (EUR 21 million in 2000), up by
EUR 3 million, represented a global average return of 4.57% in 2001 (4.80% in 2000).
The balance sheet total progressed from EUR 562 947 432 at 31 December 2000 to EUR 625 034 875
at 31 December 2001, an increase of 11%. On the liabilities side, the provision relating to guaran
tees stood at EUR 24 311 610. The statutory reserve amounted to EUR 39 464 505, a rise of 19.9%
compared to 2000.
Off-balance sheet commitments increased by 21.9% from 5 598 684 181 at 31 December 2000
to EUR 6 824 351 342 at 31 December 2001. Of the 2001 year-end balance, 58% related to fidu
ciary operations and the remainder essentially to guarantee operations from own resources.
page 791 ElF RESULTS FOR THE YEAR
Report of the Auditor
To the Audit Board of
the EUROPEAN INVESTMENT FUND
43, avenue J.F. Kennedy
L-2968 Luxembourg
Following our appointment by the Audit Board, we have audited the accompanying annual
accounts of the EUROPEAN INVESTMENT FUND for the year ended December 31, 2001. These
annual accounts are the responsibility of the Board of Directors. Our responsibility is to
express an opinion on these annual accounts based on our audit.
We conducted our audit in accordance with International Standards on Auditing. Those stan
dards require that we plan and perform the audit to obtain reasonable assurance about
whether the annual accounts are free of material misstatement. An audit includes examin
ing, on a test basis, evidence supporting the amounts and disclosures in the annual accounts.
An audit also includes assessing the accounting principles used and significant estimates
made by management, as well as evaluating the overall annual accounts presentation. We
believe that our audit provides a reasonable basis for our opinion.
In our opinion, the attached annual accounts give a true and fair view of the assets, liabili
ties and financial position of the EUROPEAN INVESTMENT FUND as at December 31, 2001 and
of the results of its operations for the year then ended in conformity with the Council
Directives of the European Union where applicable.
KPMG Audit
Reviseurs d'Entreprises
Luxembourg, 25 February 2002 D.G. Robertson
REPORT OF THE AUDITOR I page SO

The Audit Board
The Audit Board set up pursuant to Article 22 of the Statutes,
• acting in accordance with the customary standards of the audit profession,
• having studied the books of accounts and such documents which it deemed necessary to
examine in the discharge of its duties,
• having examined the report dated 25 February 2002 drawn up by KPMG Audit,
considering Articles 17, 18 and 19 of the Rules of Procedure,
hereby confirms
• that the operations of the Fund have been carried out in compliance with the formalities
and procedures laid down in the Statutes, the Rules of Procedure and the guidelines and
directives from time to time adopted by the Board of Directors;
• that the balance sheet and profit and loss account of the Fund give a true and fair view of
the financial position of the Fund in respect of its assets and liabilities, and of the results of
its operations for the financial year under review.
Luxembourg, 25 February 2002
The Audit Board
Michael HARALABIDIS
Sylvain SIMONETTI
page 811 AUDIT BOARD


Control and Evaluation
AUDIT COMMITIEE - As an independent statutory body, answerable directly to the Board of
Governors, the Audit Committee verifies that the Bank's operations have been conducted in
compliance with the procedures laid down in its Statute and the Rules of Procedure and that
its books have been kept in a proper manner. The Governors take note of the report of the
Audit Committee and its conclusions, and of the Statement by the Committee, before approv
ing the Annual Report of the Board of Directors. The Audit Committee meets every month to
coordinate its own work and that of the external and internal auditors and holds regular meet
ings with the members of the Management Committee and key staff members.
In furtherance of "best banking practice" and action to strengthen the control structures
embarked upon by the Bank over a number of years, the Audit Committee continued during
2001 to monitor closely the gradual integration into the Bank's internal control systems of the
method and recommendations of the Basle Committee on Banking Supervision (BJS - Bank for
International Settlements) set out in the "Framework for Internal Control Systems in Banking
Organisations".
EXTERNAL AUDITORS - The independent external auditors report directly to the Audit
Committee, which they inform each year of their work programme and of the coordination of
their activity with that of the Bank's Internal Audit. The firm Ernst & Young was appointed by
the Audit Committee in 1997, after consultation with the Bank's Management Committee. The
contract has been renewed for a 3-year period commencing in 2002.
INTERNAL AUDIT - Catering for audit needs at all levels of management of the EIB Group and
acting with the guarantees of independence and of professional standards conferred upon it
by its Charter revised in 2001, Internal Audit examines and evaluates the relevance and effec
tiveness of the internal control systems and the procedures involved. It is also introducing an
internal control framework based on BIS guidelines. Hence, Internal Audit reviews and tests
controls in critical banking, information technology and administrative areas over a two to five
year cycle. Under internal procedures to combat fraud, the Head of Internal Audit has author
ity to conduct enquiries. The Bank may also call upon external assistance or experts in accord
ance with the requirements of the enquiry, including the services of the European Anti-Fraud
Office (OLAF).
FINANCIAL CONTROL - This independent department, set up as part of measures to tighten
financial controls within the Bank, is responsible for general accounting and for preparing the
Bank's financial statements. Financial Control is also called upon to express a second opinion
on certain aspects of the Bank's financial policies and their implementation. Financial Control
covers all the Bank's activities whose data streams have an important impact on its financial
position, such as credit risk, performance indicators, information and management systems, the
administrative budget, ALM and market risks. Thus, the Financial Control function includes
analysing financial management instruments as well as the associated systems.
page 831 CONTROL AND EVALUATION

CREDIT RISK- The process of credit risk control for lending operations is implemented both
before and after loan signature. Its objective is to avoid making unsound loans from the out
set and, subsequent to disbursement, to ensure that the value of the EIB's loans is preserved,
leading to the complete and timely recovery of all outstanding amounts. In the case of trea
sury, portfolio and derivative operations, the goal is also to ensure that counterparties are of
a high quality, that bilateral limits are not exceeded and that the credit risk of transactions
is correctly measured and, if necessary, collateralised at all times.
The Credit Risk Directorate delivers an independent opinion on the credit risk involved in
each loan proposal to the Management Committee, with recommendations on the structure
of the loan, checking its compliance with the relevant credit policy guidelines and approved
individual and sectoral limits. Advice is given on appropriate credit risk mitigants (e.g. con
tractual clauses) to be included in the final contracts.
An in-depth analysis of the creditworthiness of both the client and the guarantor (when
appropriate) is carried out, taking also into account the maturity of the operation, as well as
all available securities and covenants. The result of this assessment is quantified by an inter
nal loan grading, based on the expected loss methodology. This loan grading serves as a gen
eral guide to the acceptability of the proposed transaction and also to establish the level of
the general provisioning required.
All the internal credit risk policy guidelines are codified and are approved by the competent
bodies.
OPERATIONS EVALUATION- This department carries out ex post evaluations and coordinates
the self-evaluation process in the Bank. It ensures transparency vis-a-vis the EIB's governing
bodies as well as interested outside parties, by carrying out thematic, sector and regional/
country evaluations of projects financed by the Bank, once they have been completed.
Through its work, this department familiarises external observers with the performance of
the Bank and encourages the institution to learn from experience.
In 2001, the department completed and published evaluation reports on regional develop
ment in Portugal and Italy, venture capital operations in the African, Caribbean and Pacific
States and energy projects in the European Union and Central and Eastern Europe.
The abovementioned controls stem from the Bank's Statute or other internal organisational
provisions. As both a Community body and a financial institution, the Bank cooperates with
other independent control bodies entrusted with such tasks under the Treaty or other regu
lations.
EUROPEAN COURT OF AUDITORS - Under Article 248 of the EC Treaty, the Court is vested
with the task of examining all revenue and expenditure accounts of the Community. The
CONTROL AND EVALUATION I page 84

results of the Court's audits are published (www.eca.eu.int). In accordance with the Agreement
mentioned in Article 248 (3) and which sets out the arrangements governing the Court's audit
of the use of Community funds managed by the Bank under mandate, the Bank continued in
2001 to provide the Court of Auditors with all information requested.
OLAF (European Anti-Fraud Office) - In accordance with the Bank's policies and procedures
regarding the investigation of cases of suspected fraud or corruption, following the establish
ment in 2000 of a cooperative relationship with OLAF, in 2001 the Bank voluntarily provided
OLAF with the results of a comprehensive audit of an EIB project on which suspicions had been
raised.
EUROPEAN OMBUDSMAN - Pursuant to Article 195 of the Treaty, the Ombudsman conducts
investigations into alleged instances of maladministration by the Community institutions and
bodies. The Treaty vests the Ombudsman with full independence in the performance of his
duties. The Bank's responses to requests for information or opinions, either in the context of a
citizen's complaint or of an investigation opened at the Ombudsman's own initiative, aim to
demonstrate the Bank's compliance with the rules that are binding on it. The Ombudsman pub
lishes the results of his enquiries (www.euro-ombudsman.eu.int). In 2001, the Bank received
five requests for information or opinions, to which it has since responded.
page 851 CONTROL AND EVALUATION

EIB Group addresses
European Investment Bank 100, boulevard Konrad Adenauer L-2950 Luxembourg Tel. (+352) 43 79 - 1 Fax (+352) 43 77 04
website: www.eib.org E-mail: [email protected]
Department for Lending Operations in: Italy, Greece, Cyprus and Malta Via Sardegna, 38 1-00187 Rome Tel. (+39) 06 47 19- 1 Fax (+39) 06 42 87 34 38
Athens Office: 364, Kifissias Ave & 1, Delfon GR-152 33 Halandri/Athens Tel. (+30) 10 68 24 517-9 Fax (+30) 10 68 24 520
Berlin Office: Lennestrasse, 17 D-1 0785 Berlin Tel. (+49 - 30) 59 00 479 - 0 Fax (+49- 30) 59 00 47 99
European Investment Fund 43, avenue J.F. Kennedy L-2968 Luxembourg Tel. (+352) 42 66 88 - 1 Fax (+352) 42 66 88 - 200
website: www.eif.org E-mail: [email protected]
II European Investment Bank
Brussels Office: Rue de Ia loi 227 B-1040 Brussels Tel. (+32 - 2) 23 50 070 Fax (+32 - 2) 23 05 827
Lisbon Office: Regus Business Center Avenida da Liberdade, 110- 2° P-1269-046 Lisbon Tel. (+351) 21 34 28 989 Fax (+351) 21 34 70 487
Madrid Office: Calle Jose Ortega y Gasset, 29 E-28006 Madrid Tel. (+34) 91 43 11 340 Fax (+34) 91 43 11 383
page 871
European Investment Fund

Ill
ISBN 92-861-0018-3
JU~