financial report 2008 - 2009 · 2007, he was awarded an australia day medallion for his services to...
TRANSCRIPT

F inanc ia l R epor t 2008 - 2009

heritage building society limited financial rePort 2008 - 2009 | 1
Directors’ Report ....................................................................2
Income Statement ...................................................................6
Balance Sheet .........................................................................7
Statement of Recognised Income and Expense .......................8
Cash Flow Statement ..............................................................9
Notes to the Financial Statements .........................................10
Directors’ Declaration ...........................................................63
Auditor’s Independence Declaration .....................................64
Independent Auditor’s Report ..............................................65
Auditors Ernst & Young
Registered office Heritage Building Society Limited 6th Floor 400 Ruthven Street Toowoomba Qld 4350
Postal address P.O. Box 190 Toowoomba Qld 4350
Telephone (07) 4690 9000
Internet address www.heritageonline.com.au
Contents
Heritage Building Society LimitedABN 32 087 652 024 AFS Licence No. 240984
finanCial REPORT2008-2009

2 | heritage building society limited financial rePort 2008 - 2009
Directors’ Report
Your directors submit their report of the consolidated entity (the "Group"), being Heritage Building Society Limited (the "Society")
and its controlled entities, for the year ended 30 June 2009.
DiRECTORS
The name and details of the directors of the Group in office during the financial year and until the date of this report are:
NAME AND QUALIFICATIONS
Mr Brian R. Carter AM, LLB, HonDUniv, FAICD
Chairman
Mr Carter is a retired Solicitor and a Toowoomba businessman. He served as a Director of Darling Downs Building Society from
1975-81 and was Deputy Chairman in 1980-81. He has been a Director of Heritage since the merger in 1981. He was Deputy
Chairman 1981-82 and has been Chairman of Directors since 1982. Mr Carter is an ex officio member of, and has involvement with,
all Board Committees. Mr Carter has also been Chairman of the Council of the Queensland Institute of Medical Research 1997-
98 and Chairman of the Board of St. Vincent’s Hospital, Toowoomba, 1990-96, and various other organisations. Mr Carter was
appointed a Member in the General Division of the Order of Australia, “For service to business and commerce through the building
society industry, and to the community through health care and medical research organisations”. He was awarded the Centenary
of Federation Medal for distinguished service to the community. Mr Carter was awarded an honorary doctorate at the University
of Southern Queensland for his strong advocacy of the university and his significant contribution to the community through his
voluntary, charitable and sporting contributions.
Mr Graeme G. Kidd BBus (Fin Plan)
Deputy Chairman
Mr Kidd has a background in natural resource administration, real estate agency and valuation, technical education, finance and the
building society industry. He served on the board of Toowoomba Permanent Building Society from 1974 to 1981. He has been a
Director of Heritage Building Society since 1981 and Deputy Chairman since April 1995. Mr Kidd is Chairman of the Audit and
Compliance Committee, a member of the Remuneration and Appointments Committee and a member of the Constitution Review
Committee. He is Chairman of Permanent LMI Pty Limited.
Mr Kerry J. Betros BBus, FCPA, MAICD
Mr Betros is Managing Director of Betros Bros Holdings Pty Ltd and associated companies, Darling Downs based wholesalers and
retailers and Chairman of HBS Custodian Pty Ltd. He has previously served on various other boards and organisations. He has
served on the Heritage Board since 1991. Mr Betros is Chairman of the Society’s Finance Committee. Mr Betros was awarded the
Centenary of Federation Medal for distinguished service to the community.
Mrs Vivienne A. Quinn MAHRI, MRCSA, FAICD
Mrs Quinn is the Managing Director of Quinn & Associates Pty Ltd, a Brisbane-based staff recruitment consultancy which operates
throughout all the eastern states. She has had 30 years in staff recruitment and has a depth of marketing experience. She is also
a partner in a primary production/tourism business on the Southern Downs. Mrs Quinn has served on various Federal and State
Government Boards and on the State Councils of human resource industry bodies. She has served on the Heritage Board since 1995
and is a member of the Audit and Compliance Committee, the Remuneration and Appointments Committee and is Chairman of the
Superannuation Policy Committee.
Dr Dennis P. Campbell PhD, MBA, FCHSE, CHE, FAIM
Dr Campbell is currently the Corporate Division Head of Legal Aid, Queensland, and was previously the Chief Executive Officer of
St. Vincent’s Hospital Toowoomba for ten years. He serves as a member of numerous Boards and Advisory Committees, representing
both public and private health sectors and has legal and health qualifications and is involved in organisational health consulting.
Dr Campbell joined the Heritage Board in 2000 and is a member of the Society's Insurance and Constitution Review Committees
and a director of Permanent LMI Pty Limited and MAP Funds Management Limited. He also serves as a Trustee of the Queensland
Museum Foundation and is Chairperson of the Management Advisory Committee of the Cobb & Co Museum, Toowoomba. In
2007, he was awarded an Australia Day Medallion for his services to the Australian College of Health Service Executives.
heritage building society limited financial rePort 2008 - 2009 | 3
Directors’ Report (continued)
NAME AND QUALIFICATIONS (continued)
Professor Peter Swannell AM, BSc, PhD, HonDUniv, CPEng, FIE Aust
Emeritus Professor Swannell was the Vice-Chancellor and President of the University of Southern Queensland from November 1996
until September 2003 having joined the University as Foundation Professor and Dean of the Faculty of Engineering and Surveying
in 1990. This appointment followed an academic career spanning over 30 years in the United Kingdom and Australia. He has
served as a Chairman and member of a number of Boards and Committees and is currently the Chairman of Empire Theatres Pty
Ltd (since 1999) and the Queensland Museum (since 2008). Professor Swannell joined the Heritage Board in 2003 and is Chairman
of the Insurance Committee and a member of the Finance Committee. He was appointed as a Member in the General Division of
the Order of Australia, “For services to higher education, particularly through the advancement of distance education and on-line
learning opportunities, to engineering as a researcher and teacher, and to the community”. He was also awarded the Centenary of
Federation Medal for services to education, particularly as Vice Chancellor of the University of Southern Queensland.
Ms Susan M. Campbell FCPA, FFTA, FFin, MAICD, BCom, GradDip(SIA), MBA
Ms Campbell was appointed as a Director in 2005 and brings with her a range of finance skills from the banking and financial
services sector. She is managing director of ARGYLL, a specialist financial consulting services firm, and is Heritage's first interstate
director. Ms Campbell is a member of the Finance Committee. She is also active with CPA Australia, AFMA, RMIA and Finsia and
works with many organisations in Australia and Asia in developing their risk management skills. Her previous work has included
working with global banks, corporate treasury and as a senior lecturer at RMIT University.
Mr Brendan P. Baulch BCom, LLB, CA
Mr Baulch is a Chartered Accountant based in Toowoomba. He began his career with Price Waterhouse in their corporate tax
division in Melbourne, after which he spent a total of eight years in London, gaining international accounting experience in a range
of business sectors including telecommunications (Cable & Wireless plc), investment banking (Société Générale) and insurance
(Lloyd’s of London). He is currently the principal of Baulch & Associates, a local accounting practice providing taxation, audit and
management accounting services. Mr Baulch is a registered tax agent and a registered company auditor. He was appointed a Director
in 2007 and is a member of the Audit and Compliance Committee. He is a director of HeritageMAP Pty Ltd.
COMPanY SECRETaRiES
Mr T. William Armagnacq BCom, FCA, FAICD
Company Secretary / Assistant Chief Executive Officer
Mr Armagnacq has been a Secretary of Heritage Building Society Limited since May 2003. From January 1998 to April 2003 he
was company secretary of a number of companies which are part of the Ergon Energy Corporation Limited Group. From July 1989
to December 1997, Mr Armagnacq was a partner of Chartered Accountants, KPMG. He has also been a director of a number of
companies and is currently a director of Permanent LMI Pty Limited.
Mr David Janetzki LLB (Hons), BEcon, AMusA
Assistant Company Secretary / Corporate Lawyer
Mr Janetzki was appointed as a Secretary of Heritage Building Society Limited since October 2007. He is the Society’s
corporate lawyer and is admitted as a solicitor of the Supreme Court of Queensland and the Supreme Court of England and
Wales. He has previously worked as a solicitor for a national law firm and as inhouse counsel for the UK operation of a
Fortune 500 company in London.

4 | heritage building society limited financial rePort 2008 - 2009
Directors’ Report (continued)
PRinCiPal aCTiViTiES
Heritage Building Society Limited is a mutual building society that is incorporated and domiciled in Australia. The principal activity
of the Group during the year was the provision of financial products and services to members. There has been no significant change
in the nature of these activities during the year.
The Group employed 725 employees as at 30 June 2009 (2008 – 698 employees).
REViEW anD RESUlT Of OPERaTiOnS
The operating profit of the Group for the financial year after income tax was $25.504 million (2008 - $20.466 million). The Group's
strong performance was supported by the growth of retail deposits, reduced reliance on securitisation and narrower spreads between
the official cash rate and bank bill rates (impacting the cost of wholesale funds).
The Group reported a 2.8% increase in total consolidated assets to a total of $7.114 billion (2008 - $6.917 billion).
DiRECTORS’ MEETinGS The number of meetings of directors (including meetings of committees) and the number of meetings attended by each director
during the financial year were:
Board Finance Audit and ComplianceRemuneration and
Appointments
Held Attended Held Attended Held Attended Held Attended
Mr Carter AM * 12 12 12 11 5 3 2 2
Mr Kidd 12 12 - - 5 5 2 2
Mr Betros 12 12 12 12 - - - -
Mrs Quinn 12 12 - - 5 5 2 2
Dr Campbell 12 12 - - - - - -
Prof Swannell AM 12 12 12 11 - - - -
Ms Campbell 12 11 12 11 - - - -
Mr Baulch 12 12 - - 5 5 - -
Insurance
Held Attended
Mr Carter AM * 3 1
Mr Kidd - -
Mr Betros - -
Mrs Quinn - -
Dr Campbell 3 3
Prof Swannell AM 3 3
Ms Campbell - -
Mr Baulch - -
The meetings held during the year indicate the number of meetings held
during the period the individual was a director or committee member.
* Mr Carter is an ex officio member, not an appointed member, of the
Audit and Compliance, Finance and Insurance Committees. He attends
only those meetings involving significant issues to the Society.

heritage building society limited financial rePort 2008 - 2009 | 5
SiGnifiCanT CHanGES in THE STaTE Of affaiRS
There was no significant change in the state of affairs of the Group during the year ended 30 June 2009 not otherwise listed in the
report or the financial statements.
SUBSEQUEnT EVEnTS
On 16 July 2009 the Society completed a $400 million Government guaranteed Transferable Certificate of Deposit issue under the
existing wholesale debt program. The proceeds form part of a more diversified funding plan for the new financial year. There are no
other significant events since the end of the financial year which will affect the operating results or state of affairs of the Group in
subsequent years.
liKElY DEVElOPMEnTS anD EXPECTED RESUlTS
A statement on the likely developments in the operations of the Group, and the expected results of these operations has not been
included in the report because, in the opinion of the Directors, it could prejudice the interest of the economic entity.
inDEMnifiCaTiOn anD inSURanCE Of DiRECTORS anD OffiCERS
For the financial year, the Group paid premiums in respect of insurance contracts which insure each person who is or has been a
director or executive officer of the Group against certain liabilities arising in the course of their activities to the Group.
The directors have not included details of the nature of the liabilities covered, or the amount of the premium paid, as such disclosure
is prohibited under the terms of the contract.
aUDiTOR’S inDEPEnDEnCE DEClaRaTiOn
In relation to the Auditor’s Independence, the Directors have sought and received a report that there has been no breaches of the
Auditor Independence requirement of the Corporations Act 2001. The report is shown on page 64.
ROUnDinG
The amounts contained in this report and the financial report have been rounded to the nearest $1,000 (where rounding is
applicable) under the option available to the company under ASIC Class Order 98/0100. The company is an entity to which the
Class Order applies.
Signed in accordance with a resolution of the directors:
TOOWOOMBA BRIAN R. CARTER GRAEME G. KIDD
27 August 2009 Chairman Deputy Chairman
Directors’ Report (continued)

6 | heritage building society limited financial rePort 2008 - 2009
FOR THE YEAR ENDED 30 JUNE 2009Note CONSOLIDATED PARENT
2009
$'000
2008
$'000
2009
$'000
2008
$'000
Interest revenue 3,4 467,417 500,638 503,783 501,628
Interest expense 3,5 (362,948) (414,823) (416,721) (442,233)
Net interest income 104,469 85,815 87,062 59,395
Other income 4 33,045 33,217 48,299 57,250
Gain on Visa Initial Public Offering 4 - 6,460 - 6,460
Total income 137,514 125,492 135,361 123,105
Impairment losses on loans and receivables 5 (2,443) (1,532) (2,443) (1,532)
Other expenses 5 (99,997) (95,412) (97,844) (93,025)
Share of net profit of associates 4 ,828 ,812 ,828 ,812
Profit before tax 35,902 29,360 35,902 29,360
Income tax expense 6 (a) (10,398) (8,894) (10,398) (8,894)
Profit after tax 25,504 20,466 25,504 20,466
income Statement
The accompanying notes form part of these financial statements

heritage building society limited financial rePort 2008 - 2009 | 7
Balance Sheet
AS AT 30 JUNE 2009Note CONSOLIDATED PARENT
2009
$'000
2008
$'000
2009
$'000
2008
$'000
Assets
Cash and cash equivalents 7 29,949 43,739 28,863 43,206
Receivables due from other financial institutions 8 192,036 286,632 130,636 241,632
Other receivables 9 58,245 57,790 58,038 56,855
Loans and receivables 10 6,108,258 6,145,237 6,108,258 6,145,237
Held to maturity financial assets 12 642,551 302,261 642,551 302,261
Investments accounted for using the equity method 13 5,796 6,466 5,796 6,466
Available for sale financial investments 14 4,890 5,455 4,890 5,455
Derivatives 15 (f) 36,829 38,265 32,019 21,812
Other investments 16 - - 347,000 -
Property, plant and equipment 17 23,181 25,153 23,181 25,153
Other assets 18 1,352 1,377 1,352 1,377
Intangibles 19 1,197 254 1,197 254
Retirement benefit asset 23 - 259 - 259
Deferred tax asset 6 (e) 9,257 4,370 4,652 11,541
Total Assets 7,113,541 6,917,258 7,388,433 6,861,508
Liabilities
Deposits and borrowings 20 6,801,584 6,605,443 4,036,664 3,220,291
Accounts payable and other liabilities 21 27,879 25,577 3,042,587 3,353,386
Derivatives 15 (f) 20,820 5,739 20,820 45,569
Current tax liabilities 6 (d) 5,132 3,023 5,132 3,023
Deferred tax liabilities 6 (e) 4,195 12,792 7,555 6,340
Provisions 22 8,117 6,859 8,117 6,859
Retirement benefit liability 23 546 - 546 -
Subordinated debt 24 50,000 57,000 50,000 57,000
Total Liabilities 6,918,273 6,716,433 7,171,421 6,692,468
Net Assets 195,268 200,825 217,012 169,040
Members' Funds
Retained profits 25 (a) 201,773 177,625 201,773 177,625
Reserves 25 (b) (6,505) 23,200 15,239 (8,585)
Total Members' Funds 195,268 200,825 217,012 169,040
The accompanying notes form part of these financial statements

8 | heritage building society limited financial rePort 2008 - 2009
Statement of Recognised income and Expense
FOR THE YEAR ENDED 30 JUNE 2009
Note CONSOLIDATED PARENT
2009
$'000
2008
$'000
2009
$'000
2008
$'000
Actuarial gain / (loss) on defined benefit plan 23 (h) (1,356) (620) (1,356) (620)
Gain / (loss) on cash flow hedge taken to members' funds 25 (b) (40,358) 13,538 34,758 (15,634)
Gain / (loss) on revaluation of Visa shares 25 (b) (577) 2,185 (577) 2,185
Income tax on items taken directly to or transferred
from equity 6 (b) 11,230 (4,820) (10,357) 3,932
Net income / (loss) recognised directly
in members' funds (31,061) 10,283 22,468 (10,137)
Profit for the period 25,504 20,466 25,504 20,466
Total recognised income and expense for the period (5,557) 30,749 47,972 10,329
The accompanying notes form part of these financial statements

heritage building society limited financial rePort 2008 - 2009 | 9
Cash flow Statement
FOR THE YEAR ENDED 30 JUNE 2009
Note CONSOLIDATED PARENT
2009
$'000
2008
$'000
2009
$'000
2008
$'000
Cash flows from operating activities
Interest received 481,888 514,676 300,125 275,800
Dividend received 1,517 - 1,517 -
Borrowing costs and interest paid (379,653) (405,333) (205,885) (194,600)
Other non-interest income received 35,229 33,302 50,451 58,246
Payments to suppliers and employees (100,213) (103,362) (96,677) (103,933)
Income tax paid (10,543) (9,678) (10,543) (9,678)
Net cash flows from operating activities 26 (a) 28,225 29,605 38,988 25,835
Cash flows from investing activities
(Increase) / decrease in investment securities and
receivables due from other financial institutions (245,694) 59,400 (229,294) (35,500)
(Increase) / decrease in loans, receivables and other
receivables 27,090 (557,324) (709,746) (1,244,814)
Net (increase) in other investments (13) - (13) -
Proceeds from sale of Visa shares - 3,669 - 3,669
Proceeds from sale of property, plant and equipment ,285 ,358 ,285 ,358
Acquisition of property, plant and equipment (4,784) (5,853) (4,784) (5,853)
Net cash flows used in investing activities (223,116) (499,750) (943,552) (1,282,140)
Cash flows from financing activities
Increase in deposits and other borrowings 188,101 428,565 822,207 144,612
Proceeds from issuance of subordinated debt - 10,000 - 10,000
Payments for redemption of subordinated debt (7,000) (10,000) (7,000) (10,000)
Proceeds from securitisation of loans - - 83,511 1,038,900
Collections received / (paid) from securitised loans 26 (b) - - (8,497) 33,082
Net cash flows from financing activities 181,101 428,565 890,221 1,216,594
Net (decrease) / increase in cash held (13,790) (41,580) (14,343) (39,711)
Cash - beginning of the year 43,739 85,319 43,206 82,917
Cash - end of the year 26 (c) 29,949 43,739 28,863 43,206
The accompanying notes form part of these financial statements
10 | heritage building society limited financial rePort 2008 - 2009
notes to the financial Statements
1. CORPORaTE infORMaTiOn
The consolidated financial report of the Heritage Building Society Limited and the Special Purpose Vehicles (SPVs) for the year
ended 30 June 2009 was authorised for issue in accordance with a resolution of the directors on 27 August 2009.
The parent entity, Heritage Building Society Limited (the "Society") is a mutual building society that is incorporated and
domiciled in Australia. The nature of operations and principal activities of the Group are described in Note 33.
The SPVs are made up of twelve trust vehicles that have been established for the purpose of securitising the Society's loans
(refer Note 30 for further details). The SPVs have been consolidated as the Society is exposed to the majority of the residual
risk of the trusts and also has the rights to obtain the majority of the benefits of the trusts.
Derecognition of Financial Assets and Financial Liabilities
The Group derecognises a financial asset or financial liability or part thereof where an entity has transferred substantially all the
risks and rewards of that asset or liability. The SPVs assets and liabilities qualify for derecognition in full or in part.
2. SUMMaRY Of SiGnifiCanT aCCOUnTinG POliCiES
(a) Basis of accounting
The financial report is a general purpose financial report, which has been prepared in accordance with the requirements
of the Corporations Act 2001 including applicable Australian Accounting Standards.
The financial report has also been prepared on a historical cost basis, except for derivative financial instruments and
available for sale investments, which have been measured at fair value. The carrying values of recognised assets and
liabilities that are hedged items in fair value hedges, and are otherwise carried at cost, are adjusted to record changes in
the fair values attributable to the risks that are being hedged.
The financial report is presented in Australian dollars and all values are rounded to the nearest thousand dollar ($’000)
unless otherwise stated under the option available to the Group under ASIC Class Order 98/0100.
(b) Statement of compliance
The financial report complies with Australian Accounting Standards as issued by the Australian Accounting Standards
Board and International Financial Reporting Standards as issued by the International Accounting Standards Board.
The following Australian Accounting Standards and Amendments to Australian Accounting Standards have been
identified as those which may impact the Group in the period of initial application. Management are in the process of
assessing the impact of the new standards. The standards are available for early adoption at 30 June 2009, but have not
been applied in preparing this financial report.

heritage building society limited financial rePort 2008 - 2009 | 11
notes to the financial Statements
2. SUMMaRY Of SiGnifiCanT aCCOUnTinG POliCiES (continued)
(b) Statement of compliance (continued)
Reference TitleNature of change to
accounting policy
Application date
of standard*
Application date
for Group
AASB 1039
(Revised)
Concise Reporting Changes to terminology and
descriptions to ensure consistency
with AASB 101.
1 January 2009 1 July 2009
AASB 101
(Revised) AASB
2007-8 and
AASB 2007-10
Presentation of Financial
Statements and
consequential amendments
to other Australian
Accounting Standards
Introduces a statement of
comprehensive income. Other
revisions include impacts on
the presentation of items in the
financial statements.
1 January 2009 1 July 2009
AASB 2008-5 Amendments to Australian
Accounting Standards
arising from the Annual
Improvements Project
The improvements project is
an annual project that provides
a mechanism for making
non-urgent, but necessary
amendments to IFRSs.
I January 2009 1 July 2009
AASB 2008-6 Further Amendments to
Australian Accounting
Standards arising from
the Annual Improvements
Project
This was the second omnibus of
amendments issued by the IASB.
1 July 2009 1 July 2009
AASB 2008-7 Amendments to Australian
Accounting Standards
- Cost of an Investment
in a Subsidiary, Jointly
Controlled Entity or
Associate
The main amendments are those
made to AASB 127 deleting the
"cost method" and requiring all
dividends from a subsidiary,
jointly controlled entity or
associate to be recognised in the
profit of the parent company
accounts.
1 January 2009 1 July 2009
AASB 2009-2 Amendments to
Australian Accounting
Standards - Improving
Disclosures about Financial
Instruments
Main amendments requires
fair value measurements to be
disclosed by the source of inputs.
1 January 2009 1 July 2009
* Application date is for the annual reporting periods beginning on or after the date shown in the above table.

12 | heritage building society limited financial rePort 2008 - 2009
2. SUMMaRY Of SiGnifiCanT aCCOUnTinG POliCiES (continued)
(b) Statement of compliance (continued)
notes to the financial Statements
(c) Basis of consolidation
The consolidated financial statements include those of the Society and the Special Purpose Vehicles (SPVs) relating to
the securitisation of the Society's loans, referred to as the "Group". The SPVs underlying assets, liabilities, revenues,
expenses and cash flows are reported in the Group's balance sheet, income statement and cash flow statement (refer to
Note 30 (c)). Where entities have been acquired during the year, their operating results have been included from the
date of acquisition. All inter-company transactions and balances have been eliminated including any unrealised profit.
(d) Significant accounting judgements, estimates and assumptions
(i) Significant accounting judgements and estimates
In the process of applying the Group's accounting policies, management has made judgements, apart from those
involving estimations, which have had an impact on the amounts recognised in the financial statements. The carrying
amounts of certain assets and liabilities are often determined based on estimates and assumptions of future events.
The key estimates and assumptions that have a significant risk of causing a material adjustment to the carrying amounts
of certain assets and liabilities within the next annual reporting period are:
The following amendments are not applicable to the Group and therefore have no impact.
Reference Title
AASB Int.15 Agreements for the Construction of Real Estate
AASB Int. 16 Hedges of a Net Investment in a Foreign Operation
AASB Int.17
and AASB
2008-13
Distributions of Non-cash Assets to Owners
AASB Int. 18 Transfers of Assets from Customers
AASB 8 and
AASB 2007-3
Operating Segments
AASB 123
(Revised) and
AASB 2007-6
Borrowing Costs
AASB 2008-1 Amendments to Australian Accounting Standard - Share-based Payments
AASB 2008-2 Amendments to Australian Accounting Standard - Puttable Financial Instruments
AASB 3
(Revised)
Business Combinations
AASB 127
(Revised) and
AASB 2008-3
Consolidated and Separate Financial Statements
AASB 2008-8 Amendments to Australian Accounting Standards - Eligible Hedged Items
AASB 2008-9 Amendments to AASB 1049
AASB 2008-11 Amendments to Australian Accounting Standards - Business Combinations Among Not-for-Profit Entities
AASB 2009-1 Amendments to Australian Accounting Standards - Borrowing Costs of Not-for-Profit Entities

heritage building society limited financial rePort 2008 - 2009 | 13
2. SUMMaRY Of SiGnifiCanT aCCOUnTinG POliCiES (continued)
(d) Significant accounting judgements, estimates and assumptions (continued)
(i) Significant accounting judgements and estimates (continued)
Loan provisioning
The Group determines whether loans are impaired on an ongoing basis. This requires an estimation of the value of the
future cash flows. The Group's policy for calculation of loan loss allowance is disclosed in Note 10 and Note 11. Refer
to Note 2 (h).
Building impairment
The carrying value of the building is reviewed for impairment at each reporting date (refer to Note 2 (k) for further
details).
Superannuation defined benefit plan
Various actuarial assumptions are required when determining the Group's superannuation obligations. The Group's
policy on the superannuation defined benefit plan is disclosed in Note 23.
Investments
Where the fair value of investments cannot be derived from active markets they are determined by other valuation
techniques and judgements including consideration of liquidity and discount rates where applicable.
(e) Revenue recognition
(i) Interest income
Revenue is recognised as interest accrues using the effective interest method. This is a method of calculating the
amortised cost of a financial asset, and allocating the interest income over the relevant period using the effective interest
rate, which is the rate that exactly discounts estimated future cash receipts through the expected life of the financial asset
to the net carrying amount of the financial asset.
Payments made to brokers for the introduction of mortgage loan borrowers to the Society are expensed over three years
from the date of payment to match the cost of acquiring the loan to the income derived from it. In line with the effective
interest rate method mortgage commission is reclassified to interest revenue.
Set up costs incurred for securitisation are carried forward and amortised over the period of probable future economic
benefits, approximately four years. In line with the effective interest rate method securitisation establishment costs are
reclassified to interest revenue.
(ii) Dividend income
Revenue is recognised when the Group's right to receive the payment is established.
(iii) Fees and commissions
Fees and commissions that form an integral part of interest are classified as part of interest revenue. Revenue is
recognised as interest accrues using the effective interest method.
(f) Cash and cash equivalents
Cash and short-term deposits in the balance sheet and statement of cash flows comprise cash at bank and in hand and
short-term deposits at call.
(g) Derivative financial instruments and hedging
The Group uses derivative financial instruments such as interest rate, basis and cross currency swaps to hedge its risks
associated with interest rate and currency fluctuations. These instruments are initially recognised at fair value on the date
on which a derivative contract is entered into and are subsequently remeasured to fair value. Derivatives are carried as
assets when their fair value is positive and as liabilities when their fair value is negative.
Any gains or losses arising from changes in the fair value of derivatives, except for those that qualify as effective cash
flow hedges, are taken directly to net profit or loss for the year.
notes to the financial Statements

14 | heritage building society limited financial rePort 2008 - 2009
The fair value of swap contracts is determined by reference to market values for similar instruments.
At the inception of a hedge relationship, the Group formally designates and documents the hedge relationship to which
the Group wishes to apply hedge accounting and the risk management objective and strategy for undertaking the hedge.
The documentation includes identification of the hedging instrument, the hedged item or transaction, the nature of
the risk being hedged and how the entity will assess the hedging instrument's effectiveness in offsetting the exposure
to changes in the hedged item's fair value or cash flows attributable to the hedged risk. Such hedges are expected to
be highly effective in achieving offsetting changes in fair value or cash flows and are assessed on an ongoing basis to
determine that they actually have been highly effective throughout the financial reporting periods for which they were
designated.
Hedges that meet the strict criteria for hedge accounting are accounted for as follows:
(i) Fair value hedges
Fair value hedges are hedges of the Group's exposure to changes in the fair value of a recognised asset or liability. For
fair value hedges, the carrying amount of the hedged item is adjusted for gains and losses attributable to the risk being
hedged. The derivative is remeasured to fair value and gains and losses from both are taken to profit or loss.
(ii) Cash flow hedges
Cash flow hedges are hedges of the Group's exposure to variability in cash flows that is attributable to a particular risk
associated with a recognised asset or liability. The effective portion of the gain or loss on the hedging instrument is
recognised directly in equity, while the ineffective portion is recognised in profit or loss.
Amounts taken to equity are transferred to the income statement when the hedged transaction affects profit or loss, such
as when hedged income or expenses are recognised.
Refer to Note 2 (l) for further detail.
(h) Loan provisioning
Loan impairment will only be recognised when objective evidence is available that a loss event has occurred and as a
consequence it is not likely that all amounts owed will be received. Outlined below are the relevant accounting policies.
Specific provision
A specific provision is raised for losses that may be incurred for individual loans that are known to be impaired by
assessing the recoverability against the security value.
Collective provision
Loans that are not known to be impaired are grouped together according to their risk characteristics and are then
assessed for impairment. Based on historical loss data and current available information for assets with similar risk
characteristics, the appropriate collective provision is raised. From the analysis performed, the provision has been
consistent with the historical level of bad debts experienced in those portfolios. The provision has been increased to
reflect the impact of the deterioration in the economic conditions of the current environment.
Impairment losses
Impairment losses are written off in the year in which they are recognised. If a provision for impairment has been
recognised in relation to the loan, write-offs are made against the provision. If no provision for impairment has
previously been recognised, write-offs for impairment losses are recognised as expenses in the profit before tax.
(i) Income tax
Deferred income tax liabilities are recognised for all taxable temporary differences except:
- when the deferred income tax liability arises from the initial recognition of goodwill or of an asset or liability in a
transaction that is not a business combination and that, at the time of the transaction, affects neither the accounting
profit nor taxable profit or loss; or
2. SUMMaRY Of SiGnifiCanT aCCOUnTinG POliCiES (continued)
(g) Derivative financial instruments and hedging (continued)
notes to the financial Statements
heritage building society limited financial rePort 2008 - 2009 | 15
- when the taxable temporary difference is associated with investments in subsidiaries, associates or interests in joint
ventures, and the timing of the reversal of the temporary difference can be controlled and it is probable that the
temporary difference will not reverse in the foreseeable future.
Deferred income tax assets are recognised for all deductible temporary differences, to the extent that it is probable that
taxable profit will be available against the deductible temporary differences, except:
- when the deferred income tax asset relating to the deductible temporary differences arises from the initial recognition
of an asset or liability in a transaction that is not a business combination and, at the time of the transaction, affects
neither the accounting profit nor taxable profit or loss; or
- when the deductible temporary difference is associated with investments in subsidiaries, associates or interests in
joint ventures, in which case a deferred tax asset is only recognised to the extent that it is probable that the temporary
difference will reverse in the foreseeable future and taxable profit will be available against which temporary differences
can be utilised.
Tax effect accounting is applied using the balance sheet method whereby deferred income tax is provided on all
temporary differences at the balance sheet date between the tax bases of assets and liabilities and their carrying amounts
for financial reporting purposes.
Deferred income tax assets and liabilities are measured at the tax rates that are expected to apply to the year when the
asset is realised or the liability is settled, based on the tax rates that have been enacted at the balance sheet date.
The carrying amount of deferred income tax assets is reviewed at each balance sheet date and reduced to the extent that
it is no longer probable that sufficient taxable profit will be available to allow all or part of the deferred income tax asset
to be utilised.
Unrecognised deferred income tax assets are reassessed at each balance sheet date and are recognised to the extent that it
has become probable that future taxable profit will be available to allow all or part of the deferred income tax asset to be
utilised.
(j) Goods and Services Tax (GST)
Revenues, expenses and assets are recognised net of the amount of GST, except where the amount of GST incurred is
not recoverable from the Australian Taxation Office. In these circumstances the GST is recognised as part of the cost of
acquisition of the asset or as part of an item of the expense. Receivables and payables in the balance sheet are shown
inclusive of GST.
(k) Property, plant and equipment
Plant and equipment is stated at cost less accumulated depreciation and any accumulated impairment losses.
Land and buildings are measured at cost less accumulated depreciation on buildings. An impairment loss is recognised
for the amount by which the asset's carrying value exceeds its recoverable amount.
Depreciation is calculated on a straight-line basis over the estimated useful life of the assets as follows:
Building units - 40 years
Leasehold improvements - the lease term
Plant and equipment - 3 to 8 years
(i) Impairment
The carrying values of plant and equipment are reviewed for impairment at each reporting date, with recoverable
amounts being estimated when events or changes in circumstance indicate the carrying value may be impaired.
An impairment loss exists when the carrying value of an asset or cash-generating units exceed its estimated recoverable
amount. The asset or cash-generating unit is then written down to its recoverable amount.
2. SUMMaRY Of SiGnifiCanT aCCOUnTinG POliCiES (continued)
(i) Income tax (continued)
notes to the financial Statements

16 | heritage building society limited financial rePort 2008 - 2009
(l) Classification of financial assets and financial instruments
(i) Financial instruments (derivatives)
Those derivatives that the Group is not applying hedge accounting are classified as 'held for trading' financial assets.
These are measured at fair value, with fair value changes charged to the profit or loss. Those derivatives where the Group
is applying hedge accounting are designated and qualify as either cash flow hedges or fair value hedges. The various
derivatives entered into are as follows:
(a) Cash flow hedge of variable rate liabilities
The Group's policy is to enter into pay fixed / receive floating swaps with approved external counterparties to mitigate
against variability in cash flows of a portfolio of floating rate liabilities.
(b) Cash flow hedge of variable rate assets
The Group's policy is to enter into pay floating / receive fixed swaps to counteract against variability in cash flows of a
portfolio of floating rate assets.
(c) Cash flow hedge of Euro denominated notes
The Group's policy is to enter into a cross currency swap to effectively convert the floating Euro denominated debt to
floating Australian dollar debt.
(ii) Financial assets
Financial assets are classified into one of the following categories:
Loans and receivables
These are non-derivative financial assets with fixed or determinable payments that are not quoted in an active market.
These assets are carried at amortised cost using the effective interest method.
Held to maturity financial assets
These are non-derivative financial assets with fixed or determinable payments and fixed maturity and where the Group
has the positive intention and ability to hold to maturity. These assets are measured at amortised cost using the effective
interest method less any impairment.
Available for sale financial investments
These are those non-derivative financial assets that are not classified in any of the above categories. After initial
measurement, available for sale financial investments are subsequently measured at fair value or cost where the fair
value is unable to be measured reliably. Unrealised gains and losses are recognised directly in equity in the available
for sale reserve.
(m) Employee benefits
Provision has been made for the liability to pay annual leave for all employees at the remuneration rates which
are expected to be paid when the liability is settled. Provision for the liability to pay long service leave is made
for all employees from their date of commencement at discounted expected future values in accordance with
AASB 119 Employee Benefits.
In accordance with AASB 119 the net position of the defined benefit plan is recognised on the balance sheet. Any gains
or losses with the exception of the actuarial gain or loss, arising from changes in the net position between reporting
periods is recognised through the profit and loss account. Actuarial gains or losses are recognised directly through
retained earnings and disclosed in the statement of recognised income and expense.
(n) Provision for directors' retiring allowance
Provision has been made for all directors in accordance with Rule 34.11.4.2 of the Constitution of the Society. The
retiring allowance is calculated as one-fourth of the aggregate amount of directors' fees which have been approved at the
annual general meeting. All or part of this retiring allowance can be paid to a complying superannuation fund.
2. SUMMaRY Of SiGnifiCanT aCCOUnTinG POliCiES (continued)
notes to the financial Statements

heritage building society limited financial rePort 2008 - 2009 | 17
(o) Make good provision and asset
A provision is made for the anticipated costs of restoring leased premises at the end of the leased term that reflects
the present obligation to restore the premises. The estimate of the costs has been calculated by reviewing current and
historical defit costs and calculating an average cost per square metre. A cost per branch has been calculated depending
on its size. A provision and asset has then been recorded to reflect the cost at the end of each lease term. The asset is
amortised over the lease term. Both the asset and liability is reassessed at the end of each financial year to account for
new, amended and expired leases.
(p) Intangible assets
Intangible assets include the value of computer software which are measured on initial recognition at cost. Following
initial recognition, intangible assets are carried at cost less any accumulated amortisation and impairment losses.
Amortisation is calculated on the straight line basis over 3 years.
(q) Leasing
The determination of whether an arrangement is a lease, or it contains a lease, is based on the substance of the
arrangement and requires an assessment of whether the fulfilment of the arrangement is dependent on the use of a
specific asset or assets and the arrangement conveys a right to use the asset.
Leases which do not transfer to the Society substantially all the risks and benefits incidental to ownership of the leased
items are operating leases. Operating lease payments are recognised as an expense in the income statement on a straight
line basis over the lease term.
(r) Accounting for associates
An associate is an entity over which the Group has significant influence and that is neither a subsidiary nor an interest
in a joint venture. Significant influence is the power to participate in the financial and operating policy decisions of the
investee. The results and assets and liabilities of associates are incorporated using the equity method of accounting.
(s) Guarantees
Guarantees are issued to third parties by the Society. These guarantees are fully secured by a member's term deposit or
other form of security.
2. SUMMaRY Of SiGnifiCanT aCCOUnTinG POliCiES (continued)
notes to the financial Statements

18 | heritage building society limited financial rePort 2008 - 2009
notes to the financial StatementsC
ON
SOL
IDA
TE
DP
AR
EN
T
Ave
rage
bal
ance
Inte
rest
Ave
rage
in
tere
st r
ate
Ave
rage
bal
ance
Inte
rest
Ave
rage
in
tere
st r
ate
2009
2008
2009
2008
2009
2008
2009
2008
2009
2008
2009
2008
$'00
0$'
000
$'00
0$'
000
%%
$'00
0$'
000
$'00
0$'
000
%%
The
follo
win
g ta
bles
sho
w t
he
aver
age
bala
nce
for
each
maj
or
cate
gory
of i
nter
est-
bear
ing
asse
ts a
nd li
abili
ties
, the
amou
nt o
f int
eres
t re
venu
e or
expe
nse
on a
net
bas
is a
nd t
he
aver
age
inte
rest
rat
e. A
ll av
erag
es
are
mon
th-e
nd a
vera
ges
and
are
repr
esen
tati
ve o
f the
Gro
up's
oper
atio
ns d
urin
g th
e ye
ar.
Fin
anci
al A
sset
s
Dep
osit
s an
d in
vest
men
t se
curi
ties
849
,521
6
95,0
03
43,
997
48,
766
5.1
8 7.
02 7
94,9
48
624
,723
4
0,86
6 4
2,90
3 5.
146.
87
Loan
s an
d re
ceiv
able
s 5
,983
,343
5
,987
,353
4
26,3
27
452
,600
7
.13
7.56
5,9
83,3
43
5,9
87,3
53
431
,277
4
57,9
66
7.21
7.65
Inte
rest
rat
e sw
aps
304
,067
1
,467
,777
1
1,36
2 1
4,07
7 N
/AN
/A 1
,475
,368
1
,467
,777
4
5,90
9 1
5,56
4 N
/AN
/A
Add
: Loa
n ap
plic
atio
n di
rect
re
venu
e -
-
2,6
38
3,8
13
N/A
N/A
- -
2
,638
3
,813
N
/AN
/A
Less
: Com
mis
sion
and
age
nt
dire
ct c
osts
- -
(1
4,90
5)(1
6,34
1)N
/AN
/A -
-
(14,
905)
(16,
341)
N/A
N/A
Less
: Sec
urit
isat
ion
es
tabl
ishm
ent
cost
s -
-
(2,0
02)
(2,2
77)
N/A
N/A
- -
(2
,002
)(2
,277
)N
/AN
/A
7,1
36,9
31
8,1
50,1
33
467
,417
5
00,6
38
8,2
53,6
59
8,0
79,8
53
503
,783
5
01,6
28
Fin
anci
al L
iabi
liti
es
Dep
osit
s 3
,566
,520
3
,182
,354
1
66,5
14
164
,590
4
.67
5.17
3,5
66,5
20
3,1
82,3
54
171
,604
1
71,1
02
4.81
5.38
Subo
rdin
ated
deb
t 5
0,54
6 5
7,00
0 3
,126
4
,632
6
.18
8.13
50,
546
57,
000
3,1
26
4,6
32
6.18
8.13
Inte
rest
bea
ring
not
es 3
,137
,397
3
,274
,306
1
76,4
89
243
,575
5
.63
7.44
- -
-
-
- -
Inte
rest
rat
e sw
aps
822
,377
2
12,3
07
16,
819
2,0
26
N/A
N/A
1,2
58,8
07
1,9
86,9
02
24,
220
26,
722
N/A
N/A
Inte
r en
tity
inte
rest
exp
ense
- -
-
-
- -
2
,849
,789
3
,181
,550
2
17,7
71
239
,777
N
/AN
/A
7,5
76,8
40
6,7
25,9
67
362
,948
4
14,8
23
7,7
25,6
62
8,4
07,8
06
416
,721
4
42,2
33
3.
inT
ER
ES
T R
EV
En
UE
an
D i
nT
ER
ES
T E
XP
En
SE
heritage building society limited financial rePort 2008 - 2009 | 19
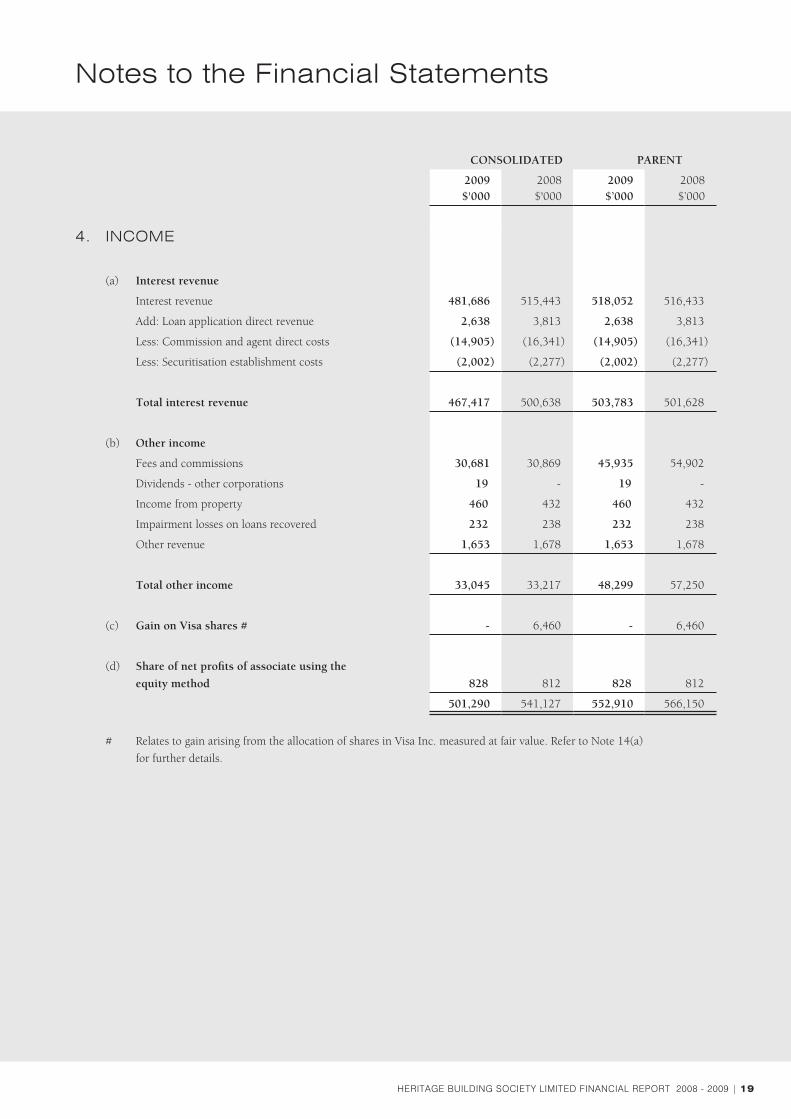
4. inCOME
(a) Interest revenue
Interest revenue 481,686 515,443 518,052 516,433
Add: Loan application direct revenue 2,638 3,813 2,638 3,813
Less: Commission and agent direct costs (14,905) (16,341) (14,905) (16,341)
Less: Securitisation establishment costs (2,002) (2,277) (2,002) (2,277)
Total interest revenue 467,417 500,638 503,783 501,628
(b) Other income
Fees and commissions 30,681 30,869 45,935 54,902
Dividends - other corporations 19 - 19 -
Income from property 460 432 460 432
Impairment losses on loans recovered 232 238 232 238
Other revenue 1,653 1,678 1,653 1,678
Total other income 33,045 33,217 48,299 57,250
(c) Gain on Visa shares # - 6,460 - 6,460
(d) Share of net profits of associate using the
equity method 828 812 828 812
501,290 541,127 552,910 566,150
# Relates to gain arising from the allocation of shares in Visa Inc. measured at fair value. Refer to Note 14(a)
for further details.
CONSOLIDATED PARENT
2009$'000
2008 $'000
2009$’000
2008 $’000
notes to the financial Statements
20 | heritage building society limited financial rePort 2008 - 2009
notes to the financial Statements
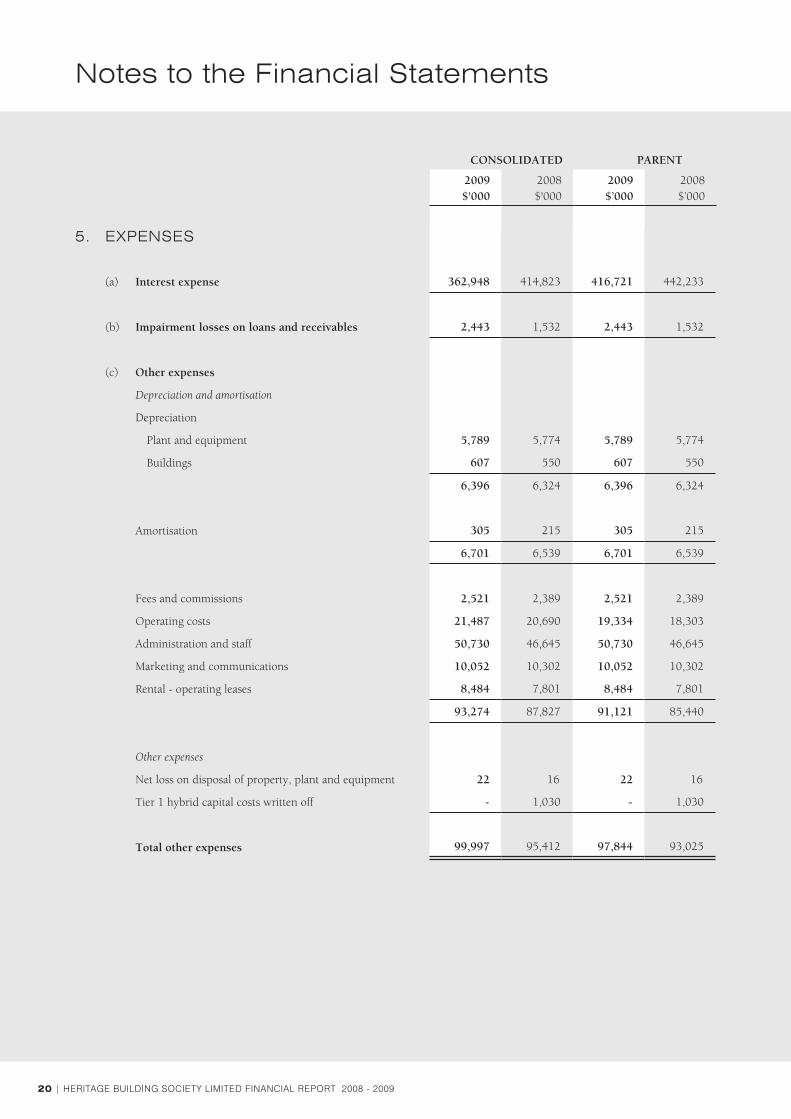
5. EXPEnSES
(a) Interest expense 362,948 414,823 416,721 442,233
(b) Impairment losses on loans and receivables 2,443 1,532 2,443 1,532
(c) Other expenses
Depreciation and amortisation
Depreciation
Plant and equipment 5,789 5,774 5,789 5,774
Buildings ,607 ,550 ,607 ,550
6,396 6,324 6,396 6,324
Amortisation ,305 ,215 ,305 ,215
6,701 6,539 6,701 6,539
Fees and commissions 2,521 2,389 2,521 2,389
Operating costs 21,487 20,690 19,334 18,303
Administration and staff 50,730 46,645 50,730 46,645
Marketing and communications 10,052 10,302 10,052 10,302
Rental - operating leases 8,484 7,801 8,484 7,801
93,274 87,827 91,121 85,440
Other expenses
Net loss on disposal of property, plant and equipment 22 16 22 16
Tier 1 hybrid capital costs written off - 1,030 - 1,030
Total other expenses 99,997 95,412 97,844 93,025
CONSOLIDATED PARENT
2009$'000
2008 $'000
2009$’000
2008 $’000
heritage building society limited financial rePort 2008 - 2009 | 21
CONSOLIDATED PARENT
2009$'000
2008 $'000
2009$’000
2008 $’000
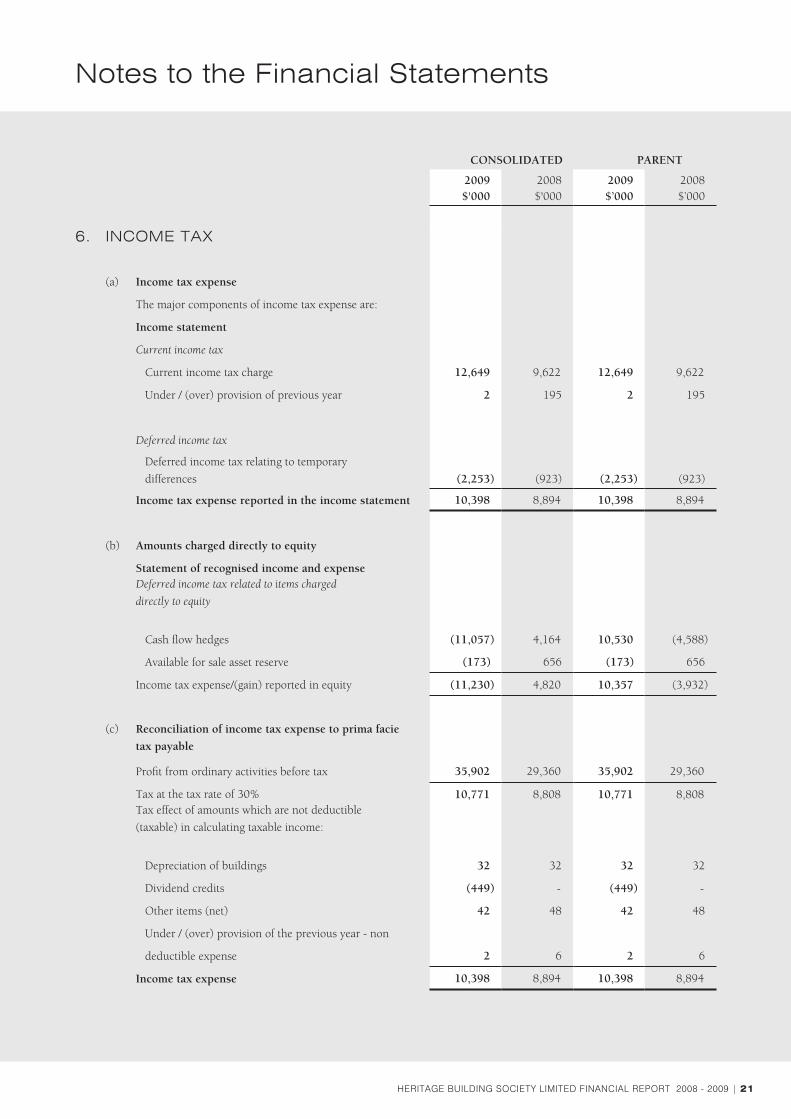
6. inCOME TaX
(a) Income tax expense
The major components of income tax expense are:
Income statement
Current income tax
Current income tax charge 12,649 9,622 12,649 9,622
Under / (over) provision of previous year 2 195 2 195
Deferred income tax
Deferred income tax relating to temporary
differences (2,253) (923) (2,253) (923)
Income tax expense reported in the income statement 10,398 8,894 10,398 8,894
(b) Amounts charged directly to equity
Statement of recognised income and expenseDeferred income tax related to items charged
directly to equity
Cash flow hedges (11,057) 4,164 10,530 (4,588)
Available for sale asset reserve (173) 656 (173) 656
Income tax expense/(gain) reported in equity (11,230) 4,820 10,357 (3,932)
(c) Reconciliation of income tax expense to prima facie
tax payable
Profit from ordinary activities before tax 35,902 29,360 35,902 29,360
Tax at the tax rate of 30% 10,771 8,808 10,771 8,808 Tax effect of amounts which are not deductible
(taxable) in calculating taxable income:
Depreciation of buildings 32 32 32 32
Dividend credits (449) - (449) -
Other items (net) 42 48 42 48
Under / (over) provision of the previous year - non
deductible expense 2 6 2 6
Income tax expense 10,398 8,894 10,398 8,894
notes to the financial Statements

22 | heritage building society limited financial rePort 2008 - 2009
notes to the financial Statements
6. inCOME TaX (continued)
(d) Current tax liability 5,132 3,023 5,132 3,023
(e) Recognised deferred tax assets and liabilities
Deferred tax asset 9,257 4,370 4,652 11,541
Deferred tax liability 4,195 12,792 7,555 6,340
Deferred income tax at 30 June relates to the following:
CONSOLIDATED Balance Sheet Income Statement
2009$'000
2008 $'000
2009$’000
2008 $’000
Deferred tax assets
Amounts recognised in profit and loss:
Employee benefits 2,044 1,687 (357) (213)
Provision for impairment 1,086 736 (350) (99)
Other provisions 633 1,101 468 (42)
Other 889 846 (43) 59
Total deferred tax assets 4,652 4,370 (282) (295)
Amounts recognised directly in equity:
Cash flow hedges 4,605 -
Total deferred tax assets 9,257 4,370
Deferred tax liabilities
Amounts recognised in profit and loss:
Loan costs 1,965 2,705 (740) 68
Fixed assets 61 1,181 (1,120) (904)
Investment in associate 1,206 1,407 (201) 94
Defined benefit fund asset 363 198 165 104
Other 118 193 (75) 10
3,713 5,684 (1,971) (628)
Total deferred tax expense (2,253) (923)
Amounts recognised directly in equity:
Cash flow hedges - 6,452
Available for sale asset reserve 483 656
Total deferred tax liabilities 4,196 12,792
CONSOLIDATED PARENT
2009$'000
2008 $'000
2009$’000
2008 $’000

heritage building society limited financial rePort 2008 - 2009 | 23
6. inCOME TaX (continued)(e) Recognised deferred tax assets and liabilities (continued)
PARENT
Deferred tax assets
Amounts recognised in profit and loss:
Employee benefits 2,044 1,687 (357) (213)
Provision for impairment 1,086 736 (350) (99)
Other provisions 633 1,101 468 (42)
Other 889 846 (43) 59
Total deferred tax assets 4,652 4,370 (282) (295)
Amounts recognised directly in equity:
Cash flow hedges - 7,171
Total deferred tax assets 4,652 11,541
Deferred tax liabilities
Amounts recognised in profit and loss:
Loan costs 1,965 2,705 (740) 68
Fixed assets 61 1,181 (1,120) (904)
Investment in associate 1,206 1,407 (201) 94
Defined benefit fund asset 363 198 165 104
Other 118 193 (75) 10
3,713 5,684 (1,971) (628)
Total deferred tax expense (2,253) (923)
Amounts recognised directly in equity:
Cash flow hedges 3,359 -
Available for sale asset reserve 483 656
Total deferred tax liabilities 7,555 6,340
Balance Sheet Income Statement
2009$'000
2008 $'000
2009$’000
2008 $’000
notes to the financial Statements

24 | heritage building society limited financial rePort 2008 - 2009
notes to the financial Statements
7. CaSH anD CaSH EQUiValEnTS
Cash at bank and on hand (a) 29,949 23,739 28,863 23,206
Deposits at call (b) - 20,000 - 20,000
29,949 43,739 28,863 43,206
(a) Cash at bank and on hand
These are interest and non-interest bearing.
(b) Deposits at call
The deposits are bearing a floating interest rate comparable to the cash rate of 3.00% (2008 - 7.25%).
These deposits mature on a daily basis.
CONSOLIDATED PARENT
2009$'000
2008 $'000
2009$’000
2008 $’000
8. RECEiVaBlES DUE fROM OTHER finanCial inSTiTUTiOnS
Interest earning deposits (b) 168,287 266,225 106,887 221,225
Deposits with other authorised deposit-taking institutions 23,749 20,407 23,749 20,407
192,036 286,632 130,636 241,632
Maturity analysis
At call 58,887 35,225 58,887 35,225
No longer than 3 months 109,400 201,000 48,000 156,000
Longer than 3 and not longer than 12 months - 30,000 - 30,000
No maturity specified (c) 23,749 20,407 23,749 20,407
192,036 286,632 130,636 241,632
(a) Impairment losses
No impairment losses have been recognised during the year on the receivables due from other
financial institutions (2008 - nil).
(b) Interest earning deposits
The weighted average effective interest rate for the interest earning deposits is disclosed in Note 15 (f).
(c) Deposits with other authorised deposit-taking institutions
The deposits with other authorised deposit-taking institutions do not have a specified maturity date.
They are carried at amortised cost.
9. OTHER RECEiVaBlES
Interest receivable 6,334 6,385 5,995 5,690
Securitisation deposits 50,700 46,968 50,700 46,968
Other 1,211 4,437 1,343 4,197
58,245 57,790 58,038 56,855
(a) Impairment losses
No impairment losses have been recognised during the year for other receivables (2008 - nil).

heritage building society limited financial rePort 2008 - 2009 | 25
CONSOLIDATED PARENT
2009$'000
2008 $'000
2009$’000
2008 $’000
10. lOanS anD RECEiVaBlES
Credit cards 67,561 67,544 67,561 67,544
Term loans 3,046,005 2,771,618 3,046,005 2,771,618
Securitised loans 2,987,592 3,293,577 2,987,592 3,293,577
Other 397 600 397 600
Related parties 1,973 1,815 1,973 1,815
6,103,528 6,135,154 6,103,528 6,135,154
Provision for impairment (3,621) (2,453) (3,621) (2,453)
Add: Securitisation establishment costs 1,802 3,519 1,802 3,519
Add: Broker commission 6,549 9,017 6,549 9,017
Net loans and advances 6,108,258 6,145,237 6,108,258 6,145,237
(a) Aggregate amounts receivable from related parties
Key management personnel 1,973 1,815 1,973 1,815
Provision for impairment - - - -
1,973 1,815 1,973 1,815
(b) Maturity analysis
At call 397 600 397 600
Not longer than 3 months 389,420 372,330 389,420 372,330
Longer than 3 and not longer than 12 months 129,631 100,907 129,631 100,907
Longer than 1 and not longer than 5 years 843,631 566,858 843,631 566,858
Longer than 5 years 4,740,449 5,094,459 4,740,449 5,094,459
6,103,528 6,135,154 6,103,528 6,135,154
(c) Concentration of risk
The loan portfolio of the Group does not include any loan or groups of related loans which represent
10% or more of capital.
notes to the financial Statements
26 | heritage building society limited financial rePort 2008 - 2009
notes to the financial Statements
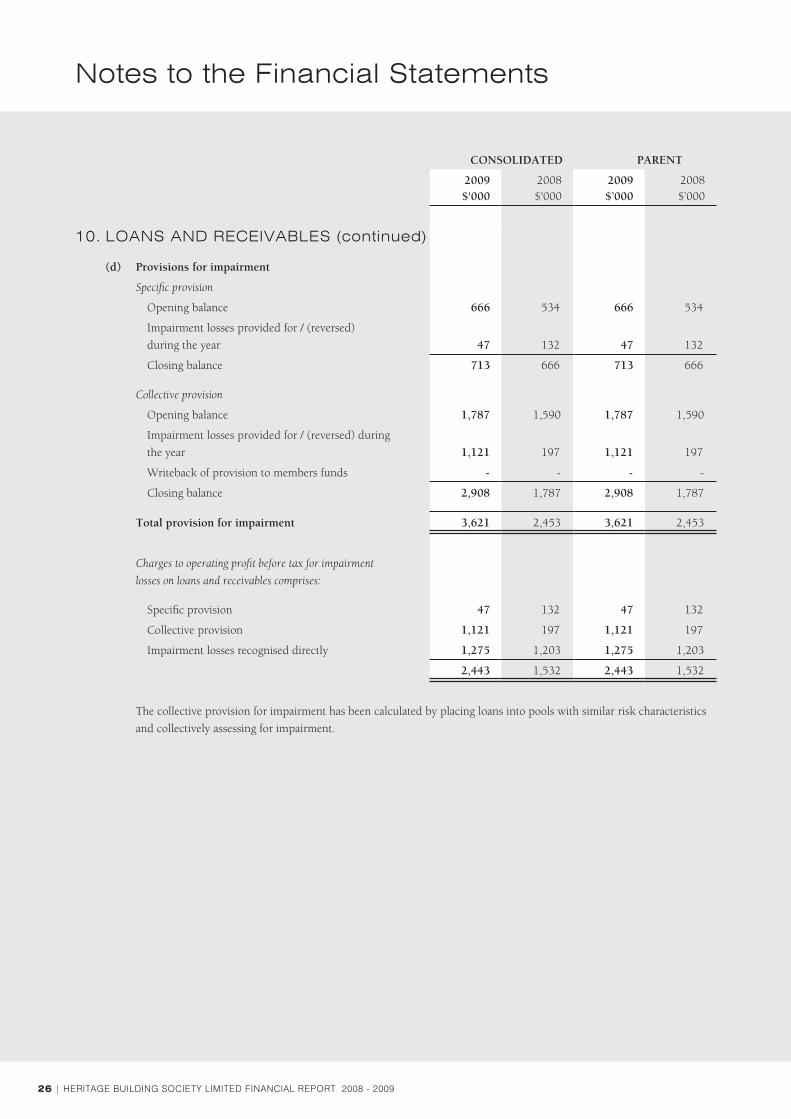
10. lOanS anD RECEiVaBlES (continued)
(d) Provisions for impairment
Specific provision
Opening balance 666 534 666 534
Impairment losses provided for / (reversed)
during the year 47 132 47 132
Closing balance 713 666 713 666
Collective provision
Opening balance 1,787 1,590 1,787 1,590
Impairment losses provided for / (reversed) during
the year 1,121 197 1,121 197
Writeback of provision to members funds - - - -
Closing balance 2,908 1,787 2,908 1,787
Total provision for impairment 3,621 2,453 3,621 2,453
Charges to operating profit before tax for impairment
losses on loans and receivables comprises:
Specific provision 47 132 47 132
Collective provision 1,121 197 1,121 197
Impairment losses recognised directly 1,275 1,203 1,275 1,203
2,443 1,532 2,443 1,532
The collective provision for impairment has been calculated by placing loans into pools with similar risk characteristics
and collectively assessing for impairment.
CONSOLIDATED PARENT
2009$'000
2008 $'000
2009$’000
2008 $’000

heritage building society limited financial rePort 2008 - 2009 | 27
CONSOLIDATED PARENT
2009$'000
2008 $'000
2009$’000
2008 $’000
11. iMPaiRMEnT Of lOanS anD RECEiVaBlES
The policy covering impaired loans and receivables is set out
in Note 2.
Total impaired assets
Gross loans no longer accruing interest 3,053 3,719 3,053 3,719
Less individually assessed provisions for impairment (713) (666) (713) (666)
Total net impaired assets 2,340 3,053 2,340 3,053
Restructured loans
Balance - - - -
- - - -
Assets acquired through enforcement of security
Balance - - - -
- - - -
Past due loans
Balance 4,437 3,412 4,437 3,412
Interest revenue foregone on past due/impaired
and restructured loans 76 77 76 77
Net fair value of assets acquired through the
enforcement of security through the financial year - - - -
12. HElD TO MaTURiTY finanCial aSSETS
Bank debt securities 449,436 282,890 449,436 282,890
Government securities 176,976 - 176,976 -
Asset backed debt securities 16,139 19,371 16,139 19,371
642,551 302,261 642,551 302,261
Maturity analysis
No longer than 3 months 421,457 231,958 421,457 231,958
Longer than 3 and not longer than 12 months 120,772 12,675 120,772 12,675
Longer than 1 and not longer than 5 years 95,880 51,947 95,880 51,947
Over 5 years 4,442 5,681 4,442 5,681
642,551 302,261 642,551 302,261
(a) Impairment losses
No impairment losses have been recognised during the year on held to maturity financial assets (2008 - nil).
The fair value of the securities is $648,555,000 including accrued interest of $4,759,000 (2008 - $305,080,000
including accrued interest of $2,645,000).
notes to the financial Statements

28 | heritage building society limited financial rePort 2008 - 2009
notes to the financial Statements
13. inVESTMEnTS aCCOUnTED fOR USinG THE EQUiTY METHOD
Investment in associate 5,796 6,466 5,796 6,466
Interest in associate OWNERSHIP INTEREST HELD BY THE SOCIETY
Balance date 31 December 49.9% 49.9% 49.9% 49.9%
Share of associate's balance sheet:
Current assets 9,684 11,037 9,684 11,037
Non-current assets 3,086 2,707 3,086 2,707
12,770 13,744 12,770 13,744
Current liabilities 1,871 3,132 1,871 3,132
Non-current liabilities 4,605 4,146 4,605 4,146
6,476 7,278 6,476 7,278
Net assets 6,294 6,466 6,294 6,466
Share of associate's profit or loss:
Revenue 2,567 3,377 2,567 3,377
Profit / (loss) before income tax 1,182 1,170 1,182 1,170
Income tax expense (354) (358) (354) (358)
Profit / (loss) after income tax 828 812 828 812
Investment in associate:
During the year, the group has received dividend payments of $1,497,600.
No significant event or transaction has occurred between the date of Permanent LMI Pty Ltd financial statements as at
31 December 2008 and that of the Group that would require adjustment to the Group's financial statements.
CONSOLIDATED PARENT
2009$'000
2008 $'000
2009$’000
2008 $’000
heritage building society limited financial rePort 2008 - 2009 | 29
CONSOLIDATED PARENT
2009$'000
2008 $'000
2009$’000
2008 $’000
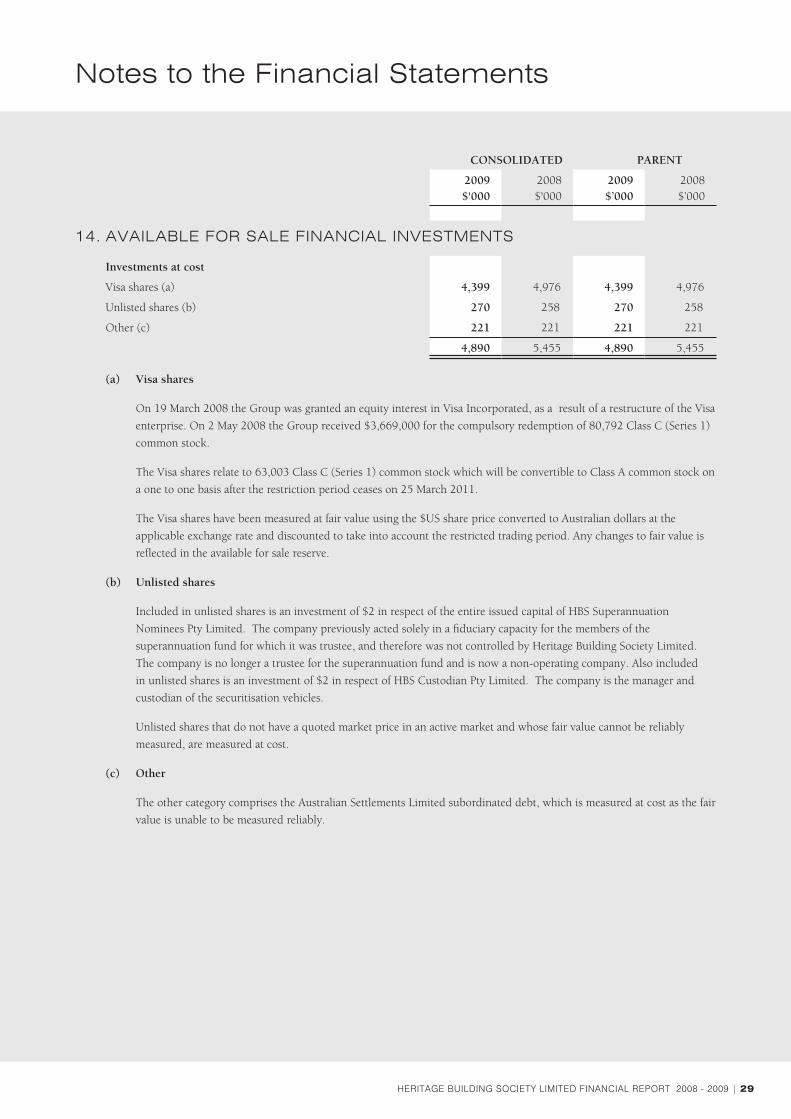
14. aVailaBlE fOR SalE finanCial inVESTMEnTS
Investments at cost
Visa shares (a) 4,399 4,976 4,399 4,976
Unlisted shares (b) 270 258 270 258
Other (c) 221 221 221 221
4,890 5,455 4,890 5,455
(a) Visa shares
On 19 March 2008 the Group was granted an equity interest in Visa Incorporated, as a result of a restructure of the Visa
enterprise. On 2 May 2008 the Group received $3,669,000 for the compulsory redemption of 80,792 Class C (Series 1)
common stock.
The Visa shares relate to 63,003 Class C (Series 1) common stock which will be convertible to Class A common stock on
a one to one basis after the restriction period ceases on 25 March 2011.
The Visa shares have been measured at fair value using the $US share price converted to Australian dollars at the
applicable exchange rate and discounted to take into account the restricted trading period. Any changes to fair value is
reflected in the available for sale reserve.
(b) Unlisted shares
Included in unlisted shares is an investment of $2 in respect of the entire issued capital of HBS Superannuation
Nominees Pty Limited. The company previously acted solely in a fiduciary capacity for the members of the
superannuation fund for which it was trustee, and therefore was not controlled by Heritage Building Society Limited.
The company is no longer a trustee for the superannuation fund and is now a non-operating company. Also included
in unlisted shares is an investment of $2 in respect of HBS Custodian Pty Limited. The company is the manager and
custodian of the securitisation vehicles.
Unlisted shares that do not have a quoted market price in an active market and whose fair value cannot be reliably
measured, are measured at cost.
(c) Other
The other category comprises the Australian Settlements Limited subordinated debt, which is measured at cost as the fair
value is unable to be measured reliably.
notes to the financial Statements

30 | heritage building society limited financial rePort 2008 - 2009
notes to the financial Statements
15. finanCial inSTRUMEnTS anD RiSK ManaGEMEnT
(a) Risk management framework
The Board and Management of the Society are responsible for implementing a risk management process to limit risks to
prudent levels. The Finance Committee and Audit & Compliance Committee have been established by the Board to develop
and monitor risk management policies within their specific areas.
The Society’s risk management policy and supporting framework are in place to enable the risks faced by the Society to be
identified and analysed, evaluated, and monitored over time. Risk management policies are reviewed regularly to reflect
changes from sources both internal and external to the Society.
The Audit & Compliance Committee is responsible for monitoring compliance with the Society’s risk management policies
and procedures, and reviewing the adequacy of the risk management framework. The Audit & Compliance Committee is
assisted in this role by Internal Audit. Internal Audit perform reviews of risk management processes and controls, reporting
the results to the Audit & Compliance Committee.
The Society has exposure to the following risks from its use of financial instruments:
Credit risk
Liquidity risk
Market risks
Operational risks
(b) Nature and details of the financial instruments
The economic entity’s accounting policies, including the terms and conditions of each class of financial asset, financial
liability and equity instrument at the balance date, are as follows:
Recognised financial instruments
Notes Criteria for recognition and basis for measurement
Nature and details of the financial instruments
(i) Financial assets
Cash, cash equivalents and receivables due from other financial institutions
7, 8 Measured at amortised cost. Cash, cash equivalents and receivables due from other financial institutions are represented by physical cash, overnight deposits, term deposits and deposits with other authorised deposit-taking institutions.
Other receivables 9 Interest receivable is accrued income on investments and loans. Securitisation deposits are measured at fair value. Other receivables are presented in sundry debtors and are carried at amortised cost.
For certificates of deposit, interest is paid at the time of rate reset (normally three months).
Loans and receivables 10 The loan interest is calculated on the daily balance outstanding and is charged in arrears to a customer’s account. The effective interest rate method has been adopted to calculate the amortised cost of loans and receivables.
All housing loans are secured by registered mortgages. The remaining loans are assessed for impairment on an individual basis. Details of maturity terms are set out in Note 10.
Held to maturity financial assets
12 The investments are carried at amortised cost less impairment and are purchased with the intent to hold until maturity. The investments are traded and settled in the same business day.
For bank debt and government securities, interest is paid on maturity. For asset backed debt securities, interest is paid monthly. Details of maturity terms are set out in Note 12. The debt securities have an effective interest rate of 3.82% (2008 – 8.05%).

heritage building society limited financial rePort 2008 - 2009 | 31
Available for sale financial investments
14 Available for sale financial investments comprise shares which are measured at market value or cost where the shares are unlisted and do not have a quoted market price, and subordinated debt in special settlement service providers which is measured at cost as the fair value is unable to be measured reliably.
Terms and conditions are detailed in Note 14.
(ii) Financial liabilities
Deposits and borrowings 20 Member deposits, transferable deposits, bank borrowings and interest bearing notes are recorded at the amortised cost.
Details of maturity terms are set out in Note 20. Interest is calculated on either the daily balance outstanding or on a minimum balance depending on the nature of the deposit.
Accounts payable and other liabilities
21 Accounts payable and other liabilities are measured at amortised cost.
Trade liabilities are normally settled on the individual creditors’ payment terms. Accrued interest is paid at the time of interest reset, being 3 months.
Subordinated debt 24 Subordinated debt is carried at the amortised cost.
Details of maturity terms are set out in Note 24. Term subordinated debt has an effective interest rate of 3.99% (2008 – 8.67%).
(iii) Financial instruments
Interest rate swaps ConsolidatedThe Group has adopted a cash flow hedging strategy where it transacts pay fixed / receive floating swaps (some of an amortising nature) with approved external counterparties to mitigate against variability in cash flows of a portfolio of floating rate liabilities.
ConsolidatedAt balance date, the Group has interest rate swap agreements with a notional amount of $795 million, on which it pays 5.40% to 7.76% interest and receives Bank Bill Swap Rate (BBSW) calculated on the notional amount (2008 - $1,650 million). The swaps expire between July 2009 and May 2011.
ParentThe Parent has adopted a cash flow hedging strategy where it transacts pay fixed / receive floating swaps with approved external counterparties to mitigate against variability in cash flows of a portfolio of floating rate liabilities.
ParentAt balance date, the Parent has interest rate swap agreements with a notional amount of $795 million, on which it pays 5.40% to 7.76% interest and receives Bank Bill Swap Rate (BBSW) calculated on the notional amount (2008 - $3,457 million). The swaps expire between July 2009 and May 2011.
ParentThe Parent has adopted a cash flow hedging strategy where it transacts pay floating / receive fixed swaps with the SPVs to counteract against variability in cash flows of a portfolio of floating rate assets.
ParentThe $1,122 million balance are a portfolio of pay floating / receive fixed interest rate swaps that the Parent has transacted with the SPVs.
15. finanCial inSTRUMEnTS anD RiSK ManaGEMEnT (continued)
(b) Nature and details of the financial instruments (continued)
Recognised financial instruments
Notes Criteria for recognition and basis for measurement
Nature and details of the financial instruments
(i) Financial assets (continued)
notes to the financial Statements
32 | heritage building society limited financial rePort 2008 - 2009
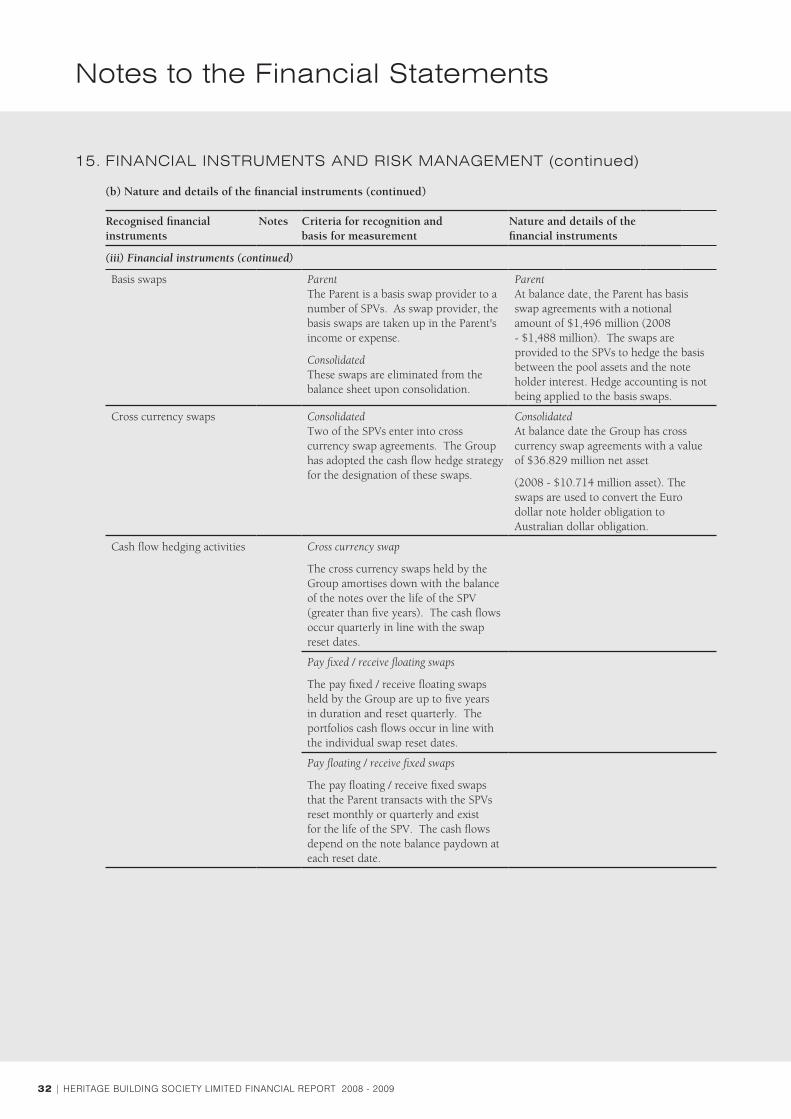
Basis swaps Parent The Parent is a basis swap provider to a number of SPVs. As swap provider, the basis swaps are taken up in the Parent's income or expense.
Consolidated These swaps are eliminated from the balance sheet upon consolidation.
Parent At balance date, the Parent has basis swap agreements with a notional amount of $1,496 million (2008 - $1,488 million). The swaps are provided to the SPVs to hedge the basis between the pool assets and the note holder interest. Hedge accounting is not being applied to the basis swaps.
Cross currency swaps Consolidated Two of the SPVs enter into cross currency swap agreements. The Group has adopted the cash flow hedge strategy for the designation of these swaps.
Consolidated At balance date the Group has cross currency swap agreements with a value of $36.829 million net asset
(2008 - $10.714 million asset). The swaps are used to convert the Euro dollar note holder obligation to Australian dollar obligation.
Cash flow hedging activities Cross currency swap
The cross currency swaps held by the Group amortises down with the balance of the notes over the life of the SPV (greater than five years). The cash flows occur quarterly in line with the swap reset dates.
Pay fixed / receive floating swaps
The pay fixed / receive floating swaps held by the Group are up to five years in duration and reset quarterly. The portfolios cash flows occur in line with the individual swap reset dates.
Pay floating / receive fixed swaps
The pay floating / receive fixed swaps that the Parent transacts with the SPVs reset monthly or quarterly and exist for the life of the SPV. The cash flows depend on the note balance paydown at each reset date.
15. finanCial inSTRUMEnTS anD RiSK ManaGEMEnT (continued)
(b) Nature and details of the financial instruments (continued)
Recognised financial instruments
Notes Criteria for recognition and basis for measurement
Nature and details of the financial instruments
(iii) Financial instruments (continued)
notes to the financial Statements
heritage building society limited financial rePort 2008 - 2009 | 33
15. finanCial inSTRUMEnTS anD RiSK ManaGEMEnT (continued)
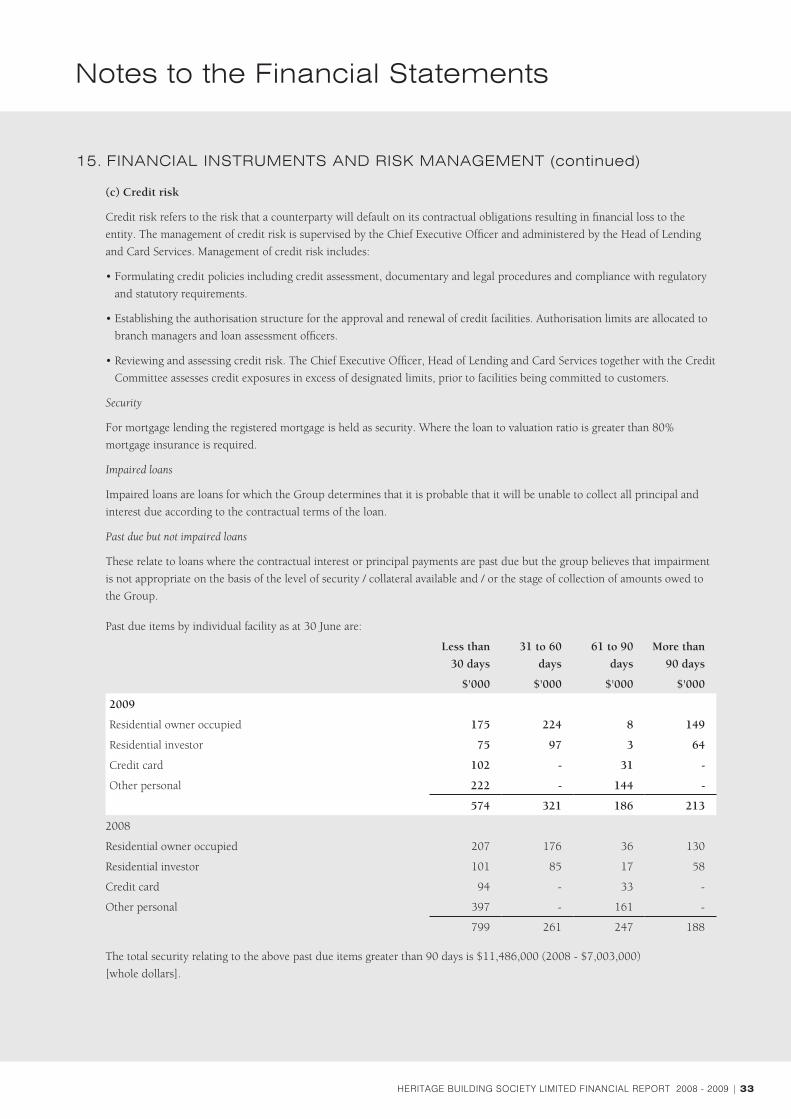
(c) Credit risk
Credit risk refers to the risk that a counterparty will default on its contractual obligations resulting in financial loss to the
entity. The management of credit risk is supervised by the Chief Executive Officer and administered by the Head of Lending
and Card Services. Management of credit risk includes:
•Formulatingcreditpoliciesincludingcreditassessment,documentaryandlegalproceduresandcompliancewithregulatory
and statutory requirements.
•Establishingtheauthorisationstructurefortheapprovalandrenewalofcreditfacilities.Authorisationlimitsareallocatedto
branch managers and loan assessment officers.
•Reviewingandassessingcreditrisk.TheChiefExecutiveOfficer,HeadofLendingandCardServicestogetherwiththeCredit
Committee assesses credit exposures in excess of designated limits, prior to facilities being committed to customers.
Security
For mortgage lending the registered mortgage is held as security. Where the loan to valuation ratio is greater than 80%
mortgage insurance is required.
Impaired loans
Impaired loans are loans for which the Group determines that it is probable that it will be unable to collect all principal and
interest due according to the contractual terms of the loan.
Past due but not impaired loans
These relate to loans where the contractual interest or principal payments are past due but the group believes that impairment
is not appropriate on the basis of the level of security / collateral available and / or the stage of collection of amounts owed to
the Group.
Past due items by individual facility as at 30 June are:
Less than
30 days
31 to 60
days
61 to 90
days
More than
90 days
$'000 $'000 $'000 $'000
2009
Residential owner occupied 175 224 8 149
Residential investor 75 97 3 64
Credit card 102 - 31 -
Other personal 222 - 144 -
574 321 186 213
2008
Residential owner occupied 207 176 36 130
Residential investor 101 85 17 58
Credit card 94 - 33 -
Other personal 397 - 161 -
799 261 247 188
The total security relating to the above past due items greater than 90 days is $11,486,000 (2008 - $7,003,000)
[whole dollars].
notes to the financial Statements
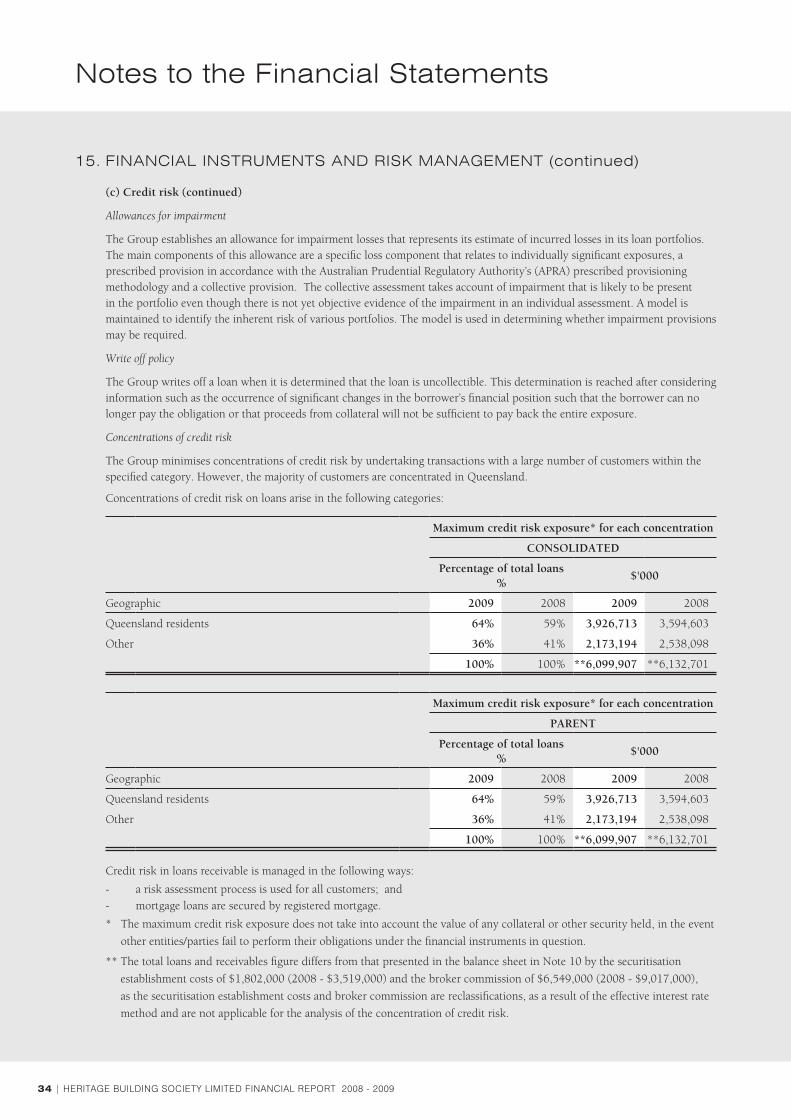
34 | heritage building society limited financial rePort 2008 - 2009
Concentrations of credit risk on loans arise in the following categories:
Maximum credit risk exposure* for each concentration
CONSOLIDATED
Percentage of total loans %
$'000
Geographic 2009 2008 2009 2008
Queensland residents 64% 59% 3,926,713 3,594,603
Other 36% 41% 2,173,194 2,538,098
100% 100% **6,099,907 **6,132,701
Maximum credit risk exposure* for each concentration
PARENT
Percentage of total loans %
$'000
Geographic 2009 2008 2009 2008
Queensland residents 64% 59% 3,926,713 3,594,603
Other 36% 41% 2,173,194 2,538,098
100% 100% **6,099,907 **6,132,701
Credit risk in loans receivable is managed in the following ways:
- a risk assessment process is used for all customers; and
- mortgage loans are secured by registered mortgage.
* The maximum credit risk exposure does not take into account the value of any collateral or other security held, in the event
other entities/parties fail to perform their obligations under the financial instruments in question.
** The total loans and receivables figure differs from that presented in the balance sheet in Note 10 by the securitisation
establishment costs of $1,802,000 (2008 - $3,519,000) and the broker commission of $6,549,000 (2008 - $9,017,000),
as the securitisation establishment costs and broker commission are reclassifications, as a result of the effective interest rate
method and are not applicable for the analysis of the concentration of credit risk.
15. finanCial inSTRUMEnTS anD RiSK ManaGEMEnT (continued)
(c) Credit risk (continued)
Allowances for impairment
The Group establishes an allowance for impairment losses that represents its estimate of incurred losses in its loan portfolios. The main components of this allowance are a specific loss component that relates to individually significant exposures, a prescribed provision in accordance with the Australian Prudential Regulatory Authority’s (APRA) prescribed provisioning methodology and a collective provision. The collective assessment takes account of impairment that is likely to be present in the portfolio even though there is not yet objective evidence of the impairment in an individual assessment. A model is maintained to identify the inherent risk of various portfolios. The model is used in determining whether impairment provisions may be required.
Write off policy
The Group writes off a loan when it is determined that the loan is uncollectible. This determination is reached after considering information such as the occurrence of significant changes in the borrower’s financial position such that the borrower can no longer pay the obligation or that proceeds from collateral will not be sufficient to pay back the entire exposure.
Concentrations of credit risk
The Group minimises concentrations of credit risk by undertaking transactions with a large number of customers within the specified category. However, the majority of customers are concentrated in Queensland.
notes to the financial Statements

heritage building society limited financial rePort 2008 - 2009 | 35
15. finanCial inSTRUMEnTS anD RiSK ManaGEMEnT (continued)
(d) Liquidity risk
Liquidity risk is the inability to access sufficient funds, both anticipated and unforseen that may lead to the Society being
unable to meet its cash flow and funding obligations as they arise.
Management of Liquidity Risk
The Society’s approach to managing liquidity is to ensure, as far as possible, that it will always have sufficient liquidity to meet
its liabilities when due, under both normal or stressed conditions, without incurring unacceptable losses or risking damage to
the Society’s reputation.
The Society has a Liquidity Management Policy that is supervised by the Chief Executive Officer and administered by the Chief
Financial Officer, the Manager of Accounting Services and the Treasurer. To ensure liquidity requirements are met, the Society
maintains minimum liquidity holdings relative to its balance sheet liabilities including irrevocable commitments but excluding
eligible capital. The minimum liquidity holdings comprise high quality liquid assets held within a Liquid Assets Portfolio.
The daily liquidity position is monitored and regular liquidity stress testing is conducted under a variety of scenarios covering
both normal and more severe market conditions. A daily report covers the daily liquidity position, liquidity forecasts are
generated weekly and summary reports are provided to Finance Committee monthly.
The tables below outline the repricing profile of the financial liabilities based on contractual undiscounted cashflows.
1 year or less Over 1 to 5 years More than 5 years
2009 2008 2009 2008 2009 2008
CONSOLIDATED $'000 $'000 $'000 $'000 $'000 $'000
Deposits and borrowings 6,476,281 6,287,008 325,303 318,435 - -
Accounts payable and other
liabilities 27,879 25,577 - - - -
Subordinated debt 50,000 57,000 - - - -
Derivatives 19,222 5,739 2,556 - - -
Total financial liabilities 6,573,382 6,375,324 327,859 318,435 - -
1 year or less Over 1 to 5 years More than 5 years
2009 2008 2009 2008 2009 2008
PARENT $'000 $'000 $'000 $'000 $'000 $'000
Deposits and borrowings 4,005,676 3,176,936 30,988 43,355 - -
Accounts payable and other
liabilities 2,420,864 2,175,998 621,723 1,177,388 - -
Subordinated debt 50,000 57,000 - - - -
Derivatives 19,222 - 2,556 - - 45,569
Total financial liabilities 6,495,762 5,409,934 655,267 1,220,743 - 45,569
Refer notes 27 and 28 for off balance sheet amounts.
The derivatives have been calculated using existing contractual terms and rates prevailing at 30 June 2009. The total amount
will accordingly differ from the balance sheet.
notes to the financial Statements

36 | heritage building society limited financial rePort 2008 - 2009
15. finanCial inSTRUMEnTS anD RiSK ManaGEMEnT (continued)
notes to the financial Statements
(e) Market risks
Market risk is the risk that changes in market prices, such as interest rates and exchange rates, will affect the Society’s income
or the value of its holdings of financial instruments. The objective of market risk is to manage and control market risk
exposures within acceptable parameters, while optimising the return on risk.
Management of Market Risks
The Society does not undertake trading activities and all exposure to market risk is in its non-trading portfolio.
Overall authority for market risk is vested in the Board and delegated to the Finance Committee. Treasury is responsible for
the development of detailed risk management polices (subject to review by Finance Committee and approval by Board) and for
the day-to-day review of their implementation.
Interest Rate Risk
Interest rate risk is the potential for loss of earnings to the Society due to adverse movements in interest rates.
The Society utilises two key risk management strategies; a Pricing Committee facilitates direct (pricing) intervention strategies
and the Finance Committee facilitates indirect (hedging) intervention strategies.
Forward Rate Agreements, Interest Rate Swaps, Options (including Interest Rate Caps and Floors), Interest Rate Futures and
Options on Interest Rate Futures are all authorised hedging instruments but are subject to approval by the Finance Committee
where they have not been utilised within the previous 12 months.
Interest rate risk is managed principally through monitoring interest rate gaps and by having pre-approved limits for repricing
bands (set with reference to expected future profit). The Finance Committee is the monitoring body for compliance with these
limits and is assisted by the monitoring activities implemented by Treasury in its day-to-day trading.
The following demonstrates the sensitivity to a reasonable possible change in interest rates and the equities market with all
other variables held constant.
Sensitivity of the income statement
The sensitivity of the income statement is the effect of the assumed changes in interest rates on the net interest income for one
year, based on the floating rate financial assets and financial liabilities held at 30 June 2009, including the effect of hedging
instruments.
Change
Sensitivity of net
interest income (NII)
2009 2009 2008
$'000 $'000
100 basis points 228 280
(100) basis points (2,838) (336)
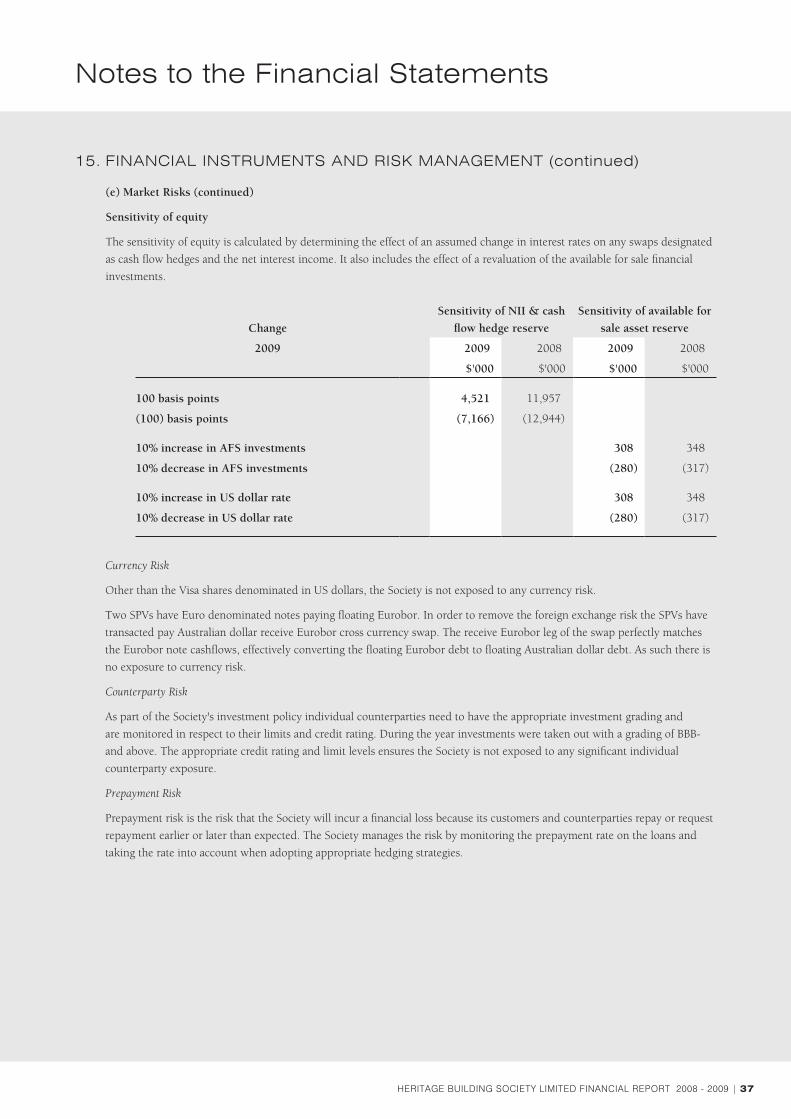
heritage building society limited financial rePort 2008 - 2009 | 37
Currency Risk
Other than the Visa shares denominated in US dollars, the Society is not exposed to any currency risk.
Two SPVs have Euro denominated notes paying floating Eurobor. In order to remove the foreign exchange risk the SPVs have
transacted pay Australian dollar receive Eurobor cross currency swap. The receive Eurobor leg of the swap perfectly matches
the Eurobor note cashflows, effectively converting the floating Eurobor debt to floating Australian dollar debt. As such there is
no exposure to currency risk.
Counterparty Risk
As part of the Society's investment policy individual counterparties need to have the appropriate investment grading and
are monitored in respect to their limits and credit rating. During the year investments were taken out with a grading of BBB-
and above. The appropriate credit rating and limit levels ensures the Society is not exposed to any significant individual
counterparty exposure.
Prepayment Risk
Prepayment risk is the risk that the Society will incur a financial loss because its customers and counterparties repay or request
repayment earlier or later than expected. The Society manages the risk by monitoring the prepayment rate on the loans and
taking the rate into account when adopting appropriate hedging strategies.
15. finanCial inSTRUMEnTS anD RiSK ManaGEMEnT (continued)
(e) Market Risks (continued)
Sensitivity of equity
The sensitivity of equity is calculated by determining the effect of an assumed change in interest rates on any swaps designated
as cash flow hedges and the net interest income. It also includes the effect of a revaluation of the available for sale financial
investments.
Change
Sensitivity of NII & cash
flow hedge reserve
Sensitivity of available for
sale asset reserve
2009 2009 2008 2009 2008
$'000 $'000 $'000 $'000
100 basis points 4,521 11,957
(100) basis points (7,166) (12,944)
10% increase in AFS investments 308 348
10% decrease in AFS investments (280) (317)
10% increase in US dollar rate 308 348
10% decrease in US dollar rate (280) (317)
notes to the financial Statements

38 | heritage building society limited financial rePort 2008 - 2009
notes to the financial Statements1
5.f
ina
nC
ial
in
ST
RU
ME
nT
S a
nD
RiS
K M
an
aG
EM
En
T (
co
ntin
ue
d)
(f)
Eff
ecti
ve i
nte
rest
rat
es a
nd
mat
uri
ty p
rofi
le
The
Gro
up's
pol
icy
in r
elat
ion
to in
tere
st r
ate
risk
is 'a
low
ris
k ap
proa
ch' m
inim
isin
g ri
sk w
here
pra
ctic
al, e
stab
lishi
ng a
ppro
pria
te li
mit
s fo
r re
sidu
al e
xpos
ures
. T
he G
roup
is
expo
sed
to m
any
vari
etie
s of
inte
rest
rat
e ri
sk b
ut h
as a
ggre
gate
d th
e ke
y in
tere
st r
ate
risk
s ar
isin
g fr
om c
omm
erci
al o
pera
tion
s. T
he p
olic
y is
des
igne
d to
mon
itor
all
form
s of
inte
rest
rat
e ri
sk t
hrou
gh t
he u
se o
f var
ious
typ
es o
f rep
orti
ng a
nd t
he F
inan
ce C
omm
itte
e.
The
follo
win
g ta
ble
sets
out
the
car
ryin
g am
ount
, by
mat
urit
y, o
f the
fina
ncia
l ins
trum
ents
exp
osed
to
inte
rest
rat
e ri
sk:
Fin
anci
al
inst
rum
ents
Flo
atin
g in
tere
st
rat
e
Fix
ed i
nte
rest
rat
e m
atu
rin
g in
:
Non
-in
tere
st b
eari
ng
Tot
al
Wei
ghte
d a
vera
ge
effe
ctiv
e in
tere
st
rate
at
bala
nce
dat
e1
year
or
less
Ove
r 1
to 5
yea
rsM
ore
than
5 ye
ars
2009
2008
2009
2008
2009
2008
2009
2008
2009
2008
2009
2008
2009
2008
$’00
0$’
000
$’00
0$’
000
$’00
0$’
000
$’00
0$’
000
$’00
0$’
000
$’00
0$’
000
%%
CO
NSO
LID
AT
ED
(i)
Fin
anci
al a
sset
s
Cas
h an
d ca
sh
equi
vale
nts
and
rece
ivab
les
due
from
othe
r fin
anci
al
inst
itut
ions
88,1
1477
,815
109,
400
231,
000
- -
-
-
24,4
7121
,556
221,
985
330,
371
2.86
%7.
11%
Hel
d to
mat
urit
y
finan
cial
ass
ets
- -
64
2,55
130
2,26
1 -
-
- -
-
-
642,
551
302,
261
3.82
%8.
05%
Loan
s an
d
rece
ivab
les
3,92
8,68
52,
953,
547
860,
782
900,
417
1,31
0,44
02,
278,
737
- -
8
,351
1
2,53
6 6,
108,
258
6,14
5,23
75.
97%
8.11
%
Oth
er r
ecei
vabl
es
and
avai
labl
e
for
sale
fina
ncia
l
inve
stm
ents
339
6
95
50,3
5746
,968
- -
-
-
12,4
3915
,582
63,1
3563
,245
2.35
%5.
90%
Der
ivat
ives
36,8
2916
,453
- 7,
384
- 14
,428
- -
-
-
36,8
2938
,265
--
Tot
al fi
nanc
ial
asse
ts4,
053,
967
3,04
8,51
01,
663,
090
1,48
8,03
01,
310,
440
2,29
3,16
5 -
-
45,2
6149
,674
7,07
2,75
86,
879,
379
--

heritage building society limited financial rePort 2008 - 2009 | 39
15
.fin
an
Cia
l i
nS
TR
UM
En
TS
an
D R
iSK
Ma
na
GE
ME
nT
(c
on
tin
ue
d)
(f)
Eff
ecti
ve i
nte
rest
rat
es a
nd
mat
uri
ty p
rofi
le (
con
tin
ued
)
Fin
anci
al
inst
rum
ents
Flo
atin
g in
tere
st
rat
e
Fix
ed i
nte
rest
rat
e m
atu
rin
g in
:
Non
-in
tere
st b
eari
ng
Tot
al
Wei
ghte
d a
vera
ge
effe
ctiv
e in
tere
st
rate
at
bala
nce
dat
e1
year
or
less
Ove
r 1
to 5
yea
rsM
ore
than
5 ye
ars
2009
2008
2009
2008
2009
2008
2009
2008
2009
2008
2009
2008
2009
2008
$’00
0$’
000
$’00
0$’
000
$’00
0$’
000
$’00
0$’
000
$’00
0$’
000
$’00
0$’
000
%%
CO
NSO
LID
AT
ED
(ii)
Fin
anci
al li
abil
itie
s
Dep
osit
s an
d
borr
owin
gs4,
081,
755
4,10
0,92
92,
367,
020
2,14
2,49
432
5,30
331
8,43
5 -
-
27,5
0643
,585
6,80
1,58
46,
605,
443
4.44
%6.
57%
Acc
ount
s pa
yabl
e
and
othe
r
liabi
litie
s -
-
- -
-
-
- -
27
,879
25,5
7727
,879
25,5
77-
-
Subo
rdin
ated
deb
t -
-
50,0
0057
,000
- -
-
-
- -
50
,000
57,0
003.
99%
8.67
%
Der
ivat
ives
- 5
,739
1
3,83
6 -
6
,984
-
-
-
- -
20
,820
5,73
9-
-
Tot
al fi
nanc
ial
liabi
litie
s4,
081,
755
4,10
6,66
82,
430,
856
2,19
9,49
433
2,28
731
8,43
5 -
-
55,3
8569
,162
6,90
0,28
36,
693,
759
--
notes to the financial Statements

40 | heritage building society limited financial rePort 2008 - 2009
notes to the financial Statements1
5.f
ina
nC
ial
in
ST
RU
ME
nT
S a
nD
RiS
K M
an
aG
EM
En
T (
co
ntin
ue
d)
(f)
Eff
ecti
ve i
nte
rest
rat
es a
nd
mat
uri
ty p
rofi
le (
con
tin
ued
)
Fin
anci
al
inst
rum
ents
Flo
atin
g in
tere
st r
ate
Fix
ed i
nte
rest
rat
e m
atu
rin
g in
:
Non
-in
tere
st b
eari
ng
Tot
al c
arry
ing
amou
nt
as p
er
bala
nce
sh
eet
Wei
ghte
d
aver
age
effe
ctiv
e
inte
rest
rat
e at
bala
nce
dat
e1
year
or
less
Ove
r 1
to 5
yea
rsM
ore
than
5 y
ears
2009
2008
2009
2008
2009
2008
2009
2008
2009
2008
2009
2008
2009
2008
$’00
0$’
000
$’00
0$’
000
$’00
0$’
000
$’00
0$’
000
$’00
0$’
000
$’00
0$’
000
%%
PA
RE
NT
(i)
Fin
anci
al a
sset
s
Cas
h an
d ca
sh
equi
vale
nts
and
rece
ivab
les
due
from
othe
r fin
anci
al
inst
itut
ions
87,0
2877
,282
48,0
0018
6,00
0 -
-
- -
24
,471
21,5
5615
9,49
928
4,83
82.
63%
7.10
%
Hel
d to
mat
urit
y
finan
cial
ass
ets
- -
64
2,55
130
2,26
1 -
-
- -
-
-
642,
551
302,
261
3.82
%8.
05%
Loan
s an
d
rece
ivab
les
3,92
8,68
52,
953,
547
860,
782
900,
417
1,31
0,44
02,
278,
737
- -
8
,351
1
2,53
6 6,
108,
258
6,14
5,23
75.
97%
8.11
%
Oth
er
rece
ivab
les
and
avai
labl
e fo
r
sale
fina
ncia
l
inve
stm
ents
- -
50
,699
46,9
68 -
-
- -
12
,229
15,3
4262
,928
62,3
102.
36%
5.99
%
Der
ivat
ives
- -
-
7,38
4 -
14,4
28 3
2,01
9 -
-
-
32,
019
21,
812
--
Tot
al fi
nanc
ial
asse
ts4,
015,
713
3,03
0,82
91,
602,
032
1,44
3,03
01,
310,
440
2,29
3,16
5 3
2,01
9 -
45
,051
49,4
347,
005,
255
6,81
6,45
8-
-

heritage building society limited financial rePort 2008 - 2009 | 41
15
.fin
an
Cia
l i
nS
TR
UM
En
TS
an
D R
iSK
Ma
na
GE
ME
nT
(c
on
tin
ue
d)
(f)
Eff
ecti
ve i
nte
rest
rat
es a
nd
mat
uri
ty p
rofi
le (
con
tin
ued
)
Fin
anci
al
inst
rum
ents
Flo
atin
g in
tere
st r
ate
Fix
ed i
nte
rest
rat
e m
atu
rin
g in
:
Non
-in
tere
st b
eari
ng
Tot
al c
arry
ing
amou
nt
as p
er
bala
nce
sh
eet
Wei
ghte
d
aver
age
effe
ctiv
e
inte
rest
rat
e at
bala
nce
dat
e1
year
or
less
Ove
r 1
to 5
yea
rsM
ore
than
5 y
ears
2009
2008
2009
2008
2009
2008
2009
2008
2009
2008
2009
2008
2009
2008
$’00
0$’
000
$’00
0$’
000
$’00
0$’
000
$’00
0$’
000
$’00
0$’
000
$’00
0$’
000
%%
PA
RE
NT
(ii)
Fin
anci
al li
abil
itie
s
Dep
osit
s an
d
borr
owin
gs2,
022,
774
1,15
7,24
81,
960,
793
1,99
1,26
930
,988
43,3
55 -
-
22,1
0928
,419
4,03
6,66
43,
220,
291
3.11
%5.
92%
Acc
ount
s
paya
ble
and
othe
r lia
bilit
ies
1,81
6,45
11,
493,
454
549,
418
622,
735
621,
723
1,17
7,38
8 -
-
54,9
9559
,809
3,04
2,58
73,
353,
386
--
Subo
rdin
ated
debt
- -
50
,000
57,0
00 -
-
- -
-
-
50,0
0057
,000
3.99
%8.
67%
Der
ivat
ives
- -
13,
836
-
6,9
84
-
- 45
,569
- -
20
,820
45,
569
--
Tot
al fi
nanc
ial
liabi
litie
s3,
839,
225
2,65
0,70
22,
574,
047
2,67
1,00
465
9,69
51,
220,
743
- 4
5,56
9 77
,104
88,2
287,
150,
071
6,67
6,24
6-
-
notes to the financial Statements

42 | heritage building society limited financial rePort 2008 - 2009
notes to the financial Statements1
5.
fin
an
Cia
l i
nS
TR
UM
En
TS
an
D R
iSK
Ma
na
GE
ME
nT
(c
on
tin
ue
d)
(g)
Fai
r va
lues
Set
out
belo
w is
a c
ompa
riso
n by
cat
egor
y of
car
ryin
g am
ount
s an
d fa
ir v
alue
s of
all
of t
he G
roup
's fi
nanc
ial i
nstr
umen
ts r
ecog
nise
d in
the
fina
ncia
l sta
tem
ents
.
CO
NSO
LID
AT
ED
PA
RE
NT
Tot
al c
arry
ing
amou
nt
as
per
bal
ance
sh
eet
Agg
rega
te n
et f
air
valu
eT
otal
car
ryin
g am
oun
t as
per
bal
ance
sh
eet
Agg
rega
te n
et f
air
valu
e
2009
2008
2009
2008
2009
2008
2009
2008
$’00
0$’
000
$’00
0$’
000
$’00
0$’
000
$’00
0$’
000
Fin
anci
al a
sset
s
Cas
h an
d ca
sh e
quiv
alen
ts a
nd r
ecei
vabl
es d
ue fr
om
othe
r fin
anci
al in
stit
utio
ns
221,
985
330,
371
221,
985
330,
371
159,
499
284,
838
159,
499
284,
838
Oth
er r
ecei
vabl
es #
53,4
8655
,145
53,4
8655
,145
53,2
7954
,210
53,2
7954
,210
Hel
d to
mat
urit
y fin
anci
al a
sset
s #
647,
310
304,
906
648,
555
305,
080
647,
310
304,
906
648,
555
305,
080
Loan
s an
d re
ceiv
able
s6,
108,
258
6,14
5,23
76,
159,
471
6,02
5,68
46,
108,
258
6,14
5,23
76,
159,
471
6,02
5,68
4
Ava
ilabl
e fo
r sa
le fi
nanc
ial i
nves
tmen
ts4,
890
5,45
54,
890
5,45
54,
890
5,45
54,
890
5,45
5
Inte
rest
rat
e sw
aps
- 21
,812
- 21
,812
32,
019
21,8
12 3
2,01
9 21
,812
Cro
ss c
urre
ncy
swap
36,8
2916
,453
36,8
2916
,453
- -
-
-
Tot
al fi
nanc
ial a
sset
s7,
072,
758
6,87
9,37
97,
125,
216
6,76
0,00
07,
005,
255
6,81
6,45
87,
057,
713
6,69
7,07
9
Fin
anci
al li
abil
itie
s
Dep
osit
s an
d bo
rrow
ings
6,76
1,58
46,
493,
143
6,76
1,58
46,
493,
143
3,99
6,66
43,
107,
991
3,99
6,66
43,
107,
991
Tra
nsfe
rabl
e de
posi
ts40
,000
112,
300
40,0
0011
2,30
040
,000
112,
300
40,0
0011
2,30
0
Subo
rdin
ated
deb
t50
,000
57,0
0050
,000
57,0
0050
,000
57,0
0050
,000
57,0
00
Acc
ount
s pa
yabl
e an
d ot
her
liabi
litie
s27
,879
25,5
7727
,879
25,5
773,
042,
587
3,35
3,38
63,
042,
587
3,35
3,38
6
Inte
rest
rat
e sw
aps
20,
820
-
20,
820
-
- 45
,569
- 45
,569
Cro
ss c
urre
ncy
swap
- 5
,739
-
5,7
39
- -
-
-
Tot
al fi
nanc
ial l
iabi
litie
s6,
900,
283
6,69
3,75
96,
900,
283
6,69
3,75
97,
129,
251
6,67
6,24
67,
129,
251
6,67
6,24
6
# T
hese
item
s di
ffer
from
the
am
ount
s di
sclo
sed
in N
otes
9 a
nd 1
2 be
caus
e ac
crue
d in
tere
st h
as b
een
allo
cate
d to
the
app
licab
le fi
nanc
ial a
sset
. T
he fa
ir v
alue
for
bills
of
exch
ange
and
cer
tific
ates
of d
epos
it a
ssum
es in
tere
st is
incl
uded
. T
he c
arry
ing
amou
nt fo
r he
ld t
o m
atur
ity
finan
cial
ass
ets
is c
ost
$642
,551
,000
(20
08 -
$30
2,26
1,00
0) p
lus
inte
rest
$4,
759,
000
(200
8 -
$2,6
45,0
00).
heritage building society limited financial rePort 2008 - 2009 | 43
15. finanCial inSTRUMEnTS anD RiSK ManaGEMEnT (continued)
(g) Fair values (continued)
The following methods and assumptions are used to determine the net fair values of financial assets and liabilities:
Cash and liquid assets and due from other financial institutions: The carrying amounts approximate fair value because of their
short term to maturity or are receivable on demand.
Other receivables, accounts payable and other liabilities: The carrying amounts approximate fair value as they are short term
in nature.
Loans and receivables: The fair value of loans are estimated using discounted cash flow analysis based on current incremental
lending rates for similar types of lending arrangements.
Held to maturity financial assets: For financial instruments traded in organised financial markets, fair value is the current
quoted market price for an asset or offer price for a liability, adjusted for transaction costs necessary to realise the asset or
settle the liability.
Deposits: The carrying amount approximates fair value because 92% (2008 - 80%) of deposits have a short date to maturity.
For longer term deposits, their current interest rates are similar to market rates.
Interest bearing notes: The carrying amount of the notes represents the fair value.
Transferable deposits and subordinated debt: The carrying amount is considered to be a reasonable estimate of net fair value.
Interest rate, basis and cross currency swaps: The fair value is determined as the difference in present value of the future
interest cash flows.
(h) Operational Risk
Operational risk is risk arising from inadequate or failed internal processes, people and information systems, or from external
events (other than credit, market, and liquidity risks). Operational risks arise from the Society’s operational activities.
The Society’s objective is to manage the risks associated with its activities to realise opportunities and minimise the impact of
undesired and unexpected events on its business activities.
Management of risks through the implementation of appropriate control strategies is supported by a programme of periodic
reviews undertaken by Internal Audit. The results of the reviews are provided to the responsible management of the subject
business unit and reported to the Audit & Compliance Committee.
(i) Capital
Capital adequacy is calculated in accordance with the Prudential Standards issued by APRA. APRA has set minimum regulatory
capital requirements that are consistent with Basel II Framework. During the year, the Group has complied in full with all its
externally imposed capital requirements.
Capital Management
The Group’s capital management policy is supervised by the Chief Executive Officer and administered by the Chief Financial
Officer, the Manager of Accounting Services and the Treasurer. Other objectives include making efficient use of capital in the
pursuit of strategic objectives. The capital adequacy ratio is monitored on a daily basis.
notes to the financial Statements
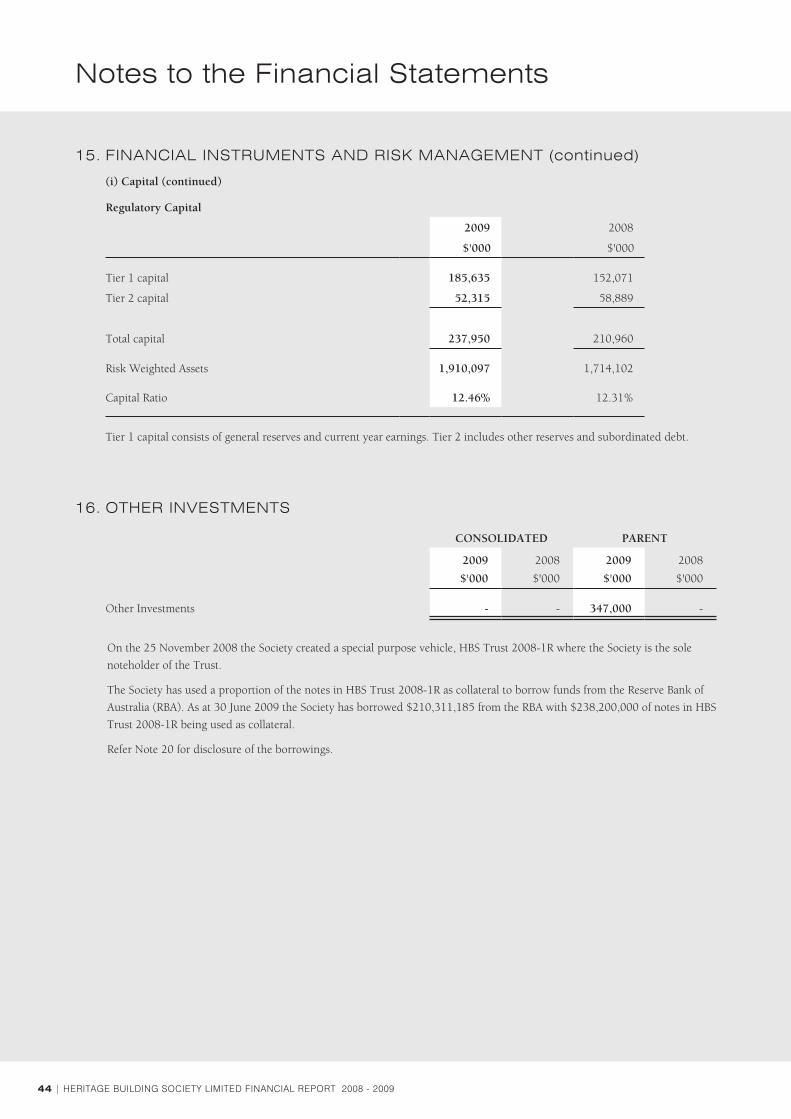
44 | heritage building society limited financial rePort 2008 - 2009
notes to the financial Statements
Regulatory Capital
2009 2008
$'000 $'000
Tier 1 capital 185,635 152,071
Tier 2 capital 52,315 58,889
Total capital 237,950 210,960
Risk Weighted Assets 1,910,097 1,714,102
Capital Ratio 12.46% 12.31%
Tier 1 capital consists of general reserves and current year earnings. Tier 2 includes other reserves and subordinated debt.
15. finanCial inSTRUMEnTS anD RiSK ManaGEMEnT (continued)
(i) Capital (continued)
16. OTHER inVESTMEnTS
CONSOLIDATED PARENT
2009 2008 2009 2008
$'000 $'000 $'000 $'000
Other Investments - - 347,000 -
On the 25 November 2008 the Society created a special purpose vehicle, HBS Trust 2008-1R where the Society is the sole
noteholder of the Trust.
The Society has used a proportion of the notes in HBS Trust 2008-1R as collateral to borrow funds from the Reserve Bank of
Australia (RBA). As at 30 June 2009 the Society has borrowed $210,311,185 from the RBA with $238,200,000 of notes in HBS
Trust 2008-1R being used as collateral.
Refer Note 20 for disclosure of the borrowings.

heritage building society limited financial rePort 2008 - 2009 | 45
17. PROPERTY, PlanT anD EQUiPMEnTCONSOLIDATED
Freehold
land
Heritage
Plaza
building
units
Furniture,
fittings,
plant and
equipment
Total
$'000 $'000 $'000 $'000
Year ended 30 June 2009
At 1 July 2008, net of accumulated depreciation
and impairment 1,800 9,312 14,041 25,153
Additions - 337 4,447 4,784
Disposals - - (360) (360)
Depreciation charge for the year - (607) (5,789) (6,396)
As at 30 June 2009, net of accumulated depreciation
and impairment 1,800 9,042 12,339 23,181
At 30 June 2009
Cost 1,800 10,987 45,001 57,788
Accumulated depreciation and impairment (a) - (1,945) (32,662) (34,607)
Net carrying amount 1,800 9,042 12,339 23,181
Year ended 30 June 2008
At 1 July 2007, net of accumulated depreciation and
impairment 1,800 9,351 14,845 25,996
Additions - 511 5,342 5,853
Disposals - - (372) (372)
Depreciation charge for the year - (550) (5,774) (6,324)
As at 30 June 2008, net of accumulated depreciation
and impairment 1,800 9,312 14,041 25,153
At 30 June 2008
Cost 1,800 10,650 41,309 53,759
Accumulated depreciation and impairment (a) - (1,338) (27,268) (28,606)
Net carrying amount 1,800 9,312 14,041 25,153
notes to the financial Statements
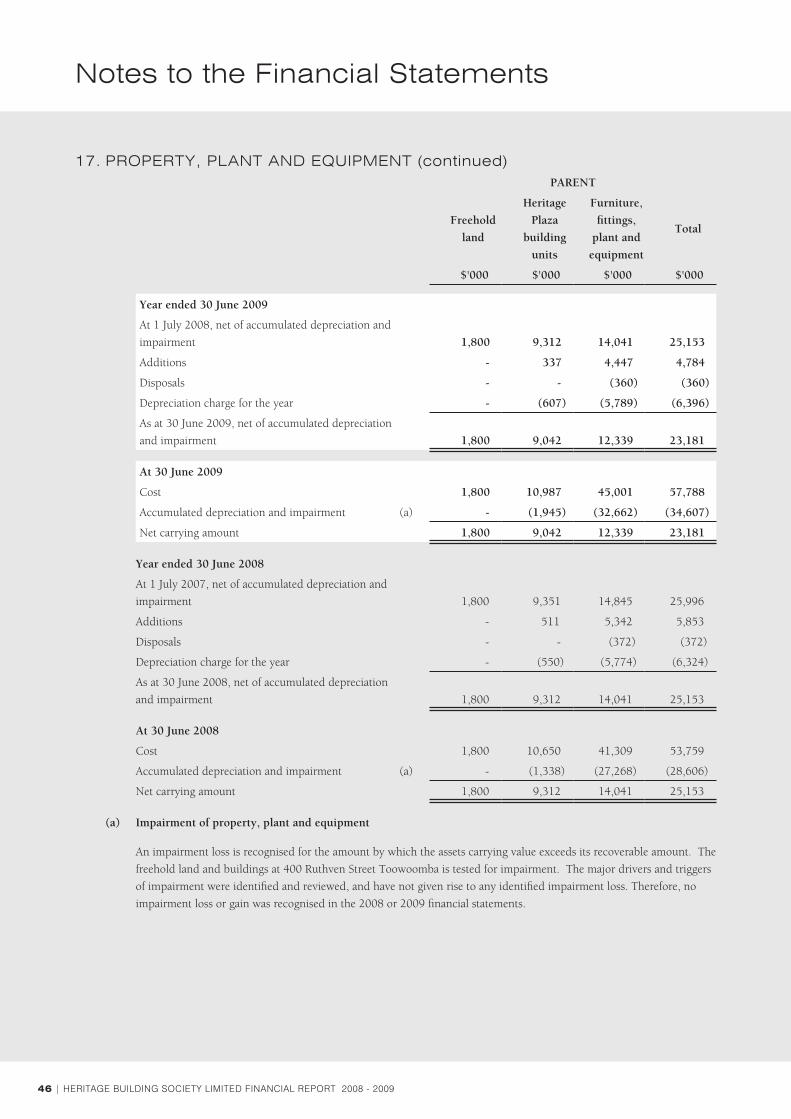
46 | heritage building society limited financial rePort 2008 - 2009
notes to the financial Statements
17. PROPERTY, PlanT anD EQUiPMEnT (continued)PARENT
Freehold
land
Heritage
Plaza
building
units
Furniture,
fittings,
plant and
equipment
Total
$'000 $'000 $'000 $'000
Year ended 30 June 2009
At 1 July 2008, net of accumulated depreciation and
impairment 1,800 9,312 14,041 25,153
Additions - 337 4,447 4,784
Disposals - - (360) (360)
Depreciation charge for the year - (607) (5,789) (6,396)
As at 30 June 2009, net of accumulated depreciation
and impairment 1,800 9,042 12,339 23,181
At 30 June 2009
Cost 1,800 10,987 45,001 57,788
Accumulated depreciation and impairment (a) - (1,945) (32,662) (34,607)
Net carrying amount 1,800 9,042 12,339 23,181
Year ended 30 June 2008
At 1 July 2007, net of accumulated depreciation and
impairment 1,800 9,351 14,845 25,996
Additions - 511 5,342 5,853
Disposals - - (372) (372)
Depreciation charge for the year - (550) (5,774) (6,324)
As at 30 June 2008, net of accumulated depreciation
and impairment 1,800 9,312 14,041 25,153
At 30 June 2008
Cost 1,800 10,650 41,309 53,759
Accumulated depreciation and impairment (a) - (1,338) (27,268) (28,606)
Net carrying amount 1,800 9,312 14,041 25,153
(a) Impairment of property, plant and equipment
An impairment loss is recognised for the amount by which the assets carrying value exceeds its recoverable amount. The
freehold land and buildings at 400 Ruthven Street Toowoomba is tested for impairment. The major drivers and triggers
of impairment were identified and reviewed, and have not given rise to any identified impairment loss. Therefore, no
impairment loss or gain was recognised in the 2008 or 2009 financial statements.

heritage building society limited financial rePort 2008 - 2009 | 47
18. OTHER aSSETS
Prepayments 981 905 981 905
Make good asset 1,305 1,236 1,305 1,236
Less: Amortisation (934) (764) (934) (764)
371 472 371 472
1,352 1,377 1,352 1,377
CONSOLIDATED PARENT
2009$'000
2008 $'000
2009$’000
2008 $’000
19. inTanGiBlESCONSOLIDATED PARENT
Computer Software Computer Software
$'000 $'000
Year ended 30 June 2009
At 1 July 2008, net of accumulated amortisation and impairment 254 254
Additions 1,074 1,074
Disposals - -
Amortisation charge for the year (131) (131)
As at 30 June 2009, net of accumulated amortisation and impairment 1,197 1,197
At 30 June 2009
Cost 1,346 1,346
Accumulated amortisation and impairment (149) (149)
Net carrying amount 1,197 1,197
Year ended 30 June 2008
At 1 July 2007, net of accumulated amortisation and impairment - -
Additions 272 272
Disposals - -
Amortisation charge for the year (18) (18)
As at 30 June 2008, net of accumulated amortisation and impairment 254 254
At 30 June 2008
Cost 272 272
Accumulated amortisation and impairment (18) (18)
Net carrying amount 254 254
notes to the financial Statements
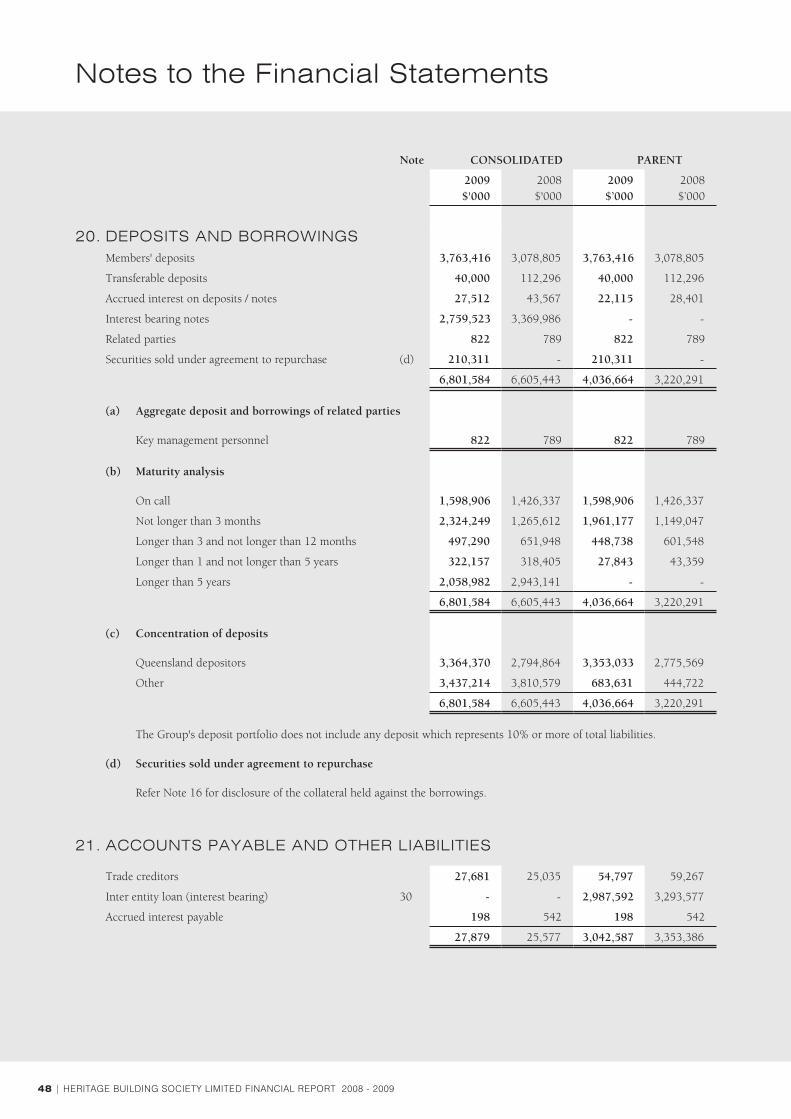
48 | heritage building society limited financial rePort 2008 - 2009
notes to the financial Statements
20. DEPOSiTS anD BORROWinGSMembers' deposits 3,763,416 3,078,805 3,763,416 3,078,805
Transferable deposits 40,000 112,296 40,000 112,296
Accrued interest on deposits / notes 27,512 43,567 22,115 28,401
Interest bearing notes 2,759,523 3,369,986 - -
Related parties 822 789 822 789
Securities sold under agreement to repurchase (d) 210,311 - 210,311 -
6,801,584 6,605,443 4,036,664 3,220,291
(a) Aggregate deposit and borrowings of related parties
Key management personnel 822 789 822 789
(b) Maturity analysis
On call 1,598,906 1,426,337 1,598,906 1,426,337
Not longer than 3 months 2,324,249 1,265,612 1,961,177 1,149,047
Longer than 3 and not longer than 12 months 497,290 651,948 448,738 601,548
Longer than 1 and not longer than 5 years 322,157 318,405 27,843 43,359
Longer than 5 years 2,058,982 2,943,141 - -
6,801,584 6,605,443 4,036,664 3,220,291
(c) Concentration of deposits
Queensland depositors 3,364,370 2,794,864 3,353,033 2,775,569
Other 3,437,214 3,810,579 683,631 444,722
6,801,584 6,605,443 4,036,664 3,220,291
The Group's deposit portfolio does not include any deposit which represents 10% or more of total liabilities.
(d) Securities sold under agreement to repurchase
Refer Note 16 for disclosure of the collateral held against the borrowings.
Note CONSOLIDATED PARENT
2009$'000
2008 $'000
2009$’000
2008 $’000
21. aCCOUnTS PaYaBlE anD OTHER liaBiliTiES
Trade creditors 27,681 25,035 54,797 59,267
Inter entity loan (interest bearing) 30 - - 2,987,592 3,293,577
Accrued interest payable 198 542 198 542
27,879 25,577 3,042,587 3,353,386

heritage building society limited financial rePort 2008 - 2009 | 49
22. PROViSiOnS
Employee benefits
Directors' retiring
allowanceMake good provision Total
$'000 $'000 $'000 $'000
CONSOLIDATED
As at 1 July 2008 5,190 433 1,236 6,859
Arising during the year 3,818 283 66 4,167
Utilised (2,692) (227) (3) (2,923)
Unused amounts reversed - - - -
Discount rate adjustment 8 - 6 14
At 30 June 2009 6,324 489 1,305 8,117
Current 2009 2,795 - 231 3,026
Non-current 2009 3,529 489 1,074 5,092
6,324 489 1,305 8,117
Current 2008 2,363 - 225 2,588
Non-current 2008 2,827 433 1,011 4,271
5,190 433 1,236 6,859
Employee benefits
Directors' retiring
allowanceMake good provision Total
$'000 $'000 $'000 $'000
PARENT
As at 1 July 2008 5,190 433 1,236 6,859
Arising during the year 3,818 283 66 4,167
Utilised (2,692) (227) (3) (2,923)
Unused amounts reversed - - - -
Discount rate adjustment 8 - 6 14
At 30 June 2009 6,324 489 1,305 8,117
Current 2009 2,795 - 231 3,026
Non-current 2009 3,529 489 1,074 5,092
6,324 489 1,305 8,117
Current 2008 2,363 - 225 2,588
Non-current 2008 2,827 433 1,011 4,271
5,190 433 1,236 6,859
notes to the financial Statements

50 | heritage building society limited financial rePort 2008 - 2009
notes to the financial Statements
23. RETiREMEnT BEnEfiT OBliGaTiOnS
(a) Superannuation plan
The Group contributes on behalf of its employees to the Heritage Building Society Limited Superannuation Plan.
Employer contributions are based on the advice of the plan's actuary, but as a minimum the Group contributes for all
employees in accordance with the Superannuation Guarantee (Administration) Act 1992. The plan provides both defined
benefits and accumulation style benefits. The object of the plan is to fund the retirement, disability and death benefits of
its members.
Defined benefits
The following sets out details in respect of the defined benefit section only.
(b) Balance sheet amounts
The amounts recognised in the balance sheet are determined as follows:
CONSOLIDATED PARENT
2009$'000
2008 $'000
2009$’000
2008 $’000
Present value of the defined benefit obligation 4,995 4,483 4,995 4,483
Fair value of defined benefit plan assets 4,449 4,742 4,449 4,742
Net liability / (asset) in the balance sheet 546 (259) 546 (259)
(c) Categories of plan assets
The percentage invested in each major category of plan assets at the balance sheet date:
CONSOLIDATED PARENT
2009 2008 2009 2008
Australian equity 30% 37% 30% 37%
International equity 23% 25% 23% 25%
Fixed income 25% 18% 25% 18%
Cash 11% 9% 11% 9%
Property 5% 11% 5% 11%
Alternatives/Other 6% 0% 6% 0%
100% 100% 100% 100%

heritage building society limited financial rePort 2008 - 2009 | 51
23. RETiREMEnT BEnEfiT OBliGaTiOnS (continued)
(d) Reconciliations
CONSOLIDATED PARENT
2009$'000
2008 $'000
2009$’000
2008 $’000
Reconciliation of the present value of the defined
benefit obligation:
Balance at the beginning of the year 4,483 5,346 4,483 5,346
Current service cost 328 392 328 392
Interest cost 257 279 257 279
Contributions by plan participants 17 23 17 23
Actuarial (gain) / loss 365 (482) 365 (482)
Benefits paid (275) (938) (275) (938)
Taxes, premiums and expenses paid (180) (137) (180) (137)
Balance at the end of the year 4,995 4,483 4,995 4,483
Reconciliation of the fair value of plan assets:
Balance at the beginning of the year 4,742 5,879 4,742 5,879
Expected return on plan assets 324 432 324 432
Actuarial gain / (loss) (991) (1,102) (991) (1,102)
Employer contributions 812 585 812 585
Contributions by plan participants 17 23 17 23
Benefits paid (275) (938) (275) (938)
Taxes, premiums and expenses paid (180) (137) (180) (137)
Balance at the end of the year 4,449 4,742 4,449 4,742
(e) Principal actuarial assumptions
The principal actuarial assumptions adopted for the calculations were:
CONSOLIDATED PARENT
2009 2008 2009 2008
Discount rate 4.6% pa 5.9% pa 4.6% pa 5.9% pa
Expected rate of return on plan assets 6.8% pa 6.8% pa 6.8% pa 6.8% pa
Expected salary increase rate 4.0% pa 4.8% pa 4.0% pa 4.8% pa
The expected return on assets assumption is determined by weighting the expected long-term return for each asset class
by the target allocation of assets to each asset class and allowing for the correlations of the investment returns between
asset classes. The returns used for each asset class are net of investment tax and investments fees.
(f) Income statement
The net expense recognised in the income statement is $261,000 (2008 - net expense $239,000).
notes to the financial Statements
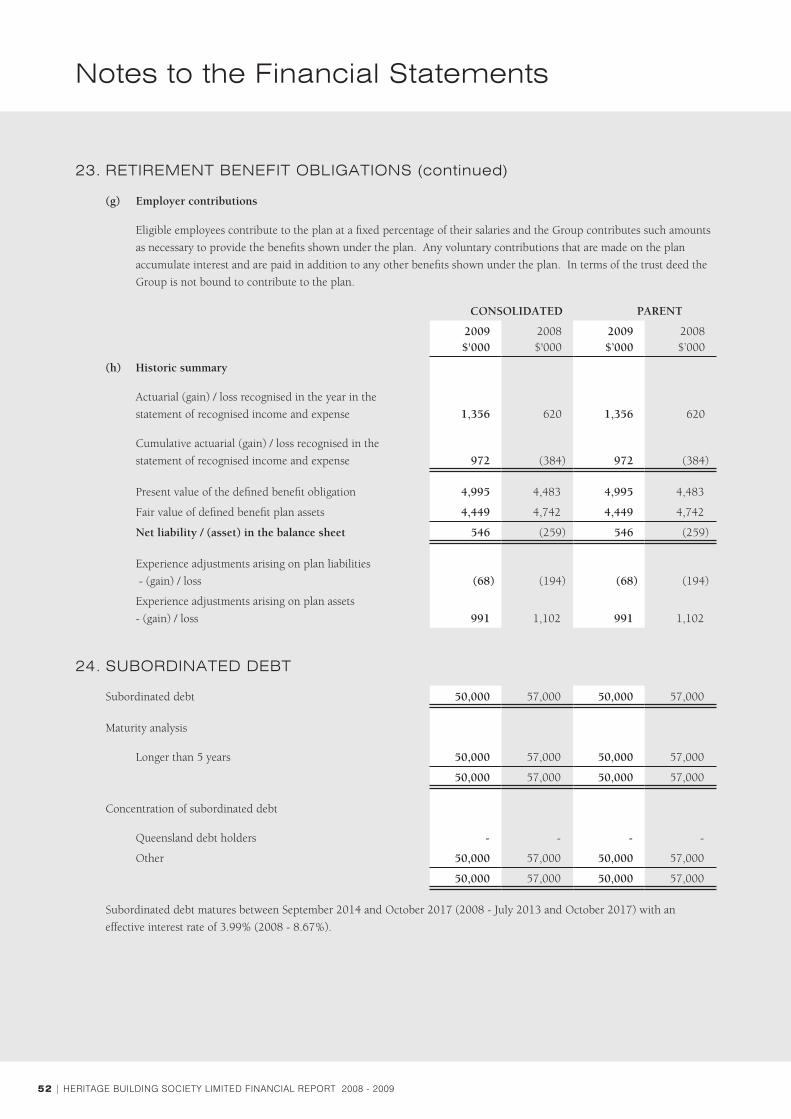
52 | heritage building society limited financial rePort 2008 - 2009
notes to the financial Statements
23. RETiREMEnT BEnEfiT OBliGaTiOnS (continued)
(g) Employer contributions
Eligible employees contribute to the plan at a fixed percentage of their salaries and the Group contributes such amounts
as necessary to provide the benefits shown under the plan. Any voluntary contributions that are made on the plan
accumulate interest and are paid in addition to any other benefits shown under the plan. In terms of the trust deed the
Group is not bound to contribute to the plan.
CONSOLIDATED PARENT
2009$'000
2008 $'000
2009$’000
2008 $’000
(h) Historic summary
Actuarial (gain) / loss recognised in the year in the
statement of recognised income and expense 1,356 620 1,356 620
Cumulative actuarial (gain) / loss recognised in the
statement of recognised income and expense 972 (384) 972 (384)
Present value of the defined benefit obligation 4,995 4,483 4,995 4,483
Fair value of defined benefit plan assets 4,449 4,742 4,449 4,742
Net liability / (asset) in the balance sheet 546 (259) 546 (259)
Experience adjustments arising on plan liabilities
- (gain) / loss (68) (194) (68) (194)
Experience adjustments arising on plan assets
- (gain) / loss 991 1,102 991 1,102
24. SUBORDinaTED DEBT
Subordinated debt 50,000 57,000 50,000 57,000
Maturity analysis
Longer than 5 years 50,000 57,000 50,000 57,000
50,000 57,000 50,000 57,000
Concentration of subordinated debt
Queensland debt holders - - - -
Other 50,000 57,000 50,000 57,000
50,000 57,000 50,000 57,000
Subordinated debt matures between September 2014 and October 2017 (2008 - July 2013 and October 2017) with an
effective interest rate of 3.99% (2008 - 8.67%).

heritage building society limited financial rePort 2008 - 2009 | 53
CONSOLIDATED PARENT
2009$'000
2008 $'000
2009$’000
2008 $’000
25. RESERVES anD RETainED PROfiTS
(a) Retained profits
Movements in retained profits were as follows:
Balance 1 July 177,625 157,779 177,625 157,779
Defined benefit superannuation plan
Actuarial gain / (loss) on defined benefit plan (1,356) (620) (1,356) (620)
Net profit for the year 25,504 20,466 25,504 20,466
Balance 30 June 201,773 177,625 201,773 177,625
(b) Reserves
Asset revaluation reserve 5,714 5,714 5,714 5,714
Cash flow hedge reserve (13,344) 15,957 8,400 (15,828)
Available for sale asset reserve 1,125 1,529 1,125 1,529
(6,505) 23,200 15,239 (8,585)
Movements:
Asset revaluation reserve
Balance 1 July 5,714 5,714 5,714 5,714
Revaluation of land - - - -
Revaluation of buildings - - - -
Balance 30 June 5,714 5,714 5,714 5,714
Cash flow hedge reserve
Balance 1 July 15,957 6,583 (15,828) (4,782)
Transfer to profit 106 (62) 106 (62)
Gain / (loss) on cash flow hedging instruments (40,464) 13,600 34,652 (15,572)
Deferred tax 11,057 (4,164) (10,530) 4,588
Balance 30 June (13,344) 15,957 8,400 (15,828)
Available for sale asset reserve
Balance 1 July 1,529 - 1,529 -
Revaluation of shares (577) 2,185 (577) 2,185
Deferred tax 173 (656) 173 (656)
Balance 30 June 1,125 1,529 1,125 1,529
notes to the financial Statements

54 | heritage building society limited financial rePort 2008 - 2009
25. RESERVES anD RETainED PROfiTS (continued)
(c) Nature and purpose of reserves
(i) Asset revaluation reserve
The property, plant and equipment revaluation reserve was used to record increments and decrements on the
revaluation of non-current assets up until the transition to IFRS. The asset revaluation reserve will not be used under the
existing accounting policy on property plant and equipment (refer Note 2 (k) ).
(ii) Cash flow hedge reserve
The hedging reserve is used to record gains or losses on a hedging instrument in a cash flow hedge that are recognised
directly in equity, as described in Note 2 (g). As the underlying transaction occurs the balance will be transferred back to
profit and loss.
(iii) Available for sale asset reserve
This reserve is used to record increments and decrements on the revaluation of the Visa shares described in Note 14 (a).
notes to the financial Statements

heritage building society limited financial rePort 2008 - 2009 | 55
26. CaSH flOW STaTEMEnT RECOnCiliaTiOn
(a) Reconciliation of the operating profit after tax to the net cash flows from operations
CONSOLIDATED PARENT
2009
$'000
2008 $'000
2009
$’000
2008 $’000
Operating profit after tax 25,504 20,466 25,504 20,466
Non cash items
Share of associates' net profits 670 (812) 670 (812)
Impairment losses on loans 2,443 1,532 2,443 1,532
Depreciation 6,396 6,324 6,396 6,324
Amortisation - loans and receivables 2,002 2,277 2,002 2,277
Provision for employee benefits 1,134 701 1,134 701
Changes in assets
Loss from sale of property, plant and equipment (22) (16) (22) (16)
Accrued interest on investments 51 (350) (305) (439)
Intangibles (942) 215 (942) 215
Sundry debtors 2,751 376 2,720 (1,505)
Prepayments 2,393 (223) 2,393 (223)
Make good asset 102 55 102 55
Expenditure carried forward (288) (1,425) (288) (1,425)
Swap asset (303) (416) (303) (416)
Available for sale asset - (6,460) - (6,460)
Defined benefit asset (1,097) (346) (1,097) (346)
Deferred tax asset 1,565 (295) (281) (7,466)
Changes in liabilities
Accrued investors interest (16,399) 9,553 (6,630) 7,919
Current tax liability 2,109 140 2,109 140
Sundry creditors 2,984 (2,215) 4,361 (2,380)
Swap liability - 3 4 3
Directors' retiring allowance 56 10 56 10
Defined benefit liability 546 - 546 -
Capitalised expenditure 493 1,030 493 1,030
Make good provision 69 109 69 109
Deferred tax liability (3,992) (628) (2,146) 6,542
Net cash flow from operating activities 28,225 29,605 38,988 25,835
(b) For the purposes of the cash flow statement, collections received / (paid) from securitised loans have been disclosed as a
separate line item.
notes to the financial Statements
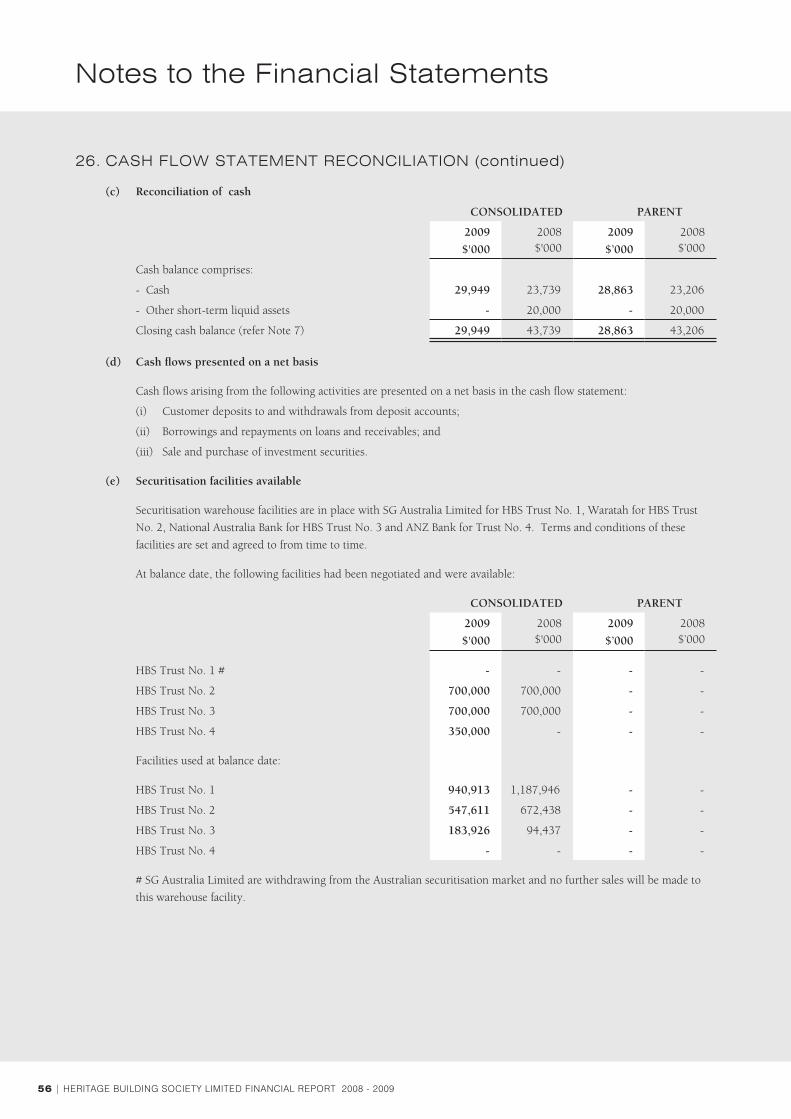
56 | heritage building society limited financial rePort 2008 - 2009
26. CaSH flOW STaTEMEnT RECOnCiliaTiOn (continued)
(c) Reconciliation of cash
CONSOLIDATED PARENT
2009
$'000
2008 $'000
2009
$’000
2008 $’000
Cash balance comprises:
- Cash 29,949 23,739 28,863 23,206
- Other short-term liquid assets - 20,000 - 20,000
Closing cash balance (refer Note 7) 29,949 43,739 28,863 43,206
(d) Cash flows presented on a net basis
Cash flows arising from the following activities are presented on a net basis in the cash flow statement:
(i) Customer deposits to and withdrawals from deposit accounts;
(ii) Borrowings and repayments on loans and receivables; and
(iii) Sale and purchase of investment securities.
(e) Securitisation facilities available
Securitisation warehouse facilities are in place with SG Australia Limited for HBS Trust No. 1, Waratah for HBS Trust
No. 2, National Australia Bank for HBS Trust No. 3 and ANZ Bank for Trust No. 4. Terms and conditions of these
facilities are set and agreed to from time to time.
At balance date, the following facilities had been negotiated and were available:
CONSOLIDATED PARENT
2009
$'000
2008 $'000
2009
$’000
2008 $’000
HBS Trust No. 1 # - - - -
HBS Trust No. 2 700,000 700,000 - -
HBS Trust No. 3 700,000 700,000 - -
HBS Trust No. 4 350,000 - - -
Facilities used at balance date:
HBS Trust No. 1 940,913 1,187,946 - -
HBS Trust No. 2 547,611 672,438 - -
HBS Trust No. 3 183,926 94,437 - -
HBS Trust No. 4 - - - -
# SG Australia Limited are withdrawing from the Australian securitisation market and no further sales will be made to
this warehouse facility.
notes to the financial Statements

heritage building society limited financial rePort 2008 - 2009 | 57
27. EXPEnDiTURE COMMiTMEnTS
(a) Capital expenditure commitments
Estimated capital expenditure contracted for at balance date but not provided for:
CONSOLIDATED PARENT
2009
$'000
2008 $'000
2009
$’000
2008 $’000
Property, plant and equipment
Payable not later than one year 708 716 708 716
Estimated capital expenditure contracted
at balance date 708 716 708 716
(b) Lease expenditure commitments
Estimated lease expenditure contracted for at balance
date but not provided for:
Operating leases (non-cancellable)
Not later than 1 year 6,951 6,561 6,951 6,561
Later than 1 and not later than 5 years 17,280 19,139 17,280 19,139
Later than 5 years 954 1,154 954 1,154
Aggregate lease expenditure contracted for
at balance date 25,185 26,854 25,185 26,854
These commitments represent payments due under non-cancellable operating leases for various premises occupied.
The average lease term is five years.
notes to the financial Statements
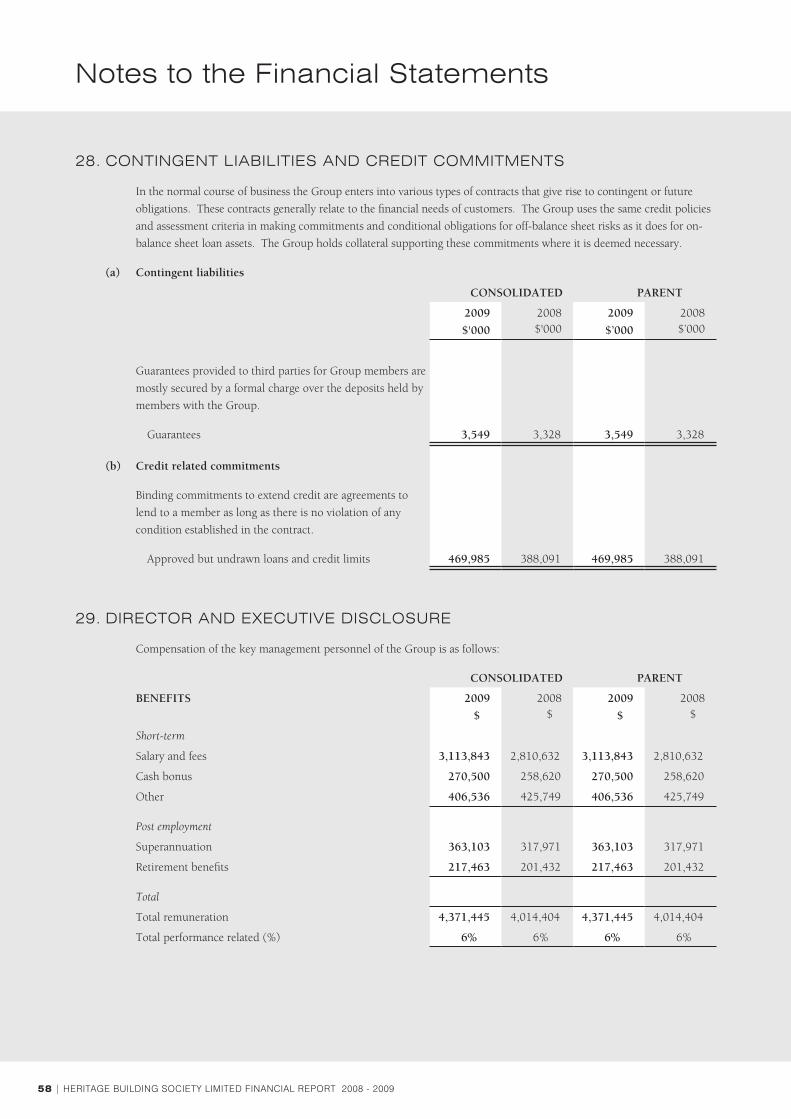
58 | heritage building society limited financial rePort 2008 - 2009
28. COnTinGEnT liaBiliTiES anD CREDiT COMMiTMEnTS
In the normal course of business the Group enters into various types of contracts that give rise to contingent or future
obligations. These contracts generally relate to the financial needs of customers. The Group uses the same credit policies
and assessment criteria in making commitments and conditional obligations for off-balance sheet risks as it does for on-
balance sheet loan assets. The Group holds collateral supporting these commitments where it is deemed necessary.
(a) Contingent liabilities
CONSOLIDATED PARENT
2009
$'000
2008 $'000
2009
$’000
2008 $’000
Guarantees provided to third parties for Group members are
mostly secured by a formal charge over the deposits held by
members with the Group.
Guarantees 3,549 3,328 3,549 3,328
(b) Credit related commitments
Binding commitments to extend credit are agreements to
lend to a member as long as there is no violation of any
condition established in the contract.
Approved but undrawn loans and credit limits 469,985 388,091 469,985 388,091
notes to the financial Statements
29. DiRECTOR anD EXECUTiVE DiSClOSURE
Compensation of the key management personnel of the Group is as follows:
CONSOLIDATED PARENT
BENEFITS 2009
$
2008$
2009
$
2008$
Short-term
Salary and fees 3,113,843 2,810,632 3,113,843 2,810,632
Cash bonus 270,500 258,620 270,500 258,620
Other 406,536 425,749 406,536 425,749
Post employment
Superannuation 363,103 317,971 363,103 317,971
Retirement benefits 217,463 201,432 217,463 201,432
Total
Total remuneration 4,371,445 4,014,404 4,371,445 4,014,404
Total performance related (%) 6% 6% 6% 6%
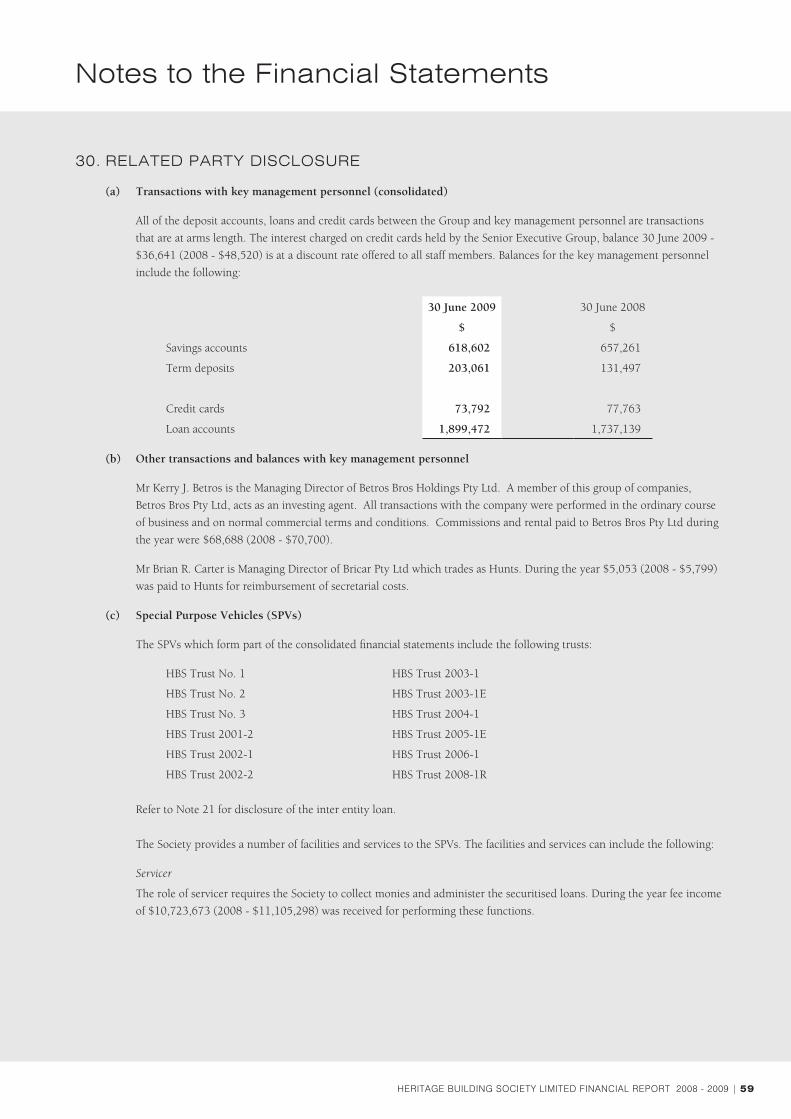
heritage building society limited financial rePort 2008 - 2009 | 59
30. RElaTED PaRTY DiSClOSURE
(a) Transactions with key management personnel (consolidated)
All of the deposit accounts, loans and credit cards between the Group and key management personnel are transactions
that are at arms length. The interest charged on credit cards held by the Senior Executive Group, balance 30 June 2009 -
$36,641 (2008 - $48,520) is at a discount rate offered to all staff members. Balances for the key management personnel
include the following:
30 June 2009 30 June 2008
$ $
Savings accounts 618,602 657,261
Term deposits 203,061 131,497
Credit cards 73,792 77,763
Loan accounts 1,899,472 1,737,139
(b) Other transactions and balances with key management personnel
Mr Kerry J. Betros is the Managing Director of Betros Bros Holdings Pty Ltd. A member of this group of companies,
Betros Bros Pty Ltd, acts as an investing agent. All transactions with the company were performed in the ordinary course
of business and on normal commercial terms and conditions. Commissions and rental paid to Betros Bros Pty Ltd during
the year were $68,688 (2008 - $70,700).
Mr Brian R. Carter is Managing Director of Bricar Pty Ltd which trades as Hunts. During the year $5,053 (2008 - $5,799)
was paid to Hunts for reimbursement of secretarial costs.
(c) Special Purpose Vehicles (SPVs)
The SPVs which form part of the consolidated financial statements include the following trusts:
HBS Trust No. 1 HBS Trust 2003-1
HBS Trust No. 2 HBS Trust 2003-1E
HBS Trust No. 3 HBS Trust 2004-1
HBS Trust 2001-2 HBS Trust 2005-1E
HBS Trust 2002-1 HBS Trust 2006-1
HBS Trust 2002-2 HBS Trust 2008-1R
Refer to Note 21 for disclosure of the inter entity loan.
The Society provides a number of facilities and services to the SPVs. The facilities and services can include the following:
Servicer
The role of servicer requires the Society to collect monies and administer the securitised loans. During the year fee income
of $10,723,673 (2008 - $11,105,298) was received for performing these functions.
notes to the financial Statements

60 | heritage building society limited financial rePort 2008 - 2009
notes to the financial Statements
30. RElaTED PaRTY DiSClOSURE (continued)
(c) Special Purpose Vehicles (SPVs) (continued)
Liquidity and redraw facility provider
The Society provides a facility to fund any redraws made by members in relation to the securitised loans. It also provides
a liquidity arrangement ensuring the SPV is able to meet its cash flow obligations. During the year fee income of $208,259
(2008 - $368,885) was received for performing these functions.
Swap provider
The Society enters into swaps with the SPVs. Interest revenue or expense in respect of these swaps is dependent on
prevailing interest rates.
The Society received $1,917,780 (2008 - $2,245,688) in interest relating to the securitisation deposits during the year.
The average balance of the securitisation deposits held was $40,458,491 (2008 - $34,665,705).
(d) Other
Details of interest in controlled entities are set out in Note 32. There are no further dealings with these entities.
Details of interest in associated companies are set out in Note 13. During the year, dividends of $1,497,600 (2008 - nil)
were received from Permanent LMI Pty Limited.
During the financial year fee income for the provision of management and accounting services of $479,436
(2008 - $494,383) was received from HBS Custodian Pty Limited.
31. aUDiTOR'S REMUnERaTiOnCONSOLIDATED PARENT
2009
$
2008 $
2009
$
2008 $
Amounts received or due and receivable by the auditors for:
An audit and review of the financial report of the Group 332,150 368,300 240,650 283,600
Taxation services 38,750 27,250 34,500 8,000
Accounting advice - financing and taxation 6,947 80,990 6,947 80,990
Securitisation services 121,800 116,400 - -
499,647 592,940 282,097 372,590
Amounts received or due and receivable by non Ernst & Young
audit firms for:
Other non-audit services in relation to the Group - - - -
- - - -
499,647 592,940 282,097 372,590

heritage building society limited financial rePort 2008 - 2009 | 61
32.COnTROllED EnTiTiES
Name of Entity
Book value of investment
% ofshares held
Country ofincorpor-
ation
Contribution toconsolidated
profit after tax
2009
$'000
2008
$'000
2009
%
2008
%
2009
$'000
2008
$'000
Parent Entity
Heritage Building Society Limited - - - - Australia - -
Special Purpose Vehicles (SPVs)
The SPVs relate to the securitisation
of the Society's loans and include the
following trusts: (Refer to Note 2 (c)
for further details).
(a) 347,000 - N/A N/A N/A - -
HBS Trust No. 1
HBS Trust No. 2
HBS Trust No. 3
HBS Trust 2001-2
HBS Trust 2002-1
HBS Trust 2002-2
HBS Trust 2003-1
HBS Trust 2003-1E
HBS Trust 2004-1
HBS Trust 2005-1E
HBS Trust 2006-1
HBS Trust 2008-1R
(a) Refer Note 16 for details.
The clean up option for HBS Trust 2002-1 was exercised on 22 June 2009. On this date pursuant to Clause 10.1 of the Series
Notice the Trust extinguished all of its right, title and interest in the remaining loans in favour of the Society.
33. SEGMEnT infORMaTiOn
The Group operated predominantly in the finance industry within Australia. The operations comprise the provision of
financial products and services to members.
Specific segmentation of loans and deposits are set out in Notes 10 and 20.
notes to the financial Statements

62 | heritage building society limited financial rePort 2008 - 2009
34. lEGal MaTTERS
On 23 January 2008 Société Générale (SG), which provides the securitisation warehouse for the HBS Trust No. 1 to the Society,
notified the Society of its decision to withdraw from its securitisation activities in Australia.
SG also made certain demands of the Society which the Society believes are outside the parameters of the contractual
arrangements between SG and the Society.
On 19 August 2008 Heritage was served with proceedings issued in the NSW Supreme Court by SG. The proceedings relate to
the facility which funds that warehouse arrangement.
SG claims that Heritage was obliged to pay an increased margin on the interest payable to SG for the 2008 and 2009 financial
years. Further, SG claims that Heritage was obliged to term out the facility annually. In addition to seeking orders to that effect,
SG seeks damages which represent the cost of finance incurred by SG and SG’s alleged loss of use of funds invested in the
facility. Accordingly, SG is seeking damages for interest foregone and SG’s alleged loss of use of funds.
The Society filed its defence in the proceedings on 26 September 2008 in which it denied the claims made by SG. Since that
time the parties have disclosed documents to each other. SG is required to serve its evidence by early September and the Society
will be required to serve its evidence by early October 2009.
Heritage is confident of its position that these claims are unfounded, and is strenuously defending the proceedings. While
Heritage has been informed that SG will be seeking to amend the legal basis for one of its claims, Heritage does not anticipate
that such amendments will impact its position. Heritage does not expect the proceedings to have a significant adverse impact
on Heritage. However, as any litigation involves risk, there can be no assurance of this.
35. EVEnTS SUBSEQUEnT TO REPORTinG DaTE
On 16 July 2009 the Society completed a $400 million Government guaranteed Transferable Certificate of Deposit issue under
the existing wholesale debt program. The proceeds form part of a more diversified funding plan for the new financial year.
There are no other significant events since the end of the financial year which will affect the operating results or state of affairs
of the Group in subsequent years.
notes to the financial Statements

heritage building society limited financial rePort 2008 - 2009 | 63
In accordance with a resolution of the directors of Heritage Building Society Limited, we state that:
In the opinion of the directors:
(a) the financial statements and notes of the Society are in accordance with the Corporations Act 2001, including:
(i) giving a true and fair view of the Society’s financial position as at 30 June 2009 and of their performance for the year
ended on that date; and
(ii) complying with Accounting Standards and Corporations Regulations 2001; and
(b) there are reasonable grounds to believe that the Society will be able to pay its debts as and when they become
due and payable.
On behalf of the Board
TOOWOOMBA BRIAN R. CARTER GRAEME G. KIDD
27 August 2009 Chairman Deputy Chairman
Directors’ Declaration

64 | heritage building society limited financial rePort 2008 - 2009

heritage building society limited financial rePort 2008 - 2009 | 65

66 | heritage building society limited financial rePort 2008 - 2009

heritage building society limited financial rePort 2008 - 2009 | 67
THiS PaGE lEfT inTEnTiOnallY BlanK

68 | heritage building society limited financial rePort 2008 - 2009
THiS PaGE lEfT inTEnTiOnallY BlanK
