financial report 2010 - brd.ro · independent auditor’s report report on conformity of the...
TRANSCRIPT

Financial Report 2010


Consolidated and individual financial statements
Prepared in Accordance withInternational Financial Reporting Standards as adopted by the European Union
DECEMBER 31, 2010

Consolidated and individual financial statements
Independent auditor’s report
Report on the Financial Statements
1. We have audited the accompanying consolidated financial statements of BRD – Groupe Societe Generale S.A., (“the Group”) which comprise the consolidated statement of financial position as at 31 December 2010, and the consolidated income statement, statement of comprehensive income, statement of changes in equity and statement of cash flows for the year then ended, and a summary of significant accounting policies and other explanatory notes. We have also audited the accompanying unconsolidated financial statements of BRD – Groupe Societe Generale S.A., (“the Bank”) which comprise the unconsolidated statement of financial position as at 31 December 2010, and the unconsolidated income statement, statement of comprehensive income, statement of changes in equity and statement of cash flows for the year then ended, and a summary of significant accounting policies and other explanatory notes.
Management’s Responsibility for the Financial Statements
2. Management is responsible for the preparation and fair presentation of these financial statements in accordance with International Financial Reporting Standards as adopted by the European Union, and for such internal control as management determines is necessary to enable the preparation of financial statements that are free from material misstatement, whether due to fraud or error.
Auditor’s Responsibility
3. Our responsibility is to express an opinion on these financial statements based on our audit. We conducted our audit in accordance with International Standards on Auditing. Those standards require that we comply with ethical requirements and plan and perform the audit to obtain reasonable assurance whether the financial statements are free from material misstatement.
4. An audit involves performing procedures to obtain audit evidence about the amounts and disclosures in the financial statements. The procedures selected depend on the auditor’s judgment, including the assessment of the risks of material misstatement of the financial statements, whether due to fraud or error. In making those risk assessments, the auditor considers internal control relevant to the Group’s/the Bank’s preparation and fair presentation of the financial statements in order to design audit procedures that are appropriate in the circumstances, but not for the purpose of expressing an opinion on the effectiveness of the entity’s internal control. An audit also includes evaluating the appropriateness of accounting policies used and the reasonableness of accounting estimates made by management, as well as evaluating the overall presentation of the financial statements.
5. We believe that the audit evidence we have obtained is sufficient and appropriate to provide a basis for our audit opinion.
Opinion – the Group
6. In our opinion, the consolidated financial statements give a true and fair view of the consolidated financial position of BRD – Groupe Societe Generale S.A. as of 31 December 2010, and its consolidated financial performance and its consolidated cash flows for the year then ended in accordance with International Financial Reporting Standards as adopted by the European Union.
Opinion – the Bank
7. In our opinion, the unconsolidated financial statements give a true and fair view of the unconsolidated financial position of BRD – Groupe Societe Generale S.A. as of 31 December 2010, and its unconsolidated financial performance and its unconsolidated cash flows for the year then ended in accordance with International Financial Reporting Standards as adopted by the European Union.

Independent auditor’s report
Report on conformity of the Administrators’ Report with the Consolidated Financial Statements
In accordance with the Order of the National Bank of Romania no. 13 from 24 December 2008, article no. 223 point e) we have read the Administrators’ Report attached to the consolidated financial statements. The Administrators’ Report is not a part of the financial statements. In the Administrators’ Report we have not identified any historic financial information which is not in accordance, in all material respects, with the information presented in the accompanying consolidated financial statements.
Ahmed Hassan, Audit Partner
Registered with the Financial Auditors’ Chamber of Romania under no. 1529/25.11.2003
On the behalf of:DELOITTE AUDIT S.R.L.Registered with the Financial Auditors’ Chamber of Romania under no.25/25.06.2001
Bucharest, Romania10 March 2011

The accompanying notes are an integral part of these financial statements(Amounts in thousands RON)
7
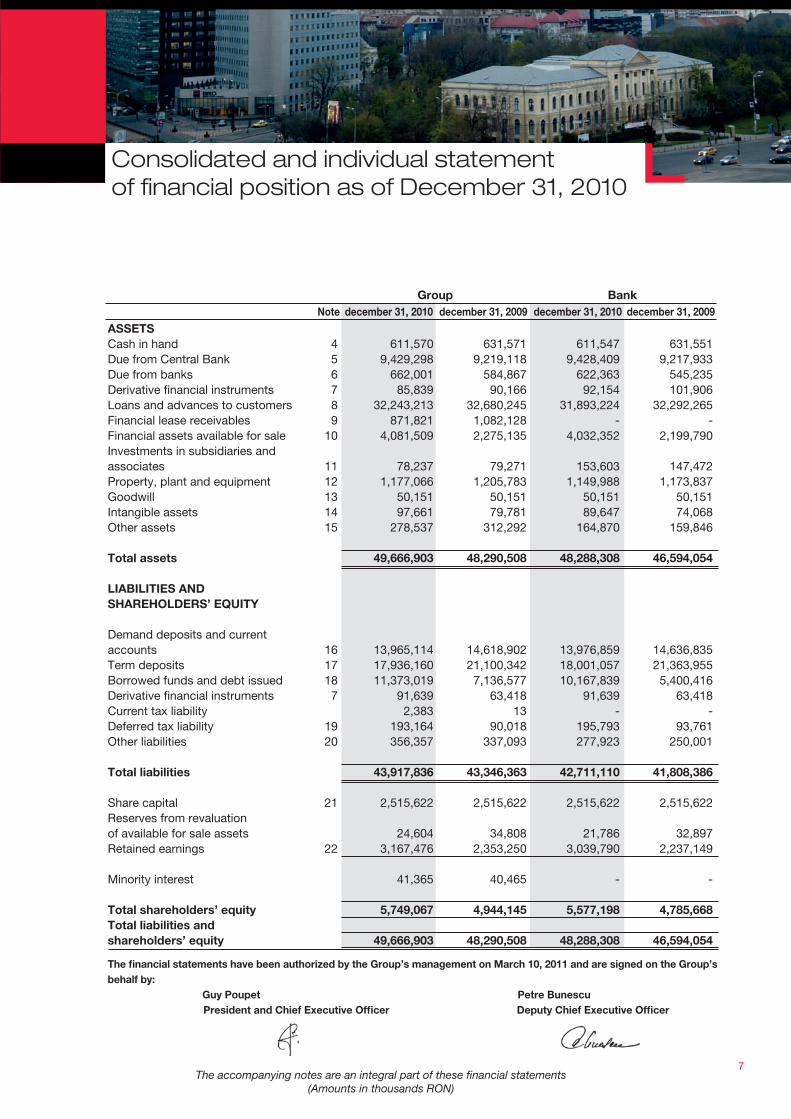
Consolidated and individual statementof financial position as of December 31, 2010
Group Bank Note december 31, 2010 december 31, 2009 december 31, 2010 december 31, 2009
ASSETS Cash in hand 4 611,570 631,571 611,547 631,551Due from Central Bank 5 9,429,298 9,219,118 9,428,409 9,217,933Due from banks 6 662,001 584,867 622,363 545,235Derivative financial instruments 7 85,839 90,166 92,154 101,906Loans and advances to customers 8 32,243,213 32,680,245 31,893,224 32,292,265Financial lease receivables 9 871,821 1,082,128 - -Financial assets available for sale 10 4,081,509 2,275,135 4,032,352 2,199,790Investments in subsidiaries and associates 11 78,237 79,271 153,603 147,472Property, plant and equipment 12 1,177,066 1,205,783 1,149,988 1,173,837Goodwill 13 50,151 50,151 50,151 50,151Intangible assets 14 97,661 79,781 89,647 74,068Other assets 15 278,537 312,292 164,870 159,846
Total assets 49,666,903 48,290,508 48,288,308 46,594,054 LIABILITIES AND SHAREHOLDERS’ EQUITY Demand deposits and current accounts 16 13,965,114 14,618,902 13,976,859 14,636,835Term deposits 17 17,936,160 21,100,342 18,001,057 21,363,955Borrowed funds and debt issued 18 11,373,019 7,136,577 10,167,839 5,400,416Derivative financial instruments 7 91,639 63,418 91,639 63,418Current tax liability 2,383 13 - -Deferred tax liability 19 193,164 90,018 195,793 93,761Other liabilities 20 356,357 337,093 277,923 250,001
Total liabilities 43,917,836 43,346,363 42,711,110 41,808,386 Share capital 21 2,515,622 2,515,622 2,515,622 2,515,622Reserves from revaluation of available for sale assets 24,604 34,808 21,786 32,897Retained earnings 22 3,167,476 2,353,250 3,039,790 2,237,149 Minority interest 41,365 40,465 - - Total shareholders’ equity 5,749,067 4,944,145 5,577,198 4,785,668Total liabilities and shareholders’ equity 49,666,903 48,290,508 48,288,308 46,594,054
The financial statements have been authorized by the Group’s management on March 10, 2011 and are signed on the Group’s
behalf by:
Guy Poupet Petre Bunescu
President and Chief Executive Officer Deputy Chief Executive Officer

The accompanying notes are an integral part of these financial statements(Amounts in thousands RON)
8
Consolidated and individual financial statements
Consolidated and individual statement of comprehensive income for the year ended December 31, 2010
Group Bank Note 2010 2009 2010 2009
Venituri din dobanzi 24 3,689,965 4,754,218 3,531,533 4,539,311Cheltuieli cu dobanzile 25 (1,370,294) (2,514,831) (1,327,267) (2,453,108)Venituri nete din dobanzi 2,319,671 2,239,387 2,204,266 2,086,203Venituri din comisioane, net 26 783,237 810,351 769,234 796,790 Foreign exchange gain 27 329,629 461,506 326,567 460,833Gain on derivative financial instruments 98,524 70,379 98,524 70,379(Loss)/Income from associates 28 237 (2,276) 8,049 1,527Other income 29 132,235 113,869 84,177 62,924 Operating income 3,663,533 3,693,216 3,490,817 3,478,656 Contribution to the Deposit Guarantee F 30 (38,287) (36,462) (38,287) (36,462)Salaries and related expenses 31 (698,767) (738,799) (661,810) (698,736)Depreciation, amortisation and impairment on tangible assets 32 (131,555) (170,948) (128,091) (162,785)Other operating expenses 33 (683,898) (691,127) (624,852) (633,180)Operating expenses (1,552,507) (1,637,336) (1,453,040) (1,531,163) Credit loss expense 34 (882,945) (605,490) (831,772) (519,258)Profit before income tax 1,228,081 1,450,390 1,206,005 1,428,235 Current income tax expense 19 (113,420) (162,657) (104,752) (161,371)Deferred tax (expense)/income 19 (105,838) (148,376) (104,915) (146,686)Total income tax (219,258) (311,033) (209,667) (308,057) Profit for the year 1,008,823 1,139,357 996,338 1,120,178 Loss attributable to minority interest (900) 6,892 - -Profit attributable to parent company shareholders 1,007,923 1,146,249 996,338 1,120,178Earnings per share (in RON) 40 1.4463 1.6448 1.4297 1.6074
Interest incomeInterest expense Net interest income Fees and commissions, net
Foreign exchange gainGain on derivative financial instruments(Loss)/Income from associatesOther income
Operating income
Contribution to the Deposit Guarantee Fund Salaries and related expenses Depreciation, amortisation and impairment on tangible assetsOther operating expensesOperating expenses
Credit loss expenseProfit before income tax
Current income tax expenseDeferred tax (expense)/incomeTotal income tax
Profit for the year
Loss attributable to minority interest Profit attributable to parent company shareholders Earnings per share (in RON)

Consolidated and individual statement of comprehensive income for the year ended December 31, 2010
9The accompanying notes are an integral part of these financial statements
(Amounts in thousands RON)
Consolidated and individual statement of changes in equity for the year ended December 31, 2010
Group Bank Note 2010 2009 2010 2009 Profit for the year 1,008,823 1,139,357 996,338 1,120,178 Other comprehensive income Net gain/(loss) on available-for-sale financial assets (12,895) 51,410 (13,995) 51,008Income tax relating to components of other comprehensive income 2,691 (6,702) 2,884 (6,408)Other comprehensive income for the year, net of tax (10,204) 44,708 (11,111) 44,600 Total comprehensive income for the year, net of tax 998,619 1,184,065 985,227 1,164,778
Attributable to: Equity holders of the parent 997,719 1,190,957 985,227 1,164,778Minority interest 900 (6,892) - -
Group
December 31, 2008 2,515,622 (9,900) 1,714,545 47,357 4,267,624Total comprehensive income - 44,708 1,146,249 (6,892) 1,184,065Equity dividends for 2008 - - (507,544) - (507,544)December 31, 2009 2,515,622 34,808 2,353,250 40,465 4,944,145Total comprehensive income - (10,204) 1,007,923 900 998,619Shared-based payment transactions - - 1,070 - 1,070Equity dividends for 2009 - - (194,767) - (194,767)December 31, 2010 21 2,515,622 24,604 3,167,476 41,365 5,749,067
Issued capital
Reserves from revaluation of
available for sale assets
Retained earnings
Minority interest
Total Note
Bank
December 31, 2008 2,515,622 (11,703) 1,624,514 4,128,433income - 44,600 1,120,179 1.164,779Equity dividends for 2008 - - (507,544) (507,544)December 31, 2009 2,515,622 32,897 2,237,149 4,785,668income - (11,111) 996,338 985,227transactions - - 1,070 1,070Equity dividends for 2009 - - (194,767) (194,767)December 31, 2010 2,515,622 21,786 3,039,790 5,577,198
Note Issued capital
Reserves from revaluation of
available for sale asset
Retained earnings
Total
21
December 31, 2008Total comprehensive incomeEquity dividends for 2008December 31, 2009Total comprehensive incomeShared-based payment transactionsEquity dividends for 2009December 31, 2010

The accompanying notes are an integral part of these financial statements(Amounts in thousands RON)
10
Consolidated and individual financial statements
Consolidated and individual statement of cash flows for the year ended December 31, 2010
Group Bank Note 2010 2009 2010 2009Cash flows from operating activities
Profit before tax
Adjustments for non-cash items Depreciation and amortization expense and net loss/(gain) from disposals of tangible and intangible assets
Share based payment Loss/(gain) from investment revaluation Net expenses from impairment of loans and from provisions Income tax paid
Operating profit before changes in operating assets and liabilities
Changes in operating assets and liabilities
Current account with NBR Accounts and deposits with banks Available for sale securities Loans Lease receivables Other assets Demand deposits Term deposits Other liabilities Total changes in operating assets and liabilities
Cash flow from operating activities
Investing activities Acquisition of equity investments Proceeds from equity investments Acquisition of tangible and intangible assets Proceeds from sale of tangible and intangible assets Cash flow from investing activities
Financing activities Increase in borrowings Dividends paid Net cash from financing activities
1,228,081
131,555
1,070(4,950)
912,795(111,050)
2,157,501
(210,180)93,698
(1,816,578)(476,398)210,307(60,519)
(653,788)(3,164,182)
151,542
(5,926,098)
(3,768,597)
(7,237)5,984
(126,572)
5,854(121,971)
4,236,442(195,043)
4,041,399
1,450,390
170,948
-3,803
625,210(285,833)
1,964,518
4,093,6227,247
(1,364,811)(1,369,093)
283,729(7,421)
(2,642,017)1,414,233
(22,459)
393,030
2,357,548
--
(190,045)
-(190,045)
(1,934,612)(506,742)
(2,441,354)
1,206,006
128,091
1,070(12,424)
857,673(104,752)
2,075,664
(210,476)93,698
(1,843,674)(460,683)
-(93,596)
(659,976)(3,362,898)
160,501
(6,377,104)
(4,301,440)
(6,591)6,294
(125,631)
5,810(120,118)
4,767,423(195,043)
4,572,380
1,428,235
162,785
--
537,810(285,656)
1,843,174
4,094,7187,247
(1,337,916)(1,435,046)
-17,734
(2,646,742)1,522,140
(4,147)
217,988
2,061,162
(5,050)-
(159,784)
-(164,834)
(1,650,198)(506,742)
(2,156,940)
35

Consolidated and individual statement of cash flows for the year ended December 31, 2010
The accompanying notes are an integral part of these financial statements(Amounts in thousands RON)
11
Group Bank Note 2010 2009 2010 2009Net movements in cash and cash equivalents
Cash and cash equivalents at beginning of the period
Cash and cash equivalents at the end of the period
Operational cash flows from interest and dividends
Interest paid Interest received Dividends received
150,831
876,092
1,026,923
2010
1,376,8573,477,652
2,342
(273,851)
1,149,943
876,092
2009
2,504,3614,500,676
2,121
150,822
836,440
987,262
2010
1,398,3513,326,887
2,342
(260,612)
1,097,052
836,440
2009
2,274,1734,091,448
2,121
35
35

The accompanying notes are an integral part of these financial statements(Amounts in thousands RON)
12
Consolidated and individual financial statements
Notes to the consolidated and individual financial statement as of and for the year ended December 31, 2010
The accompanying notes are an integral part of these financial statements(Amounts in thousands RON)
12
1. Corporate information
BRD – Groupe Société Générale (the “Bank” or “BRD”) is a joint stock company incorporated in Romania. The Bank commenced business as a state owned credit institution in 1990 by acquiring assets and liabilities of the former Banca de Investitii. The Bank headquarters and registered office is 1-7 Ion Mihalache Blvd, Bucharest.
BRD together with its subsidiaries (the “Group’) offers a wide range of banking and financial services to cor-porates and individuals, as allowed by law. The Group accepts deposits from the public and grants loans and leases, carries out funds transfer in Romania and abroad, exchanges currencies and provides other financial services for its commercial and retail customers.
The ultimate parent is Société Générale S.A. (the “Parent”or “SG”).
The Bank has 937 units throughout the country (December 31, 2009: 930).
The average number of employees of the Group during 2010 was 9,098 (2009: 9,228 ), and the number of employees of the Group as of the year-end was 9,227 (December 31, 2009: 9,150 ).
The average number of employees of the Bank during 2010 was 8,498 (2009: 8,494 ), and the number of em-ployees of the Bank as of the year-end was 8,598 (December 31, 2009: 8,476 ).
BRD – Groupe Société Générale has been quoted on the First Tier of Bucharest Stock Exchange (“BVB”) since January 15, 2001.
The shareholding structure of the Bank is as follows:
December 31, 2010 December 31, 2009
Societe Generale France 59.37% 59.37%SIF Oltenia 5.51% 5.50%SIF Banat Crisana 4.66% 4.65%SIF Transilvania 4.37% 5.00%SIF Muntenia 4.14% 5.27%SIF Moldova 3.87% 4.75%European Bank for Reconstruction and Development (“EBRD”) 5.00% 5.00%Other shareholders 13.08% 10.46%Total 100.00% 100.00%

The accompanying notes are an integral part of these financial statements(Amounts in thousands RON)
13
Notes to the consolidated and individual financial statement as of and for the year ended December 31, 2010
Notes to the consolidated and individual financial statement as of and for the year ended December 31, 2010
The accompanying notes are an integral part of these financial statements(Amounts in thousands RON)
13
2. Basis of preparation
a) Basis of preparation
In accordance with European Regulation 1606/2002 of July 19, 2002 on the application of International Accounting Standards, BRD prepared consolidated and individual financial statements for the year ended December 31, 2010 in accordance with the International Financial Reporting Standards (IFRS) as adopted by the European Union (“EU”) and in force at that date (these standards are available on European Commission Website http://ec.europa.eu/internal_market/accounting/ias/index_en.htm
The consolidated financial statements include the consolidated statement of financial position, the consoli-dated income statement, the consolidated statement of comprehensive income, the statement of changes in shareholders’ equity, the consolidated cash flow statement, and notes.
The individual financial statements include the individual statement of financial position, the individual income statement, the individual statement of comprehensive income, the statement of changes in shareholders’ equity, the individual cash flow statement, and notes.
The consolidated and the individual financial statements are presented in Romanian lei (“RON”), which is the Group’s and its subsidiaries’ functional and presentation currency, rounded to the nearest thousand, except when otherwise indicated. The consolidated and individual financial statements have been prepared on a historical cost basis, except for available-for-sale investments, derivative financial instruments, other financial assets and liabilities held for trading or financial assets and liabilities designated at fair value through profit, which have all been measured at fair value.
b) Basis for consolidation
The consolidated financial statements comprise the financial statements of the credit institution and its sub-sidiaries as at December 31, 2010. The financial statements of the subsidiaries are prepared for the same reporting period, using consistent accounting policies.
A subsidiary is an entity over which the Bank exercises control. Control is presumed to exist when direct or indirect ownership exceeds 50% of the voting power of the enterprise. The consolidated financial state-ments include the financial statements of BRD – Groupe Société Générale S.A. and the following subsidiaries: BRD Sogelease IFN S.A. (99.98% ownership, 2009: 99.98%), BRD Finance IFN S.A (49% ownership, 2009: 49%, control through the power to govern the financial and operating policies of the entity under various agreements), BRD Securities - Groupe Société Générale S.A. (99.9996% ownership, 2009: 99.9996%), BRD Corporate Finance SRL (100% ownership, 2009: 100 %) and BRD Asset Management SAI SA (99.95% own-ership, 2009: 99.95%). All intercompany transactions, balances and unrealized gains and losses on transac-tions between consolidated entities are eliminated on consolidation.
Subsidiaries are fully consolidated from the date of acquisition, being the date on which the Bank obtains control, and continue to be consolidated until the date such control ceases.
Equity and net income attributable to minority interests are shown separately in the statement of financial position and statement of comprehensive income, respectively.
Acquisition of minority interests are accounted for so as the difference between the consideration and the fair value of the share of the net assets acquired is recognized as goodwill. Any deficiency of the cost of acquisi-tion below the fair values of the identifiable net assets acquired (i.e. a discount on acquisition) is recognized directly in the income statement in the year of acquisition. The Bank is accounting the investments in subsidiaries and associates in the individual financial statements at cost.

The accompanying notes are an integral part of these financial statements(Amounts in thousands RON)
14
Consolidated and individual financial statements
Notes to the consolidated and individual financial statement as of and for the year ended December 31, 2010
14
2. Basis of preparation (continued)
c) Changes in accounting policies and adoption of revised/amended IFRS
The accounting policies adopted are consistent with those of the previous financial year.The following new and revised IFRSs have also been adopted in these consolidated financial statements. The application of these new and revised IFRSs has not had any material impact on the amounts reported for the current and prior years but may affect the accounting for future transactions or arrangements.
- IFRS 5 Non-current Assets Held for Sale and Discontinued Operations (as part of Improvements to IFRSs issued in 2009)The amendments to IFRS 5 clarify that the disclosure requirements in IFRSs other than IFRS 5 do not apply to non-current assets (or disposal groups) classified as held for sale or discontinued operations unless those IFRSs require (i) specific disclosures in respect of non-current assets (or disposal groups) classified as held for sale or discontinued operations, or (ii) disclosures about measurement of assets and liabilities within a disposal group that are not within the scope of the measurement requirement of IFRS 5 and the disclosures are not already provided in the consolidated financial statements.
- IAS 1 Presentation of Financial Statements (as part of Improvements to IFRSs issued in 2009)The amendments to IAS 1 clarify that the potential settlement of a liability by the issue of equity is not relevant to its classification as current or non current.
- IAS 1 Presentation of Financial Statements (as part of Improvements to IFRSs issued in 2010)The amendments to IAS 1 clarify that an entity may choose to present the required analysis of items of other comprehensive income either in the statement of changes in equity or in the notes to the financial statements. The amendments have been applied retrospectively.
- IAS 7 Statement of Cash Flows (as part of Improvements to IFRSs issued in 2009)The amendments to IAS 7 specify that only expenditures that result in a recognised asset in the statement of financial position can be classified as investing activities in the statement of cash flows. The application of the amendments to IAS 7 should resulted in a change in the presentation of cash outflows in respect of development costs that do not meet the criteria in IAS 38 Intangible Assets for capitalisation as part of an internally generated intangible asset.
- IFRS 3 (revised in 2008) Business Combinations
• IFRS 3(2008) allows a choice on a transaction-by-transaction basis for the measurement of non-controlling interests at the date of acquisition (previously referred to as ‘minority’ interests) either at fair value or at the non-controlling interests’ share of recognised identifiable net assets of the acquiree.
• IFRS 3(2008) changes the recognition and subsequent accounting requirements for contingent consideration. Previously, contingent consideration was recognised at the acquisition date only if payment of the contingent consideration was probable and it could be measured reliably; any subsequent adjustments to the contingent consideration were always made against the cost of the acquisition. Under the revised Standard, contingent consideration is measured at fair value at the acquisition date; subsequent adjustments to the consideration are recognised against the cost of the acquisition only to the extent that they arise from new information obtained within the measurement period (a maximum of 12 months from the acquisition date) about the fair value at the date of acquisition. All other subsequent adjustments to contingent consideration classified as an asset or a liability are recognised in profit or loss.
The accompanying notes are an integral part of these financial statements(Amounts in thousands RON)

The accompanying notes are an integral part of these financial statements(Amounts in thousands RON)
15
Notes to the consolidated and individual financial statement as of and for the year ended December 31, 2010
Notes to the consolidated and individual financial statement as of and for the year ended December 31, 2010
15
2. Basis of preparation (continued)
c) Changes in accounting policies and adoption of revised/amended IFRS (continued)
• IFRS 3(2008) requires the recognition of a settlement gain or loss when the business combination in effect settles a pre-existing relationship between the Group and the acquiree.
• IFRS 3(2008) requires acquisition-related costs to be accounted for separately from the business combination, generally leading to those costs being recognised as an expense in profit or loss as incurred, whereas previously they were accounted for as part of the cost of the acquisition.
• As part of Improvements to IFRSs issued in 2010, IFRS 3(2008) was amended to clarify that the measurement choice regarding non-controlling interests at the date of acquisition (see above) is only available in respect of non-controlling interests that are present ownership interests and that entitle their holders to a proportionate share of the entity’s net assets in the event of liquidation. All other types of non-controlling interests are measured at their acquisition-date fair value, unless another measurement basis is required by other Standards.
• In addition, as part of Improvements to IFRSs issued in 2010, IFRS 3(2008) was amended to give more guidance regarding the accounting for share-based payment awards held by the acquiree’s employees. Specifically, the amendments specify that share-based payment transactions of the acquiree that are not replaced should be measured in accordance with IFRS 2 Share-based Payment at the acquisition date (‘market-based measure’).
• The Standard defines impact on the acquisition accounting if the acquirer and acquiree were parties to a previous relation. IFRS 3 states that an entity has to classify all contractual terms as at the acquisition date with two exceptions: leases and insurance contracts. The acquirer applies its accounting standards and makes decisions in such a way as if the contractual relationship were taken over regardless of the business combination.
- IAS 27 (revised in 2008) Consolidated and Separate Financial StatementsIn specific conditions, early application is permitted. According to the revised standard, changes in the acquiree’s interest in its subsidiary that do not result in a loss of control are accounted for in equity as transactions with owners in their capacity as owners. For such transactions, no financial profit/loss is recognized or goodwill remeasured. Any difference between the change in the non-controlling interest and the fair value of the consideration paid or received is recognised directly in equity and attributed to the owners of the parent. The Standard defines accounting procedures to be applied by the parent if control of a subsidiary is lost. Amendments to IAS 28 and IAS 31 extend requirements regarding accounting for loss of control. If therefore an investor has lost significant impact on its associate, the entity should be derecognized and the difference between the total of cash inflows and the preserved interest in fair value and the carrying value of investment in the associate as at the date of losing the significant impact recognized in the profit/loss. A similar approach is required if an investor loses control over a jointly controlled entity.
- IAS 28 (revised in 2008) Investments in AssociatesWhen control of a subsidiary is lost as a result of a transaction, event or other circumstance, the revised Standard requires the Group to derecognise all assets, liabilities and non-controlling interests at their carrying amount and to recognise the fair value of the consideration received. Any retained interest in the former subsidiary is recognised at its fair value at the date control is lost. The resulting difference is recognised as a gain or loss in profit or loss.

The accompanying notes are an integral part of these financial statements(Amounts in thousands RON)
16
Consolidated and individual financial statements
Notes to the consolidated and individual financial statement as of and for the year ended December 31, 2010
2. Basis of preparation (continued)
c) Changes in accounting policies and adoption of revised/amended IFRS (continued)
The principle adopted under IAS 27(2008) (see above) that a loss of control is recognised as a disposal and re-acquisition of any retained interest at fair value is extended by consequential amendments to IAS 28. Therefore, when significant influence over an associate is lost, the investor measures any investment retained in the former associate at fair value, with any consequential gain or loss recognised in profit or loss.As part of Improvements to IFRSs issued in 2010, IAS 28(2008) has been amended to clarify that the amendments to IAS 28 regarding transactions where the investor loses significant influence over an associate should be applied prospectively.
- Amendments to IFRS 2 Share-based Payment – Group Cash-settled Share-based Payment TransactionsThe amendments clarify: (1) the scope of IFRS 2. An entity that receives goods or services in a share-based payment arrangement must account for those goods or services no matter which entity in the group settles the transaction, and no matter whether the transaction is settled in shares or cash, (2) the interaction of IFRS 2 and other standards. The Board clarified that in IFRS 2 a ‘group’ has the same meaning as in IAS 27 Consolidated and Separate Financial Statements, that is, it includes only a parent and its subsidiaries. The amendments to IFRS 2 also incorporate guidance previously included in IFRIC 8 Scope of IFRS 2 and IFRIC 11 IFRS 2—Group and Treasury Share Transactions. As a result, the IASB has withdrawn IFRIC 8 and IFRIC 11.
- Amendments to IFRS 5 Non-current Assets Held for Sale and Discontinued Operations (as part of Improvements to IFRSs issued in 2008)The amendments clarify that all the assets and liabilities of a subsidiary should be classified as held for sale when the Group is committed to a sale plan involving loss of control of that subsidiary, regardless of whether the Group will retain a non-controlling interest in the subsidiary after the sale.
- Amendments to IAS 39 Financial Instruments: Recognition and Measurement – Eligible Hedged ItemsThe revised Standard explains two hedge accounting issues: identifying inflation as a hedged risk or its portion; and hedging with options. The amendments make clear that inflation may only be hedged in the instance where changes in inflation are a contractually specified portion of cash flows of a recognised financial instrument. The amendments also clarify that a risk-free or benchmark interest rate portion of the fair value of a fixed-rate financial instrument will normally be separately identifiable and reliably measurable and, therefore, may be hedged. The revised IAS 39 permits an entity to designate purchased (or net purchased) options as a hedging instrument in a hedge of a financial or non-financial item. An entity may designate an option as a hedge of changes in the cash flows or fair value of a hedged item above or below a specified price or other variable (a one-sided risk). - IFRIC 17 Distributions of Non-cash Assets to Owners The Interpretation provides guidance on the appropriate accounting treatment when an entity distributes assets other than cash as dividends to its shareholders. The most significant conclusion reached by the IFRIC is that the dividend should be measured at the fair value of the assets distributed, and that any difference between this amount and the previous carrying amount of the assets distributed should be recognised in profit or loss when the entity settles the dividend payable. The Interpretation does not apply to non-cash assets if distribution does not result in a change of control.

The accompanying notes are an integral part of these financial statements(Amounts in thousands RON)
17
Notes to the consolidated and individual financial statement as of and for the year ended December 31, 2010
Notes to the consolidated and individual financial statement as of and for the year ended December 31, 2010
2. Basis of preparation (continued)
c) Changes in accounting policies and adoption of revised/amended IFRS (continued)
- IFRIC 18 Transfers of Assets from Customers The Interpretation addresses the accounting by recipients for transfers of property, plant and equipment from ‘customers’ and concludes that when the item of property, plant and equipment transferred meets the definition of an asset from the perspective of the recipient, the recipient should recognise the asset at its fair value on the date of the transfer, with the credit being recognised as revenue in accordance with IAS 18 Revenue.
d) Standards and Interpretations that are issued but have not yet come into effect
Standards issued but not yet effective up to the date of issuance of the bank’s financial statements are listed below. This listing is of standards and interpretations issued, which the bank reasonably expects to be applicable at a future date. The bank intends to adopt those standards when they become effective.
- IAS 24 Related Party Disclosures (Amendment)The amended standard is effective for annual periods beginning on or after 1 January 2011. It clarified the definition of a related party to simplify the identification of such relationships and to eliminate inconsistencies in its application. The revised standard introduces a partial exemption of disclosure requirements for government-related entities. The bank does not expect any impact on its financial position or performance. Early adoption is permitted for either the partial exemption for government-related entities or for the entire standard.
- IAS 32 Financial Instruments: Presentation – Classification of Rights IssuesThe amendment to IAS 32 is effective for annual periods beginning on or after 1 February 2010 and amended the definition of a financial liability in order to classify rights issues (and certain options or warrants) as equity instruments in cases where such rights are given pro rata to all of the existing owners of the same class of an entity’s non-derivative equity instruments, or to acquire a fixed number of the entity’s own equity instruments for a fixed amount in any currency. This amendment will have no impact on the bank after initial application.
- IFRIC 14 Prepayments of a minimum funding requirement (Amendment)The amendment to IFRIC 14 is effective for annual periods beginning on or after 1 January 2011 with retrospective application. The amendment provides guidance on assessing the recoverable amount of a net pension asset. The amendment permits an entity to treat the prepayment of a minimum funding requirement as an asset. The amendment is expected to have no impact on the financial statements of the bank
- IFRIC 19 Extinguishing Financial Liabilities with Equity InstrumentsIFRIC 19 is effective for annual periods beginning on or after 1 July 2010. The interpretation clarifies that equity instruments issued to a creditor to extinguish a financial liability qualify as consideration paid. The equity instruments issued are measured at their fair value. In case this cannot be reliably measured, they are measured at the fair value of the liability extinguished.Any gain or loss is recognised immediately in profit or loss. The adoption of this interpretation will have no effect on the financial statements of the bank.

The accompanying notes are an integral part of these financial statements(Amounts in thousands RON)
18
Consolidated and individual financial statements
Notes to the consolidated and individual financial statement as of and for the year ended December 31, 2010
2. Basis of preparation (continued)
d) Standards and Interpretations that are issued but have not yet come into effect (continued)
- Improvements to IFRSs (issued in May 2010)The International Accounting Standards Board (IASB) issued in May 2010 improvements to IFRSs of its annual improvement process which aims at streamlining and clarifying the international accounting standards. The majority of the amendments are clarifications or corrections of existing IFRS or amendments consequential to changes previously made (IFRS 1, IFRS 3, IFRS 7, IAS 1, IAS 21, IAS 27, IAS 28, IAS 31, IAS 32, IAS 34, IAS 39, IFRIC 13) with a view to removing inconsistency and clarifying wording. The amendments have not been adopted as they become effective for annual periods on or after either 1 July 2010 or 1 January 2011. The Group and the Bank, however, expects no impact from the adoption of the above amendments on its financial position or performance. e) Significant accounting judgments and estimates
In the process of applying the Group’s accounting policies, management is required to use its judgments and make estimates in determining the amounts recognized in the financial statements. The most significant use of judgments and estimates are as follows:
Going concernThe Bank’s management has made an assessment of the Bank’s ability to continue as a going concern and is satisfied that the bank has the resources to continue in business for the foreseeable future. Furthermore, management is not aware of any material uncertainties that may cast significant doubt upon the bank’s ability to continue as a going concern. Therefore, the financial statements continue to be prepared on the going concern basis.
Fair value of financial instrumentsWhere the fair values of financial assets and financial liabilities recorded on the statement of financial position cannot be derived from active markets, they are determined using a variety of valuation techniques that include the use of mathematical models. The inputs to these models are derived from observable market data where possible, but where observable market data are not available, judgment is required to establish fair values. The judgments include considerations of liquidity and model inputs such as volatility for longer dated derivatives and discount rates, prepayment rates and default rate assumptions for asset backed securities. The valuation of financial instruments is described in more detail in Note 43.
Impairment losses on loans and receivablesThe Group reviews its problem loans and advances at each reporting date to assess whether an allowance for impairment should be recorded in the income statement. In particular, judgment by management is required in the estimation of the amount and timing of future cash flows when determining the level of allowance required. Such estimates are based on assumptions about a number of factors and actual results may differ, resulting in future changes to the allowance.
The main considerations for the loan impairment assessment include whether any payments of principal or interest are overdue by more than 90 days or whether there are any known difficulties in the cash flows of counterparties, credit rating downgrades, or infringement of the original terms of the contract.

The accompanying notes are an integral part of these financial statements(Amounts in thousands RON)
19
Notes to the consolidated and individual financial statement as of and for the year ended December 31, 2010
Notes to the consolidated and individual financial statement as of and for the year ended December 31, 2010
2. Basis of preparation (continued)
e) Significant accounting judgments and estimates (continued)
In addition to specific allowances against individually significant loans and advances, the Group also makes a collective impairment allowance against exposures which, although not specifically identified as requiring a specific allowance, have a greater risk of default than when originally granted. This takes into consideration factors such as any deterioration in country risk, industry, and technological obsolescence, as well as identified structural weaknesses or deterioration in cash flows.
Impairment of available-for-sale investmentsThe Group reviews its debt securities classified as available-for-sale investments at each statement of financial position date to assess whether they are impaired. This requires similar judgment as applied to the individual assessment of loans and advances.The Group also records impairment charges on available-for-sale equity investments when there has been a significant or prolonged decline in the fair value below their cost. The determination of what is ‘significant’ or ‘prolonged’ requires judgment. In making this judgment, the Group evaluates, among other factors, historical share price movements and duration and extent to which the fair value of an investment is less than its cost.
Impairment of goodwillThe Group determines whether the goodwill is impaired at least on an annual basis. This requires an estimation of the value in use of the cash-generating units to which the goodwill is allocated. Estimating the value in use requires the Group to make an estimate of the expected future cash flows from the cash generating unit and also to choose a suitable discount rate in order to calculate the present value of those cash flows. The carrying amount of goodwill as of December 31, 2010 was 50,151 (December 31, 2009: 50,151).
Deferred tax assetsDeferred tax assets are recognized in respect of tax losses to the extent that it is probable that taxable profit will be available against which the losses can be utilized. Judgment is required to determine the amount of deferred tax assets that can be recognized, based upon the likely timing and level of future taxable profits, together with future tax planning strategies.
Retirement benefitsThe cost of the defined benefit retirement plan is determined using an actuarial valuation. The actuarial valuation involves making assumptions about discount rates, expected rates of return on assets, future salary increases and mortality rates. Due to the long term nature of these plans, such estimates are subject to significant uncertainty. The assumptions are described in Note 20.
f) Segment information
The operations undertaken by the Group’s entities are subject to similar risks and returns both from economic environment point of view and type of activity point of view. Therefore, the Group has not identified operating segments which should be reported separately.

The accompanying notes are an integral part of these financial statements(Amounts in thousands RON)
20
Consolidated and individual financial statements
Notes to the consolidated and individual financial statement as of and for the year ended December 31, 2010 3. Summary of significant accounting policies
a) Foreign currency translation
Transactions in foreign currencies are initially recorded at the functional currency rate ruling on the date of the transaction. Monetary assets and liabilities denominated in foreign currencies are retranslated at the functional currency rate of exchange ruling at the statement of financial position date. All differences are taken to the profit and loss. Non-monetary items that are measured in terms of historical cost in a foreign currency are translated using the exchange rates as of the dates of the initial transactions. Non-monetary items measured at fair value in a foreign currency are translated using the exchange rates at the date when the fair value was determined. The exchange rates of the currencies with the most significant impact on the Group’s financial statements as of December 31, 2010 and 2009 were as follows:
December 31, 2010 December 31, 2009 RON/ USD 3.2045 2.9361 RON/ EUR 4.2848 4.2282
b) Cash and cash equivalents
For the purpose of the cash flow statements, cash and cash equivalents comprise cash in hand, current accounts and short-term placements at other banks, excluding collaterals, treasury bills and other short-term highly liquid investments, with less than 90 days maturity from the date of acquisition.
c) Current accounts and deposits with banks
These are stated at amortized cost, less any amounts written off and provisions for impairment.
d) Loans and advances to customers and finance lease receivables
Loans and advances to customers and finance lease receivables originated by the Group by providing money directly to the borrower are recognized when the cash is advanced to those parties. They are measured initially at fair value including arrangement costs. Loans and advances to customers are subsequently measured at amortized cost using the effective interest rate method, less allowance for impairment.
If there is objective evidence that the Group will not be able to collect all amounts due (principal and interest) according to the original contractual terms of the loan / finance lease, such loans / finance leases are considered impaired. The amount of the impairment is the difference between the carrying amount and the recoverable amount of each loan / finance lease receivable, being the present value of expected cash flows discounted at the loan’s original effective interest rate including the amounts expected to be recovered from collateral, if the loan / finance lease receivable is collateralized and foreclosure is probable.
Impairment and recoverability are measured and recognized item by item for loans and receivables that are individually significant, and on a portfolio basis for similar loans and receivables that are not individually identified as impaired. The carrying amount of the asset is reduced to its estimated recoverable amount by a charge to income statement through the use of an allowance for loan impairment account and is presented in the income statement as “credit loss expense”. If the amount of the impairment subsequently decreases due to an event occurring after the impairment, the release of the allowance is credited to the income statement. A write off is made when the entire loan / finance lease receivable is deemed uncollectible. Write offs are charged against previously established impairment allowances and reduce the principal amount of a loan / finance lease receivable. Recoveries of loans and receivables written off in earlier period are included in income.

The accompanying notes are an integral part of these financial statements(Amounts in thousands RON)
21
Notes to the consolidated and individual financial statement as of and for the year ended December 31, 2010
Notes to the consolidated and individual financial statement as of and for the year ended December 31, 2010
3. Summary of significant accounting policies (continued)
e) Renegotiated loans
Where possible, the Group seeks to restructure loans rather than to take possession of collateral. This may involve extending the payment arrangements and the agreement of new loan conditions. Once the terms have been renegotiated the loan is no longer considered past due. Management continuously reviews renegotiated loans to ensure that all criteria are met and that future payments are likely to occur. The loans continue to be subject to an individual or collective impairment assessment.
f) Leases
The determination of whether an arrangement is, or contains a lease is based on the substance of the arrangement and requires an assessment of whether the fulfillment of the arrangement is dependent on the use of a specific asset or assets and the arrangement conveys a right to use the asset.
Group as a lessor
Finance leases are those which transfer to the lessee substantially all the risks and benefits incidental to ownership of the leased item and are recognized as assets at the inception of the lease at the fair value of the leased property or, if lower, at the present value of the minimum lease payments. Lease payments are allocated both to the principal and the income statement on a pattern reflecting a constant periodic rate of return on the lessor’s net investment outstanding in respect of the finance lease.
Leases where the Group retains substantially all the risks and benefits of ownership of the asset are classified as operating leases. Lease income from operating leases is recognized in income on a straight-line basis over the lease term.
Group as a lessee
Leases which do not transfer to the bank substantially all the risks and benefits incidental to ownership of the leased items are operating leases. Operating lease payments are recognized as an expense in the income statement on a straight line basis over the lease term. Contingent rental payable are recognized as an expense in the period in which they are incurred.
g) Investment in associates
An associate is an enterprise in which the Group exercises significant influence and is neither a subsidiary nor a joint venture. Associates are accounted using the equity method for consolidation purposes and cost method for individual financial statements.
Under the equity method, an investment in an associate is carried in the statement of financial position at cost plus post-acquisition changes in the Group’s share of net assets of the associate. Goodwill relating to an associate is included in the carrying amount of the investment and is not amortized. The Group does an assessment of any additional impairment loss with respect to the net investment in associate. The income statement reflects the share of the results of operations of associates. Where there has been a change recognized directly in the equity of the associate, the Group recognizes its share of any changes and discloses this, when applicable, in the statement of changes in equity.
The reporting dates of associates and the Group are identical and the associates’ major accounting policies conform to those used by the Group for like transactions and similar events in similar circumstances.
h) Investments and other financial assets classified as available for sale
Available-for-sale financial assets are those non-derivative financial assets that are designated as available for sale or are not classified as (a) loans and receivables, (b) held-to-maturity investments or (c) financial assets at fair value through profit or loss.

The accompanying notes are an integral part of these financial statements(Amounts in thousands RON)
22
Consolidated and individual financial statements
Notes to the consolidated and individual financial statement as of and for the year ended December 31, 2010
3. Summary of significant accounting policies (continued)
h) Investments and other financial assets classified as available for sale
Available for sale financial assets are recognized initially at fair value plus directly attributable transaction costs.
All regular way purchases and sales of financial assets are recognized on the settlement date. Fair value movements between trade date and settlement date are recognized in other comprehensive income.
Regular way purchases or sales are purchases or sales of financial assets that require delivery within the period generally established by regulation or convention in the marketplace.
After initial recognition available-for sale financial assets are measured at fair value with gains or losses being recognized as other comprehensive income in the available for sale reserve until the investment is derecognized or until the investment is determined to be impaired at which time the cumulative gain or loss previously reported in the available for sale reserve is included in the income statement.
The fair value of investments that are actively traded in organized financial markets is determined by reference to quoted market bid prices at the close of business on the statement of financial position date.
If an available-for sale asset carried at fair value is impaired, an amount comprising the difference between its cost and its current fair value less any impairment loss previously recognized in profit or loss is transferred from available for sale reserve to income statement. Reversals in respect of equity instruments classified as available-for sale are not recognized in income statement.
If the fair value cannot be reliably determined (for investment where there is no active market), the fair value is determined by using valuation techniques with reference to observable market inputs.
i) Tangible assets
Buildings and other tangible assets are stated at cost less accumulated depreciation and any impairment loss.
In accordance with IAS 29 “Reporting in Hyperinflationary Economies”, tangible assets have been restated, as appropriate, by applying the change in the consumer price index from the date of acquisition through December 31, 2003.
Depreciation is computed on a straight-line basis over the estimated useful life of the asset, as stated below:
Asset type Years Buildings and special constructions 10-40Computers and equipment 3-6Furniture and other equipment 10Vehicles 5
Land is not depreciated. Construction-in-progress is not depreciated until used. Expenses for repairs and maintenance are charged to operating expenses as incurred. Subsequent expenditure on property and equipment is recognized as an asset under the same general recognition principle used at initial recognition.
The carrying values of tangible assets are reviewed for impairment when events or changes in circumstances indicate the carrying value may not be recoverable. Where the carrying amount of a tangible asset is greater than the estimated recoverable amount, it is written down to its recoverable amount. Tangible assets are derecognized upon disposal or when no future economic benefits are expected from its use or disposal. Any gain or loss arising on de-recognition of the asset (calculated as the difference between the net disposal proceeds and the carrying amount of the asset) is included in the income statement in the year the asset is derecognized.

The accompanying notes are an integral part of these financial statements(Amounts in thousands RON)
23
Notes to the consolidated and individual financial statement as of and for the year ended December 31, 2010
Notes to the consolidated and individual financial statement as of and for the year ended December 31, 2010
3. Summary of significant accounting policies (continued)
j) Borrowing costs
All borrowing costs that are directly attributable to the acquisition or construction of a qualifying asset are capitalised. A qualifying asset is an asset that necessarily takes a substantial period of time to get ready for its intended use or sale.
k) Investment properties
Investment properties are measured initially at cost including transaction costs. Subsequent to initial recognition, investment properties are carried at cost less any accumulated depreciation and any accumulated impairment losses.
Investment properties are derecognized when either they have been disposed off or when the investment property is permanently withdrawn from use and no future economic benefit is expected from its disposal. Any gains or losses on the retirement or disposal of an investment property are recognized in the income statement in the year of retirement or disposal.
Transfers are made to investment property when and only when, there is a change in use, evidenced by ending of owner-occupation, commencement of an operating lease to another party, or ending of construction or development. Transfers are made from investment property when and only when, there is a change in use evidenced by commencement of owner-occupation or commencement of development with a view to sale.
The depreciation of buildings included in investment properties is computed using the linear method over the useful lives as presented in note 3. i).
l) Goodwill
Goodwill acquired in a business combination is initially measured at cost being the excess of the cost of the business combination over the Group’s interest in the net fair value of the identifiable assets, liabilities and contingent liabilities. Following initial recognition, goodwill is measured at cost less any accumulated impairment losses.
Starting January 1, 2004 goodwill is not amortized any longer and is reviewed for impairment at each reporting date or more frequently if events or changes in circumstances indicate that the carrying value may be impaired. Impairment is determined by assessing the recoverable amount of the cash-generating unit, to which the goodwill relates. Where the recoverable amount of cash-generating unit is less than the carrying amount, an impairment loss is recognized.
m) Intangible assets
Intangible assets are measured initially at cost. Following initial recognition intangible assets are carried at cost less any accumulated amortization and any accumulated impairment losses.
In accordance with IAS 29 “Reporting in Hyperinflationary Economies”, intangible assets have been restated, as appropriate, by applying the change in the consumer price index from the date of acquisition through December 31, 2003.
All intangible assets of the Group carried as of December 31, 2010 and 2009 have finite useful lives and are amortized on a straight-line basis over the estimated useful life of up to 5 years. The amortization period and the amortization method are reviewed at least at each financial year end.
At each statement of financial position date, intangibles are reviewed for indication of impairment or changes in estimated future benefits. Where the carrying amount of an asset is greater than the estimated recoverable amount, it is written down to its recoverable amount.

The accompanying notes are an integral part of these financial statements(Amounts in thousands RON)
24
Consolidated and individual financial statements
Notes to the consolidated and individual financial statement as of and for the year ended December 31, 20103. Summary of significant accounting policies (continued)
n) Derivative financial instruments
The Group uses derivative financial instruments such as forward currency contracts, currency swaps, currency options, forward and swaps on interest rate as products offered to its clients but also to hedge its risks associated with interest rate, liquidity and foreign currency. Such derivative financial instruments are initially recognized at fair value on the date on which a derivative contract is entered into and are subsequently re-measured at fair value.
Derivatives are carried as assets when their fair value is positive and as liabilities when fair value is negative. Any gains or losses arising from changes in fair value of derivatives are taken directly to profit or loss for the year.
The fair value of forward currency contracts is calculated by reference to current forward exchange rates for contracts with similar maturity profiles. The fair value of interest swap contracts is determined by reference to market values of similar instruments.
The Group did not apply hedge accounting.
o) Borrowings
Borrowings are initially recognized at the fair value of the consideration received less directly attributable transaction costs. Subsequently borrowings are stated at amortized cost using the effective interest rate method. Gains and losses are recognized in net profit or loss when the liabilities are derecognized as well as through the amortization process.
p) Offsetting of financial assets and liabilities
Financial assets and liabilities are offset and the net amount reported in the statement of financial position when there is a legally enforceable right to set off the recognized amounts and there is an intention to settle or realize on a net basis.
q) Sale and repurchase agreements
Securities sold with a simultaneous commitment to repurchase at a specified future date (repos) continue to be recognized in the statement of financial position as securities and are measured in accordance with the applicable accounting policies. The liability for amounts received under these agreements is included in customers’ deposits. The difference between sale and repurchase price is treated as interest expense using the effective yield method. Assets acquired with a corresponding commitment to resell at a specified future date (reverse repos) are recorded as loans and advances.
r) Customers’ deposits and current accounts
Customers’ current accounts and other deposits are carried at amortized cost using the effective interest rates.
s) De-recognition of financial assets and liabilities
Financial assetsA financial asset is derecognized where:• The rights to receive cash flows from the assets have expired;• The Group retains the right to receive cash flows from the asset , but has assumed an obligation to pay
them in full without material delay to a third party under a “pass-through” arrangement; or• The Group has transferred its rights to receive cash flows from the asset and either a) has transferred
substantially all the risks and rewards of the asset, or b) has neither transferred nor retained substantially all the risks and rewards of the asset, but has transferred control of the asset.

The accompanying notes are an integral part of these financial statements(Amounts in thousands RON)
25
Notes to the consolidated and individual financial statement as of and for the year ended December 31, 2010
Notes to the consolidated and individual financial statement as of and for the year ended December 31, 2010
3. Summary of significant accounting policies (continued)
s) De-recognition of financial assets and liabilities (continued)
Financial liabilitiesA financial liability is derecognized when the obligation under the liability is discharged, cancelled or expires.
Where an existing financial liability is replaced by another from the same lender on substantially different terms, or the terms of an existing liability are substantially changed, such an exchange or modification is treated as a de-recognition of the original liability and the recognition of a new liability, and the difference in the respective carrying amounts are recognized in profit or loss.
t) Recognition of income and expenses
Revenue is recognized to the extent that it is probable that the economic benefits will flow to the Group and the benefits can be reliably measured. The following specific recognition criteria must also be met before revenue is recognized:
Interest and similar income
For all financial instruments measured at amortized cost and interest bearing financial instruments classified as available-for-sale, interest income or expense is recorded at the effective interest rate, which is the rate that exactly discounts estimated future cash payments or receipts through the expected life of the financial instrument or a shorter period, where appropriate, to the net carrying amount of the financial asset or financial liability. The calculation takes into account all contractual terms of the financial instrument and includes any origination fees and incremental costs that are directly attributable to the instrument and are an integral part of the effective interest rate. The adjusted carrying amount is calculated based on the original effective interest rate and the change in carrying amount is recorded as interest income or expense.
Once the recorded value of a financial asset or a group of similar financial assets has been reduced due to an impairment loss, interest income continues to be recognized using the original effective interest rate applied to the new carrying amount.
Fee and commission income
The Group earns fee and commission income from a diverse range of services it provides to its customers. Fee income can be divided into the following two categories:
(i) Fee income earned from services that are provided over a certain period of time
Fees earned for the provision of services over a period of time are accrued over that period. These fees include asset management, custody and other management and advisory fees.
(ii) Fee income from providing transaction services
Fees arising from negotiating or participating in the negotiation of a transaction for a third party – such as the arrangement of the acquisition of shares or other securities or the purchase or sale of businesses – are recognized on completion of the underlying transaction. Fees or components of fees that are linked to a certain performance are recognized after fulfilling the corresponding criteria.
Dividend incomeRevenue is recognized when the Group’s right to receive the payment is established.
Net trading income
Results arising from trading activities include all gains and losses from changes in fair value and dividends for financial assets and financial liabilities held for trading.

The accompanying notes are an integral part of these financial statements(Amounts in thousands RON)
26
Consolidated and individual financial statements
Notes to the consolidated and individual financial statement as of and for the year ended December 31, 20103. Summary of significant accounting policies (continued)
u) Employee benefits
Short-term employee benefits:Short-term employee benefits include wages, salaries and social security contributions. Short-term employee benefits are recognized as expense when services are rendered.
Social Security Contributions:The Group and its subsidiaries as well as its employees are legally obliged to make contributions described in the financial statements as social security contributions to the National Pension Fund, managed by the Romanian State Social Security (a defined contribution plan financed on a pay-as-you-go basis). The Group has no legal or constructive obligation to pay future benefits. Its only obligation is to pay the contributions as they fall due. If the members of the Romanian State Social Security plan cease to be employed by either the Group or its subsidiary, there will be no obligation on the Group to pay the benefits earned by these employees in previous years. The Group’s contributions are included in salaries and related expenses.
Post-employment benefits:The Group has a contractual obligation to pay to retiring employees a benefit calculated taking into account the salary at the date of retirement and the number of years served by the individual. The cost of providing benefits under defined benefit plans is estimated annually using the projected unit credit actuarial valuation method and is recognized to the income statement on an accruals basis.
The surplus or deficit, arising from changes in the discount rate and from other actuarial assumptions is recognized as income or expense over the expected average remaining working lives of the employees participating in the plan.
Termination benefits:As defined by the Romanian Law, the Group pays termination indemnities in cases of termination of employment within the framework of reduction in the labor force, connected or not with reorganization. Expenses related to termination indemnities are accrued when Management decides to adopt a plan that will result in future payments of termination benefits and by the statement of financial position date either starts to implement the restructuring plan or communicates the restructuring plan to those affected by it in a sufficiently specific manner to raise a valid expectation that the Group will carry out the restructuring. Until the present time, the Group’s Management has not initiated any action in this direction.
Share–based payment transactions:Employees (including senior executives) of the Group receive remuneration in the form of SG share–based payment transactions, whereby employees render services as consideration for equity instruments (‘equity–settled transactions’) and Group Societe Generale attains certain ratios.
The cost of equity–settled transactions is recognized, together with a corresponding increase in equity, over the period in which the performance and/or service conditions are fulfilled, ending on the date on which the relevant employees become fully entitled to the award (‘the vesting date’). The cumulative expense recognized for equity–settled transactions at each reporting date until the vesting date reflects the extent to which the vesting period has expired and the Bank’s best estimate of the number of equity instruments that will ultimately vest. The income statement expense or credit for a period is recorded in “Personnel expenses” and represents the movement in cumulative expense recognized as at the beginning and end of that period.
Where the terms of an equity–settled award are modified, the minimum expense recognized in “Personnelexpenses” is the expense as if the terms had not been modified. An additional expense is recognized for any modification which increases the total fair value of the share–based payment arrangement, or is otherwise beneficial to the employee as measured at the date of modification.

The accompanying notes are an integral part of these financial statements(Amounts in thousands RON)
27
Notes to the consolidated and individual financial statement as of and for the year ended December 31, 2010
Notes to the consolidated and individual financial statement as of and for the year ended December 31, 2010
3. Summary of significant accounting policies (continued)
u) Employee benefits (continued)
Where an equity–settled award is cancelled, it is treated as if it had vested on the date of cancellation, and any expense not yet recognized for the award is recognized immediately.This includes any award where non–vesting conditions within the control of either the entity or the counterparty are not met. However, if a new award is substituted for the cancelled award, and designated as a replacement award on the date that it is granted, the cancelled and new awards are treated as if they were a modification of the original award, as described in the previous paragraph.
v) Taxation
The current tax is the amount of income taxes payable in respect of the taxable profit, reported in the statutory financial statements, computed in accordance with Romanian tax rules and accrued for in the period to which it relates.
Deferred income tax liabilities are recognized for all taxable temporary differences between the tax bases of assets and liabilities and their carrying amounts at the statement of financial position date for financial reporting purposes, which will result in taxable amounts in future periods.Deferred income tax assets are recognized for all deductible temporary differences and carry-forward of unutilized tax losses to the extent that it is probable that taxable profit will be available, against which the deductible temporary differences and carry-forward of unutilized tax losses can be utilized. The carrying amount of deferred income tax assets is reviewed at each statement of financial position date and reduced to the extent that it is no longer probable that sufficient taxable profit will be available to utilize all or part of the deductible temporary differences or tax losses.
Deferred income tax assets and liabilities are measured at the amount that is expected to be paid to or recovered from the tax authorities after taking into account the tax rates and legislation that have been enacted or substantially enacted until the statement of financial position date.
Current and deferred tax assets and liabilities are offset when they arise from the same tax reporting entity and relate to the same tax authority and when the legal right to offset exists.
Income tax relating to items recognized directly in equity is recognized in equity and not in the income statement.
w) Provisions
Provisions are recognized when the Group has a present obligation (legal or constructive), as a result of a past event, it is probable that an outflow of embodying economic benefits will be required to settle the obligation and a reliable estimate can be made of the amount of the obligation. If the effect of the time value of money is material, provisions are discounted using a current pre-tax rate that reflects, where appropriate, the risks specific to the liability. Where discounting is used, the increase in the provision due to the passage of time is recognized as borrowing cost.
x) Contingencies
Contingent liabilities are not recognized in the financial statements but they are disclosed unless the possibility of an outflow of resources embodying economic benefits is remote.
A contingent asset is not recognized in the financial statements but disclosed when an inflow of economic benefits is probable.

The accompanying notes are an integral part of these financial statements(Amounts in thousands RON)
28
Consolidated and individual financial statements
Notes to the consolidated and individual financial statement as of and for the year ended December 31, 2010
The accompanying notes are an integral part of these financial statements(Amounts in thousands RON)
28
3. Summary of significant accounting policies (continued)
y) Earnings per share
Basic earnings per share are calculated by dividing net profit for the reporting period attributable to ordinary equity holders of the parent by the weighted average number of shares outstanding during the year. As of December 31, 2010 and 2009 there were no dilutive equity instruments issued by the Group.
z) Dividends on ordinary shares
Dividends on ordinary shares are recognized as a liability and deducted from equity when they are approved by the Bank’s shareholders.
aa) Related parties
Parties are considered related with the Group when one party, either through ownership, contractual rights, family relationship or otherwise, has the ability to directly or indirectly control or significantly influence the other party in making financial and operating decisions.
Related party transaction represents a transfer of resources or obligations between related parties, regardless of whether a price is charged.
ab) Subsequent events
Post - balance sheet events that provide additional information about the Group’s position at the statement of financial position (adjusting events), or those that indicate that the going concern assumption is not appropriate are reflected in the financial statements. Post-balance sheet events that are not adjusting events are disclosed in the notes when significant.
ac) Financial guarantees
In the ordinary course of business, the Group gives financial guarantees, consisting of letters of credit, guarantees and acceptances. Financial guarantees are initially recognized in the financial statements at fair value, in ‘Other liabilities’, being the premium received / receivables. Subsequent to initial recognition, the Group’s liability under each guarantee is measured at the higher of the amortized premium and the best estimate of expenditure required settling any financial obligation arising as a result of the guarantee.Any increase in the liability relating to financial guarantees is taken to the income statement in ‘Credit loss expense’. The premium received is recognized in the income statement in ‘Net fees and commission income’ on a straight line basis over the life of the guarantee.
ad) Comparatives
Where necessary, comparative figures have been restated to conform to changes in presentation in the current year. Therefore, the net expenses from impairment of loans and from provisions presented in the consolidated cash flow statement have been restated with the cash amount relating to recoveries from derecognized receivables.

The accompanying notes are an integral part of these financial statements(Amounts in thousands RON)
29
Notes to the consolidated and individual financial statement as of and for the year ended December 31, 2010
Notes to the consolidated and individual financial statement as of and for the year ended December 31, 2010
The accompanying notes are an integral part of these financial statements(Amounts in thousands RON)
29
Group Bank
Group Bank
Group Bank
Group Bank
December 31, 2010 December 31, 2009 December 31, 2010 December 31, 2009
December 31, 2010 December 31, 2009 December 31, 2010 December 31, 2009
December 31, 2010 December 31, 2009 December 31, 2010 December 31, 2009
December 31, 2010 December 31, 2009 December 31, 2010 December 31, 2009
Cash in vaults 375,584 368,404 375,561 368,384
Cash in ATM 235,986 263,167 235,986 263,167
Total 611,570 631,571 611,547 631,551
Current accounts 9,429,298 9,219,118 9,428,409 9,217,933
Total 9,429,298 9,219,118 9,428,409 9,217,933
Deposits at
Romanian banks 260,114 105,055 260,114 105,055
Deposits at
foreign banks 248,612 349,135 208,974 309,504
Current accounts 153,275 130,677 153,275 130,676
Total 662,001 584,867 622,363 545,235
AA 311,783 387,633 272,145 348,002A 14,877 26,895 14,877 26,895BBB - 10,140 - 10,140BB 260,257 90,039 260,257 90,039Not rated* 75,085 70,160 75,085 70,160Total 662,001 584,866 622,363 545,235
*short term exposures, mainly amounts in settlement
4. Cash in hand
5. Due from Central Bank
6. Due from banks
The National Bank of Romania (NBR or Central Bank) requires commercial banks to maintain an amount on current account with NBR (“minimum compulsory reserve”), calculated as a percentage of the average qualifying non-derivative financial liabilities. As of December 31, 2010 the rate for RON and foreign currency denominated compulsory reserves was 15% and 25%, respectively (2009: 15% and 25%).
As of December 31, 2010 amounts due from banks include exposures to SG Group amounting 316,758 (December 31, 2009 exposures of 249,982).
The breakdown by rating of BRD’s banking counterparties exposures is based on an internal counterparty rating system, presented in equivalent rating of Standard&Poors:

The accompanying notes are an integral part of these financial statements(Amounts in thousands RON)
30
Consolidated and individual financial statements
Notes to the consolidated and individual financial statement as of and for the year ended December 31, 2010
Interest rate swaps 3,431 10,839 647,866Currency swaps 27,041 19,097 4,728,078Forward foreign exchange contracts 3,294 9,630 759,845Currency options 52,073 52,073 3,539,902Total 85,839 91,639 9,675,691
Group December 31, 2010 Assets Liabilities Notional
Interest rate swaps 9,746 10,839 851,694Currency swaps 27,041 19,097 4,728,078Forward foreign exchange contracts 3,294 9,630 759,845Currency options 52,073 52,073 3,539,902Total 92,154 91,639 9,879,519
Bank December 31, 2010 Assets Liabilities Notional
Interest rate swaps - 12,419 750,881Currency swaps 40,160 27,446 2,801,632Forward foreign exchange contracts 3,294 9,630 759,845Currency options 17,012 17,012 1,682,317Total 90,166 63,418 5,996,704
Group December 31, 2009 Assets Liabilities Notional
Interest rate swaps 11,740 12,419 1,117,339Currency swaps 40,160 27,446 2,801,632Forward foreign exchange contracts 32,994 6,541 761,874Currency options 17,012 17,012 1,682,317Total 101,906 63,418 6,363,162
Bank December 31, 2009 Assets Liabilities Notional
7. Derivative financial instruments
The accompanying notes are an integral part of these financial statements(Amounts in thousands RON)
31
Notes to the consolidated and individual financial statement as of and for the year ended December 31, 2010
Notes to the consolidated and individual financial statement as of and for the year ended December 31, 2010
7. Derivative financial instruments (continued)
Forwards Forward contracts are contractual agreements to buy or sell a specified financial instrument at a specific price and date in the future. Forwards are customised contracts transacted in the over-the-counter market.
SwapsSwaps are contractual agreements between two parties to exchange streams of payments over time based on specified notional amounts, in relation to movements in a specified underlying index such as an interest rate, foreign currency rate or equity index.
Interest rate swaps relate to contracts taken out by the Group with other financial institutions in which the Group either receives or pays a floating rate of interest in return for paying or receiving, respectively, a fixed rate of interest. The payment flows are usually netted against each other, with the difference being paid by one party to the other.
In a currency swap, the Group pays a specified amount in one currency and receives a specified amount in another currency. Currency swaps are mostly gross–settled.
OptionsOptions are contractual agreements that convey the right, but not the obligation, for the purchaser either to buy or sell a specific amount of a financial instrument at a fixed price, either at a fixed future date or at any time within a specified period.The Group purchases and sells options in the over-the-counter markets. Options purchased by the Group provide the Group with the opportunity to purchase (call options) or sell (put options) the underlying asset at an agreed-upon value either on or before the expiration of the option.The Group is exposed to credit risk on purchased options only to the extent of their carrying amount, which is their fair value.Options written by the Group provide the purchaser the opportunity to purchase from or sell to the Group the underlying asset at an agreed-upon value either on or before the expiration of the option.
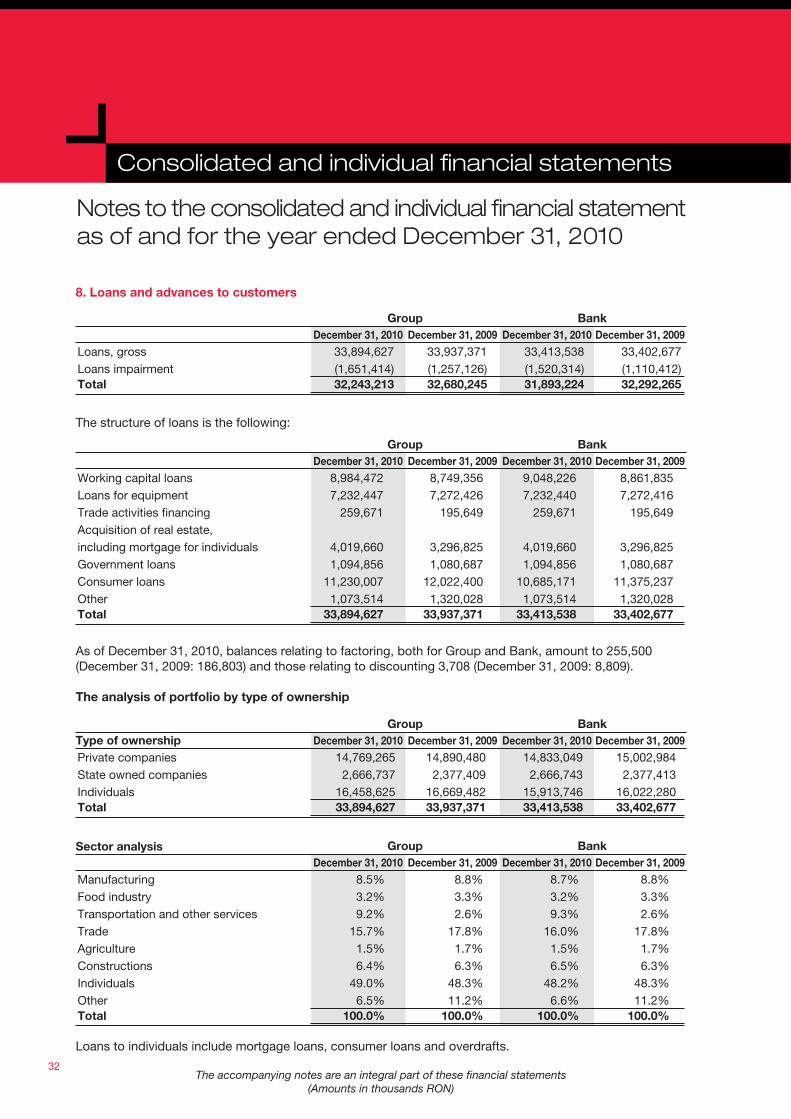
The accompanying notes are an integral part of these financial statements(Amounts in thousands RON)
32
Consolidated and individual financial statements
Notes to the consolidated and individual financial statement as of and for the year ended December 31, 2010
Group Bank December 31, 2010 December 31, 2009 December 31, 2010 December 31, 2009
Loans, gross 33,894,627 33,937,371 33,413,538 33,402,677
Loans impairment (1,651,414) (1,257,126) (1,520,314) (1,110,412)Total 32,243,213 32,680,245 31,893,224 32,292,265
Group BankType of ownership December 31, 2010 December 31, 2009 December 31, 2010 December 31, 2009
Private companies 14,769,265 14,890,480 14,833,049 15,002,984
State owned companies 2,666,737 2,377,409 2,666,743 2,377,413
Individuals 16,458,625 16,669,482 15,913,746 16,022,280Total 33,894,627 33,937,371 33,413,538 33,402,677
Group Bank December 31, 2010 December 31, 2009 December 31, 2010 December 31, 2009
Working capital loans 8,984,472 8,749,356 9,048,226 8,861,835
Loans for equipment 7,232,447 7,272,426 7,232,440 7,272,416
Trade activities financing 259,671 195,649 259,671 195,649
Acquisition of real estate,
including mortgage for individuals 4,019,660 3,296,825 4,019,660 3,296,825
Government loans 1,094,856 1,080,687 1,094,856 1,080,687
Consumer loans 11,230,007 12,022,400 10,685,171 11,375,237
Other 1,073,514 1,320,028 1,073,514 1,320,028Total 33,894,627 33,937,371 33,413,538 33,402,677
Group Bank December 31, 2010 December 31, 2009 December 31, 2010 December 31, 2009Sector analysis
Manufacturing 8.5% 8.8% 8.7% 8.8%
Food industry 3.2% 3.3% 3.2% 3.3%
Transportation and other services 9.2% 2.6% 9.3% 2.6%
Trade 15.7% 17.8% 16.0% 17.8%
Agriculture 1.5% 1.7% 1.5% 1.7%
Constructions 6.4% 6.3% 6.5% 6.3%
Individuals 49.0% 48.3% 48.2% 48.3%
Other 6.5% 11.2% 6.6% 11.2%Total 100.0% 100.0% 100.0% 100.0%
8. Loans and advances to customers
The structure of loans is the following:
Loans to individuals include mortgage loans, consumer loans and overdrafts.
As of December 31, 2010, balances relating to factoring, both for Group and Bank, amount to 255,500 (December 31, 2009: 186,803) and those relating to discounting 3,708 (December 31, 2009: 8,809).
The analysis of portfolio by type of ownership

The accompanying notes are an integral part of these financial statements(Amounts in thousands RON)
33
Notes to the consolidated and individual financial statement as of and for the year ended December 31, 2010
Notes to the consolidated and individual financial statement as of and for the year ended December 31, 2010
The value of loans individually determined to be impaired for the Group is 4,482,233 (December 31, 2009: 2,465,921 ), while for the Bank is 4,349,769 (December 31, 2009: 2,325,988 ).
Ageing analysis of past due but not impaired loans
8. Loans and advances to customers (continued)
As of December 31, 2010 the amortized cost of loans granted to the 20 largest corporate clients of the Group (groups of connected borrowers) amounts to 1,740,055 (December 31, 2009: 1,648,275) and to 1,745,993 (December 31, 2009: 1,668,809) for the Bank, while the value of letters of guarantee and letters of credit issued in favor of these clients amounts for the Group to 3,234,596 (December 31, 2009:2,871,796) and to 3,377,443 (December 31, 2009: 3,546,514 ) for the Bank.
Impairment allowance for loans
Group Collective impairment Specific impairment Total Balance as of December 31, 2008 232,536 720,655 953,191Net provision (income)/expenses (46,374) 333,104 286,730Foreign exchange losses 4,018 13,187 17,205Balance as of December 31, 2009 190,180 1,066,946 1,257,126Net provision expenses 1,057 388,726 389,783Foreign exchange losses 994 3,511 4,505Balance as of December 31, 2010 192,231 1,459,183 1,651,414
Bank Collective impairment Specific impairment Total Balance as of December 31, 2008 232,536 640,127 872,663Net provision (income)/expenses (46,374) 266,917 220,543Foreign exchange losses 4,018 13,188 17,206Balance as of December 31, 2009 190,180 920,232 1,110,412Net provision expenses 1,057 404,340 405,397Foreign exchange losses 994 3,511 4,505Balance as of December 31, 2010 192,231 1,328,083 1,520,314
Group
December 31, 2010 less than 30 days 31 to 60 days 61 to 90 days more than 90 days Total Corporate lending 1,096,458 363,759 427,753 155,556 2,043,526Small business lending 188,055 69,584 71,470 183 329,292Consumer lending 875,839 384,423 291,588 19,255 1,571,105Residential mortgages 250,136 81,394 69,532 453 401,515Total 2,410,488 899,160 860,343 175,447 4,345,438

The accompanying notes are an integral part of these financial statements(Amounts in thousands RON)
34
Consolidated and individual financial statements
Notes to the consolidated and individual financial statement as of and for the year ended December 31, 2010
8. Loans and advances to customers (continued)
Ageing analysis of past due but not impaired loans (continued)
less than 30 days 31 to 60 days 61 to 90 days more Total than 90 days
less than 30 days 31 to 60 days 61 to 90 days more Total than 90 days
less than 30 days 31 to 60 days 61 to 90 days more Total than 90 days
Corporate lending 1,031,609 404,012 274,734 154,331 1,864,686Small business lending 240,065 113,081 95,836 - 448,982Consumer lending 910,512 311,512 243,111 - 1,465,135Residential mortgages 195,708 59,872 62,870 - 318,45Total 2,377,894 888,477 676,551 154,331 4,097,253
Corporate lending 1,096,458 363,759 427,753 155,556 2,043,526Small business lending 188,055 69,584 71,470 183 329,292Consumer lending 875,839 375,835 288,023 19,255 1,558,952Residential mortgages 250,136 81,394 69,531 453 401,514Total 2,410,488 890,572 856,777 175,447 4,333,284
Corporate lending 1,031,609 404,012 274,734 154,331 1,864,686Small business lending 240,065 113,081 95,836 - 448,982Consumer lending 890,303 296,389 237,619 - 1,424,311Residential mortgages 195,708 59,872 62,870 - 318,450Total 2,357,685 873,354 671,059 154,331 4,056,429
Bank
Group & Bank
Carrying amount of loans whose terms have been renegotiated, that would otherwise be past due or impaired
Corporate lendingSmall business lending Consumer lendingResidential mortgages Total
December 31, 2009
December 31, 2009
December 31, 2010
December 31, 2010 641,086112,843261,754
6,8441,022,527
December 31, 2009 614,536113,222112,401
8,376 848,535

The accompanying notes are an integral part of these financial statements(Amounts in thousands RON)
35
Notes to the consolidated and individual financial statement as of and for the year ended December 31, 2010
Notes to the consolidated and individual financial statement as of and for the year ended December 31, 2010
8. Loans and advances to customers (continued)
Analysis of collateral coverage
Group
Corporate lending 2,043,526 1,688,636 10,520,408 5,993,955 Retail lending 2,301,911 1,515,227 14,546,548 6,562,252 Total 4,345,437 3,203,863 25,066,956 12,556,207
Corporate lending 1,864,686 1,553,824 12,094,667 7,624,508 Retail lending 2,232,567 1,499,694 15,279,529 6,935,498 Total 4,097,253 3,053,518 27,374,196 14,560,006
Bank
December 31, 2010
Corporate lending 2,043,526 1,688,636 10,584,155 5,993,955 Retail lending 2,289,758 1,515,227 14,146,329 6,562,252 Total 4,333,284 3,203,863 24,730,484 12,556,207
December 31, 2009
Corporate lending 1,864,686 1,553,824 12,207,136 7,624,508 Retail lending 2,191,743 1,499,693 14,813,123 6,935,498 Total 4,056,429 3,053,517 27,020,259 14,560,006
Overdue but not impaired
loans
Overdue but not impaired
loans
Overdue but not impaired
loans
Overdue but not impaired
loans
Covered by collaterals & guarantees
Covered by collaterals & guarantees
Covered by collaterals & guarantees
Covered by collaterals & guarantees
Loans neither impaired nor
past due
Loans neither impaired nor
past due
Loans neither impaired nor
past due
Loans neither impaired nor
past due
Covered by collaterals & guarantees
Covered by collaterals & guarantees
Covered by collaterals & guarantees
Covered by collaterals & guarantees
December 31, 2010
December 31, 2009

The accompanying notes are an integral part of these financial statements(Amounts in thousands RON)
36
Consolidated and individual financial statements
Notes to the consolidated and individual financial statement as of and for the year ended December 31, 2010
8. Loans and advances to customers (continued)
As of December 31, 2010 the carrying value of repossessed assets is 39 (December 31, 2009: 39), representing a residential building. During 2010 the Group did not repossess any assets.
The fair value of properties, letters of guarantee and cash that the Group and the Bank holds as collateral relating to loans individually determined to be impaired as at December 31, 2010 amounts to 2,797,387 (December 31, 2009: 1,319,710). The amounts are capped to the gross exposure level.
Analysis of neither impaired nor past due loans corporate lending by credit rating
Group Bank December 31 December 31 December 31 December 31 2010 2009 2010 2009 Very good 1,123,401 1,143,671 1,187,148 1,256,140 Good 462,779 444,648 462,779 444,648 Rather good 292,307 473,997 292,307 473,997 Acceptable 7,506,209 8,787,272 7,506,209 8,787,272 Performing but sensitive 988,595 1,028,020 988,595 1,028,020 Sensitive - credit risk not acceptable 147,117 217,059 147,117 217,059 Total 10,520,408 12,094,667 10,584,155 12,207,136 The internal credit rating review is performed on a quarterly basis or as soon as new and significant aspects occur modifying the credit quality of the counterparty. This process results in the classification of exposures between healthy, sensitive and non performing clients.
During the current year the internal rating system has been changed in line with the implementation of Basel II requirements at Group level. New credit risk management procedures emphasize the distinction between the corporate and retail customers.
Retail portofolio includes credit exposure to individuals, sole traders and small businesses managed consist-ently over time and in a similar manner. The significant number and similarities of retail exposures substan-tially decrease the credit risk associated to these portfolios. The risk measurement is regulated by the internal norms and procedures providing specific criteria and principles to allocate exposure into classes based on counterparty and transactions characteristics.
The quality of corporate exposures is managed using an internal credit rating system in which the human judgment is a key element of the assessment process. The internal rating system is based on rating models that include both quantitative and qualitative assessment criteria relevant to counterparty type and size. The set of internal models is developed on the Group’ available data history and the use of rating in business is formalized in internal norms and procedures.

The accompanying notes are an integral part of these financial statements(Amounts in thousands RON)
37
Notes to the consolidated and individual financial statement as of and for the year ended December 31, 2010
Notes to the consolidated and individual financial statement as of and for the year ended December 31, 2010
9. Lease receivables
Group December 31, 2010 December 31, 2009 Gross investment in finance lease: Maturity under 1 year 426,344 503,687 Maturity between 1 and 5 years 527,756 656,172 Maturity higher than 5 years 60,290 52,796 1,014,390 1,212,655 Unearned finance income (109,953) (116,301) Net investment in finance lease 904,437 1,096,354 Net investment in finance lease: Maturity under 1 year 378,885 449,366 Maturity between 1 and 5 years 473,369 599,738 Maturity higher than 5 years 52,183 47,250 904,437 1,096,354
Group December 31, 2010 December 31, 2009
Net investment in the lease 904,437 1,096,354 Accumulated allowance for uncollectible minimum lease payments receivable (32,616) (14,226) Total 871,821 1,082,128 Ageing analysis of past due but not impaired lease receivables
December 31, 2010 less than 31 to 61 to more than Total 30 days 60 days 90 days 90 days Corporate leases 67,145 25,313 34,936 29,283 156,677 Retail leases 31,998 14,000 48,640 1,523 96,160 Total 99,143 39,313 83,576 30,806 252,837 December 31, 2009 less than 31 to 60 days 61 to 90 days more than Total 30 days 90 days Corporate leases 198,949 105,528 72,497 25,100 402,074 Retail leases 53,594 36,442 25,861 6,765 122,662 Total 252,543 141,970 98,358 31,865 524,736

The accompanying notes are an integral part of these financial statements(Amounts in thousands RON)
38
Consolidated and individual financial statements
Notes to the consolidated and individual financial statement as of and for the year ended December 31, 2010
9. Lease receivables (continued)
Analysis of collateral coverage
December 31, 2010 Overdue but Covered by Neither Covered by not impaired collaterals & impaired nor collaterals & guarantees past due guarantees Corporate leases 156,678 129,648 425,912 411,626 Retail leases 96,160 84,924 137,979 134,644 Total 252,838 214,572 563,891 546,270
December 31, 2009 Overdue but Covered by Neither Covered by not impaired collaterals & impaired nor collaterals & guarantees past due guarantees Corporate leases 402,074 385,738 380,379 383,063 Retail leases 122,662 114,918 150,206 144,166 Total 524,736 500,656 530,585 527,229 The fair value of leased objects relating to lease receivables individually determined to be impaired as at December 31, 2010 amounts to 54,158 (December 31, 2009: 35,045 ). The amounts are capped to the gross exposure level.
Analysis of neither impaired nor past due corporate lease receivables by credit rating
December 31, 2010 December 31, 2009 Very good 14 50 Good 14,845 4,470 Rather good 6,804 46,546 Acceptable 367,902 294,664 Performing but sensitive 35,408 30,656 Sensitive - credit risk not acceptable 939 3,993 Total 425,912 380,379

The accompanying notes are an integral part of these financial statements(Amounts in thousands RON)
39
Notes to the consolidated and individual financial statement as of and for the year ended December 31, 2010
Notes to the consolidated and individual financial statement as of and for the year ended December 31, 2010
10. Financial assets available for sale
Group Bank December 31, December 31, December 31, December 31, 2010 2009 2010 2009
Treasury notes 3,964,454 2,131,310 3,964,453 2,131,309 Equity investments 8,826 10,345 7,691 9,209 Other securities 108,229 133,480 60,208 59,272
Total 4,081,509 2,275,135 4,032,352 2,199,790
Treasury notes
Treasury notes consist of interest bearing bonds issued by the Romanian Ministry of Public Finance, rated as BB+ by Standard&Poors. As of December 31, 2010 treasury notes amounting to 3,581 have been pledged to NBR (2009: 434,557).
Equity investments
Other equity investments represent shares in Victoria Business Centre S.A, Romanian Commodities Ex-change, Bucharest Clearing House (the former Romanian Securities Clearing and Depository Company), Thyssen Krupp Bilstein Compa S.A., Depozitarul Central S.A. (Shareholders’ Register for the National Securi-ties Commission), Fondul Roman de Garantare a Creditelor pentru Intreprinzatorii Privati SA, Romanian Clear-ing House (SC Casa Romana de Compensatie SA), Investor Compensating Fund (Fondul de Compensare a Investitorilor), TransFond and Visa International Service Association.
Other securities
The Group holds units in:• A monetary fund (“Simfonia 1”) amounting to 59,499 (December 31, 2009: 74,421);• A balanced fund (“BRD Obligatiuni”) amounting to 11,408 (December 31, 2009: 21,226);• A balanced fund (“Diverso Europa Regional”) amounting to 21,079 (December 31, 2009: 21,334 )• A balanced fund (“Actiuni Europa Regional”) amounting to 13,981 (December 31, 2009: 12,718).• A balanced fund (”Index Europa Regional”) amounting to 2,263 (December 31, 2009: 0)
The Bank holds units in:• A monetary fund (“Simfonia 1”) amounting to 11,477 (December 31, 2009: 10,666);• A balanced fund (“BRD Obligatiuni”) amounting to 11,408 (December 31, 2009: 10,774);• A balanced fund (“Diverso Europa Regional”) amounting to 21,079 (December 31, 2009: 21,334);• A balanced fund (“Actiuni Europa Regional”) amounting to 13,981 (December 31, 2009: 12,718).• A balanced fund (”Index Europa Regional”) amounting to 2,263 (December 31, 2009: 0)

The accompanying notes are an integral part of these financial statements(Amounts in thousands RON)
40
Consolidated and individual financial statements
Notes to the consolidated and individual financial statement as of and for the year ended December 31, 2010
10. Financial assets available for sale (continued)
“Simfonia 1” invests on the monetary market and in liquid debt instruments (treasury bills and bonds, corpo-rate bonds, municipal bonds). The Group held as of the year-end a total number of 1,974,733 units (2009: 2,657,887), while the Bank held a total number of 380,913 (2009: 380,913 ) with a unit value of RON 30.13 (2009: 28.00)
“BRD Obligatiuni” invests in monetary market instruments, debt instruments as well as equities traded on Bucharest Stock Exchange. As of the year-end the Group held a number of 90,353 units (2009: 178,012), while the Bank held a total number of 90,353 (2009: 90,353) with a unit value of RON 126.26 (2009: 119.24).
“Diverso Europa Regional” invests in monetary market instruments, debt instruments as well as equities traded on a regulated market. As of the year-end the Group held a number of 175,730 units (2009: 195,116), while the Bank held a total number of 175,730 (2009: 195,116 ) with a unit value of RON 119.95 (2009: 109.34)
“Actiuni Europa Regional” invests mostly in equities traded on a regulated market, in monetary market instru-ments as well as in debt instruments. As of the year-end the Group held a number of 116,238 units, (2009: 116,238), while the Bank held a total number of 116,238 (2009: 116,238 ) with a unit value of RON 120.28 (2009: 109.41)
“Index Europa Regional”invest mainly in equities which make part of index mix based BET-XT 50%, WIG-20 20%, Budapest SE Index-10% si Prague SE Index 20% as well as in monetary market instruments. As of the year-end the Group held a number of 21,794 units, (2009: 0), while the Bank held a total number of 21,794 (2009: 0) with a unit value of RON 103.83 (2009: 0)
Other securities also include as at December 31, 2009 corporate bonds issued by Estima Finance amounting to 3,781.

The accompanying notes are an integral part of these financial statements(Amounts in thousands RON)
41
Notes to the consolidated and individual financial statement as of and for the year ended December 31, 2010
Notes to the consolidated and individual financial statement as of and for the year ended December 31, 2010
11. Investments in subsidiaries and associates
In the case of associates where the Group holds less than 20% of the voting rights the existence of significant influence is evidenced by representation on the Board of Directors of the investee and/or participation in policy-making processes, including participation in decisions about dividends or other distributions.
Associates
ALD AutomotiveMobiasbanca Groupe Societe Generale S.A. BRD Asigurari de Viata SAFondul de Garantarea Creditului RuralECS International Romania SARomcard S.A.
Biroul de Credit S.A.BRD Fond de Pensii S.A.
BRD Sogelease Asset Rental SRL
Field of activity
Operational leasing
Financial institutionInsurance
Loans guarantee
Operational leasingCard transaction
processing Credit bureauPension fund management
Operational leasing
%
20.00%
20.00%49.00%
33.33%
15.00%
20.00%18.85%
49.00%
20.00%
December 31
2009
-
30,111
12,456
21,827
145
624 2,660
11,388
60
79,271
Additions/Reclassi-fications
7,237
-
-
-
-
-
-
-
-
7,237
Disposals
-
- -
-
(145)
(624)
-
-
-
(769)
Increase / (decrease)
in net assets
5,291
2,859
(2,357)
(11,938)
0
0
213
(1,840)
270
(7,502)
December 31
2010
12,528
32,970 10,099
9,889
-
-
2,874
9,547
330
78,237
Group

The accompanying notes are an integral part of these financial statements(Amounts in thousands RON)
42
Consolidated and individual financial statements
Notes to the consolidated and individual financial statement as of and for the year ended December 31, 2010
11. Investments in subsidiaries and associates (continued)
ALD AutomotiveMobiasbanca Groupe Societe Generale S.A. BRD Asigurari de Viata SAFondul de Garantarea Creditului RuralECS International Romania SARomcard S.A.
Biroul de Credit S.A.BRD Fond de Pensii S.A.
BRD Sogelease Asset Rental SRL
Associates
BRD Securities Groupe Societe Generale SA BRD Sogelease IFN SABRD Finance Credite de Consum IFN SABRD Asset Management SAI SABRD Corporate Finance SRL
Subsdiaries
Total Associates and Subsidiaries
Field of activity
Operational leasing
Financial institutionInsurance
Loans guarantee
Operational leasingCard transaction
processing Credit bureauPension fund management
Operational leasing
Financial institutionFinancial leasing
Financial institution
Funds administrationBusiness and managament consultancy
%
20.00%
20.00%49.00%
33.33%
15.00%
20.00%18.85%
49.00%
20.00%
100.00%99.98%
49.00%
99.95%
100.00%
December 31,
2009
5,262
29,01713,532
14,220
288
172779
14,690
60
78,020
2,15111,558
53,019
2,321
403
69,452
147,472
Additions/Reclassi-fications
6,591
- -
-
-
-
-
-
-
6,591
--
-
-
-
-
6,591
Disposals
-
- -
-
(288)
(172)
-
-
-
(460)
--
-
-
-
-
December 31,
2010
11,853
29,01713,532
14,220
-
-779
14,690
60
84,151
2,15111,558
53,019
2,321
403
69,452
153,603
Bank

The accompanying notes are an integral part of these financial statements(Amounts in thousands RON)
43
Notes to the consolidated and individual financial statement as of and for the year ended December 31, 2010
Notes to the consolidated and individual financial statement as of and for the year ended December 31, 2010
11. Investments in subsidiaries and associates (continued)
The subsidiaries and associate summary of financial position and income statement as at December 31, 2010 are as follows:The amounts for the subsidiaries are not audited.
Associate
ALD AutomotiveMobiasbanca Groupe Societe Generale S.A. BRD Asigurari de Viata SA
Fondul de Garantare a Creditului RuralBiroul de Credit S.A.BRD Fond de Pensii S.A.BRD Sogelease Asset Rental SRL
Subsidiaries
BRD Securities Groupe Societe Generale SA BRD Sogelease IFN SABRD Finance Credite de Consum IFN SABRD Asset Management SAI SABRD Corporate Finance SRL
Address
1-7, Ion Mihalache Street, Bucharest
81 Stefan cel Mare si Sfint Street,
Kishinev, Republic of Moldova
64 Blvd. Unirii Bl. K4, sector 3,
Bucharest
5 Occidentului Street, Bucharest
15 Calea Victoriei, Bucharest
64 Unirii Blvd, Bucharest
1-7, Ion Mihalache Street, Bucharest
Address
1-7, Ion Mihalache Street, Bucharest
1-7, Ion Mihalache Street, Bucharest
1-7, Ion Mihalache Street, Bucharest
1-3, Clucerul Udricani Street, Bucharest
1-7, Ion Mihalache Street, Bucharest
Total
assets
215,926
696,133
33,566
1,325,479 16,158
20,528 82,560
Total assets
entity in liquidation
1,015,204 522,620 4,743 788
Total
liabilities
153,284
531,281
10,792
1,295,811 725 895
80,393
Total liabilities
867,706 441,505
341 69
Net
assets
62,642 164,852
20,611
29,668 15,240 19,485
2,167
Net assets
147,498
81,116 4,402 719
Share-
holders
interest
60,469
69,777
26,361
19,909 11,643 24,949
1,357
Share-holders interest
147,465
94,929 4,401 719
Net
profit
20,326 14,723 (2,555)
13,326 3,150 (2,866) 2,027
Net profit
17,309
526 1,784 15
Bank

The accompanying notes are an integral part of these financial statements(Amounts in thousands RON)
44
Consolidated and individual financial statements
Notes to the consolidated and individual financial statement as of and for the year ended December 31, 2010
12. Property, plant and equipment
Cost:
as of December 31, 2008Transfers and additionsDisposalsas of December 31, 2009Transfers and additionsDisposalsas of December 31, 2010
Depreciation and impairment:
as of December 31, 2008Depreciation and impairmentDisposalsTransfersas of December 31, 2009Depreciation and impairmentDisposalsTransfersas of December 31, 2010
Net book value:as of December 31, 2008as of December 31, 2009as of December 31, 2010
Land & Buildings
1,307,30680,650(9,513)
1,378,443 41,751
(10,623)1,409,571
(355,759)
(85,007)5,600
(8,952)(444,118)
(68,259)6,800
(2,754)(508,331)
951,547934,325901,240
Investment properties
46,917(6,135)
(119)40,663 (2,751)
(48)37,864
(15,033)
(1,165)56
2,132(14,010)
(1,117)41
896(14,190)
31,88426,65323,674
Office equipments
214,60331,920
(39,493)207,03030,745(6,140)
231,635
(185,274)
(32,088)39,485
310(177,567)
(19,849)6,078
866(190,472)
29,32929,46341,163
Materials and other
assets
249,80069,885
(22,289)297,396
5,875(5,937)
297,334
(140,383)
(29,569)13,8456,510
(149,597)
(26,740)5,599
498(170,240)
109,417147,799127,094
Construction in
progress
88,875(20,906)
(426)67,54316,392
(40)83,895
-
----
----
88,87567,54383,895
Total
1,907,501155,414(71,840)
1,991,07592,012
(22,788)2,060,299
(696,449)
(147,829)58,986
-(785,292)
(115,965)18,519
(494)(883,233)
1,211,0521,205,7831,177,066
Group

The accompanying notes are an integral part of these financial statements(Amounts in thousands RON)
45
Notes to the consolidated and individual financial statement as of and for the year ended December 31, 2010
Notes to the consolidated and individual financial statement as of and for the year ended December 31, 2010
12. Property, plant and equipment
Cost:
as of December 31, 2008Transfers and additionsDisposalsas of December 31, 2009Transfers and additionsDisposalsas of December 31, 2010
Depreciation and impairment:
as of December 31, 2008Depreciation and impairmentDisposalsTransfersas of December 31, 2009Depreciation and impairmentDisposalsTransfersas of December 31, 2010
Net book value:as of December 31, 2008as of December 31, 2009as of December 31, 2010
Land & Buildings
1,299,94678,217(9,513)
1,368,65041,731
(10,623)1,399,758
(353,782)
(84,656)5,601
(8,952)(441,789)
(67,899)6,800
(2,755)(505,643)
946,164926,861894,115
Investment properties
46,917(6,135)
(119)40,663(2,751)
(48)37,864
(15,033)
(1,166)57
2,132(14,010)
(1,117)41
896(14,190)
31,88426,65323,674
Office equipments
209,74025,660
(39,384)196,01632,522(6,140)
222,398
(178,385)
(30,343)39,388
310(169,030)
(18,859)6,078(438)
(182,249)
31,35526,98640,149
Materials and other
assets
243,48340,464
(14,303)269,644
7,524(5,815)
271,353
(139,038)
(25,168)13,8466,510
(143,850)
(26,658)5,5091,801
(163,198)
104,445125,794108,155
Construction in
progress
86,417(18,448)
(426)67,54316,392
(40)83,895
-
----
---
86,417
67,54383,89583,895
Total
1,886,503119,758(63,745)
1,942,51695,418
(22,666)2,015,268
(686,238)
(141,333)58,892
-(768,679)
(114,533)18,428
(496)(865,280)
1,200,2651,173,8371,149,988
Bank
The land and buildings have a fair value of 954,188 as at December 31, 2010 (December 31, 2009: 986,868). The investment properties have a fair value of 31,853 as at December 31, 2010 (December 31, 2009: 26,242).

The accompanying notes are an integral part of these financial statements(Amounts in thousands RON)
46
Consolidated and individual financial statements
Notes to the consolidated and individual financial statement as of and for the year ended December 31, 2010
13. Goodwill
Goodwill represents the excess of the acquisition cost over the fair value of net identifiable assets transferred from Société Générale Bucharest to the Group in 1999. The goodwill is no longer amortized starting with January 1, 2004 (see accounting policies). During 2010 there was no impairment of the goodwill.
14. Intangible assets
The balance of the intangible assets as of December 31, 2010 and 2009 represents mainly software.
Cost:as of December 31, 2008Additions Disposalsas of December 31, 2009Additions Disposalsas of December 31, 2010
Amortization:as of December 31, 2008Amortization expenseDisposalsas of December 31, 2009Amortization expenseDisposalsTransfersas of December 31, 2010
Net book value:as of December 31, 2008as of December 31, 2009as of December 31, 2010
Group
162,88544,763
(78)207,57035,103
0242,673
(107,471)(20,396)
78(127,789)
(17,174)0
(49)(145,012)
55,41479,78197,661
Bank
154,11140,413
(78)194,44630,758
0225,204
(101,752)(18,704)
78(120,378)
(15,130)0
(49)(135,557)
52,35974,06889,647
15. Other assets
The sundry debtors balances are presented net of an impairment allowance, at Group level, of 53,678 (December 31, 2009: 33,023 ) and at Bank level of 53,678 (December 31, 2009: 23,913) related to amounts under litigation.
Group Bank december 31, 2010 december 31, 2009 december 31, 2010 december 31, 2009
Advances to suppliersSundry debtorsMaterials and consumablesMiscellaneous assets Total
92,879151,632
1,40732,619
278,537
-137,818
1,07025,982
164,870
119,615114,693
1,66376,321
312,292
-86,290
1,27572,281
159,846

The accompanying notes are an integral part of these financial statements(Amounts in thousands RON)
47
Notes to the consolidated and individual financial statement as of and for the year ended December 31, 2010
Notes to the consolidated and individual financial statement as of and for the year ended December 31, 2010
Group Bank
Group Bank
December 31, 2010 December 31, 2009 December 31, 2010 December 31, 2009
December 31, 2010 December 31, 2009 December 31, 2010 December 31, 2009
16. Demand deposits and current accounts
17. Term deposits
18. Borrowed funds and debt issued
Individuals and legal entities Foreign banks Romanian Banks Total
Borrowings from related partiesBorrowings from international financial institutionsBorrowings from other institutionsBonds issuedOther borrowingsTotal
13,432,459448,96583,690
13,965,114
9,355,440
988,686
262,756737,33028,807
11,373,019
13,444,204448,96583,690
13,976,859
8,159,390
924,043
262,756737,33184,319
10,167,839
13,798,068807,80413,030
14,618,902
4,715,876
967,064
680,012736,46837,157
7,136,577
13,816,001807,804
13,03014,636,835
2,981,678
903,275
741,838736,468
37,1575,400,416
Group Bank December 31, 2010 December 31, 2009 December 31, 2010 December 31, 2009
Individuals and legal entities Foreign banks Romanian Banks Total
16,592,1901,264,206
79,76417,936,160
16,657,0871,264,206
79,76418,001,057
15,762,5074,695,063
642,77221,100,342
16,026,1204,695,063
642,77221,363,955
Term deposits refer to deposits with initial maturities over 3 days.
The maturity structure and the re-pricing gap of the borrowings are presented in note 42.
Borrowings from related parties include an amount of EUR 200,000,000, RON 856,960,000 equivalent (2009: EUR 200,000,000, RON 845,640,000 equivalent) representing two subordinated loans, EUR 100,000,000 received in 2005, at EURIBOR6M+0.5%, due in 2015 and a EUR 100,000,000 loan received in 2006, at EURIBOR6M+0.99%, due in 2013.Other funds borrowed from related parties are senior unsecured and are used in the normal course of business. The bonds represent RON denominated notes issued in December 2006 on the Luxembourg stock exchange amounting to 735,000 for five years at a fixed rate of 7.75%.

The accompanying notes are an integral part of these financial statements(Amounts in thousands RON)
48
Consolidated and individual financial statements
Notes to the consolidated and individual financial statement as of and for the year ended December 31, 2010
19. Taxation
Current income tax is calculated based on the taxable income as per the tax statement derived from the stand alone accounts of each consolidated entity.
The deferred tax liability/asset is reconciled as follows
Deferred tax liabilityLoans and advances to customersInvestments and other securities Tangible and intangible assets Total
Deferred tax assetProvisions and other liabilitiesTotal
Taxable items
Deferred tax expense
Group December 31, 2010Temporary differences
(1,071,297)(38,327)
(210,645)(1,320,269)
113,004113,004
(1,207,265)
Consolidated Statement of
Financial Position
(171,410)(6,132)
(33,703)(211,245)
18,08118,081
(193,164)
Consolidated Income Statement
(97,067)1,991
(9,152)(104,228)
(1,610)(1,610)
(105,838)
Deferred tax liabilityLoans and advances to customersInvestments and other securities Tangible and intangible assets Total
Deferred tax assetProvisions and other liabilitiesTotal
Taxable items
Deferred tax expense
Bank December 31, 2010Temporary differences
(1,071,297)(41,813)
(210,645)(1,323,755)
100,047100,047
(1,223,708)
Consolidated Statement of
Financial Position
(171,407)(6,690)
(33,703)(211,800)
16,00716,007
(195,793)
Individual Income Statement
(97,062)631
(9,152)(105,583)
668668
(104,915)

The accompanying notes are an integral part of these financial statements(Amounts in thousands RON)
49
Notes to the consolidated and individual financial statement as of and for the year ended December 31, 2010
Notes to the consolidated and individual financial statement as of and for the year ended December 31, 2010
19. Taxation (continued)
Deferred tax liabilityLoans and advances to customersInvestments and other securities Tangible and intangible assets Total
Deferred tax assetProvisions and other liabilitiesTotal
Taxable items
Deferred tax expense
Group December 31, 2009Temporary differences
(464,651)(67,588)
(153,441)(685,680)
123,069123,069
(562,611)
Consolidated Statement of
Financial Position
(74,344)(10,814)(24,551)
(109,709)
19,69119,691
(90,018)
Consolidated Income Statement
(69,145)1,355
(78,482)(146,272)
(2,104)(2,104)
(148,376)
Deferred tax liabilityLoans and advances to customersInvestments and other securities Tangible and intangible assets Total
Deferred tax assetProvisions and other liabilitiesTotal
Taxable items
Deferred tax expense
Bank December 31, 2009Temporary differences
(464,651)(63,780)
(153,441)(681,872)
95,86595,865
(586,007)
Individual Statement of
Financial Position
(74,344)(10,205)(24,551)
(109,100)
15,33915,339
(93,761)
Individual Income Statement
(69,145)1,670
(78,482)(145,957)
(729)(729)
(146,686)

The accompanying notes are an integral part of these financial statements(Amounts in thousands RON)
50
Consolidated and individual financial statements
Notes to the consolidated and individual financial statement as of and for the year ended December 31, 2010
19. Taxation (continued)
Movement in deferred tax is as follows:
Deferred tax asset, net as of December 31, 2008 Deferred tax recognized in other comprehensive income Net deferred tax expense Deferred tax liability, net as of December 31, 2009 Deferred tax recognized in other comprehensive income Net deferred tax expense Deferred tax liability, net as of December 31, 2010
Group
65,060(6,702)
(148,376)(90,018)
2,691(105,838)(193,164)
Bank
59,333(6,408)
(146,686)(93,761)
2,884(104,915)(195,793)
Reconciliation of total tax charge
Group Bank
2010 2009 2010 2009
Gross profit (before income tax)Income tax (16%)Non-deductible elementsNon-taxable elementsIncome tax at effective tax rate
1,228,081197,842185,401
(163,985)
219,258
1,206,005194,310181,047
(165,690)
209,667
1,450,390232,062209,336
(130,365)
311,033
1,428,235228,518203,126
(123,587)
308,057

The accompanying notes are an integral part of these financial statements(Amounts in thousands RON)
51
Notes to the consolidated and individual financial statement as of and for the year ended December 31, 2010
Notes to the consolidated and individual financial statement as of and for the year ended December 31, 2010
Group Bank
december 31, 2010 december 31, 2009 december 31, 2010 december 31, 2009
Sundry creditorsOther payables to State budget Deferred incomePayables to employees Dividends payableFinancial guarantee contractsProvisionsTotal
176,152
60,68028,59975,6832,069
8,8634,311
356,357
103,001
59,08828,59974,2422,069
8,8632,061
277,923
178,956
39,63923,99579,9752,343
7,2394,946
337,093
95,057
38,78123,99578,472
2,345
7,2394,112
250,001
20. Other liabilities
Payables to employees include, among other, gross bonuses relating to 2010 profit, amounting to 35,000 (2009: 44,997) and post-employment benefits amounting to 39,101 (2009: 31,728). The social security contri-butions relating to bonuses 9,800 (2009: 12,603) are included in Other payables to State Budget. Provisions are related to legal claims and penalties.
The movement in provisions is as follows:
Group
Carrying value as of December 31, 2008 3,333Additional expenses 3,408Reversals of provisions (1,795)Carrying value as of December 31, 2009 4,946Additional expenses 2,025Reversals of provisions (2,660)Carrying value as of December 31, 2010 4,311
Bank
Carrying value as of December 31, 2008 2,965Additional expenses 2,918Reversals of provisions (1,771)Carrying value as of December 31, 2009 4,112Additional expenses 305Reversals of provisions (2,356)Carrying value as of December 31, 2010 2,061

The accompanying notes are an integral part of these financial statements(Amounts in thousands RON)
52
Consolidated and individual financial statements
Notes to the consolidated and individual financial statement as of and for the year ended December 31, 2010
20. Other liabilities (continued)
Post-employment benefit plan
This is a defined benefit plan under which the amount of benefit that an employee is entitled to receive on retirement depends on years of service and salary. The plan covers substantially all the employees and the benefits are unfunded. A full actuarial valuation by a qualified independent actuary is carried out annually.
Expenses recognised in profit and loss
December 31, 2010 December 31, 2009
Current service cost 4,820 1,422Interest cost on benefit obligation 3,023 1,383Actuarial losses recognized during the year 998 15,974Past service cost 20 20Net benefit expense 8,861 18,799
Movement in defined benefits obligations
December 31, 2010 December 31, 2009
Opening defined benefit obligation 31,728 13,904Total service cost 4,840 1,442Benefits paid (1,473) (975)Interest cost on benefit obligation 3,023 1,383Actuarial losses recognized during the year 998 15,974Closing defined benefit obligation 39,116 31,728
Main actuarial assumptions
December 31, 2010 December 31, 2009
Discount rate 4.15% 5.49%Inflation rate 1.87% 2.18%Average salary increase rate (0-4 years) 1.00% 3%Average salary increase rate (over 5 years) 2.00% 2%Average remaining working period (years) 17.69 17.91 December 31, 2010 December 31, 2009
Defined benefit obligation 39,116 31,728Experience adjustment on plan liabilities (1,980) 1,160
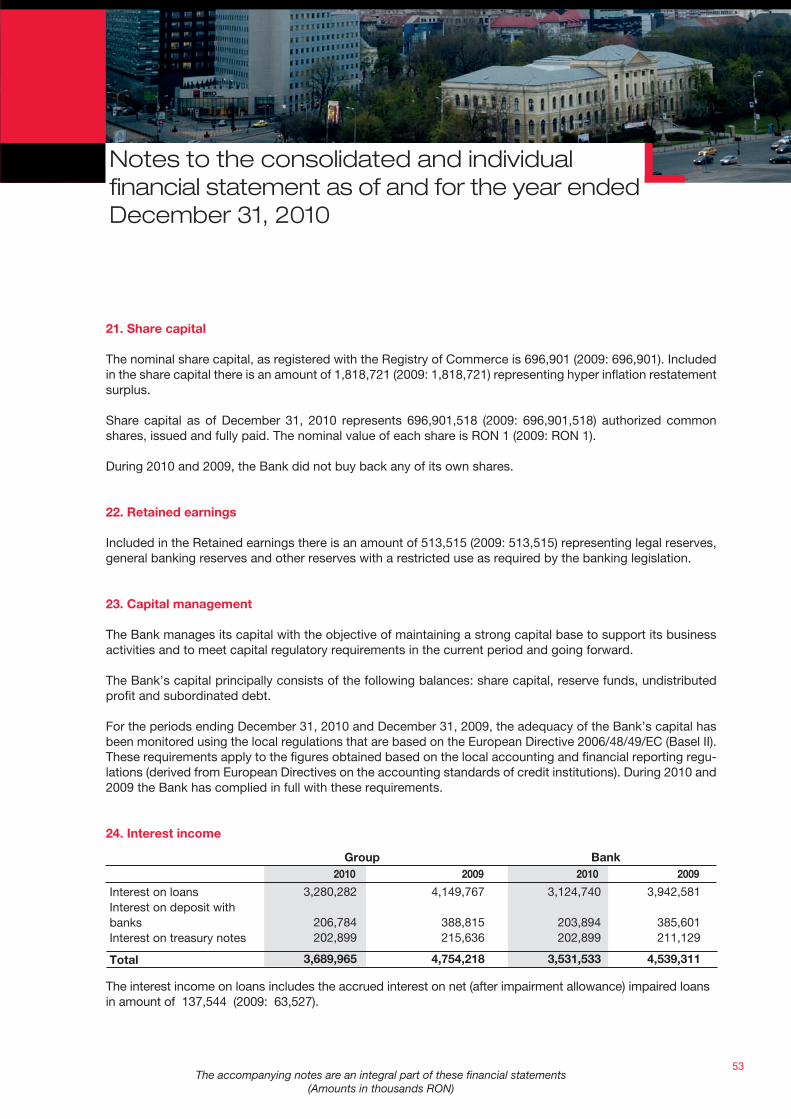
The accompanying notes are an integral part of these financial statements(Amounts in thousands RON)
53
Notes to the consolidated and individual financial statement as of and for the year ended December 31, 2010
Notes to the consolidated and individual financial statement as of and for the year ended December 31, 2010
21. Share capital
The nominal share capital, as registered with the Registry of Commerce is 696,901 (2009: 696,901). Included in the share capital there is an amount of 1,818,721 (2009: 1,818,721) representing hyper inflation restatement surplus.
Share capital as of December 31, 2010 represents 696,901,518 (2009: 696,901,518) authorized common shares, issued and fully paid. The nominal value of each share is RON 1 (2009: RON 1).
During 2010 and 2009, the Bank did not buy back any of its own shares.
22. Retained earnings
Included in the Retained earnings there is an amount of 513,515 (2009: 513,515) representing legal reserves, general banking reserves and other reserves with a restricted use as required by the banking legislation.
23. Capital management
The Bank manages its capital with the objective of maintaining a strong capital base to support its business activities and to meet capital regulatory requirements in the current period and going forward.
The Bank’s capital principally consists of the following balances: share capital, reserve funds, undistributed profit and subordinated debt.
For the periods ending December 31, 2010 and December 31, 2009, the adequacy of the Bank’s capital has been monitored using the local regulations that are based on the European Directive 2006/48/49/EC (Basel II). These requirements apply to the figures obtained based on the local accounting and financial reporting regu-lations (derived from European Directives on the accounting standards of credit institutions). During 2010 and 2009 the Bank has complied in full with these requirements.
24. Interest income
The interest income on loans includes the accrued interest on net (after impairment allowance) impaired loans in amount of 137,544 (2009: 63,527).
Group Bank
2010 2009 2010 2009
Interest on loansInterest on deposit with banksInterest on treasury notes
Total
3,280,282
206,784 202,899
3,689,965
3,124,740
203,894202,899
3,531,533
4,149,767
388,815215,636
4,754,218
3,942,581
385,601211,129
4,539,311

The accompanying notes are an integral part of these financial statements(Amounts in thousands RON)
54
Consolidated and individual financial statements
Notes to the consolidated and individual financial statement as of and for the year ended December 31, 2010
25. Interest expense
27 Foreign exchange gain
26. Fees and commissions, net
28. Income from associates
Group Bank
Group Bank
Group Bank
Group Bank
2010 2009 2010 2009
2010 2009 2010 2009
2010 2009 2010 2009
2010 2009 2010 2009
Interest on term deposits Interest on demand deposits Interest on borrowings Total
Foreign exchange income Foreign exchangeexpensesTotal
Commission revenue from pro-cessing of transactionsOther commission revenueCommission expense Net commission revenue
Share of increase/(decrease) in net assets from associatesDividends from associatesNet gain from sale of interest in associatesTotal
821,358436,541112,395
1,370,294
7,561,421
(7,231,792)329,629
837,97582,565
(137,303)783,237
(7,502)1,755
5,984237
828,978374,166124,123
1,327,267
7,410,290
(7,083,723)326,567
821,46080,740
(132,966)769,234
-1,755
6,2948,049
1,531,231749,857233,743
2,514,831
5,756,191
(5,294,685)461,506
845,04383,267
(117,959)810,351
(3,804)1,527
-(2,277)
1,548,724719,916184,468
2,453,108
5,595,590
(5,134,757)460,833
825,87782,976
(112,063)796,790
-1,527
-1,527
29. Other income
Other income includes income from banking activities offered to the clients and income from non-banking activities, such as income from rentals. The income from rental of investment properties, both for the Group and the Bank, is 2,390 (2009: 2,930).
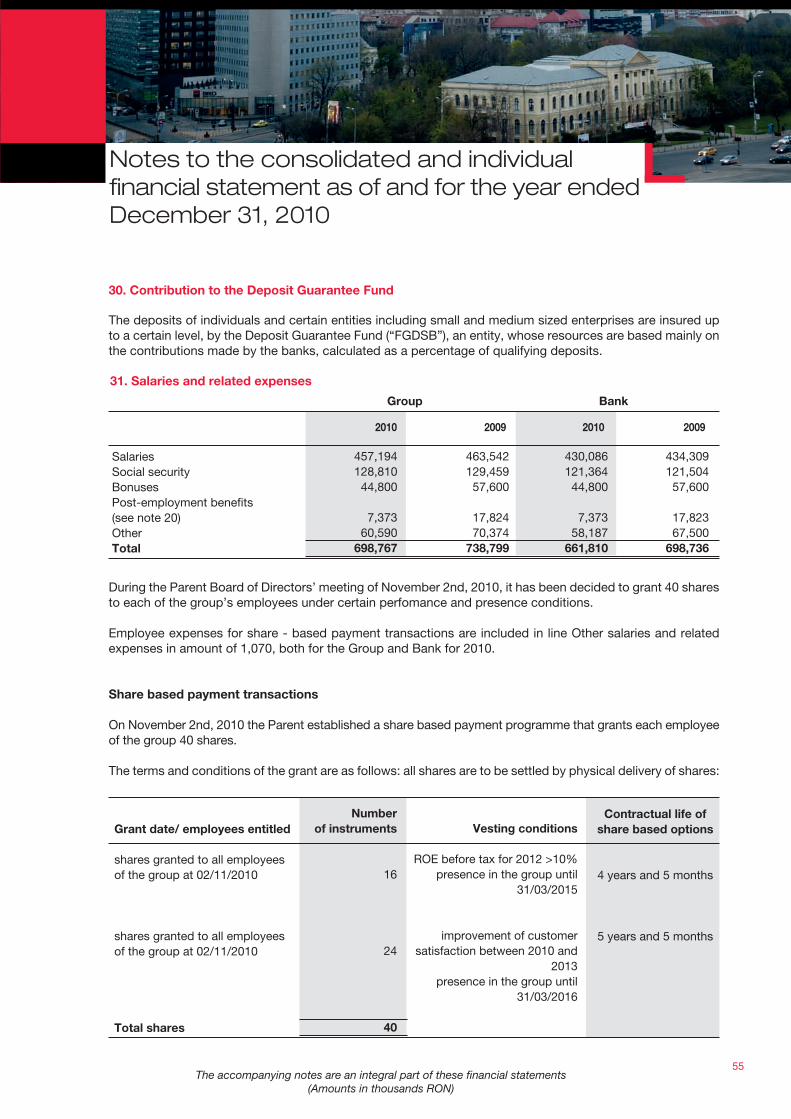
The accompanying notes are an integral part of these financial statements(Amounts in thousands RON)
55
Notes to the consolidated and individual financial statement as of and for the year ended December 31, 2010
Notes to the consolidated and individual financial statement as of and for the year ended December 31, 2010
31. Salaries and related expenses
Group Bank
2010 2009 2010 2009
SalariesSocial securityBonuses Post-employment benefits (see note 20)OtherTotal
457,194128,81044,800
7,37360,590
698,767
430,086121,36444,800
7,37358,187
661,810
463,542129,45957,600
17,82470,374
738,799
434,309121,504
57,600
17,82367,500
698,736
30. Contribution to the Deposit Guarantee Fund
The deposits of individuals and certain entities including small and medium sized enterprises are insured up to a certain level, by the Deposit Guarantee Fund (“FGDSB”), an entity, whose resources are based mainly on the contributions made by the banks, calculated as a percentage of qualifying deposits.
During the Parent Board of Directors’ meeting of November 2nd, 2010, it has been decided to grant 40 shares to each of the group’s employees under certain perfomance and presence conditions.
Employee expenses for share - based payment transactions are included in line Other salaries and related expenses in amount of 1,070, both for the Group and Bank for 2010.
Share based payment transactions
On November 2nd, 2010 the Parent established a share based payment programme that grants each employee of the group 40 shares.
The terms and conditions of the grant are as follows: all shares are to be settled by physical delivery of shares:
Grant date/ employees entitled
shares granted to all employees of the group at 02/11/2010
shares granted to all employees of the group at 02/11/2010
Total shares
Number of instruments
16
24
40
Vesting conditions
ROE before tax for 2012 >10%presence in the group until
31/03/2015
improvement of customer satisfaction between 2010 and
2013presence in the group until
31/03/2016
Contractual life of share based options
4 years and 5 months
5 years and 5 months

The accompanying notes are an integral part of these financial statements(Amounts in thousands RON)
56
Consolidated and individual financial statements
Notes to the consolidated and individual financial statement as of and for the year ended December 31, 2010
31. Salaries and related expenses (continued)
The number and weighted average exercise price of shares is as follows:
Outstanding as at January 1, 2010
Granted during the period
- exercise date 31/03/2015
- exercise date 31/03/2016
Outstanding as at December 31, 2010
Weighted average exercise price (RON)
-
123113
236
Number of shares
-
144,432216,648
361,080
The shares outstanding as at December 31, 2010 have an exercise price of 123 RON (those with an exercise date as at March 31, 2015) and of 113 RON (those with an exercise date as at March 31, 2016) and a contractual life of 4 years and 5 months and 5 years and 5 months respectively.
32. Depreciation and amortization expense
Group Bank
Group Bank
2010 2009 2010 2009
2010 2009 2010 2009
Depreciation and impairment (see Note 12)Amortisation (see Note 14)Losses/(Gains) on disposal of tangible and intangible assetsTotal
Administrative expensesPublicity and sponsorships Other expenses Total
115,96517,174
(1,584)131,555
558,42041,62883,850
683,898
114,53315,130
(1,572)128,091
529,17441,11554,563
624,852
147,82920,396
2,723170,948
567,61243,70879,807
691,127
141,33418,703
2,748162,785
539,36742,74151,072
633,180
33. Other operating expense
Administrative expenses refer mainly to rentals, maintenance expenses, local taxes and various utilities such as energy and telecommunication.
The Group has operating leases that are cancellable with prior notice much shorter than the remaining con-tract period and/or with penalties to be paid which are much lower than lease expense for the remaining contract period.

The accompanying notes are an integral part of these financial statements(Amounts in thousands RON)
57
Notes to the consolidated and individual financial statement as of and for the year ended December 31, 2010
Notes to the consolidated and individual financial statement as of and for the year ended December 31, 2010
Group Bank
2010 2009 2010 2009
Net loans impairment allowanceNet impairment allowance for sundry debtorsNet impairment allowance for financial leasesIncome from recoveries of derecognized receivablesWrite-offs of bad debtsFinancial guarantee contractsTotal
389,78130,407
10,336
(30,485)481,282
1,624882,945
405,39731,695
-
(27,952)421,008
1,624831,772
286,7309,384
11,569
(18,107)308,675
7,239605,490
220,5439,828
-
(17,405)299,053
7,239519,258
34. Credit loss expense
35. Cash and cash equivalents for cash flow purposes
For the purpose of the cash flow statements, cash and cash equivalents comprise the following balances, with less than 90 days maturity from the date of acquisition:
Cash in hand (see note 4)
Current accounts and deposits with banks
Total
December 31, 2010 December 31, 2009
611,570
415,353
1,026,923
631,571
244,521
876,092
Group
Cash in hand (see note 4)
Current accounts and deposits with banks
Total
December 31, 2010 December 31, 2009
611,547
375,715
987,262
631,551
204,889
836,440
For the purpose of consolidated cash flow statement the net expenses from impairment of loans and from provisions are reconciled as follows:
Bank

The accompanying notes are an integral part of these financial statements(Amounts in thousands RON)
58
Consolidated and individual financial statements
Notes to the consolidated and individual financial statement as of and for the year ended December 31, 2010
35. Cash and cash equivalents for cash flow purposes (continued)
Net loans impairment allowance
Net impairment allowance for sundry debtors
Net impairment allowance for financial leases
Write-offs expenses
Financial guarantee contracts
Net movement in other provisions
Total
Net loans impairment allowance
Net impairment allowance for sundry debtors
Write-offs expenses
Financial guarantee contracts
Net movement in other provisions
Total
December 31, 2010
December 31, 2010
December 31, 2009
December 31, 2009
389,781
30,407
10,336
481,282
1,624
(635)
912,795
405,397
31,695
421,008
1,624
(2,051)
857,673
286,730
9,384
11,569
308,675
7,239
1,613
625,210
220,543
9,828
299,053
7,239
1,147
537,810
Group
Bank
36. Guarantees and other financial commitments
Guarantees and letters of creditThe Group issues guarantees and letters of credit for its customers. The primary purpose of letters of credit is to ensure that funds are available to a customer as required. Guarantees and standby letters of credit, which represent irrevocable assurances that the Group will make payments in the event that a customer cannot meet its obligations to third parties, carry a similar credit risk as loans. The market and credit risk on these financial instruments, as well as the operational risk is similar to that arising from granting of loans. In the event of a claim on the Group as a result of a customer’s default on a guarantee these instruments also present a degree of liquidity risk to the Group.
Credit related commitmentsFinancing commitments represent unused amounts of approved credit facilities. While there is some credit risk associated with the commitment, the risk is viewed as modest, since it results from the possibility of unused portions of loan authorizations being drawn by the client and, these amounts not being repaid sub-sequently when due.

The accompanying notes are an integral part of these financial statements(Amounts in thousands RON)
59
Notes to the consolidated and individual financial statement as of and for the year ended December 31, 2010
Notes to the consolidated and individual financial statement as of and for the year ended December 31, 2010
The Group monitors the term to maturity of credit commitments because longer-term commitments generally have a greater degree of credit risk than shorter-term commitments. The total outstanding contractual amount of commitments does not necessarily represent future cash requirements, since many of these commitments will expire or be terminated without being funded.
Group Bank
December 31, 2010 December 31, 2009 December 31, 2010 December 31, 2009
Tangible non-current assetsIntangible non-current assetsTotal
16,637
8,68725,324
16,637
8,68725,324
19,135
3,14822,283
Group Bank
December 31, 2010 December 31, 2009 December 31, 2010 December 31, 2009
Letters of guarantee grantedFinancing commitments grantedTotal commitments granted
7,931,516
3,274,814
11,206,330
8,022,717
3,313,193
11,335,910
8,224,088
3,742,697
11,966,785
8,320,280
3,786,026
12,106,306
19,135
3,14822,283
37. Capital commitments
38. Related parties
The Group enters into related party transactions with its parent, other SG entities, subsidiaries and associ-ates. All related party transactions were made on substantially the same terms, including interest rates and collateral requirements, as those prevailing for similar transactions with unrelated parties. The transactions/balances with subsidiaries were eliminated for consolidation purposes.The transactions/balances with related parties can be summarized as follows:
36. Guarantees and other financial commitments (continued)

The accompanying notes are an integral part of these financial statements(Amounts in thousands RON)
60
Consolidated and individual financial statements
Notes to the consolidated and individual financial statement as of and for the year ended December 31, 2010
2010 2009
AssetsNostro accountsDepositsLoansDerivative financial instruments
LiabilitiesLoro accountsDepositsBorrowingsSubordinated borrowingsLease payableDerivative financial
instruments
Commitments Letters of guarantee receivedNotional amount of foreign exchange transactionsNotional amount of interest rate derivatives
Income statementInterest and commision revenues Interest and com-mission expense Net (loss) on interest rate derivativesNet gain/(loss) on foreign exchange derivativesOther incomeOther expenses
Parent
244,84442,95118,953
182,940
-
9,977,92914,143
608,3548,491,213
864,219-
-
4,745,481
284,153
4,022,021
439,307
88,003
14,075
34,383
(10,093)
49,638--
Parent
234,80430,72321,141
182,940
-
6,829,4174,276
2,109,2663,862,594
853,281-
-
3,828,142
348,444
2,918,860
560,838
84,521
14,418
62,470
(11,008)
18,641--
Subsidiaries
160,585-
43,597110,673
6,315
147,036-
76,6458,577
-55,499
6,315
-
-
-
-
40,739
21,389
17,395
521
-548886
Subsidiaries
340,818-
177,808163,010
-
365,361-
280,52811,285
-61,809
11,739
-
-
-
-
76,653
37,511
29,799
-
3,8021,1664,375
Other SG
entities7,9941,4706,524
-
-
869,572722
868,850-
--
-
33,978
8,197
25,781
-
66,757
76
67,083
-
(402)
-
Other SG
entities11,19311,193
--
-
3,230,107958
3,229,149-
--
-
70,677
6,416
64,261
-
136,169
1,056
134,098
-
1,015--
Associates
----
-
581-
581-
--
-
-
-
-
-
423
2
421
-
---
Associates
1,224--
1,224
-
52,769-
52,769-
--
-
-
-
-
-
14,859
43
14,816
-
---
The interest expenses include an amount of 15,271 (2009: 24,257) relating to subordinated loans.As of December 31, 2010, the Board of Directors and Managing Committee members own 344,680 shares (2009: 367,080).
The short-term benefits relating to the key management personnel (salaries, bonuses, other emoluments and related social security contributions) amounted to 6,236 (2009: 5,148).
38. Related parties (continued)

The accompanying notes are an integral part of these financial statements(Amounts in thousands RON)
61
Notes to the consolidated and individual financial statement as of and for the year ended December 31, 2010
Notes to the consolidated and individual financial statement as of and for the year ended December 31, 2010
39. Contingencies
40. Earnings per share
41. Dividends on ordinary shares
As of December 31, 2010 BRD is the defendant in a number of lawsuits arising in the course of business, amounting to approximately 10,111 (2009: 2,595). The management believes that the ultimate resolution of these matters will not have a material adverse effect on the Group’s overall financial position and performance.
An amount of 19,483 (5 million Euro equivalent) was fined by the Competition Council following an audit of this authority held in October 2008 in several Romanian banks. The Group considers the fine illegal and ground-less and consequently challenged in court its application.
42. Risk management
The main financial assets and liabilities of the Group are the loans and advances, lease receivables, amounts placed with NBR, demand and term deposits and borrowings. These instruments are exposed to a series of risks such as credit risk, foreign exchange risk, interest rate risk and liquidity risk that are discussed below.
42.1 Credit risk
Credit risk represents the loss, which the Group would suffer if a client or counterparty fails to meet its con-tractual obligations. The credit risk is inherent in traditional banking products – loans, commitments to lend and other contingent liabilities, such as letters of credit and fair value derivative contracts (refer to the notes 8, 9 and 36).
The Group restricts its credit exposure to both individual counterparties and counterparty groups by using credit limits attributed when the Group rates the client. The size of limit depends on the assessment of quanti-tative factors such as the clients’ financial strength, industry position, if a business client, as well as qualitative factors such as the quality of management and shareholders structure. Besides, the soundness of the securi-ties provided by the client is considered. The securities could take the form of collateral or personal guaran-tees. In the case of individuals the collaterals are mainly mortgages and pledges on vehicles. The personal guarantees are provided in most of the cases by close relatives. For companies most of the collaterals are mortgages on the production facilities or other owned real estate, pledges on equipment and stock while the personal guarantees are provided by parent, other companies in the group or by other banks. The exposures are monitored against limits on a continuous basis.
Group Bank
Ordinary shares on the market
Profit attributable to parent company shareholders
Earnings per share (in RON)
696,901,518
1,007,923
1.4463
696,901,518
996,338
1.4297
696,901,518
1,146,249
1.6448
696,901,518
1,120,178
1.6074
December 31, 2010 December 31, 2009 December 31, 2010 December 31, 2009
Group Bank
Declared and paid during the year Dividends for 2009: 0.27947 (2008: 0.72828)
Proposed for approval at AGM Dividends for 2010: 0.17957 (2009:0.27947)
192,698
125,147
192,698
125,147
505,198
194,767
505,198
194,767
December 31, 2010 December 31, 2009 December 31, 2010 December 31, 2009

The accompanying notes are an integral part of these financial statements(Amounts in thousands RON)
62
Consolidated and individual financial statements
Notes to the consolidated and individual financial statement as of and for the year ended December 31, 2010
42. Risk management (continued)
42.1 Credit risk (continued)
Maximum exposure to credit risk before considering any collaterals or guarantees
ASSETS
Due from Central Bank
Due from banks
Derivative financial instruments
Loans, gross
Impairment reserve for loans
Loans and advances to customers
Financial lease receivables
Financial assets available for sale
Investments in associates
Other assets
Total in balance sheet
Letters of guarantee granted
Financing commitments grantedTotal commitments granted
Total credit risk exposure
ASSETS
Due from Central Bank
Due from banks
Derivative financial instruments
Loans, gross
Impairment reserve for loans
Loans and advances to customers
Financial lease receivables
Financial assets available for sale
Investitii in filiale si asociati
Other assets
Total in balance sheet
Letters of guarantee granted
Financing commitments granted
Total commitments granted
Total credit risk exposure
December 31, 2010
December 31, 2010
December 31, 2009
December 31, 2009
9,429,298
662,001
85,839
33,894,627
(1,651,414)
32,243,213
871,821
4,081,509
78,237
278,53747,730,455
3,274,814
-
3,274,814
51,005,269
9,428,409
622,363
92,154
33,413,538
(1,520,314)
31,893,224
-
4,032,352
153,603
164,870
46,386,975
3,313,193
-
3,313,193
49,700,168
9,219,118
584,867
90,166
33,937,371
(1,257,126)
32,680,245
1,082,128
2,275,135
79,271
312,292
46,323,222
3,742,697
-
3,742,697
50,065,919
9,217,933
545,235
101,906
33,402,677
(1,110,412)
32,292,265
-
2,199,790
147,472
159,846
44,664,447
3,786,026
-
3,786,026
48,450,473
Group
Bank

The accompanying notes are an integral part of these financial statements(Amounts in thousands RON)
63
Notes to the consolidated and individual financial statement as of and for the year ended December 31, 2010
Notes to the consolidated and individual financial statement as of and for the year ended December 31, 2010
Group
2010
2009
2009
Bank
2010
42. Risk management (continued)
42.2 Market risk
Market risk is the risk of loss arising from movements in observable market variables such as interest rates, and exchange rates.
Foreign exchange riskThe foreign exchange risk is the risk of loss resulting from changes in exchange rates. The Group manages the foreign currency risk by using limits for the open foreign currency positions both by currency and at the level of global foreign currency position.
The table below indicates the currencies to which the Group had significant exposure as at December 31 on its assets and liabilities. The analysis calculates the effect of a reasonably possible movement of the currency rate against RON, with all other variables held constant, on the income statement and equity. A negative amount in the table reflects a potential net reduction in income statement or equity, while a positive amount reflects a net potential increase. An equivalent decrease in each of the below currencies against RON would have resulted in an equivalent but opposite impactThe impact on equity does not contain the impact in income statement.
Currency EUR Other
Currency EUR Other
Currency EUR Other
Currency EUR Other
Change in currency rate %
+5 +5
Change in currency rate %
+5 +5
Change in currency rate %
+5 +5
Change in currency rate %
+5 +5
Effect on profit before tax
(45,943)932
Effect on profit before tax
26,6572,814
Effect on profit before tax
(37,578)306
Effect on profit before tax
20,7641,958
Effect on equity
(195)-
Effect on equity
(195)-
Effect on equity
1,823-
Effect on equity
1,823-

The accompanying notes are an integral part of these financial statements(Amounts in thousands RON)
64
Consolidated and individual financial statements
Notes to the consolidated and individual financial statement as of and for the year ended December 31, 2010
42. Risk management (continued)
42.2 Market risk (continued)
The Group and the Bank statement of financial position structure by currency is presented below:
GroupDecember 31, 2010
BankDecember 31, 2010
AssetsLiabilities and shareholders’ equityEffect of derivatives held for risk management
Total
49,666,903
49,666,903
-
-
Total
48,288,308
48,288,308
-
-
EUR
25,471,508
22,343,945
(2,672,141)
455,422
EUR
24,705,320
21,500,047
(2,672,141)
533,132
RON
23,488,751
25,798,306
1,801,210
(508,345)
RON
22,884,582
25,275,201
1,801,210
(589,409)
Other
706,644
1,524,652
870,931
52,923
Other
698,405
1,513,060
870,931
56,277
GroupDecember 31, 2009
BankDecember 31, 2009
AssetsLiabilities and shareholders’ equityEffect of derivatives held for risk management
Total
48,290,508
48,290,508
-
-
Total
46,594,054
46,594,054
-
-
EUR
26,786,403
24,406,775
(2,138,923)
240,705
EUR
25,767,223
23,213,026
(2,138,923)
415,274
RON
20,927,587
22,931,540
1,725,318
(278,635)
RON
20,280,341
22,460,087
1,725,318
(454,428)
Other
576,518
952,193
413,605
37,930
Other
546,490
920,941
413,605
39,154

The accompanying notes are an integral part of these financial statements(Amounts in thousands RON)
65
Notes to the consolidated and individual financial statement as of and for the year ended December 31, 2010
Notes to the consolidated and individual financial statement as of and for the year ended December 31, 2010
42. Risk management (continued)
42.2 Market risk (continued)
Interest rate risk Interest rate risk arises from the possibility that changes in interest rates will affect future cash flows or the fair values of financial instruments. The only interest risk taken by the Group is non-trading and it is monitored by the means of interest rate gap. In accordance with the Group’s policy, positions are monitored on a regular basis and appropriate strategies are used to ensure positions are maintained within the established limits. The following table demonstrates the sensitivity to a reasonable possible change in interest rates, with all other variables held constant, of the Group’s and Bank’s income statement and equity.
The sensitivity of the income statement is the effect of the assumed changes in interest rates on the profit or loss for the year, based on the financial assets and financial liabilities held at 31 December. The sensitivity of equity is calculated by revaluing fixed rate available-for-sale financial assets at 31 December for the effects of the assumed changes in interest rates. The total sensitivity of the income statement and equity is based on the assumption that there are parallel shifts in the yield curve.
The table below analyses the Group’s and the Bank’s interest rate risk exposure. The Group’s assets and liabilities are included at carrying amount and categorised by the earlier of contractual re-pricing or maturity dates.
Group Bank
December 31, 2010
December 31, 2009
December 31, 2010
December 31, 2009
Effect on profit before tax
(4,509)4,509
Effect on profit before tax
4,078(4,078)
Effect on profit before tax
636(636)
Effect on profit before tax
4,078(4,078)
Effect on equity 9,665(9,665)
Effect on equity 7,103(7,103)
Effect on equity 9,665(9,665)
Effect on equity 7,103(7,103)
Change in interest rate (b.p)
100(100)
Change in interest rate (b.p)
100(100)
Change in interest rate (b.p)
100(100)
Change in interest rate (b.p)
100(100)

The accompanying notes are an integral part of these financial statements(Amounts in thousands RON)
66
Consolidated and individual financial statements
Notes to the consolidated and individual financial statement as of and for the year ended December 31, 2010
42. Risk management (continued)
42.2 Market risk (continued)
December 31, 2010
ASSETSCash in handDue from Central Bank Due from banksDerivative financial instrumentsLoans and advances to customersFinancial lease receivablesFinancial assets available for saleInvestments in associatesGoodwillNon current assets and other assetsTotal assets
LiabilitiesDemand deposits and current accountsTerm depositsBorrowed funds and debt issuedDerivative financial instrumentsCurrent tax liabilityDeferred tax liabilityOther liabilitiesTotal liabilities
Total shareholders’ equity
Net position
0-1 months
611,5709,429,298
422,36385,839
14,273,93896,172
112,344---
25,031,524
13,965,11410,086,9601,832,308
91,639-
16,102354,288
26,346,411
-
(1,314,887)
1-3 months
--
85-
11,087,65491,445
149,086--
278,53711,606,807
-5,084,4695,672,701
--
11,1422,069
10,770,381
-
836,426
3-12
months
--
110,423-
2,750,809454,404
1,956,946---
5,272,582
-1,860,2423,702,970
-2,383
35,496-
5,601,091
-
(328,509)
1-5 years
--
25,106-
3,323,727211,003
1,639,285 ---
5,199,121
-859,282144,887
--
53,008-
1,057,177
-
4,141,944
Over 5 years
--
104,024-
807,08518,797
223,84878,23750,151
1,274,7272,556,869
-45,20720,153
--
77,416-
142,776
5,749,067
(3,334,975)
Total
611,5709,429,298
662,00185,839
32,243,213871,821
4,081,50978,23750,151
1,553,26449,666,903
13,965,11417,936,16011,373,019
91,6392,383
193,164356,357
43,917,836
Group

The accompanying notes are an integral part of these financial statements(Amounts in thousands RON)
67
Notes to the consolidated and individual financial statement as of and for the year ended December 31, 2010
Notes to the consolidated and individual financial statement as of and for the year ended December 31, 2010
42. Risk management (continued)
42.2 Market risk (continued)
December 31, 2009
ASSETSCash in handDue from Central Bank Due from banksDerivative financial instrumentsLoans and advances to customersFinancial lease receivablesFinancial assets available for saleInvestments in associatesGoodwillNon current assets and other assetsTotal assets
LiabilitiesDemand deposits and current accountsTerm depositsBorrowed funds and debt issuedDerivative financial instrumentsCurrent tax liabilityDeferred tax liabilityOther liabilitiesTotal liabilities
Total shareholders’ equity
Net position
0-1
months
631,5719,219,118
343,05190,166
17,349,553109,09110,690
---
27,753,240
14,618,90213,365,7801,881,432
63,418-
7,253334,750
30,271,535
-
(2,518,295)
1-3 months
----
8,270,435439,609232,427
--
312,2929,254,763
-6,748,9983,663,821
--
4,7732,343
10,419,935
-
(1,165,172)
3-12
months
--
204,157-
1,516,164248,660
1,349,134---
3,318,115
-859,863631,740
-13
6,917-
1,498,533
-
1,819,582
1-5 years
--
25,106-
4,239,775245,846506,371
---
5,017,098
-124,376920,364
--
24,151-
1,068,891
-
3,948,207
Over 5 years
--
2,553-
1,304,318 38,922
176,513 79,271 50,151
1,285,564 2,947,292
-1,325
39,220--
46,924-
87,469
4,944,145
(2,084,322)
Total
631,5719,219,118
584,86790,166
32,680,2451,082,1282,275,135
79,27150,151
1,597,85648,290,508
14,618,90221,100,3427,136,577
63,41813
90,018337,093
43,346,363
Group

The accompanying notes are an integral part of these financial statements(Amounts in thousands RON)
68
Consolidated and individual financial statements
Notes to the consolidated and individual financial statement as of and for the year ended December 31, 2010
42. Risk management (continued)
42.2 Market risk (continued)
December 31, 2010
ASSETSCash in handDue from Central Bank Due from banksDerivative financial instrumentsLoans and advances to customersFinancial assets available for saleInvestments in associatesGoodwillNon current assets and other assetsTotal assets
LiabilitiesDemand deposits and current accountsTerm depositsBorrowed funds and debt issuedDerivative financial instrumentsDeferred tax liabilityOther liabilitiesTotal liabilities
Total shareholders’ equity
Net position
0-1 months
611,5479,428,409
420,41692,154
14,295,921261,430
---
25,109,877
13,976,85910,114,3041,563,125
91,63916,302
275,85426,038,083
-
(928,206)
1-3 months
--
85-
11,085,404839,948
--
164,87012,090,307
-5,089,4695,001,737
-11,2532,069
10,104,528
-
1,985,779
3-12
months
--
110,392-
2,712,7191,344,908
---
4,168,019
-1,860,2423,535,044
-35,773
-5,431,059
-
(1,263,040)
1-5 years
----
3,055,4461,407,489
---
4,462,935
-859,28264,765
-52,232
-976,279
-
3,486,656
Over 5 years
--
91,470-
743,734178,577153,60350,151
1,239,6352,457,170
-77,7603,168
-80,233
-161,161
5,577,198
(3,281,190)
Total
611,5479,428,409
622,36392,154
31,893,2244,032,352
153,60350,151
1,404,50548,288,308
13,976,85918,001,05710,167,839
91,639195,793277,923
42,711,110
Bank

The accompanying notes are an integral part of these financial statements(Amounts in thousands RON)
69
Notes to the consolidated and individual financial statement as of and for the year ended December 31, 2010
Notes to the consolidated and individual financial statement as of and for the year ended December 31, 2010
42. Risk management (continued)
42.2 Market risk (continued)
December 31, 2009
ASSETSCash in handDue from Central Bank Due from banksDerivative financial instrumentsLoans and advances to customersFinancial assets available for saleInvestments in associatesGoodwillNon current assets and other assetsTotal assets
LiabilitiesDemand deposits and current accountsTerm depositsBorrowed funds and debt issuedDerivative financial instrumentsDeferred tax liabilityOther liabilitiesTotal liabilities
Total shareholders’ equity
Net position
0-1 months
631,5519,217,933
341,078101,906
17,385,51310,752
---
27,688,733
14,636,83513,566,8401,464,853
63,4187,337
247,65629,986,939
-
(2,298,206)
1-3 months
----
8,268,908236,384
--
159,8468,665,138
-6,753,9982,691,642
-4,8302,345
9,452,815
-
(787,677)
3-12
months
--
204,157-
1,485,6001,372,102
---
3,061,859
-859,863431,529
-7,025
-1,298,417
-
1,763,442
1-5 years
----
3,935,420514,992
---
4,450,412
-144,376805,007
-23,825
-973,208
-
3,477,204
Over 5 years
----
1,216,82465,560
147,47250,151
1,247,9052,727,912
-38,8787,385
-50,744
-97,007
4,785,668
(2,154,763)
Total
631,5519,217,933
545,235101,906
32,292,2652,199,790
147,47250,151
1,407,75146,594,054
14,636,83521,363,9555,400,416
63,41893,761
250,00141,808,386
Bank

The accompanying notes are an integral part of these financial statements(Amounts in thousands RON)
70
Consolidated and individual financial statements
Notes to the consolidated and individual financial statement as of and for the year ended December 31, 2010
42. Risk management (continued)
42.3 Liquidity risk
The liquidity risk is associated either with the difficulty of an enterprise to raise necessary funds in order to meet commitments or with its inability to realize a financial asset quickly and for an amount close to its fair value. The Group permanently monitors the current liquidity gaps and forecasts regularly the future liquidity position. As well the Group uses stress scenarios as part of liquidity risk management.The maturity structure of the Group’s and the Bank’s assets and liabilities, based on the expected maturity as of December 31, 2010 and 2009 is as follows:
December 31, 2010
ASSETS
Cash in hand
Due from Central Bank
Due from banks
Derivative financial
instruments
Loans and advances to
customers
Financial lease receivables
Financial assets available
for sale
Investments in associates
Goodwill
Non current assets and
other assets
Total assets
LIABILITIES
Demand deposits and
current accounts
Term deposits
Borrowed funds and debt
issued
Derivative financial
instruments
Current tax liability
Deferred tax liability
Other payables
Total liabilities
Total shareholders equity
Gap
Cumulative gap
Total
611,570
9,429,298
662,001
85,839
32,243,213
871,821
4,081,509
78,237
50,151
1,553,264
49,666,903
13,965,114
17,936,160
11,373,019
91,639
2,383
193,164
356,357
43,917,836
5,749,067
1-3
months
-
-
-
-
2,095,862
91,445
149,086
-
-
278,537
2,614,930
-
4,870,229
261,678
-
-
11,142
2,069
5,145,118
-
(2,530,188)
(13,802,134)
0-1
months
611,570
9,429,298
422,449
85,839
3,457,251
96,172
112,344
-
-
-
14,214,923
13,965,114
10,086,960
972,766
91,639
-
16,102
354,288
25,486,869
-
(11,271,946)
(11,271,946)
3-12
months
-
-
18,294
-
8,025,397
454,404
1,956,946
-
-
-
10,455,041
-
1,881,666
7,758,696
-
2,383
35,496
-
9,678,241
-
776,800
(13,025,334)
Over
5 years
-
-
122,976
-
8,693,493
18,797
223,848
-
-
-
9,059,114
-
152,327
148,697
-
-
23,003
-
324,027
-
8,735,088
4,400,365
-
-
-
-
-
-
-
78,237
50,151
1,274,727
1,403,115
-
-
-
-
-
54,413
-
54,413
5,749,067
(4,400,365)
-
Group1-5
years
-
-
98,282
-
9,971,210
211,003
1,639,285
-
-
-
11,919,780
-
944,978
2,231,183
-
-
53,008
-
3,229,169
-
8,690,611
(4,334,723)
Without defined maturity

The accompanying notes are an integral part of these financial statements(Amounts in thousands RON)
71
Notes to the consolidated and individual financial statement as of and for the year ended December 31, 2010
Notes to the consolidated and individual financial statement as of and for the year ended December 31, 2010
42. Risk management (continued)
42.3 Liquidity risk (continued)
December 31, 2009
ASSETS
Cash
Due from Central Bank
Due from banks
Derivative financial instruments
Loans, net
Financial lease receivables
Financial assets available
for sale
Investments in associates
Goodwill
Non current assets and other
assets
Total assets
LIABILITIES
Demand deposits and current
accounts
Term deposits
Borrowed funds and debt
issued
Derivative financial
instruments
Current tax liability
Deferred tax liability
Other payables
Total liabilities
Total shareholders equity
Gap
Cumulative gap
Total
631,571
9,219,118
584,867
90,166
32,680,245
1,082,128
2,275,135
79,271
50,151
1,597,856
48,290,508
14,618,902
21,100,342
7,136,577
63,418
13
90,018
337,093
43,346,363
4,944,145
1-3
months
-
-
-
-
2,098,086
439,609
232,427
-
-
312,292
3,082,414
-
3,500,005
74,832
-
-
4,773
2,343
3,581,953
-
(499,539)
(9,094,804)
0-1
months
631,571
9,219,118
343,051
90,166
3,513,543
109,091
10,690
-
-
-
13,917,230
14,618,902
7,331,106
157,066
63,418
-
7,253
334,750
22,512,495
-
(8,595,265)
(8,595,265)
3-12
months
-
-
18,294
-
7,091,640
248,660
1,349,134
-
-
-8,707,728
-
2,792,710
1,052,235
-
13
6,917
-
3,851,875
-
4,855,853
(4,238,951)
Over
5 years
-
-
125,240
-
9,360,769
38,921
176,513
-
-
-
9,701,443
-
137,523
597,148
-
-
11,364
-
746,035
-
8,955,408
3,564,719
-
-
-
-
-
-
-
79,271
50,151
1,285,564
1,414,986
-
-
-
-
-
35,560
-
35,560
4,944,145
(3,564,719)
-
-
Group1-5
years
-
-
98,282
-
10,616,207
245,847
506,371
-
-
-
11,466,707
-
7,338,998
5,255,296
-
-
24,151
-
12,618,445
-
(1,151,738)
(5,390,689)
Without defined maturity

The accompanying notes are an integral part of these financial statements(Amounts in thousands RON)
72
Consolidated and individual financial statements
Notes to the consolidated and individual financial statement as of and for the year ended December 31, 2010
42. Risk management (continued)
42.3 Liquidity risk (continued)
December 31, 2010
ASSETS
Cash in hand
Due from Central Bank
Due from banks
Derivative financial
instruments
Loans and advances to
customers
Financial lease receivables
Financial assets available
for sale
Investments in associates
Goodwill
Non current assets and
other assets
Total assets
LIABILITIES
Demand deposits and
current accounts
Term deposits
Borrowed funds and debt
issued
Derivative financial
instruments
Deferred tax liability
Other payables
Total liabilities
Total shareholders equity
Gap
Cumulative gap
Total
611,547
9,428,409
622,363
92,154
31,893,224
-
4,032,352
153,603
50,151
1,404,505
48,288,308
13,976,859
18,001,057
10,167,839
91,639
195,793
277,923
42,711,110
5,577,198
1-3
months
-
-
-
-
2,093,798
-
839,948
-
-
164,870
3,098,616
-
4,875,229
229,913
-
11,253
2,069
5,118,464
-
(2,019,848)
(13,088,512)
0-1
months
611,547
9,428,409
420,501
92,154
3,457,080
-
261,430
-
-
-
14,271,121
13,976,859
10,114,304
864,827
91,639
16,302
275,854
25,339,785
-
(11,068,664)
(11,068,664)
3-12
months
-
-
18,294
-
7,989,799
-
1,344,908
-
-
-
9,353,001
-
1,881,666
7,410,191
-
35,773
-
9,327,630
-
25,371
(13,063,141)
Over
5 years
-
-
110,392
-
8,633,850
-
178,577
-
-
-
8,922,819
-
184,880
131,712
-
22,933
-
339,525
-
8,583,294
4,191,109
-
-
-
-
-
-
-
153,603
50,151
1,239,635
1,443,389
-
-
-
-
57,300
-
57,300
5,577,198
(4,191,109)
-
Bank1-5
years
-
-
73,176
-
9,718,697
-
1,407,489
-
-
-
11,199,362
-
944,978
1,531,196
-
52,232
-
2,528,406
-
8,670,956
(4,392,186)
Without defined maturity
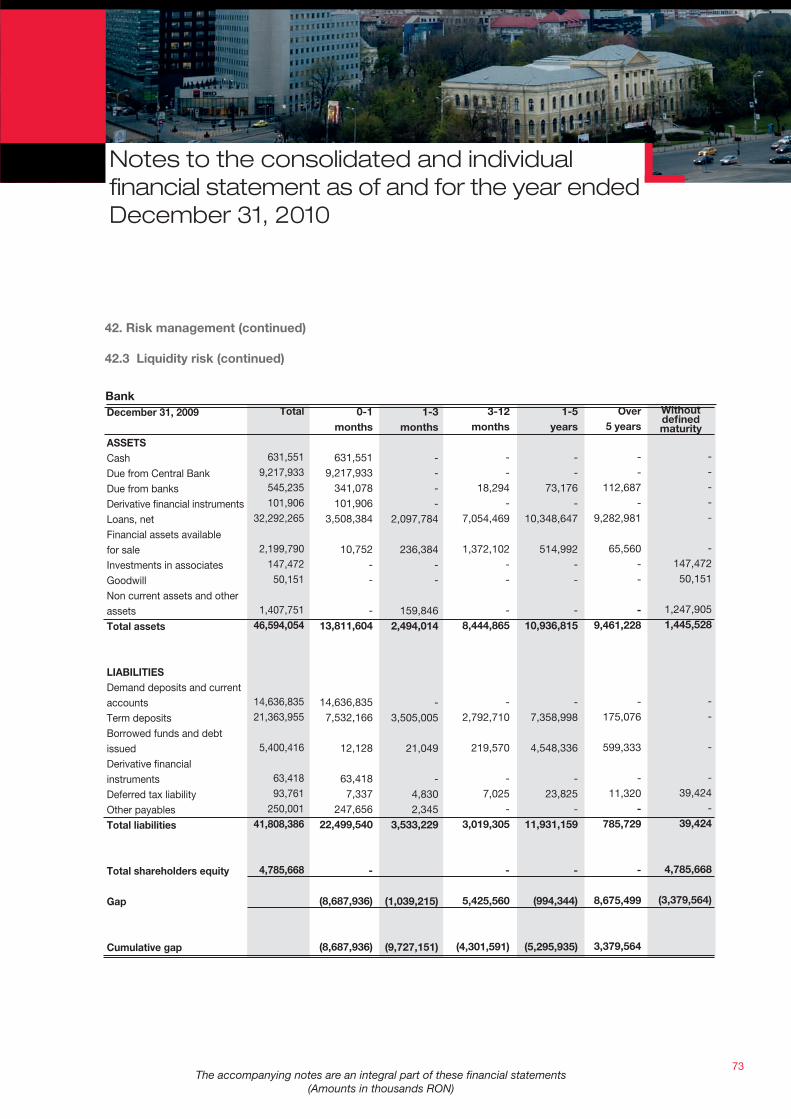
The accompanying notes are an integral part of these financial statements(Amounts in thousands RON)
73
Notes to the consolidated and individual financial statement as of and for the year ended December 31, 2010
Notes to the consolidated and individual financial statement as of and for the year ended December 31, 2010
42. Risk management (continued)
42.3 Liquidity risk (continued)
December 31, 2009
ASSETS
Cash
Due from Central Bank
Due from banks
Derivative financial instruments
Loans, net
Financial assets available
for sale
Investments in associates
Goodwill
Non current assets and other
assets
Total assets
LIABILITIES
Demand deposits and current
accounts
Term deposits
Borrowed funds and debt
issued
Derivative financial
instruments
Deferred tax liability
Other payables
Total liabilities
Total shareholders equity
Gap
Cumulative gap
Total
631,551
9,217,933
545,235
101,906
32,292,265
2,199,790
147,472
50,151
1,407,751
46,594,054
14,636,835
21,363,955
5,400,416
63,418
93,761
250,001
41,808,386
4,785,668
1-3
months
-
-
-
-
2,097,784
236,384
-
-
159,846
2,494,014
-
3,505,005
21,049
-
4,830
2,345
3,533,229
(1,039,215)
(9,727,151)
0-1
months
631,551
9,217,933
341,078
101,906
3,508,384
10,752
-
-
-
13,811,604
14,636,835
7,532,166
12,128
63,418
7,337
247,656
22,499,540
-
(8,687,936)
(8,687,936)
3-12
months
-
-
18,294
-
7,054,469
1,372,102
-
-
-
8,444,865
-
2,792,710
219,570
-
7,025
-
3,019,305
-
5,425,560
(4,301,591)
Over
5 years
-
-
112,687
-
9,282,981
65,560
-
-
-
9,461,228
-
175,076
599,333
-
11,320
-
785,729
-
8,675,499
3,379,564
-
-
-
-
-
-
147,472
50,151
1,247,905
1,445,528
-
-
-
-
39,424
-
39,424
4,785,668
(3,379,564)
Bank1-5
years
-
-
73,176
-
10,348,647
514,992
-
-
-
10,936,815
-
7,358,998
4,548,336
-
23,825
-
11,931,159
-
(994,344)
(5,295,935)
Without defined maturity

The accompanying notes are an integral part of these financial statements(Amounts in thousands RON)
74
Consolidated and individual financial statements
Notes to the consolidated and individual financial statement as of and for the year ended December 31, 2010
42. Risk management (continued)
42.3 Liquidity risk (continued)
Future undiscounted cash flowsThe tables below summaries the maturity profile of the financial liabilities based on contractual undiscounted repayment obligations.
December 31, 2010
LIABILITIES
Demand deposits and current
accounts
Term deposits
Borrowed funds and debt
issued
Current tax liability
Deferred tax liability
Other liabilities except for fair
values of derivatives
Derivative financial instruments
Letters of guarantee granted
Total liabilities
Total
13,965,467
18,154,390
11,708,114
2,383
193,164
356,357
458
7,931,516
52,311,849
1-3
months
-
4,928,262
261,971
-
11,142
2,069
(477)
-
5,202,967
0-1
months
13,965,467
10,052,329
874,828
-
16,102
354,288
(1,218)
7,931,516
33,193,312
3-12
months
-
1,950,359
7,737,525
2,383
35,496
-
7,263
-
9,733,026
Over
5 years
-
189,090
155,800
-
23,003
-
(3)
-
367,890
-
-
-
-
54,413
-
-
-
54,413
Group1-5
years
-
1,034,350
2,677,989
-
53,008
-
(5,106)
-
3,760,241
Without defined maturity
December 31, 2009
LIABILITIES
Demand deposits and current
accounts
Term deposits
Borrowed funds and debt
issued
Current tax liability
Deferred tax liability
Other liabilities except for fair
values of derivatives
Derivative financial instruments
Letters of guarantee granted
Total liabilities
Total
14,621,276
21,299,488
7,485,949
13
90,018
337,093
61,452
8,224,088
52,119,377
1-3
months
-
6,312,848
1,433,903
-
4,773
2,343
4,591
-
7,758,458
0-1
months
14,621,276
11,919,824
117,105
-
7,253
334,750
27,595
8,224,088
35,251,891
3-12
months
-
2,441,963
1,893,209
13
6,917
-
41,625
-
4,383,727
Over
5 years
-
196,361
607,773
-
11,364
-
(321)
-
815,177
-
-
-
-
35,560
-
-
-
35,560
Group1-5
years
-
428,492
3,433,959
-
24,151
-
(12,038)
-
3,874,564
Without defined maturity

The accompanying notes are an integral part of these financial statements(Amounts in thousands RON)
75
Notes to the consolidated and individual financial statement as of and for the year ended December 31, 2010
Notes to the consolidated and individual financial statement as of and for the year ended December 31, 2010
42. Risk management (continued)
42.3 Liquidity risk (continued)
Future undiscounted cash flows (continued)
December 31, 2010
LIABILITIES
Demand deposits and current
accounts
Term deposits
Borrowed funds and debt
issued
Deferred tax liability
Other liabilities except for fair
values of derivatives
Derivative financial
instruments
Letters of guarantee granted
Total liabilities
Total
13,977,212
18,223,977
10,433,475
195,794
277,923
6,882
8,022,717
51,137,980
1-3
months
-
4,933,262
222,160
11,253
2,069
1,024
-
5,169,768
0-1
months
13,977,212
10,082,101
868,518
16,302
275,854
(1,577)
8,022,717
33,241,127
3-12
months
-
1,950,359
7,549,880
35,773
-
10,073
-
9,546,085
Over
5 years
-
223,904
135,475
22,934
-
(3)
-
382,310
-
-
-
57,300
-
-
-
57,300
Bank1-5
years
-
1,034,351
1,657,442
52,232
-
(2,635)
-
2,741,390
Without defined maturity
December 31, 2009
LIABILITIES
Demand deposits and current
accounts
Term deposits
Borrowed funds and debt
issued
Deferred tax liability
Other liabilities except for fair
values of derivatives
Derivative financial
instruments
Letters of guarantee granted
Total liabilities
Total
14,638,828
21,755,551
5,652,039
93,761
250,001
79,108
8,320,280
50,789,568
1-3
months
-
6,317,848
1,287,524
-
2,345
7,097
-
7,614,814
0-1
months
14,638,828
12,115,116
11,260
93,761
247,656
27,155
8,320,280
35,454,056
3-12
months
-
2,441,963
1,166,531
-
-
48,902
-
3,657,396
Over
5 years
-
196,361
568,372
-
-
(321)
-
764,412
-
-
-
-
-
-
-
-
Bank1-5
years
-
684,263
2,618,352
-
-
(3,725)
-
3,298,890
Without defined maturity

The accompanying notes are an integral part of these financial statements(Amounts in thousands RON)
76
Consolidated and individual financial statements
Notes to the consolidated and individual financial statement as of and for the year ended December 31, 2010
43. Fair value
Determination of fair value and fair value hierarchyThe Group uses the following hierarchy for determining and disclosing the fair value of financial instruments by valuation technique:
Level 1: quoted (unadjusted) prices in active markets for identical assets or liabilities;
Level 2: other techniques for which all inputs which have a significant effect on the recorded fair value are observable, either directly or indirectly; and
Level 3: techniques which use inputs which have a significant effect on the recorded fair value that are not based on observable market data.
The following table shows an analysis of financial instruments recorded at fair value by level of the fair value hierarchy:
December 31, 2010
Group Bank
December 31, 2010
Financial assetsDerivative financial instruments
Interest rate swapsCurrency swapsForward foreign exchange contractsCurrency options
Financial assets available for sale
Treasury notesEquity investmentsOther securities
Total
Financial liabilitiesDerivative financial instrumentsInterest rate swapsCurrency swapsForward foreign exchange contractsCurrency options
Total
--
---
-1,356
108,229109,585109,585
--
---
Level 1
--
---
-1,356
60,20861,56461,564
--
---
Level 1
--
---
-7,470
-7,4707,470
--
---
Level 3
--
---
-6,335
-6,3356,335
--
---
Level 3
3,43127,041
3,29452,07385,839
3,964,454--
3,964,4544,050,293
10,83919,097
9,63052,07391,639
Level 2
9,74627,041
3,29452,07392,154
3,964,453--
3,964,4534,056,607
10,83919,097
9,63052,07391,639
Level 2
3,43127,041
3,29452,07385,839
3,964,4548,826
108,2294,081,5094,167,348
10,83919,097
9,63052,07391,639
Total
9,74627,041
3,29452,07392,154
3,964,4547,691
60,2084,032,3524,124,506
10,83919,097
9,63052,07391,639
Total

The accompanying notes are an integral part of these financial statements(Amounts in thousands RON)
77
Notes to the consolidated and individual financial statement as of and for the year ended December 31, 2010
Notes to the consolidated and individual financial statement as of and for the year ended December 31, 2010
December 31, 2009
Group Bank
December 31, 2009
Financial assetsDerivative financial instruments
Interest rate swapsCurrency swapsForward foreign exchange contractsCurrency options
Financial assets available for sale
Treasury notesEquity investmentsOther securities
Total
Financial liabilitiesDerivative financial instrumentsInterest rate swapsCurrency swapsForward foreign exchange contractsCurrency options
Total
-----
-3,088
129,699132,787132,787
--
---
Level 1
--
---
-3,088
55,49158,57958,579
--
---
Level 1
--
---
-7,257
-7,2577,257
--
---
Level 3
--
---
-6,121
-6,1216,121
--
---
Level 3
-40,160
32,99417,01290,166
2,131,310-
3,7812,135,0912,225,257
12,41927,446
6,54117,01263,418
Level 2
11,74040,160
32,99417,012
101,906
2,131,309-
3,7812,135,0902,236,996
12,41927,446
6,54117,01263,418
Level 2
-40,160
32,99417,01290,166
2,131,31010,345
133,4802,275,1352,365,301
12,41927,446
6,54117,01263,418
Total
11,74040,160
32,99417,012
101,906
2,131,3099,209
59,2722,199,7902,301,696
12,41927,446
6,54117,01263,418
Total
43. Fair value (continued)
Financial instruments recorded at fair valueThe following is a description of the determination of fair value for financial instruments which are recorded at fair value using valuation techniques. These incorporate the Group’s estimate of assumptions that a market participant would make when valuing the instruments.
DerivativesDerivative products valued using a valuation technique with market observable inputs are mainly interest rate swaps, currency swaps and forward foreign exchange contracts. The most frequently applied valuation tech-niques include forward pricing and swap models, using present value calculations. The models incorporate various inputs including foreign exchange spot and forward rates and interest rate curves.
Financial assets available for saleAvailable-for-sale financial assets valued using a valuation technique or pricing models primarily consist of unquoted equities and debt securities. These assets are valued using models which sometimes only incorpo-rate data observable in the market and at other times use both observable and non-observable data. The non-observable inputs to the models include assumptions regarding the financial performance of the investee.

The accompanying notes are an integral part of these financial statements(Amounts in thousands RON)
78
Consolidated and individual financial statements
Notes to the consolidated and individual financial statement as of and for the year ended December 31, 2010
43. Fair value (continued)
Fair value of financial assets and liabilities not carried at fair value
Financial assetsDeposits with banks, loans originated by the Group and leases are measured at amortized cost using the ef-fective interest rate method less any impairment allowance.
For deposits with banks, amortized cost is estimated to approximate fair value due to their short–term nature, interest rates reflecting current market conditions and no significant transaction costs.
Financial liabilitiesThe amortized cost of deposits from banks and customers is considered to approximate their respective fair values, since these items have predominantly short maturities, carry interest rates reflecting current market conditions and are settled without significant transaction costs.
The following table presents the fair value and the carrying amount per type of financial instrument.
December 31, 2010 December 31, 2009
Group Bank
December 31, 2009December 31, 2010
Financial assetsCash in hand
Due from Central Bank
Due from banks
Loans and advances
to customers
Financial lease
receivables
Financial liabilitiesDemand deposits and
current accounts
Term deposits
Borrowed funds and
debt issued
611,570
9,429,298
662,001
32,243,213
871,821
43,817,903
13,965,114
17,936,160
11,373,019
43,274,293
Carrying
value
611,547
9,428,409
622,363
31,893,224
-
42,555,543
13,976,859
18,001,057
10,167,839
42,145,755
Carrying
value
631,571
9,219,118
584,867
32,680,245
1,082,128
44,197,929
14,618,902
21,100,342
7,136,577
42,855,821
Carrying
value
631,551
9,217,933
545,235
32,292,265
-
42,686,984
14,636,835
21,363,955
5,400,416
41,401,206
Carrying
value
611,570
9,429,298
662,001
32,354,730
840,158
43,897,757
13,965,114
17,237,828
11,405,727
42,608,669
Fair
value
611,547
9,428,409
622,363
32,068,947
-
42,731,266
13,976,859
17,271,983
10,891,164
42,140,006
Fair
value
631,571
9,219,118
584,867
32,755,350
995,944
44,186,850
14,618,902
20,957,382
7,110,530
42,686,814
Fair
value
631,551
9,217,933
545,235
32,437,396
-
42,832,115
14,636,835
21,183,723
5,141,460
40,962,018
Fair
value
The accompanying notes are an integral part of these financial statements(Amounts in thousands RON)
79
Notes to the consolidated and individual financial statement as of and for the year ended December 31, 2010
Notes to the consolidated and individual financial statement as of and for the year ended December 31, 2010
43. Fair value (continued)
The methods and significant assumptions applied in determining the fair value of the elements in the table above are listed below.
The fair value of fixed rate instruments is estimated by discounting the maturing cash flows with discount fac-tors derived from the rates offered to similar clients, for similar products on similar maturities. The fair value of floating instruments is estimated by discounting from the next re-pricing date using as discount factors rates offered to similar clients, for similar products on similar time horizons.
Changes in the credit quality of loans within the portfolio are not taken into account in determining gross fair values, as the impact of impairment is recognized separately by deducting the amount of the allowance for credit losses from both carrying and fair values.
For the purposes of the fair value disclosure, the interest accrued to date is included in the carrying value of the financial instruments.

Financial Report 2010