financial report april 2016 - louisville msd · · 2017-02-23financial report april 2016....
TRANSCRIPT

msdSafe, clean waterways
FINANCIAL REPORT APRIL 2016
METROPOLITAN SEWER DISTRICT
MONTHLY FINANCIAL REPORT APRIL 2016
Table of Contents Performance Metrics: ...................................................................................................................................... 1 Financial Statements:
Financial Overview ..................................................................................................................................... 2-3 Statement of Revenue, Expense & Change in Net Position ........................................................................... 4 Statement of Net Position .............................................................................................................................. 5
Operating Expenses: Operating Budget Performance YTD............................................................................................................. 6 Monthly Operating Expenditures ................................................................................................................... 7 Summary of MSD Operating Expenses ......................................................................................................... 8 Detail of MSD Operating Expenses ........................................................................................................ 9 - 10 MSD Staffing ............................................................................................................................................... 11 MSD Overtime Analysis .............................................................................................................................. 12
Capital Spending:
MSD Bid Variance ....................................................................................................................................... 13 MSD Capital Budget Performance .............................................................................................................. 14 MSD Monthly Capital Spending by Type ................................................................................................... 15 MSD Annual Capital Spending by Type ..................................................................................................... 16 MSD Maple Street Project Expense Summary ........................................................................................... 17
Customers:
MSD’s Operating Revenue .......................................................................................................................... 18 Wastewater Customer Count ....................................................................................................................... 19 New Customer Count (Data unavailable due to new system implementation) ........................................................... 20
Capital Markets: Market Rates ......................................................................................................................................... 21 - 22 Kentucky Municipal Market Update ............................................................................................................ 23 MSD Investment by Category ...................................................................................................................... 24 Muni Bond Investments ............................................................................................................................... 25 MSD Commercial Paper .............................................................................................................................. 26 MSD Current Investment Model .................................................................................................................. 27 Mark to Market Valuation of SWAPS ......................................................................................................... 28
Performance Metrics Details: Operating Budget Expenditures ................................................................................................................... 29 Capital Expenditures .................................................................................................................................... 30 Regulatory .................................................................................................................................................... 31 Safety ........................................................................................................................................................... 32 Customer Service ......................................................................................................................................... 33
Miscellaneous
Monthly P-Card Spending ........................................................................................................................... 34 Top 10 Goods & Services Purchasing Contracts ......................................................................................... 35 MBE/WBE Expenditure Report ................................................................................................................... 36 Construction Change Order Variance Report .............................................................................................. 37 Board Approvals for Operating and Capital Expenditures .......................................................................... 38 Board Approvals for Operating and Capital Expenditures – FY Comparison ............................................. 39 Board Approvals for Operating and Capital Expenditures – Monthly Approvals .................................. 40-41

FY 2016 MSD Performance Metrics
Data Supplied by: Saundra GibsonMay 18, 2016
July August September October November December January February March April May June
FY15 YTD Performance Goal 80.4% 84.7% 86.3% 85.9% 87.3% 90.7% 89.2% 90.1% 90.3% 91.2% 92.0% 93.6%
FY16 YTD Performance Goal 72.5% 81.8% 95.5% 94.1% 93.3% 99.5% 98.8% 96.9% 98.8% 98.3%
78.0%
83.0%
88.0%
93.0%
98.0%
103.0%
108.0%
% of Goal Target
95.1 - 100%
Operational Expense
July August September October November December January February March April May June
FY15 YTD Performance Goal 64.9% 117.0% 64.5% 78.7% 80.4% 84.6% 82.0% 74.7% 76.2% 80.2% 83.8% 99.5%
FY16 YTD Performance Goal 37.9% 71.3% 85.5% 90.7% 82.3% 87.1% 85.8% 91.1% 90.5% 101.2%
60.0%
85.0%
110.0% % of Goal
Target 80.0% - 89.9%
Capital Expense FY16 $187,476,329
FY16 $116,021,156
July August September October November December January February March April May June
FY15 YTD Performance Goal 100.0% 97.1% 98.0% 98.5% 97.6% 98.0% 98.3% 97.7% 95.1% 95.0% 95.4% 95.2%
FY16 YTD Performance Goal 94.2% 96.3% 95.8% 94.1% 94.7% 94.6% 94.5% 94.3% 94.4% 93.8%
85.0%
91.0%
97.0%
103.0%
% of Goal Target
92.1% - 94.9%
Regulatory Violation Free Months
July August September October November December January February March April May June
FY15 YTD Performance Goal 81.0% 56.0% 53.0% 70.0% 86.0% 87.0% 84.0% 83.0% 85.0% 95.0% 118.0% 114.0%
FY16 YTD Performance Goal 91.0% 102.0% 102.0% 103.0% 101.0% 94.0% 93.0% 88.0% 89.0% 86.0%
67.0%
80.5%
94.0%
107.5%
121.0%
% of Goals Target
90.1% - 100%
Safety Lost Time/Prevent Acc /OSHA
July August September October November December January February March April May June
FY16 YTD Performance Goal 92.0% 94.1% 95.1% 95.7% 95.7% 95.7% 95.5% 95.8% 95.6% 95.5%
75.0%
82.8%
90.6%
98.4%
% of Goals Target
90.0% - 93.6%
Customer Relations
Customer Service
1

This page left blank intentionally.

MSD FINANCIAL OVERVIEW NET INCOME ANALYSIS
April 2016
NET INCOME:
Net Income YTD YTD Variance % FYTD 2016 FY 2016 %(thousands) FY 2016 FY 2015 Change Budget Budget Var
Net Operating Income 80,716 78,310 2,405 3.07% 76,453 4,263 5.58%Investment Income 13,762 14,602 (839) (5.75%) 15,750 (1,988) (12.62%)Interest Expense (61,848) (60,788) (1,060) (1.74%) (65,667) 3,819 5.82%Other Non-operating - 831 (831) (100.00%) - - Net Income before Swaps 32,630 32,955 (325) (0.99%) 26,536 6,094 22.97%Change in Fair Value/Swap (4,539) (15,039) 10,501 69.82% (4,539) Total Net Income 28,092$ 17,916$ 10,176$ 56.80% 26,536$ 1,556$ 5.86%
• Net Operating Income for FY 2016 is $80.7 million compared to $78.3 million for the same period last year, an increase of $2.4 million or 3.1% and is $4.3 million or 5.6% more than budget for this period.
• Investment Income for FY 2016 of $13.8 million is $0.8 million or 5.8% less than the same period last year. This decrease is primarily due to an un-realized market value gain of $0.6 million on municipal securities in FY 2016 versus an un-realized gain of $1.4 million in fiscal year 2015. FYTD investment income is $2.0 million or 12.6% less than budget.
• Interest Expense for FY 2016 is $1.1 million or 1.7% more than the same period last year. FYTD
interest expense is $3.8 million or 5.8% less than budget which is partially due to the refinance of the 2006A Revenue Bonds and the amortization of the 2015 BAN premium.
• Net Income before Swaps totaled $32.6 million compared to $33.0 million for the same period last year, a decrease of $0.3 million or 1.0% and is $6.1 million or 23.0% more than budget for this period.
• Total Net Income/(loss) including MTM change on swaps totaled $28.1 million, $10.2 million more
than the amount for the same period last year, and is $1.6 million or 5.9% more than budget for this period.
Submitted by: Chad Collier May 17, 2016
2

MSD FINANCIAL OVERVIEW
REVENUE & EXPENSE ANALYSIS April 2016
REVENUES: Revenue YTD YTD Variance % FYTD 2016 FY 2016 %(thousands) FY 2016 FY 2015 Change Budget Budget Var
Wastewater 152,610 144,871 7,738 5.34% 149,992 2,618 1.75%Stormwater 45,453 42,841 2,613 6.10% 45,867 (414) (0.90%)Other 3,783 3,968 (185) (4.67%) 4,052 (269) (6.64%)Total Operating Revenue 201,846$ 191,681$ 10,166$ 5.30% 199,911$ 1,935$ 0.97%
• Total Operating Revenue for FY 2016 was $201.8 million compared to $191.7 million for the same
period last year, an increase of $10.2 million or 5.3% and is $1.9 million or 1.0% more than budgeted revenues.
• Wastewater Service Charges totaled $152.6 million for the year. This is an increase of $7.7 million or
5.3% from last year and $2.6 million or 1.8% more than budget.
• Stormwater service charges were $45.5 million for the year, an increase of $2.6 million or 6.1% from last year and $0.4 million or 0.9% less than budget.
• Other income was $0.2 million or 4.7% less than the amount recorded one year ago and is $0.3 or
6.6% less than budget.
OPERATING EXPENSES: Expenses YTD YTD Variance % FYTD 2016 FY 2016 %(thousands) FY 2016 FY 2015 Change Budget Budget Var
Service & Admin Costs 69,897 60,285 9,612 15.94% 70,125 (228) (0.33%)Depreciation 51,234 53,086 (1,852) (3.49%) 53,333 (2,099) (3.94%)Total Operating Expenses 121,131$ 113,370$ 7,761 6.85% 123,458$ (2,328)$ (1.89%)
• Service & Administrative Costs of $69.9 million for FY 2016 is $9.6 million or 15.9% more than the
same period last year and $0.2 million or 0.3% less than FYTD budget.
• Total Operating Expense for FY 2016 was $121.1 million which is 6.9% or $7.8 million more than the same period last year and 1.9% or $2.3 million less than FYTD budget.
Submitted by: Chad Collier May 17, 2016
3

Prepared by: Christina Corley05/10/2016
STATEMENT OF CHANGES IN NET POSITION, APRIL 30, 2016YTD YTD
APRIL 2016 APRIL 2015 VARIANCE % APRIL 2016 APRIL 2015 VARIANCE % Sewer Charges
8,562,384.81 9,256,787.46 (694,402.65) -7.50% Residential 84,108,518.10 80,309,121.30 3,799,396.80 4.73%3,742,788.67 3,841,772.00 (98,983.33) -2.58% Commercial 48,702,327.11 52,595,116.46 (3,892,789.35) -7.40%1,671,695.25 1,646,370.48 25,324.77 1.54% Industrial 16,438,922.27 14,463,893.93 1,975,028.34 13.65%
328,300.65 528,793.51 (200,492.86) -37.92% Other 7,035,847.43 2,818,563.76 4,217,283.67 149.63%(160,372.20) (549,992.56) 389,620.36 -70.84% Free Sewer Charges (3,675,804.80) (5,315,356.94) 1,639,552.14 -30.85%
14,144,797.18 14,723,730.89 (578,933.71) -3.93% Total Sewer Charges 152,609,810.11 144,871,338.51 7,738,471.60 5.34%
4,516,723.37 4,786,843.00 (270,119.63) -5.64% Drainage Charges 45,453,468.88 42,840,844.66 2,612,624.22 6.10%
18,661,520.55 19,510,573.89 (849,053.34) -4.35% Total Service Charges 198,063,278.99 187,712,183.17 10,351,095.82 5.51%
598,789.14 257,781.12 341,008.02 132.29% Other Operating Income 3,783,100.32 3,968,379.31 (185,278.99) -4.67%
19,260,309.69 19,768,355.01 (508,045.32) -2.57% Total Operating Revenue 201,846,379.31 191,680,562.48 10,165,816.83 5.30%
Operating Expenses3,197,669.90 3,181,072.38 16,597.52 0.52% Salaries & Wages 33,048,355.19 31,730,034.90 1,318,320.29 4.15%1,460,538.68 1,464,883.24 (4,344.56) -0.30% Labor Related Overhead 13,309,039.08 13,347,841.56 (38,802.48) -0.29%1,471,915.65 1,339,772.72 132,142.93 9.86% Utilities 15,527,823.33 10,776,437.61 4,751,385.72 44.09%
652,353.47 907,380.76 (255,027.29) -28.11% Materials & Supplies 7,325,705.04 7,074,130.70 251,574.34 3.56%1,718,898.60 2,073,034.92 (354,136.32) -17.08% Contractual Services 18,806,888.41 15,618,147.93 3,188,740.48 20.42%
296,955.05 266,423.74 30,531.31 11.46% Chemicals 3,349,696.33 2,971,426.38 378,269.95 12.73%74,227.77 119,292.17 (45,064.40) -37.78% Fuel 1,128,781.83 1,240,504.76 (111,722.93) -9.01%
157,413.04 113,243.25 44,169.79 39.00% Insurance Premiums & Claims 1,432,098.19 1,241,232.66 190,865.53 15.38%771,574.19 (37,489.58) 809,063.77 -2158.10% Bad Debt 2,146,794.71 1,147,290.63 999,504.08 87.12%
39,359.50 159,204.76 (119,845.26) -75.28% Other Operating Expense 829,450.93 707,567.00 121,883.93 17.23%0.00 0.00 0.00 Mapping/Insurance Recovery (1,018,097.00) (465,137.00) (552,960.00)
(2,636,924.94) (1,842,544.90) (794,380.04) 43.11% Capitalized Overhead (25,989,851.14) (25,104,959.99) (884,891.15) 3.52%- - - Capital Expenses (over)/under applied - - -
7,203,980.91 7,744,273.46 (540,292.55) -6.98% Total Service and Administrative Costs 69,896,684.90 60,284,517.14 9,612,167.76 15.94%
4,978,367.00 5,069,818.68 (91,451.68) -1.80% Depreciation 50,163,043.08 51,993,802.05 (1,830,758.97) -3.52%104,697.12 108,756.15 (4,059.03) -3.73% Amortization 1,071,011.20 1,091,884.50 (20,873.30) -1.91%
5,083,064.12 5,178,574.83 (95,510.71) -1.84% Total Depreciation/Amortization 51,234,054.28 53,085,686.55 (1,851,632.27) -3.49%
12,287,045.03 12,922,848.29 (635,803.26) -4.92% Total Operating Expenses 121,130,739.18 113,370,203.69 7,760,535.49 6.85%
6,973,264.66 6,845,506.72 127,757.94 1.87% Net Operating Income 80,715,640.13 78,310,358.79 2,405,281.34 3.07%
Non-Operating Revenue (Expenses)- 0.00 0.00 Gain/Loss Disposal of Assets - 0.00 0.00
1,414,648.74 286,811.54 1,127,837.20 393.23% Investment Income 13,762,234.00 14,601,559.11 (839,325.11) -5.75%(6,144,618.80) (5,890,503.73) (254,115.07) 4.31% Interest Expense (61,847,665.02) (60,787,873.74) (1,059,791.28) 1.74%
(4,729,970.06) (5,603,692.19) 873,722.13 -15.59% Total Non-Operating Revenue (Expenses) (48,085,431.02) (46,186,314.63) (1,899,116.39) 4.11%
- 831,125.00 (831,125.00) Contributions - 831,125.00 (831,125.00) 2,243,294.60 2,072,939.53 170,355.07 8.22% Change in Net Position before change in Swaps 32,630,209.11 32,955,169.16 (324,960.05) -0.99%
5,330,761.32 3,091,177.06 2,239,584.26 72.45% Change in Fair Value of Swaps (4,538,603.35) (15,039,399.29) 10,500,795.94 -69.82%7,574,055.92 5,164,116.59 2,409,939.33 46.67% Change in Net Position after change in Swaps 28,091,605.76 17,915,769.87 10,175,835.89 56.80%
4

Prepared by: Christina Corley5/10/2016
STATEMENT OF NET POSITION, APRIL 30, 2016Reporting period Reporting period
APRIL 2016 JUNE 2015 VARIANCE Current Assets Unrestricted Cash & Cash Equivalents 124,214,007.07 63,113,411.57 61,100,595.50 96.81% Sewer & Drainage Receivable 20,397,242.63 19,858,843.32 538,399.31 2.71% Assessment Warrants Receivable 737,287.02 1,844,417.79 (1,107,130.77) -60.03% Miscellaneous Receivables 6,724,899.27 2,083,886.28 4,641,012.99 222.71% Inventories 4,073,232.10 3,980,739.16 92,492.94 2.32% Prepaid Expenses 700,850.97 1,687,472.36 (986,621.39) -58.47% Restricted Funds 202,035,650.60 155,121,441.85 46,914,208.75 30.24% Accrued Interest Receivable 1,193,227.98 1,193,227.98 - - Total Current Assets 360,076,397.64 248,883,440.31 111,192,957.33 44.68%
Non-Current Assets Utility Plant in Service 2,846,635,105.61 2,777,788,488.76 68,846,616.85 2.48% Accumulated Depreciation (1,058,720,961.03) (1,008,503,475.01) (50,217,486.02) 4.98% Construction in Progress 709,303,428.72 623,181,353.56 86,122,075.16 13.82% Net Fixed Assets 2,497,217,573.30 2,392,466,367.31 104,751,205.99 4.38%
Non-Current Receivables 29,947,618.98 30,806,603.67 (858,984.69) -2.79%
Total Assets 2,887,241,589.92 2,672,156,411.29 215,085,178.63 8.05%
Total Deferred Outflow of Resources 14,772,902.07 20,406,268.68 (5,633,366.61) -27.61%
Total Assets & Deferred Outflow of Resources 2,902,014,491.99 2,692,562,679.97 209,451,812.02 7.78%
Current Liabilities Miscellaneous Accounts Payable 7,371,937.35 9,613,078.46 (2,241,141.11) -23.31% Accounts Payable - Construction 2,818,630.51 21,714,273.56 (18,895,643.05) -87.02% Contract Retainage 13,366,201.81 8,892,994.91 4,473,206.90 50.30% Accrued Interest Payable 44,070,810.87 13,035,917.18 31,034,893.69 238.07% Current Maturities of Bonds Payable 29,702,500.00 29,415,000.00 287,500.00 0.98% Bond Anticipation Notes 228,460,071.79 228,507,615.47 (47,543.68) -0.02% Deposits Payable 2,367,085.87 1,639,499.14 727,586.73 44.38% Accrued Salaries & Wages 948,255.23 1,443,159.77 (494,904.54) -34.29% Accrued Workers' Comp Insurance 1,755,238.06 1,755,238.06 - - Employee Comp Absences Payable 2,350,313.28 2,124,417.12 225,896.16 10.63% Total Current Liabilities 333,211,044.77 318,141,193.67 15,069,851.10 4.74%
Non-Current Liabilities Long-Term Debt Payable 1,754,570,000.00 1,583,390,000.00 171,180,000.00 10.81% Other Long-Term Liability 122,618,792.18 113,729,345.59 8,889,446.59 7.82% Total Non-Current Liabilities 1,877,188,792.18 1,697,119,345.59 180,069,446.59 10.61%
Total Liabilities 2,210,399,836.95 2,015,260,539.26 195,139,297.69 9.68%
Total Deferred Inflow of Resources 96,026,983.77 92,232,693.22 3,794,290.55 4.11%
Total Liabilities & Deferred Inflow of Resources 2,306,426,820.72 2,107,493,232.48 198,933,588.24 9.44%
Net Position 595,587,671.27 585,069,447.49 10,518,223.78 1.80%
5

Submitted by: Patrick Meador5/18/2016
MSD Operating Budget Performanceas of 4/30/16
FY 2016
$103,945 $107,607
$111,795
$117,433 $115,281 $115,975 $116,021
$100,353
$106,783 $106,587 $108,535 $107,650 $106,174
$95,887
$81,861 $84,917 $87,058 $86,612 $86,692 $85,389
5,750
25,750
45,750
65,750
85,750
105,750
125,750
YTD FY 2010 YTD FY 2011 YTD FY 2012 YTD FY 2013 YTD FY 2014 YTD FY 2015 YTD FY 2016
Dol
lars
(th
ousa
nds)
Full Year Budget Full Year Actual YTD Current Month
6

Submitted by:Patrick Meador
5/18/2016
( February Average & Actual results lower due to short period's impact on Salary & Labor Related Overhead expenses. ) FY16 February decrease due to reclasses of $6.5mil for Bad Debt and $2.0mil for Capital expenses from Operating, and also recording insurance reimbursements of $1.750mil for flooding at MFWTP.
July August September October November December January February March April May June FY09 Monthly Expense 7,159,223 7,587,494 7,873,654 8,275,113 7,195,068 8,635,986 7,491,173 6,690,664 7,971,547 8,437,125 7,781,021 9,048,130 FY10 Monthly Expense 7,386,999 8,148,639 8,486,419 9,094,573 8,283,698 6,948,622 8,476,898 7,519,560 8,540,456 8,974,921 8,330,559 10,162,054 FY11 Monthly Expense 7,587,390 9,001,815 8,850,109 7,851,341 9,040,318 8,747,213 8,932,186 7,661,459 9,567,360 7,677,838 10,239,672 11,625,964 FY12 Monthly Expense 6,938,802 9,262,950 8,701,018 8,576,673 9,335,042 9,121,497 9,575,862 7,561,275 9,333,951 8,651,037 9,449,379 10,079,761 FY13 Monthly Expense 7,542,927 8,233,728 9,177,573 8,774,161 8,039,016 9,326,840 9,527,659 7,129,486 9,312,560 9,163,157 9,495,244 12,317,284 FY14 Monthly Expense 8,456,854 7,639,492 9,284,868 9,203,567 7,974,333 9,041,529 8,743,617 8,040,331 9,381,557 8,925,528 7,754,558 13,203,938 FY15 Monthly Expense 6,671,498 8,194,713 8,687,684 8,082,296 8,684,686 10,012,260 8,019,812 8,155,263 9,371,511 9,509,755 9,830,123 10,954,297 Seven Year Average 7,391,956 8,295,547 8,723,046 8,551,104 8,364,594 8,833,421 8,681,030 7,536,862 9,068,420 8,762,766 8,982,937 11,027,918 FY16 Monthly Expense 8,282,835 10,657,815 10,902,076 8,137,821 11,341,478 8,945,330 13,079,686 3,966,801 10,731,838 9,840,856
$3,000,000
$5,000,000
$7,000,000
$9,000,000
$11,000,000
$13,000,000
Dol
lars
MSD FY 2016 Monthly Operating Performance Actual Results versus Seven Year Average
As of 4/30/16
7

Submitted by: Patrick Meador5/18/2016
Operating Expenses FY16 Budget FY16 YTD Actual FY15 YTD ActualVariance Actual
to BudgetVariance Actual
to Prior Year
Salaries & Wages 32,726,719 33,048,299 31,728,405 321,580 1,319,894Labor Related Overhead 14,255,447 13,309,039 13,348,753 (946,408) (39,714)Utilities 13,562,678 15,527,782 10,767,563 1,965,104 4,760,219Materials & Supplies 6,166,029 7,147,595 6,082,007 981,566 1,065,588Contractual Services 22,041,459 19,536,549 15,916,457 (2,504,910) 3,620,092Chemicals 3,474,469 3,349,686 2,970,564 (124,783) 379,122Fuel 1,371,835 937,213 1,227,401 (434,622) (290,188)Insurance Premiums & Claims 1,116,473 1,432,098 1,242,815 315,625 189,283Bad Debt 1,666,660 2,146,795 1,147,291 480,135 999,504Other Operating Expense 1,200,649 802,979 684,595 (397,670) 118,384System Roll-up Variance 0 (1,351,499) 272,861 (1,351,499) (1,624,360)
TOTAL 97,582,418 95,886,535 85,388,712 (1,695,882) 10,497,824
DIVISIONS FY16 Budget FY16 YTD Actual FY15 YTD ActualVariance Actual
to BudgetVariance Actual
to Prior Year
Engineering 7,102,307 6,420,931 6,466,320 (681,376) (45,389)Executive 3,724,016 2,169,016 2,249,588 (1,555,000) (80,572)Finance 9,332,855 9,221,788 7,891,375 (111,067) 1,330,413Human Resources 5,452,264 5,379,063 5,265,891 (73,201) 113,172Information Technology 6,402,024 6,992,332 4,746,843 590,308 2,245,489Legal Services 1,736,949 1,279,206 1,208,120 (457,743) 71,086OPERATIONS GROUP 63,832,003 65,775,699 57,287,714 1,943,696 8,487,985System Roll-up Variance 0 (1,351,499) 272,861 (1,351,499) (1,624,360)
TOTAL 97,582,418 95,886,535 85,388,712 (1,695,882) 10,497,824
OPERATIONS GROUP FY16 Budget FY16 YTD Actual FY15 YTD ActualVariance Actual
to BudgetVariance Actual
to Prior Year
COLLECTIONS - (Metro) 15,806,413 13,668,935 12,913,946 (2,137,478) 754,989 DRAINAGE & FP - (I&FP) 16,391,459 15,192,147 9,905,595 (1,199,312) 5,286,552 PERFORMANCE 1,225,760 792,655 1,018,129 (433,105) (225,474) SUPPORT - (Phy Assets) 1,801,150 5,950,644 6,009,925 4,149,494 (59,281) TREATMENT - (MFWTP) 28,607,221 30,171,318 27,440,119 1,564,097 2,731,199
Operations Group Total 63,832,003 65,775,699 57,287,714 1,943,696 8,487,985
Summary of MSD Operating Expenseas of 4/30/16
FY 2016
8
Submitted by:Patrick Meador
5/18/2016
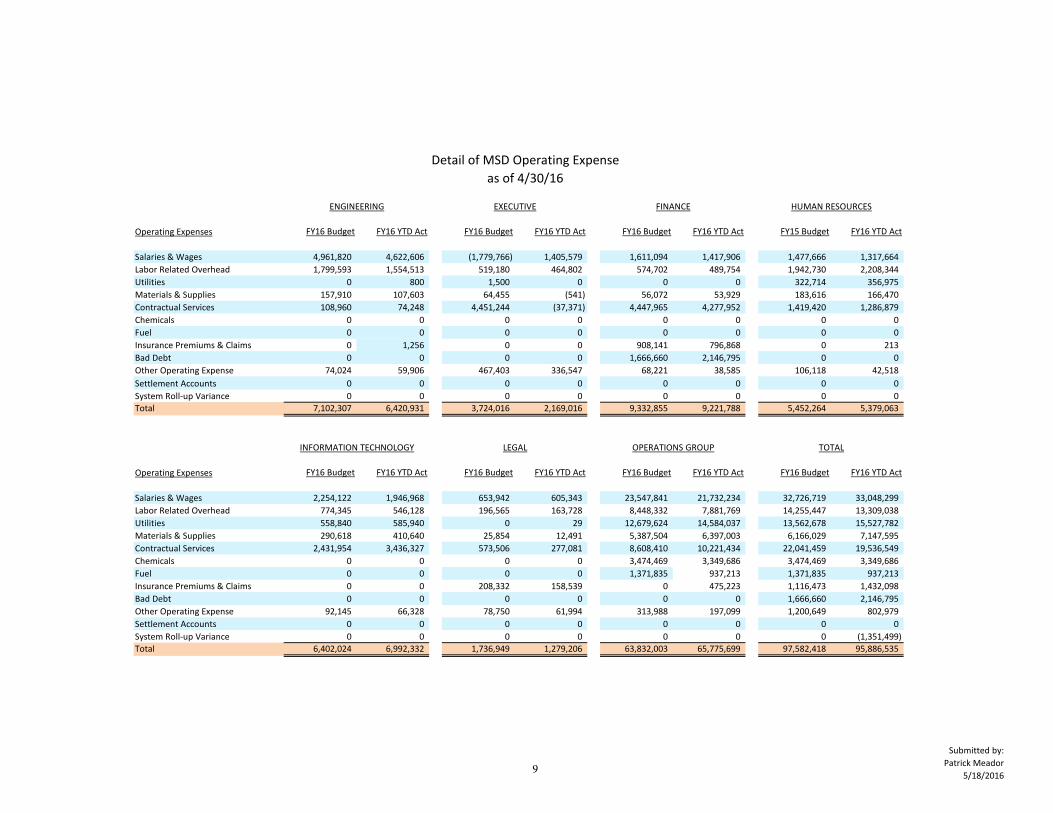
Operating Expenses FY16 Budget FY16 YTD Act FY16 Budget FY16 YTD Act FY16 Budget FY16 YTD Act FY15 Budget FY16 YTD Act
Salaries & Wages 4,961,820 4,622,606 (1,779,766) 1,405,579 1,611,094 1,417,906 1,477,666 1,317,664Labor Related Overhead 1,799,593 1,554,513 519,180 464,802 574,702 489,754 1,942,730 2,208,344Utilities 0 800 1,500 0 0 0 322,714 356,975Materials & Supplies 157,910 107,603 64,455 (541) 56,072 53,929 183,616 166,470Contractual Services 108,960 74,248 4,451,244 (37,371) 4,447,965 4,277,952 1,419,420 1,286,879Chemicals 0 0 0 0 0 0 0 0Fuel 0 0 0 0 0 0 0 0Insurance Premiums & Claims 0 1,256 0 0 908,141 796,868 0 213Bad Debt 0 0 0 0 1,666,660 2,146,795 0 0Other Operating Expense 74,024 59,906 467,403 336,547 68,221 38,585 106,118 42,518Settlement Accounts 0 0 0 0 0 0 0 0System Roll-up Variance 0 0 0 0 0 0 0 0Total 7,102,307 6,420,931 3,724,016 2,169,016 9,332,855 9,221,788 5,452,264 5,379,063
Operating Expenses FY16 Budget FY16 YTD Act FY16 Budget FY16 YTD Act FY16 Budget FY16 YTD Act FY16 Budget FY16 YTD Act
Salaries & Wages 2,254,122 1,946,968 653,942 605,343 23,547,841 21,732,234 32,726,719 33,048,299Labor Related Overhead 774,345 546,128 196,565 163,728 8,448,332 7,881,769 14,255,447 13,309,038Utilities 558,840 585,940 0 29 12,679,624 14,584,037 13,562,678 15,527,782Materials & Supplies 290,618 410,640 25,854 12,491 5,387,504 6,397,003 6,166,029 7,147,595Contractual Services 2,431,954 3,436,327 573,506 277,081 8,608,410 10,221,434 22,041,459 19,536,549Chemicals 0 0 0 0 3,474,469 3,349,686 3,474,469 3,349,686Fuel 0 0 0 0 1,371,835 937,213 1,371,835 937,213Insurance Premiums & Claims 0 0 208,332 158,539 0 475,223 1,116,473 1,432,098Bad Debt 0 0 0 0 0 0 1,666,660 2,146,795Other Operating Expense 92,145 66,328 78,750 61,994 313,988 197,099 1,200,649 802,979Settlement Accounts 0 0 0 0 0 0 0 0System Roll-up Variance 0 0 0 0 0 0 0 (1,351,499)Total 6,402,024 6,992,332 1,736,949 1,279,206 63,832,003 65,775,699 97,582,418 95,886,535
ENGINEERING
INFORMATION TECHNOLOGY OPERATIONS GROUPLEGAL TOTAL
EXECUTIVE FINANCE HUMAN RESOURCES
Detail of MSD Operating Expenseas of 4/30/16
9

Submitted by:Patrick Meador
5/18/2016
Operating Expenses FY16 Budget FY16 YTD Act FY16 Budget FY16 YTD Act FY16 Budget FY16 YTD Act
Salaries & Wages 7,871,336 7,476,120 4,545,839 3,493,293 874,660 581,102Labor Related Overhead 2,858,381 2,589,049 1,714,283 1,648,786 329,872 206,828Utilities 83,330 45,319 4,420,356 5,093,891 0 0Materials & Supplies 1,624,539 1,190,359 1,059,425 1,782,238 6,700 1,608Contractual Services 2,872,640 1,902,013 3,927,336 2,847,744 4,360 2,570Chemicals 7,100 598 658,320 306,536 0 0Fuel 8,330 606 24,000 1,592 0 0Insurance Premiums & Claims 400,000 448,372 0 11,351 0 0Bad Debt 0 0 0 0 0 0Other Operating Expense 80,757 16,498 41,900 6,716 10,168 546Settlement Accounts 0 0 0 0 0 0System Roll-up Variance 0 0 0 0 0 0Total 15,806,413 13,668,935 16,391,459 15,192,147 1,225,760 792,655
Operating Expenses FY16 Budget FY16 YTD Act FY16 Budget FY16 YTD Act FY16 Budget FY16 YTD Act
Salaries & Wages 2,707,650 2,681,214 7,548,356 7,500,504 23,547,841 21,732,234Labor Related Overhead 977,379 932,595 2,568,417 2,504,511 8,448,332 7,881,769Utilities (19,534) 89,752 8,195,472 9,355,075 12,679,624 14,584,037Materials & Supplies 727,877 482,993 1,968,963 2,939,804 5,387,504 6,397,003Contractual Services (3,355,569) 771,749 5,159,643 4,697,358 8,608,410 10,221,435Chemicals (208,334) 0 3,017,383 3,042,553 3,474,469 3,349,686Fuel 1,318,600 932,769 20,905 2,246 1,371,835 937,213Insurance Premiums & Claims (400,000) 14,500 0 1,000 0 475,223Bad Debt 0 0 0 0 0 0Other Operating Expense 53,081 45,071 128,082 128,268 313,988 197,099Settlement Accounts 0 0 0 0 0 0System Roll-up Variance 0 0 0 0 0 0Total 1,801,150 5,950,644 28,607,221 30,171,318 63,832,003 65,775,699
Detail of MSD Operating Expenseas of 4/30/16
DRAINAGE & FP
TREATMENT
PERFORMANCE MATRIX
OPERATIONS GROUP
COLLECTIONS
SUPPORT
10
Submitted by: Patrick Meador5/18/2016
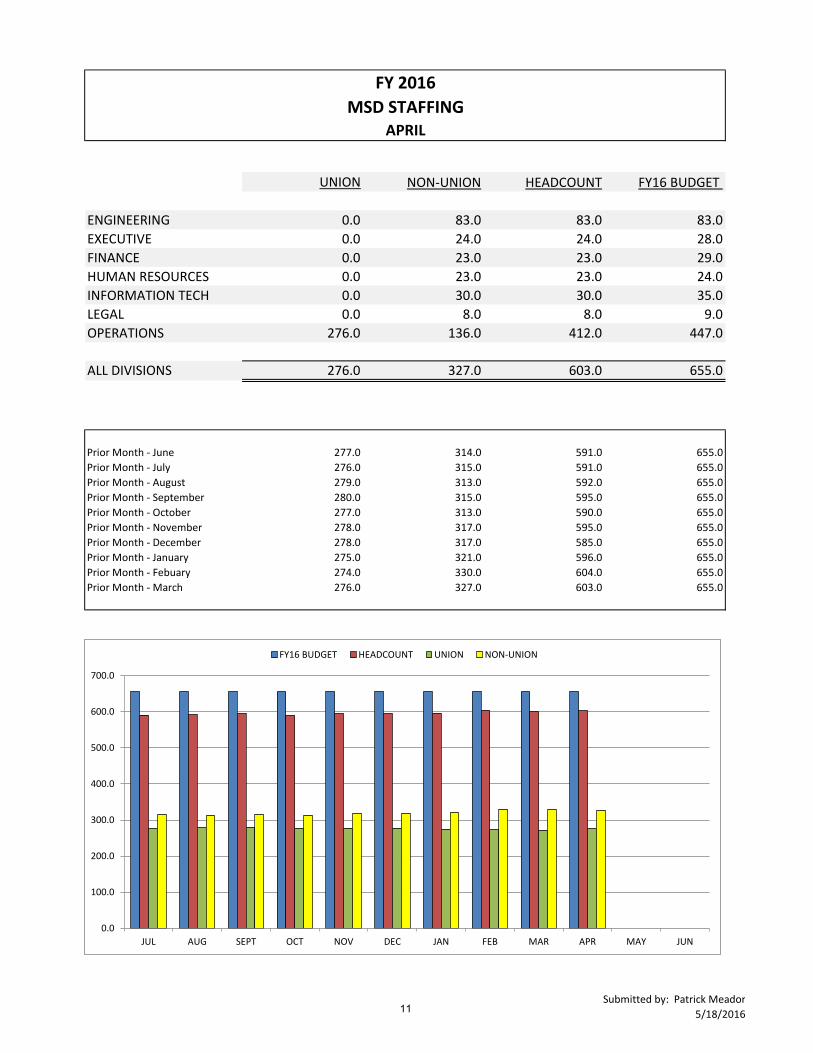
UNION NON-UNION HEADCOUNT FY16 BUDGET
ENGINEERING 0.0 83.0 83.0 83.0EXECUTIVE 0.0 24.0 24.0 28.0FINANCE 0.0 23.0 23.0 29.0HUMAN RESOURCES 0.0 23.0 23.0 24.0INFORMATION TECH 0.0 30.0 30.0 35.0LEGAL 0.0 8.0 8.0 9.0OPERATIONS 276.0 136.0 412.0 447.0
ALL DIVISIONS 276.0 327.0 603.0 655.0
Prior Month - June 277.0 314.0 591.0 655.0Prior Month - July 276.0 315.0 591.0 655.0Prior Month - August 279.0 313.0 592.0 655.0Prior Month - September 280.0 315.0 595.0 655.0Prior Month - October 277.0 313.0 590.0 655.0Prior Month - November 278.0 317.0 595.0 655.0Prior Month - December 278.0 317.0 585.0 655.0Prior Month - January 275.0 321.0 596.0 655.0Prior Month - Febuary 274.0 330.0 604.0 655.0Prior Month - March 276.0 327.0 603.0 655.0
FY 2016
APRILMSD STAFFING
0.0
100.0
200.0
300.0
400.0
500.0
600.0
700.0
JUL AUG SEPT OCT NOV DEC JAN FEB MAR APR MAY JUN
FY16 BUDGET HEADCOUNT UNION NON-UNION
11

MSD OVERTIME ANALYSISApril FY 2016
Total OT/ Total SalaryTotal Overtime % of Total Overtime Fiscal Year 2016 Apr YTD FY'16 Apr YTD FY'15 Variance
Home Office 95,273.00$ 3.46% Total Overtime 2,291,380.49$ Home Office 56,142.41$ Home Office 82,390.61$ -$26,248.20
Treatment 307,481.77$ 11.16% Total Salary 33,828,990.36$ Treatment 940,346.48$ Treatment 1,043,531.08$ -$103,184.60
Drainage and Flood Protection 1,239,764.64$ 45.00%
Overtime Percentage of Total Salary 6.77%
Drainage and Flood Protection 233,592.11$
Drainage and Flood Protection 241,672.57$
-$8,080.46
Collections 284,915.52$ 10.34% Collections 258,061.86$ Collections 226,982.50$ $31,079.36Support 706,319.37$ 25.64% Support 649,547.21$ Support 559,440.50$ $90,106.71Engineering 121,105.82$ 4.40% Engineering 153,690.42$ Engineering 102,634.60$ $51,055.82
Jul-15 Aug-15 Sep-15 Oct-15 Nov-15 Dec-15 Jan-16 Feb-16 Mar-16 Apr-16 May-16 Jun-16 YTD 2016Total Overtime 305,540.69$ 183,757.83$ 189,184.08$ 249,680.40$ 198,161.18$ 199,555.75$ 305,110.38$ 185,118.56$ 203,760.75$ 271,510.87$ -$ -$ 2,291,380.49$ Total Salary 3,796,968.46$ 2,953,842.62$ 3,436,345.21$ 3,876,174.87$ 3,024,456.49$ 3,894,766.06$ 3,075,491.90$ 2,974,342.67$ 3,024,914.13$ 3,771,687.95$ -$ -$ 33,828,990.36$ Overtime % of Total Salary 8.05% 6.22% 5.51% 6.44% 6.55% 5.12% 9.92% 6.22% 6.74% 7.20% 6.77%
Prepared by Chris Duzyk 5/18/2016
Total Overtime vs. Total Salary for Fiscal Year 2016
MSD's Overtime Comparision YTDMSD's Total Overtime for Fiscal Year 2015
$-
$20,000.00
$40,000.00
$60,000.00
$80,000.00
$100,000.00
$120,000.00
$140,000.00
Jul-14 Aug-14 Sep-14 Oct-14 Nov-14 Dec-14 Jan-15 Feb-15 Mar-15 Apr-15 May-15 Jun-15
MSD's Overtime For Fiscal Year 2015 Home Office Drainage and FP Treatment Collections Support Engineering
$-
$20,000.00
$40,000.00
$60,000.00
$80,000.00
$100,000.00
$120,000.00
$140,000.00
Jul-15 Aug-15 Sep-15 Oct-15 Nov-15 Dec-15 Jan-16 Feb-16 Mar-16 Apr-16 May-16 Jun-16
MSD's Overtime Apr YTD FY 2016 Home Office Drainage and FP Treatment Collections Support Engineering
$-
$20,000.00
$40,000.00
$60,000.00
$80,000.00
$100,000.00
$120,000.00
$140,000.00
Jul-14 Aug-14 Sep-14 Oct-14 Nov-14 Dec-14 Jan-15 Feb-15 Mar-15 Apr-15 May-15 Jun-15
MSD's Overtime Apr YTD FY 2015 Home Office Drainage and FP Treatment Collections Support Engineering
12

MSD's Construction Variance - FY14 Through Current FY Comparison
Created By: Kevin Schmidt4/2/2016
FY 14 Over/Under Total Variance
FY 15 Over/Under Total Variance
FY 16 Over/Under Total Variance
Mth FY14 Mth FY15 Mth FY16 # OVER 34 29 27Jul-13 16,911.70$ Jul-14 11,678,564.78$ Jul-15 (513,767.62)$ $ OVER 2,854,215.75$ 22,692,303.47$ 5,437,660.54$
Aug-13 (633,443.13)$ Aug-14 2,863,671.85$ Aug-15 (97,504.62)$ % 11.51% 25.09% 16.73%Sep-13 964,597.42$ Sep-14 508,085.84$ Sep-15 336,973.00$
Oct-13 (908,835.26)$ Oct-14 (161,671.54)$ Oct-15 26,903.25$
Nov-13 (499,377.19)$ Nov-14 263,670.50$ Nov-15 1,604,767.26$ # UNDER 32 25 38Dec-13 233,888.59$ Dec-14 4,012,318.78$ Dec-15 (968,290.12)$ $ UNDER (18,122,143.55)$ (9,728,358.50)$ (9,002,525.28)$ Jan-14 69,944.53$ Jan-15 (1,181,411.75)$ Jan-16 (80,020.00)$ % -23.99% -11.05% -19.20%Feb-14 178,060.27$ Feb-15 (5,202,495.47)$ Feb-16 (5,480.00)$
Mar-14 61,317.94$ Mar-15 (14,159.87)$ Mar-16 (60,980.60)$ (15,267,927.80)$ 12,963,944.97$ (3,564,864.74)$ Apr-14 (13,272,322.51)$ Apr-15 (614,236.42)$ Apr-16 (3,807,465.29)$
May-14 (1,491,870.16)$ May-15 (40,350.02)$ May-16
Jun-14 13,200.00$ Jun-15 851,958.29$ Jun-16
(15,267,927.80)$ 12,963,944.97$ (3,564,864.74)$
Total variance reflects the difference of Estimate Cost vs. Board Approval by month for Construction services.
Total YTD
TOTAL FY14 TOTAL FY15 TOTAL FY16
FY 14 Variance by Month
FY 15 Variance by Month
FY 16 Variance by Month
$(15,000,000.00)
$(10,000,000.00)
$(5,000,000.00)
$-
$5,000,000.00
$10,000,000.00
$15,000,000.00
BID
VA
RIA
NC
E
Jul-15 Aug-15 Sep-15 Oct-15 Nov-15 Dec-15 Jan-16 Feb-16 Mar-16 Apr-16 May-16 Jun-16 FY14 $16,911.70 $(633,443.13) $964,597.42 $(908,835.26) $(499,377.19) $233,888.59 $69,944.53 $178,060.27 $61,317.94 $(13,272,322.51 $(1,491,870.16) $13,200.00
FY15 $11,678,564.78 $2,863,671.85 $508,085.84 $(161,671.54) $263,670.50 $4,012,318.78 $(1,181,411.75) $(5,202,495.47) $(14,159.87) $(614,236.42) $(40,350.02) $851,958.29
FY16 $(513,767.62) $(97,504.62) $336,973.00 $26,903.25 $1,604,767.26 $(968,290.12) $(80,020.00) $(5,480.00) $(60,980.60) $(3,807,465.29)
Month to Month by Fiscal Year
13

Submitted by: Patrick Meador 5/18/2016
$135,617 $163,823 $156,194 $150,662
$108,670 $117,859
$187,476
$116,179
$138,311
$102,508 $90,283 $85,978 $117,299 $129,380
$91,850 $103,935
$78,096 $63,727 $63,368 $70,841
0
50,000
100,000
150,000
200,000
FY 2010 FY 2011 FY 2012 FY 2013 FY 2014 FY 2015 FY 2016
Dol
lars
(th
ousa
nds)
FY 2016 MSD Capital Budget Performance
YTD as of 4/30/16
Full Year Budget Full Year Actual YTD Current Month
Planning/Design 8.36%
Easements -0.20%
Construction 89.80%
Equipment 1.74%
Labor 0.00%
Other 0.30%
MSD Capital Expenditures by Category Total Expenditures to Date:
$129,380,285
14

Submitted by: Patrick Meador5/18/2016
2016 July August September October November December January February March April May June Total Percentage
IOAP 2,920,591 9,097,780 10,542,172 14,707,509 8,883,555 11,573,056 11,109,444 16,254,456 5,606,576 16,050,916 0 0 106,746,055 89%Sanitary 3,144,341 1,453,932 2,734,335 6,039,947 4,413,240 5,137,157 4,928,331 3,960,709 6,923,941 5,712,091 0 0 44,448,024 37%Drainage 76,939 381,782 244,304 514,394 303,461 329,701 389,911 462,489 334,401 280,446 0 0 3,317,828 3%Floodwall 79,886 154,785 2,026 219 223,877 114,519 97,463 35,573 53,119 96,763 0 0 858,229 1%
Total 6,221,756 11,088,279 13,522,838 21,262,069 13,824,133 17,154,433 16,525,148 20,713,227 12,918,037 22,140,216 0 0 155,370,136 129%
2015 July August September October November December January February March April May June Total Percentage
IOAP 6,096,532 6,975,721 1,186,858 11,130,272 6,371,146 9,918,927 4,608,741 7,536,045 6,076,334 9,090,729 9,164,068 8,673,769 86,829,140 72%Sanitary 529,795 2,475,179 617,925 2,987,929 1,891,324 2,054,147 5,084,817 3,523,559 2,722,138 1,872,921 3,506,151 2,478,717 29,744,603 25%Drainage 960,363 725,992 43,287 45,925 45,394 183,790 216,972 132,206 86,426 166,493 387,117 467,906 3,461,871 3%Floodwall 38,722 4,937 (7,193) (4,308) (1,345) 19,536 2,545 (248) (12) 35,001 88,640 86,814 263,089 0%
Total 7,625,412 10,181,829 1,840,877 14,159,818 8,306,519 12,176,400 9,913,075 11,191,562 8,884,886 11,165,144 13,145,976 11,707,206 120,298,703 100%(Negative September / October spending caused by reversal of FY14 Capital accruals.)
2014 July August September October November December January February March April May June Total Percentage
IOAP 9,806,841 (90,026) 4,852,546 7,439,649 3,927,151 6,267,677 8,255,257 5,075,129 5,238,275 4,214,331 7,915,747 11,070,744 73,973,321 62%Sanitary 2,136,563 1,286,277 1,872,499 5,342,248 3,952,920 2,946,309 3,544,634 3,939,437 2,770,161 2,924,565 3,316,175 4,733,260 38,765,047 32%Drainage 194,007 (237,925) 2,153,213 807,252 506,540 194,867 58,480 175,636 249,928 461,670 209,747 1,455,555 6,228,970 5%Floodwall 55,682 27,550 43,579 71,149 13,126 158,398 33,108 (403) 82,838 100,153 8,834 80,523 674,536 1%
Total 12,193,092 985,876 8,921,837 13,660,298 8,399,737 9,567,252 11,891,478 9,189,799 8,341,201 7,700,719 11,450,503 17,340,083 119,641,875 100%
IOAP: Integrated Overflow Abatement Plan
As of 4/30/16(Includes Capitalized Overhead)
MSD MONTHLY CAPITAL SPENDING BY TYPE
0
2,000,000
4,000,000
6,000,000
8,000,000
10,000,000
12,000,000
14,000,000
16,000,000
18,000,000
July August Sept October November December January February March April May June
IOAP Sanitary Drainage Floodwall
15

Submitted by: Patrick Meador5/18/2016
2016 July August September October November December January February March April May June Total Percentage
IOAP 2,920,591 12,018,371 22,560,543 37,268,053 46,151,607 57,724,663 68,834,107 85,088,564 90,695,139 106,746,055 0 0 106,746,055 89%Sanitary 3,144,341 4,598,273 7,332,608 13,372,555 17,785,795 22,922,952 27,851,283 31,811,992 38,735,933 44,448,024 0 0 44,448,024 37%Drainage 76,939 458,721 703,025 1,217,419 1,520,880 1,850,581 2,240,492 2,702,981 3,037,382 3,317,828 0 0 3,317,828 3%Floodwall 79,886 234,671 236,697 236,916 460,793 575,311 672,774 708,347 761,466 858,229 0 0 858,229 1%
Total 6,221,756 17,310,035 30,832,873 52,094,942 65,919,075 83,073,508 99,598,656 120,311,883 133,229,920 155,370,136 0 0 155,370,136 129%
2015 July August September October November December January February March April May June Total Percentage
IOAP 6,096,532 13,072,253 14,259,111 25,389,383 31,760,529 41,679,456 46,288,197 53,824,241 59,900,575 68,991,304 78,155,371 86,829,140 86,829,140 72%Sanitary 529,795 3,004,974 3,622,899 6,610,828 8,502,152 10,556,298 15,641,116 19,164,675 21,886,813 23,759,734 27,265,886 29,744,603 29,744,603 25%Drainage 960,363 1,686,355 1,729,642 1,775,567 1,820,961 2,004,751 2,221,723 2,353,929 2,440,355 2,606,848 2,993,965 3,461,871 3,461,871 3%Floodwall 38,722 43,659 36,466 32,158 30,813 50,349 52,894 52,646 52,635 87,636 176,275 263,089 263,089 0%
Total 7,625,412 17,807,241 19,648,118 33,807,936 42,114,455 54,290,855 64,203,930 75,395,492 84,280,378 95,445,522 108,591,498 120,298,703 120,298,703 100%
2014 July August September October November December January February March April May June Total Percentage
IOAP 9,806,841 9,716,815 14,569,361 22,009,010 25,936,161 32,203,838 40,459,095 45,534,224 50,772,499 54,986,830 62,902,577 73,973,321 73,973,321 62%Sanitary 2,136,563 3,422,840 5,295,339 10,637,587 14,590,507 17,536,817 21,081,450 25,020,887 27,791,048 30,715,612 34,031,787 38,765,047 38,765,047 32%Drainage 194,007 (43,918) 2,109,295 2,916,546 3,423,086 3,617,954 3,676,434 3,852,070 4,101,998 4,563,667 4,773,414 6,228,970 6,228,970 5%Floodwall 55,682 83,232 126,811 197,960 211,086 369,484 402,592 402,189 485,026 585,180 594,014 674,536 674,536 1%
Total 12,193,092 13,178,969 22,100,806 35,761,104 44,160,841 53,728,093 65,619,571 74,809,369 83,150,570 90,851,289 102,301,792 119,641,875 119,641,875 100%
IOAP: Integrated Overflow Abatement Plan
MSD ANNUAL CAPITAL SPENDING BY TYPE(Includes Capitalized Overhead)
Years 2000 through 2015
0
20,000,000
40,000,000
60,000,000
80,000,000
100,000,000
120,000,000
140,000,000
2000 2001 2002 2003 2004 2005 2006 2007 2008 2009 2010 2011 2012 2013 2014 2015
IOAP SANITARY DRAINAGE FLOODWALL
16
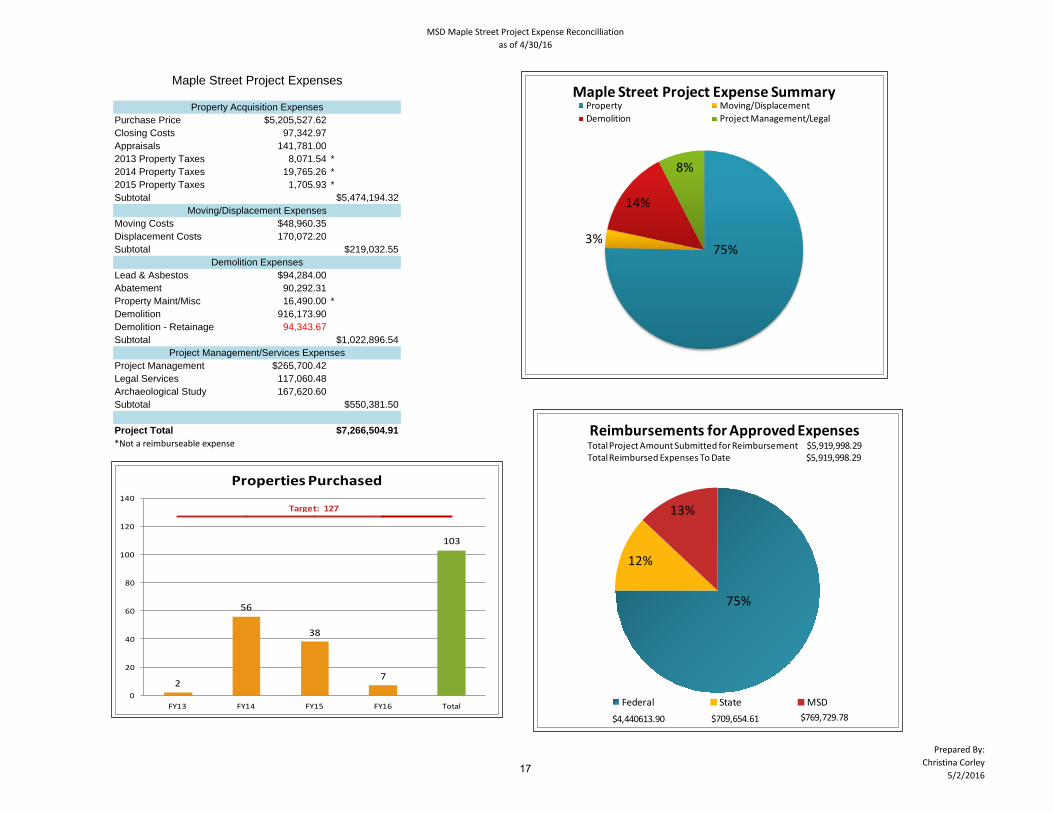
MSD Maple Street Project Expense Reconcilliation as of 4/30/16
Prepared By:Christina Corley
5/2/2016
Purchase Price $5,205,527.62Closing Costs 97,342.97Appraisals 141,781.002013 Property Taxes 8,071.54 *2014 Property Taxes 19,765.26 *2015 Property Taxes 1,705.93 *Subtotal $5,474,194.32
Moving Costs $48,960.35Displacement Costs 170,072.20Subtotal $219,032.55
Lead & Asbestos $94,284.00Abatement 90,292.31Property Maint/Misc 16,490.00 *Demolition 916,173.90Demolition - Retainage 94,343.67Subtotal $1,022,896.54
Project Management $265,700.42Legal Services 117,060.48Archaeological Study 167,620.60Subtotal $550,381.50
Project Total $7,266,504.91*Not a reimburseable expense
Maple Street Project Expenses
Property Acquisition Expenses
Demolition Expenses
Project Management/Services Expenses
Moving/Displacement Expenses
75%3%
14%
8%
Maple Street Project Expense SummaryProperty Moving/DisplacementDemolition Project Management/Legal
2
56
38
7
103
0
20
40
60
80
100
120
140
FY13 FY14 FY15 FY16 Total
Properties Purchased
Target: 127
75%
12%
13%
Reimbursements for Approved Expenses Total Project Amount Submitted for Reimbursement $5,919,998.29Total Reimbursed Expenses To Date $5,919,998.29
Federal State MSD$709,654.61 $769,729.78$4,440613.90
17

MSD's Operating RevenueFY 2016
in 000'sResidental Jul Aug Sept Oct Nov Dec Jan Feb Mar Apr May Jun YTD Totals %Sewer
Service Charge 2,507$ 2,827$ 2,871$ 3,018$ 2,620$ 2,903$ 2,452$ 2,657$ 3,266$ 2,964$ 28,086$ 27.81%Volume Charges 3,173 3,581 3,789 3,736 3,114 3,223 2,772 2,943 3,661$ 3,215 33,207 32.88%Quality Charges - - - - - - - - - - - 0.00%Meter Reading Charge - - - - - - - - - - - 0.00%Consent Decree Charge 2,100 2,370 2,404 2,523 2,191 2,420 2,042 2,223 2,734$ 2,461 23,469 23.24%Senior Citizen Discount (49) (75) (61) (77) (53) (76) (52) (65) (67)$ (78) (653) -0.65%
DrainageDrainage Fees 1,446 1,808 1,629 1,837 1,470 1,836 1,418 1,705 1,879 1,866 16,895 16.73%
9,178$ 10,511$ 10,632$ 11,037$ 9,341$ 10,306$ 8,633$ 9,463$ 11,473$ 10,429$ -$ -$ 101,003$ 100.00%CommercialSewer
Service Charge 646$ 538$ 727$ 531$ 695$ 485$ 637$ 453$ 812$ 505$ 6,028$ 8.08%Volume Charges 3,334 3,405 3,850 2,802 4,069 2,447 2,923 2,161 3,904$ 2,357 31,252 41.89%Quality Charges 140 136 88 88 76 81 62 62 86$ 91 911 1.22%Meter Reading Charge 13 16 17 13 11 5 5 4 6$ 3 92 0.12%Consent Decree Charge 1,112 1,118 1,264 942 1,353 815 993 721 1,313$ 787 10,419 13.96%
DrainageDrainage Fees 2,311 2,969 2,728 2,478 2,612 2,456 2,327 2,474 3,164 2,387 25,907 34.72%
7,557$ 8,183$ 8,674$ 6,854$ 8,817$ 6,288$ 6,946$ 5,875$ 9,285$ 6,130$ -$ -$ 74,609$ 100.00%IndustrialSewer
Service Charge 48$ 54$ 50$ 43$ 49$ 49$ 45 44$ 56$ 52$ 489$ 2.56%Volume Charges 708 859 889 675 764 675 583 783 800$ 748 7,484 39.21%Quality Charges 586 809 735 421 817 345 484 616 621$ 631 6,064 31.77%Meter Reading Charge 7 9 7 7 7 7 6 7 9$ 8 74 0.39%Consent Decree Charge 221 260 276 210 238 210 182 243 249$ 233 2,322 12.17%
DrainageDrainage Fees 312 243 271 243 273 277 225 239 305 263 2,652 13.89%
1,880$ 2,233$ 2,229$ 1,600$ 2,148$ 1,563$ 1,525$ 1,932$ 2,041$ 1,935$ -$ -$ 19,086$ 100.00%Other Charges
874$ 720$ 1,349$ 630$ 936$ 572$ 394$ 395$ 677$ 328$ 6,876$ Free ChargesFree Sewer (680)$ (464)$ (827)$ (307)$ (522)$ (156)$ (156)$ (157)$ (243)$ (160)$ (3,672)$ Free Drainage -$
14,740$ 16,163$ 17,428$ 15,257$ 16,365$ 14,003$ 13,371$ 13,090$ 17,885$ 14,145$ -$ -$ 152,449$ 77.03%4,069 5,020 4,628 4,558 4,356 4,569 3,971 4,417 5,349 4,517 - - 45,453 22.97%
18,809$ 21,183$ 22,056$ 19,815$ 20,721$ 18,573$ 17,342$ 17,508$ 23,234$ 18,662$ -$ -$ 197,902$ 100.00%
Prepared By Chris Duzyk 5/18/2016
Total Service Charges
Total Residental
Total Commercial
Total Industrial
Total SewerTotal Drainage
$(250,000.00)
$(200,000.00)
$(150,000.00)
$(100,000.00)
$(50,000.00)
$-
$50,000.00
$100,000.00
$150,000.00
$200,000.00
$250,000.00
$(5,000)
$-
$5,000
$10,000
$15,000
$20,000
$25,000
$30,000
$35,000
$40,000
$45,000
Jul FY15
Jul FY16
Aug FY15
Aug FY16
Sept FY15
Sept FY16
Oct FY15
Oct FY16
Nov FY15
Nov FY16
Dec FY15
Dec FY16
Jan FY15
Jan FY16
Feb FY15
Feb FY16
Mar FY15
Mar FY16
Apr FY15
Apr FY16
May FY15
May FY16
Jun FY15
Jun FY16
YTD Operating Revenue (000s)
Mon
thly
Ope
ratin
g Re
venu
e (0
00s)
Revenue Comparison - FY 2015 to FY 2016 Total Residental Total Commercial Total Industrial Other Charges Free Sewer/Drainage YTD 2015 YTD 2016
18

Louisville and Jefferson County Metropolitan Sewer DistrictWastewater Customer Count
Plant Code140 LWC 26 4151 LWC 248 26152 LWC 33 1153 LWC 0 1164 LWC 0 0
235 LWC 0 0
237 LWC 3 6244 LWC 0 0294 LWC 2 0
312 38
Submitted by: Adonis HendersonDate: 5/2/2016
Floyds Fork 8,307 374 1 8,684
Grand Total 232,436 21,569 403 254,758
Moser Farm (Hite Creek) 166 0 0 166
Glen Oaks - Sec. 5 Only (Hite Creek)
267 1 0 268
Cedar Creek 17,215 1,110
9,982 618
9 18,343
McNeely Lake 396 1 0 3978 10,609
Derek Guthrie 65,086 3,921 23 69,060Morris Forman - City 79,281 10,499Morris Forman - County 51,736 5,045 51 56,866Hite Creek
Multi Customers
311 90,365
TotalService Area Customers Customers Customers Customers
April-16
Residential Commercial Industrial Metro Customers
19

New Customer Count
April data for this chart is unavailable due to new system implementation.
20

MARKET RATES
Data Supplied by: Saundra GibsonMay 18, 201621

MARKET RATES
Data Supplied by: Saundra GibsonMay 18, 201622

Kentucky Municipal Market Update
Market Commentary
Prepared by the Public Finance Department of Hilliard Lyons for the Louisville & Jefferson Metropolitan Sewer DistrictMay-16
Alex RorkeSenior Managing Director of Municipal Securities [email protected]
Greg PhillipsManaging [email protected]
Chip SutherlandSenior V.P. - Public Finance [email protected]
Brian ShawV.P. - [email protected]
Mark RawlingsV.P. - Head of Quantitative [email protected]
Kelly MrsicV.P. - Public Finance [email protected]
Michael OldigesPublic Finance [email protected]
Andrew WebbPublic Finance Analyst [email protected]
Market Overview
Municipal bonds notched their 10th positive month and outperformed Treasuries in April thanks largely to robust demand and manageable supply, and despite a murkier macro backdrop. Economic data disappointed, but a risk-on sentiment returned as the oil price rebounded 20% and the Federal Reserve reiterated its patience in raising rates. This caused Treasury rates to rise (and prices fall). The graph below shows the 10-year Treasury rate since January 2015 to present.
Muni issuance came in at $32.5 billion for April, down 21% from 2015 and 4% below the 10-year average. Total potential municipal volume for the week of May 23rd is estimated at $11.3 billion. Demand, as measured by muni bond fund inflows/outflows, was $5.3 billion of inflows for the month and $20.3 billion year-to-date (YTD). Muni bond funds reported the 32nd straight week of inflows for the week ending May 13th. Notably, we did not see the typical tax-time outflows in muni bond funds this April.
This is likely due to lower tax bills (given lackluster equity returns in 2015) and a continued demand for high-quality income, lower relative volatility and diversification away from equity and equity-like (corporate high yield) risk. Crossover demand continues in a world increasingly characterized by negative interest rates. Despite unfavorable headlines in Puerto Rico, Chicago and Atlantic City, the core of the market remains healthy. Municipal Market Analytics reports the YTD default rate at 0.64%, which includes Puerto Rico’s May 1 default. Missed payments on July 1 could increase that number, but we believe that possibility has been well-telegraphed and discounted by the market.
23
Prepared by : Christina Corley05/10/2016
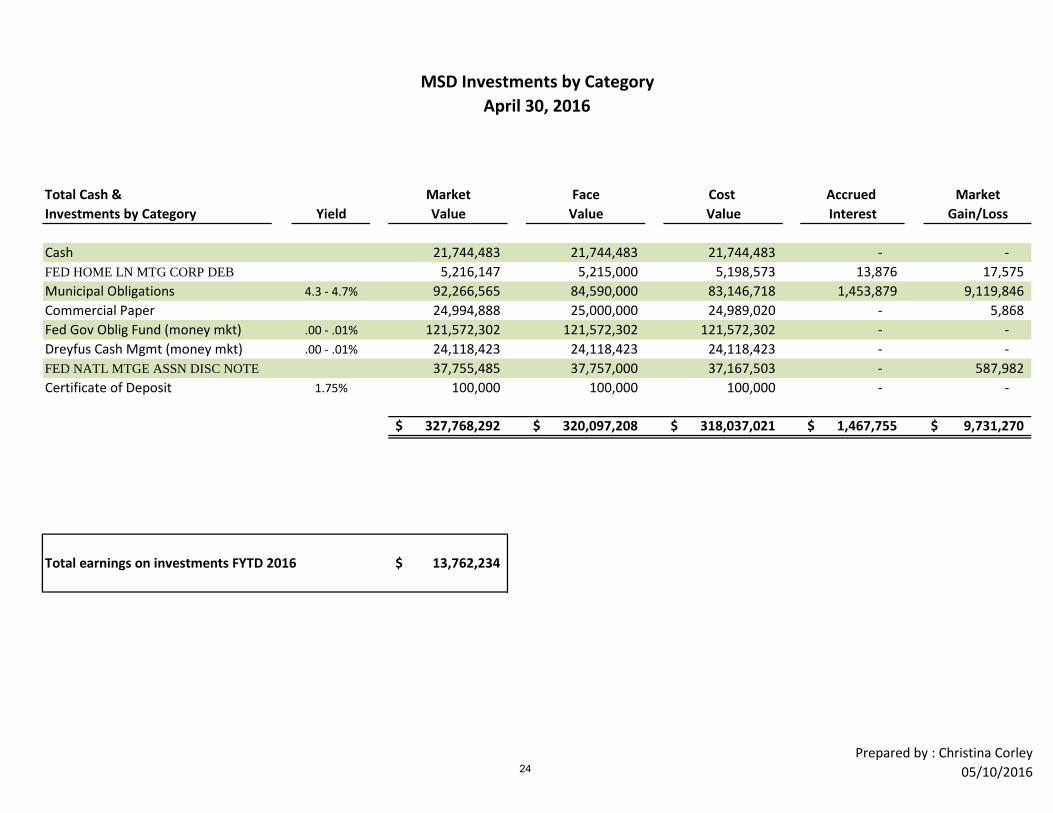
MSD Investments by Category
Total Cash & Market Face Cost Accrued MarketInvestments by Category Yield Value Value Value Interest Gain/Loss
Cash 21,744,483 21,744,483 21,744,483 - - FED HOME LN MTG CORP DEB 5,216,147 5,215,000 5,198,573 13,876 17,575 Municipal Obligations 4.3 - 4.7% 92,266,565 84,590,000 83,146,718 1,453,879 9,119,846 Commercial Paper 24,994,888 25,000,000 24,989,020 - 5,868 Fed Gov Oblig Fund (money mkt) .00 - .01% 121,572,302 121,572,302 121,572,302 - - Dreyfus Cash Mgmt (money mkt) .00 - .01% 24,118,423 24,118,423 24,118,423 - - FED NATL MTGE ASSN DISC NOTE 37,755,485 37,757,000 37,167,503 - 587,982 Certificate of Deposit 1.75% 100,000 100,000 100,000 - -
327,768,292$ 320,097,208$ 318,037,021$ 1,467,755$ 9,731,270$
Total earnings on investments FYTD 2016 13,762,234$
April 30, 2016
24

MSD's Muni Bond Investments AprilFY 2016
Maturity Date Market Value Par Value Cost Rating (Moody's) Market Yield Coupon Rate Yield to Maturity DurationAUSTIN TEX WTR & WASTEWATER 11/15/2040 5,760,200.00$ 5,000,000.00$ 5,087,981.25$ Aa2 4.49% 5.125% 4.20% 14.9BAY AREA TOLL AUTH CALIF TOLL 4/1/2034 3,192,090.00$ 3,000,000.00$ 3,060,416.67$ Aa3 4.45% 5.00% 4.03% 12.3BEAVERCREEK OHIO CITY SCH DIST 12/1/2036 1,417,550.40$ 1,260,000.00$ 1,232,343.00$ Aa2 4.47% 5.00% 4.14% 13.2CHICAGO ILL 1/1/2039 5,840,991.00$ 5,160,000.00$ 5,220,322.23$ Aa3 4.71% 5.00% 4.56% 13.8DALLAS TEX AREA RAPID TRAN 12/1/2036 1,230,540.00$ 2,000,000.00$ 1,983,888.89$ Aa3 4.46% 5.00% 4.12% 13.2FLORIDA ST BRD ED PUB ED 6/1/2037 1,442,886.60$ 1,380,000.00$ 1,309,373.13$ Aa1 4.33% 4.75% 4.07% 13.6HARRIS CNTY TEX FLOOD CTL DIST 10/1/2039 5,757,600.00$ 5,000,000.00$ 5,094,694.44$ Aa1 4.39% 5.00% 4.07% 14.6JEA FLA WTR & SWR SYS REV 10/1/2039 1,081,795.35$ 955,000.00$ 960,172.92$ Aa2 4.41% 5.00% 4.10% 14.6JEA FLA WTR & SWR SYS REV 10/1/2039 1,030,820.70$ 910,000.00$ 914,929.17$ Aa2 4.41% 5.00% 4.10% 14.6KING CNTY WASH SWR REV 1/1/2039 5,160,309.60$ 5,265,000.00$ 5,383,358.91$ Aa2 4.39% 5.00% 4.06% 14.1LAS VEGAS VALLEY NEV WTR DIST 2/1/2037 462,271.50$ 3,000,000.00$ 2,988,573.33$ Aa2 4.62% 5.00% 4.39% 13.3LOS ANGELES CALIF DEPT ARPTS 5/15/2040 5,722,000.00$ 5,000,000.00$ 4,791,850.00$ Aa3 4.46% 5.00% 4.19% 14.8LOS ANGELES CALIF DEPT WTR 7/1/2038 6,516,120.00$ 6,000,000.00$ 6,199,120.00$ Aa3 4.61% 5.25% 4.27% 13.7LOUISIANA ST GAS & FUELS TAX 5/1/2040 5,578,700.00$ 5,000,000.00$ 5,029,861.11$ Aa2 4.38% 5.00% 4.06% 14.9METROPOLITAN ATLANTA RAPID 7/1/2039 5,555,750.00$ 5,000,000.00$ 5,076,883.33$ A1 4.45% 5.00% 4.16% 14.3NEW YORK N Y CITY MUN WTR FIN 6/15/2037 4,300,539.60$ 4,110,000.00$ 4,110,000.00$ Aa2 4.43% 5.00% 4.08% 13.5NEW YORK N Y CITY MUN WTR FIN 6/15/2039 1,877,137.50$ 1,500,000.00$ 1,533,125.00$ Aa2 4.59% 5.00% 4.39% 14.1NEW YORK N Y CITY MUN WTR FIN 6/15/2039 2,230,280.00$ 2,000,000.00$ 1,975,480.00$ Aa2 4.39% 5.00% 4.07% 14.3PALM BEACH CNTY FLA PUB IMPT 5/1/2038 3,252,210.00$ 3,000,000.00$ 3,047,916.67$ Aa1 4.57% 5.00% 4.34% 13.9SALT RIVER PROJ ARIZ AGRIC 1/1/2038 2,125,400.00$ 2,000,000.00$ 2,030,331.11$ Aa1 4.51% 5.00% 4.23% 13.7SALT RIVER PROJ ARIZ AGRIC 1/1/2038 5,313,500.00$ 5,000,000.00$ 5,008,650.00$ Aa1 4.51% 5.00% 4.23% 13.7TEXAS ST 4/1/2018 3,245,280.00$ 430,000.00$ 462,984.69$ 4.14% 4.75% -2.28% 2.8TEXAS ST 4/1/2037 4,869,746.30$ 4,570,000.00$ 4,558,144.48$ Aaa 4.47% 4.75% 3.91% 13.8TRIBOROUGH BRDG & TUNL AUTH N 11/15/2037 858,120.00$ 800,000.00$ 794,403.56$ Aa3 4.41% 5.00% 4.06% 13.9TRIBOROUGH BRDG & TUNL AUTH N 11/15/2037 818,576.00$ 1,750,000.00$ 1,748,541.67$ Aa3 4.41% 5.00% 4.06% 13.9TRIBOROUGH BRDG & TUNL AUTH N 11/15/2038 7,626,150.00$ 7,000,000.00$ 7,060,386.67$ Aa3 4.42% 5.00% 4.10% 14.3
Totals: 92,266,564.55$ 86,090,000.00$ 86,663,732.23$ Average Years to Maturity: 22.12
Prepared By Chris Duzyk 5/18/2016
4.08084% 14.18179
Asset Description
5.18182%Total Weighted Average Coupon Rates
4.62710%Total Weighted Average Market Yield
Total Weighted Average Yield to Maturity
Unrealized Gain in Total (Market Value - Cost)$5,602,832.32
Total Weighted Average Duration
25

MSD's Commercial Paper
MSD 0.1836AA Nonfinancial 0.114A2/P2 Nonfinancial 0.3725AA Financial 0.0949AA Asset-Backed 0.2143
Company Maturity Date Purchase Amount Maturity Amount Rate1
Insitutional SF 5/16/2016 24,989,020.83$ 25,116,520.81$ 0.5102%Total: 24,989,020.83$ 25,116,520.81$ 0.5102%
1 Total rate shown is MSD's weighted average CP rate at month's end
Prepared by Duzyk 5/18/2016
YTD Average Rate as of 4/5/2013
Outstanding as of 04/30/2016
0.0000%
0.1000%
0.2000%
0.3000%
0.4000%
0.5000%
0.6000%
0.7000%
0.8000%
0.9000%
1.0000%
MSD's Spread - Corporate Commercial Paper MSD Avg. CP Rate AA Nonfinancial CP A2/P2 Nonfinancial CP AA Financial CP AA Asset-Backed
0.00%
0.10%
0.20%
0.30%
0.40%
0.50%
0.60%
Federal Funds Rate Fed Fund Target Rate Effective Fed Fund Rate
**Effective Fed Fund rate is a weighted average of rates on brokered trades
FOMC Meetings June 15 July 27 September 21
0
10000000
20000000
30000000
40000000
50000000
60000000
70000000
80000000
90000000
0.00%
0.05%
0.10%
0.15%
0.20%
0.25%
0.30%
0.35%
0.40%
0.45%
0.50%
0.55%
0.60%
0.65%
0.70%
MSD's CP Purchases, Balance and 1 Mo. Buyer Rate vs. 1 Mo. LIBOR Purchases Maturities Outstanding CP Libor - 1 month MSD Avg. CP Rate
26

MSD's Current Investment Model - April FY 2016
Series Revenue Fund Debt Service Fund Debt Reserve Fund Construction Fund Cost of Issuance Totals2005A -$ -$ -$ -$ -$ -$ 2006A -$ 2,198,059.64$ -$ -$ -$ 2,198,059.64$ 2007A -$ 2,387,495.80$ -$ -$ -$ 2,387,495.80$ 2008A -$ 3,972,961.87$ 5,023,145.50$ -$ -$ 8,996,107.37$ 2009A -$ 6,637,392.58$ 11,802,888.84$ -$ -$ 18,440,281.42$ 2009B -$ 17,627,586.60$ 29,575,519.75$ -$ -$ 47,203,106.35$ 2009C -$ 4,933,857.31$ 25,513,309.37$ -$ -$ 30,447,166.68$ 2010A -$ 9,452,709.10$ 38,561,169.49$ -$ -$ 48,013,878.59$ 2011A -$ 7,656,268.90$ -$ -$ -$ 7,656,268.90$ 2015 BAN -$ 10,659,592.38$ -$ -$ -$ 10,659,592.38$ 2013A&B -$ 5,581,877.60$ 26,852,604.09$ -$ -$ 32,434,481.69$ 2013C -$ 2,230,330.98$ 5,395,990.24$ -$ -$ 7,626,321.22$ 2014A -$ 1,669,791.36$ -$ 7.12$ -$ 1,669,798.48$ 2015A -$ 3,355,229.81$ 4,572,276.83$ 76,550,581.88$ -$ 84,478,088.52$ 2015B -$ 1,907,314.81$ -$ -$ -$ 1,907,314.81$ Cash 21,608,698.05$ -$ -$ -$ -$ 21,608,698.05$ Certificate of Deposit 100,000.00$ -$ -$ -$ -$ 100,000.00$ Money Market 1,941,631.78$ -$ -$ -$ -$ 1,941,631.78$ Totals 23,650,329.83$ 80,270,468.74$ 147,296,904.11$ 76,550,589.00$ -$ 327,768,291.68$
Asset Description Revenue Fund Debt Service Fund Debt Reserve Fund Construction Fund Cost of Issuance TotalsCash 21,608,698.05$ -$ -$ 135,532.27$ -$ 21,744,230.32$ Certificate of Deposit 100,000.00$ -$ -$ -$ -$ 100,000.00$ Money Market 1,941,631.78$ -$ -$ 36,420,312.11$ -$ 38,361,943.89$ Money Market-Dreyfus -$ 15,195,909.89$ 8,922,513.35$ -$ -$ 24,118,423.24$ Money Market-Federated PRM -$ 17,627,586.60$ 3,552,621.35$ -$ -$ 21,180,207.95$ Money Market-Federated Govt. Ob -$ 47,446,972.25$ 14,583,422.98$ 7.12$ -$ 62,030,402.35$ Muni-Bonds -$ -$ 92,266,564.55$ -$ -$ 92,266,564.55$ Fannie Mae-MBS -$ -$ 22,755,634.58$ -$ -$ 22,755,634.58$ Treasury - Agency -$ -$ 5,216,147.30$ 14,999,850.00$ -$ 20,215,997.30$ Corporate Commercial Paper -$ -$ -$ -$ -$ -$ Asset Backed Commercial Paper -$ -$ -$ 24,994,887.50$ -$ 24,994,887.50$ Totals 23,650,329.83$ 80,270,468.74$ 147,296,904.11$ 76,550,589.00$ -$ 327,768,291.68$
Prepared by Chris Duzyk 5/18/2016
7%
25%
45%
23%
0%
MSD's Fund Totals
Revenue Fund
Debt Service Fund
Debt Reserve Fund
Construction Fund
Cost of Issuance
8% 14%
8%
7%
22%
33%
8%
MSD's Asset Breakdown
Cash
Certificate of Deposit
Money Market
Money Market-Dreyfus
Money Market-Federated PRM
Money Market-Federated Govt. Ob.
Muni-Bonds
Fannie Mae-MBS
27

Ccy Credit Support Provider Maturity Date Accrued
USD Wells Fargo Bank, NA 05/15/2033 (290,488.54)
USD Bank of America, NA 05/15/2033 (72,767.54)
(363,256.07)
Series 1999 - 1 -$225.732M 67% LIBOR Fixed Payer Swap - Amended - 6/12/2013 180,716,000 180,716,000 (74,954,660.52) (75,245,149.06)
Series 1999 - 2 -$56.433 67% LIBOR Fixed Payer Swap - Amended - 6/12/2013 56,433,000 45,284,000 (18,762,629.36) (18,835,396.90)
Values on this statement are shown from your perspectiveA positive number is an asset
A negative number is a liability
Description Initial Notional Current Notional Base Value* Net Value**
MTM VALUATION AS OF CLOSE 4/29/2016Louisville and Jefferson County Metropolitan Sewer District
Total USD Currency 237149000 226000000 (93,717,289.88) (94,080,545.96)
28

Submitted by: Patrick Meador5/18/2016
Year to Date Totals O&M Budget Jul Aug Sep Oct Nov Dec Jan Feb Mar Apr May JunFY11 YTD Total 107,606,600 7,587,390 16,589,206 25,439,315 33,290,656 42,330,974 51,078,187 60,010,374 67,671,833 77,239,193 84,917,031 95,156,703 106,782,666FY12 YTD Total 111,795,300 6,938,802 16,201,752 24,902,770 33,479,442 42,814,484 51,935,981 61,511,843 69,073,118 78,407,069 87,058,106 96,507,485 106,587,246FY13 YTD Total 117,433,000 7,542,927 15,776,654 24,954,227 33,728,389 41,767,405 50,599,259 60,126,918 67,751,390 77,063,950 86,612,356 96,217,336 108,535,303FY14 YTD Total 115,280,596 8,456,854 16,096,345 25,381,204 34,584,770 42,559,114 51,600,642 60,344,260 68,384,591 77,766,147 86,691,675 94,446,233 107,650,171FY15 YTD Total 115,975,014 6,671,498 14,866,211 23,553,895 31,636,191 40,321,276 50,333,536 58,353,348 66,508,611 75,879,722 85,389,477 95,219,201 106,174,406FY16 YTD Total 116,021,156 7,762,835 16,440,660 28,342,724 37,926,793 46,102,024 58,298,571 68,378,257 75,313,842 86,045,680 95,886,535
Percent Expended to DateFY11 YTD Total 7.11% 15.54% 23.82% 31.18% 39.64% 47.83% 56.20% 63.37% 72.33% 79.52% 89.11% 100.00%FY12 YTD Total 6.51% 15.20% 23.36% 31.41% 40.17% 48.73% 57.71% 64.80% 73.56% 81.68% 90.54% 100.00%FY13 YTD Total 6.95% 14.54% 22.99% 31.08% 38.48% 46.62% 55.40% 62.42% 71.00% 79.80% 88.65% 100.00%FY14 YTD Total 7.86% 14.95% 23.58% 32.13% 39.53% 47.93% 56.06% 63.52% 72.24% 80.53% 87.73% 100.00%FY15 YTD Total 6.15% 13.70% 21.71% 29.16% 37.16% 46.39% 53.78% 61.30% 69.94% 78.70% 87.76% 97.86%
5 YEAR AVERAGE 6.91% 14.79% 23.09% 30.99% 39.00% 47.50% 55.83% 63.09% 71.82% 80.05% 88.76% 99.57%
Performance Matrix Results - FY 2015
FY15 Budget comparative on 5 YEAR AVERAGE 8,299,641 17,559,846 27,299,114 36,831,210 46,177,221 55,503,893 65,407,366 73,816,875 84,017,635 93,606,126 103,535,674 115,975,014FY15 YTD Total 6,671,498 14,866,211 23,553,895 31,636,191 40,321,276 50,333,536 58,353,348 66,508,611 75,879,722 85,389,477 95,219,201 106,174,406Variance of Actual to 5 YEAR AVERAGE (1,628,143) (2,693,635) (3,745,219) (5,195,019) (5,855,945) (5,170,357) (7,054,018) (7,308,264) (8,137,913) (8,216,649) (8,316,473) (9,800,608)
FY 2015 Performance Level Matrix Results 80.38% 84.66% 86.28% 85.90% 87.32% 90.68% 89.22% 90.10% 90.31% 91.22% 91.97% 91.55%
Performance Matrix Results - FY 2016
FY16 YTD Budget 10,710,546 20,095,154 29,683,058 40,294,935 49,395,127 58,567,261 69,210,179 77,748,089 87,051,857 97,582,418 106,511,877 115,524,529FY16 YTD Total 7,762,835 16,440,660 28,342,724 37,926,793 46,102,024 58,298,571 68,378,257 75,313,842 86,045,680 95,886,535Variance of Actual to Budget (2,947,711) (3,654,494) (1,340,334) (2,368,142) (3,293,103) (268,690) (831,921) (2,434,246) (1,006,176) (1,695,882)
FY 2016 Performance Level Matrix Results 72.48% 81.81% 95.48% 94.12% 93.33% 99.54% 98.80% 96.87% 98.84% 98.26% 0.00% 0.00%
Performance Matrix Performance Matrix Results Results: FY15 FY16 Budget Actual Percentage 5 Yr Average 2013 92.42% Exceptionally Achieves
Exceptionally Achieves < 92.5% < 92.5% FY11 107,606,600 106,782,666 99.23% 94.79% 2014 93.38% Commendably AchievesCommendably Achieves 92.6% - 95% 92.6% - 95% FY12 111,795,300 106,587,246 95.34% 2015 93.55% Commendably Achieves
Fully Achieves 95.1% - 100% 95.1% - 100% FY13 117,433,000 108,535,303 92.42%Minimally Achieves 100.1% - 104.9% 100.1% - 104.9% FY14 115,280,596 107,650,171 93.38%
Fails to Achieve > 105% > 105% FY15 115,975,014 108,496,496 93.55%
ASSUMPTIONS: Matrix results assume a typical weather year and no extraordinary events exceeding contingency reserve.
PERFORMANCE MATRIX - OPERATING EXPENSEFY 2016
ACTUALS
"Manage the operating units of MSD within the FY2016 budget, delivering reliable and responsive services to customers."
29

Submitted by: Patrick Meador5/18/2016
Year to Date Totals Budget Jul Aug Sep Oct Nov Dec Jan Feb Mar Apr May Jun
FY11 YTD Total 0 1,262,958 16,276,036 24,056,876 34,447,381 43,008,365 54,167,734 68,556,733 79,586,957 93,448,740 103,934,678 114,823,264 138,311,288FY12 YTD Total 0 12,013,202 10,264,823 19,837,145 30,303,709 38,307,940 47,269,999 57,000,249 65,618,465 70,335,835 78,096,420 85,409,667 102,508,269FY13 YTD Total 150,661,500 6,689,211 6,471,367 10,658,314 22,862,055 30,238,249 38,543,925 45,964,426 53,351,679 58,217,541 63,726,904 70,740,663 90,283,467FY14 YTD Total 108,669,797 9,048,107 8,106,866 14,158,444 24,827,164 30,545,485 37,501,927 46,587,639 53,259,836 58,635,402 63,367,536 72,427,292 85,978,375FY15 YTD Total 117,859,314 5,346,882 12,716,942 11,632,363 23,038,258 29,921,263 38,987,761 46,300,430 55,051,591 61,767,963 70,840,562 81,639,090 117,298,703FY16 YTD Total 187,476,359 3,902,562 12,006,650 23,516,883 42,996,039 53,570,102 67,680,306 81,097,201 99,775,576 109,876,994 129,380,285
5 YEAR AVERAGE by Month 7.02% 2.82% 5.14% 10.67% 6.94% 8.37% 8.98% 7.96% 6.40% 6.90% 8.50% 20.29%YTD 7.02% 9.84% 14.99% 25.66% 32.60% 40.96% 49.95% 57.91% 64.30% 71.20% 79.71% 100.00%
Performance Matrix Results - FY 2015
FY15 Budget Comparative on 5 YEAR AVERAGE 8,241,033 10,868,600 18,048,423 29,255,811 37,228,890 46,084,036 56,444,827 73,648,201 81,106,410 88,318,428 97,415,509 117,859,314FY15 YTD Total 5,346,882 12,716,942 11,632,363 23,038,258 29,921,263 38,987,761 46,300,430 55,051,591 61,767,963 70,840,562 81,639,090 117,298,703Variance of Actual to 5 YEAR AVERAGE (2,894,151) 1,848,342 (6,416,060) (6,217,553) (7,307,627) (7,096,275) (10,144,397) (18,596,610) (19,338,447) (17,477,866) (15,776,419) (560,611)
FY 2015 Performance Level Matrix Results 64.88% 117.01% 64.45% 78.75% 80.37% 84.60% 82.03% 74.75% 76.16% 80.21% 83.81% 99.52%
FY14 Actual versus Budget Results 141.46% 88.68% 84.75% 94.48% 90.14% 88.20% 91.41% 79.87% 79.79% 78.24% 81.86% 79.12%FY15 Actual versus Budget Results 64.88% 117.01% 64.45% 78.75% 80.37% 84.60% 82.03% 74.75% 76.16% 80.21% 83.81% 99.52%FY16 Budget Comparative on 5 YEAR AVERAGE 13,169,669 18,455,035 28,096,986 48,109,118 61,115,056 76,799,685 93,641,169 108,558,831 120,554,222 133,487,416 149,429,910 187,476,359FY16 YTD Total 3,902,562 12,006,650 23,516,883 42,996,039 53,570,102 67,680,306 81,097,201 99,775,576 109,876,994 129,380,285 0 0Variance of Actual to 5 YEAR AVERAGE (9,267,107) (6,448,385) (4,580,103) (5,113,079) (7,544,954) (9,119,379) (12,543,968) (8,783,255) (10,677,228) (4,107,131) 0 0FY16 Actual versus Budget Results 29.63% 65.06% 83.70% 89.37% 87.65% 88.13% 86.60% 91.91% 91.14% 96.92% 0.00% 0.00%
FY14 Variance to Engineer's Estimate 2.69% -6.09% 1.39% -1.59% -2.56% -1.84% -1.65% -1.19% -1.06% -13.67% -13.24% -13.20%FY15 Variance to Engineer's Estimate 63.98% 63.35% 60.73% 50.12% 44.54% 27.50% 19.92% 8.82% 8.79% 8.15% 8.01% 7.82%
FY16 Bid Estimate 6,237,581 9,755,084 15,547,644 19,287,638 25,444,542 38,903,966 39,163,966 39,260,856 39,931,306 83,094,371 0 0FY16 Board Approved 5,723,814 9,143,812 15,273,345 19,040,242 26,801,914 39,293,347 39,473,327 39,564,737 40,174,206 79,529,806 0 0FY16 Variance to Engineer's Estimate -8.24% -6.27% -1.76% -1.28% 5.33% 1.00% 0.79% 0.77% 0.61% -4.29% 0.00% 0.00%
FY 2014 Performance Level Matrix Results 138.77% 94.77% 83.36% 96.07% 92.70% 90.04% 93.06% 81.06% 80.85% 91.91% 95.10% 92.32%FY 2015 Performance Level Matrix Results 0.90% 53.66% 3.72% 28.63% 35.83% 57.10% 62.11% 65.93% 67.37% 72.06% 75.80% 91.70%
FY 2016 Performance Level Matrix Results 37.87% 71.33% 85.46% 90.65% 82.32% 87.12% 85.81% 91.14% 90.53% 101.21% 0.00% 0.00%
Performance Matrix Results: 2013 59.92% Minimally Achieves Performance Matrix Results
FY14 FY15 FY16 2014 79.12% Fully Achieves Budget * Actual * PercentageExceptionally Achieves >92.5% >92.5% >95.0% 2015 99.52% Exceptionally Achieves FY11 163,822,500 138,311,288 84.43%
Commendably Achieves 85% - 92.4% 85% - 92.4% 90% - 94.9% FY12 156,193,500 102,508,269 65.63%Fully Achieves 75% - 84.9% 75% - 84.9% 80% - 89.9% FY13 150,661,500 90,283,467 59.92%
Minimally Achieves 65.1% - 74.9% 65.1% - 74.9% 75% - 79.9% FY14 108,669,797 85,978,375 79.12%Fails to Achieve <65% <65% <75% FY15 117,859,314 117,298,703 99.52%
AVERAGE 106,876,020 77.72%
PERFORMANCE MATRIX - CAPITAL EXPENSEFY 2016
ACTUALS
"Effectively manage the FY2016 Capital Program to assure projects are completed on time and within budget."
* Does not include Force Account amounts.
( FY13 through FY15 included Actual vs. Budget % Only )
( FY16 Actual to Budget % + / - FY16 Variance to Eng. Estimate % )
30

FY 2016 ViolationsTreatment Plant 2008 2009 2010 2011 2012 2013 2014 2015 July August Sept. October November December January February March April May June
Bancroft 0 1 0 0 0 0 0 0 0 0 0 0 0 0 0 0 *2016Berrytown 0 0 0 0 1 0 1 2 0 0 0 0 0 *2016Cedar Creek 4 0 0 0 0 0 0 0 0 0 0 0 0 0 0 0 0 0Derek R.Guthrie 1 2 0 0 0 0 0 3 0 0 0 0 0 0 0 0 0 0Floyds Fork 4 2 0 1 0 0 0 0 0 0 0 0 0 0 0 0 0 0Hite Creek 0 2 0 4 0 0 0 0 0 0 0 0 0 0 2 0 0 0Hunting Creek North 1 0 2 0 0 3 0 0 0 0 *2016Hunting Creek South 3 2 10 5 3 4 0 0 0 *2016J-Town 13 1 0 0 0 1 1 1 0 0 0 2 0 0 *2016Ken Carla 1 1 0 0 0 1 0 0 0 0 *2016McNeely Lake 0 1 0 0 1 3 2 0 0 0 0 0 0 0 0 0 0 0Morris Forman 0 0 3 2 0 0 0 15 1 0 0 2 0 0 0 4 0 2Shadow Wood 1 0 5 8 0 3 0 0 0 0 *2016Starview Estates 1 0 0 0 0 0 0 0 0 0 0 0 0 0 0 0 *2016Timberlake 5 2 0 2 0 4 0 0 0 *2016Closed Plants 8 2 6 4 1 3 9 1 Total Violations - Cumulative 42 16 26 26 6 22 13 22 1 1 1 5 5 5 7 11 11 13
Violation Months 30 15 9 15 4 12 8 9 1 1 1 3 3 3 4 5 5 6
Violation Free Months (a) 87.50% 93.75% 96.25% 93.75% 98.33% 95.00% 96.30% 95.24% 93.33% 96.43% 97.37% 93.75% 94.83% 95.52% 94.67% 93.98% 94.38% 93.68%(a) each month per treatment plant without one or more NOVs*year removed from serviceRegional Treatment Plants
Unauthorized Dry Weather Discharges FY16 Unauthorized Discharges2008 2009 2010 2011 2012 2013 2014 2015 July August Sept. October November December January February March April May June
Bypass 10 21 13 3 8 8 8 0 1 0 1 1 0 0 0 0 0 0Electrical 1 3 3 1 2 0 1 0 0 0 0 0 0 0 0 0 0 1Grease 0 4 1 1 0 1 4 6 0 0 1 0 0 1 0 0 0 0Mechanical 4 5 7 7 4 2 1 3 0 0 0 0 0 0 0 0 0 1Obstruction 3 4 9 13 16 8 4 5 0 0 0 0 2 0 0 0 1 0Flood 11 1 0 2 0 0 0 1 0 0 0 0 0 0 0 0 0 0Roots 7 3 4 3 2 2 5 2 0 0 0 0 0 0 0 0 1 0Structural 4 11 3 12 8 2 6 8 1 1 2 1 0 3 1 1 1 2
Total Discharges - Cumulative 40 52 40 42 40 23 29 25 2 3 7 9 11 15 16 17 20 24 0 0
Discharge Months 40 52 40 42 40 23 29 25 2 3 7 9 11 15 16 17 20 24 0 0
S. A. Discharge Free Months (b) 91.67% 89.17% 91.67% 91.25% 91.67% 95.21% 93.96% 94.79% 95.00% 96.25% 94.17% 94.38% 94.50% 93.75% 94.29% 94.69% 94.44% 94.00%(b) Excluding Power, Utility Damage and Upset causes.
Results: 2013 95.00% Commendable Achieves2014 96.30% Commendable Achieves 94.2% 96.3% 95.8% 94.1% 94.7% 94.6% 94.5% 94.3% 94.4% 93.8%2015 95.24% Commendable Achieves
Exceptional Achieves < 16 97% > 97% Exceptional Achieves > 97% > 97% > 97%Commendable Achieves 16 to 26 95% 95% to 96.9% Commendable Achieves 95% to 96.9% 95% to 96.9% 95% to 96.9%Fully Achieves 27 to 40 92% 92.10% to 94.9% Fully Achieves 92.10% to 94.9% 92.10% to 94.9% 92.10% to 94.9%Minimal Achieves 41 to 51 89% 89.10% to 92.0% Minimal Achieves 89.10% to 92.0% 89.10% to 92.0% 89.10% to 92.0%Fails to Achieve > 51 89% < 89% Fails to Achieve < 89% < 89% < 89%
FY 2014 FY 2015 FY 2016
Performance Matrix - RegulatoryNotice to EPA
"Effectively operate wastewater plants to assure compliance with water quality regulations and improve the quality of area waterways."
NOV Performance Goals (50%)
Violations
FY 2016UD Performance Goals (50%)
Discharges
Weighted Average
31
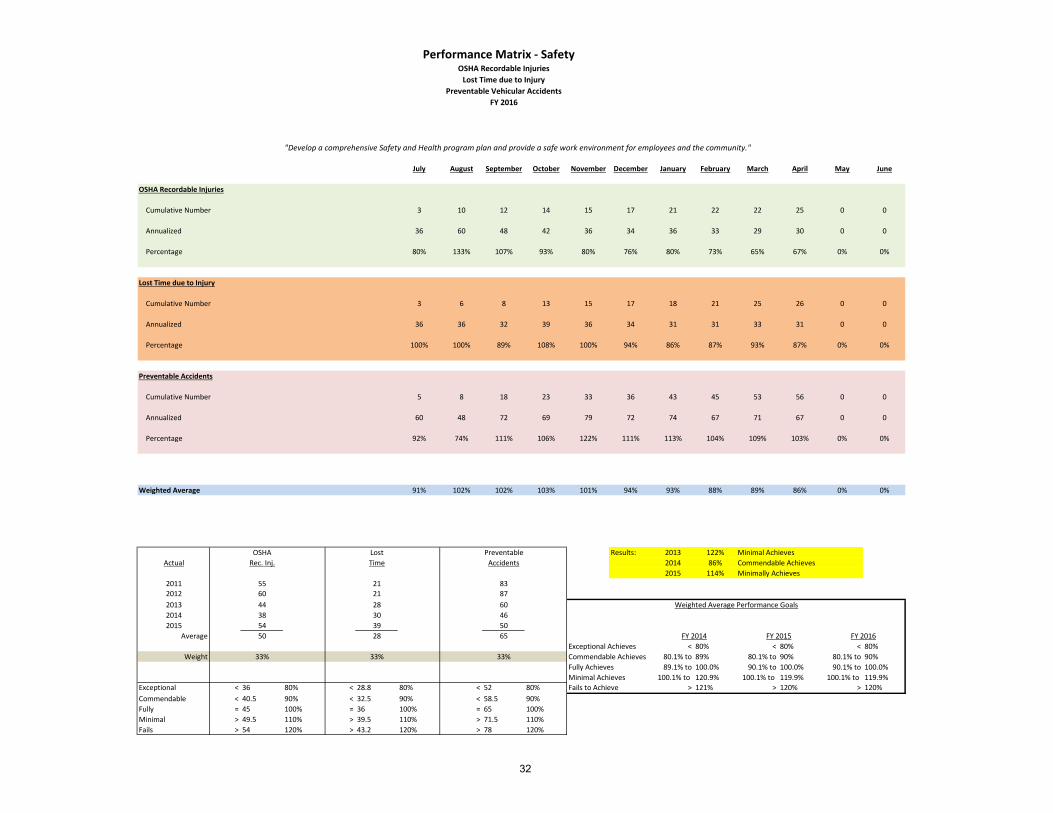
Performance Matrix - SafetyOSHA Recordable Injuries
Lost Time due to InjuryPreventable Vehicular Accidents
FY 2016
"Develop a comprehensive Safety and Health program plan and provide a safe work environment for employees and the community."
July August September October November December January February March April May June
OSHA Recordable Injuries
Cumulative Number 3 10 12 14 15 17 21 22 22 25 0 0
Annualized 36 60 48 42 36 34 36 33 29 30 0 0
Percentage 80% 133% 107% 93% 80% 76% 80% 73% 65% 67% 0% 0%
Lost Time due to Injury
Cumulative Number 3 6 8 13 15 17 18 21 25 26 0 0
Annualized 36 36 32 39 36 34 31 31 33 31 0 0
Percentage 100% 100% 89% 108% 100% 94% 86% 87% 93% 87% 0% 0%
Preventable Accidents
Cumulative Number 5 8 18 23 33 36 43 45 53 56 0 0
Annualized 60 48 72 69 79 72 74 67 71 67 0 0
Percentage 92% 74% 111% 106% 122% 111% 113% 104% 109% 103% 0% 0%
Weighted Average 91% 102% 102% 103% 101% 94% 93% 88% 89% 86% 0% 0%
OSHA Lost Preventable Results: 2013 122% Minimal AchievesActual Rec. Inj. Time Accidents 2014 86% Commendable Achieves
2015 114% Minimally Achieves2011 55 21 832012 60 21 872013 44 28 602014 38 30 462015 54 39 50
Average 50 28 65Exceptional Achieves < 80% < 80% < 80%
Weight 33% 33% 33% Commendable Achieves 80.1% to 89% 80.1% to 90% 80.1% to 90%Fully Achieves 89.1% to 100.0% 90.1% to 100.0% 90.1% to 100.0%Minimal Achieves 100.1% to 120.9% 100.1% to 119.9% 100.1% to 119.9%
Exceptional < 36 80% < 28.8 80% < 52 80% Fails to Achieve > 121% > 120% > 120%Commendable < 40.5 90% < 32.5 90% < 58.5 90%Fully = 45 100% = 36 100% = 65 100%Minimal > 49.5 110% > 39.5 110% > 71.5 110%Fails > 54 120% > 43.2 120% > 78 120%
Weighted Average Performance Goals
FY 2014 FY 2015 FY 2016
32

Performance Matrix - Customer ServiceService Requests - MSD Assets
Drainage Service RequestsBackup Service Requests
FY 2016
"Achieving a premium level of customer care and service throughout MSD."
July August September October November December January February March April May June
Service Requests - MSD Assets
Cumulative Service Requests 2,008 3,178 4,232 5,107 6,077 7,233 7,947 8,989 10,342 11,707 0 0 Annualized 24,096 19,068 16,928 15,321 14,585 14,466 15,894 13,483 13,789 14,105 0 0
Customers 254,286 254,286 254,286 254,286 254,286 254,286 254,286 254,369 254,370 254616 0 0
Percentage Free 91% 93% 93% 94% 94% 94% 94% 95% 95% 94% 0% 0%
Drainage Service Requests
Cumulative Open Requests 1,421 2,748 3,916 4,902 5,813 6,629 7,372 8,130 9,015 10,065 0 0 Cumulative Open Requests < 9 Months 1,406 2,727 3,890 4,873 5,782 6,593 7,325 8,075 8,940 9,956 0 0
Percentage 99% 99% 99% 99% 99% 99% 99% 99% 99% 99% 0% 0%
Backup Service Requests
Total Backup Requests 283 513 760 1,023 1,335 1,711 2,057 2,385 2,763 3,045 0 0 Backup Requests Responded to Within 4 Hours 245 465 704 960 1,246 1,595 1,921 2,229 2,569 2,836 0 0
Percentage 87% 91% 93% 94% 93% 93% 93% 93% 93% 93% 0% 0%
Weighted Average 92.0% 94.1% 95.1% 95.7% 95.7% 95.7% 95.5% 95.8% 95.6% 95.5% 0% 0%
Service Drainage Backup 2014 91.75% Fully AchievesActual Requests Requests Requests 2015 91.66% Fully Achieves
Requests Customers 1-% Requests < 9 Months % Requests < 4 Hours %2014 9,611 240,280 96.00% 12,410 11,316 91.18% 4,083 3,597 88.10% Weighted Average Performance Goals2015 14,326 244,694 94.15% 11,237 10,524 93.65% 4,103 3,578 87.20%
Average 11,969 242,487 95.07% 11,824 10,920 92.42% 4,093 3,588 87.65%Exceptional Achieves > 96.0%
Weight 33% 33% 33% Commendable Achieves 93.7% to 95.9%Fully Achieves 90.0% to 93.6%Minimal Achieves 81.1% to 89.9%
Exceptional < 98% 107% < 96% 107% < 94% 107% Fails to Achieve < 81.0%Commendable < 96% 104% < 94% 104% < 91% 103%Fully = 92% 100% = 90% 100% = 88% 100%Minimal > 87% 95% > 85% 94% > 84% 95%Fails > 83% 90% > 81% 90% > 79% 90%
FY 2016
33

This page left blank intentionally.

$38,038.44
$41,864.41
$41,178.69
$42,446.65
$41,956.24
$44,927.34
$32,211.04
$36,865.39
$45,178.15
$51,754.40
$60,045.81
$40,059.34
$0.00
$10,000.00
$20,000.00
$30,000.00
$40,000.00
$50,000.00
$60,000.00
$70,000.00
May-15 Jun-15 Jul-15 Aug-15 Sep-15 Oct-15 Nov-15 Dec-15 Jan-16 Feb-16 Mar-16 Apr-16
P-CARD TOTAL SPEND DATE RANGE: MAY 31, 2015 TO APRIL 30, 2016
P-cards issued= 118 P-card By Division Total violation = N/A - Executive Office= 3 Operations Information Technology Division - Sales Tax = 0 - Legal=3 - Administration = 1 - Information Technology= 7 - Split charges = 0 - Human Resources=4 - Collections Systems = 16 - Lack of Receipts = 0 - Finance=5 - Drainage & Flood Protection = 10 - Personal expense = 0 - Treatment Facilities (Maintenance) = 13 - Late receipt = 0 Engineering Division - Collections System (Sanitary) = 5 - Unauthorized purchase = 0 - Regulaory & GIS = 2 - Support Services = 15 - Prepay = 0 - Development = 4 - Treatment Facilities = 20 -Substitute Receipts = 0 - Design & Construction = 6 - Performance = 4 - Travel Expenditures = 0 - Lack of Employee Signature = 0 - Lack of Supervisor Signature = 0 ORIGINAL REPORT CREATED BY: KEVIN SCHMIDT 4.13.2016
34

CONTRACT DATE RANGE 7/1/2015-6/30/20161/1/2016 - 6/30/2016
1/1/2016 - 12/31/2021
8/1/2015 - 7/31/2016
7/1/2015 - 6/30/2016
7/1/2015 - 6/30/2016
1/1/2015 - 12/31/2015
9/1/2015 - 8/31/2016
8/1/2015 - 7/31/2016
06/23/2015-06/30/2016
PURCHASE ORDER VALUE 2,666,132.00$ $ 1,323,300.00 $ 1,296,583.00 1,056,821.82$ 975,234.00$ 955,333.00$ $ 937,500.00 881,660.00$ $ 753,500.00 $ 1,078,000.00
Contract Title / Company Name
*Polymer Emulsion /Mannich
(Polydyne, Inc.)
Onsite Vehicle & Parts Supply Mgmt (NAPA Genuine
Auto Parts)
Supply of Natural Gas to MFWQTC (Constellation New Energy)
Sodium Hypochlorite (Chemical
Resources, Inc.)
Removal, Hauling & Dumping of
Biosolids (C & J Waste Mgmt, Inc.)
Commercial Vacuum &
Waterblasting (C & J Waste Mgmt, Inc.)
Collection Systems Tele-Inspection &
Cleaning (Robinson Pipe
Cleaning)
Fleet Fuel Credit Card Services
(Wex, Inc.)
Temporary Personal Services (Power Staffing)
IT Consulting Services
(Teksystems, Inc.)
TOTAL SPEND BY CONTRACT EFFECTIVE AND EXPIRATION DATE 1,731,340.46$ -$ -$ 481,638.42$ 638,595.95$ 224,180.34$ 1,032,777.97$ 369,736.49$ 101,809.45$ 751,204.20$ % SPEND 64.9% 0.0% 0.0% 45.6% 65.5% 23.5% 110.2% 41.9% 13.5% 69.7%TOTAL SPEND BY FISCAL YEAR 2016EFFECTIVE JULY 1, 2015 1,731,340.46$ -$ -$ 481,638.42$ 638,595.95$ 224,180.34$ 1,032,777.97$ 369,736.49$ 101,809.45$ 751,204.20$
REVIEW PERIOD: CONTRACT EFFECTIVE DATE THROUGH 4/30/2016TWELVE MONTH TOTAL SPEND BY PURCHASE ORDERPURCHASING TOP 10 GOODS & SERVICES CONTRACTS
TOTAL SPEND BY CONTRACT EFFECTIVE AND EXPIRATION DATE
$0.00
$500,000.00
$1,000,000.00
$1,500,000.00
$2,000,000.00
$2,500,000.00
$3,000,000.00
Polymer Emulsion & Mannich
Onsite Vehicle & Parts Supply Mgmt
Supply of Natural Gas to MFWQTC
Sodium Hypochlorite Removal, Hauling & Dumping of Biosolids
Commercial Vacuum &Waterblasting
Collection Systems Tele-Inspection &
Cleaning
Wex, Inc. Temporary Personal Service
CONTRACT VALUE TOTAL SPEND SPEND BY FY16
Chart Created by: KEVIN SCHMIDT 5/11/2016
35

MBE
WBE
All Others
Total Expense
18.01%
11.51%
70.48%
$17,909,894.00
14.60%
6.31%
79.09%
$109,278,051.00
4.64%
8.30%
87.06%
$27,009,470.00
MBE/ WBE Expenditure Report YTD July 1, 2015 - April 30, 2016
Goods & Services
Construction Services
Professional Services
CHART CREATED BY: K.SCHMIDT 5/11/16
36

Construction Change Order Variance Report
Kevin SchmidtMay 2016
MONTH TOTAL ORIGINAL
AMOUNT TOTAL CHANGE
ORDER AMOUNTVARIANCE MONTH
TOTAL ORIGINAL AMOUNT
TOTAL CHANGE ORDER AMOUNT
VARIANCE MONTH TOTAL ORIGINAL
AMOUNT TOTAL CHANGE
ORDER AMOUNTVARIANCE
Jul-13 $ 8,770,873.80 $ 173,168.07 1.974% Jul-14 $ - $ - Jul-15 $ 99,092,486.14 $ 1,229,573.70 1.241%
Aug-13 8,385,039.37$ $ 365,306.60 4.357% Aug-14 21,879,391.91$ $ 173,051.97 0.791% Aug-15 38,538,217.88$ $ 101,142.17 0.262%
Sep-13 10,028,930.24$ $ 457,927.11 4.566% Sep-14 5,944,965.00$ $ 90,201.18 1.517% Sep-15 127,426,508.52$ $ 1,345,304.87 1.056%
Oct-13 $ 730,000.00 $ 275,000.00 37.671% Oct-14 $ 8,447,257.96 $ 156,897.30 1.857% Oct-15 $ 60,444,554.35 $ 595,535.39 0.985%
Nov-13 $ 8,419,074.00 231,499.27$ 2.750% Nov-14 $ 576,704.00 20,565.00$ 3.566% Nov-15 $ 7,972,084.50 341,579.79$ 4.285%
Dec-13 1,465,659.51$ 79,615.04$ 5.432% Dec-14 1,886,530.51$ 116,550.25$ 6.178% Dec-15 14,667,622.49$ 780,243.77$ 5.319%
Jan-14 $ 1,901,221.25 34,878.03$ 1.835% Jan-15 $ 8,291,197.84 31,601.06$ 0.381% Jan-16 $ 40,703,145.00 2,704,437.62$ 6.644%
Feb-14 23,166,502.69$ 265,335.71$ 1.145% Feb-15 19,345,124.19$ 146,495.95$ 0.757% Feb-16 44,036,056.00$ 294,389.39$ 0.669%
Mar-14 56,422,131.91$ 407,874.46$ 0.723% Mar-15 -$ -$ Mar-16 48,065,656.29$ 389,599.01$ 0.811%
Apr-14 1,333,650.00$ 279,820.78$ 20.982% Apr-15 -$ -$ Apr-16 55,008,508.29$ 4,896,288.88$ 8.901%
May-14 12,081,937.93$ 598,416.11$ 4.953% May-15 10,813,550.00$ 334,628.00$ 3.095% May-16
Jun-14 831,912.00$ 115,686.00$ 13.906% Jun-15 38,532,000.00$ 6,217.88$ 0.016% Jun-16
TOTAL 133,536,932.70$ 3,284,527.18$ 2.460% TOTAL 115,716,721.41$ 1,076,208.59$ 0.930% TOTAL 535,954,839.46$ 12,678,094.59$ 2.366%
FY14 FY15 FY16
0.000%
5.000%
10.000%
15.000%
20.000%
25.000%
30.000%
35.000%
40.000%
Jul-15 Aug-15 Sep-15 Oct-15 Nov-15 Dec-15 Jan-16 Feb-16 Mar-16 Apr-16 May-16 Jun-16
Construction Change Order Variances
FY14
FY15
FY16
37

BOARD APPROVALS FOR OPERATING AND CAPITAL EXPENDITURES
Submitted by: Patrick Meador5/18/2016
BOARD MEETING ACTIONS 4-25-16DESCRIPTION DEPARTMENT ACCOUNT OPERATING CAPITAL
Anthem Blue Cross / Blue Shield of KY / Medical Coverages All Divisions 51500 - Medical $6,270,578Mason Tilman Associates / Disparity Study 5110311 - Executive 52195 - Other Contractual Services $590,529Basham Construction & Rental Co / Camp Taylor Sanitary Sewer Replcmnt H13142 - Eng Design / Construction 56216 - Construction $7,470,000MAC Construction & Excavating / Camp Taylor Sanitary Sewer Replcmnt H12196 - Eng Design / Construction 56216 - Construction $7,791,000MAC Construction & Excavating / Clifton Heights CSO Storage Basin H09123 - Eng Design / Construction 56216 - Construction $23,589,000
April Totals $6,861,107 $38,850,000
Y-T-D TOTALS $9,634,496 $73,317,063
38

BOARD APPROVALS FOR OPERATING AND CAPITAL EXPENDITURES
Submitted by: Patrick Meador5/18/2016
2016 July August September October November December January February March April May June Total Percentage
Operating 2,106,697 3,671,508 5,341,858 5,741,858 7,165,158 8,461,741 8,461,741 8,461,741 9,634,496 16,495,603 0 0 16,495,603 13%Capital 10,546,131 16,194,205 23,297,078 28,688,287 42,606,221 56,277,743 60,907,826 66,644,603 73,317,063 112,167,063 0 0 112,167,063 87%
Total 12,652,828 19,865,713 28,638,936 34,430,145 49,771,379 64,739,484 69,369,567 75,106,344 82,951,559 128,662,666 0 0 128,662,666 100%
2015 July August September October November December January February March April May June Total Percentage
Operating 524,000 524,000 4,560,001 4,894,791 4,894,791 5,316,592 5,316,592 5,316,592 12,716,704 17,702,399 17,952,399 17,952,399 22,442,272 10%Capital 29,727,349 37,575,374 51,075,622 57,562,224 63,533,667 103,544,367 116,570,966 165,843,622 168,830,878 173,735,754 177,090,644 177,090,644 196,134,107 90%
Total 30,251,349 38,099,374 55,635,623 62,457,015 68,428,458 108,860,959 121,887,558 171,160,214 181,547,582 191,438,153 195,043,043 195,043,043 218,576,379 100%
0
20,000,000
40,000,000
60,000,000
80,000,000
100,000,000
120,000,000
140,000,000
160,000,000
180,000,000
July August September October November December January February March April May June
FY13 Operating
FY14 Operating
FY15 Operating
FY16 Operating
FY13 Capital
FY14 Capital
FY15 Capital
FY16 Capital
FY13 Operating
FY14 Operating
FY15 Operating
FY13 Capital
FY14 Capital
FY15 Capital
Fiscal Years Comparison - YTD Approvals FY 2013 through FY 2016
39
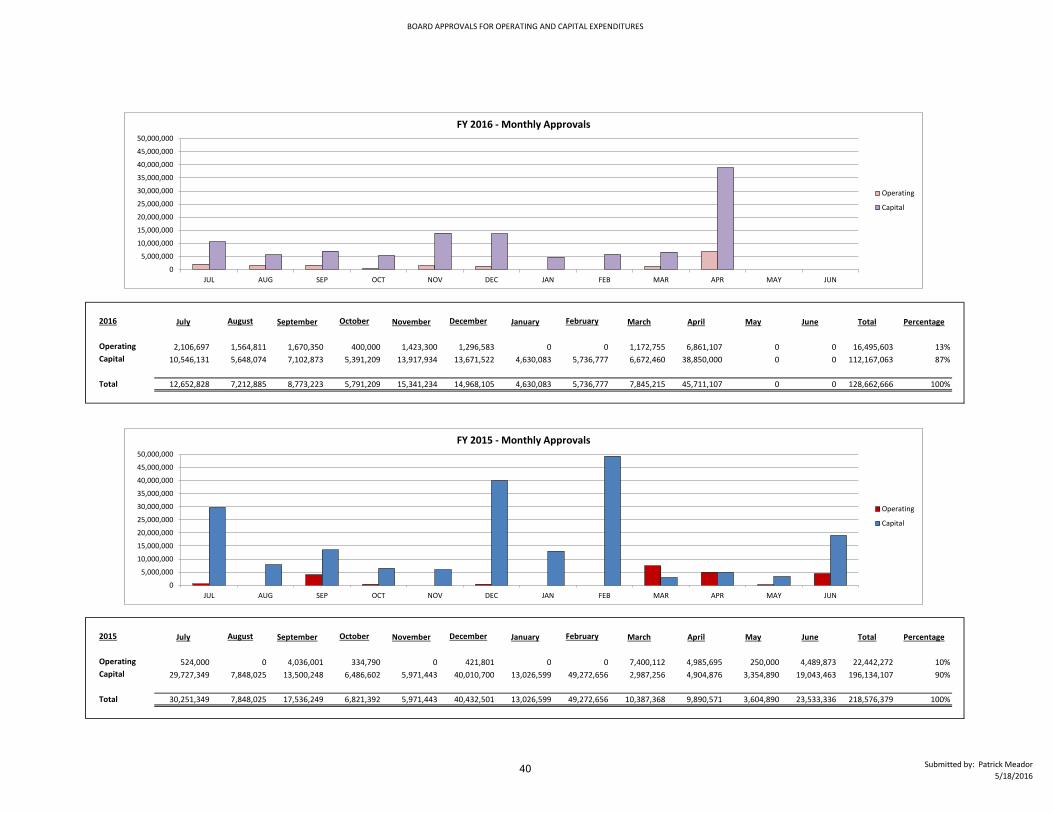
BOARD APPROVALS FOR OPERATING AND CAPITAL EXPENDITURES
Submitted by: Patrick Meador5/18/2016
2016 July August September October November December January February March April May June Total Percentage
Operating 2,106,697 1,564,811 1,670,350 400,000 1,423,300 1,296,583 0 0 1,172,755 6,861,107 0 0 16,495,603 13%Capital 10,546,131 5,648,074 7,102,873 5,391,209 13,917,934 13,671,522 4,630,083 5,736,777 6,672,460 38,850,000 0 0 112,167,063 87%
Total 12,652,828 7,212,885 8,773,223 5,791,209 15,341,234 14,968,105 4,630,083 5,736,777 7,845,215 45,711,107 0 0 128,662,666 100%
2015 July August September October November December January February March April May June Total Percentage
Operating 524,000 0 4,036,001 334,790 0 421,801 0 0 7,400,112 4,985,695 250,000 4,489,873 22,442,272 10%Capital 29,727,349 7,848,025 13,500,248 6,486,602 5,971,443 40,010,700 13,026,599 49,272,656 2,987,256 4,904,876 3,354,890 19,043,463 196,134,107 90%
Total 30,251,349 7,848,025 17,536,249 6,821,392 5,971,443 40,432,501 13,026,599 49,272,656 10,387,368 9,890,571 3,604,890 23,533,336 218,576,379 100%
0
5,000,000
10,000,000
15,000,000
20,000,000
25,000,000
30,000,000
35,000,000
40,000,000
45,000,000
50,000,000
JUL AUG SEP OCT NOV DEC JAN FEB MAR APR MAY JUN
Operating
Capital
FY 2015 - Monthly Approvals
0
5,000,000
10,000,000
15,000,000
20,000,000
25,000,000
30,000,000
35,000,000
40,000,000
45,000,000
50,000,000
JUL AUG SEP OCT NOV DEC JAN FEB MAR APR MAY JUN
Operating
Capital
FY 2016 - Monthly Approvals
40

BOARD APPROVALS FOR OPERATING AND CAPITAL EXPENDITURES
Submitted by: Patrick Meador5/18/2016
2014 July August September October November December January February March April May June Total Percentage
Operating 2,302,983 550,000 4,551,800 2,980,411 432,070 165,481 138,900 2,012,553 0 5,962,221 990,473 3,937,929 24,024,821 16%Capital 2,113,288 13,943,361 18,736,868 9,631,679 7,536,570 6,546,055 5,581,419 3,163,120 2,201,305 38,532,000 13,480,504 2,076,865 123,543,034 84%
Total 4,416,271 14,493,361 23,288,668 12,612,090 7,968,640 6,711,536 5,720,319 5,175,673 2,201,305 44,494,221 14,470,977 6,014,794 147,567,855 100%
2013 July August September October November December January February March April May June Total Percentage
Operating 8,401,404 0 629,646 125,000 1,840,075 113,750 355,563 2,603,498 420,014 5,956,454 563,258 2,051,234 23,059,896 25%Capital 3,080,181 8,787,007 10,081,966 9,317,696 19,300,516 8,300,000 384,492 2,661,294 3,266,098 3,556,384 1,235,534 886,861 70,858,029 75%
Total 11,481,585 8,787,007 10,711,612 9,442,696 21,140,591 8,413,750 740,055 5,264,792 3,686,112 9,512,838 1,798,792 2,938,095 93,917,925 100%
0 5,000,000
10,000,000 15,000,000 20,000,000 25,000,000 30,000,000 35,000,000 40,000,000 45,000,000 50,000,000
JUL AUG SEP OCT NOV DEC JAN FEB MAR APR MAY JUN
Operating
Capital
FY 2013 - Monthly Approvals
0
5,000,000
10,000,000
15,000,000
20,000,000
25,000,000
30,000,000
35,000,000
40,000,000
45,000,000
50,000,000
JUL AUG SEP OCT NOV DEC JAN FEB MAR APR MAY JUN
Operating
Capital
FY 2014 - Monthly Approvals
41

700 West Liberty Street
Louisville, KY 40203-1911
LouisvilleMSD.org
24/7 Customer Relations
502-587-0603
A publication of MSD Finance Department.