financial report everything food made easy
TRANSCRIPT

Everything Food Made Easy
Financial Report 2020
C O N T E N T S
01 Directors’ Statement
03 Independent Auditors’ Report
06 Statements of Financial Position
07 Statements of Profit or Loss
08 Statements of Comprehensive Income
09 Consolidated Statement of Changes in Equity
11 Statement of Changes in Equity
13 Consolidated Statement of Cash Flows
15 Notes to the Financial Statements

01EVERYTHING FOOD MADE EASY
Directors’ Statement
The Directors present this annual report to the members together with the audited financial statements of NTUC Fairprice Co-operative Limited (the “Co-operative”) for the financial year ended 31 December 2020.
In our opinion:
(a) the financial statements set out on pages 6 to 84 are drawn up so as to give a true and fair view of the state of affairs of the Group and the Co-operative as at 31 December 2020 and of the results, changes in equity of the Group and the Co-operative and cash flows of the Group for the year ended on that date in accordance with the provisions of the Co-operative Societies Act, Chapter 62 (the “Act”) and Singapore Financial Reporting Standards;
(b) at the date of this statement, there are reasonable grounds to believe that the Co-operative will be able to pay its debts when they fall due; and
(c) the receipts, expenditure, investment of monies, acquisition and disposal of assets made by the Co-operative during the year ended 31 December 2020 have been made in accordance with the By-Laws of the Co-operative and the provisions of the Act and the Rules (made under section 95 of the Act).
The Board of Directors has, on the date of this statement, authorised these financial statements for issue.
(a) Directors
The Directors of the Co-operative in office at the date of this statement are as follows:
Bobby Chin Yoke Choong Stephen Lim Beng Lin Ronald Ong Whatt Soon Albert Cheng Yong Kim Lim Sau Hoong Kristy Tan Ruyan Lee Seow Hiang Ho Wah Lee Kee Teck Koon Tan Hwee Bin (Appointed on 22 Jun 2020)Ong Hwee Liang (Appointed on 22 Jun 2020)Robert Yap Min Choy (Appointed on 10 Aug 2020)
(b) Arrangements to enable Directors to acquire shares or debentures
Neither at the end of, nor at any time during the financial year, was the Co-operative a party to any arrangement whose object is to enable the Directors of the Co-operative to acquire benefits by means of the acquisition of shares in or debentures of the Co-operative or any other body corporate.
FairPrice Group Financial Report 202002
Directors’ Statement
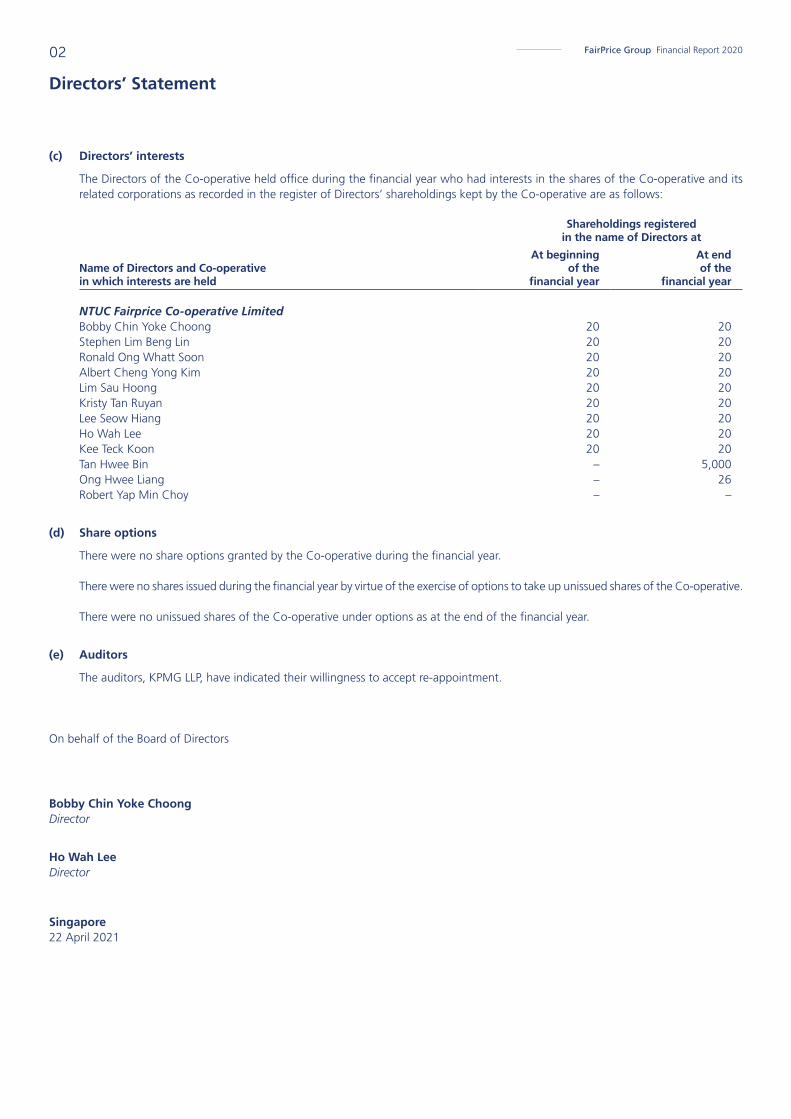
(c) Directors’ interests
The Directors of the Co-operative held office during the financial year who had interests in the shares of the Co-operative and its related corporations as recorded in the register of Directors’ shareholdings kept by the Co-operative are as follows:
Shareholdings registeredin the name of Directors at
Name of Directors and Co-operativein which interests are held
At beginning of the
financial year
At end of the
financial year
NTUC Fairprice Co-operative Limited Bobby Chin Yoke Choong 20 20Stephen Lim Beng Lin 20 20Ronald Ong Whatt Soon 20 20Albert Cheng Yong Kim 20 20Lim Sau Hoong 20 20Kristy Tan Ruyan 20 20Lee Seow Hiang 20 20Ho Wah Lee 20 20Kee Teck Koon 20 20Tan Hwee Bin – 5,000Ong Hwee Liang – 26Robert Yap Min Choy – –
(d) Share options
There were no share options granted by the Co-operative during the financial year.
There were no shares issued during the financial year by virtue of the exercise of options to take up unissued shares of the Co-operative.
There were no unissued shares of the Co-operative under options as at the end of the financial year.
(e) Auditors
The auditors, KPMG LLP, have indicated their willingness to accept re-appointment.
On behalf of the Board of Directors
Bobby Chin Yoke Choong Director
Ho Wah Lee Director
Singapore22 April 2021

03EVERYTHING FOOD MADE EASY
Independent Auditors’ ReportMembers of the Co-operativeNTUC Fairprice Co-operative Limited
Report on the audit of financial statements
Opinion
We have audited the financial statements of NTUC Fairprice Co-operative Limited (‘the Co-operative’) and its subsidiaries (‘the Group’), which comprise the consolidated statement of financial position of the Group and the statement of financial position of the Co-operative as at 31 December 2020, and the consolidated statement of profit or loss, consolidated statement of comprehensive income, consolidated statement of changes in equity and consolidated statement of cash flows of the Group and statement of profit or loss, statement of comprehensive income and statement of changes in equity of the Co-operative for the year then ended, and notes to the financial statements, including a summary of significant accounting policies, as set out on pages 6 to 84.
In our opinion, the accompanying consolidated financial statements of the Group and the statement of financial position, statement of profit or loss, statement of comprehensive income and statement of changes in equity of the Co-operative are properly drawn up in accordance with the provisions of the Co-operative Societies Act, Chapter 62 (‘the Act’) and Financial Reporting Standards in Singapore (‘FRSs’) so as to give a true and fair view of the state of affairs of the Group and the Co-operative as at 31 December 2020 and of the results and changes in equity of the Group and the Co-operative and consolidated cash flows of the Group for the year ended on that date.
Basis for opinion
We conducted our audit in accordance with Singapore Standards on Auditing (‘SSAs’). Our responsibilities under those standards are further described in the ‘Auditors’ responsibilities for the audit of the financial statements’ section of our report. We are independent of the Group in accordance with the Accounting and Corporate Regulatory Authority Code of Professional Conduct and Ethics for Public Accountants and Accounting Entities (‘ACRA Code’) together with the ethical requirements that are relevant to our audit of the financial statements in Singapore, and we have fulfilled our other ethical responsibilities in accordance with these requirements and the ACRA Code. We believe that the audit evidence we have obtained is sufficient and appropriate to provide a basis for our opinion.
Other information
Management is responsible for the other information contained in the annual report. Other information is defined as all information in the annual report other than the financial statements and our auditors’ report thereon. We have obtained all other information prior to the date of this auditors’ report.
Our opinion on the financial statements does not cover the other information and we do not express any form of assurance conclusion thereon.
In connection with our audit of the financial statements, our responsibility is to read the other information and, in doing so, consider whether the other information is materially inconsistent with the financial statements or our knowledge obtained in the audit or otherwise appears to be materially misstated. If, based on the work we have performed, we conclude that there is a material misstatement of this other information, we are required to report that fact. We have nothing to report in this regard.

FairPrice Group Financial Report 202004
Independent Auditors’ ReportMembers of the Co-operativeNTUC Fairprice Co-operative Limited
Responsibilities of management and directors for the financial statements
Management is responsible for the preparation of financial statements that give a true and fair view in accordance with the provisions of the Act and FRSs, and for such internal controls as management determines is necessary to enable the preparation of financial statements that are free from material misstatement, whether due to fraud or error.
In preparing the financial statements, management is responsible for assessing the Group’s ability to continue as a going concern, disclosing, as applicable, matters related to going concern and using the going concern basis of accounting unless management either intends to liquidate the Group or to cease operations, or has no realistic alternative but to do so.
The directors’ responsibilities include overseeing the Group’s financial reporting process.
Auditors’ responsibilities for the audit of the financial statements
Our objectives are to obtain reasonable assurance about whether the financial statements as a whole are free from material misstatement, whether due to fraud or error, and to issue an auditors’ report that includes our opinion. Reasonable assurance is a high level of assurance, but is not a guarantee that an audit conducted in accordance with SSAs will always detect a material misstatement when it exists. Misstatements can arise from fraud or error and are considered material if, individually or in the aggregate, they could reasonably be expected to influence the economic decisions of users taken on the basis of these financial statements.
As part of an audit in accordance with SSAs, we exercise professional judgement and maintain professional scepticism throughout the audit. We also:
• Identify and assess the risks of material misstatement of the financial statements, whether due to fraud or error, design and perform audit procedures responsive to those risks, and obtain audit evidence that is sufficient and appropriate to provide a basis for our opinion. The risk of not detecting a material misstatement resulting from fraud is higher than for one resulting from error, as fraud may involve collusion, forgery, intentional omissions, misrepresentations, or the override of internal controls.
• Obtain an understanding of internal controls relevant to the audit in order to design audit procedures that are appropriate in the
circumstances, but not for the purpose of expressing an opinion on the effectiveness of the Group’s internal controls.
• Evaluate the appropriateness of accounting policies used and the reasonableness of accounting estimates and related disclosures made by management.
• Conclude on the appropriateness of management’s use of the going concern basis of accounting and, based on the audit evidence obtained, whether a material uncertainty exists related to events or conditions that may cast significant doubt on the Group’s ability to continue as a going concern. If we conclude that a material uncertainty exists, we are required to draw attention in our auditors’ report to the related disclosures in the financial statements or, if such disclosures are inadequate, to modify our opinion. Our conclusions are based on the audit evidence obtained up to the date of our auditors’ report. However, future events or conditions may cause the Group to cease to continue as a going concern.
• Evaluate the overall presentation, structure and content of the financial statements, including the disclosures, and whether the financial statements represent the underlying transactions and events in a manner that achieves fair presentation.
• Obtain sufficient appropriate audit evidence regarding the financial information of the entities or business activities within the Group to express an opinion on the consolidated financial statements. We are responsible for the direction, supervision and performance of the group audit. We remain solely responsible for our audit opinion.
We communicate with the directors regarding, among other matters, the planned scope and timing of the audit and significant audit findings, including any significant deficiencies in internal controls that we identify during our audit.
05EVERYTHING FOOD MADE EASY
Independent Auditors’ ReportMembers of the Co-operativeNTUC Fairprice Co-operative Limited
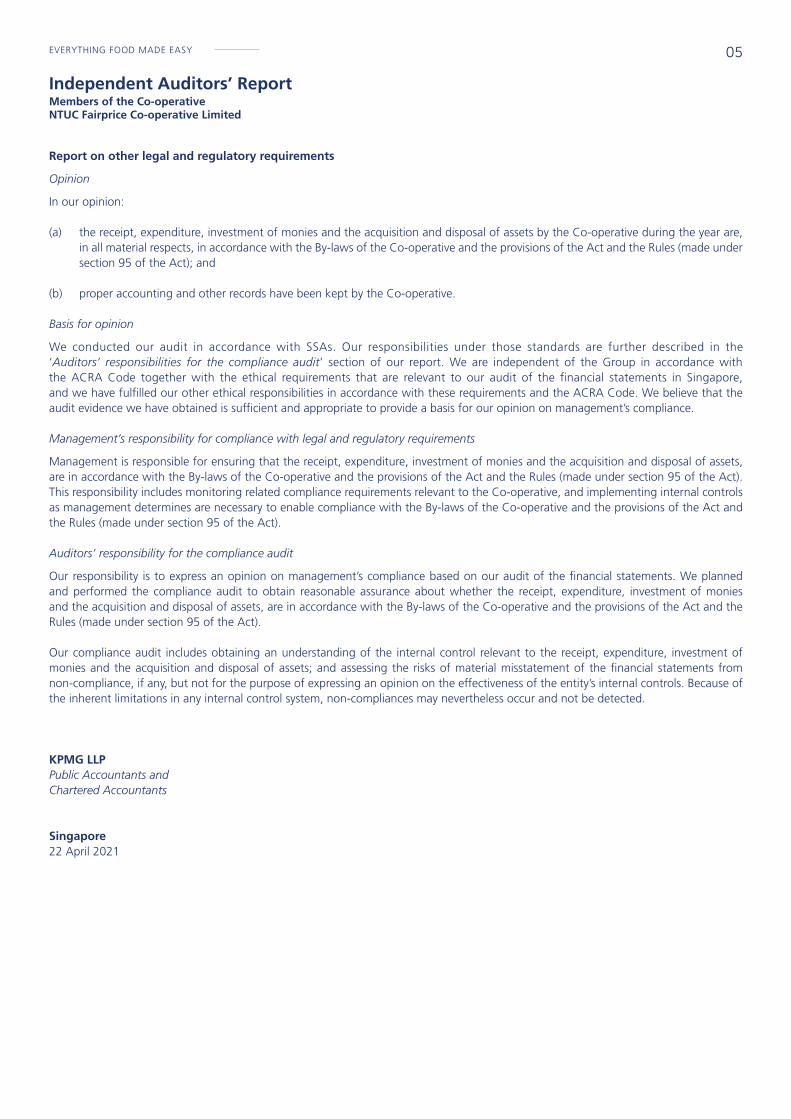
Report on other legal and regulatory requirements
Opinion
In our opinion:
(a) the receipt, expenditure, investment of monies and the acquisition and disposal of assets by the Co-operative during the year are, in all material respects, in accordance with the By-laws of the Co-operative and the provisions of the Act and the Rules (made under section 95 of the Act); and
(b) proper accounting and other records have been kept by the Co-operative. Basis for opinion
We conducted our audit in accordance with SSAs. Our responsibilities under those standards are further described in the ‘Auditors’ responsibilities for the compliance audit’ section of our report. We are independent of the Group in accordance with the ACRA Code together with the ethical requirements that are relevant to our audit of the financial statements in Singapore, and we have fulfilled our other ethical responsibilities in accordance with these requirements and the ACRA Code. We believe that the audit evidence we have obtained is sufficient and appropriate to provide a basis for our opinion on management’s compliance.
Management’s responsibility for compliance with legal and regulatory requirements
Management is responsible for ensuring that the receipt, expenditure, investment of monies and the acquisition and disposal of assets, are in accordance with the By-laws of the Co-operative and the provisions of the Act and the Rules (made under section 95 of the Act). This responsibility includes monitoring related compliance requirements relevant to the Co-operative, and implementing internal controls as management determines are necessary to enable compliance with the By-laws of the Co-operative and the provisions of the Act and the Rules (made under section 95 of the Act).
Auditors’ responsibility for the compliance audit
Our responsibility is to express an opinion on management’s compliance based on our audit of the financial statements. We planned and performed the compliance audit to obtain reasonable assurance about whether the receipt, expenditure, investment of monies and the acquisition and disposal of assets, are in accordance with the By-laws of the Co-operative and the provisions of the Act and the Rules (made under section 95 of the Act).
Our compliance audit includes obtaining an understanding of the internal control relevant to the receipt, expenditure, investment of monies and the acquisition and disposal of assets; and assessing the risks of material misstatement of the financial statements from non-compliance, if any, but not for the purpose of expressing an opinion on the effectiveness of the entity’s internal controls. Because of the inherent limitations in any internal control system, non-compliances may nevertheless occur and not be detected.
KPMG LLPPublic Accountants andChartered Accountants
Singapore22 April 2021

FairPrice Group Financial Report 202006
Statements of Financial Position As at 31 December 2020
GROUP CO-OPERATIVENote 2020 2019 2020 2019
$’000 $’000 $’000 $’000
Non-current assets Property, plant and equipment 4 620,598 629,107 432,903 419,563Right-of-use assets 5 1,432,285 1,446,600 1,174,303 1,151,933Investment properties 6 3,116 8,746 – –Intangible assets 7 251,763 323,499 10,136 12,286Subsidiaries 8 – – 310,477 378,827Associates 9 894,494 869,355 990,889 968,120Other investments 10 1,472,486 1,325,925 1,467,014 1,201,728Trade and other receivables 11 12,346 10,790 127,417 75,634
Total non-current assets 4,687,088 4,614,022 4,513,139 4,208,091 Current assets Other investments 10 – 239,401 – 236,985Trade and other receivables 11 280,431 128,438 248,865 73,163Inventories 12 356,611 298,763 337,937 278,098Cash and cash equivalents 13 618,869 414,535 477,456 279,488
Total current assets 1,255,911 1,081,137 1,064,258 867,734
Total assets 5,942,999 5,695,159 5,577,397 5,075,825 Equity Share capital 14 436,205 436,740 436,205 436,740Retained earnings 2,107,594 1,944,755 1,958,374 1,770,673Other reserves 15 127,012 379,070 126,212 304,774
Equity attributable to members of the Co-operative 2,670,811 2,760,565 2,520,791 2,512,187Non-controlling interests 8 4,623 4,184 – –
Total equity 2,675,434 2,764,749 2,520,791 2,512,187 Non-current liabilities Borrowings 16 414,005 267,490 414,005 267,000Lease liabilities 17 1,229,131 1,199,066 1,033,658 1,003,503Provisions 18 51,152 53,211 39,737 40,907Deferred tax liabilities 19 23,173 23,389 – –Trade and other payables 20 7,452 10,740 – –
Total non-current liabilities 1,724,913 1,553,896 1,487,400 1,311,410
Current liabilities Borrowings 16 40,000 88,744 40,000 80,000Lease liabilities 17 257,283 271,366 174,153 167,712Trade and other payables 20 1,244,937 1,014,922 1,355,053 1,004,516Current tax liabilities 432 1,482 – –
Total current liabilities 1,542,652 1,376,514 1,569,206 1,252,228
Total liabilities 3,267,565 2,930,410 3,056,606 2,563,638
Total liabilities and equity 5,942,999 5,695,159 5,577,397 5,075,825
The accompanying notes form an integral part of these financial statements.
07EVERYTHING FOOD MADE EASY
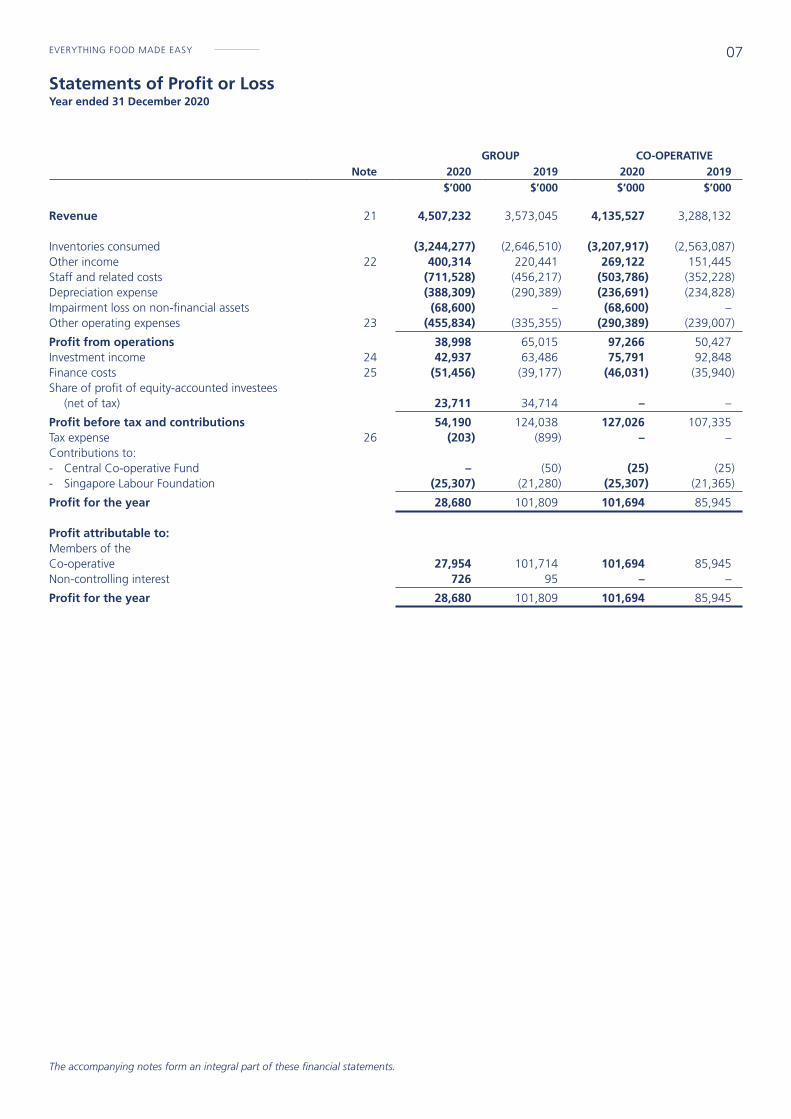
Statements of Profit or Loss Year ended 31 December 2020
GROUP CO-OPERATIVENote 2020 2019 2020 2019
$’000 $’000 $’000 $’000
Revenue 21 4,507,232 3,573,045 4,135,527 3,288,132 Inventories consumed (3,244,277) (2,646,510) (3,207,917) (2,563,087)Other income 22 400,314 220,441 269,122 151,445Staff and related costs (711,528) (456,217) (503,786) (352,228)Depreciation expense (388,309) (290,389) (236,691) (234,828)Impairment loss on non-financial assets (68,600) – (68,600) –Other operating expenses 23 (455,834) (335,355) (290,389) (239,007)
Profit from operations 38,998 65,015 97,266 50,427Investment income 24 42,937 63,486 75,791 92,848Finance costs 25 (51,456) (39,177) (46,031) (35,940)Share of profit of equity-accounted investees (net of tax) 23,711 34,714 – –
Profit before tax and contributions 54,190 124,038 127,026 107,335Tax expense 26 (203) (899) – –Contributions to: - Central Co-operative Fund – (50) (25) (25)- Singapore Labour Foundation (25,307) (21,280) (25,307) (21,365)
Profit for the year 28,680 101,809 101,694 85,945 Profit attributable to: Members of the Co-operative 27,954 101,714 101,694 85,945Non-controlling interest 726 95 – –
Profit for the year 28,680 101,809 101,694 85,945
The accompanying notes form an integral part of these financial statements.

FairPrice Group Financial Report 202008
Statements of Comprehensive IncomeYear ended 31 December 2020
GROUP CO-OPERATIVE 2020 2019 2020 2019
$’000 $’000 $’000 $’000
Profit for the year 28,680 101,809 101,694 85,945 Other comprehensive income Items that will not be reclassified to profit or loss Equity investments at FVOCI - net change in fair value (38,890) 144,075 (14,124) 133,542 Items that are or may be reclassified subsequently to profit or loss Debt investments at FVOCI - net change in fair value (800) 9,438 (742) 9,438Debt investments at FVOCI - reclassified to profit or loss (6,587) (18) (6,587) (18)
Other comprehensive income for the year, net of tax (46,277) 153,495 (21,453) 142,962
Total comprehensive income for the year (17,597) 255,304 80,241 228,907 Total comprehensive income attributable to: Members of the Co-operative (18,117) 255,177 80,241 228,907Non-controlling interest 520 127 – –
Total comprehensive income for the year (17,597) 255,304 80,241 228,907
The accompanying notes form an integral part of these financial statements.

09EVERYTHING FOOD MADE EASY
Consolidated Statement of Changes in EquityYear ended 31 December 2020
Attributable to members of the Co-operative
Note Share
capitalRetained earnings
Fair value
reserve
Foreign currency
translation reserve
Capital reserve Total
Non-controlling
interestTotal
equity
$’000 $’000 $’000 $’000 $’000 $’000 $’000 $’000
GROUP
At 1 January 2019 437,864 1,892,584 247,269 (276) – 2,577,441 – 2,577,441Adjustment on initial application
of FRS 116 (net of tax) – – – – – – – –
Adjusted balance at 1 January 2019 437,864 1,892,584 247,269 (276) – 2,577,441 – 2,577,441
Total comprehensive income for the year
Profit for the year – 101,714 – – – 101,714 95 101,809
Other comprehensive incomeNet change in fair value: - equity investments at FVOCI – – 144,043 – – 144,043 32 144,075- debt investments at FVOCI – – 9,438 – – 9,438 – 9,438Debt investments at FVOCI –
reclassified to profit or loss – – (18) – – (18) – (18)
Total other comprehensive income – – 153,463 – – 153,463 32 153,495
Total comprehensive income for the year – 101,714 153,463 – – 255,177 127 255,304
Transactions with owners, recognised directly in equity
Contributions by and distributions to owners
Acquisition of subsidiaries 31 – – – – 1,536 1,536 4,057 5,593Issue of shares 14 650 – – – – 650 – 650Redemption of shares 14 (1,774) – – – – (1,774) – (1,774)Payments relating to appropriations/
distributions approved by members of the Co-operative:
- Dividends 27 – (21,880) – – – (21,880) – (21,880) - Patronage rebates – (50,685) – – – (50,685) – (50,685)Write-back of Patronage rebates – 100 – – – 100 – 100
Total transactions with owners (1,124) (72,465) – – 1,536 (72,053) 4,057 (67,996)
Transfer of fair value reserve of equity investments at FVOCI upon disposal – 22,922 (22,922) – – – – –
At 31 December 2019 436,740 1,944,755 377,810 (276) 1,536 2,760,565 4,184 2,764,749
The accompanying notes form an integral part of these financial statements.

FairPrice Group Financial Report 202010
Consolidated Statement of Changes in Equity (cont’d)Year ended 31 December 2020
Attributable to members of the Co-operative
Note Share
capitalRetained earnings
Fair value
reserve
Foreign currency
translation reserve
Capital reserve Total
Non-controlling
interestTotal
equity
$’000 $’000 $’000 $’000 $’000 $’000 $’000 $’000
GROUP
At 1 January 2020 436,740 1,944,755 377,810 (276) 1,536 2,760,565 4,184 2,764,749
Total comprehensive income for the year
Profit for the year – 27,954 – – – 27,954 726 28,680
Other comprehensive incomeNet change in fair value: - equity investments at FVOCI – – (38,684) – – (38,684) (206) (38,890)- debt investments at FVOCI – – (800) – – (800) – (800)Debt investments at FVOCI –
reclassified to profit or loss – – (6,587) – – (6,587) – (6,587)
Total other comprehensive income – – (46,071) – – (46,071) (206) (46,277)
Total comprehensive income for the year – 27,954 (46,071) – – (18,117) 520 (17,597)
Transactions with owners, recognised directly in equity
Contributions by and distributions to owners
Issue of shares 14 670 – – – – 670 – 670Redemption of shares 14 (1,205) – – – – (1,205) – (1,205)Payments relating to
appropriations/distributions approved by members of the Co-operative:
- Dividends 27 – (21,587) – – – (21,587) (81) (21,668) - Patronage rebates – (49,630) – – – (49,630) – (49,630)Write-back of Patronage rebates – 115 – – – 115 – 115
Total transactions with owners (535) (71,102) – – – (71,637) (81) (71,718)
Transfer of fair value reserve of equity investments at FVOCI upon disposal – 205,987 (205,987) – – – – –
At 31 December 2020 436,205 2,107,594 125,752 (276) 1,536 2,670,811 4,623 2,675,434
The accompanying notes form an integral part of these financial statements.
11EVERYTHING FOOD MADE EASY
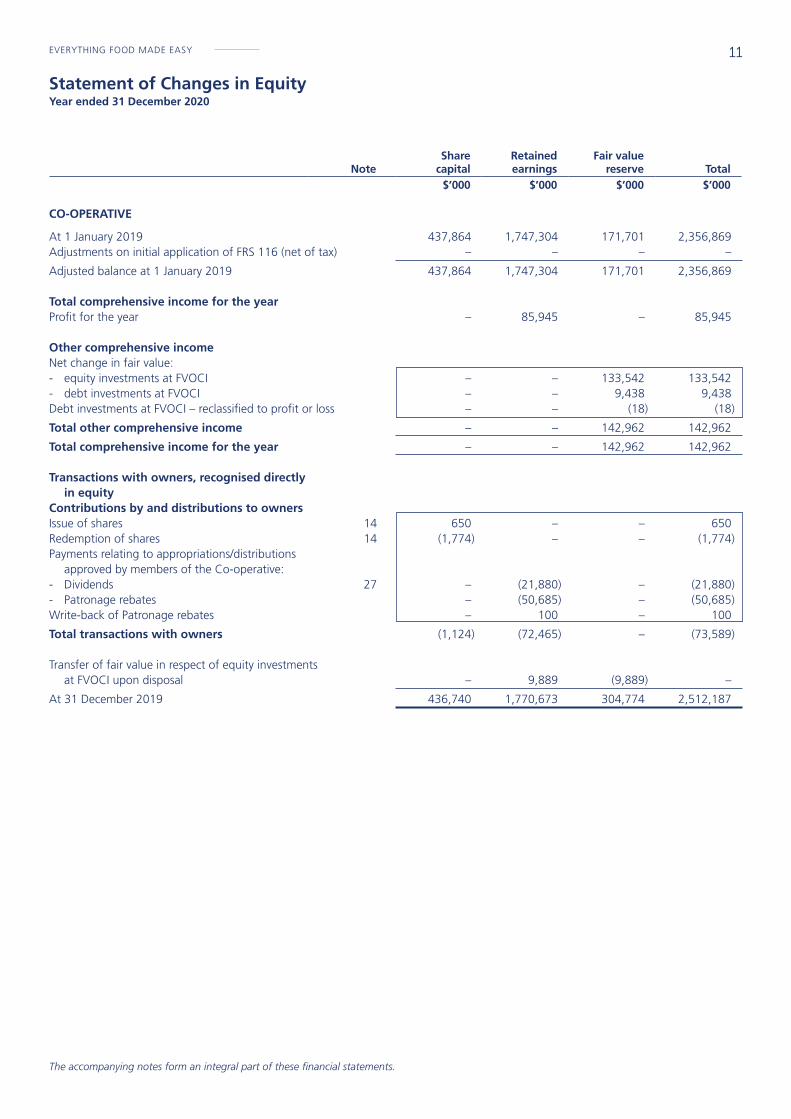
Statement of Changes in EquityYear ended 31 December 2020
NoteShare
capitalRetained earnings
Fair valuereserve Total
$’000 $’000 $’000 $’000 CO-OPERATIVE
At 1 January 2019 437,864 1,747,304 171,701 2,356,869Adjustments on initial application of FRS 116 (net of tax) – – – –
Adjusted balance at 1 January 2019 437,864 1,747,304 171,701 2,356,869 Total comprehensive income for the year Profit for the year – 85,945 – 85,945 Other comprehensive income Net change in fair value: - equity investments at FVOCI – – 133,542 133,542- debt investments at FVOCI – – 9,438 9,438Debt investments at FVOCI – reclassified to profit or loss – – (18) (18)
Total other comprehensive income – – 142,962 142,962
Total comprehensive income for the year – – 142,962 142,962 Transactions with owners, recognised directly in equity Contributions by and distributions to owners Issue of shares 14 650 – – 650Redemption of shares 14 (1,774) – – (1,774)Payments relating to appropriations/distributions approved by members of the Co-operative: - Dividends 27 – (21,880) – (21,880)- Patronage rebates – (50,685) – (50,685)Write-back of Patronage rebates – 100 – 100
Total transactions with owners (1,124) (72,465) – (73,589) Transfer of fair value in respect of equity investments at FVOCI upon disposal – 9,889 (9,889) –
At 31 December 2019 436,740 1,770,673 304,774 2,512,187
The accompanying notes form an integral part of these financial statements.

FairPrice Group Financial Report 202012
NoteShare
capitalRetained earnings
Fair valuereserve Total
$’000 $’000 $’000 $’000 CO-OPERATIVE
At 1 January 2020 436,740 1,770,673 304,774 2,512,187 Total comprehensive income for the year Profit for the year – 101,694 – 101,694 Other comprehensive income Net change in fair value: - equity investments at FVOCI – – (14,214) (14,214)- debt investments at FVOCI – – (742) (742)Debt investments at FVOCI – reclassified to profit or loss – – (6,587) (6,587)
Total other comprehensive income – – (21,453) (21,453)
Total comprehensive income for the year – – (21,453) (21,453) Transactions with owners, recognised directly in equity Contributions by and distributions to owners Issue of shares 14 670 – – 670Redemption of shares 14 (1,205) – – (1,205)Payments relating to appropriations/distributions approved by members of the Co-operative: - Dividends 27 – (21,587) – (21,587)- Patronage rebates – (49,630) – (49,630)Write-back of Patronage rebates – 115 – 115
Total transactions with owners (535) (71,102) – (71,637) Transfer of fair value in respect of equity investments at FVOCI upon disposal – 157,109 (157,109) –
At 31 December 2020 436,205 1,958,374 126,212 2,520,791
Statement of Changes in Equity (cont’d)Year ended 31 December 2020
The accompanying notes form an integral part of these financial statements.

13EVERYTHING FOOD MADE EASY
Note 2020 2019$’000 $’000
Cash flows from operating activities Profit before tax and contributions 54,190 124,038Adjustments for: Allowance for inventory obsolescence 9,425 –Amortisation of intangible assets 12,406 5,554Depreciation of property, plant and equipment 88,245 71,882Depreciation of right-of-use assets 300,064 218,453Depreciation of investment properties 248 54Gain on derecognition of right-of-use assets (245) (36)Gain on disposal of an associate – (1,154)Gain on disposal of debt investments – FVOCI (6,587) (18)Gain on disposal of investment property (6,618) –Intangible assets written-off 222 2,333Inventories written-off 44,881 27,725Loss on disposal of intangible assets 1,128 –Loss on disposal of property, plant and equipment 8,254 3,062Property, plant and equipment written off 2,593 –(Reversal of)/Impairment losses recognised on: - trade receivables 1,185 1,117- debt investments – FVOCI (309) (70)- intangible assets 68,600 –- investment in an associate – 1,428Share of profit of equity-accounted investees (23,711) (34,714)Dividend income (19,164) (40,717)Interest income (16,877) (21,527)Finance costs 51,456 39,177
569,386 396,587 Changes in: - Inventories (112,154) (44,391)- Trade and other receivables (258,453) 23,253- Trade and other payables 222,346 50,831- Provision (2,558) (1,345)
Cash generated from operations 418,567 424,935Contribution to Central Co-operative Fund paid (25) (50)Contribution to Singapore Labour Foundation paid (23,277) (23,563)Taxes paid (1,469) (1,375)
Net cash from operating activities 393,796 399,947 Cash flows from investing activities Acquisitions through business combinations (net of cash acquired) 31 – 32,067Additions in investments in associates (1,428) (2,482)Dividend received 19,164 40,717Interest received 19,553 21,326Proceeds from disposal of property, plant and equipment 1,256 1,304Proceeds from sale of investment property 12,000 –Proceeds from sale of other investments 154,550 203,783Purchase of property, plant and equipment (92,267) (96,309)Purchase of intangible assets (7,202) (2,557)Purchase of other investments – (179,609)
Net cash from investing activities 105,626 18,240
Consolidated Statement of Cash Flows Year ended 31 December 2020
The accompanying notes form an integral part of these financial statements.

FairPrice Group Financial Report 202014
Consolidated Statement of Cash Flows (cont’d)Year ended 31 December 2020
Note 2020 2019$’000 $’000
Cash flows from financing activities Dividends paid on members’ shares 27 (21,587) (21,880)Interest paid (51,456) (39,177)Fixed deposit pledged with bank – (129)Proceeds from issuance of shares 670 650Proceeds from borrowings 150,000 40,000Payment made for redemption of shares 14 (1,205) (1,774)Payment of patronage rebates to members (49,630) (50,470)Repayment of borrowings (52,229) (24,651)Payment of lease liabilities (269,522) (200,395)
Net cash used in financing activities (294,959) (297,826) Net increase in cash and cash equivalents 204,463 120,361Cash and cash equivalents at beginning of the year 414,406 294,045
Cash and cash equivalents at end of the year 13 618,869 414,406
Significant non-cash transactions:
• In 2019, the Group acquired subsidiaries, NTUC Foodfare Co-operative Limited and Kopitiam Investments Pte Ltd for a purchase consideration of $331,663,000. The acquisition was partially financed by loans of $267,000,000.
• Dividends amounting to $22,768,000 (2019: $22,045,000) were paid by an associate to the Group in the form of subscribing additional shares in the associate.
• During the year, the Group and Co-operative transferred investment portfolio amounting to $1,010,053,000 to Angsana Macro Fund (AMF) in exchange for 744,997,614 units in AMF which holds investments in quoted unit trust, quoted equity investments and quoted debt investment.
The accompanying notes form an integral part of these financial statements.
15EVERYTHING FOOD MADE EASY
Notes to the Financial Statements Year ended 31 December 2020
These notes form an integral part of the financial statements.
The financial statements were authorised for issue by the Board of Directors on 22 April 2021.
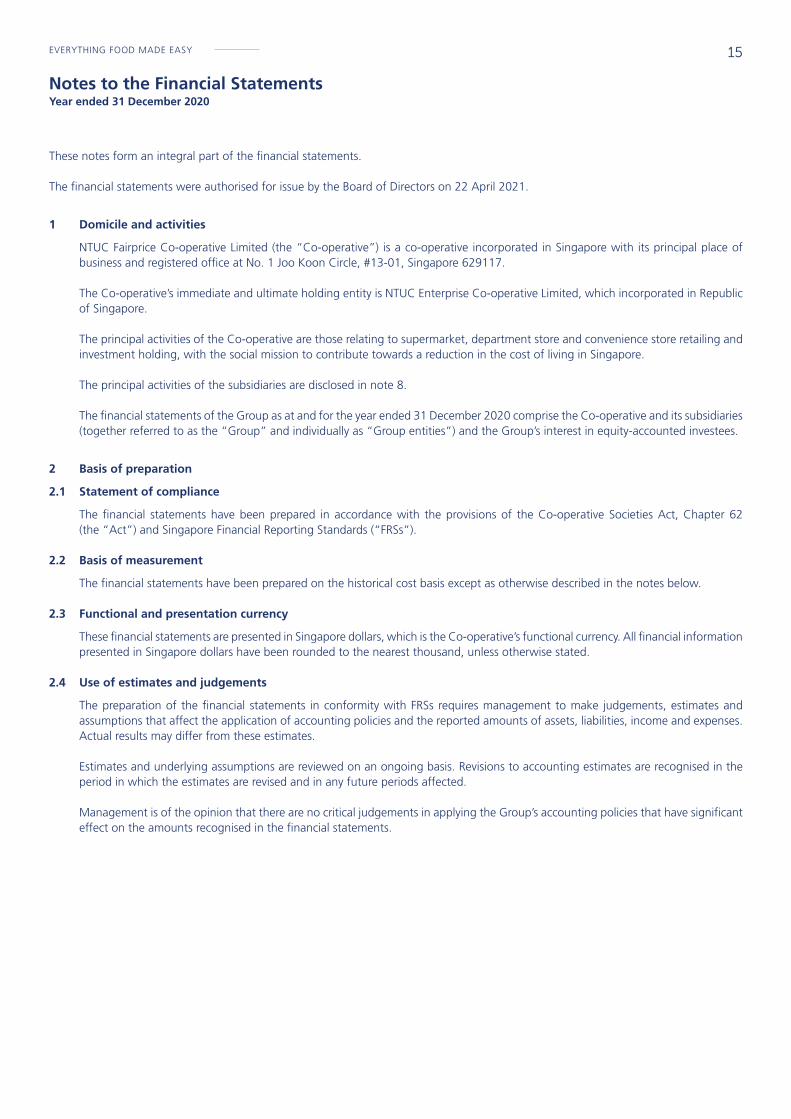
1 Domicile and activities
NTUC Fairprice Co-operative Limited (the “Co-operative”) is a co-operative incorporated in Singapore with its principal place of business and registered office at No. 1 Joo Koon Circle, #13-01, Singapore 629117.
The Co-operative’s immediate and ultimate holding entity is NTUC Enterprise Co-operative Limited, which incorporated in Republic of Singapore.
The principal activities of the Co-operative are those relating to supermarket, department store and convenience store retailing and investment holding, with the social mission to contribute towards a reduction in the cost of living in Singapore.
The principal activities of the subsidiaries are disclosed in note 8.
The financial statements of the Group as at and for the year ended 31 December 2020 comprise the Co-operative and its subsidiaries (together referred to as the “Group” and individually as “Group entities”) and the Group’s interest in equity-accounted investees.
2 Basis of preparation
2.1 Statement of compliance
The financial statements have been prepared in accordance with the provisions of the Co-operative Societies Act, Chapter 62 (the “Act”) and Singapore Financial Reporting Standards (“FRSs”).
2.2 Basis of measurement
The financial statements have been prepared on the historical cost basis except as otherwise described in the notes below.
2.3 Functional and presentation currency
These financial statements are presented in Singapore dollars, which is the Co-operative’s functional currency. All financial information presented in Singapore dollars have been rounded to the nearest thousand, unless otherwise stated.
2.4 Use of estimates and judgements
The preparation of the financial statements in conformity with FRSs requires management to make judgements, estimates and assumptions that affect the application of accounting policies and the reported amounts of assets, liabilities, income and expenses. Actual results may differ from these estimates. Estimates and underlying assumptions are reviewed on an ongoing basis. Revisions to accounting estimates are recognised in the period in which the estimates are revised and in any future periods affected.
Management is of the opinion that there are no critical judgements in applying the Group’s accounting policies that have significant effect on the amounts recognised in the financial statements.
FairPrice Group Financial Report 202016
Notes to the Financial Statements Year ended 31 December 2020
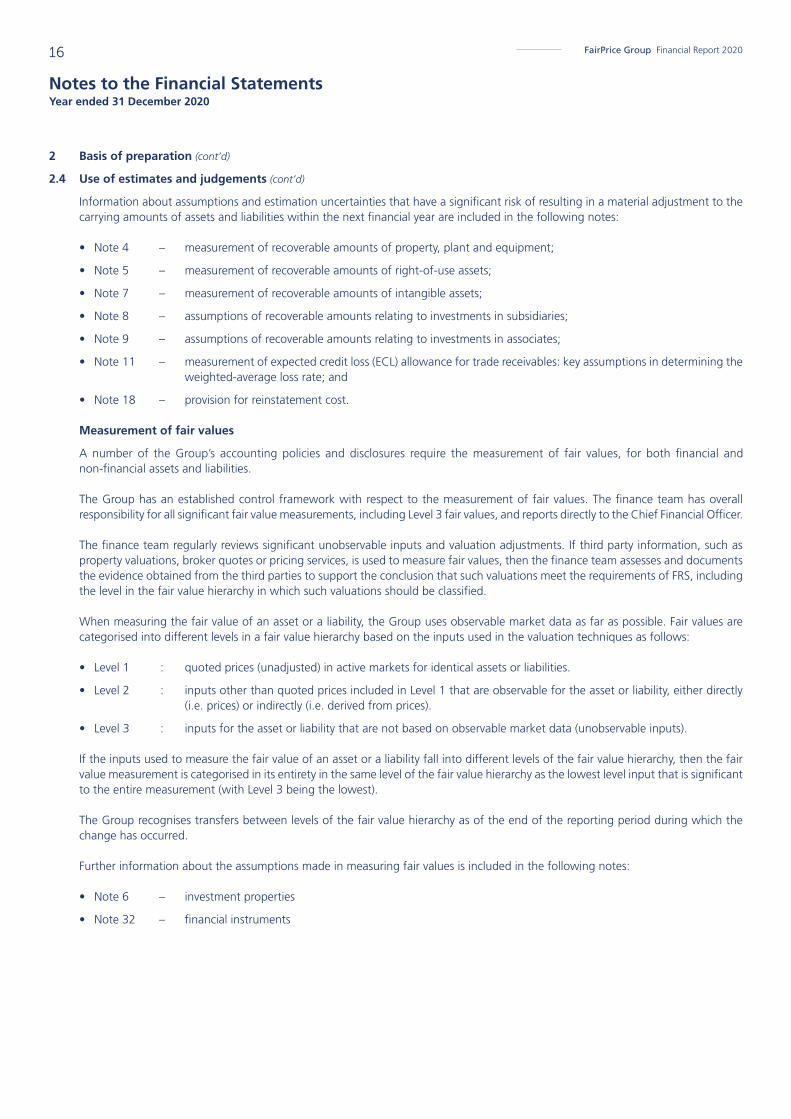
2 Basis of preparation (cont’d)
2.4 Use of estimates and judgements (cont’d)
Information about assumptions and estimation uncertainties that have a significant risk of resulting in a material adjustment to the carrying amounts of assets and liabilities within the next financial year are included in the following notes:
• Note 4 – measurement of recoverable amounts of property, plant and equipment;
• Note 5 – measurement of recoverable amounts of right-of-use assets;
• Note 7 – measurement of recoverable amounts of intangible assets;
• Note 8 – assumptions of recoverable amounts relating to investments in subsidiaries;
• Note 9 – assumptions of recoverable amounts relating to investments in associates;
• Note 11 – measurement of expected credit loss (ECL) allowance for trade receivables: key assumptions in determining the weighted-average loss rate; and
• Note 18 – provision for reinstatement cost.
Measurement of fair values
A number of the Group’s accounting policies and disclosures require the measurement of fair values, for both financial and non-financial assets and liabilities.
The Group has an established control framework with respect to the measurement of fair values. The finance team has overall responsibility for all significant fair value measurements, including Level 3 fair values, and reports directly to the Chief Financial Officer.
The finance team regularly reviews significant unobservable inputs and valuation adjustments. If third party information, such as property valuations, broker quotes or pricing services, is used to measure fair values, then the finance team assesses and documents the evidence obtained from the third parties to support the conclusion that such valuations meet the requirements of FRS, including the level in the fair value hierarchy in which such valuations should be classified.
When measuring the fair value of an asset or a liability, the Group uses observable market data as far as possible. Fair values are categorised into different levels in a fair value hierarchy based on the inputs used in the valuation techniques as follows:
• Level 1 : quoted prices (unadjusted) in active markets for identical assets or liabilities.
• Level 2 : inputs other than quoted prices included in Level 1 that are observable for the asset or liability, either directly (i.e. prices) or indirectly (i.e. derived from prices).
• Level 3 : inputs for the asset or liability that are not based on observable market data (unobservable inputs). If the inputs used to measure the fair value of an asset or a liability fall into different levels of the fair value hierarchy, then the fair value measurement is categorised in its entirety in the same level of the fair value hierarchy as the lowest level input that is significant to the entire measurement (with Level 3 being the lowest).
The Group recognises transfers between levels of the fair value hierarchy as of the end of the reporting period during which the change has occurred.
Further information about the assumptions made in measuring fair values is included in the following notes:
• Note 6 – investment properties
• Note 32 – financial instruments

17EVERYTHING FOOD MADE EASY
Notes to the Financial Statements Year ended 31 December 2020
2 Basis of preparation (cont’d)
2.5 Changes in accounting policies
New standards and amendments
The Group has applied the following FRSs, amendments to and interpretations of FRSs for the first time for the annual period beginning on 1 January 2020:
• Amendments to References to Conceptual Framework in FRS Standards
• Definition of a Business (Amendments to FRS 103)
• Definition of Material (Amendments to FRS 1 and FRS 8)
• Interest Rate Benchmark Reform (Amendments to FRS 109, FRS 39, FRS 107)
The application of these standards and amendments to standards did not have a material effect on the financial statements.
3 Significant accounting policies
The accounting policies set out below have been applied consistently to all periods presented in these financial statements, and have been applied consistently by Group entities.
3.1 Basis of consolidation
(i) Business combinations
The Group accounts for business combinations using the acquisition method when the acquired set of activities and assets meets the definition of a business and control is transferred to the Group (see note ii). In determining whether a particular set of activities and assets is a business, the Group assesses whether the set of assets and activities acquired includes, at a minimum, an input and substantive process and whether the acquired set has the ability to produce outputs. The Group has an option to apply a ‘concentration test’ that permits a simplified assessment of whether an acquired set of activities and assets is not a business. The optional concentration test is met if substantially all of the fair value of the gross assets acquired is concentrated in a single identifiable asset or group of similar identifiable assets.
The Group measures goodwill at the date of acquisition as:
• the fair value of the consideration transferred; plus
• the recognised amount of any non-controlling interest (“NCI”) in the acquiree; plus
• if the business combination is achieved in stages, the fair value of the pre-existing equity interest in the acquiree, over the net recognised amount (generally fair value) of the identifiable assets acquired and liabilities assumed. Any goodwill that arises is tested annually for impairment.
When the excess is negative, a bargain purchase gain is recognised immediately in profit or loss.
The consideration transferred does not include amounts related to the settlement of pre-existing relationships. Such amounts are generally recognised in profit or loss.
Any contingent consideration payable is recognised at fair value at the date of acquisition and included in the consideration transferred. If the contingent consideration that meets the definition of a financial instrument is classified as equity, it is not remeasured and settlement is accounted for within equity. Otherwise, other contingent consideration is remeasured at fair value at each reporting date and subsequent changes to the fair value of the contingent consideration are recognised in profit or loss.

FairPrice Group Financial Report 202018
Notes to the Financial Statements Year ended 31 December 2020
3 Significant accounting policies (cont’d)
3.1 Basis of consolidation (cont’d)
NCI that are present ownership interests and entitle their holders to a proportionate share of the acquiree’s net assets in the event of liquidation are measured either at fair value or at the NCI proportionate share of the recognised amounts of the acquiree’s identifiable net assets, at the acquisition date. The measurement basis taken is elected on a transaction-by-transaction basis. All other NCI are measured at acquisition-date fair value, unless another measurement basis is required by FRSs.
Costs related to the acquisition, other than those associated with the issue of debt or equity securities, that the Group incurs in connection with a business combination are expensed as incurred.
Changes in the Group’s interest in a subsidiary that do not result in a loss of control are accounted for as equity transactions.
(ii) Subsidiaries
Subsidiaries are entities controlled by the Group. The Group controls an entity when it is exposed to, or has rights to, variable returns from its involvement with the entity and has the ability to affect those returns through its power over the entity. The financial statements of subsidiaries are included in the consolidated financial statements from the date that control commences until the date that control ceases.
The accounting policies of subsidiaries have been changed when necessary to align them with the policies adopted by the Group. Losses applicable to NCI in a subsidiary are allocated to the NCI even if doing so causes the NCI to have a deficit balance.
(iii) Acquisitions from entities under common control
Business combinations arising from transfers of interests in entities that are under the control of the shareholder that controls the Group are accounted for as if the acquisition had occurred at the beginning of the earliest comparative year presented or, if later, at the date that common control was established. The assets and liabilities acquired are recognised at the carrying amounts recognised previously in the Group’s controlling shareholder’s financial statements. The components of equity of the acquired entities are added to the same components within Group equity and any gain or loss arising is recognised directly in equity.
(iv) Loss of control
When the Group loses control over a subsidiary, it derecognises the assets and liabilities of the subsidiary, and any related NCI and other components of equity. Any resulting gain or loss is recognised in profit or loss. Any interest retained in the former subsidiary is measured at fair value when control is lost.
(v) Investments in associates (“equity-accounted investees”)
Associates are those entities in which the Group has significant influence, but not control or joint control, over the financial and operating policies of these entities. Significant influence is presumed to exist when the Group holds 20% or more of the voting power of another entity.
Investments in associates are accounted for using the equity method. They are recognised initially at cost, which includes transaction costs. Subsequent to initial recognition, the consolidated financial statements include the Group’s share of the profit or loss and other comprehensive income (“OCI”) of equity-accounted investees, after adjustments to align the accounting policies with those of the Group, from the date that significant influence commences until the date that significant influence ceases.
When the Group’s share of losses exceeds its investment in an equity-accounted investee, the carrying amount of the investment, together with any long-term interests that form part thereof, is reduced to zero, and the recognition of further losses is discontinued except to the extent that the Group has an obligation to fund the investee’s operations or has made payments on behalf of the investee.
19EVERYTHING FOOD MADE EASY
Notes to the Financial Statements Year ended 31 December 2020
3 Significant accounting policies (cont’d)
3.1 Basis of consolidation (cont’d)
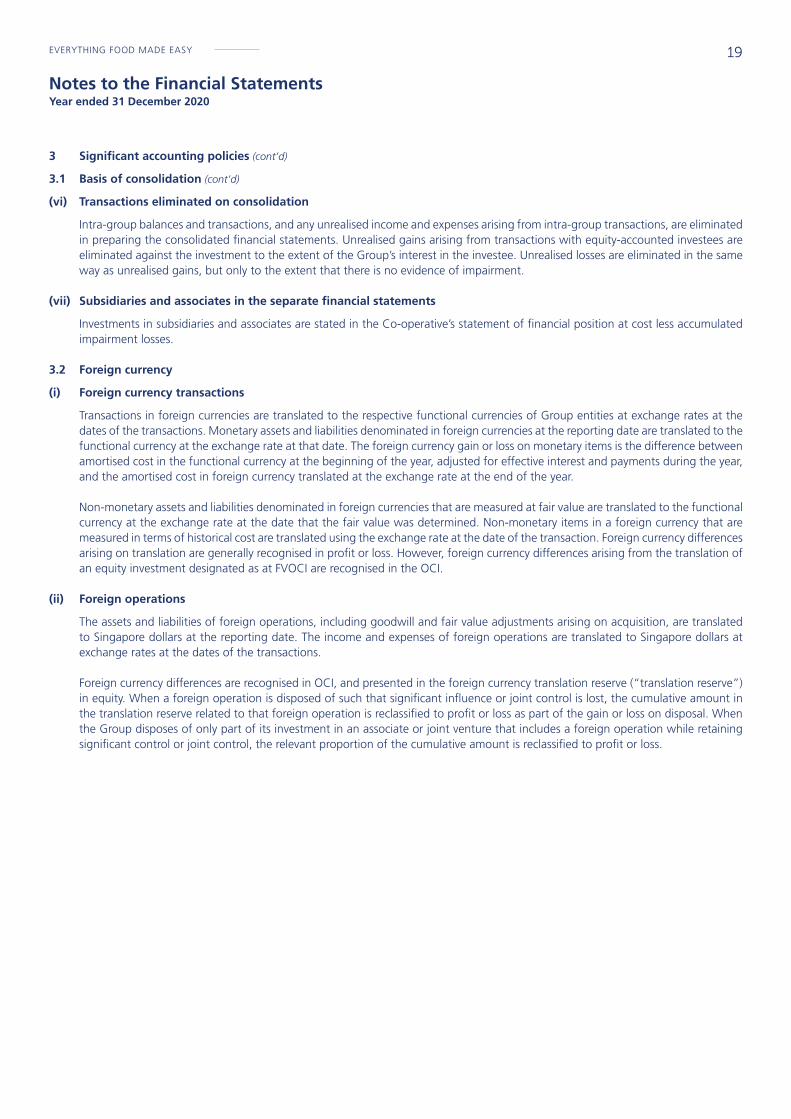
(vi) Transactions eliminated on consolidation
Intra-group balances and transactions, and any unrealised income and expenses arising from intra-group transactions, are eliminated in preparing the consolidated financial statements. Unrealised gains arising from transactions with equity-accounted investees are eliminated against the investment to the extent of the Group’s interest in the investee. Unrealised losses are eliminated in the same way as unrealised gains, but only to the extent that there is no evidence of impairment.
(vii) Subsidiaries and associates in the separate financial statements
Investments in subsidiaries and associates are stated in the Co-operative’s statement of financial position at cost less accumulated impairment losses.
3.2 Foreign currency
(i) Foreign currency transactions
Transactions in foreign currencies are translated to the respective functional currencies of Group entities at exchange rates at the dates of the transactions. Monetary assets and liabilities denominated in foreign currencies at the reporting date are translated to the functional currency at the exchange rate at that date. The foreign currency gain or loss on monetary items is the difference between amortised cost in the functional currency at the beginning of the year, adjusted for effective interest and payments during the year, and the amortised cost in foreign currency translated at the exchange rate at the end of the year.
Non-monetary assets and liabilities denominated in foreign currencies that are measured at fair value are translated to the functional currency at the exchange rate at the date that the fair value was determined. Non-monetary items in a foreign currency that are measured in terms of historical cost are translated using the exchange rate at the date of the transaction. Foreign currency differences arising on translation are generally recognised in profit or loss. However, foreign currency differences arising from the translation of an equity investment designated as at FVOCI are recognised in the OCI.
(ii) Foreign operations
The assets and liabilities of foreign operations, including goodwill and fair value adjustments arising on acquisition, are translated to Singapore dollars at the reporting date. The income and expenses of foreign operations are translated to Singapore dollars at exchange rates at the dates of the transactions.
Foreign currency differences are recognised in OCI, and presented in the foreign currency translation reserve (“translation reserve”) in equity. When a foreign operation is disposed of such that significant influence or joint control is lost, the cumulative amount in the translation reserve related to that foreign operation is reclassified to profit or loss as part of the gain or loss on disposal. When the Group disposes of only part of its investment in an associate or joint venture that includes a foreign operation while retaining significant control or joint control, the relevant proportion of the cumulative amount is reclassified to profit or loss.

FairPrice Group Financial Report 202020
Notes to the Financial Statements Year ended 31 December 2020
3 Significant accounting policies (cont’d)
3.3 Financial instruments
(i) Recognition and initial measurement
Non-derivative financial assets and financial liabilities
Trade receivables and debt investments issued are initially recognised when they are originated. All other financial assets and financial liabilities are initially recognised when the Group becomes a party to the contractual provisions of the instrument.
A financial asset (unless it is a trade receivable without a significant financing component) or financial liability is initially measured at fair value plus, for an item not at fair value through profit or loss (“FVTPL”), transaction costs that are directly attributable to its acquisition or issue. A trade receivable without a significant financing component is initially measured at the transaction price.
(ii) Classification and subsequent measurement
Non-derivative financial assets
On initial recognition, a financial asset is classified as measured at amortised cost; fair value through other comprehensive income (“FVOCI”) – debt investment; FVOCI – equity investment; or FVTPL.
Financial assets are not reclassified subsequent to their initial recognition unless the Group changes its business model for managing financial assets, in which case all affected financial assets are reclassified on the first day of the first reporting period following the change in the business model.
Financial assets at amortised cost
A financial asset is measured at amortised cost if it meets both of the following conditions and is not designated as at FVTPL:
• it is held within a business model whose objective is to hold assets to collect contractual cash flows; and
• its contractual terms give rise on specified dates to cash flows that are solely payments of principal and interest on the principal amount outstanding.
Debt investments at FVOCI
A debt investment is measured at FVOCI if it meets both of the following conditions and is not designated as at FVTPL:
• it is held within a business model whose objective is achieved by both collecting contractual cash flows and selling financial assets; and
• its contractual terms give rise on specified dates to cash flows that are solely payments of principal and interest on the principal amount outstanding.
Equity investments at FVOCI
On initial recognition of an equity investment that is not held-for-trading, the Group may irrevocably elect to present subsequent changes in the investment’s fair value in OCI. This election is made on an investment-by-investment basis.
Financial assets at FVTPL
All financial assets not classified as measured at amortised cost or FVOCI as described above are measured at FVTPL. On initial recognition, the Group may irrevocably designate a financial asset that otherwise meets the requirements to be measured at amortised cost or at FVOCI as at FVTPL if doing so eliminates or significantly reduces an accounting mismatch that would otherwise arise.

21EVERYTHING FOOD MADE EASY
Notes to the Financial Statements Year ended 31 December 2020
3 Significant accounting policies (cont’d)
3.3 Financial instruments (cont’d)
(ii) Classification and subsequent measurement (cont’d)
Financial assets: Business model assessment
The Group makes an assessment of the objective of the business model in which a financial asset is held at a portfolio level because this best reflects the way the business is managed and information is provided to management. The information considered includes:
• the stated policies and objectives for the portfolio and the operation of those policies in practice. These include whether management’s strategy focuses on earning contractual interest income, maintaining a particular interest rate profile, matching the duration of the financial assets to the duration of any related liabilities or expected cash outflows or realising cash flows through the sale of the assets;
• how the performance of the portfolio is evaluated and reported to the Group’s management;
• the risks that affect the performance of the business model (and the financial assets held within that business model) and how those risks are managed;
• how managers of the business are compensated – e.g. whether compensation is based on the fair value of the assets managed or the contractual cash flows collected; and
• the frequency, volume and timing of sales of financial assets in prior periods, the reasons for such sales and expectations about future sales activity.
Transfers of financial assets to third parties in transactions that do not qualify for derecognition are not considered sales for this purpose, consistent with the Group’s continuing recognition of the assets.
Financial assets that are held-for-trading or are managed and whose performance is evaluated on a fair value basis are measured at FVTPL.
Non-derivative financial assets: Assessment whether contractual cash flows are solely payments of principal and interest
For the purposes of this assessment, ‘principal’ is defined as the fair value of the financial asset on initial recognition. ‘Interest’ is defined as consideration for the time value of money and for the credit risk associated with the principal amount outstanding during a particular period of time and for other basic lending risks and costs (e.g. liquidity risk and administrative costs), as well as a profit margin.
In assessing whether the contractual cash flows are solely payments of principal and interest, the Group considers the contractual terms of the instrument. This includes assessing whether the financial asset contains a contractual term that could change the timing or amount of contractual cash flows such that it would not meet this condition. In making this assessment, the Group considers:
• contingent events that would change the amount or timing of cash flows;
• terms that may adjust the contractual coupon rate, including variable rate features;
• prepayment and extension features; and
• terms that limit the Group’s claim to cash flows from specified assets (e.g. non-recourse features).
A prepayment feature is consistent with the solely payments of principal and interest criterion if the prepayment amount substantially represents unpaid amounts of principal and interest on the principal amount outstanding, which may include reasonable additional compensation for early termination of the contract. Additionally, for a financial asset acquired at a significant discount or premium to its contractual par amount, a feature that permits or requires prepayment at an amount that substantially represents the contractual par amount plus accrued (but unpaid) contractual interest (which may also include reasonable additional compensation for early termination) is treated as consistent with this criterion if the fair value of the prepayment feature is insignificant at initial recognition.
FairPrice Group Financial Report 202022
Notes to the Financial Statements Year ended 31 December 2020
3 Significant accounting policies (cont’d)
3.3 Financial instruments (cont’d)
(ii) Classification and subsequent measurement (cont’d)
Non-derivative financial assets: Subsequent measurement and gains and losses
Financial assets at FVTPL
These assets are subsequently measured at fair value. Net gains and losses, including any interest or dividend income, are recognised in profit or loss.
Financial assets at amortised cost
These assets are subsequently measured at amortised cost using the effective interest method. The amortised cost is reduced by impairment losses. Interest income, foreign exchange gains and losses and impairment are recognised in profit or loss. Any gain or loss on derecognition is recognised in profit or loss.
Debt investments at FVOCI
These assets are subsequently measured at fair value. Interest income calculated using the effective interest method, foreign exchange gains and losses and impairment are recognised in profit or loss. Other net gains and losses are recognised in OCI. On derecognition, gains and losses accumulated in OCI are reclassified to profit or loss. Equity investments at FVOCI
These assets are subsequently measured at fair value. Dividends are recognised as income in profit or loss unless the dividend clearly represents a recovery of part of the cost of the investment. Other net gains and losses are recognised in OCI and are never reclassified to profit or loss.
Non-derivative financial liabilities: Classification, subsequent measurement and gains and losses
Financial liabilities are classified as measured at amortised cost or FVTPL. A financial liability is classified as at FVTPL if it is classified as held-for-trading or it is designated as such on initial recognition. Financial liabilities at FVTPL are measured at fair value and net gains and losses, including any interest expense, are recognised in profit or loss. Directly attributable transaction costs are recognised in profit or loss as incurred.
Other financial liabilities are initially measured at fair value less directly attributable transaction costs. They are subsequently measured at amortised cost using the effective interest method. Interest expense and foreign exchange gains and losses are recognised in profit or loss.

23EVERYTHING FOOD MADE EASY
Notes to the Financial Statements Year ended 31 December 2020
3 Significant accounting policies (cont’d)
3.3 Financial instruments (cont’d)
(iii) Derecognition
Financial assets
The Group derecognises a financial asset when the contractual rights to the cash flows from the financial asset expire, or it transfers the rights to receive the contractual cash flows in a transaction in which either substantially all of the risks and rewards of ownership of the financial asset are transferred or the Group neither transfers nor retains substantially all of the risks and rewards of ownership and it does not retain control of the financial asset.
Transferred assets are not derecognised when the Group enters into transactions whereby it transfers assets recognised in its statements of financial position, but retains either all or substantially all of the risks and rewards of the transferred assets.
Financial liabilities
The Group derecognises a financial liability when its contractual obligations are discharged or cancelled, or expire. The Group also derecognises a financial liability when its terms are modified and the cash flows of the modified liability are substantially different, in which case a new financial liability based on the modified terms is recognised at fair value.
On derecognition of a financial liability, the difference between the carrying amount extinguished and the consideration paid (including any non-cash assets transferred or liabilities assumed) is recognised in profit or loss.
(iv) Offsetting
Financial assets and financial liabilities are offset and the net amount presented in the statements of financial position when, and only when, the Group currently has a legally enforceable right to set off the amounts and it intends either to settle them on a net basis or to realise the asset and settle the liability simultaneously.
(v) Cash and cash equivalents
Cash and cash equivalents comprise cash balances that are subject to an insignificant risk of changes in their fair value, and are used by the Group in the management of its short-term commitments.
(vi) Share capital
Ordinary shares
Ordinary shares are classified as equity. Incremental costs directly attributable to the issue of ordinary shares are recognised as a deduction from equity.
Members’ shares
Members’ shares are classified as equity. Incremental costs directly attributable to the issue of members’ shares are recognised as a deduction from equity.
FairPrice Group Financial Report 202024
Notes to the Financial Statements Year ended 31 December 2020
3 Significant accounting policies (cont’d)
3.4 Property, plant and equipment
(i) Recognition and measurement
Items of property, plant and equipment are measured at cost less accumulated depreciation and accumulated impairment losses.
Cost includes expenditure that is directly attributable to the acquisition of the asset. The cost of self-constructed assets includes:
• the cost of materials and direct labour;
• any other costs directly attributable to bringing the assets to a working condition for their intended use;
• when the Group has an obligation to remove the asset or restore the site, an estimate of the costs of dismantling and removing the items and restoring the site on which they are located; and
• capitalised borrowing costs.
When parts of an item of property, plant and equipment have different useful lives, they are accounted for as separate items (major components) of property, plant and equipment.
The gain or loss on disposal of an item of property, plant and equipment is recognised in profit or loss.
(ii) Subsequent costs
The cost of replacing a component of an item of property, plant and equipment is recognised in the carrying amount of the item if it is probable that the future economic benefits embodied within the component will flow to the Group, and its cost can be measured reliably. The carrying amount of the replaced component is derecognised. The costs of the day-to-day servicing of property, plant and equipment are recognised in profit or loss as incurred.
(iii) Provision for instatement costs
A provision is recognised for the estimated costs of dismantlement, removal or restoration of property, plant and equipment arising from the acquisition or use of assets. The estimated costs are capitalised and included in the cost of property, plant and equipment and are depreciated over the useful life of the asset.
(iv) Depreciation
Depreciation is based on the cost of an asset less its residual value. Significant components of individual assets are assessed and if a component has a useful life that is different from the remainder of that asset, that component is depreciated separately.
Depreciation is recognised as an expense in profit or loss on a straight-line basis over the estimated useful lives of each component of an item of property, plant and equipment, unless it is included in the carrying amount of another asset. Freehold land and construction-in-progress are not depreciated.
Depreciation is recognised from the date that the property, plant and equipment are installed and are ready for use, or in respect of internally constructed assets, from the date that the asset is completed and ready for use.
The estimated useful lives for the current and comparative years are as follows:
Freehold buildings - 20 to 42 yearsLeasehold buildings - 15 to 84 yearsFurniture, fittings and renovation - 1 to 15 yearsPlant and machinery - 2 to 20 yearsEquipment and motor vehicles - 2 to 10 yearsComputers - 1 to 5 years
Depreciation methods, useful lives and residual values are reviewed at the end of each reporting period and adjusted if appropriate.

25EVERYTHING FOOD MADE EASY
Notes to the Financial Statements Year ended 31 December 2020
3 Significant accounting policies (cont’d)
3.5 Intangible assets
(i) Goodwill
Goodwill that arises upon the acquisition of subsidiaries is included in intangible assets. For the measurement of goodwill at initial recognition, see note 3.1(i).
Subsequent measurement
Goodwill is measured at cost less accumulated impairment losses. In respect of associates, the carrying amount of goodwill is included in the carrying amount of the investment, and an impairment loss on such an investment is not allocated to any asset, including goodwill, that forms part of the carrying amount of the associates.
(ii) Brand name
Brand name that arises upon acquisition of subsidiaries is measured initially at cost. The cost of brand name acquired is the fair value as at the date of acquisition. Following to initial acquisition, brand name is measured at cost less accumulated impairment losses. The brand is assessed to have indefinite useful life because based on the current market share of the brand name, there is no foreseeable limit to the period over which the brand name is expected to generate net cash inflows for the Group. The brand name is tested for impairment annually or whenever there is indication of impairment.
The useful life of the brand name with indefinite useful life is reviewed annually to determine whether the useful life assessment continues to be supportable. If not, the change in useful life from indefinite to finite is made on a prospective basis.
(iii) Other intangible assets
Other intangible assets that are acquired by the Group and have finite useful lives are measured at cost less accumulated amortisation and accumulated impairment losses.
Subsequent expenditure
Subsequent expenditure is capitalised only when it increases the future economic benefits embodied in the specific asset to which it relates. All other expenditure is recognised in profit or loss as incurred.
Amortisation
Amortisation is calculated based on the cost of asset, less its residual value.
Amortisation is recognised on a straight-line basis over the estimated useful lives of other intangible assets, from the date that they are available for use. The estimated useful lives for current and comparative years are as follows:
Software and licenses - 3 to 5 yearsTenant contracts - 4 to 5 years
Amortisation methods, useful lives and residual values are reviewed at the end of each reporting period and adjusted if appropriate.
FairPrice Group Financial Report 202026
Notes to the Financial Statements Year ended 31 December 2020
3 Significant accounting policies (cont’d)
3.6 Investment properties
Investment properties are held either to earn rental income or capital appreciation or both, but not for sale in the ordinary course of business, use in the production or supply of goods or services, or for administrative purposes. Investment properties are stated at cost less accumulated depreciation and accumulated impairment losses.
Cost includes expenditure that is directly attributable to the acquisition or construction of the investment properties. The cost of self-constructed investment properties includes the cost of materials and direct labour and any other costs directly attributable to bringing the investment properties to a working condition for their intended use and capitalised borrowing costs.
Depreciation is recognised in profit or loss on a straight-line basis over the estimated useful lives at each component of investment properties.
The estimated useful lives for the current year are as follows:
Investment properties - 26 to 82 years
3.7 Leases
At inception of a contract, the Group assesses whether a contract is, or contains, a lease. A contract is, or contains, a lease if the contract conveys the right to control the use of an identified asset for a period of time in exchange for consideration.
(i) As a lessee
At commencement or on modification of a contract that contains a lease component, the Group allocates the consideration in the contract to each lease component on the basis of its relative stand-alone prices. However, for the leases of property in which it is a lessee, the Group has elected not to separate non-lease components and account for the lease and non-lease components as a single lease component.
The Group recognises a right-of-use asset and a lease liability at the lease commencement date. The right-of-use asset is initially measured at cost, which comprises the initial amount of the lease liability adjusted for any lease payments made at or before the commencement date, plus any initial direct costs incurred and an estimate of costs to dismantle and remove the underlying asset or to restore the underlying asset or the site on which it is located, less any lease incentives received.
The right-of-use asset is subsequently depreciated using the straight-line method from the commencement date to the end of the lease term, unless the lease transfers ownership of the underlying asset to the Group by the end of the lease term or the cost of the right-of-use asset reflects that the Group will exercise a purchase option. In that case the right-of-use asset will be depreciated over the useful life of the underlying asset, which is determined on the same basis as those of property and equipment. In addition, the right-of-use asset is periodically reduced by impairment losses, if any, and adjusted for certain remeasurements of the lease liability.
The right-of-use asset is subsequently stated at cost less accumulated depreciation and impairment losses.
The lease liability is initially measured at the present value of the lease payments that are not paid at the commencement date, discounted using the interest rate implicit in the lease or, if that rate cannot be readily determined, the Group’s incremental borrowing rate. Generally, the Group uses its incremental borrowing rate as the discount rate.
The Group determines its incremental borrowing rate by obtaining interest rates from various external financing sources and makes certain adjustments to reflect the terms of the lease and type of the asset leased.
27EVERYTHING FOOD MADE EASY
Notes to the Financial Statements Year ended 31 December 2020
3 Significant accounting policies (cont’d)
3.7 Leases (cont’d)
(i) As a lessee (cont’d)
Lease payments included in the measurement of the lease liability comprise the following:
• fixed payments, including in-substance fixed payments;
• variable lease payments that depend on an index or a rate, initially measured using the index or rate as at the commencement date; and
• the exercise price under a purchase option that the Group is reasonably certain to exercise, lease payments in an optional renewal period if the Group is reasonably certain to exercise an extension option, and penalties for early termination of a lease unless the Group is reasonably certain not to terminate early.
The lease liability is measured at amortised cost using the effective interest method. It is remeasured when there is a change in future lease payments arising from a change in an index or rate, if the Group changes its assessment of whether it will exercise a purchase, extension or termination option or if there is a revised in-substance fixed lease payment.
When the lease liability is remeasured in this way, a corresponding adjustment is made to the carrying amount of the right-of-use asset, or is recorded in profit or loss if the carrying amount of the right-of-use asset has been reduced to zero.
The Group presents right-of-use assets that do not meet the definition of investment property in ‘right-of-use assets’ and lease liabilities in the statements of financial position.
Short-term leases and leases of low-value assets
The Group has elected not to recognise right-of-use assets and lease liabilities for leases of low-value assets and short-term leases, including IT equipment. The Group recognises the lease payments associated with these leases as an expense on a straight-line basis over the lease term.
(ii) As a lessor
At inception or on modification of a contract that contains a lease component, the Group allocates the consideration in the contract to each lease component on the basis of their relative stand-alone prices.
When the Group acts as a lessor, it determines at lease inception whether each lease is a finance lease or an operating lease. To classify each lease, the Group makes an overall assessment of whether the lease transfers substantially all of the risks and rewards incidental to ownership of the underlying asset. If this is the case, then the lease is a finance lease; if not, then it is an operating lease. As part of this assessment, the Group considers certain indicators such as whether the lease is for the major part of the economic life of the asset.
When the Group is an intermediate lessor, it accounts for its interests in the head lease and the sub-lease separately. It assesses the lease classification of a sub-lease with reference to the right-of-use asset arising from the head lease, not with reference to the underlying asset. If a head lease is a short-term lease to which the Group applies the exemption described above, then it classifies the sub-lease as an operating lease.
If an arrangement contains lease and non-lease components, then the Group applies FRS 115 to allocate the consideration in the contract.
The Group recognises lease payments received under operating leases as income on a straight-line basis over the lease term as part of ‘other income’. Rental income from sub-leased property is recognised as “other income”.
FairPrice Group Financial Report 202028
Notes to the Financial Statements Year ended 31 December 2020
3 Significant accounting policies (cont’d)
3.8 Inventories
Inventories are measured at the lower of cost and net realisable value. The cost of inventories is based on the weighted average method, and includes expenditure incurred in acquiring the inventories and other costs incurred in bringing them to their existing location and condition.
Net realisable value is the estimated selling price in the ordinary course of business, less the estimated costs of completion and estimated costs necessary to make the sale.
3.9 Impairment
(i) Non-derivative financial assets
The Group recognises loss allowances for ECLs on:
• financial assets measured at amortised cost;
• debt investments measured at FVOCI; and
• lease receivables.
Loss allowances of the Group are measured on either of the following bases:
• 12-month ECLs: these are ECLs that result from default events that are possible within the 12 months after the reporting date (or for a shorter period if the expected life of the instrument is less than 12 months); or
• Lifetime ECLs: these are ECLs that result from all possible default events over the expected life of a financial instrument.
Simplified approach
The Group applies the simplified approach to provide for ECLs for all trade receivables (including lease receivables). The simplified approach requires the loss allowance to be measured at an amount equal to lifetime ECLs.
General approach
The Group applies the general approach to provide for ECLs on all other financial instruments. Under the general approach, the loss allowance is measured at an amount equal to 12-month ECLs at initial recognition.
At each reporting date, the Group assesses whether the credit risk of a financial instrument has increased significantly since initial recognition. When credit risk has increased significantly since initial recognition, loss allowance is measured at an amount equal to lifetime ECLs.
When determining whether the credit risk of a financial asset has increased significantly since initial recognition and when estimating ECLs, the Group considers reasonable and supportable information that is relevant and available without undue cost or effort. This includes both quantitative and qualitative information and analysis, based on the Group’s historical experience and informed credit assessment and includes forward-looking information.
If credit risk has not increased significantly since initial recognition or if the credit quality of the financial instruments improves such that there is no longer a significant increase in credit risk since initial recognition, loss allowance is measured at an amount equal to 12-month ECLs.
The Group considers a financial asset to be in default when the borrower is unlikely to pay its credit obligations to the Group in full, without recourse by the Group to actions such as realising security (if any is held).
The maximum period considered when estimating ECLs is the maximum contractual period over which the Group is exposed to credit risk.

29EVERYTHING FOOD MADE EASY
Notes to the Financial Statements Year ended 31 December 2020
3 Significant accounting policies (cont’d)
3.9 Impairment (cont’d)
(i) Non-derivative financial assets (cont’d)
Measurement of ECLs
ECLs are probability-weighted estimates of credit losses. Credit losses are measured at the present value of all cash shortfalls (i.e. the difference between the cash flows due to the entity in accordance with the contract and the cash flows that the Group expects to receive). ECLs are discounted at the effective interest rate of the financial asset.
Credit-impaired financial assets
At each reporting date, the Group assesses whether financial assets carried at amortised cost and debt investments at FVOCI are credit-impaired. A financial asset is ‘credit-impaired’ when one or more events that have a detrimental impact on the estimated future cash flows of the financial asset have occurred.
Evidence that a financial asset is credit-impaired includes the following observable data:
• significant financial difficulty of the debtor;
• a breach of contract such as a default;
• the restructuring of a loan or advance by the Group on terms that the Group would not consider otherwise;
• it is probable that the debtor will enter bankruptcy or other financial reorganisation; or
• the disappearance of an active market for a security because of financial difficulties.
Presentation of allowance for ECLs in the statements of financial position
Loss allowances for financial assets measured at amortised cost are deducted from the gross carrying amount of these assets.
For debt investments at FVOCI, loss allowances are charged to profit or loss and recognised in OCI.
Write-off
The gross carrying amount of a financial asset is written off (either partially or in full) to the extent that there is no realistic prospect of recovery. This is generally the case when the Group determines that the debtor does not have assets or sources of income that could generate sufficient cash flows to repay the amounts subject to the write-off. However, financial assets that are written off could still be subject to enforcement activities in order to comply with the Group’s procedures for recovery of amounts due.
FairPrice Group Financial Report 202030
Notes to the Financial Statements Year ended 31 December 2020
3 Significant accounting policies (cont’d)
3.9 Impairment (cont’d)
(ii) Non-financial assets
The carrying amounts of the Group’s non-financial assets, other than inventories, are reviewed at each reporting date to determine whether there is any indication of impairment. If any such indication exists, then the asset’s recoverable amount is estimated. For goodwill, and intangible assets that have indefinite useful lives, the recoverable amount is estimated each year at the same time. An impairment loss is recognised if the carrying amount of an asset or its related cash-generating unit (“CGU”) exceeds its estimated recoverable amount.
The recoverable amount of an asset or CGU is the greater of its value in use and its fair value less costs to sell. In assessing value in use, the estimated future cash flows are discounted to their present value using a pre-tax discount rate that reflects current market assessments of the time value of money and the risks specific to the asset or CGU. For the purpose of impairment testing, assets that cannot be tested individually are grouped together into the smallest group of assets that generates cash inflows from continuing use that are largely independent of the cash inflows of other assets or CGUs. Subject to an operating segment ceiling test, for the purposes of goodwill impairment testing, CGUs to which goodwill has been allocated are aggregated so that the level at which impairment testing is performed reflects the lowest level at which goodwill is monitored for internal reporting purposes. Goodwill acquired in a business combination is allocated to groups of CGUs that are expected to benefit from the synergies of the combination.
The Group’s corporate assets do not generate separate cash inflows and are utilised by more than one CGU. Corporate assets are allocated to CGUs on a reasonable and consistent basis and tested for impairment as part of the testing of the CGU to which the corporate asset is allocated.
Impairment losses are recognised in profit or loss. Impairment losses recognised in respect of CGUs are allocated first to reduce the carrying amounts of any goodwill allocated to the CGU (“group of CGUs”), and then to reduce the carrying amounts of the other assets in the group of CGU on a pro rata basis.
An impairment loss in respect of goodwill is not reversed. In respect of other assets, impairment losses recognised in prior periods are assessed at each reporting date for any indications that the loss has decreased or no longer exists. An impairment loss is reversed if there has been a change in the estimates used to determine the recoverable amount and only to the extent that the recoverable amount increases. An impairment loss is reversed only to the extent that the asset’s carrying amount does not exceed the carrying amount that would have been determined, net of depreciation or amortisation, if no impairment loss had been recognised.
An impairment loss in respect of an associate is measured by comparing the recoverable amount of the investment with its carrying amount in accordance with the requirements for non-financial assets. An impairment loss is recognised in profit or loss. An impairment loss is reversed if there has been a change in the estimates used to determine the recoverable amount and only to the extent that the recoverable amount increases.
Goodwill that forms part of the carrying amount of an investment in an associate is not recognised separately, and therefore is not tested for impairment separately. Instead, the entire amount of the investment in an associate is tested for impairment as a single asset when there is objective evidence that the investment in an associate may be impaired.

31EVERYTHING FOOD MADE EASY
Notes to the Financial Statements Year ended 31 December 2020
3 Significant accounting policies (cont’d)
3.10 Employee benefits
(i) Defined contribution plans
A defined contribution plan is a post-employment benefit plan under which an entity pays fixed contributions into a separate entity and will have no legal or constructive obligation to pay further amounts. Obligations for contributions to defined contribution pension plans are recognised as an employee benefit expense in profit or loss in the periods during which related services are rendered by employees.
(ii) Short-term employee benefits
Short-term employee benefit obligations are measured on an undiscounted basis and are expensed as the related service is provided. A liability is recognised for the amount expected to be paid under short-term cash bonus or profit-sharing plans if the Group has a present legal or constructive obligation to pay this amount as a result of past service provided by the employee, and the obligation can be estimated reliably.
3.11 Provision
A provision is recognised if, as a result of a past event, the Group has a present legal or constructive obligation that can be estimated reliably, and it is probable that an outflow of economic benefits will be required to settle the obligation. Provisions are determined by discounting the expected future cash flows at a pre-tax rate that reflects current market assessments of the time value of money and the risks specific to the liability. The unwinding of the discount is recognised as finance cost.
3.12 Revenue
(i) Sale of food and beverages and retail goods
Revenue from sale of goods in the ordinary course of business is recognised when the Group satisfied a performance obligation (“PO”) by transferring control of a promised good to the customer. The amount of revenue recognised is the amount of the transaction price allocated to the satisfied PO.
The transaction price is allocated to each PO in the contract on the basis of the relative stand-alone selling prices of the promised goods. The individual standalone selling price of a good that has not previously been sold on a stand-alone basis, or has a highly variable selling price, is determined based on the residual portion of the transaction price after allocating the transaction price to goods with observable stand-alone selling prices. A discount or variable consideration is allocated to one or more, but not all, of the performance obligations if it relates specifically to those POs.
Transaction price is the amount of consideration in the contract to which the Group expects to be entitled in exchange for transferring the promised goods.
(ii) Income from food court operations
Rental income arising from investment properties and operating leases on sub-leases of food stall is accounted for on a straight-line basis over the lease term. The aggregate costs of incentives provided to lessees are recognised as a reduction of rental income over the lease term on a straight-line basis. The variable portion of the rental income which is computed based on a percentage of the food court tenants’ gross sales is recognised when such sales are earned.

FairPrice Group Financial Report 202032
Notes to the Financial Statements Year ended 31 December 2020
3 Significant accounting policies (cont’d)
3.13 Other income
(i) Rental income
Rental income arising from operating leases on sub-leases of space is accounted for on a straight-line basis over the lease terms. The aggregate costs of incentives provided to lessees are recognised as a reduction of rental income over the lease term on a straight-line basis. The variable portion of the rental income which is computed based on a percentage of the tenants’ gross sales is recognised when such sales are earned.
(ii) Concessionary and commission income
Concessionary and commission income are recognised at a point of time in which the services are provided by the Group.
(iii) Advertising, promotion and other service income
Advertising, promotion and other service income are recognised over time based on the percentage of completion reflecting the progress towards complete satisfaction of that PO.
(iv) Management fee income
Management fee income received from a subsidiary relates to the charges of services provided to the subsidiary.
(v) Fitting out income
Fitting out income recoverable from tenants in relation to cost of renovating the stalls is recognised in profit or loss on a straight-line basis over the term of the lease.
(vi) Sponsorship income
Sponsorship income from suppliers is recognised on a straight-line basis over the sponsored period.
3.14 Investment income
(i) Dividend income
Dividend income is recognised in profit or loss on the date that the Group’s right to receive payment is established, which in the case of quoted securities is normally the ex-dividend date.
(ii) Interest income or interest expense
Interest income or expense is recognised using the effective interest method.
The ‘effective interest rate’ is the rate that exactly discounts estimated future cash payments or receipts through the expected life of the financial instrument to:
• the gross carrying amount of the financial asset; or
• the amortised cost of the financial liability.
In calculating interest income and expense, the effective interest rate is applied to the gross carrying amount of the asset (when the asset is not credit-impaired) or to the amortised cost of the liability. However, for financial assets that have become credit-impaired subsequent to initial recognition, interest income is calculated by applying the effective interest rate to the amortised cost of the financial asset. If the asset is no longer credit-impaired, then the calculation of interest income reverts to the gross basis.
Borrowing costs that are not directly attributable to the acquisition, construction or production of a qualifying asset are recognised in profit or loss using the effective interest method.

33EVERYTHING FOOD MADE EASY
Notes to the Financial Statements Year ended 31 December 2020
3 Significant accounting policies (cont’d)
3.15 Government grants
Government grants related to assets are initially recognised as deferred income at fair value when there is reasonable assurance that they will be received and the Group will comply with the conditions associated with the grant. These grants are then recognised in profit or loss as ‘other income’ on a systematic basis over the useful life of the asset. Grants that compensate the Group for expenses incurred are recognised in profit or loss as ‘other income’ on a systematic basis in the same periods in which the expenses are recognised, unless the conditions for receiving the grant are met after the related expenses have been recognised. In this case, the grant is recognised when it becomes receivable.
3.16 Patronage rebates
Patronage rebates distributed to the members of the Co-operative/NTUC Union cardholders (“members”) are recognised as a liability in the Co-operative’s and the Group’s financial statements in the period in which the patronage rebates are approved by the members at the annual general meeting. Patronage rebates which are not claimed within 3 years from the date of payment by members are written back in accordance with By-laws 12.4 and the rules of NTUC Union Card Scheme.
3.17 Tax
Tax expense comprises current and deferred tax. Current tax and deferred tax is recognised in profit or loss except to the extent that it relates to a business combination, or items recognised directly in equity or in OCI.
The Group has determined that interest and penalties related to income taxes, including uncertain tax treatments, do not meet the definition of income taxes, and therefore accounted for them under FRS 37 Provisions, Contingent Liabilities and Contingent Assets.
Current tax is the expected tax payable or receivable on the taxable income or loss for the year, using tax rates enacted or substantively enacted at the reporting date, and any adjustment to tax payable in respect of previous years. The amount of current tax payable or receivable is the best estimate of the tax amount expected to be paid or received that reflects uncertainty related to income taxes, if any. Current tax also includes any tax arising from dividends.
Current tax assets and liabilities are offset only if certain criteria are met.
Deferred tax is recognised in respect of temporary differences between the carrying amounts of assets and liabilities for financial reporting purposes and the amounts used for taxation purposes.
Deferred tax is not recognised for:
• temporary differences on the initial recognition of assets or liabilities in a transaction that is not a business combination and that affects neither accounting nor taxable profit or loss;
• temporary differences related to investments in subsidiaries and associates to the extent that the Group is able to control the timing of the reversal of the temporary difference and it is probable that they will not reverse in the foreseeable future; and
• taxable temporary differences arising on initial recognition of goodwill.
The measurement of deferred taxes reflects the tax consequences that would follow the manner in which the Group expects, at the reporting date, to recover or settle the carrying amount of its assets and liabilities. Deferred tax is measured at the tax rates that are expected to be applied to temporary differences when they reverse, based on the laws that have been enacted or substantively enacted by the reporting date.

FairPrice Group Financial Report 202034
Notes to the Financial Statements Year ended 31 December 2020
3 Significant accounting policies (cont’d)
3.17 Tax (cont’d)
Deferred tax assets and liabilities are offset if there is a legally enforceable right to offset current tax liabilities and assets, and they relate to taxes levied by the same tax authority on the same taxable entity, or on different tax entities, but they intend to settle current tax liabilities and assets on a net basis or their tax assets and liabilities will be realised simultaneously.
Deferred tax assets are recognised for unused tax losses, unused tax credits and deductible temporary differences to the extent that it is probable that future taxable profits will be available against which they can be used. Future taxable profits are determined based on the reversal of relevant taxable temporary differences. If the amount of taxable temporary differences is insufficient to recognise a deferred tax asset in full, then future taxable profits, adjusted for reversals of existing temporary differences, are considered, based on the business plans for individual subsidiaries in the Group. Deferred tax assets are reviewed at each reporting date and are reduced to the extent that it is no longer probable that the related tax benefit will be realised; such reductions are reversed when the probability of future taxable profits improves.
Unrecognised deferred tax assets are reassessed at each reporting date and recognised to the extent that it has become probable that future taxable profits will be available against which they can be used.
3.18 New standards and interpretations not yet effective
A number of new standards, interpretations and amendments to standards are effective for annual periods beginning after 1 January 2020 and earlier application is permitted; however, the Group has not early adopted the new or amended standards and interpretations in preparing these financial statements.
The following new FRSs, interpretations and amendments to FRSs are not expected to have a significant impact on the Group’s consolidated financial statements and the Co-operative’s statement of financial position.
• FRS 117 Insurance contracts
• Classification of Liabilities as Current or Non-current (Amendments to FRS 1)
• Covid-19 Related Rent Concessions (Amendment to FRS 116)
• Sale or Contribution of Assets between an Investor and its Associate or Joint Venture (Amendments to FRS 110 and FRS 28)
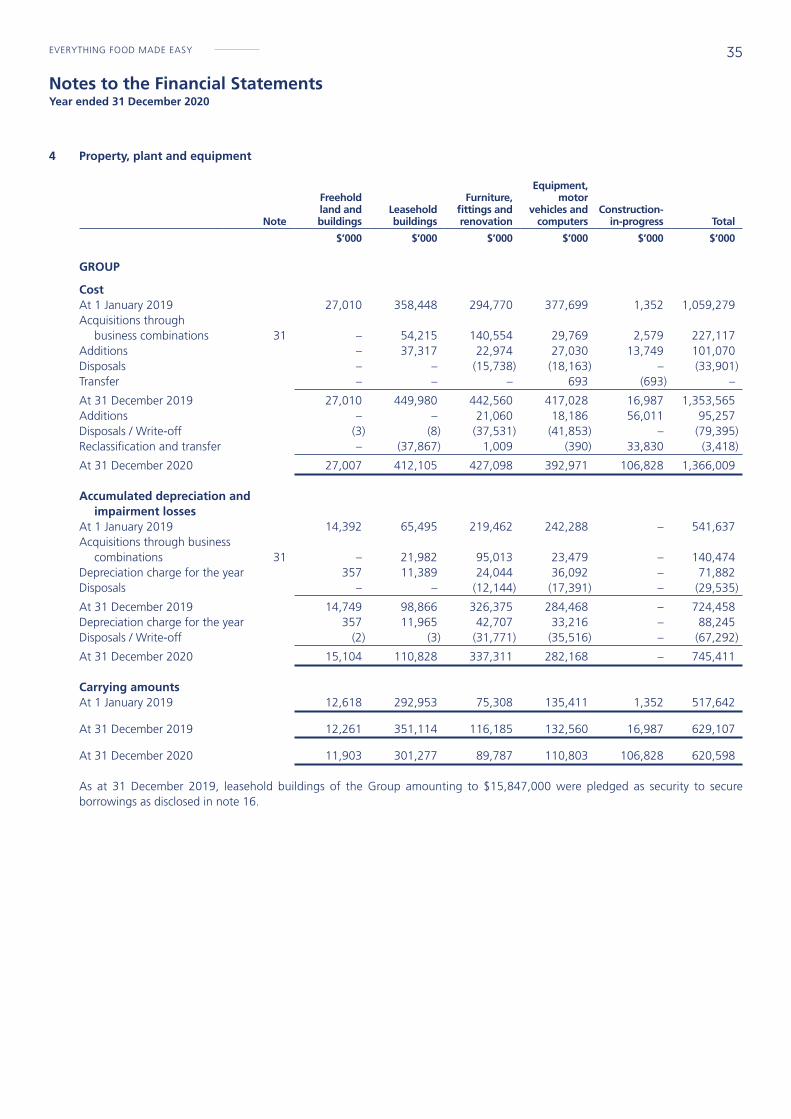
35EVERYTHING FOOD MADE EASY
Notes to the Financial Statements Year ended 31 December 2020
4 Property, plant and equipment
Note
Freeholdland and buildings
Leasehold buildings
Furniture, fittings and renovation
Equipment, motor
vehicles and computers
Construction-in-progress Total
$’000 $’000 $’000 $’000 $’000 $’000
GROUP
Cost At 1 January 2019 27,010 358,448 294,770 377,699 1,352 1,059,279Acquisitions through business combinations 31 – 54,215 140,554 29,769 2,579 227,117Additions – 37,317 22,974 27,030 13,749 101,070Disposals – – (15,738) (18,163) – (33,901)Transfer – – – 693 (693) –
At 31 December 2019 27,010 449,980 442,560 417,028 16,987 1,353,565Additions – – 21,060 18,186 56,011 95,257Disposals / Write-off (3) (8) (37,531) (41,853) – (79,395)Reclassification and transfer – (37,867) 1,009 (390) 33,830 (3,418)
At 31 December 2020 27,007 412,105 427,098 392,971 106,828 1,366,009 Accumulated depreciation and impairment losses At 1 January 2019 14,392 65,495 219,462 242,288 – 541,637Acquisitions through business combinations 31 – 21,982 95,013 23,479 – 140,474Depreciation charge for the year 357 11,389 24,044 36,092 – 71,882Disposals – – (12,144) (17,391) – (29,535)
At 31 December 2019 14,749 98,866 326,375 284,468 – 724,458Depreciation charge for the year 357 11,965 42,707 33,216 – 88,245Disposals / Write-off (2) (3) (31,771) (35,516) – (67,292)
At 31 December 2020 15,104 110,828 337,311 282,168 – 745,411 Carrying amounts At 1 January 2019 12,618 292,953 75,308 135,411 1,352 517,642
At 31 December 2019 12,261 351,114 116,185 132,560 16,987 629,107
At 31 December 2020 11,903 301,277 89,787 110,803 106,828 620,598 As at 31 December 2019, leasehold buildings of the Group amounting to $15,847,000 were pledged as security to secure borrowings as disclosed in note 16.

FairPrice Group Financial Report 202036
Notes to the Financial Statements Year ended 31 December 2020
4 Property, plant and equipment (cont’d)
Freeholdland and buildings
Leasehold buildings
Furniture, fittings and renovation
Equipment, motor
vehicles and computers
Construction-in-progress Total
$’000 $’000 $’000 $’000 $’000 $’000
CO-OPERATIVE
Cost At 1 January 2019 27,010 315,370 269,869 230,583 – 842,832Additions – 37,317 16,020 18,963 – 72,300Disposals – – (5,865) (14,399) – (20,264)
At 31 December 2019 27,010 352,687 280,024 235,147 – 894,868Additions – – 10,640 10,396 47,911 68,947Disposals / Write-off (3) – (7,796) (20,756) – (28,555)Reclassification and transfer – (37,867) 846 (63) 37,867 783
At 31 December 2020 27,007 314,820 283,714 224,724 85,778 936,043 Accumulated depreciation and impairment losses At 1 January 2019 14,392 44,733 204,313 178,592 – 442,030Depreciation charge for the year 357 10,466 16,921 24,963 – 52,707Disposals – – (5,238) (14,194) – (19,432)
At 31 December 2019 14,749 55,199 215,996 189,361 – 475,305Depreciation charge for the year 357 10,466 18,425 20,620 – 49,868Disposals / Write-off (2) – (6,507) (16,307) – (22,816)Reclassification and transfer – – 783 – – 783
At 31 December 2020 15,104 65,665 228,697 193,674 – 503,140 Carrying amounts At 1 January 2019 12,618 270,637 65,556 51,991 – 400,802
At 31 December 2019 12,261 297,488 64,028 45,786 – 419,563
At 31 December 2020 11,903 249,155 55,017 31,050 85,778 432,903
Included within the carrying amounts of furniture, fittings and renovation is provision for reinstatement costs of $19,869,000 (2019: $26,166,000) for the Group and $16,387,800 (2019: $20,671,282) for the Co-operative.

37EVERYTHING FOOD MADE EASY
Notes to the Financial Statements Year ended 31 December 2020
5 Right-of-use assets
NoteLand and buildings Equipment Total
$’000 $’000 $’000
GROUP
Cost At 1 January 2019 – – –Recognition of right-of-use asset on initial application of FRS 116 1,196,608 – 1,196,608
Adjusted balance at 1 January 2019 1,196,608 – 1,196,608Acquisitions through business combinations 31 271,328 – 271,328Additions 263,912 21 263,933Derecognition of right-of-use assets* (1,346) – (1,346)
At 31 December 2019 1,730,502 21 1,730,523 At 1 January 2020 1,730,502 21 1,730,523Additions 188,422 626 189,048Reassessment and modification 71,599 – 71,599Derecognition of right-of-use assets* (93,060) (39) (93,099)
At 31 December 2020 1,897,463 608 1,898,071 Accumulated depreciation and impairment losses At 1 January 2019 – – –Acquisitions through business combinations 31 65,470 – 65,470Depreciation charge for the year 218,449 4 218,453
At 31 December 2019 283,919 4 283,923Depreciation charge for the year 299,912 152 300,064Reassessment and modification (67,600) – (67,600)Derecognition of right-of-use assets* (50,590) (11) (50,601)
At 31 December 2020 465,641 145 465,786 Carrying amounts At 1 January 2019 1,196,608 – 1,196,608
At 31 December 2019 1,446,583 17 1,446,600
At 31 December 2020 1,431,822 463 1,432,285
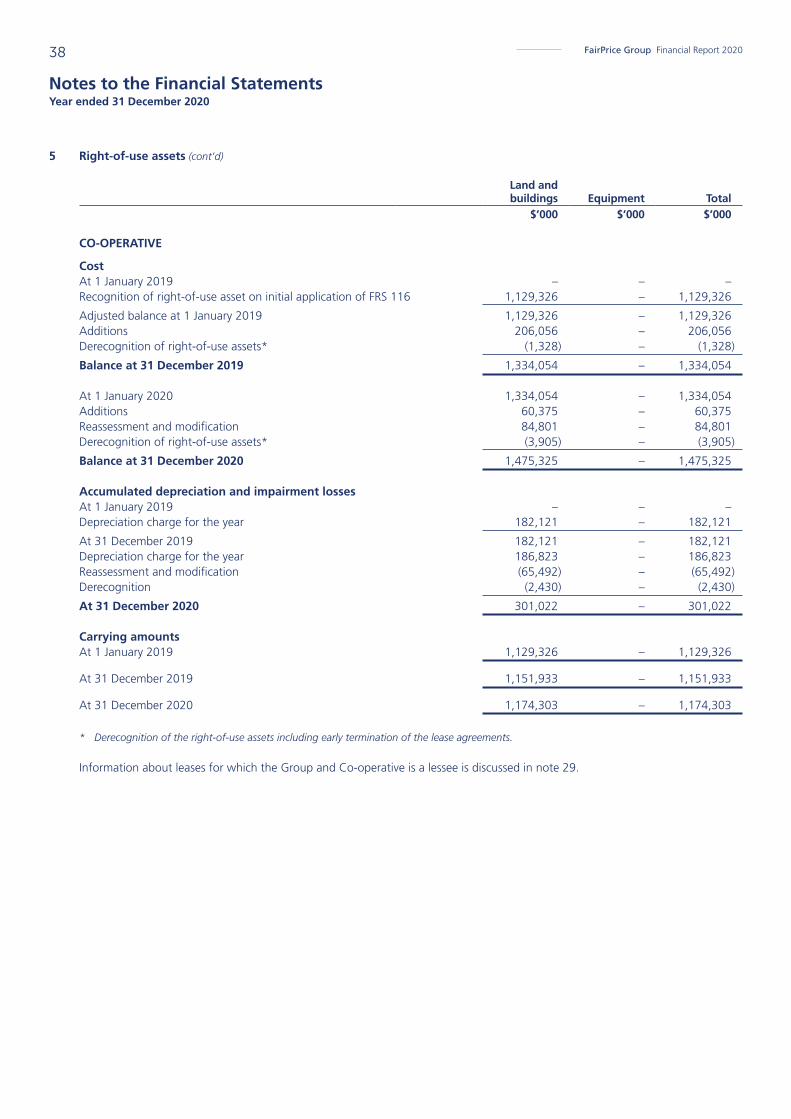
FairPrice Group Financial Report 202038
Notes to the Financial Statements Year ended 31 December 2020
5 Right-of-use assets (cont’d)
Land and buildings Equipment Total
$’000 $’000 $’000
CO-OPERATIVE
Cost At 1 January 2019 – – –Recognition of right-of-use asset on initial application of FRS 116 1,129,326 – 1,129,326
Adjusted balance at 1 January 2019 1,129,326 – 1,129,326Additions 206,056 – 206,056Derecognition of right-of-use assets* (1,328) – (1,328)
Balance at 31 December 2019 1,334,054 – 1,334,054 At 1 January 2020 1,334,054 – 1,334,054Additions 60,375 – 60,375Reassessment and modification 84,801 – 84,801Derecognition of right-of-use assets* (3,905) – (3,905)
Balance at 31 December 2020 1,475,325 – 1,475,325 Accumulated depreciation and impairment losses At 1 January 2019 – – –Depreciation charge for the year 182,121 – 182,121
At 31 December 2019 182,121 – 182,121Depreciation charge for the year 186,823 – 186,823Reassessment and modification (65,492) – (65,492)Derecognition (2,430) – (2,430)
At 31 December 2020 301,022 – 301,022 Carrying amounts At 1 January 2019 1,129,326 – 1,129,326
At 31 December 2019 1,151,933 – 1,151,933
At 31 December 2020 1,174,303 – 1,174,303 * Derecognition of the right-of-use assets including early termination of the lease agreements.
Information about leases for which the Group and Co-operative is a lessee is discussed in note 29.
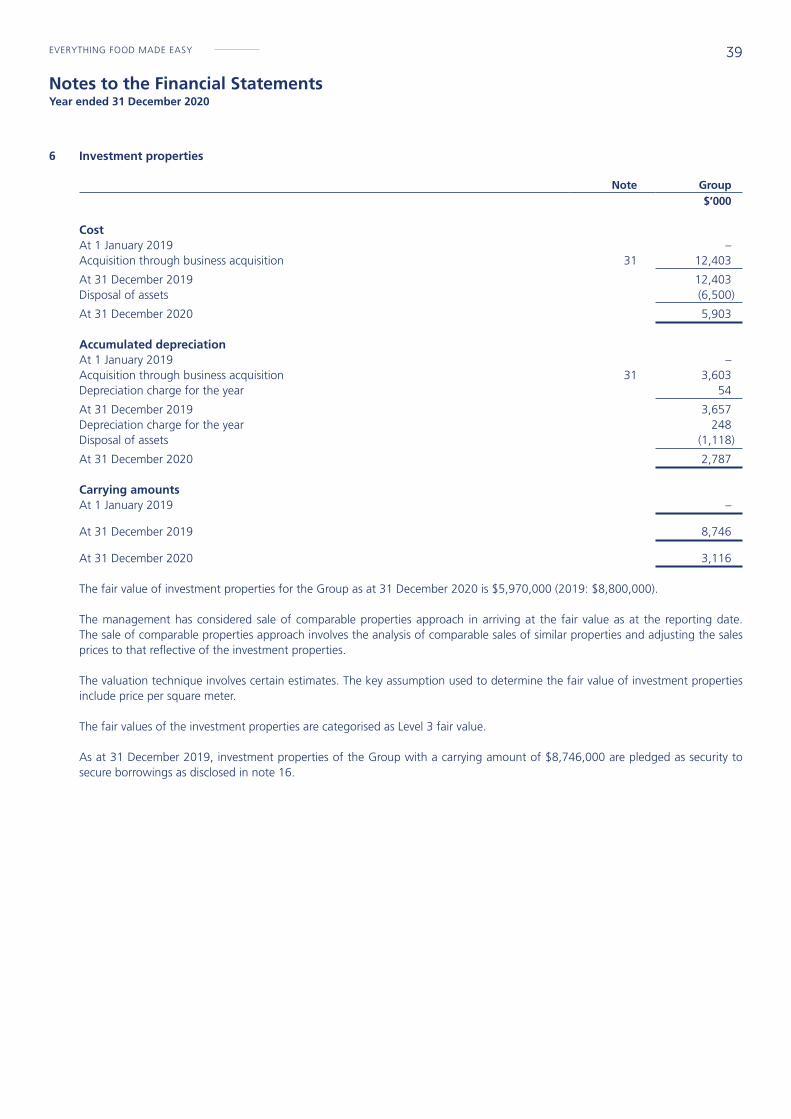
39EVERYTHING FOOD MADE EASY
Notes to the Financial Statements Year ended 31 December 2020
6 Investment properties
Note Group$’000
Cost At 1 January 2019 –Acquisition through business acquisition 31 12,403
At 31 December 2019 12,403Disposal of assets (6,500)
At 31 December 2020 5,903 Accumulated depreciation At 1 January 2019 –Acquisition through business acquisition 31 3,603Depreciation charge for the year 54
At 31 December 2019 3,657Depreciation charge for the year 248Disposal of assets (1,118)
At 31 December 2020 2,787
Carrying amounts At 1 January 2019 –
At 31 December 2019 8,746
At 31 December 2020 3,116 The fair value of investment properties for the Group as at 31 December 2020 is $5,970,000 (2019: $8,800,000).
The management has considered sale of comparable properties approach in arriving at the fair value as at the reporting date. The sale of comparable properties approach involves the analysis of comparable sales of similar properties and adjusting the sales prices to that reflective of the investment properties.
The valuation technique involves certain estimates. The key assumption used to determine the fair value of investment properties include price per square meter.
The fair values of the investment properties are categorised as Level 3 fair value.
As at 31 December 2019, investment properties of the Group with a carrying amount of $8,746,000 are pledged as security to secure borrowings as disclosed in note 16.
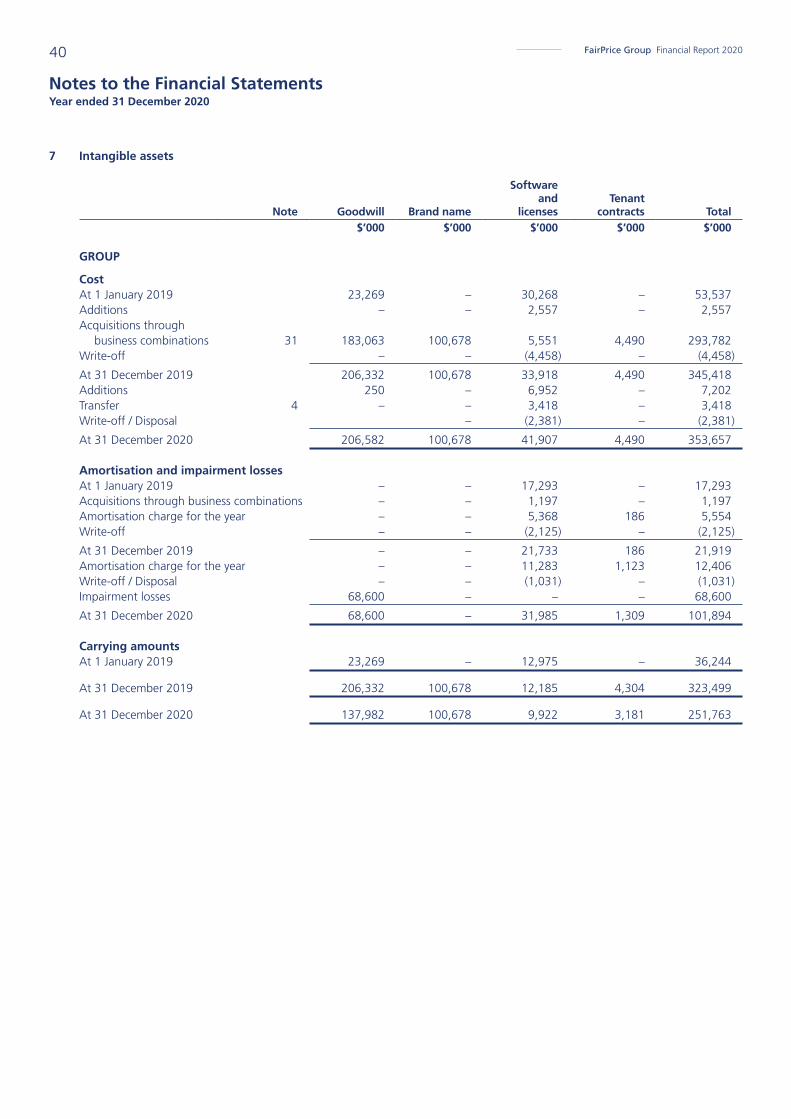
FairPrice Group Financial Report 202040
Notes to the Financial Statements Year ended 31 December 2020
7 Intangible assets
Note Goodwill Brand name
Software and
licensesTenant
contracts Total$’000 $’000 $’000 $’000 $’000
GROUP
Cost At 1 January 2019 23,269 – 30,268 – 53,537Additions – – 2,557 – 2,557Acquisitions through business combinations 31 183,063 100,678 5,551 4,490 293,782Write-off – – (4,458) – (4,458)
At 31 December 2019 206,332 100,678 33,918 4,490 345,418Additions 250 – 6,952 – 7,202Transfer 4 – – 3,418 – 3,418Write-off / Disposal – (2,381) – (2,381)
At 31 December 2020 206,582 100,678 41,907 4,490 353,657
Amortisation and impairment losses At 1 January 2019 – – 17,293 – 17,293Acquisitions through business combinations – – 1,197 – 1,197Amortisation charge for the year – – 5,368 186 5,554Write-off – – (2,125) – (2,125)
At 31 December 2019 – – 21,733 186 21,919Amortisation charge for the year – – 11,283 1,123 12,406Write-off / Disposal – – (1,031) – (1,031)Impairment losses 68,600 – – – 68,600
At 31 December 2020 68,600 – 31,985 1,309 101,894 Carrying amounts At 1 January 2019 23,269 – 12,975 – 36,244
At 31 December 2019 206,332 100,678 12,185 4,304 323,499
At 31 December 2020 137,982 100,678 9,922 3,181 251,763

41EVERYTHING FOOD MADE EASY
Notes to the Financial Statements Year ended 31 December 2020
7 Intangible assets (cont’d)
Goodwill
Software and
licenses Total$’000 $’000 $’000
CO-OPERATIVE
Cost At 1 January 2019 6,085 22,630 28,715Additions – 2,320 2,320Write-off – (4,441) (4,441)
At 31 December 2019 6,085 20,509 26,594Additions – 6,649 6,649Write-off – (2,099) (2,099)
At 31 December 2020 6,085 25,059 31,144 Amortisation At 1 January 2019 – 12,322 12,322Amortisation charge for the year – 4,095 4,095Write-off – (2,109) (2,109)
At 31 December 2019 – 14,308 14,308Amortisation charge for the year – 7,681 7,681Write-off – (981) (981)
At 31 December 2020 – 21,008 21,008 Carrying amounts
At 1 January 2019 6,085 10,308 16,393
At 31 December 2019 6,085 6,201 12,286
At 31 December 2020 6,085 4,051 10,136 In 2020, the Group recognised additional goodwill of $250,000 due to additional purchase consideration paid for the acquisition of Kopitiam in 2019. Please refer to note 31 for additional information on the acquisition.
Impairment testing of CGUs containing goodwill
For the purpose of impairment testing, goodwill has been allocated to the Group’s CGU as follows:
2020 2019$’000 $’000
Food and beverage 114,713 183,063Retail 6,085 6,085Trading 17,184 17,184
137,982 206,332

FairPrice Group Financial Report 202042
Notes to the Financial Statements Year ended 31 December 2020
7 Intangible assets (cont’d)
Impairment test
During the year, the food and beverage cash-generating unit (CGU) was adversely impacted by the Covid-19 pandemic, with the economic downturn, lockdown measures and dine-in restrictions leading to losses recorded. The recoverable amount of the CGU was estimated and $68,600,000 impairment losses was recognised.
The impairment loss on goodwill in the food and beverage CGU was included in ‘impairment of non-financial assets’ in profit or loss. No asset other than goodwill was impaired.
Key assumptions used in the estimation of value in use were as follows:
Discount rate Growth rate Terminal growth rate2020 2019 2020 2019 2020 2019
% % % % % %
Food and beverage 7.5 7.5 3.0 1.0 1.5 1.3Retail 7.0 10.0 1.0 1.0 1.0 1.0Trading 7.0 10.0 1.0 4.0 – 7.0 1.0 1.0 The recoverable amounts of the CGUs are determined based on value in use calculations. The value in use calculation is a discounted cash flow model using cash flow projections based on the most recent forecasts approved by management covering 1 to 5 years. Cash flows beyond these periods are extrapolated using the estimated terminal growth rates stated in the table above. The terminal growth rates used for each CGU are within management’s expectation of the long term average growth rates of the respective industry in which the CGUs operate. The discount rates applied are the weighted average cost of capital from the relevant business segments.
The recoverable amount of the food and beverage CGU is sensitive to changes to the discount rate and terminal growth rate used in the recoverable amount calculations. The following changes in assumptions would have resulted in a significant increase/(decrease) in the impairment loss as follows:
Key assumptions used for recoverable amount
calculations
Discount
rateTerminal
growth rate
$’000 $’000
CGU: - An increase by 0.5% 10,912 (8,596)- A decrease by 0.5% (12,569) 7,274 Management has identified that a reasonably possible change in a key assumption could cause the carrying amount to exceed the recoverable amount. The following table shows the amount by which this assumption would need to change for the estimated recoverable amount to be equal to the carrying amount.
Change required for carrying amount to equal the recoverable amount
2020 2019
% %
Discount rate: - Food and beverage services * 5.9- Retail 2.2 3.9- Trading 6.1 3.8
* Not relevant for 31 December 2020 as the food and beverage CGU has been impaired to its recoverable amount.

43EVERYTHING FOOD MADE EASY
Notes to the Financial Statements Year ended 31 December 2020
8 Subsidiaries
CO-OPERATIVE2020 2019$’000 $’000
Unquoted equity shares, at cost 383,613 383,363Less: Impairment loss (73,136) (4,536)
310,477 378,827 Movement in allowance for impairment loss is as follows:
CO-OPERATIVE2020 2019$’000 $’000
As at 1 January 4,536 4,536Impairment loss during the year 68,600 –
As at 31 December 73,136 4,536 The Co-operative assessed the carrying amount of its investments in subsidiaries for indicators of impairment loss. Based on the Co-operative’s assessment, the Co-operative has recognised an impairment loss of $68,600,000 on its investment in Kopitiam Investment Pte Ltd (“Kopitiam”). The recoverable amount of Kopitiam is determined based on the value-in-use calculations by management, on cash generating unit (CGU) basis. Kopitiam is the holding company of the food and beverage CGU, which goodwill was recognised and tested for impairment at Group level (note 7).
As at the reporting date, the impairment loss of $4,536,000 recognised on its investment in NewFront Investments Pte Ltd in the prior years continued to be appropriate as the subsidiary was still loss-making. The recoverable amount of the investment was determined based on net asset position of the subsidiary which approximated its fair value as at 31 December 2020.
Details of the subsidiaries as at 31 December are as follows:
Ownership interestName of subsidiaries Principal activities
Country of incorporation and operation 2020 2019
% %
Grocery Logistics of Singapore Pte Ltd Warehousing and distribution Singapore 100.0 100.0
AlphaPlus Investments Pte Ltd Investment holding Singapore 100.0 100.0
NewFront Investments Pte Ltd Investment holding Singapore 100.0 100.0
Cheers Holdings (2004) Pte Ltd Convenience store operator Singapore 100.0 100.0
Interstates Market (2007) Pte Ltd Trading Singapore 100.0 100.0
FPTM Pte Ltd Investment holding Singapore 100.0 100.0
Fairprice International (2010) Pte Ltd Investment holding Singapore 100.0 100.0
Origins Healthcare Pte Ltd Trading Singapore 100.0 100.0
NTUC Enterprise Nexus Co-operative Limited (“Nexus”)
Shared services provider Singapore 99.0 99.0
Kopitiam Investment Pte Ltd (“Kopitiam”) Food outlets operator Singapore 100.0 100.0
NTUC Foodfare Co-operative Ltd (“NTUC Foodfare”)
Managing of food outlets Singapore 99.9 99.9

FairPrice Group Financial Report 202044
Notes to the Financial Statements Year ended 31 December 2020
8 Subsidiaries (cont’d)
Ownership interestName of subsidiaries Principal activities
Country of incorporation and operation 2020 2019
% %
Fairprice Group Holdings Pte Ltd Investment holding Singapore 100.0 –
Fairprice Group Food Services Pte Ltd Operation of food courts and food kiosks
Singapore 100.0 –
Fairprice Group Food Solutions Pte Ltd Wholesale of food and beverages Singapore 100.0 –
Fairprice Group Supply Chain Pte Ltd Wholesale trade of goods without a dominant product
Singapore 100.0 –
Subsidiary of AlphaPlus Investments Pte Ltd (i)
Thomson Plaza Investments Pte Ltd Property owner Singapore 100.0 100.0
Subsidiary of Nexus
Cleaning Concept Pte Ltd Provision of cleaning services Singapore 100.0 100.0
Subsidiary of NTUC Foodfare
Foodfare Catering Pte Ltd Catering and supply of food and beverages
Singapore 70 70
Subsidiaries of Kopitiam
Kopitiam Properties Pte Ltd Investment holding Singapore 100.0 100.0
S28 Holdings Pte Ltd Investment holding Singapore 100.0 100.0
Bagus Management Pte Ltd Operation of food courts and provision of related services
Singapore * 100.0
Copitiam Pte Ltd Operation of food courts and provision of related services
Singapore * 100.0
Kopisi Pte Ltd Operation of food courts and provision of related services
Singapore * 100.0
Renaissance Properties Pte Ltd Operation of food courts/centre, operation and promotion of the Lau Pa Sat festival market and provision of related services
Singapore 100.0 100.0
The Dessert Shop Pte Ltd Manufacturer and wholesaler of desserts and beverages
Singapore * 100.0

45EVERYTHING FOOD MADE EASY
Notes to the Financial Statements Year ended 31 December 2020
8 Subsidiaries (cont’d)
Ownership interestName of subsidiaries Principal activities
Country of incorporation and operation 2020 2019
% %
The Pau Shop Pte Ltd Manufacturer, distributor and retailer of dim sum, bakery products and beverages
Singapore * 100.0
Shi Hui Yuan Pte Ltd Food stall operator and restaurants Singapore 100.0 100.0
Kleanway Pte Ltd ** General cleaning contractors Singapore 100.0 100.0
Pa Sat (Kopitiam) Pte Ltd ** General wholesale trade Singapore 100.0 100.0
iMetrics Pte Ltd ** Software and hardware engineering and all activities related to information technology
Singapore 100.0 100.0
The above subsidiaries are audited by KPMG LLP, Singapore.
* The entities are amalgamated into Kopitiam Properties Pte Ltd during the year.
** The entities are under voluntary liquidation.
(i) AlphaPlus Investment Pte Ltd is a member of NTUC Fairprice Foundation Ltd. The result and net assets of NTUC Fairprice Foundation Ltd (“Foundation”) have not been consolidated as the Memorandum of Association (“M&A”) of the Foundation provides that it cannot pay, or transfer directly or indirectly from its income and property to the member in the form of dividend, bonus, or by way of profit, except for payments made in good faith in return for goods and services. Furthermore, the Memorandum provides that in the event of winding up of the Foundation, the residual assets after the satisfaction of all its debts and liabilities shall not be paid to or distributed to the member of the Foundation. Approval from the Commissioner of Charities is required if the member were to amend the clauses in the M&A. Consequently, the Group does not have control over the assets and reserve of the Foundation and hence the Foundation is not accounted for as a subsidiary of the Group.
Non-controlling interests
The following subsidiary have a non-controlling interests (“NCI”).
Ownership interestsheld by NCI
Name of entity Country of incorporation 2020 2019
% %
NTUC Foodfare Singapore 0.025 0.025

FairPrice Group Financial Report 202046
Notes to the Financial Statements Year ended 31 December 2020
8 Subsidiaries (cont’d)
Non-controlling interests (cont’d)
The following summarises the financial information of the Group’s subsidiary with material non-controlling interests, prepared in accordance with FRS and the Group’s accounting policies. The information is before inter-company eliminations with other entities in the Group.
NTUC Foodfare
2020 2019$’000 $’000
Revenue 79,214 28,614 Profit for the year (7,407) 1,452Other comprehensive income for the year (783) 488
Total comprehensive income for the year (8,190) 1,940 Attributable to NCI from the date of acquisition to 31 December: - Profit 726 95- Other comprehensive income (206) 32
- Total comprehensive income 520 127
Non-current assets 90,500 93,805Current assets 40,172 39,376Non-current liabilities (43,714) (30,226)Current liabilities (42,099) (47,167)
Net assets 44,859 55,788
Net assets attributable to NCI 4,623 4,184 Cash flows from operating activities 52,250 36,379Cash flows used in investing activities (35,106) (24,146)Cash flows used in financing activities (20,294) (943)
Net increase in cash and cash equivalents (3,150) 11,290

47EVERYTHING FOOD MADE EASY
Notes to the Financial Statements Year ended 31 December 2020
9 Associates
GROUP CO-OPERATIVE 2020 2019 2020 2019
$’000 $’000 $’000 $’000
Interests in associates 894,494 869,355 990,889 968,120
Details of the associates as at 31 December are as follows:
Ownership interestName of associates Principal activities
Country of incorporation and operation 2020 2019
% %
SG Domain Pte Ltd (1) Investment holding Singapore 20.0 20.0
Mercatus Co-operative Limited (1) Property investment Singapore 41.37 41.37
Associates of NewFront Investments Pte Ltd
NTUC Co-operatives Suzhou Investments Pte Ltd (1)
Investment holding Singapore 26.6 26.6
Nextmall (Cayman Islands) Holdings Corporation (2)
Hypermarket retailing Cayman Islands 33 .7 33.7
Quayline Fairprice Sdn Bhd Supermarket retailing Malaysia * 40.0
Associate of AlphaPlus Investments Pte Ltd
SMRT Alpha Pte. Ltd. (3) Real estate management Singapore 30.0 30.0
Associate of Fairprice International (2010) Pte Ltd
Saigon Co-operative Fairprice Ltd (4) Supermarket retailing Vietnam 36.0 36.0
(1) Audited by KPMG LLP, Singapore.(2) Under members’ voluntary liquidation.(3) Audited by Ernst and Young LLP, Singapore.(4) Audited by Deloitte Vietnam.
* This investment has been liquidated.
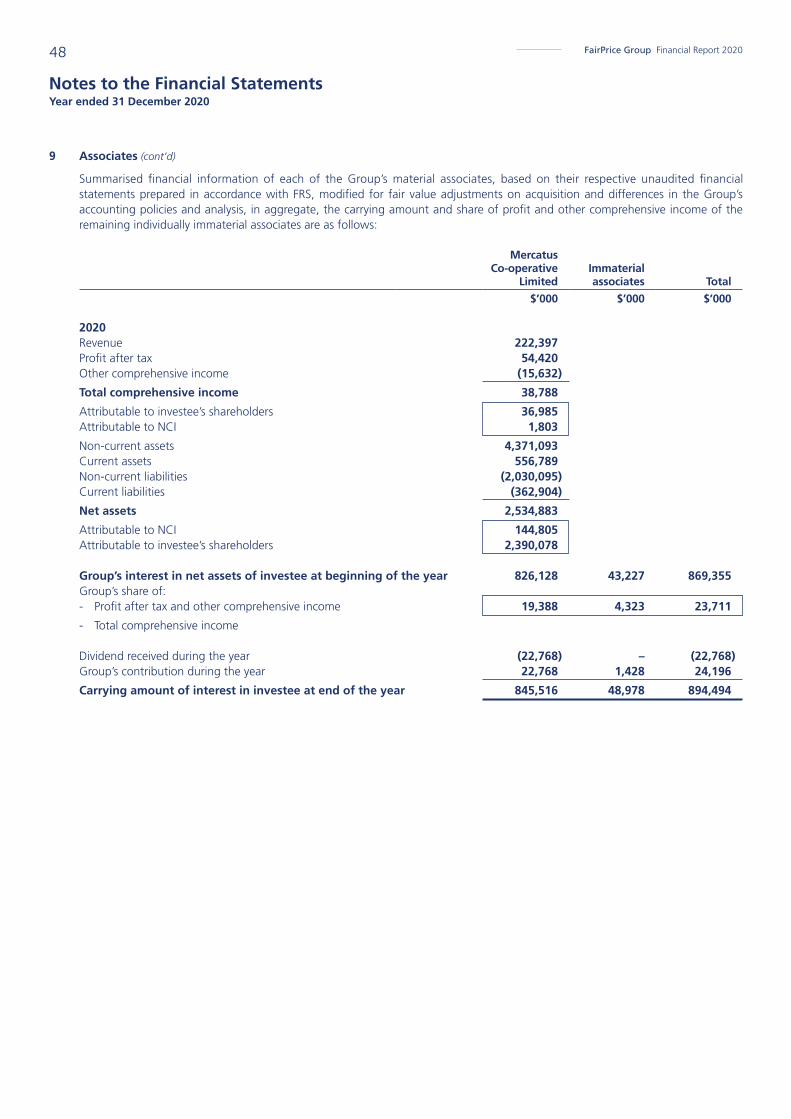
FairPrice Group Financial Report 202048
Notes to the Financial Statements Year ended 31 December 2020
9 Associates (cont’d)
Summarised financial information of each of the Group’s material associates, based on their respective unaudited financial statements prepared in accordance with FRS, modified for fair value adjustments on acquisition and differences in the Group’s accounting policies and analysis, in aggregate, the carrying amount and share of profit and other comprehensive income of the remaining individually immaterial associates are as follows:
Mercatus Co-operative
LimitedImmaterial associates Total
$’000 $’000 $’000
2020Revenue 222,397Profit after tax 54,420 Other comprehensive income (15,632)
Total comprehensive income 38,788
Attributable to investee’s shareholders 36,985 Attributable to NCI 1,803
Non-current assets 4,371,093 Current assets 556,789 Non-current liabilities (2,030,095)Current liabilities (362,904)
Net assets 2,534,883
Attributable to NCI 144,805 Attributable to investee’s shareholders 2,390,078
Group’s interest in net assets of investee at beginning of the year 826,128 43,227 869,355Group’s share of: - Profit after tax and other comprehensive income 19,388 4,323 23,711
- Total comprehensive income Dividend received during the year (22,768) – (22,768)Group’s contribution during the year 22,768 1,428 24,196
Carrying amount of interest in investee at end of the year 845,516 48,978 894,494

49EVERYTHING FOOD MADE EASY
Notes to the Financial Statements Year ended 31 December 2020
9 Associates (cont’d)
Mercatus Co-operative
Limited
NTUC Foodfare
Co-operative Limited
Immaterial associates Total
$’000 $’000 $’000 $’000
2019Revenue 259,723 Profit after tax 76,858 Other comprehensive income (5,227)
Total comprehensive income 71,631
Attributable to investee’s shareholders 69,598 Attributable to NCI 2,033 Non-current assets 4,628,237 Current assets 274,701 Non-current liabilities (1,897,742) Current liabilities (507,881)
Net assets 2,497,315
Attributable to NCI 145,402 Attributable to investee’s shareholders 2,351,913 Group’s interest in net assets of investee at beginning of the year 794,399 23,695 39,408 857,502Group’s share of: - Profit after tax and other comprehensive income 31,729 220 2,765 34,714
- Total comprehensive income 31,729 220 2,765 34,714 Carrying amount of interest in associate acquired as subsidiary – (23,915) – (23,915)Dividend received during the year (22,045) – – (22,045)Group’s contribution during the year 22,045 – 2,482 24,527Impairment loss on investment in an associate – – (1,428) (1,428)
Carrying amount of interest in investee at end of the year 826,128 – 43,227 869,355 During the year, $22,769,000 (2019: $22,045,000) of the Group’s contribution relates to the dividend paid via issuance of ordinary shares by Mercatus Co-operative Limited.
The Group’s share of results of certain associates has been recognised to the extent of the carrying amount of the investments as there is no obligation to contribute to any losses in excess of the amount of investment. The accumulated unrecognised share of losses amounted to approximately $15,650,000 (2019: $3,042,000).
There are no significant restrictions on the ability of associates to transfer funds to the Group in form of cash dividends, or to repay loans or advances made by the Group.

FairPrice Group Financial Report 202050
Notes to the Financial Statements Year ended 31 December 2020
10 Other investments
GROUP CO-OPERATIVE 2020 2019 2020 2019
$’000 $’000 $’000 $’000
Quoted unit trust - FVOCI – 752,027 – 633,634Quoted equity investments - FVOCI 4,960 243,138 – 237,344Quoted debt investments - FVOCI – 239,401 – 236,985Unquoted equity investments - FVOCI 1,136,776 10 1,136,264 –Unquoted debt investment - at amortised cost 330,000 330,000 330,000 330,000Other investments 750 750 750 750
1,472,486 1,565,326 1,467,014 1,438,713 Non-current 1,472,486 1,325,925 1,467,014 1,201,728Current – 239,401 – 236,985
1,472,486 1,565,326 1,467,014 1,438,713 The fair value of quoted unit trusts and equity investments is based on quoted bid price.
Dividend income related to unit trusts and equity investments at FVOCI for the Group and Co-operative amounting to $19,164,000 (2019: $40,717,000) and $15,961,000 (2019: $35,703,000) respectively.
During the year, the Group and Co-operative transferred investment portfolio amounting to $1,010,053,000 to Angsana Macro Fund (AMF) in exchange for 744,997,614 units in AMF which holds investments in quoted unit trust, quoted equity investments and quoted debt investment.
The fair value of the unquoted equity investments is categorised as Level 2 fair value based on observable market data (see note 2.4).
In prior year, investments in quoted debt securities for the Group and Co-operative with effective interest rates 3.06% and 3.04% per annum respectively had maturity dates ranging January 2020 to April 2077.
Investments in unquoted debt with effective interest rate of 3.1% (2019: 3.1%) per annum for the Group and Co-operative have maturity date until April 2047 (2019: April 2047).

51EVERYTHING FOOD MADE EASY
Notes to the Financial Statements Year ended 31 December 2020
11 Trade and other receivables
GROUP CO-OPERATIVE 2020 2019 2020 2019
$’000 $’000 $’000 $’000
Trade receivables 51,714 42,609 22,024 18,510Less: Impairment loss (8,989) (7,830) (270) (54)
42,725 34,779 21,754 18,456 Trade amounts due from: - Ultimate holding entity 844 707 – 9- Related parties 4,364 955 – 312- Subsidiaries – – 20,245 2,078
- Associates 28 629 – 629
5,236 2,291 20,245 3,028
Loans to subsidiaries – – 178,183 125,888Less: Impairment loss – – (50,766) (50,653)
– – 127,417 75,235
Loans to associates 4,333 4,333 – –Less: Impairment loss (4,333) (4,333) – –
– – – –Lease receivables 489 1,607 125 1,607Deposits 53,090 54,823 23,882 21,297Prepayments 84,736 21,656 82,208 18,614Interest receivables 7,231 9,907 8,164 9,870Other receivables: - External parties 97,342 10,466 87,413 190- Ultimate holding entity 554 3,699 528 500- Subsidiaries – – 3,174 –- Related parties 1,374 – 1,372 –
292,777 139,228 376,282 148,797 Non-current 12,346 10,790 127,417 75,634Current 280,431 128,438 248,865 73,163
292,777 139,228 376,282 148,797 The average credit period on sale of goods is 30 to 60 days (2019: 30 to 60 days).
The loans to subsidiaries are unsecured and bear interest ranging from 2.9% to 3.0% (2019: 3.0%) per annum during the year. The remaining loans to subsidiaries of $50,509,000 (2019: $50,500,000) are interest-free. Both loans to subsidiaries are not expected to be repaid within 12 months from the reporting period. The Co-operative has recognised an impairment loss of $113,000 on loans to subsidiaries during the year.
Loan to an associate was unsecured and bore interest at 4.0% per annum and was not expected to be repaid within 12 months from the reporting period. The loan to associate had been fully impaired in prior year.
The Group and the Co-operative’s exposure to credit and currency risks, and impairment losses for trade and other receivables, are disclosed in note 32.
Other receivables of external parties in 2020 mainly comprise of government grant receivables. Prepayments comprise amounts paid to suppliers and for certain acquisition made by the Group. Please refer to note 34 (a).
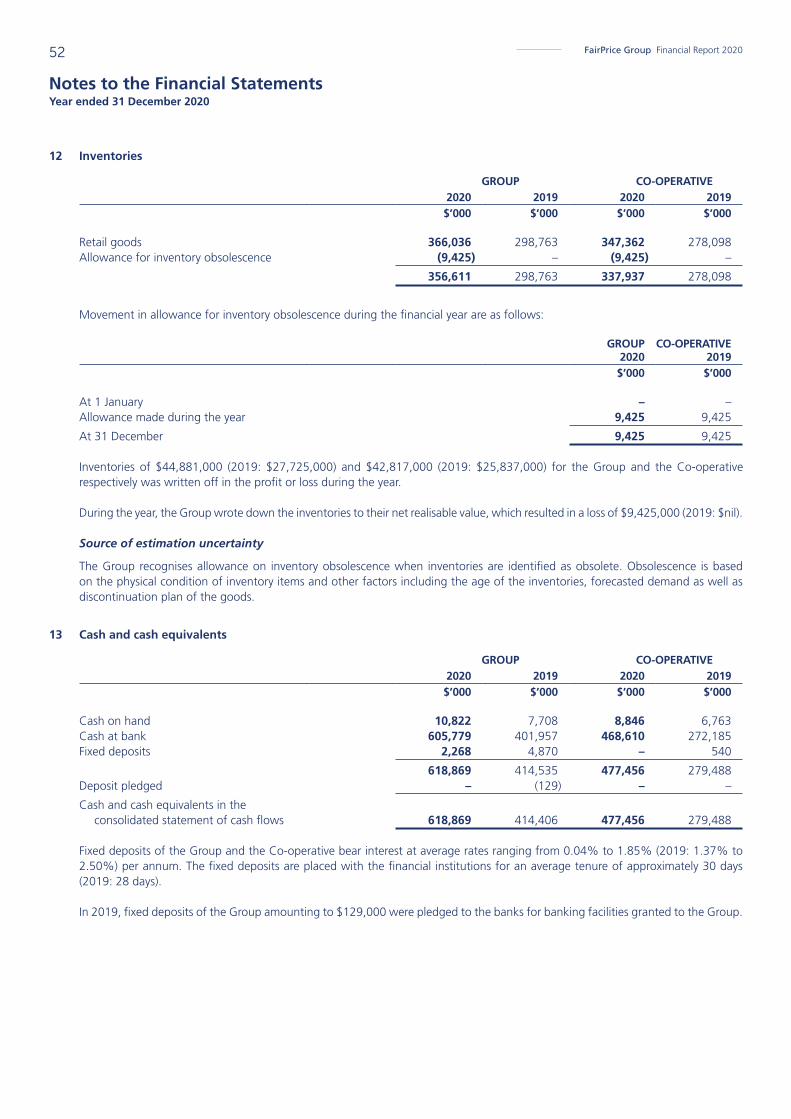
FairPrice Group Financial Report 202052
Notes to the Financial Statements Year ended 31 December 2020
12 Inventories
GROUP CO-OPERATIVE 2020 2019 2020 2019
$’000 $’000 $’000 $’000
Retail goods 366,036 298,763 347,362 278,098Allowance for inventory obsolescence (9,425) – (9,425) –
356,611 298,763 337,937 278,098
Movement in allowance for inventory obsolescence during the financial year are as follows:
GROUP 2020
CO-OPERATIVE2019
$’000 $’000
At 1 January – –Allowance made during the year 9,425 9,425
At 31 December 9,425 9,425 Inventories of $44,881,000 (2019: $27,725,000) and $42,817,000 (2019: $25,837,000) for the Group and the Co-operative respectively was written off in the profit or loss during the year.
During the year, the Group wrote down the inventories to their net realisable value, which resulted in a loss of $9,425,000 (2019: $nil).
Source of estimation uncertainty
The Group recognises allowance on inventory obsolescence when inventories are identified as obsolete. Obsolescence is based on the physical condition of inventory items and other factors including the age of the inventories, forecasted demand as well as discontinuation plan of the goods.
13 Cash and cash equivalents
GROUP CO-OPERATIVE 2020 2019 2020 2019
$’000 $’000 $’000 $’000
Cash on hand 10,822 7,708 8,846 6,763Cash at bank 605,779 401,957 468,610 272,185Fixed deposits 2,268 4,870 – 540
618,869 414,535 477,456 279,488Deposit pledged – (129) – –
Cash and cash equivalents in the consolidated statement of cash flows 618,869 414,406 477,456 279,488 Fixed deposits of the Group and the Co-operative bear interest at average rates ranging from 0.04% to 1.85% (2019: 1.37% to 2.50%) per annum. The fixed deposits are placed with the financial institutions for an average tenure of approximately 30 days (2019: 28 days).
In 2019, fixed deposits of the Group amounting to $129,000 were pledged to the banks for banking facilities granted to the Group.

53EVERYTHING FOOD MADE EASY
Notes to the Financial Statements Year ended 31 December 2020
14 Share capital
CO-OPERATIVE
2020 2019 2020 2019
Number of ordinary shares
’000 ’000 $’000 $’000
Authorised: Ordinary shares 500,000 500,000 500,000 500,000 Issued and paid up: At beginning of the year 436,740 437,864 436,740 437,864 Issued during the year 670 650 670 650 Redemption during the year (1,205) (1,774) (1,205) (1,774)
At end of the year 436,205 436,740 436,205 436,740
CO-OPERATIVE
2020 2019 2020 2019
Number of ordinary shares
’000 ’000 $’000 $’000
The share capital is represented by: Members’ shares hold by the founder member National Trade Union Congress (b) (c) (d) 82,800 39,700 82,800 39,700Other members’ shares (a) (c) (d) 353,405 397,040 353,405 397,040
436,205 436,740 436,205 436,740
(a) This relates to the shares held by members where the Co-operative has the right of refusal to redeem the members’ shares. Included in the members’ shares is 100,000,000 shares allotted to NTUC Enterprise Co-operative Limited by the Co-operative amounting to $100,000,000 which are not to be withdrawn or transferred within ten years from the date of their issue. Members include an individual person or institution or organisation duly admitted to the membership of the Co-operative in accordance with the By-laws of the Co-operative. In accordance with By-laws 5.6, the shares are redeemable at the lower of the nominal value of $1 per share or the net asset value of the share.
(b) This relates to the shares held by the founder member National Trade Union Congress.(c) In accordance with By-laws 4.2.2, the Board of Directors shall have the absolute discretion to approve or reject any application for membership
or for additional shares without assigning any reason for its decision. By-laws 4.6 also states that, every member shall, unless otherwise disqualified under the Co-operative Societies Act, Chapter 62 or the By-laws, have the right to:
(i) avail himself of all services of the Society;
(ii) stand for election to office, subject to the provisions of the Act and the By-laws, where applicable;
(iii) be co-opted to hold office in the Society, where applicable;
(iv) participate and vote at general meetings; and
(v) enjoy all other rights, privileges or benefits provided under the By-laws.(d) The Co-operative’s ordinary shares carry no right to fixed income.
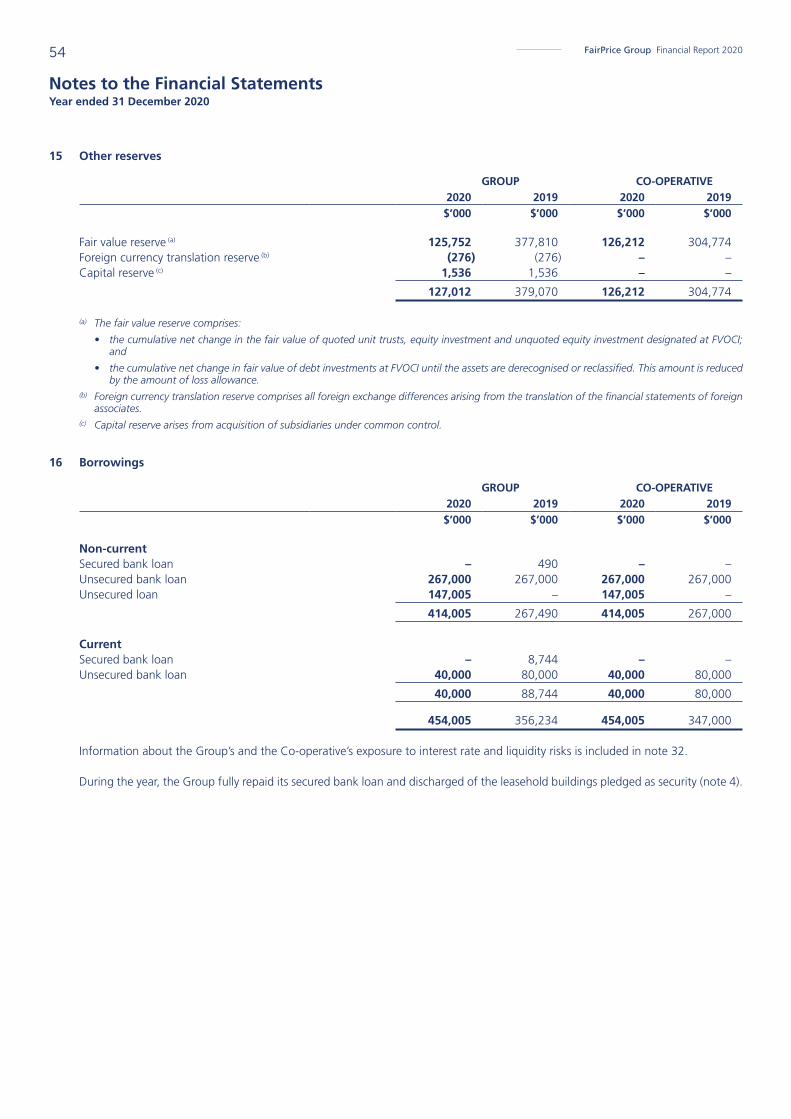
FairPrice Group Financial Report 202054
Notes to the Financial Statements Year ended 31 December 2020
15 Other reserves
GROUP CO-OPERATIVE 2020 2019 2020 2019
$’000 $’000 $’000 $’000
Fair value reserve (a) 125,752 377,810 126,212 304,774Foreign currency translation reserve (b) (276) (276) – –Capital reserve (c) 1,536 1,536 – –
127,012 379,070 126,212 304,774
(a) The fair value reserve comprises:
• the cumulative net change in the fair value of quoted unit trusts, equity investment and unquoted equity investment designated at FVOCI; and
• the cumulative net change in fair value of debt investments at FVOCI until the assets are derecognised or reclassified. This amount is reduced by the amount of loss allowance.
(b) Foreign currency translation reserve comprises all foreign exchange differences arising from the translation of the financial statements of foreign associates.
(c) Capital reserve arises from acquisition of subsidiaries under common control.
16 Borrowings
GROUP CO-OPERATIVE2020 2019 2020 2019$’000 $’000 $’000 $’000
Non-current Secured bank loan – 490 – –Unsecured bank loan 267,000 267,000 267,000 267,000Unsecured loan 147,005 – 147,005 –
414,005 267,490 414,005 267,000 Current Secured bank loan – 8,744 – –Unsecured bank loan 40,000 80,000 40,000 80,000
40,000 88,744 40,000 80,000
454,005 356,234 454,005 347,000 Information about the Group’s and the Co-operative’s exposure to interest rate and liquidity risks is included in note 32.
During the year, the Group fully repaid its secured bank loan and discharged of the leasehold buildings pledged as security (note 4).
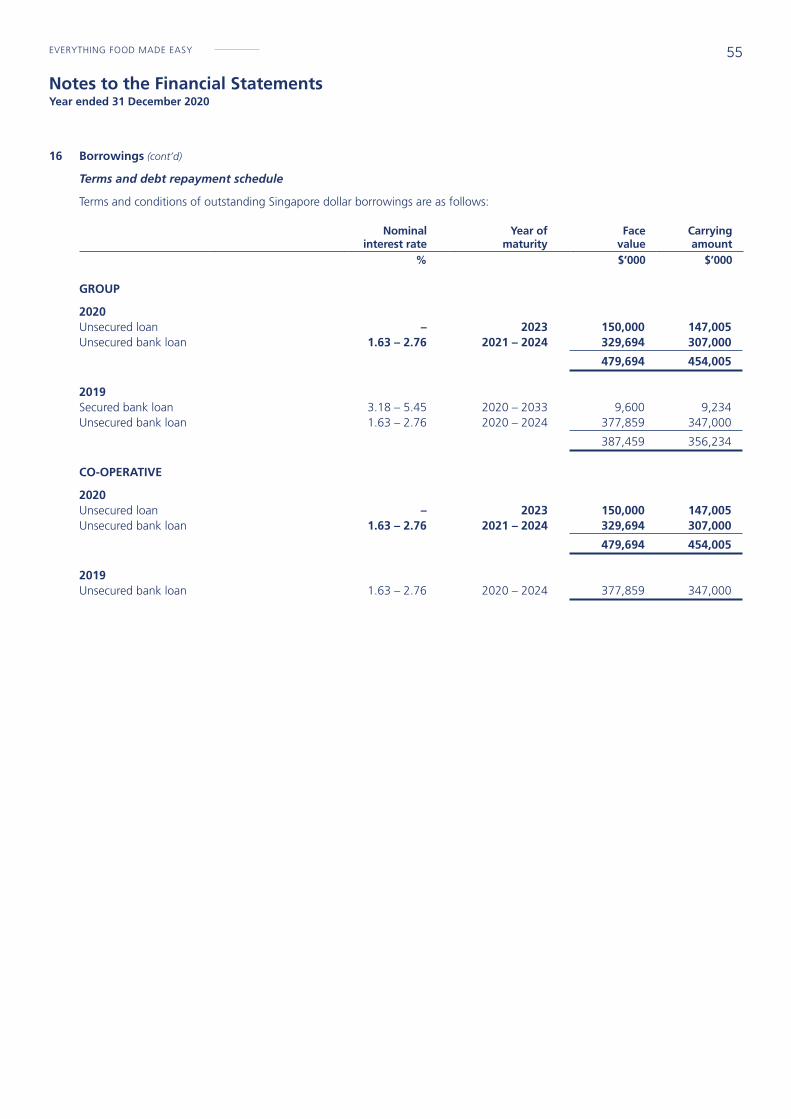
55EVERYTHING FOOD MADE EASY
Notes to the Financial Statements Year ended 31 December 2020
16 Borrowings (cont’d)
Terms and debt repayment schedule
Terms and conditions of outstanding Singapore dollar borrowings are as follows:
Nominal
interest rateYear of
maturityFace
valueCarrying amount
% $’000 $’000
GROUP
2020Unsecured loan – 2023 150,000 147,005Unsecured bank loan 1.63 – 2.76 2021 – 2024 329,694 307,000
479,694 454,005 2019Secured bank loan 3.18 – 5.45 2020 – 2033 9,600 9,234Unsecured bank loan 1.63 – 2.76 2020 – 2024 377,859 347,000
387,459 356,234 CO-OPERATIVE
2020Unsecured loan – 2023 150,000 147,005Unsecured bank loan 1.63 – 2.76 2021 – 2024 329,694 307,000
479,694 454,005 2019Unsecured bank loan 1.63 – 2.76 2020 – 2024 377,859 347,000

FairPrice Group Financial Report 202056
Notes to the Financial Statements Year ended 31 December 2020
17 Lease liabilities
GROUP CO-OPERATIVE 2020 2019 2020 2019
$’000 $’000 $’000 $’000
Non-current 1,229,131 1,199,066 1,033,658 1,003,503Current 257,283 271,366 174,153 167,712
1,486,414 1,470,432 1,207,811 1,171,215
Terms and conditions of outstanding Singapore dollar lease liabilities are as follows:
Nominal
interest rateYear of
maturityFace
valueCarrying amount
% $’000 $’000
GROUP
2020Lease liabilities 0.81 – 4.32 2021 – 2072 1,671,709 1,486,414 2019Lease liabilities 1.95 – 4.32 2020 – 2072 1,694,823 1,470,432
CO-OPERATIVE
2020Lease liabilities 0.81 – 1.95 2021 – 2072 1,380,458 1,207,811 2019Lease liabilities 1.95 – 3.10 2020 – 2072 1,355,710 1,171,215

57EVERYTHING FOOD MADE EASY
Notes to the Financial Statements Year ended 31 December 2020
17 Lease liabilities (cont’d)
Reconciliation of movements of liabilities to cash flows arising from financing activities
NoteLease
liabilities Borrowings Total
$’000 $’000 $’000
GROUP
Balance at 1 January 2019 – 60,000 60,000Adjustment on initial adoption of FRS 116 1,199,659 – 1,199,659
Adjusted balance at 1 January 2019 1,199,659 60,000 1,259,659 Changes from investing cash flow Acquisitions through business combinations 31 208,617 280,885 489,502
Total changes from investing cash flow 208,617 280,885 489,502 Changes from financing cash flows Repayment of borrowings – (24,651) (24,651)Proceeds from borrowings – 40,000 40,000Payment of lease liabilities (200,395) – (200,395)Interest paid (36,902) (2,275) (39,177)
Total changes from financing cash flows (237,297) 13,074 (224,223) Other changesLiability-related New leases and revised rental rate 263,933 – 263,933Interest expense 36,902 2,275 39,177Derecognition of lease liabilities (1,382) – (1,382)
Total liability-related other changes 299,453 2,275 301,728
Balance at 31 December 2019 1,470,432 356,234 1,826,666
Balance at 1 January 2020 1,470,432 356,234 1,826,666 Changes from financing cash flows Repayment of borrowings – (52,229) (52,229)Proceeds from borrowings – 150,000 150,000Payment of lease liabilities (269,522) – (269,522)Interest paid (42,043) (9,413) (51,456)
Total changes from financing cash flows (311,565) 88,358 (223,207) Other changesLiability-related New leases and revised rental rate 328,247 – 328,247Interest expense 42,043 9,413 51,456Derecognition of lease liabilities (42,743) – (42,743)
Total liability-related other changes 327,547 9,413 336,960
Balance at 31 December 2020 1,486,414 454,005 1,940,419
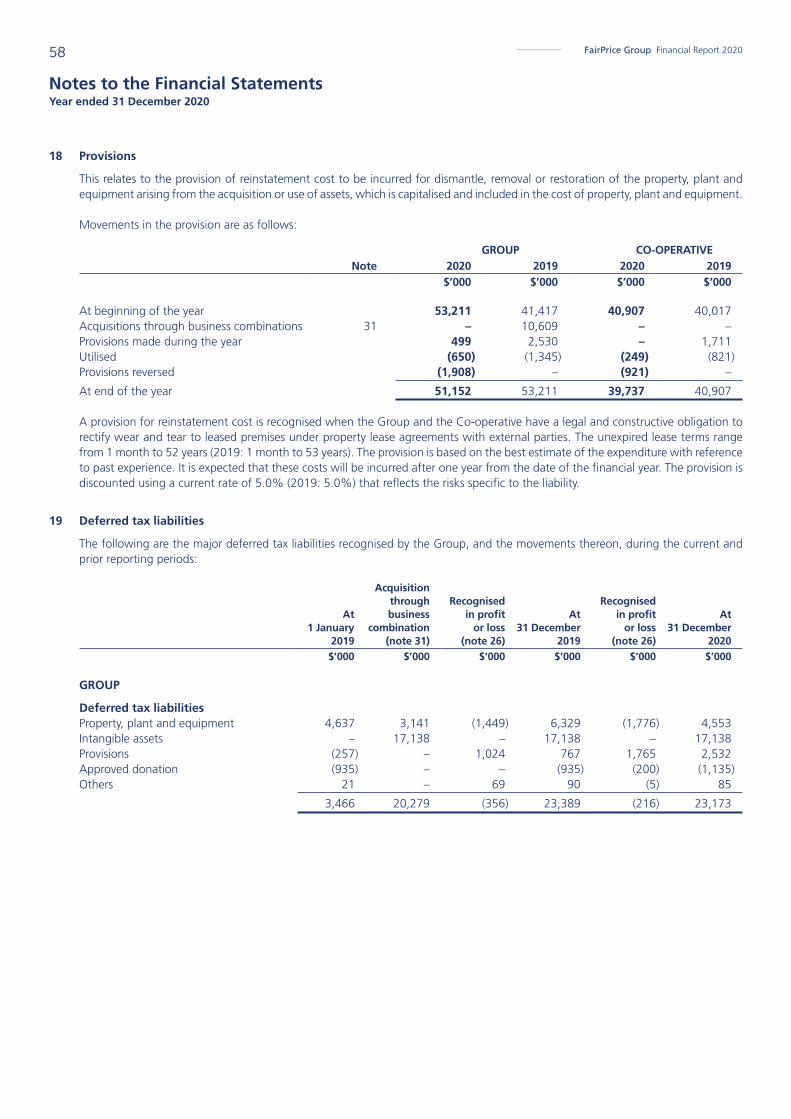
FairPrice Group Financial Report 202058
Notes to the Financial Statements Year ended 31 December 2020
18 Provisions
This relates to the provision of reinstatement cost to be incurred for dismantle, removal or restoration of the property, plant and equipment arising from the acquisition or use of assets, which is capitalised and included in the cost of property, plant and equipment.
Movements in the provision are as follows:
GROUP CO-OPERATIVENote 2020 2019 2020 2019
$’000 $’000 $’000 $’000
At beginning of the year 53,211 41,417 40,907 40,017Acquisitions through business combinations 31 – 10,609 – –Provisions made during the year 499 2,530 – 1,711Utilised (650) (1,345) (249) (821)Provisions reversed (1,908) – (921) –
At end of the year 51,152 53,211 39,737 40,907 A provision for reinstatement cost is recognised when the Group and the Co-operative have a legal and constructive obligation to rectify wear and tear to leased premises under property lease agreements with external parties. The unexpired lease terms range from 1 month to 52 years (2019: 1 month to 53 years). The provision is based on the best estimate of the expenditure with reference to past experience. It is expected that these costs will be incurred after one year from the date of the financial year. The provision is discounted using a current rate of 5.0% (2019: 5.0%) that reflects the risks specific to the liability.
19 Deferred tax liabilities
The following are the major deferred tax liabilities recognised by the Group, and the movements thereon, during the current and prior reporting periods:
At 1 January
2019
Acquisition through business
combination (note 31)
Recognised in profit
or loss (note 26)
At 31 December
2019
Recognised in profit
or loss (note 26)
At 31 December
2020$’000 $’000 $’000 $’000 $’000 $’000
GROUP
Deferred tax liabilities Property, plant and equipment 4,637 3,141 (1,449) 6,329 (1,776) 4,553Intangible assets – 17,138 – 17,138 – 17,138Provisions (257) – 1,024 767 1,765 2,532Approved donation (935) – – (935) (200) (1,135)Others 21 – 69 90 (5) 85
3,466 20,279 (356) 23,389 (216) 23,173

59EVERYTHING FOOD MADE EASY
Notes to the Financial Statements Year ended 31 December 2020
20 Trade and other payables
GROUP CO-OPERATIVE 2020 2019 2020 2019
$’000 $’000 $’000 $’000
Trade payables External parties 703,408 612,809 637,576 540,756Amount due to ultimate holding entity 5 – – –Amount due to subsidiaries – – 33,157 7,744Amount due to related parties 72 346 – 109
703,485 613,155 670,733 548,609 Other payables Amounts due to: - Ultimate holding entity 1,453 500 – –- Subsidiaries – – 282,563 168,344- Associates 30,643 30,643 30,643 30,643- Related parties 11,441 214 329 –- Directors – 80 – –Accrued operating expenses (a) 157,109 172,389 112,225 115,784Accrued short-term employee benefits 134,768 31,445 105,468 29,982Contributions to: - Central Co-operative Fund (b) 50 25 50 25- Singapore Labour Foundation (c) 25,307 23,277 25,307 21,365Contract liabilities 54,894 61,911 54,894 57,157Deposits received 24,739 35,010 5,445 5,384Deferred grant income 48,657 – 39,284 –Stored value cards (d) 20,724 19,312 – –Others 39,119 37,701 28,112 27,223
548,904 412,507 684,320 455,907
Total 1,252,389 1,025,662 1,355,053 1,004,516 Non-current 7,452 10,740 – –Current 1,244,937 1,014,922 1,355,053 1,004,516
1,252,389 1,025,662 1,355,053 1,004,516
(a) Accrued operating expenses include accruals for purchases of property, plant and equipment for the Group and the Co-operative amounting to $7,633,000 and $6,456,000 (2019: $5,142,000 and $3,169,000) respectively.
(b) In accordance with Section 71(2)(a) of the Co-operative Societies Act, Chapter 62, the Co-operative contributes 5% of the first $500,000 of its surplus resulting from the operations of the Co-operative to the Central Co-operative Fund and this amount is due to be paid in the next financial year.
(c) In accordance with Section 71(2)(b) of the Co-operative Societies Act, Chapter 62, the Co-operative has opted to contribute 20% of the surplus in excess of $500,000 from the operations of the Co-operative to the Singapore Labour Foundation (“SLF”) and the amount is due to be paid in the next financial year.
(d) The amount represents advance payments from customers by way of purchase and top-up of Kopitiam card.
The average credit period on purchase of goods is 45 - 60 days (2019: 45 - 60 days). Trade payables principally comprise amounts outstanding for trade purchases and ongoing costs.
The contract liabilities primarily relate to:
• advance consideration received from customers for sale of gift vouchers of $54,894,000 (2019: $57,157,000); and• advance consideration received from suppliers for promotion of beverage of $nil (2019: $4,754,000).
Deferred grant income relates to the wage support and subsidies received from the government but not earned as at 31 December 2020.
The Group and the Co-operative’s exposures to currency and liquidity risks for trade and other payables are disclosed in note 32.
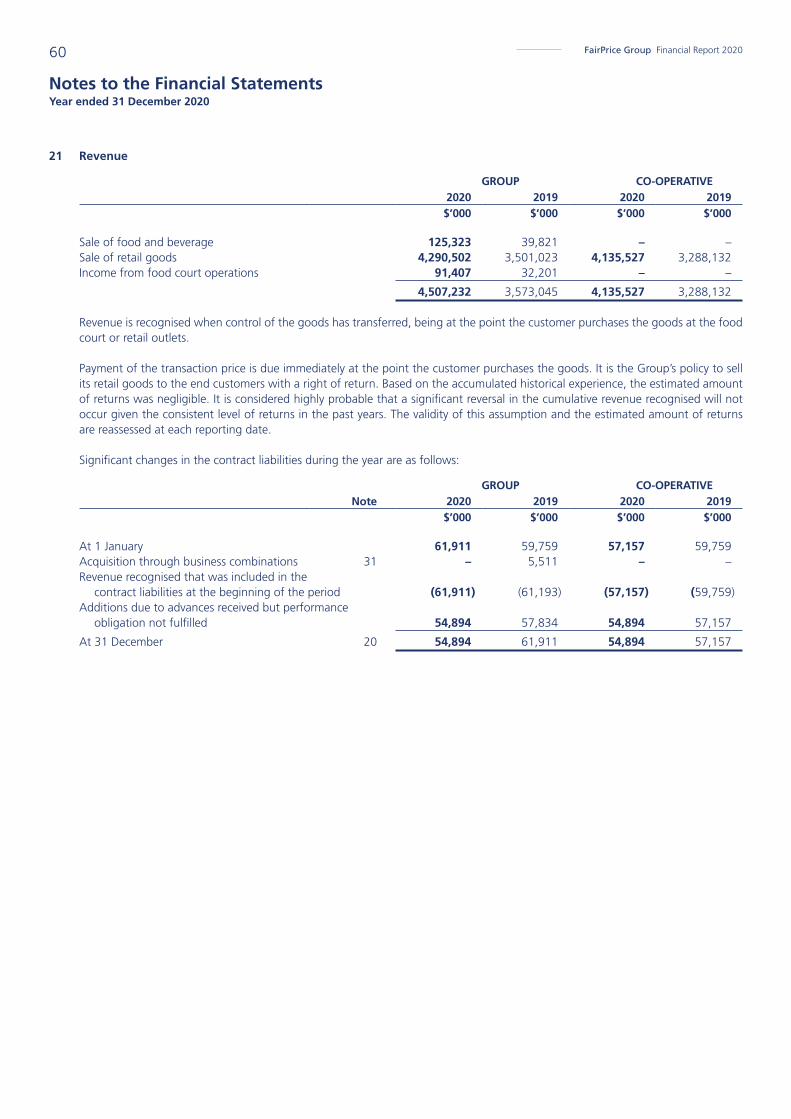
FairPrice Group Financial Report 202060
Notes to the Financial Statements Year ended 31 December 2020
21 Revenue
GROUP CO-OPERATIVE 2020 2019 2020 2019
$’000 $’000 $’000 $’000
Sale of food and beverage 125,323 39,821 – –Sale of retail goods 4,290,502 3,501,023 4,135,527 3,288,132Income from food court operations 91,407 32,201 – –
4,507,232 3,573,045 4,135,527 3,288,132 Revenue is recognised when control of the goods has transferred, being at the point the customer purchases the goods at the food court or retail outlets.
Payment of the transaction price is due immediately at the point the customer purchases the goods. It is the Group’s policy to sell its retail goods to the end customers with a right of return. Based on the accumulated historical experience, the estimated amount of returns was negligible. It is considered highly probable that a significant reversal in the cumulative revenue recognised will not occur given the consistent level of returns in the past years. The validity of this assumption and the estimated amount of returns are reassessed at each reporting date.
Significant changes in the contract liabilities during the year are as follows:
GROUP CO-OPERATIVENote 2020 2019 2020 2019
$’000 $’000 $’000 $’000
At 1 January 61,911 59,759 57,157 59,759Acquisition through business combinations 31 – 5,511 – –Revenue recognised that was included in the contract liabilities at the beginning of the period (61,911) (61,193) (57,157) (59,759)Additions due to advances received but performance obligation not fulfilled 54,894 57,834 54,894 57,157
At 31 December 20 54,894 61,911 54,894 57,157

61EVERYTHING FOOD MADE EASY
Notes to the Financial Statements Year ended 31 December 2020
22 Other income
GROUP CO-OPERATIVE 2020 2019 2020 2019
$’000 $’000 $’000 $’000
Advertising, promotion and other service income 68,810 97,806 64,690 71,219Concessionary and commission income 23,677 25,949 20,114 22,436Discounts received 2,266 2,038 2,157 1,919Franchise fee income – 208 – –Government grants 146,459 2,938 105,408 –Gain on disposal of investment property 6,618 – – –Gain on derecognition of right-of-use assets 245 36 25 9Management fee 2,870 3,099 – –Rental income from property sublease 24,825 30,642 30,581 35,700Rental income from lease receivables 23 1,505 23 1,505Subscription fee 112 812 112 –Rental relief 45,127 – 16,328 –Others 79,282 55,408 29,684 18,657
400,314 220,441 269,122 151,445 Government grants recognised in 2020 mainly relate to the wage support and subsidies from government to support businesses during the period of economic uncertainty due to the Covid-19 pandemic.
Rental relief recognised in 2020 relates to rental waiver given by landlords to the Group and the Co-operative.
23 Other operating expenses
GROUP CO-OPERATIVE 2020 2019 2020 2019
$’000 $’000 $’000 $’000
Amortisation of intangible asset 12,406 5,554 7,681 4,095Donation to NTUC Fairprice Foundation Limited 20,000 10,000 4,650 3,200Expenses relating to short-term leases 4,961 372 – 372Expenses relating to leases low-value assets 4 1,620 – 1,620Expenses relating to variable lease payments 29,490 29,891 7,202 4,020Impairment loss on investment in an associate – 1,428 – –Impairment loss on loans to subsidiaries – – 113 –Intangible assets written off 222 2,333 – 2,332

FairPrice Group Financial Report 202062
Notes to the Financial Statements Year ended 31 December 2020
23 Other operating expenses (cont’d)
GROUP CO-OPERATIVE 2020 2019 2020 2019
$’000 $’000 $’000 $’000
Property & plant & equipment written off 2,593 – – –Loss on disposal of property, plant and equipment 8,254 3,062 5,693 3,015Loss on disposal of intangible assets 1,128 – 1,118 –Marketing expenses 40,740 28,497 38,983 28,386Packing and logistic expenses 94,202 32,558 56,316 45,892Property tax 3,767 3,568 1,998 1,999Professional fee 27,072 24,664 21,487 23,989Repair, maintenance and supplies 63,891 77,140 49,213 43,847Impairment loss on trade receivables 1,185 1,117 242 21Security expense 5,501 4,736 5,501 3,589Sundry expense 38,869 27,078 36,863 26,087Utilities 49,235 42,107 33,486 33,902Grant expenses 3,051 – 1,940 –Others 49,263 39,630 17,903 12,641
455,834 335,355 290,389 239,007
24 Investment income
GROUP CO-OPERATIVE 2020 2019 2020 2019
$’000 $’000 $’000 $’000
Dividend income - Associates – – 22,768 22,045- Subsidiaries – – 10,400 13,500- Other investments 19,164 40,717 15,962 35,703Gain on disposal of an associate – 1,154 – –Interest income - Financial institutions 1,456 704 1,100 689- Debt investments 5,163 10,593 5,163 10,593- Ultimate holding entity 10,258 10,230 10,258 10,230- Loans to subsidiaries – – 3,244 –Gain on disposal of debt investments - FVOCI 6,587 18 6,587 18Reversal of Impairment loss - Debt investments - FVOCI 309 70 309 70
42,937 63,486 75,791 92,848
25 Finance costs
GROUP CO-OPERATIVE 2020 2019 2020 2019
$’000 $’000 $’000 $’000
Interest expense - Subsidiaries – – 3,782 957- Financial institutions 9,413 2,275 9,274 1,592Interest on lease liabilities 42,043 36,902 32,975 33,391
51,456 39,177 46,031 35,940

63EVERYTHING FOOD MADE EASY
Notes to the Financial Statements Year ended 31 December 2020
26 Tax expense
GROUPNote 2020 2019
$’000 $’000
Current tax expense: Current year 787 1,491Changes in estimates related to prior years (368) (236)
419 1,255Deferred tax expense: Origination and reversal of temporary difference (1,172) (452)Changes in estimates related to prior years 956 96
19 (216) (356)
Total tax expense 203 899 Reconciliation of effective tax rate
Profit before tax 54,190 124,038 Tax expense at statutory tax rate of 17% (2019: 17%) 9,212 21,086Non-deductible expenses 15,448 3,118Exempt income (1) (19,107) (15,285)Effect of share of profit of equity–accounted investees (4,031) (5,901)Unrecognised deferred tax assets 4,039 (576)Effect of tax concessions–donations (5,946) (1,403)Changes in estimates related to prior years 588 (140)
203 899
(1) Exempt income mainly pertains to the Co-operative’s income. The income of any Co-operative Society registered under the Co-operative Societies Act, Chapter 62 is exempted from income tax under Section 13(1)(f)(ii) of the Singapore Income Tax Act, Chapter 134.
No deferred tax assets have been recognised in respect of the following:
GROUP 2020 2019
$’000 $’000
Deductible temporary differences 15,043 1,552Unutilised tax losses 17,231 6,963
32,274 8,515 In 2019, the Group acquired deductible temporary differences of $583,000 and unutilised tax losses of $11,318,000 from a subsidiary at the date of acquisition.
Deferred tax assets have not been recognised in respect of these items because it is not probable that future taxable profit will be available against which the Group can utilise the benefits therefrom. The unutilised tax losses which is available for set off against future profits are subject to agreement by the tax authority and compliance with tax regulations. These temporary differences and unutilised tax losses do not expire under the current the legislation.
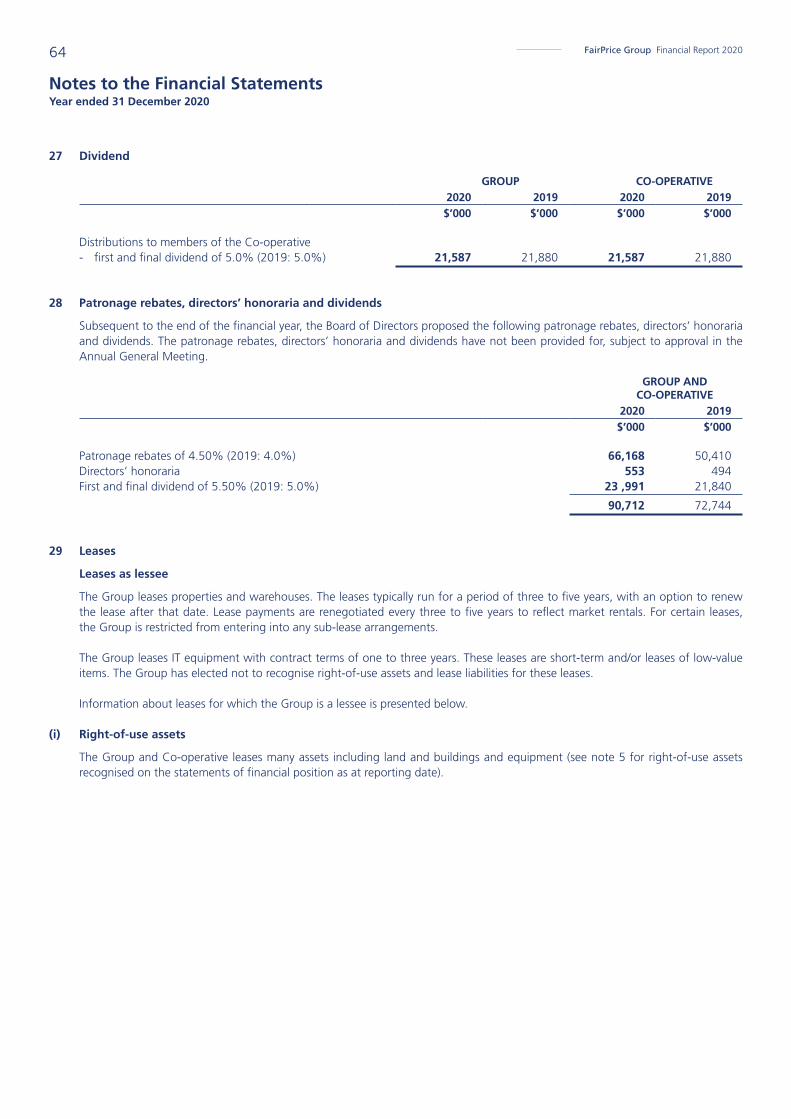
FairPrice Group Financial Report 202064
Notes to the Financial Statements Year ended 31 December 2020
27 Dividend
GROUP CO-OPERATIVE 2020 2019 2020 2019
$’000 $’000 $’000 $’000
Distributions to members of the Co-operative - first and final dividend of 5.0% (2019: 5.0%) 21,587 21,880 21,587 21,880
28 Patronage rebates, directors’ honoraria and dividends
Subsequent to the end of the financial year, the Board of Directors proposed the following patronage rebates, directors’ honoraria and dividends. The patronage rebates, directors’ honoraria and dividends have not been provided for, subject to approval in the Annual General Meeting.
GROUP AND CO-OPERATIVE
2020 2019$’000 $’000
Patronage rebates of 4.50% (2019: 4.0%) 66,168 50,410Directors’ honoraria 553 494First and final dividend of 5.50% (2019: 5.0%) 23 ,991 21,840
90,712 72,744
29 Leases
Leases as lessee
The Group leases properties and warehouses. The leases typically run for a period of three to five years, with an option to renew the lease after that date. Lease payments are renegotiated every three to five years to reflect market rentals. For certain leases, the Group is restricted from entering into any sub-lease arrangements.
The Group leases IT equipment with contract terms of one to three years. These leases are short-term and/or leases of low-value items. The Group has elected not to recognise right-of-use assets and lease liabilities for these leases.
Information about leases for which the Group is a lessee is presented below.
(i) Right-of-use assets
The Group and Co-operative leases many assets including land and buildings and equipment (see note 5 for right-of-use assets recognised on the statements of financial position as at reporting date).
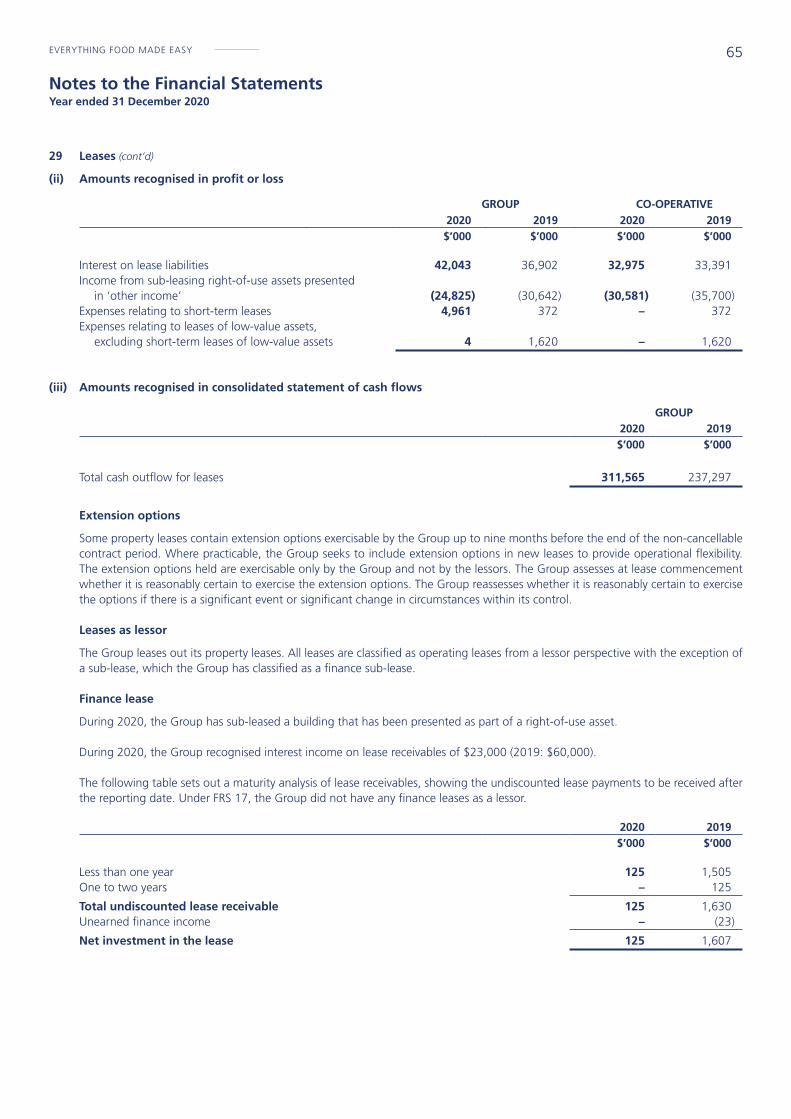
65EVERYTHING FOOD MADE EASY
Notes to the Financial Statements Year ended 31 December 2020
29 Leases (cont’d)
(ii) Amounts recognised in profit or loss
GROUP CO-OPERATIVE 2020 2019 2020 2019
$’000 $’000 $’000 $’000
Interest on lease liabilities 42,043 36,902 32,975 33,391Income from sub-leasing right-of-use assets presented in ‘other income’ (24,825) (30,642) (30,581) (35,700)Expenses relating to short-term leases 4,961 372 – 372Expenses relating to leases of low-value assets, excluding short-term leases of low-value assets 4 1,620 – 1,620
(iii) Amounts recognised in consolidated statement of cash flows
GROUP 2020 2019
$’000 $’000
Total cash outflow for leases 311,565 237,297
Extension options
Some property leases contain extension options exercisable by the Group up to nine months before the end of the non-cancellable contract period. Where practicable, the Group seeks to include extension options in new leases to provide operational flexibility. The extension options held are exercisable only by the Group and not by the lessors. The Group assesses at lease commencement whether it is reasonably certain to exercise the extension options. The Group reassesses whether it is reasonably certain to exercise the options if there is a significant event or significant change in circumstances within its control.
Leases as lessor
The Group leases out its property leases. All leases are classified as operating leases from a lessor perspective with the exception of a sub-lease, which the Group has classified as a finance sub-lease.
Finance lease
During 2020, the Group has sub-leased a building that has been presented as part of a right-of-use asset.
During 2020, the Group recognised interest income on lease receivables of $23,000 (2019: $60,000).
The following table sets out a maturity analysis of lease receivables, showing the undiscounted lease payments to be received after the reporting date. Under FRS 17, the Group did not have any finance leases as a lessor.
2020 2019$’000 $’000
Less than one year 125 1,505One to two years – 125
Total undiscounted lease receivable 125 1,630Unearned finance income – (23)
Net investment in the lease 125 1,607

FairPrice Group Financial Report 202066
Notes to the Financial Statements Year ended 31 December 2020
29 Leases (cont’d)
Operating lease
The Group leases out its leased properties. The Group has classified these leases as operating leases, because they do not transfer substantially all of the risks and rewards incidental to the ownership of the assets.
Rental income from property sub-lease recognised by the Group during 2020 was $24,285,000 (2019: $30,642,000).
The following table sets out a maturity analysis of lease payments, showing the undiscounted lease payments to be received after the reporting date.
GROUP CO-OPERATIVE 2020 2019 2020 2019
$’000 $’000 $’000 $’000
Less than one year 66,835 75,782 28,760 26,111One to two years 35,990 45,614 18,417 13,886Two to three years 10,150 18,110 8,059 6,659Three to four years 1,677 2,896 1,469 2,010Four to five years 718 801 628 718More than five years 124 156 106 139
Total 115,494 143,359 57,439 49,523
30 Commitments
As at the end of the financial year, the Group and the Co-operative have the following outstanding commitments which have not been provided in the financial statements:
GROUP CO-OPERATIVE 2020 2019 2020 2019
$’000 $’000 $’000 $’000
Capital commitments: Purchase of property, plant and equipment - contracted 269,186 246,485 147,206 195,841
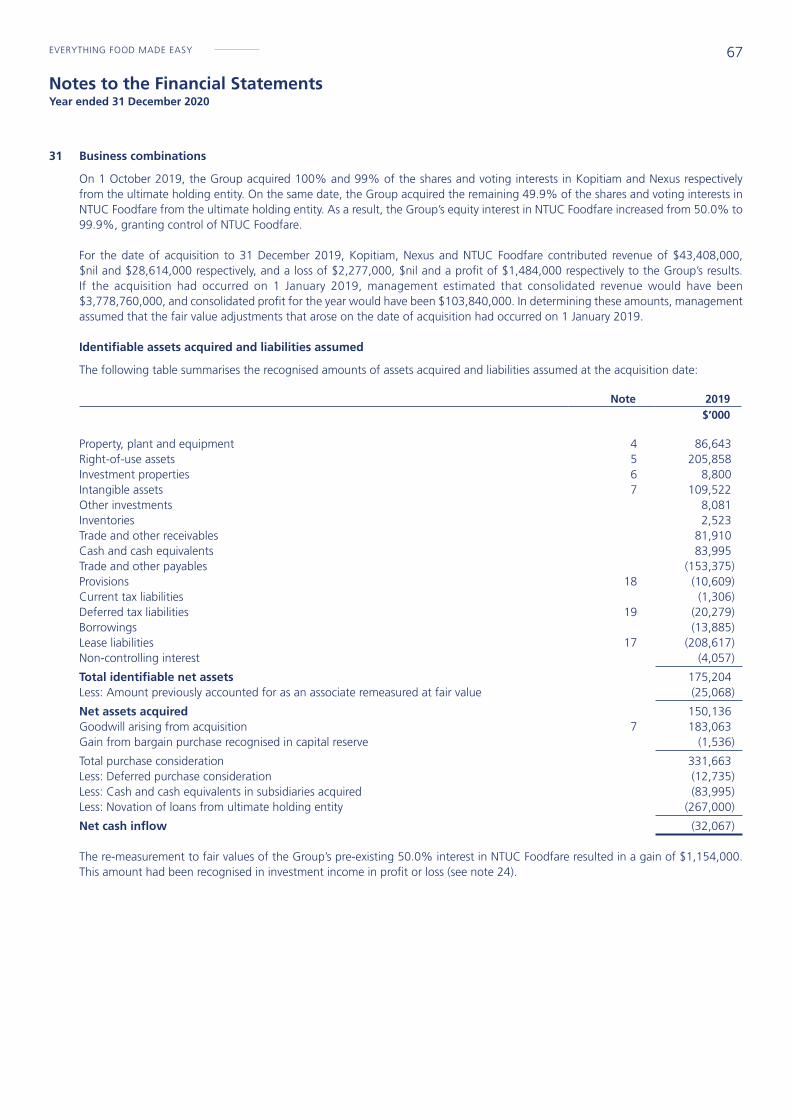
67EVERYTHING FOOD MADE EASY
Notes to the Financial Statements Year ended 31 December 2020
31 Business combinations
On 1 October 2019, the Group acquired 100% and 99% of the shares and voting interests in Kopitiam and Nexus respectively from the ultimate holding entity. On the same date, the Group acquired the remaining 49.9% of the shares and voting interests in NTUC Foodfare from the ultimate holding entity. As a result, the Group’s equity interest in NTUC Foodfare increased from 50.0% to 99.9%, granting control of NTUC Foodfare.
For the date of acquisition to 31 December 2019, Kopitiam, Nexus and NTUC Foodfare contributed revenue of $43,408,000, $nil and $28,614,000 respectively, and a loss of $2,277,000, $nil and a profit of $1,484,000 respectively to the Group’s results. If the acquisition had occurred on 1 January 2019, management estimated that consolidated revenue would have been $3,778,760,000, and consolidated profit for the year would have been $103,840,000. In determining these amounts, management assumed that the fair value adjustments that arose on the date of acquisition had occurred on 1 January 2019.
Identifiable assets acquired and liabilities assumed
The following table summarises the recognised amounts of assets acquired and liabilities assumed at the acquisition date:
Note 2019$’000
Property, plant and equipment 4 86,643Right-of-use assets 5 205,858Investment properties 6 8,800Intangible assets 7 109,522Other investments 8,081Inventories 2,523Trade and other receivables 81,910Cash and cash equivalents 83,995Trade and other payables (153,375)Provisions 18 (10,609)Current tax liabilities (1,306)Deferred tax liabilities 19 (20,279)Borrowings (13,885)Lease liabilities 17 (208,617)Non-controlling interest (4,057)
Total identifiable net assets 175,204Less: Amount previously accounted for as an associate remeasured at fair value (25,068)
Net assets acquired 150,136Goodwill arising from acquisition 7 183,063Gain from bargain purchase recognised in capital reserve (1,536)
Total purchase consideration 331,663Less: Deferred purchase consideration (12,735)Less: Cash and cash equivalents in subsidiaries acquired (83,995)Less: Novation of loans from ultimate holding entity (267,000)
Net cash inflow (32,067) The re-measurement to fair values of the Group’s pre-existing 50.0% interest in NTUC Foodfare resulted in a gain of $1,154,000. This amount had been recognised in investment income in profit or loss (see note 24).
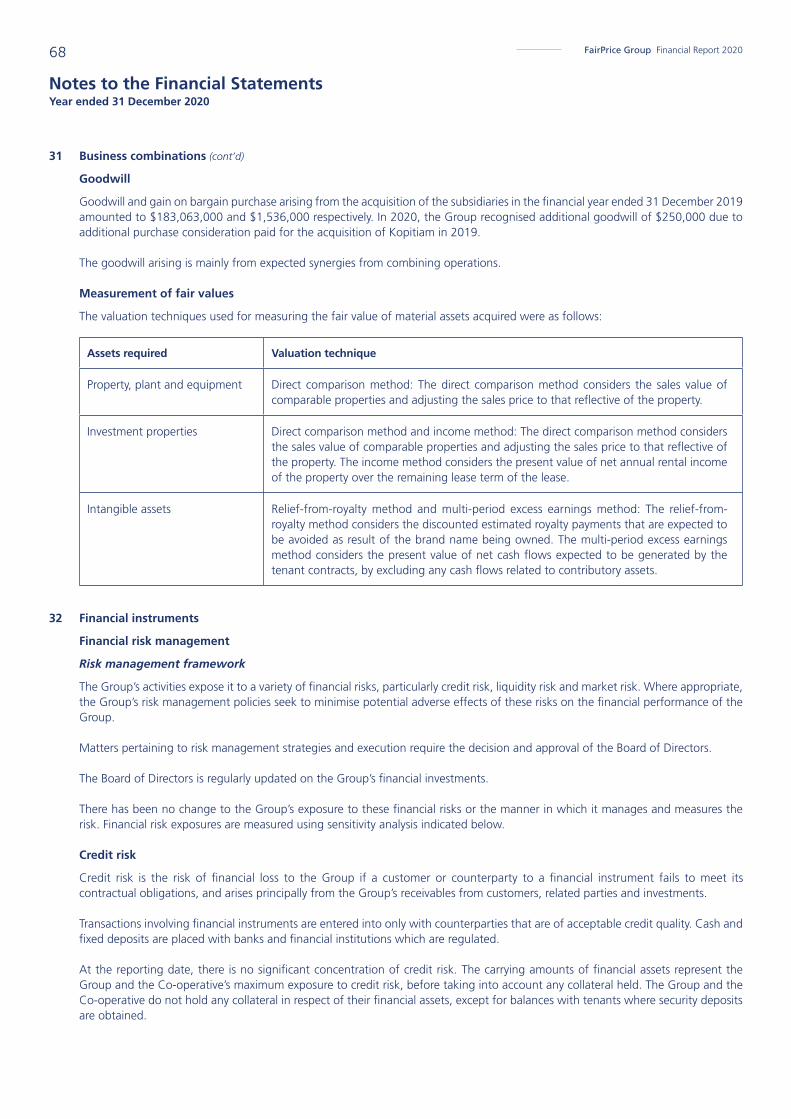
FairPrice Group Financial Report 202068
Notes to the Financial Statements Year ended 31 December 2020
31 Business combinations (cont’d)
Goodwill
Goodwill and gain on bargain purchase arising from the acquisition of the subsidiaries in the financial year ended 31 December 2019 amounted to $183,063,000 and $1,536,000 respectively. In 2020, the Group recognised additional goodwill of $250,000 due to additional purchase consideration paid for the acquisition of Kopitiam in 2019.
The goodwill arising is mainly from expected synergies from combining operations.
Measurement of fair values
The valuation techniques used for measuring the fair value of material assets acquired were as follows:
Assets required Valuation technique
Property, plant and equipment Direct comparison method: The direct comparison method considers the sales value of comparable properties and adjusting the sales price to that reflective of the property.
Investment properties Direct comparison method and income method: The direct comparison method considers the sales value of comparable properties and adjusting the sales price to that reflective of the property. The income method considers the present value of net annual rental income of the property over the remaining lease term of the lease.
Intangible assets Relief-from-royalty method and multi-period excess earnings method: The relief-from-royalty method considers the discounted estimated royalty payments that are expected to be avoided as result of the brand name being owned. The multi-period excess earnings method considers the present value of net cash flows expected to be generated by the tenant contracts, by excluding any cash flows related to contributory assets.
32 Financial instruments
Financial risk management
Risk management framework
The Group’s activities expose it to a variety of financial risks, particularly credit risk, liquidity risk and market risk. Where appropriate, the Group’s risk management policies seek to minimise potential adverse effects of these risks on the financial performance of the Group.
Matters pertaining to risk management strategies and execution require the decision and approval of the Board of Directors.
The Board of Directors is regularly updated on the Group’s financial investments.
There has been no change to the Group’s exposure to these financial risks or the manner in which it manages and measures the risk. Financial risk exposures are measured using sensitivity analysis indicated below.
Credit risk
Credit risk is the risk of financial loss to the Group if a customer or counterparty to a financial instrument fails to meet its contractual obligations, and arises principally from the Group’s receivables from customers, related parties and investments.
Transactions involving financial instruments are entered into only with counterparties that are of acceptable credit quality. Cash and fixed deposits are placed with banks and financial institutions which are regulated.
At the reporting date, there is no significant concentration of credit risk. The carrying amounts of financial assets represent the Group and the Co-operative’s maximum exposure to credit risk, before taking into account any collateral held. The Group and the Co-operative do not hold any collateral in respect of their financial assets, except for balances with tenants where security deposits are obtained.

69EVERYTHING FOOD MADE EASY
Notes to the Financial Statements Year ended 31 December 2020
32 Financial instruments (cont’d)
Credit risk (cont’d)
Impairment loss
Expected credit loss assessment
The Group uses an allowance matrix to measure the ECLs of trade receivables.
Loss rates are based actual credit loss experience over the past 3 years. These rates are adjusted to reflect differences between economic conditions during the period over which the historic data has been collected, current conditions and the Group’s view of economic conditions over the expected lives of the receivables.
The following table provides information about the exposure to credit risk and ECLs for trade receivables as at 31 December:
GROUP
Weighted average loss
rate
Gross carrying amount
Impairment loss
allowance
% $’000 $’000
2020Current (not past due) – 18,713 –1 – 30 days past due – 10,283 –31 – 60 days past due – 5,629 –More than 60 days past due 34.49 22,325 (8,989)
56,950 (8,989) 2019Current (not past due) 0.88 20,800 (184)1 – 30 days past due 0.66 6,538 (43)31 – 60 days past due 0.08 2,399 (2)More than 60 days past due 50.13 15,163 (7,601)
44,900 (7,830)
CO-OPERATIVE
Weighted average loss
rate
Gross carrying amount
Impairment loss
allowance
% $’000 $’000
2020Current (not past due) – 25,317 –1 – 30 days past due – 8,007 –31 – 60 days past due – 537 –More than 60 days past due 2.36 8,408 (270)
42,269 (270) 2019Current (not past due) – 9,197 –1 – 30 days past due – 6,138 –31 – 60 days past due – 956 –More than 60 days past due 1.03 5,247 (54)
21,538 (54)
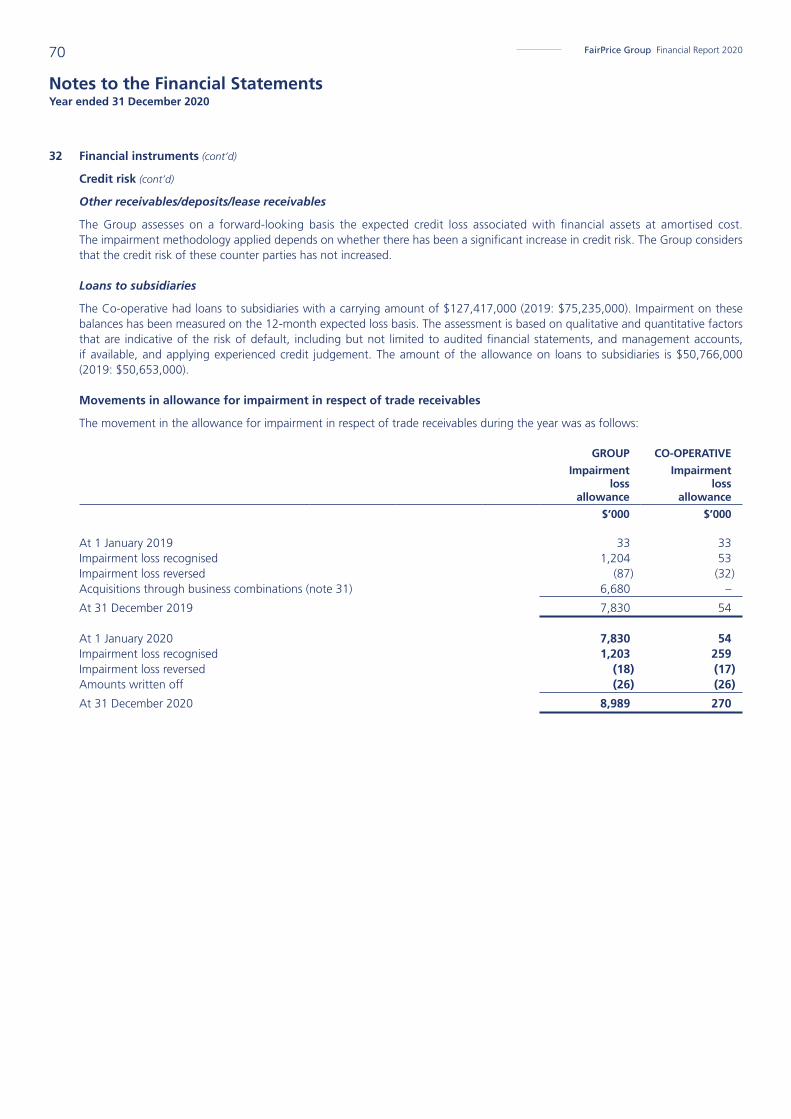
FairPrice Group Financial Report 202070
Notes to the Financial Statements Year ended 31 December 2020
32 Financial instruments (cont’d)
Credit risk (cont’d)
Other receivables/deposits/lease receivables
The Group assesses on a forward-looking basis the expected credit loss associated with financial assets at amortised cost. The impairment methodology applied depends on whether there has been a significant increase in credit risk. The Group considers that the credit risk of these counter parties has not increased.
Loans to subsidiaries
The Co-operative had loans to subsidiaries with a carrying amount of $127,417,000 (2019: $75,235,000). Impairment on these balances has been measured on the 12-month expected loss basis. The assessment is based on qualitative and quantitative factors that are indicative of the risk of default, including but not limited to audited financial statements, and management accounts, if available, and applying experienced credit judgement. The amount of the allowance on loans to subsidiaries is $50,766,000 (2019: $50,653,000).
Movements in allowance for impairment in respect of trade receivables
The movement in the allowance for impairment in respect of trade receivables during the year was as follows:
GROUP
Impairment loss
allowance
CO-OPERATIVE
Impairment loss
allowance
$’000 $’000
At 1 January 2019 33 33Impairment loss recognised 1,204 53Impairment loss reversed (87) (32)Acquisitions through business combinations (note 31) 6,680 –
At 31 December 2019 7,830 54 At 1 January 2020 7,830 54Impairment loss recognised 1,203 259Impairment loss reversed (18) (17)Amounts written off (26) (26)
At 31 December 2020 8,989 270

71EVERYTHING FOOD MADE EASY
Notes to the Financial Statements Year ended 31 December 2020
32 Financial instruments (cont’d)
Credit risk (cont’d)
Cash and cash equivalents
The Group and the Co-operative held cash and cash equivalents of $618,869,000 and $477,456,000 (2019: $414,535,000 and $279,488,000), respectively at 31 December 2020. The cash and cash equivalents are held with banks and financial institutions with sound credit ratings.
Impairment on cash and cash equivalents has been measured on the 12-month expected loss basis and reflects the short maturities of the exposures. The Group considers that its cash and cash equivalents have low credit risk based on the external credit ratings of the counterparties. The amount of the allowance on cash and cash equivalents was insignificant.
Debt investments
The Group limits its exposure to credit risk on investments held by investing only in liquid debt, securities and only with counterparties that have a credit rating of at least B- from Fitch Ratings Inc and B- from Standard & Poor’s Global Ratings.
The Group monitors the changes in credit risk to the tracking published external credit ratings annually. The 12-month and lifetime probabilities of default are based on historical data supplied by Moody’s Investors Service for each credit rating and are recalibrated based on current bond yields and CDS prices. Loss given default (“LGD”) parameters generally reflect an assumed recovery rate of 40% except when a security is credit-impaired, in which case the estimate of loss is based on the instrument’s current market price and original effective interest rate.
The following table presents an analysis of the credit quality of debt investments at amortised cost and FVOCI. It indicates whether assets measured at amortised cost or FVOCI were subject to a 12-month ECL or lifetime ECL allowance and, in latter case, whether they are credit-impaired.
2020 2019
FVOCI
12-month ECL
At amortised
costs
12-month ECL
FVOCI
12-month ECL
At amortised
costs/
12-month ECL
$’000 $’000 $’000 $’000
GROUP
Credit ratingBBB- to AAA – 330,000 219,543 330,000BB- to BB+ – – 18,690 –B- to B+ – – 1,477 –
Gross carrying amounts – 330,000 239,710 330,000Loss allowance – – (309) –
Carrying amount – 330,000 239,401 330,000 CO-OPERATIVE
Credit rating BBB- to AAA – 330,000 217,127 330,000BB- to BB+ – – 18,690 –B- to B+ – – 1,477 –
Gross carrying amounts – 330,000 237,294 330,000Loss allowance – – (309) –
Carrying amount – 330,000 236,985 330,000 The Group and the Co-operative did not have any debt investments that were past due but not impaired at 31 December 2020.
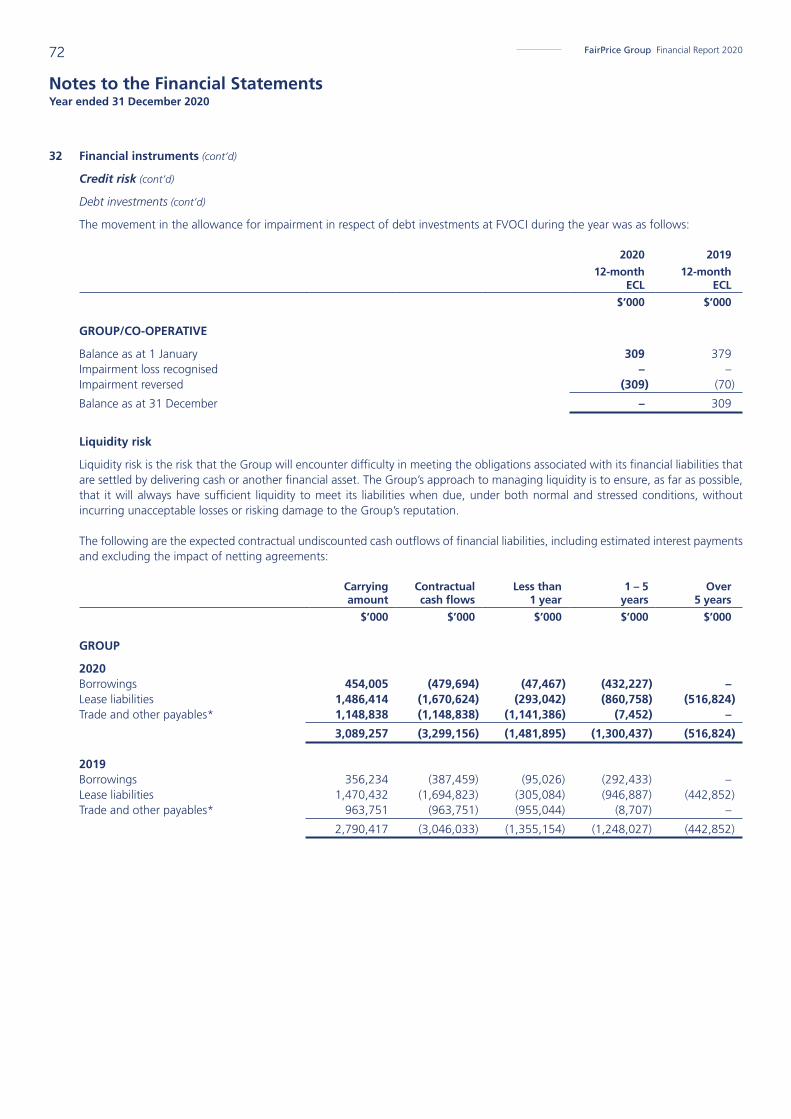
FairPrice Group Financial Report 202072
Notes to the Financial Statements Year ended 31 December 2020
32 Financial instruments (cont’d)
Credit risk (cont’d)
Debt investments (cont’d)
The movement in the allowance for impairment in respect of debt investments at FVOCI during the year was as follows:
2020
12-month ECL
2019
12-month ECL
$’000 $’000
GROUP/CO-OPERATIVE
Balance as at 1 January 309 379Impairment loss recognised – –Impairment reversed (309) (70)
Balance as at 31 December – 309
Liquidity risk
Liquidity risk is the risk that the Group will encounter difficulty in meeting the obligations associated with its financial liabilities that are settled by delivering cash or another financial asset. The Group’s approach to managing liquidity is to ensure, as far as possible, that it will always have sufficient liquidity to meet its liabilities when due, under both normal and stressed conditions, without incurring unacceptable losses or risking damage to the Group’s reputation.
The following are the expected contractual undiscounted cash outflows of financial liabilities, including estimated interest payments and excluding the impact of netting agreements:
Carrying amount
Contractual cash flows
Less than 1 year
1 – 5 years
Over 5 years
$’000 $’000 $’000 $’000 $’000
GROUP
2020Borrowings 454,005 (479,694) (47,467) (432,227) –Lease liabilities 1,486,414 (1,670,624) (293,042) (860,758) (516,824)Trade and other payables* 1,148,838 (1,148,838) (1,141,386) (7,452) –
3,089,257 (3,299,156) (1,481,895) (1,300,437) (516,824) 2019Borrowings 356,234 (387,459) (95,026) (292,433) –Lease liabilities 1,470,432 (1,694,823) (305,084) (946,887) (442,852)Trade and other payables* 963,751 (963,751) (955,044) (8,707) –
2,790,417 (3,046,033) (1,355,154) (1,248,027) (442,852)

73EVERYTHING FOOD MADE EASY
Notes to the Financial Statements Year ended 31 December 2020
32 Financial instruments (cont’d)
Liquidity risk (cont’d)
Carrying amount
Contractual cash flows
Less than 1 year
1 – 5 years
Over 5 years
$’000 $’000 $’000 $’000 $’000
CO-OPERATIVE
2020Borrowings 454,005 (479,694) (47,467) (432,227) –Lease liabilities 1,207,811 (1,379,372) (203,803) (682,218) (493,351)Trade and other payables* 1,260,875 (1,260,875) (1,260,875) – –
2,922,691 (3,119,941) (1,512,145) (1,114,445) (493,351) 2019Borrowings 347,000 (377,859) (88,322) (289,537) –Lease liabilities 1,171,215 (1,355,710) (199,131) (750,108) (406,471)Trade and other payables* 947,359 (947,359) (947,359) – –
2,465,574 (2,680,928) (1,234,812) (1,039,645) (406,471)
* Excludes contract liabilities and deferred grant income
It is not expected that the cash flows in the maturity analysis could occur significantly earlier, or at significantly different amounts.
Market risk
Market risk is the risk that changes in market prices, such as foreign exchange rates, interest rates and equity prices will affect the Group’s income or the value of its holdings of financial instruments. The objective of market risk management is to manage and control market risk exposures within acceptable parameters, while optimising the return.
Currency risk
The Group is exposed to foreign currency risk on purchases that are denominated in currencies other than the respective functional currencies of Group entities. The currencies in which these transactions primarily are denominated in US Dollar (“USD”), EURO (“EUR”), Swiss Franc (“CHF”), British Sterling Pound (“GBP”), Japanese Yen (“JPY”), Australian Dollar (“AUD”), and Hong Kong Dollar (“HKD”).
The Group manages its foreign exchange exposure by adopting a policy of matching receipts and payments, and asset purchases, in the currency of the relevant entity, where possible.

FairPrice Group Financial Report 202074
Notes to the Financial Statements Year ended 31 December 2020
32 Financial instruments (cont’d)
Market risk (cont’d)
Currency risk (cont’d)
Exposure to currency risk
The Group’s and the Co-operative’s exposures to foreign currencies are as follows:
USD EUR CHF GBP JPY AUD HKD SEK Total
$’000 $’000 $’000 $’000 $’000 $’000 $’000 $’000 $’000
GROUP AND CO-OPERATIVE
2020Financial assets Cash and cash equivalents 4,075 – – – – 740 – – 4,815
Total financial assets 4,075 – – – – 740 – – 4,815 Financial liabilities Trade and other payables (1,387) – – – – (8) – – (1,395)
Total financial liabilities (1,387) – – – – (8) – – (1,395) Net financial assets at end of the year 2,688 – – – – 732 – – 3,420 2019Financial assets Cash and cash equivalents 3,883 17 (2) 129 93 79 – 6 4,205Quoted equity investments - FVOCI 92,318 18,744 7,442 10,598 7,088 2,109 2,752 – 141,051Quoted debt investments - FVOCI 92,240 – – – – – – – 92,240
Total financial assets 188,441 18,761 7,440 10,727 7,181 2,188 2,752 6 237,496 Financial liabilities Trade and other payables (8,424) (323) – (846) – (1,687) – – (11,280)
Total financial liabilities (8,424) (323) – (846) – (1,687) – – (11,280) Net financial assets at end of the year 180,017 18,438 7,440 9,881 7,181 501 2,752 6 226,216
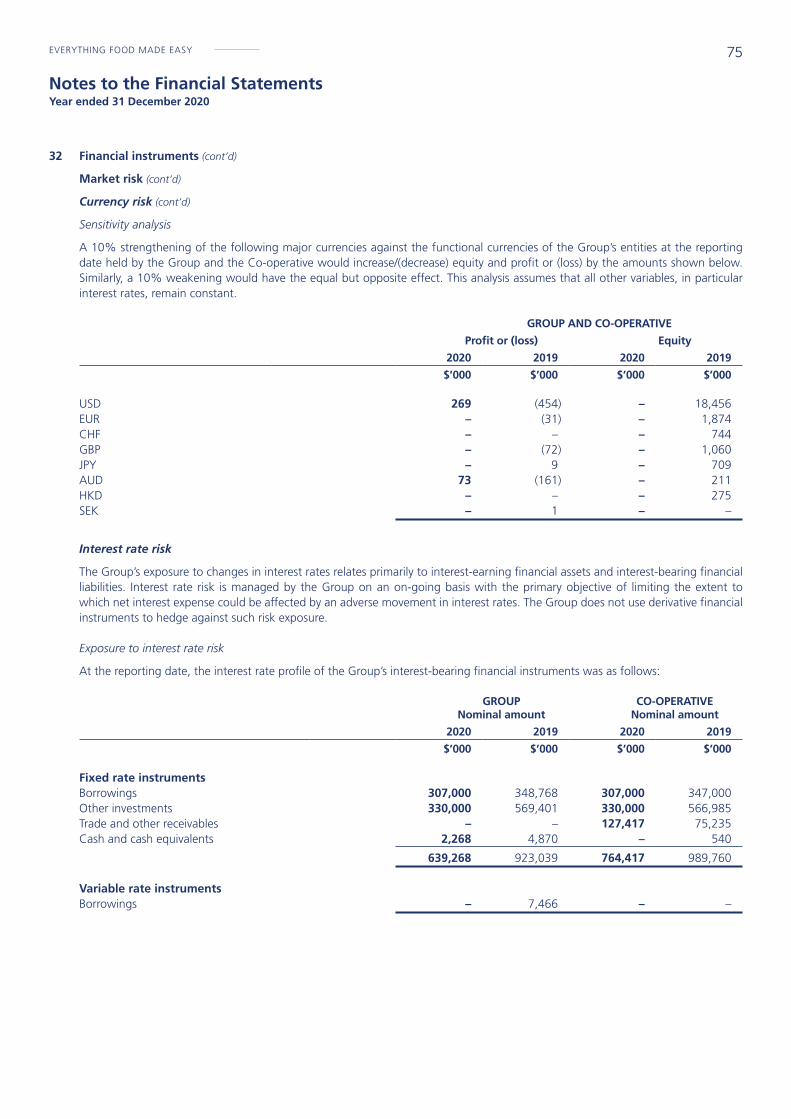
75EVERYTHING FOOD MADE EASY
Notes to the Financial Statements Year ended 31 December 2020
32 Financial instruments (cont’d)
Market risk (cont’d)
Currency risk (cont’d)
Sensitivity analysis
A 10% strengthening of the following major currencies against the functional currencies of the Group’s entities at the reporting date held by the Group and the Co-operative would increase/(decrease) equity and profit or (loss) by the amounts shown below. Similarly, a 10% weakening would have the equal but opposite effect. This analysis assumes that all other variables, in particular interest rates, remain constant.
GROUP AND CO-OPERATIVE
Profit or (loss) Equity
2020 2019 2020 2019
$’000 $’000 $’000 $’000
USD 269 (454) – 18,456EUR – (31) – 1,874CHF – – – 744GBP – (72) – 1,060JPY – 9 – 709AUD 73 (161) – 211HKD – – – 275SEK – 1 – –
Interest rate risk
The Group’s exposure to changes in interest rates relates primarily to interest-earning financial assets and interest-bearing financial liabilities. Interest rate risk is managed by the Group on an on-going basis with the primary objective of limiting the extent to which net interest expense could be affected by an adverse movement in interest rates. The Group does not use derivative financial instruments to hedge against such risk exposure.
Exposure to interest rate risk
At the reporting date, the interest rate profile of the Group’s interest-bearing financial instruments was as follows:
GROUP Nominal amount
CO-OPERATIVE Nominal amount
2020 2019 2020 2019
$’000 $’000 $’000 $’000
Fixed rate instruments Borrowings 307,000 348,768 307,000 347,000Other investments 330,000 569,401 330,000 566,985Trade and other receivables – – 127,417 75,235Cash and cash equivalents 2,268 4,870 – 540
639,268 923,039 764,417 989,760 Variable rate instruments Borrowings – 7,466 – –

FairPrice Group Financial Report 202076
Notes to the Financial Statements Year ended 31 December 2020
32 Financial instruments (cont’d)
Market risk (cont’d)
Interest rate risk (cont’d)
Sensitivity analysis for variable rate instruments
For variable rate instrument, a reasonably possible change of 100 basis points in interest rates at the reporting date would have increased (decreased) profit or loss by the amounts shown below. This analysis assumes that all other variables remain constant.
Profit or loss
100bp
increase 100bp
decrease
$’000 $’000
31 December 2019Variable rate instruments 746 (746)
Sensitivity analysis for fixed rate instruments
The Group does not account for any fixed rate financial assets and liabilities at fair value through profit or loss. Therefore, in respect of the fixed rate instruments, a change in interest rates at the reporting date would not affect profit or loss.
Equity price risk
The Group and the Co-operative are exposed to equity price risks changes arising from equity investments at FVOCI. An increase in the underlying equity prices of the equity investments at FVOCI at the reporting date by 10% (2019: 10%) for the Group and the Co-operative, would increase other components of equity before any tax effect by the amounts shown below. Similarly, a 10% decrease in underlying equity price of the equity investments would have the equal but opposite effect. This analysis assumes that all other variables remain constant.
GROUP CO-OPERATIVE
$’000 $’000
2020Equity investments at FVOCI Equity 114,174 113,626 2019Equity investments at FVOCI Equity 99,517 87,098

77EVERYTHING FOOD MADE EASY
Notes to the Financial Statements Year ended 31 December 2020
32 Financial instruments (cont’d)
Market risk (cont’d)
Equity price risk (cont’d)
Accounting classifications and fair values
The carrying amounts and fair values of financial assets and financial liabilities, including their levels in the fair value hierarchy are as follows. It does not include fair value information for financial assets and financial liabilities not measured at fair value if the carrying amount is a reasonable approximation of fair value. Further, the fair value disclosure of lease liabilities is also not required for the current year.
Carrying amount Fair value
Amortised cost
Equity investments
- FVOCI
Debt investments
- FVOCI
Other financial
liabilities at amortised
cost Total Level 1 Level 2 Level 3 Total
$’000 $’000 $’000 $’000 $’000 $’000 $’000 $’000 $’000
GROUP
2020Financial assets measured at fair value Quoted equity investments - FVOCI – 4,960 – – 4,960 4,960 – – 4,960Unquoted equity investments - FVOCI – 1,136,776 – – 1,136,776 – 1,136,776 – 1,136,776
– 1,141,736 – – 1,141,736
Financial assets not measured at fair value Unquoted debt investment 330,000 – – – 330,000 – 356,614 – 356,614Other investments 750 – – – 750 Cash and cash equivalents 618,869 – – – 618,869 Trade and other receivables* 208,041 – – – 208,041
1,157,660 – – – 1,157,660
Financial liabilities not measured at fair value Borrowings – – – (454,005) (454,005) – (415,320) – (415,320)Lease liabilities – – – (1,486,414) (1,486,414) Trade and other payables** – – – (1,148,838) (1,148,838)
– – – (3,089,257) (3,089,257)
* Excludes prepayments
** Excludes contract liabilities and deferred grant income

FairPrice Group Financial Report 202078
Notes to the Financial Statements Year ended 31 December 2020
32 Financial instruments (cont’d)
Market risk (cont’d)
Equity price risk (cont’d)
Accounting classifications and fair values (cont’d)
Carrying amount Fair value
Amortised cost
Equity investments
- FVOCI
Debt investments
- FVOCI
Other financial
liabilities at amortised
cost Total Level 1 Level 2 Level 3 Total
$’000 $’000 $’000 $’000 $’000 $’000 $’000 $’000 $’000
GROUP
2019Financial assets measured at fair value Quoted unit trust - FVOCI – 752,027 – – 752,027 752,027 – – 752,027Quoted equity investments - FVOCI – 243,138 – – 243,138 243,138 – – 243,138Quoted debt investments - FVOCI – – 239,401 – 239,401 239,401 – – 239,401Unquoted equity investments - FVOCI – 10 – – 10 – – 10 10
– 995,175 239,401 – 1,234,576
Financial assets not measured at fair value Unquoted debt investment 330,000 – – – 330,000 – 357,162 – 357,162Other investments 750 – – – 750 Cash and cash equivalents 414,535 – – – 414,535 Trade and other receivables* 117,572 – – – 117,572
862,857 – – – 862,857
Financial liabilities not measured at fair value Borrowings – – – (356,234) (356,234) – (330,697) – (330,697)Lease liabilities – – – (1,470,432) (1,470,432) Trade and other payables** – – – (963,751) (963,751)
– – – (2,790,417) (2,790,417)
* Excludes prepayments
** Excludes contract liabilities
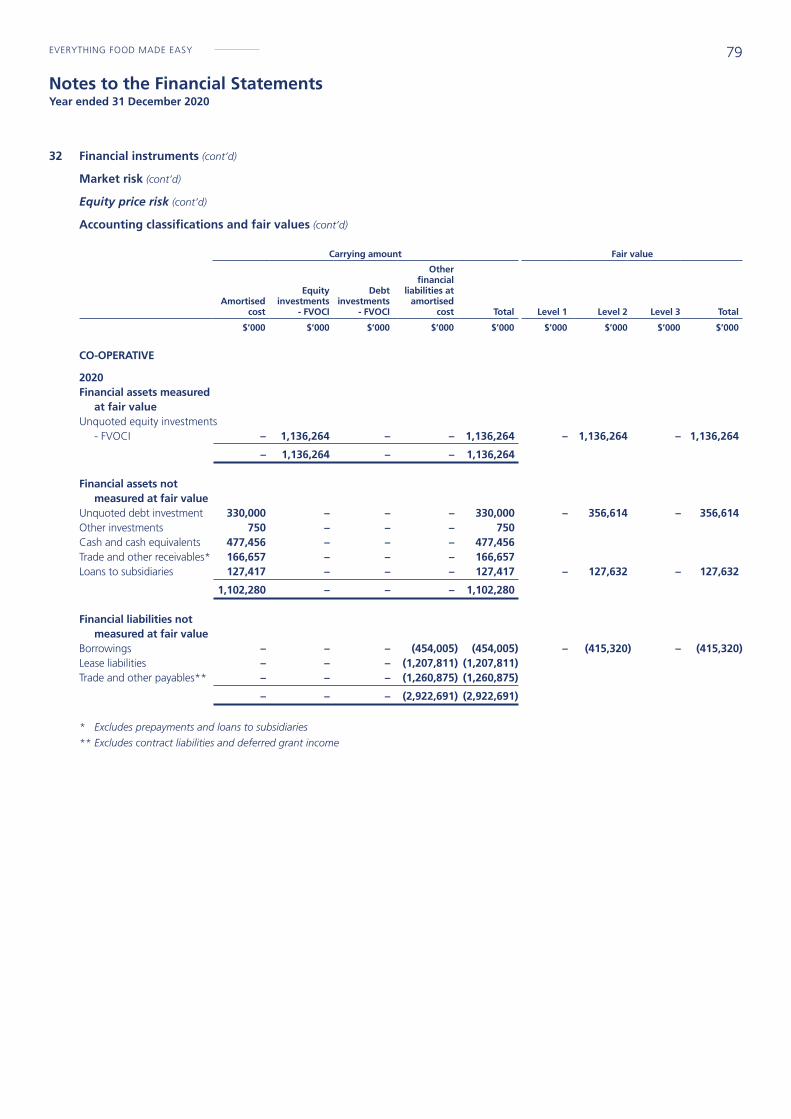
79EVERYTHING FOOD MADE EASY
Notes to the Financial Statements Year ended 31 December 2020
32 Financial instruments (cont’d)
Market risk (cont’d)
Equity price risk (cont’d)
Accounting classifications and fair values (cont’d)
Carrying amount Fair value
Amortised cost
Equity investments
- FVOCI
Debt investments
- FVOCI
Other financial
liabilities at amortised
cost Total Level 1 Level 2 Level 3 Total
$’000 $’000 $’000 $’000 $’000 $’000 $’000 $’000 $’000
CO-OPERATIVE
2020Financial assets measured at fair value Unquoted equity investments - FVOCI – 1,136,264 – – 1,136,264 – 1,136,264 – 1,136,264
– 1,136,264 – – 1,136,264
Financial assets not measured at fair value Unquoted debt investment 330,000 – – – 330,000 – 356,614 – 356,614Other investments 750 – – – 750 Cash and cash equivalents 477,456 – – – 477,456 Trade and other receivables* 166,657 – – – 166,657 Loans to subsidiaries 127,417 – – – 127,417 – 127,632 – 127,632
1,102,280 – – – 1,102,280
Financial liabilities not measured at fair valueBorrowings – – – (454,005) (454,005) – (415,320) – (415,320)Lease liabilities – – – (1,207,811) (1,207,811)Trade and other payables** – – – (1,260,875) (1,260,875)
– – – (2,922,691) (2,922,691)
* Excludes prepayments and loans to subsidiaries
** Excludes contract liabilities and deferred grant income

FairPrice Group Financial Report 202080
Notes to the Financial Statements Year ended 31 December 2020
32 Financial instruments (cont’d)
Market risk (cont’d)
Equity price risk (cont’d)
Accounting classifications and fair values (cont’d)
Carrying amount Fair value
Amortised cost
Equity investments
- FVOCI
Debt investments
- FVOCI
Other financial
liabilities at amortised
cost Total Level 1 Level 2 Level 3 Total
$’000 $’000 $’000 $’000 $’000 $’000 $’000 $’000 $’000
CO-OPERATIVE
2019Financial assets measured at fair value Quoted unit trust - FVOCI – 633,634 – – 633,634 633,634 – – 633,634Quoted equity investments - FVOCI – 237,344 – – 237,344 237,344 – – 237,344Quoted debt investments - FVOCI – – 236,985 – 236,985 236,985 – – 236,985
– 870,978 236,985 – 1,107,963
Financial assets not measured at fair value Unquoted debt investment 330,000 – – – 330,000 – 357,162 – 357,162Other investments 750 – – – 750 Cash and cash equivalents 279,488 – – – 279,488 Trade and other receivables* 54,948 – – – 54,948 Loans to subsidiaries 75,235 – – – 75,235 – 75,962 – 75,962
740,421 – – – 740,421 Financial liabilities not measured at fair valueBorrowings – – – (347,000) (347,000) – (321,463) – (321,463)Lease liabilities – – – (1,171,215) (1,171,215) Trade and other payables** – – – (947,359) (947,359)
– – – (2,465,574) (2,465,574)
* Excludes prepayments and loans to subsidiaries
** Excludes contract liabilities

81EVERYTHING FOOD MADE EASY
Notes to the Financial Statements Year ended 31 December 2020
32 Financial instruments (cont’d)
Market risk (cont’d)
Determination of fair value
Fair values have been determined for measurement and disclosure purposes based on the following methods.
The fair values of quoted unit trusts, quoted equity investments and quoted debt investments traded in an active market and are determined with reference to quoted bid prices at the reporting date.
The fair value of unquoted equity investments, held by the Co-operative, is determined based on the net asset value in the investment fund’s valuation reports at the reporting date and is derived from prices from an observable market.
The fair values of certain unquoted equity investments included within level 3 are estimated based on the Group’s share of the net assets values of the investee company, which take into consideration the fair value of the underlying investment portfolio held by the investee company. The fair value of the investment portfolio is determined based on the underlying values with reference to quoted bid prices traded in a quoted market.
Financial instruments measured at fair value based on level 3
Unquoted equity
investments - FVOCI$’000
GROUP
At 1 January 2019 21,351Gains in other comprehensive income 782Proceed from disposal (22,123)
At 31 December 2019 10Gains in other comprehensive income 11Proceed from disposal (21)
At 31 December 2020 – There were no transfers between Level 1 and Level 2 of the fair value hierarchy during the financial year.
Financial instruments not measured at fair value
Type Valuation Technique
GROUP
Unquoted debt investment, borrowings and lease liabilities
Discounted cash flows: The valuation model considers the present value of expected payment, discounted using a risk-adjusted discount rate.
CO-OPERATIVE
Unquoted debt investment, loans to subsidiaries, borrowings and lease liabilities
Discounted cash flows: The valuation model considers the present value of expected payment, discounted using a risk-adjusted discount rate.
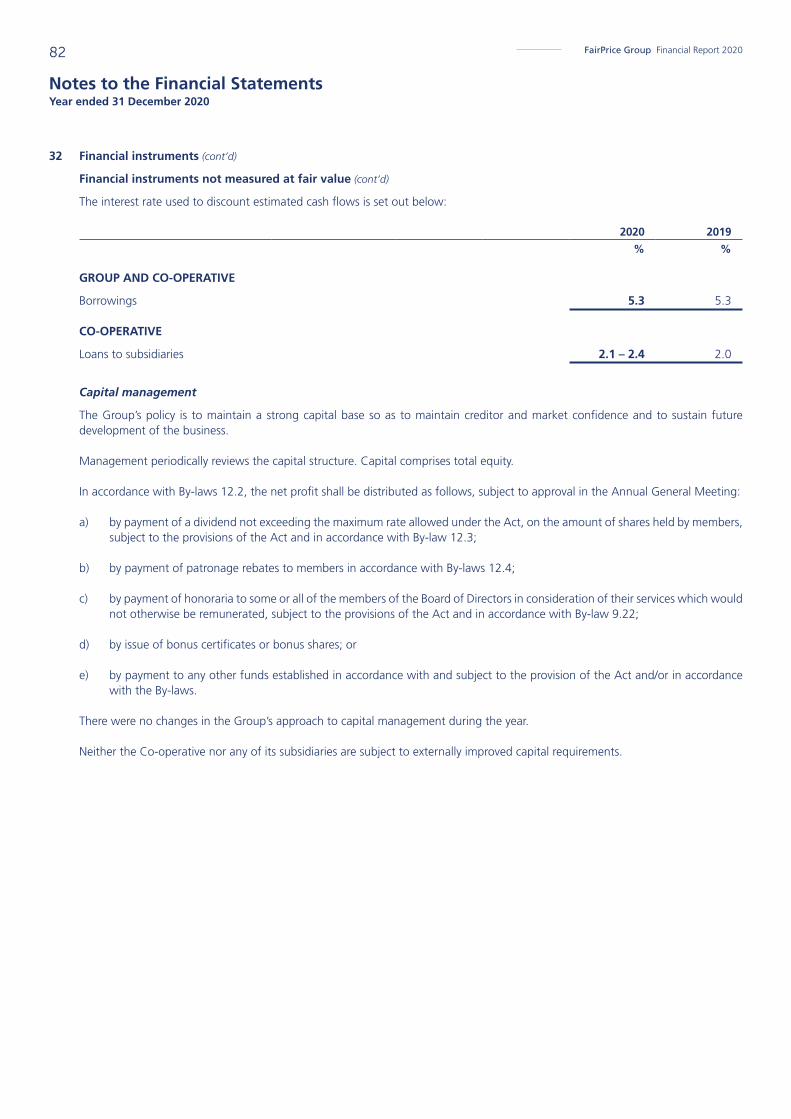
FairPrice Group Financial Report 202082
Notes to the Financial Statements Year ended 31 December 2020
32 Financial instruments (cont’d)
Financial instruments not measured at fair value (cont’d)
The interest rate used to discount estimated cash flows is set out below:
2020 2019
% %
GROUP AND CO-OPERATIVE
Borrowings 5.3 5.3 CO-OPERATIVE
Loans to subsidiaries 2.1 – 2.4 2.0
Capital management
The Group’s policy is to maintain a strong capital base so as to maintain creditor and market confidence and to sustain future development of the business.
Management periodically reviews the capital structure. Capital comprises total equity.
In accordance with By-laws 12.2, the net profit shall be distributed as follows, subject to approval in the Annual General Meeting:
a) by payment of a dividend not exceeding the maximum rate allowed under the Act, on the amount of shares held by members, subject to the provisions of the Act and in accordance with By-law 12.3;
b) by payment of patronage rebates to members in accordance with By-laws 12.4;
c) by payment of honoraria to some or all of the members of the Board of Directors in consideration of their services which would not otherwise be remunerated, subject to the provisions of the Act and in accordance with By-law 9.22;
d) by issue of bonus certificates or bonus shares; or
e) by payment to any other funds established in accordance with and subject to the provision of the Act and/or in accordance with the By-laws.
There were no changes in the Group’s approach to capital management during the year.
Neither the Co-operative nor any of its subsidiaries are subject to externally improved capital requirements.

83EVERYTHING FOOD MADE EASY
Notes to the Financial Statements Year ended 31 December 2020
33 Related parties
The Co-operative is a subsidiary of NTUC Enterprise Co-operative Limited (“NTUC Enterprise”), incorporated in the Republic of Singapore, which is also the Co-operative’s ultimate holding entity. Related companies in these financial statements refer to members of the ultimate holding entity’s group of entities.
Some of the Group’s transactions and arrangements are with related parties and the effect of these on the basis determined between the parties is reflected in these financial statements.
During the financial year, the Group entered into the following transactions with related parties:
GROUP CO-OPERATIVE 2020 2019 2020 2019
$’000 $’000 $’000 $’000
Donations to NTUC Fairprice Foundation Limited 20,000 10,000 4,650 3,200Sales of goods to: - Subsidiaries – – (58,919) (59,119)- Related parties (1,053) (1,149) (1,053) (1,149)Rental income from: - Ultimate holding entity (197) (269) (197) (269)- Subsidiaries – – (8,735) (6,326)- Associates – (423) – (423)- Related parties (1,421) (705) (609) (705)Interest income from: - Ultimate holding entity (10,258) (10,230) (10,258) (10,230)- Subsidiaries – – (3,244) –Interest expense from subsidiaries – – 3,782 957Rental expenses to: - Subsidiaries – – 1,391 –- Associates 48,647 48,105 40,590 42,722- Related party 5,119 117 4,938 5,500Redemption link points by related party (6,733) (8,188) (6,685) (8,188)Dividend expenses to: - Ultimate holding entity 7,898 9,478 7,898 9,478- Related parties 6,210 5,478 5,810 5,478Purchases from: - Subsidiaries – – 166,173 104,303- Associates 9,103 805 9,103 805- Related party 12,137 – 12,137 –Other operating expenses to: - Ultimate holding entity 4,408 6,623 4,402 6,623- Subsidiaries – – 19,299 5,894- Associate 5,765 – – –- Related party 2,188 3,021 – 3,021Sponsorship to: - Ultimate holding entity 90 – 90 –- Related parties 4,000 1,000 4,000 1,000Dividend income from: - Subsidiary – – (10,400) (13,500)- Associates (22,768) (22,045) (22,768) (22,045)- Related parties – (15) – (15) Please refer to notes 9 and 11 for additional information on related party transactions with associates.

FairPrice Group Financial Report 202084
Notes to the Financial Statements Year ended 31 December 2020
33 Related parties (cont’d)
Management personnel compensation
The remuneration of directors and other members of key management during the financial year was as follows:
GROUP CO-OPERATIVE2020 2019 2020 2019$’000 $’000 $’000 $’000
Salaries, short-term employee benefits and post-employment benefits: - directors 494 540 494 477- officers 6,440 10,569 5,743 9,305
6,934 11,109 6,237 9,782
34 Subsequent event
Subsequent to the reporting date, there were the following significant events in January 2021:
(a) The Group acquired 60% interest in a portfolio of companies in the food and beverage industry for $32,400,000.
(b) The Group acquired 100% stake in NTUC Link Pte Ltd from the immediate and ultimate holding entity, NTUC Enterprise Co-operative Limited, through an internal restructuring for a consideration of $1.

This page has been intentionally left blank.
