financial report half-yearly q1 – q2 2020 · 2020. 8. 12. · q2 2020 q2 2019 change in % q1-q2...
TRANSCRIPT

HALF-YEARLY FINANCIAL REPORT Q1 – Q2 2020
January 1 – June 30, 2020
IFRS Key Figures of GEA
(EUR million)Q2
2020Q2
2019Change
in %Q1-Q2
2020Q1-Q2
2019Change
in %
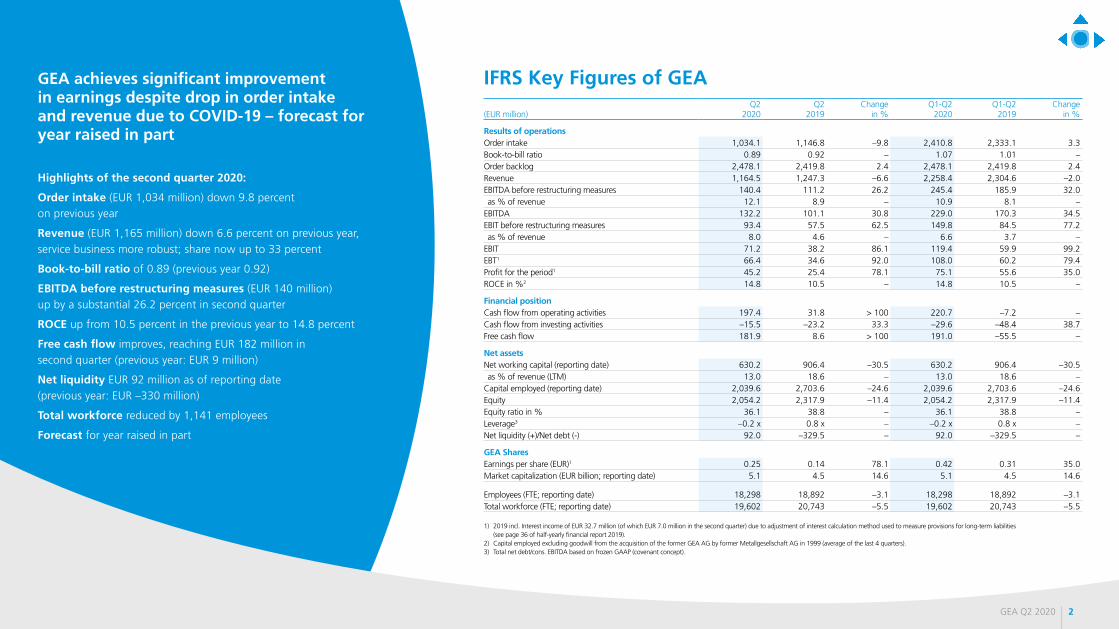
Results of operationsOrder intake 1,034.1 1,146.8 –9.8 2,410.8 2,333.1 3.3Book-to-bill ratio 0.89 0.92 – 1.07 1.01 –Order backlog 2,478.1 2,419.8 2.4 2,478.1 2,419.8 2.4Revenue 1,164.5 1,247.3 –6.6 2,258.4 2,304.6 –2.0EBITDA before restructuring measures 140.4 111.2 26.2 245.4 185.9 32.0as % of revenue 12.1 8.9 – 10.9 8.1 –
EBITDA 132.2 101.1 30.8 229.0 170.3 34.5EBIT before restructuring measures 93.4 57.5 62.5 149.8 84.5 77.2as % of revenue 8.0 4.6 – 6.6 3.7 –
EBIT 71.2 38.2 86.1 119.4 59.9 99.2EBT1 66.4 34.6 92.0 108.0 60.2 79.4Profit for the period1 45.2 25.4 78.1 75.1 55.6 35.0ROCE in %2 14.8 10.5 – 14.8 10.5 –
Financial positionCash flow from operating activities 197.4 31.8 > 100 220.7 –7.2 –Cash flow from investing activities –15.5 –23.2 33.3 –29.6 –48.4 38.7Free cash flow 181.9 8.6 > 100 191.0 –55.5 –
Net assetsNet working capital (reporting date) 630.2 906.4 –30.5 630.2 906.4 –30.5as % of revenue (LTM) 13.0 18.6 – 13.0 18.6 –
Capital employed (reporting date) 2,039.6 2,703.6 –24.6 2,039.6 2,703.6 –24.6Equity 2,054.2 2,317.9 –11.4 2,054.2 2,317.9 –11.4Equity ratio in % 36.1 38.8 – 36.1 38.8 –Leverage3 –0.2 x 0.8 x – –0.2 x 0.8 x –Net liquidity (+)/Net debt (-) 92.0 –329.5 – 92.0 –329.5 –
GEA SharesEarnings per share (EUR)1 0.25 0.14 78.1 0.42 0.31 35.0Market capitalization (EUR billion; reporting date) 5.1 4.5 14.6 5.1 4.5 14.6
Employees (FTE; reporting date) 18,298 18,892 –3.1 18,298 18,892 –3.1Total workforce (FTE; reporting date) 19,602 20,743 –5.5 19,602 20,743 –5.5
1) 2019 incl. Interest income of EUR 32.7 million (of which EUR 7.0 million in the second quarter) due to adjustment of interest calculation method used to measure provisions for long-term liabilities (see page 36 of half-yearly financial report 2019).2) Capital employed excluding goodwill from the acquisition of the former GEA AG by former Metallgesellschaft AG in 1999 (average of the last 4 quarters).3) Total net debt/cons. EBITDA based on frozen GAAP (covenant concept).
Highlights of the second quarter 2020:
Order intake (EUR 1,034 million) down 9.8 percent on previous year
Revenue (EUR 1,165 million) down 6.6 percent on previous year, service business more robust; share now up to 33 percent
Book-to-bill ratio of 0.89 (previous year 0.92)
EBITDA before restructuring measures (EUR 140 million) up by a substantial 26.2 percent in second quarter
ROCE up from 10.5 percent in the previous year to 14.8 percent
Free cash flow improves, reaching EUR 182 million in second quarter (previous year: EUR 9 million)
Net liquidity EUR 92 million as of reporting date (previous year: EUR –330 million)
Total workforce reduced by 1,141 employees
Forecast for year raised in part
GEA achieves significant improvement in earnings despite drop in order intake and revenue due to COVID-19 – forecast for year raised in part
2GEA Q2 2020
Interim GroupManagement Report 4GEA in the Second Quarter of 2020 5
Report on Economic Position 6
Report on Risks and Opportunities 15
Report on Change in Forecast 16
Condensed InterimConsolidated FinancialStatements 18Consolidated Balance Sheet 19
Consolidated Income Statement for the period April 1 – June 30, 2020 20
Consolidated Statement of Comprehensive Income for the period April 1 – June 30, 2020 21
Consolidated Income Statement for the period January 1 – June 30, 2020 22
Consolidated Statement of Comprehensive Income for the period January 1 – June 30, 2020 23
Consolidated Cash Flow Statement 24
Consolidated Statement of Changes in Equity 26
Notes to the condensed interim consolidated financial statements 27
1. Reporting Principles 27
2. Basis of consolidation 29
3. Balance sheet disclosures 30
4. Consolidated income statement disclosures 35
5. Statement of comprehensive income and consolidated statement of changes in equity disclosures 35
6. Segment Reporting 36
7. Related party transactions 40
Further Information 41
Responsibility Statement 42
Review Report 43
Financial Calendar/Imprint 44
Contents
Time for change in the global pharmaceutical industry
GEA and its partners are leading the way toward smaller, more flexible, continuous
processing technologies that have the potential to transform the future
of pharmaceutical development, manufacturing and delivering customized
quantities of drugs to patients in need in a quick and efficient way.
More infos »»»
3GEA Q2 2020

4GEA Q2 2020
GEA in the Second Quarter of 2020 5
Report on Economic Position 6
Report on Risks and Opportunities 15
Report on Change in Forecast 16
Interim GroupManagement Report

GEA in the Second Quarter of 2020
GEA grew its EBITDA before restructuring measures by a substantial 26 percent to EUR 140.4 million (previous year: EUR 111.2 million) in the second quarter, even though revenue was lower due to the COVID-19 pandemic. The company also posted a marked year-on-year improvement in several other financial indicators, including ROCE, net working capital, net liquidity and cash flow.
In a very challenging macroeconomic environment, GEA closed the quarter on a positive footing. In particularly, the trend in earnings and ROCE underscore how successful the measures introduced last year to improve efficiency have been. After a very good first quarter, the decreases in order intake and revenue were expected given the negative effects of the COVID-19 pandemic. The second half of 2020 is set to remain challenging. GEA is well placed with its focus on stable end markets such as food, beverages and pharmaceuticals, and its efficiency measures are producing results. That is why the company has raised its forecast for 2020 in part and remains confident to reach its medium-term financial targets.
Order intake grew by 3.3 percent to EUR 2,411 million in the first six months of the year (previous year: EUR 2,333 million), while at EUR 2,258 million, revenue was down 2.0 percent on the figure for the same period of the previous year (EUR 2,305 million). EBITDA before restructuring measures grew by a substantial 32.0 percent to EUR 245.4 million in the first half year (previous year: EUR 185.9 million).
Largely as a result of the COVID-19 pandemic, order intake fell by 9.8 percent to EUR 1,034 million in the second quarter. While the Farm Technologies division more-or-less achieved its prior-year level, the Refrigeration Technologies division was hit particularly hard by the decline in business. Projects in the EUR 5 million – EUR 15 million range were disproportionately impacted by the slump in order intake, while projects below EUR 1 million in volume contracted at a slightly lower rate. Due to the pandemic, revenue of EUR 1,165 million was also 6.6 percent below the previous year’s figure, which was a record figure for a second quarter. With the exception of the Separation & Flow Technologies division, all GEA divisions recorded declines in revenue. GEA’s Service business remained relatively unscathed by developments and even managed to increase its share of overall revenue slightly from 31.6 percent in the previous year to 32.7 percent in the quarter under review.
Despite the fall in revenue, GEA achieved a marked year-on-year improvement in EBITDA before restructuring measures in the quarter under review. The positive trend was driven not only by substantial improvements in margins and the rapid implementation of various restructuring measures, but also by reduced travel expenses and lower special items compared to the previous year. After EUR 21.2 million in the prior-year quarter, special items came to EUR 8.9 million in the reporting quarter – EUR 7.3 million of which was in connection with COVID-19. Payroll expenses were also substantially lower due to a significant reduction in the number of employees: compared with June 30, 2019, the workforce contracted by 595 for a total of 18,298 employees. Including temporary staff and self-employed contractors working for GEA, the reduction amounted to 1,141 full-time equivalents. The Liquid & Powder Technologies division posted the biggest reduction in employee numbers at 325.
ROCE (return on capital employed) rose to 14.8 percent (previous year: 10.5 percent). Net working capital fell significantly, to EUR 630.2 million as of June 30, 2020. At 13.0 percent, the ratio of average working capital over the last 12 months to revenue was thus significantly lower than in the previous year (18.6 percent). Cash flow from operating activities since the start of the year amounted to EUR 220.7 million, EUR 227.8 million above the previous year level of EUR –7.2 million. Free cash flow stood at EUR 191.0 million compared to EUR –55.5 million a year earlier. Higher EBITDA coupled with a marked reduction in net working capital were the key drivers of these significant improvements. As of the reporting date, GEA’s net liquidity stood at EUR 92.0 million, after net debt of EUR 329.5 million a year earlier. It should be noted that, thus far in 2020, only half (EUR 75.8 million) of the 2019 dividend has been distributed, the remaining payment being due after the Annual General Meeting, which has been delayed and is now scheduled for November 26, 2020.
Thanks to its solid performance, GEA was able to raise in part its outlook for the 2020 financial year. The Group still expects revenue for 2020 to be slightly lower (previous year: EUR 4,880 million). As regards EBITDA before restructuring measures, the Group now expects to come in at minimum the upper end of the previous range of EUR 430 to 480 million (previous year: EUR 479 million). GEA anticipates that ROCE will now be within a corridor of 12.0 to 14.0 percent rather than the former one of 9.0 to 11.0 percent (previous year: 10.6 percent).
5GEA Q2 2020
GEA in the Second Quarter of 2020

Report on Economic Position
Course of business
A disclosure of the group’s course of business, including the comparable prior-year figures, is presented for five GEA divisions, namely Separation & Flow Technologies, Liquid & Powder Technologies, Food & Healthcare Technologies, Farm Technologies, and Refrigeration Technologies (for information on the Group’s structure since January 1, 2020, see p. 38 f. of the 2019 Annual Report). All amounts have been rounded using standard rules. Adding together individual amounts may, therefore, result in rounding differences in some cases.
Order intakeAt EUR 1,034.1 million, order intake in the second quarter of 2020 was lower (down 9.8 percent) than in the same quarter of the previous year due to the COVID-19 pandemic. Whereas the Refrigeration Technologies division was hit particularly hard by the slump in orders, the figure posted by Farm Technologies was almost on a par with the previous year. Adjusted for exchange rate fluctuations, order intake fell by 8.0 percent. With the exception of Western Europe and the Middle East & Africa, all regions recorded declines in order intake. Projects in the EUR 5 million – EUR 15 million range were more severely affected by the slump in order intake, whereas “basic business” (orders of below EUR 1 million in volume) contracted at a below average rate.
In the months April – June of the current financial year, the Liquid & Powder Technologies division secured one major order (projects above EUR 15 million in volume) for a beverages project in Europe. In the prior-year quarter, GEA also booked one major project (Food & Healthcare Technologies).
Order intake(EUR million)
Q22020
Q22019
Changein %
Q1-Q22020
Q1-Q22019
Changein %
Separation & Flow Technologies 287.6 323.4 –11.1 619.9 637.0 –2.7
Liquid & Powder Technologies 334.8 365.3 –8.4 900.5 775.0 16.2
Food & Healthcare Technologies 192.1 222.2 –13.5 414.5 460.1 –9.9
Farm Technologies 155.9 157.8 –1.2 333.3 320.2 4.1
Refrigeration Technologies 138.4 197.7 –30.0 322.8 352.1 –8.3
Consolidation –74.7 –119.7 37.5 –180.2 –211.3 14.8
GEA 1,034.1 1,146.8 –9.8 2,410.8 2,333.1 3.3
In the first six months of the 2020 financial year, order intake was 3.3 percent up on the comparable previous year’s level, mainly thanks to the strong first quarter. Adjusted for currency effects, order intake grew by 4.3 percent in the first six months of 2020.
Order backlog GEA’s order backlog of EUR 2,478.1 million was 2.7 percent above the value as of December 31, 2019 (EUR 2,412.4 million).
6GEA Q2 2020
Report on Economic Position

Revenue GEA’s figure for revenue stood at EUR 1,164.5 million in the second quarter of 2020 – 6.6 percent below the prior-year figure, a reflection once again of the impact of the COVID-19 crisis. With the exception of the Separation & Flow Technologies division, all GEA divisions recorded declines in revenue. Adjusted for exchange rate movements, revenue fell by 5.1 percent year-on-year. Only the regions North America, Germany, Austria, and Switzerland & Eastern Europe saw revenue growth in the second quarter.
Service revenue fell by 3.3 percent in the quarter under review (by 1.6 percent when adjusted for currency effects). Its share of total revenue increased slightly from 31.6 percent in the previous year to 32.7 percent.
The book-to-bill ratio, i.e. the ratio of order intake to revenue, was at 0.89 in the quarter under review (previous year: 0.92). This value stood at 1.07 (previous year: 1.01) for the first six months of the year.
Revenue(EUR million)
Q22020
Q22019
Changein %
Q1-Q22020
Q1-Q22019
Changein %
Separation & Flow Technologies 312.8 300.7 4.0 591.2 575.2 2.8
Liquid & Powder Technologies 422.6 445.2 –5.1 808.1 807.2 0.1
Food & Healthcare Technologies 236.9 251.6 –5.8 449.5 474.5 –5.3
Farm Technologies 144.6 160.1 –9.7 286.0 303.4 –5.7
Refrigeration Technologies 164.2 189.5 –13.4 334.0 338.9 –1.5
Consolidation –116.6 –99.7 –16.9 –210.3 –194.6 –8.1
GEA 1,164.5 1,247.3 –6.6 2,258.4 2,304.6 –2.0
Revenue for the first six months of 2020 also fell short of the comparable figure for the previous year. Thanks to the strong first quarter, however, revenue fell by only 2.0 percent to EUR 2,258.4 million (previous year: EUR 2,304.6 million.) Adjusted for exchange rate movements, revenue fell by 1.2 percent. Service revenue increased by 2.2 percent in the first six months of the year (by 3.2 percent when adjusted for currency effects). Its share of total revenue was 33.5 percent in the first six months compared with 32.1 percent in the previous year.
Results of operations, financial position and net assets
Results of operationsSince the start of 2019 – in line with its internal control system – GEA’s management has been using EBITDA before restructuring measures as an indication of its operating performance. The adjusted restructuring measures are outlined in terms of content and scope, presented to the Chairman of the Supervisory Board by the CEO and, where required by the Board’s rules of procedure, approved and finalized by the Supervisory Board. Only measures requiring funding in excess of EUR 2 million are taken into account. Adjustments are no longer made for expenses incurred in other strategic projects above and beyond restructuring measures (see page 40 f. of the 2019 Annual Report).
In accordance with this definition, EBITDA before restructuring measures for the second quarter of 2020 was adjusted for expenses totaling EUR 8.2 million (previous year: EUR 10.2 million). These expenses were incurred largely to implement the new Group structure, to optimize the procurement organization and to implement the planned portfolio measures. In the first six months of the financial year, these adjustments amounted to EUR 16.4 million (previous year: EUR 15.5 million).
The following table shows the divisions’ EBITDA and EBITDA margin (before restructuring measures):
EBITDA before restructuring measures/EBITDA margin before restructuring measures(EUR million)
Q22020
Q22019
Changein %
Q1-Q22020
Q1-Q22019
Changein %
Separation & Flow Technologies 63.7 45.9 38.8 123.5 103.6 19.2
Liquid & Powder Technologies 37.4 24.9 50.4 45.6 17.7 > 100
Food & Healthcare Technologies 21.6 12.1 78.2 38.1 31.5 20.7
Farm Technologies 14.9 13.2 12.7 25.8 19.3 33.7
Refrigeration Technologies 13.0 14.9 –12.6 30.4 22.0 38.1
Others –9.7 –1.0 < –100 –17.4 –7.8 < –100
Consolidation –0.5 1.3 – –0.5 –0.4 –14.1
GEA 140.4 111.2 26.2 245.4 185.9 32.0
as % of revenue 12.1 8.9 – 10.9 8.1 –
7GEA Q2 2020
Report on Economic Position

Despite the drop in revenue, EBITDA before restructuring measures in the second quarter of 2020 was EUR 29.2 million or 26.2 percent above the comparable prior-year level. Moreover, since all divisions managed to reduce their payroll and travel expenses, EBITDA margins before restructuring measures improved markedly in almost every division. The improvement in the margin was around 310 basis points for GEA as a whole.
In the prior-year quarter, negative special items affected the company’s account to the tune of some EUR 21.2 million. In the reporting quarter, negative special items amounted to EUR 8.9 million. They were attributable in particular to additional impairments of trade receivables and contract assets necessitated by adjustments to economic growth expectations for the 2020 financial year in the wake of COVID-19.
At EUR 245.4 million, EBITDA before restructuring measures in the first six months of 2020 was well above the comparable prior-year figure (EUR 185.9 million). The corresponding margin rose by 280 basis points to 10.9 percent.
The following table shows the reconciliation of EBITDA before restructuring measures through EBITDA and EBIT to EBIT before restructuring measures:
Reconciliation of EBITDA before restructuring measures toEBIT before restructuring measures (EUR million)
Q22020
Q22019
Changein %
Q1-Q22020
Q1-Q22019
Changein %
EBITDA before restructuring measures 140.4 111.2 26.2 245.4 185.9 32.0
Restructuring measures –8.2 –10.2 – –16.4 –15.5 –
EBITDA 132.2 101.1 30.8 229.0 170.3 34.5
Depreciation and impairment losses on property, plant and equipment and investment property, as well as amortization of and impairment losses on intangible assets and goodwill, as reported in the statement of changes in non-current assets –61.0 –62.8 – –109.7 –110.4 –
EBIT 71.2 38.2 86.1 119.4 59.9 99.2
Restructuring measures 22.2 19.2 – 30.4 24.6 –
EBIT before restructuring measures 93.4 57.5 62.5 149.8 84.5 77.2
Net interest income stood at EUR –11.3 million in the first half of 2020 compared with EUR 0.3 million in the same period of the previous year. In 2019, the figure for net interest income had received a EUR 11.5 million boost from an adjustment to the method of calculating interest when measuring provisions for environmental protection and mining.
Earnings before tax (EBT) increased substantially, rising from EUR 60.2 million in the first half of 2019 to EUR 108.0 million in the first half of 2020.
An income tax rate of 30.0 percent is expected for the 2020 financial year (previous year: 23.0 percent) and this figure was also used to calculate the tax expense for the first six months of the year. The result was a tax expense of EUR 32.4 million (previous year: EUR 13.9 million).
In the first half of 2020, earnings from discontinued operations were almost in the black at EUR –0.6 million. In the comparable prior-year period, discontinued operations had reported a gain of EUR 9.2 million thanks to the above-mentioned adjustment to the method of calculating interest, which generated pre-tax income of EUR 21.2 million.
Earnings per share in the first half of 2020 stood at EUR 0.42 (based, as before, on an average of 180,492,172 dividend-earning shares in circulation), compared with EUR 0.31 in the previous year.
Financial position Net debt including discontinued operations fell significantly compared with the EUR 329.5 million figure from June 30, 2019. At the end of June, GEA reported net liquidity of EUR 92.0 million. This improved net liquidity is attributable primarily to significantly higher earnings, to the strong reduction in working capital and to the fact that only half the dividend has been paid out thus far.
Overview of net liquidity incl. discontinued operations(EUR million) 06/30/2020 12/31/2019 06/30/2019
Cash and cash equivalents 513.8 354.6 230.6
Liabilities to banks 421.9 326.1 560.2
Net liquidity (+)/Net debt (-) 92.0 28.4 –329.5
Gearing (%) –4.5 –1.4 14.2
8GEA Q2 2020
Report on Economic Position

The chart below shows the key factors responsible for the change in the net financial position (including discontinued operations) over the last 12 months:
–330
Net cash flow
+509
Free cash flow
+589
IFRS 16 Payments
–64
Interests paid
–16
Discontinued operations
–2
Dividends
–76
–7 –2
Currency effects
Others Net position 06/30/2020
+92
Change in net financial position(EUR million)
Net position 06/30/2019
The chart below illustrates the marked reduction in net working capital:
Change in net working capital (continued operations)(EUR million)
Trade receivables
Contract assets
Inventories
Trade payables
Contract liabilities
Anticipated losses from construction contracts
Net working capital
Q2 2020
Q2 2019
- = 630774 764420 674650 4
- = 906873 832487 631648 8
The consolidated cash flow statement is as follows:
Overview of cash flow statement(EUR million)
Q1-Q22020
Q1-Q22019
Changeabsolute
Cash flow from operating activities 220.7 –7.2 227.8
Cash flow from investing activities –29.6 –48.4 18.7
Free cash flow 191.0 –55.5 246.6
Cash flow from financing activities –24.2 45.1 –69.3
Net cash flow other discontinued operations –0.3 –10.0 9.6
Change in unrestricted cash and cash equivalents 158.3 –16.9 175.2
Since the start of the year, cash flow of EUR 220.7 million has been generated from activities attributable to continuing operations, EUR 227.8 million above the previous year’s level. This considerable improvement was mainly due to higher EBITDA and the marked reduction in net working capital.
Cash flow from investing activities was also up year-on-year at EUR 18.7 million. The increase resulted mainly from lower payments to acquire property, plant and equipment, and intangible assets.
Free cash flow in the first half year thus came to EUR 191.0 million, EUR 246,6 million higher year-on-year.
9GEA Q2 2020
Report on Economic Position

In particular, the raising of finance loans (on balance EUR 91.2 million), but also the one-time payout on the dividend (EUR 75.8 million) and outflows for lease liabilities (EUR 31.5 million) were reflected in the cash flow of EUR –24.2 million from financing activities attributable to continuing operations. In the previous year, this balance sheet item had contained the full dividend payout (EUR 153.4 million) plus outflows for lease liabilities on a comparable scale to previous year. In addition, the second quarter of 2019 saw increased utilization of credit lines (EUR 237.5 million).
Guarantee lines, which are mainly for contract performance, plus advance payments and warranties amounting to EUR 1,232.6 million (December 31, 2019: EUR 1,316.4 million) were available to GEA as of the reporting date, of which EUR 480.2 million (December 31, 2019: EUR 425.7 million) had been utilized.
Net assets
Condensed balance sheet(EUR million) 06/30/2020
as % oftotal assets 12/31/2019
as % oftotal assets
Changein %
Assets
Non-current assets 2,992.8 52.6 3,066.6 53.7 –2.4
thereof goodwill 1,512.2 26.6 1,512.2 26.5 –
thereof deferred taxes 339.7 6.0 351.6 6.2 –3.4
Current assets 2,693.5 47.4 2,643.9 46.3 1.9
thereof cash and cash equivalents 513.8 9.0 354.6 6.2 44.9
thereof assets held for sale 0.1 0.0 0.2 0.0 –14.6
Total assets 5,686.3 100.0 5,710.6 100.0 –0.4
Equity and liabilities
Equity 2,054.2 36.1 2,090.1 36.6 –1.7
Non-current liabilities 1,635.7 28.8 1,540.8 27.0 6.2
thereof financial liabilities 510.4 9.0 424.0 7.4 20.4
thereof deferred taxes 103.8 1.8 104.3 1.8 –0.5
Current liabilities 1,996.5 35.1 2,079.7 36.4 –4.0
thereof financial liabilities 81.6 1.4 90.0 1.6 –9.4
Total equity and liabilities 5,686.3 100.0 5,710.6 100.0 –0.4
Compared with December 31, 2019, total assets declined by a slight EUR 24.2 million or 0.4 percent. This was primarily the result of a EUR 140.6 million fall in trade receivables. At the same time, cash and cash equivalents rose sharply. In addition, the amounts posted under non-current assets for property, plant and equipment, and intangible assets (including impairments of the Farm Technologies division’s internally generated technologies) were lower.
Compared with December 31, 2019, equity fell slightly, by EUR 35.9 million to EUR 2,054.2 million. While consolidated earnings of EUR 75.1 million augmented equity, the one-time dividend payout of EUR 75.8 million effected May 6 and currency translation effects of EUR 23.2 million served to reduce equity. The equity ratio is now 36.1 percent.
In non-current liabilities, bank loans increased by EUR 99.8 million, while lease liabilities were reduced by EUR 13.9 million. The fall in current liabilities was mainly due to a reduction in both trade payables and provisions for personnel expenses.
10GEA Q2 2020
Report on Economic Position
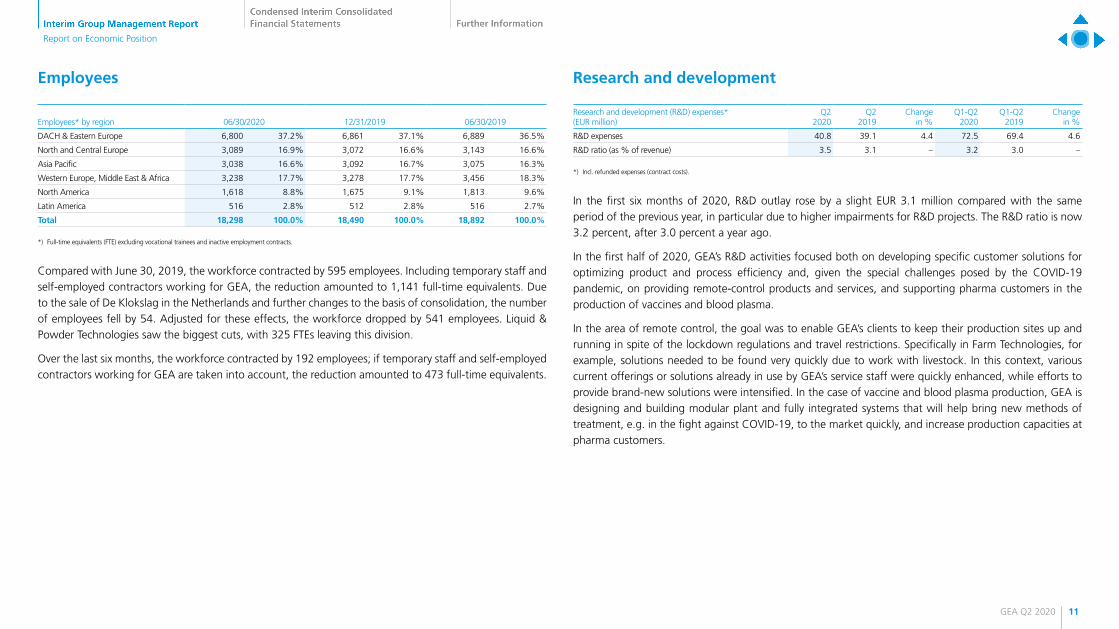
Employees
Employees* by region 06/30/2020 12/31/2019 06/30/2019
DACH & Eastern Europe 6,800 37.2% 6,861 37.1% 6,889 36.5%
North and Central Europe 3,089 16.9% 3,072 16.6% 3,143 16.6%
Asia Pacific 3,038 16.6% 3,092 16.7% 3,075 16.3%
Western Europe, Middle East & Africa 3,238 17.7% 3,278 17.7% 3,456 18.3%
North America 1,618 8.8% 1,675 9.1% 1,813 9.6%
Latin America 516 2.8% 512 2.8% 516 2.7%
Total 18,298 100.0% 18,490 100.0% 18,892 100.0%
*) Full-time equivalents (FTE) excluding vocational trainees and inactive employment contracts.
Compared with June 30, 2019, the workforce contracted by 595 employees. Including temporary staff and self-employed contractors working for GEA, the reduction amounted to 1,141 full-time equivalents. Due to the sale of De Klokslag in the Netherlands and further changes to the basis of consolidation, the number of employees fell by 54. Adjusted for these effects, the workforce dropped by 541 employees. Liquid & Powder Technologies saw the biggest cuts, with 325 FTEs leaving this division.
Over the last six months, the workforce contracted by 192 employees; if temporary staff and self-employed contractors working for GEA are taken into account, the reduction amounted to 473 full-time equivalents.
Research and development
Research and development (R&D) expenses*(EUR million)
Q22020
Q22019
Changein %
Q1-Q22020
Q1-Q22019
Changein %
R&D expenses 40.8 39.1 4.4 72.5 69.4 4.6
R&D ratio (as % of revenue) 3.5 3.1 – 3.2 3.0 –
*) Incl. refunded expenses (contract costs).
In the first six months of 2020, R&D outlay rose by a slight EUR 3.1 million compared with the same period of the previous year, in particular due to higher impairments for R&D projects. The R&D ratio is now 3.2 percent, after 3.0 percent a year ago.
In the first half of 2020, GEA’s R&D activities focused both on developing specific customer solutions for optimizing product and process efficiency and, given the special challenges posed by the COVID-19 pandemic, on providing remote-control products and services, and supporting pharma customers in the production of vaccines and blood plasma.
In the area of remote control, the goal was to enable GEA’s clients to keep their production sites up and running in spite of the lockdown regulations and travel restrictions. Specifically in Farm Technologies, for example, solutions needed to be found very quickly due to work with livestock. In this context, various current offerings or solutions already in use by GEA’s service staff were quickly enhanced, while efforts to provide brand-new solutions were intensified. In the case of vaccine and blood plasma production, GEA is designing and building modular plant and fully integrated systems that will help bring new methods of treatment, e.g. in the fight against COVID-19, to the market quickly, and increase production capacities at pharma customers.
11GEA Q2 2020
Report on Economic Position

Return on capital employed
Return on capital employed (ROCE)(average of the last 4 quarters) 06/30/2020 06/30/2019
EBIT before restructuring measures (EUR million) 336.7 273.2
Capital employed (EUR million)* 2,270.9 2,590.9
Return on capital employed (in %) 14.8 10.5
*) Capital employed excluding goodwill from the acquisition of the former GEA AG by former Metallgesellschaft AG in 1999 (average of the last 4 quarters); this also applies for the ROCE of the divisions.
The strong increase in ROCE – from 10.5 percent to 14.8 percent – is due both to improved earnings and to lower working capital.
Key indicators based on constant year-on-year exchange rates
Q1-Q2 2020reported
Q1-Q2 2020constant exchange rates
Revenue (EUR million) 2,258.4 2,277.5
Growth in revenue (in %) –2.0 –1.2
EBITDA before restructuring measures (EUR million) 245.4 247.6
ROCE (in %) 14.8 14.8
Divisions of GEA in the second quarter
Separation & Flow Technologies
Separation & Flow Technologies(EUR million)
Q22020
Q22019
Changein %
Q1-Q22020
Q1-Q22019
Changein %
Order intake 287.6 323.4 –11.1 619.9 637.0 –2.7
Revenue 312.8 300.7 4.0 591.2 575.2 2.8
EBITDA before restructuring measures 63.7 45.9 38.8 123.5 103.6 19.2
as % of revenue 20.4 15.3 – 20.9 18.0 –
EBITDA 61.9 44.9 38.1 121.6 102.1 19.2
EBIT before restructuring measures 53.4 36.2 47.5 103.1 84.5 22.1
EBIT 50.3 34.8 44.5 99.9 82.6 21.0
ROCE in % 23.1 21.7 – 23.1 21.7 –
• Second-quarter order intake 11.1 percent below the prior-year figure due to COVID-19 (fall of 9.8 percent when adjusted for currency translation effects); with the exception of Germany, Austria, Switzerland & Eastern Europe, all regions recorded a decline in order intake
• Second-quarter revenue 4.0 percent above the prior-year level despite COVID-19 (growth in revenue 5.4 percent when adjusted for currency translation)
• Revenue growth in all regions with the exception of Latin America • At 40.3 percent, share of revenue from service business in second quarter still at high level
(previous year: 41.3 percent) • Marked improvement in EBITDA before restructuring measures, from EUR 45.9 million to
EUR 63.7 million in the quarter under review, thanks to growth in revenue, positive product mix effects and savings triggered by COVID-19 as well as to the absence of the non-recurring expenses that hampered earnings in the previous year (EUR 10.0 million)
12GEA Q2 2020
Report on Economic Position

Liquid & Powder Technologies
Liquid & Powder Technologies(EUR million)
Q22020
Q22019
Changein %
Q1-Q22020
Q1-Q22019
Changein %
Order intake 334.8 365.3 –8.4 900.5 775.0 16.2
Revenue 422.6 445.2 –5.1 808.1 807.2 0.1
EBITDA before restructuring measures 37.4 24.9 50.4 45.6 17.7 > 100
as % of revenue 8.9 5.6 – 5.6 2.2 –
EBITDA 37.3 23.3 60.2 45.4 15.6 > 100
EBIT before restructuring measures 28.3 14.5 94.8 26.6 –2.4 –
EBIT 28.2 5.2 > 100 26.4 –12.2 –
ROCE in % 46.1 11.3 – 46.1 11.3 –
• Second-quarter order intake 8.4 percent below prior-year figure largely due to rescheduling of projects by customers (fall of 6.6 percent when adjusted for currency translation); positive trend for chemical-industry customers
• One project over EUR 15 million in the quarter under review • Second-quarter revenue 5.1 percent below prior-year level, mainly as a result of restrictions in
accessing customer locations due to COVID-19 (fall of 4.3 percent when adjusted for currency translation); service business was also affected by these restrictions
• Revenue decline mainly in North and Central Europe and the Asia Pacific region; growth in North America continues to be significant
• Slight fall in share of revenue from service business (down from 22.4 percent in the prior-year quarter to 22.0 percent in the quarter under review)
• EBITDA before restructuring measures increased significantly from EUR 24.9 million despite the lower revenue to EUR 37.4 million in the quarter under review, primarily due to the absence in 2020 of the negative effects on earnings of the previous year (EUR 12.8 million) and to the restructuring measures that are already bearing fruit in terms of lower payroll expenses In addition, there were savings triggered by COVID-19
Food & Healthcare Technologies
Food & Healthcare Technologies(EUR million)
Q22020
Q22019
Changein %
Q1-Q22020
Q1-Q22019
Changein %
Order intake 192.1 222.2 –13.5 414.5 460.1 –9.9
Revenue 236.9 251.6 –5.8 449.5 474.5 –5.3
EBITDA before restructuring measures 21.6 12.1 78.2 38.1 31.5 20.7
as % of revenue 9.1 4.8 – 8.5 6.6 –
EBITDA 21.5 12.1 77.2 37.8 31.5 20.1
EBIT before restructuring measures 8.8 –0.8 – 12.4 5.7 > 100
EBIT 8.7 –0.8 – 12.2 5.7 > 100
ROCE in % 3.9 1.3 – 3.9 1.3 –
• Second-quarter order intake 13.5 percent below prior-year figure (fall of 13.4 percent when adjusted for currency translation); this division had secured a major order worth almost EUR 18 million in the prior-year quarter
• Decline due to project rescheduling as a result of COVID-19 • Second-quarter revenue 5.8 percent below prior-year level (fall of 5.6 percent when adjusted for
currency translation); delays in plant installation and commissioning due to COVID-19 • Revenue drop mainly in Western Europe, Middle East and Africa, and North and Central Europe;
substantial growth in the Asia Pacific region • Slight increase in share of revenue from service business (up from 23.7 percent in the prior-year
quarter to 24.2 percent in the quarter under review) • Despite the decline in revenue, significant increase in EBITDA before restructuring measures in the
quarter under review from EUR 12.1 million to EUR 21.6 million; here too, this trend was due to the absence in 2020 of special items (EUR 5.5 million) that hampered earnings a year earlier
13GEA Q2 2020
Report on Economic Position

Farm Technologies
Farm Technologies(EUR million)
Q22020
Q22019
Changein %
Q1-Q22020
Q1-Q22019
Changein %
Order intake 155.9 157.8 –1.2 333.3 320.2 4.1
Revenue 144.6 160.1 –9.7 286.0 303.4 –5.7
EBITDA before restructuring measures 14.9 13.2 12.7 25.8 19.3 33.7
as % of revenue 10.3 8.2 – 9.0 6.3 –
EBITDA 16.6 12.8 30.5 27.3 18.6 46.5
EBIT before restructuring measures 8.0 1.3 > 100 12.1 0.9 > 100
EBIT –2.9 0.9 – 1.0 0.2 > 100
ROCE in % 14.6 10.3 – 14.6 10.3 –
• Second-quarter order intake a slight 1.2 percent below the prior-year level despite COVID-19 (up 2.3 percent when adjusted for currency translation). Weaker trend in North and Latin America almost offset by robust growth in Asia Pacific and by dairy robot business in Germany; Latin America severely impacted by COVID-19.
• Second-quarter revenue 9.7 percent below prior-year level (fall of 6.3 percent when adjusted for currency translation); downward trend in new-machinery business, but stable service business
• Further increase in already very high share of revenue enjoyed by service business: up from 42.5 percent in the prior-year quarter to 46.8 percent in the quarter under review
• Despite significantly lower revenue, EBITDA before restructuring measures in the quarter under review at EUR 14.9 million above the prior-year level thanks to lower payroll expenses and further cost-cutting due to COVID-19
Refrigeration Technologies
Refrigeration Technologies(EUR million)
Q22020
Q22019
Changein %
Q1-Q22020
Q1-Q22019
Changein %
Order intake 138.4 197.7 –30.0 322.8 352.1 –8.3
Revenue 164.2 189.5 –13.4 334.0 338.9 –1.5
EBITDA before restructuring measures 13.0 14.9 –12.6 30.4 22.0 38.1
as % of revenue 7.9 7.9 – 9.1 6.5 –
EBITDA 13.6 11.2 21.0 30.9 18.3 68.8
EBIT before restructuring measures 8.0 9.7 –17.7 20.0 11.5 74.4
EBIT 8.5 5.1 68.3 20.5 6.9 > 100
ROCE in % 17.8 13.3 – 17.8 13.3 –
• Second-quarter order intake a full 30.0 percent down on the good prior-year figure due to COVID-19 (fall of 27.6 percent when adjusted for currency translation); this substantial decline was primarily due to delays affecting major projects
• Germany, Austria, Switzerland & Eastern Europe, along with Western Europe and the Middle East & Africa saw the biggest declines in order intake
• Second-quarter revenue 13.4 percent below prior-year level (fall of 10.8 percent when adjusted for currency translation); main drivers of the trend were the regions severely affected by COVID-19 such as Western Europe, the Middle East & Africa, and Asia Pacific
• Increase in share of revenue from service business (up from 34.3 percent in the prior-year quarter to 35.8 percent in the reporting quarter)
• Despite the marked decrease in revenue, reporting-quarter EBITDA before restructuring measures down just EUR 1.9 million to EUR 13.0 million, also due to cost-cutting triggered by COVID-19; corresponding EBITDA margin unchanged at 7.9 percent thanks to focus on high-margin products
14GEA Q2 2020
Report on Economic Position

Report on Risks and Opportunities
Aside from the issues explained below, there was no significant change in the overall assessment of risks and opportunities in the reporting period compared with the position presented in the 2019 Annual Report.
In 2018, GEA Group Holding France SAS (GGH France) sold its subsidiary GEA Westfalia Separator Production France SAS (GWSP France) to Altifort France SAS. GWSP France was renamed ALTIFORT INNOVATECH SASU (Altifort). Altifort has since become insolvent. Under a lawsuit brought before the civil court in Soissons by 91 Altifort employees in early July 2020, GGH France and GEA Westfalia Separator Group GmbH (GEA WS) are being sued for severance payments totaling EUR 10.4 million. In support of their claim, the applicants are relying mainly on the allegation that the sale of GWSP France was null and void, with the result that GGH France and GEA WS remain liable. The GEA companies being sued consider this reasoning to be unsound in all respects and are defending themselves against the action.
Risks arising from the consequences of the coronavirus pandemic (COVID-19) still exist. These include production outages due to temporary site closures by order of authorities, and declines in order intake and revenue. COVID-19 may also give rise to further special items for GEA’s account. The overall impact of the COVID-19 risks still cannot be reliably quantified. It is still considered possible that GEA’s business might be adversely affected to a degree over and above the effects already incorporated in the outlook for 2020, with moderate financial implications for the company.
All in all, from today’s perspective, there are no risks to the continued existence of GEA as a going concern. Sufficient provisions have been recognized for identified risks in line with the relevant requirements.
15GEA Q2 2020
Report on Risks and Opportunities

Report on Change in Forecast
GEA’s Report on Expected Developments takes into account relevant facts and events that were known at the date of preparation of these abridged interim consolidated financial statements and that could influence the future development of its business.
Economic environment in 2020
In their most recent publications, the main economic research institutions, i.e. the International Monetary Fund (IMF), the World Bank Group, and the United Nations (UN) again downgraded all the forecasts for the development of the global economy presented at the start of the year. They predict that global gross domestic product in 2020 will contract by 4.9 percent (IMF, down from minus 3.0 percent growth previously predicted in April 2020), by 5.2 percent (World Bank Group, down from 2.5 percent growth previously predicted), and by 3.2 percent (UN, down from 2.5 percent growth previously predicted). All three institutes cite the COVID-19 pandemic as the main reason for these negative developments. The forecasts at the start of the year could not have foreseen how severely economic activity would be affected by the crisis. It is also likely that the global economy will take longer to recover than previously expected.
Business outlook
The outlook for 2020 as published in the 2019 Annual Report continues to assume constant exchange rates and that demand in GEA’s sales markets will likely stagnate or even slow somewhat in 2020 due to continuing tensions afflicting the economy. Potential acquisitions and divestments in 2020 have not been factored into the outlook.
GEA confirms the outlook for 2020 as published in its 2019 Annual Report for the key indicator revenue. It is raising its forecast for both EBITDA before restructuring measures and ROCE slightly. With regard to the 2020 financial year, GEA now expects as follows:
Outlook* fiscal year 2020Expectations for 2020 (according
to Annual Report 2019) New outlook for 2020 2019
Revenue development slightly declining slightly declining EUR 4,880 million
EBITDA before restructuring measures EUR 430 – 480 million
at minimum a figure at the upper end of the range of
EUR 430 – 480 million EUR 479 million
ROCE 9.0 – 11.0% 12.0 – 14.0% 10.6%
*) For revenue, “slight” indicates a change of up to +/- 5%, while a change of more than +/- 5% is referred to as “significant.” For earnings figures, “slight” indicates a change of up to +/- 10%, while a change of more than +/- 10% is deemed “significant.” GEA defines changes in ROCE of up to +/- 3%p as “slight” and changes in excess of +/- 3 %p as “significant.”
The principal uncertainty in the outlook for 2020 remains the potential impact on GEA’s business activity and performance of the coronavirus (COVID-19) – still spreading at the time of publication.
16GEA Q2 2020
Report on Change in Forecast

GEA is expecting the following trends for the individual divisions compared with the group as a whole:
Revenue development* (EUR million)
Expectations for 2020 (according to Annual Report 2019) New outlook for 2020
2019(pro-forma)
Separation & Flow Technologies slightly declining slightly declining 1,238
Liquid & Powder Technologies slightly declining slightly declining 1,729
Food & Healthcare Technologies slightly declining significantly declining 963
Refrigeration Technologies slightly declining significantly declining 705
Farm Technologies slightly declining significantly declining 656
Consolidation – – –411
*) For revenue, “slight” indicates a change of up to +/- 5%, while a change of more than +/- 5% is referred to as “significant.”
EBITDA before restructuring measures* (EUR million)
Expectations for 2020 (according to Annual Report 2019) New outlook for 2020
2019(pro-forma)
Separation & Flow Technologies slightly declining slightly rising 247.1
Liquid & Powder Technologies significantly rising significantly rising 87.2
Food & Healthcare Technologies slightly declining significantly rising 66.8
Refrigeration Technologies slightly declining slightly declining 58.3
Farm Technologies slightly declining slightly rising 60.3
Others significantly declining significantly declining –39.0
Consolidation – – –1.5
*) For earnings figures, “slight” indicates a change of up to +/- 10%, while a change of more than +/- 10% is deemed “significant.
ROCE* (in %)
Expectations for 2020 (according to Annual Report 2019) New outlook for 2020
2019(pro-forma)
Separation & Flow Technologies slightly declining slightly rising 20.5
Liquid & Powder Technologies significantly rising significantly rising 14.4
Food & Healthcare Technologies slightly rising significantly rising 2.1
Refrigeration Technologies slightly declining slightly rising 13.4
Farm Technologies slightly declining slightly rising 10.2
*) GEA defines changes in ROCE of up to +/- 3%p as “slight” and changes in excess of +/- 3%p as “significant.” For capital employed, the 2019 pro-forma figures reflect the same allocation of proportionate goodwill as had resulted from the reallocation for FY 2020 pursuant to IAS 36.87. No ROCE is determined for the “Other” segment.
Düsseldorf, August 3, 2020
The Executive Board
Stefan Klebert Johannes Giloth Marcus A. Ketter
17GEA Q2 2020
Report on Change in Forecast

18GEA Q2 2020
Consolidated Balance Sheet 19
Consolidated Income Statement for the period April 1 – June 30, 2020 20
Consolidated Statement of Comprehensive Income for the period April 1 – June 30, 2020 21
Consolidated Income Statement for the period January 1 – June 30, 2020 22
Consolidated Statement of Comprehensive Income for the period January 1 – June 30, 2020 23
Consolidated Cash Flow Statement 24
Consolidated Statement of Changes in Equity 26
Notes to the condensed interim consolidated financial statements 27
1. Reporting Principles 27
2. Basis of consolidation 29
3. Balance sheet disclosures 30
4. Consolidated income statement disclosures 35
5. Statement of comprehensive income and consolidated statement of changes in equity disclosures 35
6. Segment Reporting 36
7. Related party transactions 40
Condensed Interim Consolidated Financial Statements

Consolidated Balance Sheetas of June 30, 2020
Assets(EUR thousand) 06/30/2020 12/31/2019
Changein %
Property, plant and equipment 685,795 718,524 –4.6
Investment property 2,176 2,201 –1.1
Goodwill 1,512,181 1,512,181 –
Other intangible assets 398,151 429,322 –7.3
Equity-accounted investments 5,169 5,672 –8.9
Other non-current financial assets 49,653 47,185 5.2
Deferred taxes 339,705 351,555 –3.4
Non-current assets 2,992,830 3,066,640 –2.4
Inventories 764,342 741,200 3.1
Contract assets 419,702 413,038 1.6
Trade receivables 774,440 915,078 –15.4
Income tax receivables 30,546 32,779 –6.8
Other current financial assets 190,502 187,123 1.8
Cash and cash equivalents 513,838 354,559 44.9
Assets held for sale 135 158 –14.6
Current assets 2,693,505 2,643,935 1.9
Total assets 5,686,335 5,710,575 –0.4
Equity and liabilities(EUR thousand) 06/30/2020 12/31/2019
Changein %
Subscribed capital 520,376 520,376 –
Capital reserve 1,217,861 1,217,861 –
Retained earnings 251,870 265,176 –5.0
Accumulated other comprehensive income 63,655 86,260 –26.2
Equity attributable to shareholders of GEA Group AG 2,053,762 2,089,673 –1.7
Non-controlling interests 422 421 0.2
Equity 2,054,184 2,090,094 –1.7
Non-current provisions 129,607 124,656 4.0
Non-current employee benefit obligations 872,165 866,200 0.7
Non-current financial liabilities 510,398 423,975 20.4
Non-current contract liabilities 306 272 12.5
Other non-current liabilities 19,366 21,438 –9.7
Deferred taxes 103,810 104,282 –0.5
Non-current liabilities 1,635,652 1,540,823 6.2
Current provisions 183,650 177,884 3.2
Current employee benefit obligations 205,633 235,214 –12.6
Current financial liabilities 81,579 90,040 –9.4
Trade payables 650,840 741,956 –12.3
Current contract liabilities 673,697 639,435 5.4
Income tax liabilities 32,515 34,005 –4.4
Other current liabilities 168,585 161,124 4.6
Current liabilities 1,996,499 2,079,658 –4.0
Total equity and liabilities 5,686,335 5,710,575 –0.4
19GEA Q2 2020
Consolidated Balance Sheet

Consolidated Income Statementfor the period April 1 – June 30, 2020
(EUR thousand)Q2
2020Q2
2019Change
in %
Revenue 1,164,529 1,247,291 –6.6
Cost of sales 808,017 894,403 –9.7
Gross profit 356,512 352,888 1.0
Selling expenses 136,643 157,044 –13.0
Research and development expenses 21,381 26,074 –18.0
General and administrative expenses 117,924 110,721 6.5
Other income 85,218 55,873 52.5
Other expenses 83,437 70,626 18.1
Net result from impairment and reversal of impairment on trade receivables and contract assets –11,129 –5,892 –88.9
Share of profit or loss of equity-accounted investments 161 250 –35.6
Other financial income 10 –142 –
Other financial expenses 234 279 –16.1
Earnings before interest and tax (EBIT) 71,153 38,233 86.1
Interest income 760 2,725 –72.1
Interest expense 5,527 6,385 –13.4
Profit before tax from continuing operations 66,386 34,573 92.0
Income taxes 21,166 7,952 > 100
Profit after tax from continuing operations 45,220 26,621 69.9
Profit or loss after tax from discontinued operations 11 –1,220 –
Profit for the period 45,231 25,401 78.1
of which attributable to shareholders of GEA Group AG 45,231 25,398 78.1
of which attributable to non-controlling interests – 3 –
(EUR)Q2
2020Q2
2019Change
in %
Basic and diluted earnings per share from continuing operations 0.25 0.15 69.9
Basic and diluted earnings per share from discontinued operations 0.00 –0.01 –
Basic and diluted earnings per share 0.25 0.14 78.1
Weighted average number of ordinary shares used to calculate basic and diluted earnings per share (million) 180.5 180.5 –
20GEA Q2 2020
Consolidated Income Statementfor the period April 1 – June 30, 2020

Consolidated Statement of Comprehensive Incomefor the period April 1 – June 30, 2020
(EUR thousand)Q2
2020Q2
2019Change
in %
Profit for the period 45,231 25,401 78.1
Items, that will not be reclassified to profit or loss in the future:
Actuarial gains/losses on pension and other post-employment benefit obligations –16,875 –24,292 30.5
Items, that will be reclassified subsequently to profit or loss when specific conditions are met:
Exchange differences on translating foreign operations –10,132 –18,547 45.4
thereof changes in unrealized gains and losses –10,132 –18,799 46.1
thereof realized gains and losses – 252 –
Result from fair value measurement of financial instruments –1,543 –297 < –100
thereof changes in unrealized gains and losses –2,104 –436 < –100
thereof tax effect 561 139 > 100
Reclassification in profit or loss from fair value measurement of financial instruments 1,543 297 > 100
thereof net result from impairment and reversal of impairment on financial assets 2,104 436 > 100
thereof tax effect –561 –139 < –100
Other comprehensive income –27,007 –42,839 37.0
Total comprehensive income 18,224 –17,438 –
of which attributable to GEA Group AG shareholders 18,224 –17,441 –
of which attributable to non-controlling interests – 3 –
21GEA Q2 2020
Consolidated Statement of Comprehensive Incomefor the period April 1 – June 30, 2020

Consolidated Income Statementfor the period January 1 – June 30, 2020
(EUR thousand)Q1-Q2
2020Q1-Q2
2019Change
in %
Revenue 2,258,371 2,304,604 –2.0
Cost of sales 1,568,428 1,653,490 –5.1
Gross profit 689,943 651,114 6.0
Selling expenses 279,025 300,458 –7.1
Research and development expenses 44,409 47,893 –7.3
General and administrative expenses 236,430 226,323 4.5
Other income 221,149 136,222 62.3
Other expenses 217,777 145,486 49.7
Net result from impairment and reversal of impairment on trade receivables and contract assets –13,739 –7,691 –78.6
Share of profit or loss of equity-accounted investments 70 637 –89.0
Other financial income 10 94 –89.4
Other financial expenses 407 279 45.9
Earnings before interest and tax (EBIT) 119,385 59,937 99.2
Interest income 1,484 13,435 –89.0
Interest expense 12,820 13,148 –2.5
Profit before tax from continuing operations 108,049 60,224 79.4
Income taxes 32,415 13,852 > 100
Profit after tax from continuing operations 75,634 46,372 63.1
Profit or loss after tax from discontinued operations –573 9,213 –
Profit for the period 75,061 55,585 35.0
thereof attributable to shareholders of GEA Group AG 75,061 55,586 35.0
thereof attributable to non-controlling interests – –1 –
(EUR)Q1-Q2
2020Q1-Q2
2019Change
in %
Basic and diluted earnings per share from continuing operations 0.42 0.26 63.1
Basic and diluted earnings per share from discontinued operations –0.00 0.05 –
Basic and diluted earnings per share 0.42 0.31 35.1
Weighted average number of ordinary shares used to calculate basic and diluted earnings per share (million) 180.5 180.5 –0.0
22GEA Q2 2020
Consolidated Income Statementfor the period January 1 – June 30, 2020
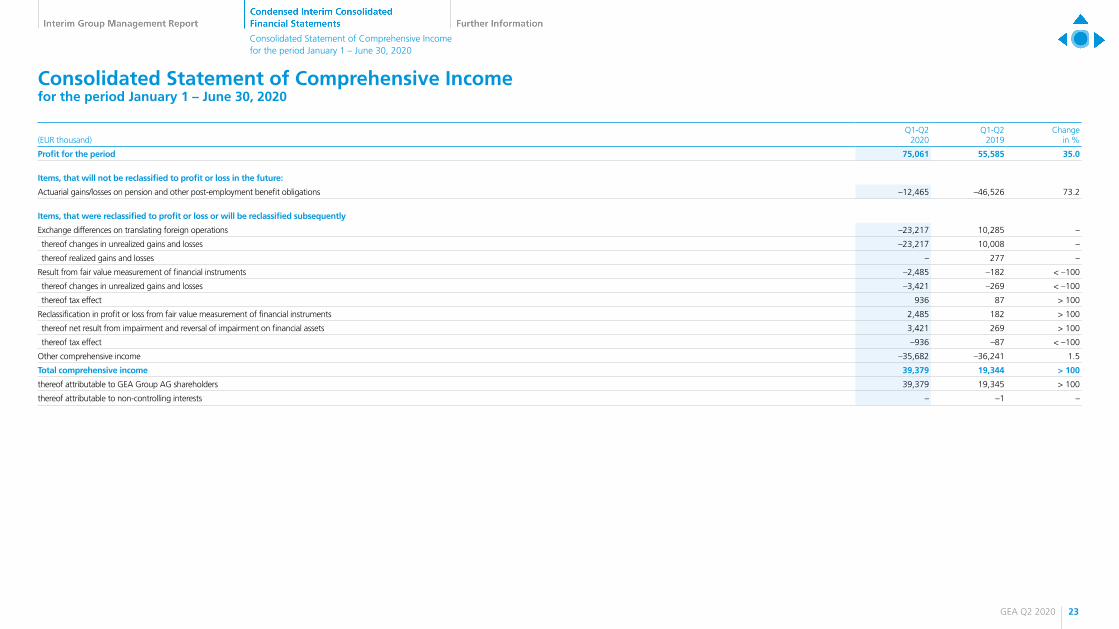
Consolidated Statement of Comprehensive Incomefor the period January 1 – June 30, 2020
(EUR thousand)Q1-Q2
2020Q1-Q2
2019Change
in %
Profit for the period 75,061 55,585 35.0
Items, that will not be reclassified to profit or loss in the future:
Actuarial gains/losses on pension and other post-employment benefit obligations –12,465 –46,526 73.2
Items, that were reclassified to profit or loss or will be reclassified subsequently
Exchange differences on translating foreign operations –23,217 10,285 –
thereof changes in unrealized gains and losses –23,217 10,008 –
thereof realized gains and losses – 277 –
Result from fair value measurement of financial instruments –2,485 –182 < –100
thereof changes in unrealized gains and losses –3,421 –269 < –100
thereof tax effect 936 87 > 100
Reclassification in profit or loss from fair value measurement of financial instruments 2,485 182 > 100
thereof net result from impairment and reversal of impairment on financial assets 3,421 269 > 100
thereof tax effect –936 –87 < –100
Other comprehensive income –35,682 –36,241 1.5
Total comprehensive income 39,379 19,344 > 100
thereof attributable to GEA Group AG shareholders 39,379 19,345 > 100
thereof attributable to non-controlling interests – –1 –
23GEA Q2 2020
Consolidated Statement of Comprehensive Incomefor the period January 1 – June 30, 2020

(EUR thousand)Q2
2020Q2
2019
Profit for the period 45,231 25,401
plus income taxes 21,166 7,952
minus profit or loss after tax from discontinued operations –11 1,220
Profit before tax from continuing operations 66,386 34,573
Net interest income 4,767 3,660
Earnings before interest and tax (EBIT) 71,153 38,233
Depreciation, amortization, impairment losses, and reversal of impairment losses on non-current assets 61,036 62,847
Other non-cash income and expenses 8,517 8,193
Employee benefit obligations from defined benefit pension plans –10,825 –10,502
Change in provisions and other employee benefit obligations 14,893 15,059
Losses and disposal of non-current assets –736 272
Change in inventories including unbilled construction contracts* –947 –83,143
Change in trade receivables 61,183 –6,972
Change in trade payables 4,182 10,138
Change in other operating assets and liabilities –230 6,291
Tax payments –10,803 –8,595
Cash flow from operating activities of continued operations 197,423 31,821
Cash flow from operating activities of discontinued operations –125 –962
Cash flow from operating activities 197,298 30,859
Proceeds from disposal of non-current assets 1,070 38
Payments to acquire property, plant and equipment, and intangible assets –17,548 –23,434
Payments from non-current financial assets 37 6
Interest income 354 115
Dividend income 599 68
Cash flow from investing activities of continued operations –15,488 –23,207
(EUR thousand)Q2
2020Q2
2019
Cash flow from investing activities of discontinued operations 1,000 –7,933
Cash flow from investing activities –14,488 –31,140
Dividend payments –75,807 –153,418
Payments from lease liabilities –16,164 –13,914
Proceeds from finance loans 141,169 177,434
Repayments of finance loans –43,503 –1,100
Interest payments –2,205 –3,505
Cash flow from financing activities of continued operations 3,490 5,497
Cash flow from financing activities of discontinued operations –14 –
Cash flow from financing activities 3,476 5,497
Effect of exchange rate changes on cash and cash equivalents –2,532 –1,490
Change in unrestricted cash and cash equivalents 183,754 3,726
Unrestricted cash and cash equivalents at beginning of period 328,767 226,858
Unrestricted cash and cash equivalents at end of period 512,521 230,584
Restricted cash and cash equivalents 1,317 63
Cash and cash equivalents total 513,838 230,647
*) Including advanced payments received.
Consolidated Cash Flow Statement for the period April 1 – June 30, 2020
24GEA Q2 2020
Consolidated Cash Flow Statement

(EUR thousand)Q1-Q2
2020Q1-Q2
2019
Profit for the period 75,061 55,585
plus income taxes 32,415 13,852
minus profit or loss after tax from discontinued operations 573 –9,213
Profit before tax from continuing operations 108,049 60,224
Net interest income 11,336 –287
Earnings before interest and tax (EBIT) 119,385 59,937
Depreciation, amortization, impairment losses, and reversal of impairment losses on non-current assets 109,659 110,409
Other non-cash income and expenses 15,072 10,923
Employee benefit obligations from defined benefit pension plans –21,649 –21,005
Change in provisions and other employee benefit obligations –16,851 17,959
Losses and disposal of non-current assets –840 –220
Change in inventories including unbilled construction contracts* –11,678 –138,252
Change in trade receivables 110,771 59,470
Change in trade payables –83,259 –84,020
Change in other operating assets and liabilities 16,888 4,426
Tax payments –16,824 –26,780
Cash flow from operating activities of continued operations 220,674 –7,153
Cash flow from operating activities of discontinued operations –1,326 –1,790
Cash flow from operating activities 219,348 –8,943
Proceeds from disposal of non-current assets 1,949 979
Payments to acquire property, plant and equipment, and intangible assets –32,919 –45,995
Payments from non-current financial assets – –4,245
Interest income 728 679
Dividend income 599 199
Cash flow from investing activities of continued operations –29,643 –48,383
(EUR thousand)Q1-Q2
2020Q1-Q2
2019
Cash flow from investing activities of discontinued operations 1,000 –8,163
Cash flow from investing activities –28,643 –56,546
Dividend payments –75,807 –153,418
Payments from lease liabilities –31,456 –30,658
Proceeds from finance loans 141,169 237,509
Repayments of finance loans –50,000 –1,100
Interest payments –8,078 –7,196
Cash flow from financing activities of continued operations –24,172 45,137
Cash flow from financing activities of discontinued operations –21 –6
Cash flow from financing activities –24,193 45,131
Effect of exchange rate changes on cash and cash equivalents –8,170 3,467
Change in unrestricted cash and cash equivalents 158,342 –16,891
Unrestricted cash and cash equivalents at beginning of period 354,179 247,475
Unrestricted cash and cash equivalents at end of period 512,521 230,584
Restricted cash and cash equivalents 1,317 63
Cash and cash equivalents total 513,838 230,647
*) Including advanced payments received.
Consolidated Cash Flow Statement for the period January 1 – June 30, 2020
25GEA Q2 2020
Consolidated Cash Flow Statement

Consolidated Statement of Changes in Equity as of June 30, 2020
Accumulated other comprehensive income
(EUR thousand) Subscribed capital Capital reserves Retained earningsTranslation of
foreign operations
Equity attributable to shareholders of
GEA Group AG Non-controlling interests Total
Balance at Jan. 1, 2019 (180,492,172 shares) 520,376 1,217,861 647,950 62,681 2,448,868 568 2,449,436
Profit for the period – – 55,586 – 55,586 –1 55,585
Other comprehensive income – – –46,526 10,285 –36,241 – –36,241
Total comprehensive income – – 9,060 10,285 19,345 –1 19,344
Dividend payment by GEA Group AG – – –153,418 – –153,418 – –153,418
Adjustment hyperinflation* – – 594 – 594 – 594
Changes in combined Group – – 1,946 – 1,946 – 1,946
Change in other non-controlling interests – – – – – 4 4
Balance at June 30, 2019 (180,492,172 shares) 520,376 1,217,861 506,132 72,966 2,317,335 571 2,317,906
Balance at Jan. 1, 2020 (180,492,172 shares) 520,376 1,217,861 265,176 86,260 2,089,673 421 2,090,094
Profit for the period – – 75,061 – 75,061 – 75,061
Other comprehensive income – – –12,465 –23,217 –35,682 – –35,682
Total comprehensive income – – 62,596 –23,217 39,379 – 39,379
Dividend payment by GEA Group AG – – –75,807 – –75,807 – –75,807
Adjustment hyperinflation* – – –95 612 517 – 517
Changes in combined Group – – – – – – –
Change in other non-controlling interests – – – – – 1 1
Balance at June 30, 2020 (180,492,172 shares) 520,376 1,217,861 251,870 63,655 2,053,762 422 2,054,184
*) Effect of accounting for hyperinflation in Argentina according to IAS 29.
26GEA Q2 2020
Consolidated Statement of Changes in Equity

Notes to the condensed interim consolidated financial statements
1. Reporting Principles
1.1 Basis of presentationThe condensed interim consolidated financial statements of GEA Group Aktiengesellschaft, Peter-Müller-Strasse 12, 40468 Düsseldorf/Germany (entry HRB 65691 in the commercial register of the Local Court of Düsseldorf) and the interim financial statements of the subsidiaries included in the condensed interim consolidated financial statements were prepared in accordance with the International Financial Reporting Standards (IFRS) and related Interpretations issued by the International Accounting Standards Board (IASB), as adopted by the EU for interim financial reporting in accordance with Regulation (EC) No. 1606/2002 of the European Parliament and the Council on the application of international accounting standards. In accordance with IAS 34, the condensed interim consolidated financial statements do not contain all the information and disclosures required by the IFRS for full-year consolidated financial statements.
The condensed interim consolidated financial statements and Group management report on the second quarter have been reviewed by an auditor. The Executive Board released them for publication on August 3, 2020.
The condensed interim consolidated financial statements were prepared in euros (EUR). All amounts, including the comparative figures, are presented in thousands of euros (EUR thousand), except for the segment information. All amounts have been rounded using standard rounding rules. Adding together individual amounts may therefore result in a difference in the order of EUR 1 thousand in some instances.
With the exception of the pronouncements applicable for the first time as of January 1, 2020, the accounting policies applied to these condensed interim consolidated financial statements are the same as those applied as of December 31, 2019, and are described in detail on pages 179 to 200 of the Annual Report 2019, which contains GEA’s IFRS consolidated financial statements.
1.2 Accounting pronouncements applied for the first timeThe initial application of the following accounting standards had no material effect on the condensed interim consolidated financial statements.
Amendments to references to the conceptual framework in IFRS standards – issued by the IASB in March 2018The revised conceptual framework contains several new sections. One section each on measurement, presentation and disclosures and on the disposal of assets or liabilities has been added. In addition, the sections on defining terms such as “asset” and “liability” and reporting assets and liabilities in financial statements have also been revised. The terms “prudence”, “management responsibility”, “measurement uncertainty” and “economic perspective” were also redefined in the interest of clarity.
Amendments to IFRS 3 “Business Combinations” – issued by the IASB in October 2018The amendments to IFRS 3 concern the definition of a business and address the difficulties that arise when an entity determines whether it has acquired a business or a group of assets. Essentially, the amendments state that to be considered a business, an acquired set of activities and assets must include, at a minimum, an input and a substantive process that together significantly contribute to the ability to create results (outputs). The amendments also narrow the definitions of a business and of outputs by focusing on goods and services provided to customers and by removing the reference to an ability to reduce costs. Finally, an optional concentration test has been added that permits a simplified assessment of whether an acquired set of activities and assets is not a business.
27GEA Q2 2020
Notes to the condensed interim consolidated financial statements

Amendments to IAS 1 “Presentation of Financial Statements” and to IAS 8 “Accounting Policies, Changes in Accounting Estimates and Errors” concerning the definition of materiality – issued by the IASB in October 2018The changes aim to narrow the definition of “material” and to align the definition used in the conceptual framework and the standards themselves, while making it easier for preparers to assess materiality without the existing regulations being changed to a substantial degree. The revised definition refers to the materiality of items of information. A shift in emphasis has therefore taken place, away from omissions and misstatements towards information.
Interest Rate Benchmark Reform (amendments to IFRS 9, IAS 39 and IFRS 7) – issued by the IASB in September 2019The expedients provided by the amendments allow companies to continue using hedge accounting during the period of uncertainty that exists prior to the replacement of an existing benchmark, e.g. an IBOR or “Interbank Offered Rate”. A company must apply the regulations to all hedging relationships affected by reform of the reference interest rate and make additional disclosures about these relationships in the notes.
1.3 Accounting pronouncements not yet appliedThe following accounting pronouncements were published by June 30, 2020 but not yet subject to mandatory application. GEA does not expect the implementation of the revised accounting pronouncements to materially affect its financial reporting.
Amendments to IFRS 10 and IAS 28 – Sale or Contribution of Assets between an Investor and its Associate or Joint Venture – issued by the IASB in September 2014The content of this amendment, which has not yet been applied, is described in the Annual Report 2019 (page 182).
Amendments to IAS 1 “Presentation of Financial Statements” – issued by the IASB in January 2020The amendments to IAS 1 serve to clarify the criteria by which a liability is classified as either current or non-current. The amendments assert that a liability should be classified as non-current if an entity has substantial rights, in place at the reporting date, to defer settlement of the liability for at least twelve months after the reporting period. If the exercising of these rights is subject to certain conditions being met, the entity must have done so by the reporting date; otherwise the liability is to be classified as current.
On July 15, 2020 the IASB decided to postpone the date of first-time application from January 1, 2022 to financial years beginning on or after January 1, 2023. Earlier application is permitted, provided that the amendment is endorsed by the EU beforehand.
Amendments to IFRS 3 “Business Combinations” – issued by the IASB in May 2020The amendments to IFRS 3 relate to a reference in IFRS 3 to the Conceptual Framework. However, this does not result in any change in the accounting for business combinations.
The amendments are to be applied – subject to their endorsement by the EU – for financial years beginning on or after January 1, 2022. Earlier application is permitted.
Amendments to IFRS 16 “Leases” – COVID-19-Related Rent Concessions – issued by the IASB in May 2020Under certain conditions, the amendments provide for the possibility for lessees to waive an assessment as to whether rental concessions granted in connection with the COVID-19 pandemic are a modification of a contract. If the exemption is used, the lessee will treat the rental concessions as if it were not a contract modification.
Subject to endorsement by the EU, the amendments are to be applied for financial years beginning on or after June 1, 2020. Earlier application would have been permissible.
Amendments to IAS 16 “Property, plant and equipment” – Proceeds before Intended Use – issued by the IASB in May 2020The amendments to IAS 16 clarify that proceeds from sales of products manufactured while an item of property, plant and equipment is being brought into the condition necessary for it to be capable of operating in the manner intended by management may not be offset against the cost of that item of property, plant and equipment. Such sales proceeds should be recognized in profit or loss, as should the related costs.
Subject to endorsement by the EU, the amendments are to be applied for financial years beginning on or after January 1, 2022. Earlier application is permitted.
28GEA Q2 2020
Notes to the condensed interim consolidated financial statements

Amendments to IAS 37 “Provisions, contingent liabilities and contingent assets” – Onerous Contracts – Cost of Fulfilling a Contract – issued by the IASB in May 2020The amendments to IAS 37 are clarifications regarding the costs that an entity should consider in determining whether a contract will be loss-making. Accordingly, all costs directly related to the contract should be included in the costs incurred in fulfilling a contract. In addition to directly attributable costs, this includes costs that would not have been incurred without the conclusion of the contract.
Subject to endorsement by EU, the amendments are to be applied for financial years beginning on or after January 1, 2022. Earlier application is permitted.
Improvements to IFRSs 2018-2020 cycle – amendments under the IASB’s annual improvements project – issued by the IASB in May 2020The improvements result from the IASB’s annual improvement process, which is designed to make minor amendments to standards and interpretations. They comprise minor amendments to four standards in all (IFRS 1, IFRS 9, IFRS 16 and IAS 41).
Subject to endorsement by EU, the amendments are to be applied for financial years beginning on or after January 1, 2022. Earlier application is permitted.
1.4 Interim financial reporting principlesThese condensed interim consolidated financial statements present a true and fair view of the Company’s net assets, financial position and results of operations in the reporting period.
The preparation of the condensed interim consolidated financial statements requires management to make certain estimates and assumptions that may affect the Company’s assets, liabilities, provisions, deferred tax assets and liabilities, as well as its income and expenses. Although management makes such estimates and assumptions carefully and in good faith, actual amounts may differ from the estimates used in the condensed interim consolidated financial statements.
Factors that may cause amounts to fall below expectations include a deterioration in the global economic situation, movements in exchange rates and interest rates, as well as material litigation and changes in environmental or other legislation. Errors in internal operating processes, the loss of key customers, and rising borrowing costs may also adversely affect the Group’s future performance.
The effects of COVID-19 on accounting at GEA can be seen in the following sections (Credit risk, Intangible assets and Tax rate).
2. Basis of consolidation
The consolidated group changed as follows in the first half of 2020:
Numberof companies
Consolidated Group as of December 31, 2019 197
German companies (including GEA Group AG) 29
Foreign companies 168
Initial consolidation 1
Merger –1
Consolidated Group as of June 30, 2020 197
German companies (including GEA Group AG) 29
Foreign companies 168
A total of 45 subsidiaries (as of December 31, 2019: 44) were not consolidated given their effect on the Group’s net assets, financial position and operational results is immaterial – even when viewed in the aggregate.
29GEA Q2 2020
Notes to the condensed interim consolidated financial statements
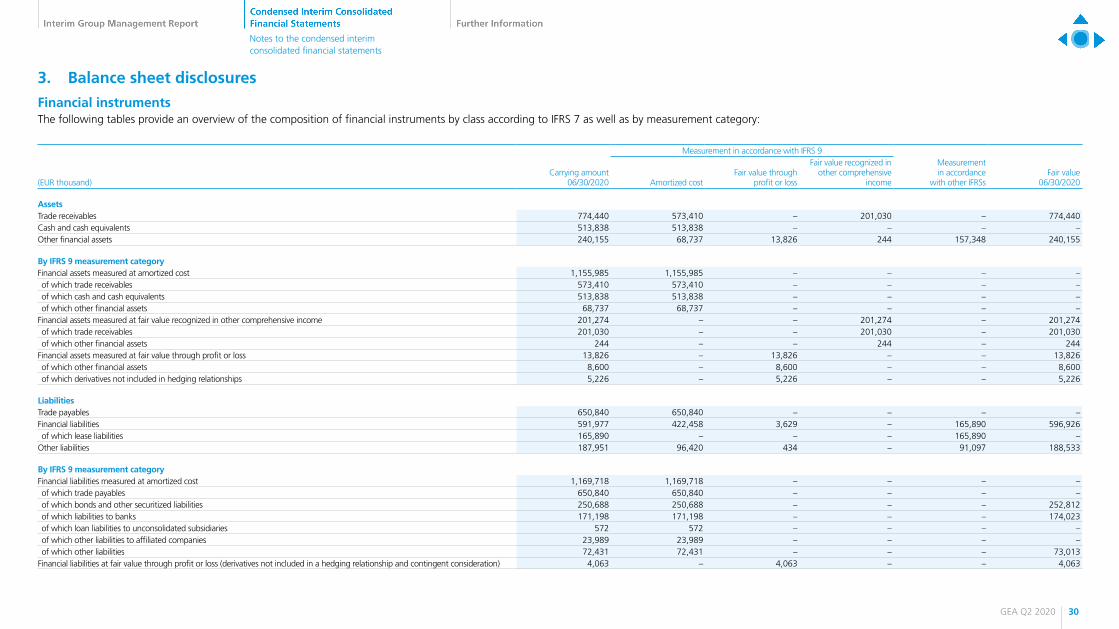
3. Balance sheet disclosures
Financial instrumentsThe following tables provide an overview of the composition of financial instruments by class according to IFRS 7 as well as by measurement category:
Measurement in accordance with IFRS 9
(EUR thousand)Carrying amount
06/30/2020 Amortized costFair value through
profit or loss
Fair value recognized in other comprehensive
income
Measurement in accordance
with other IFRSsFair value
06/30/2020
AssetsTrade receivables 774,440 573,410 – 201,030 – 774,440Cash and cash equivalents 513,838 513,838 – – – –Other financial assets 240,155 68,737 13,826 244 157,348 240,155
By IFRS 9 measurement categoryFinancial assets measured at amortized cost 1,155,985 1,155,985 – – – –of which trade receivables 573,410 573,410 – – – –of which cash and cash equivalents 513,838 513,838 – – – –of which other financial assets 68,737 68,737 – – – –
Financial assets measured at fair value recognized in other comprehensive income 201,274 – – 201,274 – 201,274of which trade receivables 201,030 – – 201,030 – 201,030of which other financial assets 244 – – 244 – 244
Financial assets measured at fair value through profit or loss 13,826 – 13,826 – – 13,826of which other financial assets 8,600 – 8,600 – – 8,600of which derivatives not included in hedging relationships 5,226 – 5,226 – – 5,226
LiabilitiesTrade payables 650,840 650,840 – – – –Financial liabilities 591,977 422,458 3,629 – 165,890 596,926of which lease liabilities 165,890 – – – 165,890 –
Other liabilities 187,951 96,420 434 – 91,097 188,533
By IFRS 9 measurement categoryFinancial liabilities measured at amortized cost 1,169,718 1,169,718 – – – –of which trade payables 650,840 650,840 – – – –of which bonds and other securitized liabilities 250,688 250,688 – – – 252,812of which liabilities to banks 171,198 171,198 – – – 174,023of which loan liabilities to unconsolidated subsidiaries 572 572 – – – –of which other liabilities to affiliated companies 23,989 23,989 – – – –of which other liabilities 72,431 72,431 – – – 73,013
Financial liabilities at fair value through profit or loss (derivatives not included in a hedging relationship and contingent consideration) 4,063 – 4,063 – – 4,063
30GEA Q2 2020
Notes to the condensed interim consolidated financial statements

Measurement in accordance with IFRS 9
(EUR thousand)Carrying amount
12/31/2019 Amortized costFair value through
profit or loss
Fair value recognized in other comprehensive
income
Measurement in accordance
with other IFRSsFair value
12/31/2019
AssetsTrade receivables 915,078 802,612 – 112,466 – 915,078Cash and cash equivalents 354,559 354,559 – – – –Other financial assets 234,308 83,218 12,819 244 138,027 234,308
By IFRS 9 measurement categoryFinancial assets measured at amortized cost 1,240,389 1,240,389 – – – –of which trade receivables 802,612 802,612 – – – –of which cash and cash equivalents 354,559 354,559 – – – –of which other financial assets 83,218 83,218 – – – –
Financial assets measured at fair value recognized in other comprehensive income 112,710 – – 112,710 – 112,710of which trade receivables 112,466 – – 112,466 – 112,466of which other financial assets 244 – – 244 – 244
Financial assets measured at fair value through profit or loss 12,819 – 12,819 – – 12,819of which other financial assets 8,963 – 8,963 – – 8,963of which derivatives not included in hedging relationships 3,856 – 3,856 – – 3,856
LiabilitiesTrade payables 741,956 741,956 – – – –Financial liabilities 514,015 326,348 5,513 – 182,154 522,264of which liabilities under finance leases 182,154 – – – 182,154 –Other liabilities 182,562 98,810 434 – 83,318 190,281
By IFRS 9 measurement categoryFinancial liabilities measured at amortized cost 1,167,114 1,167,114 – – – –of which trade payables 741,956 741,956 – – – –of which bonds and other securitized liabilities 251,796 251,796 – – – 259,229of which liabilities to banks 74,343 74,343 – – – 75,159of which loan liabilities to unconsolidated subsidiaries 209 209 – – – –of which other liabilities to affiliated companies 31,195 31,195 – – – –of which other liabilities 67,615 67,615 – – – 75,334
Financial liabilities at fair value through profit or loss (derivatives not included in a hedging relationship and contingent consideration) 5,947 – 5,947 – – 5,947
31GEA Q2 2020
Notes to the condensed interim consolidated financial statements
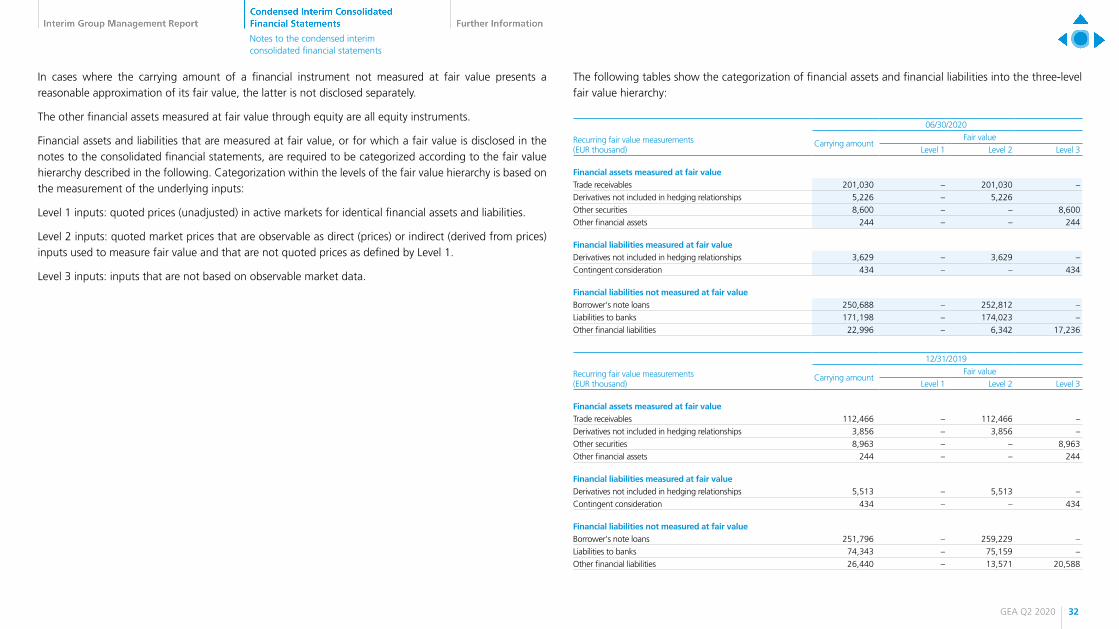
In cases where the carrying amount of a financial instrument not measured at fair value presents a reasonable approximation of its fair value, the latter is not disclosed separately.
The other financial assets measured at fair value through equity are all equity instruments.
Financial assets and liabilities that are measured at fair value, or for which a fair value is disclosed in the notes to the consolidated financial statements, are required to be categorized according to the fair value hierarchy described in the following. Categorization within the levels of the fair value hierarchy is based on the measurement of the underlying inputs:
Level 1 inputs: quoted prices (unadjusted) in active markets for identical financial assets and liabilities.
Level 2 inputs: quoted market prices that are observable as direct (prices) or indirect (derived from prices) inputs used to measure fair value and that are not quoted prices as defined by Level 1.
Level 3 inputs: inputs that are not based on observable market data.
The following tables show the categorization of financial assets and financial liabilities into the three-level fair value hierarchy:
Recurring fair value measurements(EUR thousand)
06/30/2020
Carrying amountFair value
Level 1 Level 2 Level 3
Financial assets measured at fair valueTrade receivables 201,030 – 201,030 –Derivatives not included in hedging relationships 5,226 – 5,226Other securities 8,600 – – 8,600Other financial assets 244 – – 244
Financial liabilities measured at fair valueDerivatives not included in hedging relationships 3,629 – 3,629 –Contingent consideration 434 – – 434
Financial liabilities not measured at fair valueBorrower‘s note loans 250,688 – 252,812 –Liabilities to banks 171,198 – 174,023 –Other financial liabilities 22,996 – 6,342 17,236
Recurring fair value measurements(EUR thousand)
12/31/2019
Carrying amountFair value
Level 1 Level 2 Level 3
Financial assets measured at fair valueTrade receivables 112,466 – 112,466 –Derivatives not included in hedging relationships 3,856 – 3,856 –Other securities 8,963 – – 8,963Other financial assets 244 – – 244
Financial liabilities measured at fair valueDerivatives not included in hedging relationships 5,513 – 5,513 –Contingent consideration 434 – – 434
Financial liabilities not measured at fair valueBorrower‘s note loans 251,796 – 259,229 –Liabilities to banks 74,343 – 75,159 –Other financial liabilities 26,440 – 13,571 20,588
32GEA Q2 2020
Notes to the condensed interim consolidated financial statements

There were no transfers into or out of the levels of the fair value hierarchy in fiscal year 2019.
The fair values of trade receivables and trade payables, cash and cash equivalents, and other financial receivables essentially correspond to the carrying amounts; this is due to the predominantly short remaining maturities.
In the case of certain trade receivables measured at fair value due to existing factoring arrangements, that fair value is calculated based on yield curves observable in the market. These are categorized within Level 2 of the fair value hierarchy.
The fair value of derivatives is determined using quoted exchange rates and yield curves observable in the market. Accordingly, these are categorized within Level 2 of the fair value hierarchy.
A receivable relating to the former raw material activities of Metallgesellschaft AG was allocated to Level 3 financial instruments; its fair value is determined by means of a present value calculation based on the debtor’s payment plan. As the debtor operates a copper mine, its payment plan is influenced by the price of copper. Gains and losses from the subsequent measurement of the receivable are carried in profit or loss from discontinued operations. The following table shows the changes in fair value over the first half year of 2020:
(EUR thousand)
Fair value 12/31/2019 8,963
Redemption –418
Interest income 481
Currency translation –426
Fair value 06/30/2020 8,600
As of June 30, 2020, the key, non-observable input factors of the above-mentioned receivable consisted of expected annual cash inflows of between EUR 218 thousand and EUR 2,377 thousand and an average, risk adjusted discount rate of 3.3 percent.
For the fair value of the receivable, reasonably possible changes at June 30, 2020 to one of the significant unobservable inputs, holding other inputs consistent, would have the following effects:
06/30/2020
Profit or loss
(EUR thousand) Increase Decrease
Expected cash flows (10% movement) 860 –860
Risk-adjusted discount rate (movement 100 basis points) –210 219
Other equity investments are also categorized within Level 3 of the hierarchy. The fair value is determined by using inputs that are not based on observable market data. No significant changes in the fair value were identified in the first half-year.
Financial liabilities resulting from contingent purchase price considerations are assigned to Level 3. The fair value of these liabilities is determined by means of present value calculations, which take into account various inputs that are not observable in the market, and that are based particularly on corporate planning, as specified in the respective purchase price clauses. No significant changes in the fair value were identified in the first half-year.
The fair value of borrower’s note loans and liabilities to banks is measured based on the yield curve and take into account credit spreads. Therefore, they are categorized within Level 2 of the fair value hierarchy. The interest deferred as of the reporting date is included in the fair values.
Included in other financial liabilities is a contractual obligation undertaken in the context of a company acquisition. The fair value of this instrument is measured using contractual cashflows based on the yield curve, considering credit spreads. Accordingly, these are categorized within Level 2 of the fair value hierarchy.
Additionally, certain other financial liabilities resulting from the sale of GEA’s former Heat Exchangers Segment are categorized within Level 3 of the fair value hierarchy, since their fair value is measured based on the present value of future cash outflows expected and on contractual obligations associated with the sale.
33GEA Q2 2020
Notes to the condensed interim consolidated financial statements

Credit riskIn the first half of 2020, GEA adjusted its loss rates applied as part of the so-called “Simplified Approach” for trade receivables and contract assets, not credit impaired. This is mainly due to an adjustment of scaling factors that take forward-looking information into account and are based on forecasts of gross domestic product (GDP). Due to COVID-19, these forecasts were significantly adjusted in the first half of 2020. As of June 30, 2020, the weighted average scaling factor was 4.9. As of December 31, 2019, this factor was 1.1.
Further information on credit risks can be found in the Annual Report 2019 p. 201ff.
The following table shows the expected credit losses of trade receivables and contract, not credit impaired, as of June 30, 2020:
(EUR thousand)Gross carrying
amountWeighted average
loss rate Range of loss rates Loss allowance
Not overdue 957,622 0.56% 0.03% - 2.20% 5,369
of which contract assets 421,989 0.54% 0.03% - 2.20% 2,287
of which trade receivables 535,633 0.58% 0.03% - 2.20% 3,082
Overdue (trade receivables) 194,009 1.76% 0.08% - 8.52% 3,420
Total 1,151,631 8,789
The following table shows the expected credit losses of trade receivables and contract, not credit impaired, as of June 30, 2019:
(EUR thousand)Gross carrying
amountWeighted average
loss rate Range of loss rates Loss allowance
Not overdue 1,011,975 0.07% 0.02% - 0.16% 694
of which contract assets 407,928 0.03% 0.02% - 0.16% 130
of which trade receivables 604,047 0.09% 0.02% - 0.16% 564
Overdue (trade receivables) 257,289 0.27% 0.07% - 0.46% 692
Total 1,269,264 1,386
In the first half of 2020, the result of impairment losses and reversals of impairment losses on trade receivables and contract assets, not credit impaired, amounted to EUR –7,524 thousand (previous year EUR –261 thousand).
In second quarter of 2020, the result of impairment losses and reversals of impairment losses on trade receivables and contract assets, not credit impaired, amounted to EUR –7,290 thousand (previous year EUR –27 thousand).
Intangible assetsDue to the coronavirus pandemic, individual assets were tested for impairment. The basis for this was the updated earnings planning. The tests performed did not reveal any indication that any of the tested assets might be impaired.
Goodwill allocated to the former business areas Equipment and Solutions was reallocated to the new operating segments in form of divisions based on the relative values as of the reorganization date. Corresponding to internal control, the operating segment Pavan was considered as an independent cash-generating unit. In contrast to the above-mentioned approach, historical values from the original Pavan acquisition were used as the benchmark for the reallocation of goodwill of Pavan (see Annual Report 2019, p. 190).
A qualitative assessment was made to check if there is any indication for impairment of goodwill. The review also gave no indication the goodwill might be impaired.
Liabilities to banksIn April 2020, GEA utilized a further cash credit line with a volume of EUR 100,000 thousand with the European Investment Bank. The loan is scheduled for repayment in 2027.
34GEA Q2 2020
Notes to the condensed interim consolidated financial statements

4. Consolidated income statement disclosures
Income tax expenseThe income taxes disclosed for continuing operations in the interim reporting period were calculated using an estimated tax rate of 30.0 percent (previous year: 23.0 percent). The increase in the tax rate compared to the previous year is primarily due to changes in the regional distribution of consolidated net income and in the planned tax effects of non-creditable withholding taxes.
5. Statement of comprehensive income and consolidated statement of changes in equity disclosures
DividendsIn the first half of 2020, GEA made an advance payment for dividends on ordinary shares in the amount of EUR 75,807 thousand. This is the legal maximum amount of EUR 0.42 per share based on the last two relevant annual financial statements.
Translation of foreign operationsThe change in exchange differences for translating foreign operations amounted to EUR –23.217 thousand in the first half of 2020 (previous year: EUR 10.285 thousand) and resulted primarily from the rise of the euro against the Brazilian real and the Russian ruble.
Actuarial gains and losses on pension and other post-employment benefit obligationsThe actuarial losses on pension and other post-employment benefit obligations of EUR 12,465 thousand (previous year: EUR 46,526 thousand) (after taxes) recognized in other comprehensive income in the first six months of 2020 were the result of a drop in the discount rates to be used for measuring pension provisions (Germany: fell 10 basis points since December 31, 2019; UK and U.S.A: fell of 40 basis points, on average, since December 31, 2019).
In the period under review, the procedure to determine the discount rates was refined: Due to a changeover at Bloomberg, the BCLASS system, rather than the Bloomberg Industry Classification System, is now used as the basis for determining the portfolio of high-quality corporate bonds decisive for determining discount rates. This results in a more refined bond selection, which leads to a EUR 886 thousand lower defined benefit obligation and correspondingly lower actuarial losses from pension and other post-employment benefit obligations as of June 30, 2020.
35GEA Q2 2020
Notes to the condensed interim consolidated financial statements

6. Segment Reporting
As reported in the Annual Report 2019, GEA’s new group structure became effective on January 1, 2020. In this new structure, the group is divided into five divisions with up to six business units each, which comprise similar technologies.
The Group’s operating segments were reorganized accordingly during the reporting period. Organizing the divisions into segments corresponds to the internal control systems as well as to the reporting to Board and Supervisory Board, except for the segment Food & Healthcare Technologies which consists of the same-named operating segment and the operating segment Pavan. The aggregation of these operating segments is based on similar characteristics regarding economic features, nature of products and production processes, customer groups, sales methods as well as regulatory environment. The figures for the previous year were adapted to the new reporting structure.
GEA’s business activities are divided into the following five divisions:
Segment Activities
Separation & Flow Technologies Activities concerned with the manufacture of process-related components, notably separators, decanters, valves, pumps, and homogenizers
Liquid & Powder Technologies Design and development of process solutions for the dairy, brewing, food, and chemical industries; technological focus on liquid processing, concentration, industrial drying, powder processing and handling and emission control
Food & Healthcare Technologies Range of competencies for the pharmaceutical and food industries, e.g. customer solutions for food processing and packaging; solutions for the baking industry; extrusion and milling equipment; and process technology for the pharmaceutical industry
Farm Technologies Development of integrated customer solutions – ranging from automatic milking and feeding systems, manure management systems and barn equipment as well as digital herd management solutions – for profitable dairy and livestock farming
Refrigeration Technologies Development, manufacturing and installation of innovative key components and technical solutions such as reciprocating and screw compressors and valves
A Global Corporate Center (GCC) continues to bundle the central management and administrative functions and performs the essential management functions for the entire group. The functions bundled in the Global Corporate Center do not constitute independent operating segments. The operating expenses of the Global Corporate Center are allocated, where possible, to the divisions.
36GEA Q2 2020
Notes to the condensed interim consolidated financial statements

(EUR million)Separation & Flow
TechnologiesLiquid & Powder
TechnologiesFood & Healthcare
Technologies Farm TechnologiesRefrigeration Technologies Others Consolidation GEA
Q2 2020Order intake 287.6 334.8 192.1 155.9 138.4 – –74.7 1,034.1External revenue 271.3 398.4 194.1 142.2 158.6 – – 1,164.5Intersegment revenue 41.5 24.3 42.9 2.4 5.6 – –116.6 –Total revenue 312.8 422.6 236.9 144.6 164.2 – –116.6 1,164.5EBITDA before restructuring measures 63.7 37.4 21.6 14.9 13.0 –9.7 –0.5 140.4as % of revenue 20.4 8.9 9.1 10.3 7.9 – – 12.1
EBITDA 61.9 37.3 21.5 16.6 13.6 –18.3 –0.5 132.2EBIT before restructuring measures 53.4 28.3 8.8 8.0 8.0 –12.6 –0.5 93.4as % of revenue 17.1 6.7 3.7 5.5 4.8 – – 8.0
EBIT 50.3 28.2 8.7 –2.9 8.5 –21.2 –0.5 71.2as % of revenue 16.1 6.7 3.7 –2.0 5.2 – – 6.1
Additions to property, plant and equipment and intangible assets 6.8 4.0 7.6 5.0 1.3 1.4 – 26.1Depreciation and amortization 11.6 9.1 12.8 19.5 5.1 2.9 – 61.0
Q2 2019Order intake 323.4 365.3 222.2 157.8 197.7 – –119.7 1,146.8External revenue 260.2 427.6 223.0 158.6 177.9 – – 1,247.3Intersegment revenue 40.4 17.7 28.5 1.5 11.6 – –99.7 –Total revenue 300.7 445.2 251.6 160.1 189.5 – –99.7 1,247.3EBITDA before restructuring measures 45.9 24.9 12.1 13.2 14.9 –1.0 1.3 111.2as % of revenue 15.3 5.6 4.8 8.2 7.9 – – 8.9
EBITDA 44.9 23.3 12.1 12.8 11.2 –4.5 1.3 101.1EBIT before restructuring measures 36.2 14.5 –0.8 1.3 9.7 –4.7 1.3 57.5as % of revenue 12.0 3.3 –0.3 0.8 5.1 – – 4.6
EBIT 34.8 5.2 –0.8 0.9 5.1 –8.2 1.3 38.2as % of revenue 11.6 1.2 –0.3 0.6 2.7 – – 3.1
Additions to property, plant and equipment and intangible assets 8.6 –4.8 5.0 4.9 1.9 3.9 – 19.5Depreciation and amortization 10.0 18.1 13.0 11.9 6.2 3.7 – 62.8
The recognition and measurement policies for assets and liabilities of the divisions, and hence also for working capital, are the same as those used in the group and described in the accounting policies section of the Annual Report 2019.
37GEA Q2 2020
Notes to the condensed interim consolidated financial statements

(EUR million)Separation & Flow
TechnologiesLiquid & Powder
TechnologiesFood & Healthcare
Technologies Farm TechnologiesRefrigeration Technologies Others Consolidation GEA
Q1 - Q2 2020Order intake 619.9 900.5 414.5 333.3 322.8 – –180.2 2,410.8External revenue 509.9 763.9 381.0 282.8 320.7 – – 2,258.4Intersegment revenue 81.2 44.2 68.4 3.2 13.3 – –210.3 –Total revenue 591.2 808.1 449.5 286.0 334.0 – –210.3 2,258.4EBITDA before restructuring measures 123.5 45.6 38.1 25.8 30.4 –17.4 –0.5 245.4as % of revenue 20.9 5.6 8.5 9.0 9.1 – – 10.9
EBITDA 121.6 45.4 37.8 27.3 30.9 –33.5 –0.5 229.0EBIT before restructuring measures 103.1 26.6 12.4 12.1 20.0 –24.1 –0.5 149.8as % of revenue 17.4 3.3 2.8 4.2 6.0 – – 6.6
EBIT 99.9 26.4 12.2 1.0 20.5 –40.2 –0.5 119.4as % of revenue 16.9 3.3 2.7 0.4 6.1 – – 5.3
ROCE in %1 23.1 46.1 3.9 14.6 17.8 – – 14.8Segment assets 2,502.3 1,865.6 1,257.8 659.8 806.7 3,288.3 –4,694.0 5,686.3Segment liabilities 1,122.6 1,284.4 938.0 352.0 506.0 2,340.2 –2,911.1 3,632.2Net working capital (reporting date)2 330.8 –56.8 142.7 133.7 98.4 –12.8 –5.8 630.2Additions to property, plant and equipment and intangible assets 16.3 8.4 12.6 8.6 12.1 3.1 – 61.0Depreciation and amortization 21.7 19.0 25.6 26.3 10.4 6.7 – 109.7
Q1 - Q2 2019Order intake 637.0 775.0 460.1 320.2 352.1 – –211.3 2,333.1External revenue 495.3 776.2 415.9 300.5 316.7 – – 2,304.6Intersegment revenue 79.9 31.0 58.6 2.9 22.2 – –194.6 –Total revenue 575.2 807.2 474.5 303.4 338.9 – –194.6 2,304.6EBITDA before restructuring measures 103.6 17.7 31.5 19.3 22.0 –7.8 –0.4 185.9as % of revenue 18.0 2.2 6.6 6.3 6.5 – – 8.1
EBITDA 102.1 15.6 31.5 18.6 18.3 –15.4 –0.4 170.3EBIT before restructuring measures 84.5 –2.4 5.7 0.9 11.5 –15.1 –0.4 84.5as % of revenue 14.7 –0.3 1.2 0.3 3.4 – – 3.7
EBIT 82.6 –12.2 5.7 0.2 6.9 –22.8 –0.4 59.9as % of revenue 14.4 –1.5 1.2 0.1 2.0 – – 2.6
ROCE in %1 21.7 11.3 1.3 10.3 13.3 – – 10.5Segment assets 2,789.3 1,957.2 1,613.2 704.0 836.6 3,250.4 –5,183.2 5,967.4Segment liabilities 1,178.1 1,307.5 1,036.8 374.6 528.8 2,581.7 –3,357.9 3,649.5Net working capital (reporting date)2 378.0 117.3 134.4 151.4 117.8 8.9 –1.5 906.4Additions to property, plant and equipment and intangible assets 46.5 67.3 32.2 34.6 41.7 19.1 – 241.5Depreciation and amortization 19.5 27.9 25.8 18.4 11.5 7.3 – 110.4
1) ROCE = EBIT before restructuring measures/capital employed; EBIT before restructuring measures and capital employed both calculated as the average for the last 4 quarters and before effects relating to goodwill from the acquisition of the former GEA AG by the former Metallgesellschaft AG in 1999; capital employed = non-current assets less interest-bearing non-current assets + working capital + non-interest-bearing assets, liabilities and provisions less assets and liabilties in connection with income taxes.2) Working capital = inventories + trade receivables + contract assets - trade payables - contract liabilities - provisions for anticipated losses (POC).
38GEA Q2 2020
Notes to the condensed interim consolidated financial statements

Consolidation comprises the intersegment revenue from transactions between operating segments. Intersegment revenue is calculated using standard market prices.
(EUR million)
Separation & Flow
Technologies
Liquid & Powder
Technologies
Food & Healthcare
TechnologiesFarm
TechnologiesRefrigeration Technologies Consolidation GEA
Q2 2020
Revenue by revenue element
From construction contracts 37.9 294.8 116.7 – 62.8 –37.4 474.8
From sale of goods and services 148.8 34.7 63.0 76.9 42.6 –57.3 308.7
From service agreements 126.1 93.2 57.2 67.7 58.8 –21.9 381.1
Total 312.8 422.6 236.9 144.6 164.2 –116.6 1,164.5
(EUR million)
Separation & Flow
Technologies
Liquid & Powder
Technologies
Food & Healthcare
TechnologiesFarm
TechnologiesRefrigeration Technologies Consolidation GEA
Q2 2019
Revenue by revenue element
From construction contracts 41.0 312.9 135.0 – 78.9 –35.7 532.2
From sale of goods and services 135.5 32.4 57.1 92.0 45.6 –41.5 321.0
From service agreements 124.2 99.9 59.5 68.1 64.9 –22.5 394.1
Total 300.7 445.2 251.6 160.1 189.5 –99.7 1,247.3
(EUR million)
Separation & Flow
Technologies
Liquid & Powder
Technologies
Food & Healthcare
TechnologiesFarm
TechnologiesRefrigeration Technologies Consolidation GEA
Q1 - Q2 2020
Revenue by revenue element
From construction contracts 66.9 567.1 214.1 – 129.0 –68.4 908.8
From sale of goods and services 277.0 62.1 119.8 146.1 86.4 –98.0 593.4
From service agreements 247.3 178.9 115.5 140.0 118.6 –44.0 756.2
Total 591.2 808.1 449.5 286.0 334.0 –210.3 2,258.4
(EUR million)
Separation & Flow
Technologies
Liquid & Powder
Technologies
Food & Healthcare
TechnologiesFarm
TechnologiesRefrigeration Technologies Consolidation GEA
Q1 - Q2 2019
Revenue by revenue element
From construction contracts 69.7 572.9 253.5 – 133.7 –68.8 961.1
From sale of goods and services 262.6 63.0 107.3 168.4 84.9 –82.6 603.5
From service agreements 242.9 171.3 113.7 135.0 120.4 –43.3 740.0
Total 575.2 807.2 474.5 303.4 338.9 –194.6 2,304.6
39GEA Q2 2020
Notes to the condensed interim consolidated financial statements

External revenue(EUR million)
Q22020
Q22019
Changein %
Q1-Q22020
Q1-Q22019
Changein %
Germany 96.7 106.1 –8.8 192.0 211.4 –9.2
Asia Pacific 270.5 295.4 –8.4 495.7 523.0 –5.2
ACH & Eastern Europe 154.9 139.7 10.8 305.1 260.3 17.2
Western Europe, Middle East & Africa 188.2 210.7 –10.7 368.4 379.3 –2.9
North- and Central Europe 142.8 178.3 –19.9 291.8 341.2 –14.5
Latin America 75.8 92.7 –18.2 154.4 171.8 –10.2
North America 235.5 224.4 5.0 451.0 417.6 8.0
GEA 1,164.5 1,247.3 –6.6 2,258.4 2,304.6 –2.0
Since the start of the 2019 financial year – in line with its internal control system – GEA’s management has been using the key indicator of “earnings before interest, taxes, depreciation and amortization” (EBITDA) before restructuring expenses in addition to revenue as a measure of its operating performance. “EBITDA before restructuring” is an indicator that has been adjusted for earnings effects attributable to restructuring measures outlined in terms of content and scope by the CEO, presented to the Chairman of the Supervisory Board, and – where required by the Board’s rules of procedure – approved and finalized by the Supervisory Board. Only measures requiring funding in excess of EUR 2 million are considered.
In accordance with the above definition, adjustments for restructuring expenses in the first half-year 2020 totaled EUR 30.4 million (previous year: EUR 24.6 million), with EBITDA accounting for EUR 16.4 million (previous year: EUR 15.5 million) of this amount. In this context, the term restructuring expenses relates to expenditures directly connected to restructuring measures (e.g. severance payments) that would therefore qualify as restructuring expenses under IAS 37 as well. The restructuring measures defined by the Board also extend to impairment losses on assets, as well as to other expenses arising indirectly from the restructuring measures.
The restructuring expenses incurred up to June 30, 2020 can be allocated to the divisions as follows:
(EUR million)
Separation & Flow
Technologies
Liquid & Powder
Technologies
Food & Healthcare
TechnologiesFarm
TechnologiesRefrigeration Technologies Other GEA
Restructuring according to IAS 37 – –0.1 –0.8 –2.3 –0.6 0.3 –3.5
Impairments and reversals of impairments 1.4 – 0.7 12.4 – – 14.4
Gains and losses from the disposal of selected parts of operations – – – – – – –
Others 1.8 0.3 0.3 1.0 0.1 15.8 19.4
Total 3.2 0.2 0.2 11.1 –0.5 16.1 30.4
In accordance with the internal management system, the profitability of the five divisions is measured using earnings before interest, taxes, depreciation and amortization (EBITDA), along with earnings before interest and taxes (EBIT). These indicators correspond to the values shown in the income statement.
A reconciliation of EBIT to profit or loss before income tax is included in the income statement.
7. Related party transactions
There were no material related party transactions with an effect on the net assets, financial position or results of operations.
40GEA Q2 2020
Notes to the condensed interim consolidated financial statements

41GEA Q2 2020
Responsibility Statement 42
Review Report 43Financial Calendar/Imprint 44
Further Information

Responsibility Statement
To the best of our knowledge, and in accordance with the applicable reporting principles for interim financial reporting, the interim consolidated financial statements give a true and fair view of the assets, liabilities, financial position, and profit or loss of the group, and the interim management report of the group includes a fair review of the development and performance of the business and the position of the group, together with a description of the material opportunities and risks associated with the expected development of the group for the remaining months of the fiscal year.
Düsseldorf, August 3, 2020
The Executive Board
Stefan Klebert Johannes Giloth Marcus A. Ketter
42GEA Q2 2020
Responsibility Statement
Review ReportTo GEA Group Aktiengesellschaft, Düsseldorf We have reviewed the condensed interim consolidated financial statements of the GEA AG Aktiengesellschaft, Düsseldorf – comprising Income Statement, Statement of Comprehensive Income, Balance Sheet, Statement of Changes in Equity, Cash Flow Statement and notes – together with the interim group management report of the GEA Group Aktiengesellschaft, Düsseldorf for the period from January 1 to June 30, 2020 that are part of the semi annual according to § 115 WpHG [“Wertpapierhandelsgesetz“: “German Securities Trading Act”]. The preparation of the condensed interim consolidated financial statements in accordance with International Accounting Standard IAS 34 “Interim Financial Reporting” as adopted by the EU, and of the interim group management report in accordance with the requirements of the WpHG applicable to interim group management reports, is the responsibility of the Company’s management. Our responsibility is to issue a report on the condensed interim consolidated financial statements and on the interim group management report based on our review.
We performed our review of the condensed interim consolidated financial statements and the interim group management report in accordance with the German generally accepted standards for the review of financial statements promulgated by the Institut der Wirtschaftsprüfer (IDW). Those standards require that we plan and perform the review so that we can preclude through critical evaluation, with a certain level of assurance, that the condensed interim consolidated financial statements have not been prepared, in material respects, in accordance with IAS 34, “Interim Financial Reporting” as adopted by the EU, and that the interim group management report has not been prepared, in material respects, in accordance with the requirements of the WpHG applicable to interim group management reports. A review is limited primarily to inquiries of company employees and analytical assessments and therefore does not provide the assuranceattainable in a financial statement audit. Since, in accordance with our engagement, we have not performed a financial statement audit, we cannot issue an auditor’s report.
Based on our review, no matters have come to our attention that cause us to presume that the condensed interim consolidated financial statements have not been prepared, in material respects, in accordance with IAS 34, “Interim Financial Reporting” as adopted by the EU, or that the interim group management report has not been prepared, in material re-spects, in accordance with the requirements of the WpHG applicable to interim group management reports.
Düsseldorf, August 3, 2020
KPMG AGWirtschaftsprüfungsgesellschaft
Lurweg JessenWirtschaftsprüfer Wirtschaftsprüfer[German Public Auditor] [German Public Auditor]
43GEA Q2 2020
Review Report

Financial Calendar
Annual Shareholders‘ Meeting
for 2019
Quarterly Statement
for the period up to September 30, 2020
2020
NOVEMBER
52020
NOVEMBER
26
American Depository Receipts (ADR)
CUSIP .........................361592108Symbol .......................GEAGYSponsor ......................Deutsche Bank Trust
Company AmericasADR-Level ...................1Ratio ..........................1:1
Investor Relations
Phone +49 211 9136-1081Fax +49 211 9136-31081Mail [email protected]
GEA Stock: Key data
WKN ..........................660 200ISIN ..........................DE0006602006Reuters code ...............G1AG.DEBloomberg code ...........G1A.GRXetra ..........................G1A.DE
Communication, Marketing & Branding
Phone +49 211 9136-1492Fax +49 211 9136-31492Mail [email protected]
Imprint
Published by:GEA Group AktiengesellschaftPeter-Müller-Straße 1240468 Düsseldorf, Germanygea.com
Layout:Christiane Luhmannluhmann & friends
Picture credits:Gorodenkoff – stock.adobe.com, page 3
This report includes forward-looking statements on GEA Group Aktien gesellschaft, its subsidiaries and associates, and on the economic and political conditions that may influence the business performance of GEA. All these statements are based on assumptions made by the Executive Board using information available to it at the time. Should these assumptions prove to be wholly or partly incorrect, or should further risks arise, actual business performance may differ from that expected. The Executive Board therefore cannot assume any liability for the statements made.
Note regarding the rounding of figuresDue to the commercial rounding of figures and percentages, small deviations may occur.
Note to the half-yearly financial reportThis half-yearly financial report is the English translation of the original German version. In case of deviations between these two, the German version prevails.
44GEA Q2 2020
Financial Calendar/Imprint

GEA
/Q2/
EN/0
090
gea.com
GEA is one of the largest suppliers for food processing technology and of related industries. The global group specializes in machinery, plants, as well
as process technology and components. GEA provides sustainable solutions for sophisticated production processes in diverse end-user markets and
offers a comprehensive service portfolio.
The company is listed on the German MDAX (G1A, WKN 660 200), the STOXX® Europe 600 Index as well as the DAX 50 ESG Index and selected MSCI
Global Sustainability Indexes. With an ”A-“ rating, GEA is among the leading group in the climate benchmark Carbon Disclosure Project.
We live our values.Excellence • Passion • Integrity • Responsibility • GEA-versity
GEA Group Aktiengesellschaft
Peter-Müller-Straße 12
40468 Düsseldorf
Germany
Phone: +49 211 9136-0