financial report harvard college
TRANSCRIPT

FISCAL YEAR 2004–2005
FINANCIAL REPORTto the board of overseers of
HARVARD COLLEGE

2 Letter from the President
4 Letter to the Board of Overseers
8 Analysis of financial results
16 Review of endowment results
18 Review of capital activities
23 Annual report of the Harvard
Management Company
27 Financial statements
55 Supplemental information
con
cept
,des
ign
and
cove
rph
oto
gra
ph:s
amet
zbl
acks
ton
eas
soci
ates
,bo
sto
nph
oto
gra
phy:
tom
kate
s;pa
ge7:
ken
td
ayto
n,i
nse
t:jo
hn
chas
e,h
arva
rdu
niv
ersi
tyn
ews
off
ice;
pag
e55
:co
ope
r,ro
bert
son
&pa
rtn
ers,
llp;
back
cove
r:ju
stin
ide,
har
vard
un
iver
sity
new
so
ffic
e

renovations at schlesinger library
The Radcliffe Institute for Advanced Studies celebrated the sixtieth
anniversary of the Arthur and Elizabeth Schlesinger Library on the
History of Women in America. During this landmark year, renovations
took place at the library, restoring and updating the building while
preserving its holdings for future research. The Schlesinger Library
collects manuscripts, books, and other materials essential for under-
standing women’s lives and activities, including the papers of many
famous women such as Dorothy West and Amelia Earhart, the
records of groups like the National Organization for Women, a
world-renowned collection of over 15,000 culinary books, and the
Radcliffe College Archives.
2 Harvard University
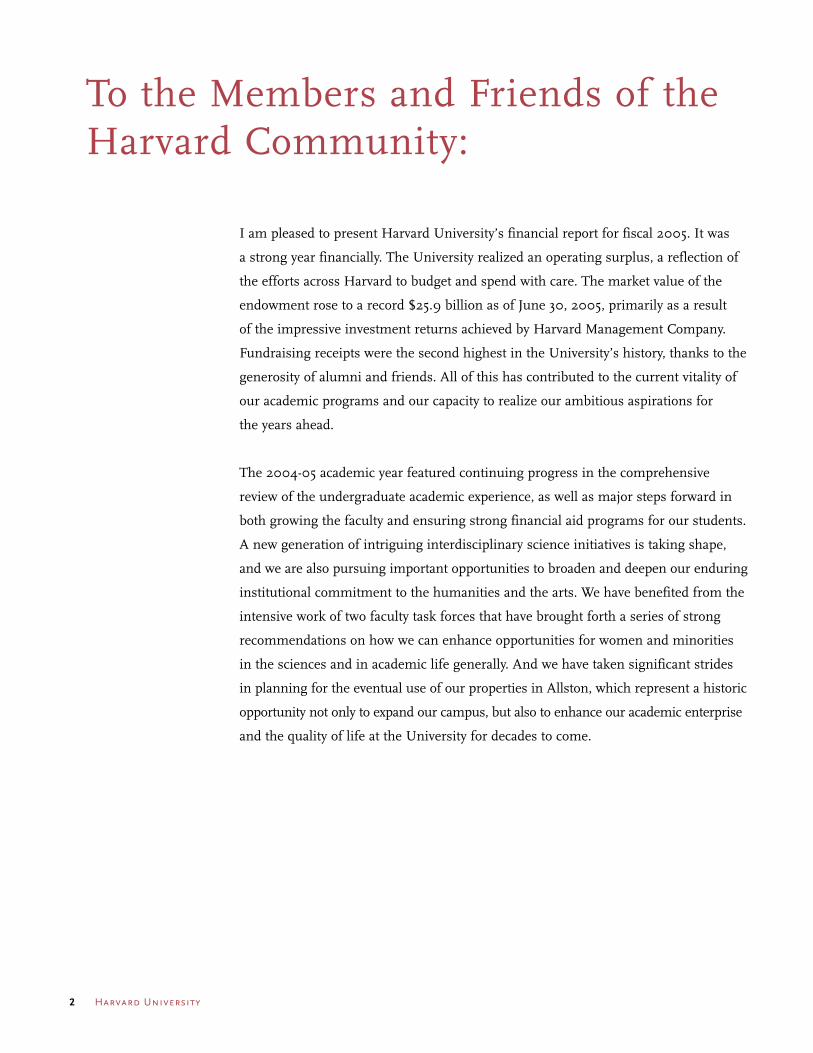
I am pleased to present Harvard University’s financial report for fiscal 2005. It was
a strong year financially. The University realized an operating surplus, a reflection of
the efforts across Harvard to budget and spend with care. The market value of the
endowment rose to a record $25.9 billion as of June 30, 2005, primarily as a result
of the impressive investment returns achieved by Harvard Management Company.
Fundraising receipts were the second highest in the University’s history, thanks to the
generosity of alumni and friends. All of this has contributed to the current vitality of
our academic programs and our capacity to realize our ambitious aspirations for
the years ahead.
The 2004-05 academic year featured continuing progress in the comprehensive
review of the undergraduate academic experience, as well as major steps forward in
both growing the faculty and ensuring strong financial aid programs for our students.
A new generation of intriguing interdisciplinary science initiatives is taking shape,
and we are also pursuing important opportunities to broaden and deepen our enduring
institutional commitment to the humanities and the arts. We have benefited from the
intensive work of two faculty task forces that have brought forth a series of strong
recommendations on how we can enhance opportunities for women and minorities
in the sciences and in academic life generally. And we have taken significant strides
in planning for the eventual use of our properties in Allston, which represent a historic
opportunity not only to expand our campus, but also to enhance our academic enterprise
and the quality of life at the University for decades to come.
To the Members and Friends of the Harvard Community:

Harvard University 3
In short, thanks to the hard work and support of people across the Harvard community,
we have the benefit of strong foundations on which to build. I look forward to a
productive year ahead, one full of energy and collaborative effort, as we work together
to secure the future excellence of an institution whose traditions and innovations
continue to engage and inspire us all.
Sincerely,
Lawrence H. Summers
President
October 11, 2005

Fiscal 2005 has been a financially successful year for Harvard University. The University’s
third straight year of outstanding positive investment results boosted the endowment
to a record $25.9 billion. This endowment growth will help support several important
priorities in the coming years, including the development of an Allston campus, exciting
new interdisciplinary scientific endeavors, continued expansion of the faculty, and
increased support of students through financial aid and graduate student housing.
The past year has also been one of change. Jack Meyer, President and ceo of Harvard
Management Company (hmc) since 1990, and several of his colleagues departed on
October 1, 2005 to establish their own hedge fund. Mohamed A. El-Erian, currently
a Managing Director at Pacific Investment Management Company (pimco), has been
appointed President and Chief Executive Officer of hmc, commencing early in 2006.
Peter Nadosy, a member of the hmc Board and former President of Morgan Stanley
Asset Management, is serving as Interim Chief Investment Officer until Mr. El-Erian
assumes his post.
Financial highlights
v The University ended the year with an operating surplus of $44 million on $2.8
billion of expenses. This surplus included a $9 million unrestricted surplus and
a $35 million surplus in restricted funds (funds whose use is limited to the purposes
designated by the donors or sponsors).
v Harvard Management Company achieved a 19.2% total return for fiscal 2005, resulting
in a five-year annualized return of 9.5%. The total market value of the endowment
rose from $22.6 billion to $25.9 billion, and total net assets grew from $26.9 billion
to $30.6 billion.
To the Board of Overseers of Harvard College:
4 Harvard University

Harvard University 5
v Total revenue rose 8%, due to substantial increases in current use gifts and other
income, as well as steady growth in other revenue categories.
v Student income, net of scholarships applied to tuition and fees, rose 5%, while total
scholarships and other student awards grew 8%, outpacing tuition growth for the
seventh consecutive year. This relatively higher percentage increase underscores the
continued focus on financial aid as one of the University’s highest priorities.
v Sponsored funding for research and training increased 6%, primarily due to growth
in federal funding of 8%. The increase in federal sponsored research support included
14% greater funding from the nih as well as additional research support from other
federal sponsors, including other Department of Health and Human Services agencies
and the Department of Defense.
v Thanks to the generosity of alumni and friends, gifts totaled an impressive $639 million,
an 8% increase over fiscal 2004. Endowment gifts totaled $286 million, current use
gifts were $188 million, and grants for non-federal research as well as gifts for loans,
facilities, and life income funds comprised the remaining $165 million.
v Endowment income distributed for operations increased 6% to $855 million, the
result of a 4% increase in the distribution rate as well as distributions on additions to
the endowment. The fiscal 2005 spending rate was 4.5%, within the targeted range of
4.5% to 5.0%.
v Endowment income distributed for operations remained the University’s largest source
of income in fiscal 2005, representing 31% of total operating income compared with 21%
ten years ago. This growth reflects both the generous support of our alumni and friends
as well as the continued strong performance of the Harvard Management Company.
v Total expenses increased 8%, primarily driven by significant growth in space and
occupancy costs as new buildings came on line and energy costs increased nationwide.

6 Harvard University
Ann E. Berman
Vice President for Finance
October 11, 2005
James F. Rothenberg
Treasurer
v The University spent $1.4 billion on compensation, an increase of 5% over fiscal
2004. Compensation growth included an increase in total salary and wage costs of
6%, and of 3% in benefits expenses after several years of more significant increases.
v Space and occupancy expenses increased 11%, primarily due to higher maintenance,
interest, and utilities costs. In addition, the University spent a total of $470 million
on physical renewal, new facilities, and acquisitions. Significant expenditures were
incurred for construction of the Center for Government and International Studies,
the Biology Research Infrastructure building, the Northwest Science Building, the
Oxford Street garage, and the Laboratory for Integrated Science and Engineering, as
well as for renovations at Baker Library, Aldrich Hall, Dumbarton Oaks, and the
Biological Laboratories.
v Other expenses increased 12%, largely due to higher purchased services costs. These
services were primarily associated with Allston development planning as well as with
certain legal settlement costs.
Looking forward, we must understand that realizing the University’s objectives will
require continued fiscal prudence and significant new resources. The past few years
of financial strength will enable the University to actively pursue its goals. Faculty,
staff, alumni, friends, and students each hold an important role in helping to build
on this financial success and sustain the University’s future.

research in genomics and molecular biologylaboratories
Of the female undergraduates who matriculate at Harvard College,
over 50% declare an interest in concentrating in the sciences; only
42% of this group actually does so. Two task forces recently issued
reports on women in the sciences and faculty diversity. The University
has committed $50 million over the next ten years towards imple-
menting the recommendations of the task forces, including ways of
encouraging female students in their pursuits of scientific study
and research.

F I N A N C I A L R E S U LT S
8 Harvard University
The University realized unrestricted and restrictedoperating surpluses in fiscal 2005, the first time inthree years that both the unrestricted and restrictedoperating results were positive. The unrestrictedoperating surplus was $8.7 million, reboundingfrom an $11.7 million unrestricted operating deficitin fiscal 2004. The restricted operating surplus was
$34.9 million, compared with $48.5 million in fiscal2004. At year-end, the University’s total assets were$55.5 billion, and total liabilities were $25.0 billion.Net assets of $30.6 billion included $25.9 billion ofendowment funds.
Harvard University’s many achievements over the past fiscal year extendedfrom the areas of teaching and research to administration and public service.The highlights that follow provide a sampling of the accomplishments ofeach School and of the University as a whole.
Analysis of financial results
Fiscal 2005 was a financially successful year for the University, with an operating surplus,
strong endowment growth, and total net assets of $30.6 billion.
O V E R V I E W
This section of the report analyzes revenue andexpenses for fiscal 2005.
Revenue The University’s operating revenuetotaled $2.8 billion in fiscal 2005, an 8% increaseover the prior year. Most revenue categories experi-enced steady growth, with substantial increases ingifts for current use and other income.

Analysis of financial results Harvard University 9
In the past year, the
Faculty of Arts and
Sciences has been
intensely focused on
creating a new under-
graduate curriculum.
The Faculty will soon
review the products of
two years’ work and
approve a new range of
curricular requirements.
Some innovation in this
area has already
occurred: increasing
numbers of students
are engaged in study,
research, or work
abroad; a new founda-
tional life sciences
course began this fall;
and the freshman semi-
nar program continues
to expand.
New building for the
sciences is underway,
with the Laboratory for
Integrated Science
and Engineering, the
Northwest Science
Building, and the
Biology Research
Infrastructure building
all under construction.
Beyond the sciences,
the Center for Govern-
ment and International
Studies opened in
September 2005.
The faculty now
numbers 700, with
approximately 100 new
faculty members added
in the past ten years.
This growth will fuel the
new undergraduate
curriculum and fortify
both fas’s and the
University’s interdisci-
plinary efforts in the
sciences.
Faculty, staff, and
student diversity
continue to be areas of
major effort, intensified
by the reports of the
University’s task forces
on diversity and women
in the sciences. Student
financial aid, both for
graduate students and
undergraduates,
remains an important
challenge and continu-
ing investment.
Faculty of Arts and Sciences
F I S C A L Y E A R 2005 O P E R AT I N G R E V E N U E
14%
21%
5%
7%
31%
22%
Endowment incomedistributed for operations
Income from other investments
Student income
Sponsored research support
Other income
Current use gifts
Student income Student income increased 5%from fiscal 2004, totaling $586.5 million in fiscal2005. Revenue from undergraduate tuition rose 5%,consistent with the change in the College’s tuitionrate. Graduate tuition revenue increased 7%, reflecting6% average graduate tuition rate growth and addi-tional graduate students in certain programs. Totalstudent room and board income grew 6%, primarilydue to a 4% increase in the undergraduate roomand board rate as well as additional housing of graduate students at One Western Avenue, 29Garden Street, and Peabody Terrace. Continuingand executive education revenue rose 7%, largely
a result of increased enrollment in programs at the Business School and the Graduate School ofEducation (gse), as well as new programs at theKennedy School of Government (ksg) and the MedicalSchool (hms). Scholarships applied to student incomecontinued to outpace tuition growth, with a 9%increase in fiscal 2005 following a 10% increase in fiscal 2004.
Sponsored research support Support forsponsored research grew 6% in fiscal 2005 to$626.4 million, primarily due to an 8% increase infederal support. Total non-federal sponsored supportremained flat in fiscal 2005. The University received82% of its sponsored research funding from thefederal government, 12% from foundations, and 6%from other sources, including corporations, foreign,state, and local governments, as well as researchinstitutes.
Various agencies of the Department ofHealth and Human Services, including mostnotably the National Institutes of Health, funded$401.2 million or 79% of the University’s federalsponsored research in fiscal 2005, growing from$367.9 million or 78% of federal funding in fiscal2004. The National Science Foundation supplied7% of fiscal 2005 federal support, with the remainderawarded by other federal entities including theDepartments of Defense, Energy, and Education, as well as the National Aeronautics and Space

hbs completed an $85
million renovation of
Baker Library, restoring
its historic reading
room, lobby, and north
facade, creating a south-
facing entrance that
further opens the cam-
pus to Boston’s Allston-
Brighton neighborhood,
and designing spaces to
bring together faculty,
students, and other
academics. Renovations
to Aldrich Hall were also
completed. Technology
plays a central role in
both buildings, providing
students and faculty with
state-of-the-art research
tools as well as enhanced
classroom interactivity.
The MBA Class of
2007 comprises 914
students, 33% of whom
are international, 22%
minorities, and 38%
women.
The India Research
Center opened in Mum-
bai, joining centers in
Asia, Latin America,
Europe, and California.
These centers facilitate
faculty research and
foster ties with academic
and business communi-
ties around the world.
10 Harvard University Analysis of financial results
Administration. Approximately 95% of fiscal 2005federal sponsored funding was received by threeSchools: hms, 40%; the School of Public Health(hsph), 30%; and the Faculty of Arts and Sciences(fas), 25%.
In fiscal 2005, hsph received the largestaward ever granted to one of the University’s indi-vidual principal investigators: $94.4 million for thecare and treatment of people living with hiv-aids inNigeria, Tanzania, and Botswana. This five-year federal award, of which $17.4 million was receivedin fiscal 2005, is funded by the President’s EmergingPlan for aids Relief (pepfar). The project teamaspires to train Nigerian, Tanzanian, and Botswanan
doctors, nurses, and other health care providers totreat 75,000 patients over the next five years, withthe ultimate goal of empowering these Africancountries with capacity for self-sustenance after theproject’s end.
The indirect costs of sponsored programsinclude facilities operations and maintenance,depreciation, debt service, library use, and adminis-trative expenses. These costs are allocated as overheadto the direct costs of sponsored projects, enablingtheir partial recovery from sponsors. Other Universityresources finance the unrecovered overhead costsassociated with sponsored programs.
In December 2004,
the new hsdm Research
and Education Building
hosted its opening
reception. The 67,000-
square-foot building,
whose design has
received much recogni-
tion, houses state-
of-the-art laboratories,
classrooms, an audi-
torium, and common
areas. The new building
devotes half of its space
to education, technology,
and faculty offices,
with the remainder
housing basic science
laboratories.
School of Dental MedicineBusiness School
1These numbers are restated to conform with fiscal 2003 presentation.
SU M M A R Y O F F I N A N C I A L R E S U LT SDollar amounts in millions
2005 2004 2003 2002 2001Total revenue $ 2,800.9 $ 2,597.7 $ 2,472.7 $ 2,349.01 $ 2,228.2Total expenses 2,757.4 2,560.9 2,432.9 2,261.61 2,063.3Total gifts 639.0 591.8 562.4 477.5 707.1
Student notes receivable 128.6 128.6 136.7 151.3 159.0Fixed assets, net 3,797.8 3,468.9 3,168.4 2,774.4 2,382.8Bonds and notes payable 2,849.1 2,604.7 2,246.9 1,839.5 1,622.2
Net assets–General Operating Account 4,197.6 3,935.5 3,439.4 3,419.9 3,279.9Net assets–endowment 25,853.0 22,587.3 19,294.7 17,518.0 18,259.2
Total return on general investments 19.2% 21.1% 12.5% (0.5%) (2.7%)Degree student enrollment 19,731 19,638 19,536 19,539 18,847

Analysis of financial results Harvard University 11
In fiscal 2005, indirect cost reimbursements totaled$155.6 million. Federal indirect cost recovery rose9% to $143.5 million, representing 28% of total federalsupport. Predetermined federal indirect cost recoveryrates have been established across the Universitythrough fiscal 2006. The subsequent federal indirectcost rates will be proposed and negotiated in thecoming year for use with grants and contracts beginning in fiscal 2007.
Among non-federal sponsors, indirect costrecovery rates are agreed upon independently witheach sponsor, are typically much lower than federalrates, and can vary widely from 0% to over 60%.Non-federal indirect cost recovery increased $3.1million to $12.2 million, with non-federal sponsoreddirect support declining 3%. Individual non-federalprojects can substantially impact non-federal sponsoredrevenue and related indirect cost recovery trends forthe University in any given year.
Two research centers formed in fiscal 2004 continued to evolve in fiscal 2005: the Harvard StemCell Institute (hsci) and the Eli and Edythe L. BroadInstitute (the Broad Institute) joint venture with theMassachusetts Institute of Technology (mit), theWhitehead Institute, and the Harvard-affiliatedteaching hospitals. hsci received $10.8 million inprivate gifts during fiscal 2005 and in turn fundedstem cell projects at the University and in the Harvard-affiliated teaching hospitals’ research laboratories.The Broad Institute made steady progress in genomic
research during its first full year of operation andlooks forward to occupying a new state-of-the-artbuilding near mit in April 2006. Both the BroadInstitute and hsci are expected to achieve major scientific advances and discoveries with additionalsponsored research funding.
Gifts for current use Gifts from alumni andfriends provide crucial funding for the University’songoing operations and priorities such as under-graduate and graduate student financial aid. Currentuse gifts surpassed fiscal 2004 by 22%, totaling$187.8 million in fiscal 2005. hms and hsci receivedsignificant incremental gifts during fiscal 2005.
Investment income Total investment incomeincreased 6% to $984.6 million in fiscal 2005. The largest component of investment income,endowment income distributed for operations, alsoincreased 6% to $854.8 million. This growth wasdue to a 4% increase in the distribution rate as wellas the impact of new gifts and other additions to theendowment. The distribution rate as a percentage ofendowment market value was 4.5%, within the targetedspending rate of 4.5% to 5.0%. The University’sendowment and related spending policies may befound in the section of this report beginning onpage 16.
Graduate School of Design Divinity School
Professor Alan Altshuler
became Dean of the
faculty in February 2005
after seven months as
Acting Dean. His initia-
tives have included
thorough reviews of
the School’s research
centers and the creation
of advisory faculty
committees on instruc-
tion, faculty norms, and
external relations.
Progress was made
towards the goal of
increasing the size and
diversity of the senior
faculty. The School’s
financial performance
also continued to
improve, resulting in
the second straight year
with an unrestricted
surplus.
Academic year 2004-05
witnessed a record num-
ber of professorial
searches at hds, result-
ing in the hiring of five
new faculty members.
The multi-year curricu-
lum redesign continued,
with changes imple-
mented in the Master of
Divinity program and
ongoing discussion on
the Master of
Theological Studies cur-
riculum, towards the
goal of graduating this
century’s leaders in min-
istry and service and
helping to prepare the
next generation of schol-
ars in religion.
Fiscal 2005 was a
very successful year for
the School’s revitalized
fundraising effort, with
approximately $10
million raised, including
endowment of a new
professorship in science
and religion. Additionally,
the Harvard Divinity
Bulletin was successfully
redesigned as a general-
interest magazine
covering critical con-
cerns surrounding
religion and public life,
religion and the arts, and
theological education.

Other income Other income consists primarilyof rental and parking fees, publication revenue, royalties, health and clinic fees, and revenue fromother auxiliary enterprises whose activities are consistent with the University’s mission. In fiscal2005, other income rose 12% to $415.7 million, largelydue to incremental rental and royalty income.
Expenses The University’s operating expensestotaled $2.8 billion in fiscal 2005, an 8% increaseover the prior year. Expense categories that rose significantly during the year included space andoccupancy costs as well as other expenses. TheUniversity continues to pursue cost savings acrossall expense categories.
Compensation As one of the foremost institutionsof higher education in the world, the Universitystrives to hire and retain outstanding faculty andstaff. Accordingly, the University offers an attractiveand competitive compensation and benefits package,which includes pension plans, health benefits foractive and retired employees, dental plans, lifeinsurance, tuition assistance, child and elder careresource services, mortgage and educational loanprograms, tax-deferred annuity programs, and freeadmission to the University’s museums and libraries.
Compensation costs totaled $1.4 billion in fiscal 2005, an increase of 5% over fiscal 2004. Compensation represented 51% of the University’stotal expenses in fiscal 2005 and 52% in fiscal 2004.
Salaries and wages rose 6%, while benefits costsincreased 3%. Salary expense growth reflects facultyhiring initiatives and additional personnel to supportboth the University’s science initiatives and greatersponsored research activity, as well as pay increasesand adjustments.
Benefits costs were impacted by several offsetting changes. Pension expenses increased 13%and health costs rose a modest 5%, while postretire-ment health costs decreased 28%. Despite continuedincreases in American health costs, the University wasable to contain growth in this area by implementinga self-insurance program in January 2005. This program is expected to result in administrative costsavings. The decline in post-retirement health costswas largely due to the impact of anticipated futuresubsidies resulting from new Medicare legislation(the Medicare Prescription Drug Improvement andModernization Act of 2003). Postretirement healthcosts are also affected by actuarial assumptionsincluding interest rates, which may cause significantchanges in these costs from year to year.
In addition to the standard benefits package,the Schools may offer educational and subsidizedmortgage loans to their faculty members. The mort-gage program helps faculty members cope with thehigh cost of housing in the Boston area. Total loansoutstanding to faculty and staff increased 9% to$118.8 million in fiscal 2005, reflecting new loansassociated with faculty growth.
12 Harvard University Analysis of financial results
In June 2005, Professor
Kathleen McCartney, a
leading expert on early
childhood education,
assumed the role of
Acting Dean. The work
to build a core curricu-
lum continued: the
initial course, Thinking
Like an Educator, was
expanded to include 225
students; a new course
focusing on education
reform was developed;
and a seminar for first-
year Doctoral students
was created. Progress
continued in reviewing
the Master’s degree
programs, in particular
the School’s Teacher
Education program.
Faculty have also led
the creation of a unified
doctoral program
experience.
During his first year as
Dean, David Ellwood
focused the School’s
activities on three
central themes: partner-
ship, excellence, and
impact. ksg is collabo-
rating across the
University through
several new fellowships
intended to encourage
students to pursue joint
degrees and participate
in social entrepreneur-
ship.
In addition, the
School recently endowed
the Center for Business
and Government, recog-
nizing that collaboration
between business and
government is central
to the solution of public
problems. With the
assistance of a $10
million gift, ksg has
been able to enhance
its efforts towards excel-
lence in teaching and
research. This gift
provides funds for hiring
and retaining superb
faculty, strengthening
teaching programs,
upgrading facilities,
and enhancing the
student loan repayment
program.
John F. Kennedy School of GovernmentGraduate School of Education

Analysis of financial results Harvard University 13
Financial aid The University strives to enable all admitted students to attend its Schools, regardlessof their financial circumstances. Enhancing thefinancial aid programs for both undergraduate andgraduate students continues to be one of theUniversity’s top priorities.
Scholarships and student awards, includingamounts applied against student income, increased8% to $283.1 million in fiscal 2005. In addition, theUniversity spent $56.7 million on student employment,loaned $26.2 million to students, and acted as agenton behalf of specific student recipients for $13.7 millionin aid from outside sponsors. Approximately 65% ofscholarships and student awards is funded throughgifts from generous alumni and friends, endowmentincome, and sponsored support, with the remaining35% supported by other University operating funds.
Over the past ten years, the cost of attendingHarvard College has increased 51%, from $28,150 to$42,450 per year. During that same ten-year period,the average annual scholarship award has grown85%, from $14,170 to $26,240. The College providesneed-based financial aid, while admitting studentson a need-blind basis. Almost 70% of undergraduatestudents receive financial aid, with close to 50%qualifying for need-based scholarship assistance.The average undergraduate aid package consists ofgrants, loans, and employment, and represents 70%of the total cost of attendance. In the past five years,
financial aid enhancements have generated a 61%decline in the median indebtedness among graduat-ing seniors, from $16,400 for the Class of 2000 to$6,400 for the Class of 2005.
A major new financial aid initiative wasimplemented in fiscal 2005, designed to encouragetalented students from families of low and moderateincome to apply to and attend the College. Parentsof families with annual income of less than $40,000are no longer expected to contribute to the cost oftheir child’s undergraduate education. In addition,the University has reduced the contributions expectedof families with income between $40,000 and$60,000. This initiative is the latest step in a pro-gressive expansion of undergraduate financial aidthat has led to the largest applicant pool and themost competitive admission rate (9.1%) in the historyof the College. The Class of 2009 is also the College’smost economically diverse to date, with a 22%increase in the number of students from lowerincome backgrounds as compared with the Class of2008. This new initiative and other improvementshave made Harvard College’s financial aid programan exemplar among institutions of higher education.
Financial aid is also vital in attracting studentsto the graduate and professional Schools. Between50% and 93% of each School’s students receivedfinancial support in fiscal 2005. The Universityexpanded financial aid for graduate and professional
Law School
hls completed the first
comprehensive renova-
tion of Harkness
Commons, the student
and dining center, result-
ing in increased formal
and informal use of the
space. hls also made
significant progress in
developing a student
information system,
which will be imple-
mented in fiscal 2006.
The Law School
introduced elective read-
ing groups for first-year
students, small informal
sessions convening
groups of students
and faculty members
to read and discuss
materials on a specific
topic. Over 90% of the
first-year class elected
to participate in nearly
50 offerings.
hms launched four new
advanced degree pro-
grams in collaboration
with other areas of the
University. An MD-MBA
program was begun
with Harvard Business
School, and a new MD-
PhD program in social
sciences and two new
PhD programs, in sys-
tems biology and
chemical biology, were
developed in conjunc-
tion with fas.
Planning for exten-
sive reform of the
medical education
program made major
strides through pilot
projects and agreement
on five core areas for
reform. A target date for
implementation of the
year-one curriculum
reform has been set
for the fall of 2006.
In fiscal 2005,
hms faculty at the
Quadrangle and the
affiliated hospitals
continued to receive
major federal grants,
including funding for
hiv vaccine research,
bioinformatics, and
biosecurity.
Medical School

14 Harvard University Analysis of financial results
students during the past year, utilizing funds reallo-cated from cost-cutting initiatives in the University’score central administration. These funds are intendedto provide $9.0 million of incremental financial aidto eight of the graduate and professional Schoolsthrough fiscal 2007. The Schools are deploying thesefunds in a variety of ways, ranging from additionalsupport for hsph Presidential Scholars to Leadershipin Education merit awards for Master’s degree students at gse and funding for ksg PresidentialPublic Service Fellowships.
In fiscal 2005, the University continued its partnership with a major financial institution toprovide commercially funded loans to graduate andprofessional students through the Harvard EducationalLoan Program (help). Graduate students rely oneducational loans or other financing to cover the costsof attending the University. The help program isparticularly important for international students,who are ineligible for federally subsidized educationloans. The program assisted more than 2,100 graduatestudents by providing over $39.1 million of below-market-rate loans in fiscal 2005. In the coming year,approximately $42.0 million is expected to beloaned to 2,200 students.
The University also maintains its own studentloan programs, which are funded through federalsupport, University capital resources, and donations.Outstanding loans from University funds to currentand former students remained constant at $128.6million in fiscal 2005.
Supplies and equipment In fiscal 2005, suppliesand equipment expenses increased 10% to $206.7million. This growth was primarily related to generalequipment purchases and upgrades.
University-wide contracts with vendor partnerstogether with cost-conscious purchasing practicescontained further expense growth. During fiscal2005, the University completed contract renegotiationswith its primary office supplies vendor, resulting inadditional savings. A new contract was also negotiatedwith a convenience copier vendor. Other vendorpartnerships continued in the areas of office furniture;scientific supplies; personal computers; watermarkand recycled paper; facilities maintenance, repair,and operating supplies; and audiovisual equipment.The University will continue to evaluate additionalvendor savings opportunities in the coming year,while also encouraging increased use of preferredvendors to generate and leverage further savings forthe University.
hsph received funding
from the National
Cancer Institute to create
a professional network
for reducing cancer
deaths and illness in
minority and under-
served populations in
Massachusetts. The net-
work will develop cancer
prevention programs
and early detection inter-
ventions. Other research
at hsph identified the
importance of combin-
ing treatment and
prevention efforts to
combat the hiv epidem-
ic in Africa; found a link
between obesity and
Type 2 diabetes; and
determined through
computer modeling that
rapid vaccination could
avert a future pandemic
caused by bird flu.
In fiscal 2005, the
Radcliffe Institute
marked five years since
the 1999 merger of
Radcliffe College and the
University with a strong
sense of progress and
accomplishment. In that
short time, fellowship
applications have
increased 280% as the
Institute's reputation has
spread, and support
from alumnae/alumni
and friends has grown
an extraordinary 103%
since fiscal 2004.
The Radcliffe
Institute reopened
Schlesinger Library after
an extensive renovation
aimed at securing and
preserving its increasing-
ly valuable collections.
The Institute finalized
preparations for the next
phase of its space plan:
renovation of the
Radcliffe Gym into a
spacious lecture hall for
fellows’ presentations
and other events, as well
as much needed office
space for Institute staff.
School of Public Health Radcliffe Institute for Advanced Study

Analysis of financial results Harvard University 15
Space and occupancy Space and occupancycosts totaled $296.1 million in fiscal 2005, an 11%increase over the prior year. Facilities improvementand maintenance costs rose 19%, largely due tonon-capitalizable laboratory and other renovations at hsph, hms, and fas. Interest on bonds and notespayable related to capital projects increased 18% as a result of new debt issuances and higher interestrates on variable-rate debt. Utility costs grew 10%due to higher market rates. The University is activelyidentifying and implementing strategies to mitigatethe effects of volatility in the energy markets.
Other expenses Other expenses consist primarilyof purchased services; expenses subcontracted toother institutions for sponsored projects; travel,publishing, and telephone costs. In fiscal 2005,other expenses increased 12% to $556.9 million.Expense growth occurred in legal and settlementcosts primarily associated with the Harvard Institutefor International Development, as well as consultingfees for development in Allston and interest costsassociated with the University’s working capital.
Vendor partnerships helped to reduce expendituresin the areas of temporary employment, expressmail, travel, and offset printing. A renegotiated contract with the University’s major express mailvendor is expected to generate future cost savings.The University continues to seek additional cost savings by consolidating vendors, negotiating contracts, and leveraging purchasing activity.
In July 2005, Professor
Evelynn Hammonds was
appointed as Senior Vice
Provost for Faculty Devel-
opment and Diversity.
Her office will implement
the recommendations
made by the Task Forces
on Women Faculty and
Women in Science and
Engineering, including
collecting quality data on
faculty appointments and
diversity, establishing
mentoring programs for
junior faculty, enhancing
work-family benefits, and
improving the faculty
appointment process to
ensure both diversity
and excellence.
The Task Force on
Science and Technology
issued a report in April
2005 focusing on oppor-
tunities for interdiscipli-
nary ventures, highlight-
ing those that would
benefit from co-location
in the developing Allston
campus. Several key
fields were identified:
chemical biology, innova-
tive computing, stem
cells, systems biology,
and certain areas of
engineering. The pro-
posed co-location of
these programs, while
logistically challenging,
promises to foster
dynamic synergies and
connections.
The Office of Tech-
nology Development
(otd) has been restruc-
tured and is in the
process of defining a
new technology develop-
ment strategy, including
a University-wide tech-
nology transfer program.
otd is responsible for all
activities pertaining to
intellectual property,
licensing, and techno-
logy transfer, aiming to
translate new knowledge
and innovations into
practical advances bene-
ficial to society, while
providing further sup-
port for the University’s
goals and mission.
The University

16 Harvard University
The University’s endowment, the legacy of generous alumni and friends, achieved a record
market value of $25.9 billion in fiscal 2005. The University relies upon the endowment to
provide support in perpetuity for its teaching and research mission.
R E A L E N D O W M E N T G R O W T H
Compound annual rate of growth
1974–84 1985–95 1996–05 1974–05Total general investment return 10.4% 12.7% 14.8% 13.4%Average per unit income distributed as a percent of unit value (5.1) (4.1) (4.2) (4.5)Total return reinvested 5.3 8.6 10.6 8.9
Capital additions 3.3 1.5 2.0 2.2
Total growth in endowment 8.6 10.1 12.6 11.1
Inflation rate (7.8) (3.5) (2.4) (4.5)
REAL ENDOWMENT GROWTH 0.8% 6.6% 10.2% 6.6%
Review of endowment results
The endowment is the financial cornerstone of theUniversity, providing long-term funding for studentfinancial aid, the faculty, and academic programs.The endowment contains approximately 10,840 separate funds, the majority of which are restrictedfor specific purposes. The endowment’s growth andthe resulting income stream depend upon gifts fromgenerous alumni and friends as well as prudentinvestment management.
In fiscal 2005, endowment gifts totaled $285.7 million,an increase of 11% over the prior year. This increasereflects incremental endowment gifts at the BusinessSchool (hbs) and the Radcliffe Institute for AdvancedStudy (rias). hbs’s endowment gifts increased by70% to $102.3 million, as its capital campaignentered its final phase. rias more than doubled itsendowment gifts to $8.8 million.
A S T R O N G E N D O W M E N T

Review of endowment results Harvard University 17
In billions of dollars In millions of dollars
E N D O W M E N T G R O W T H * E N D O W M E N T I N C O M E D I S T R I B U T E D
P E R F O R M A N C E O V E R V I E W
Harvard Management Company (hmc) is responsiblefor managing the endowment’s investments. Theunaudited Annual Report of the Harvard ManagementCompany, beginning on page 23, discusses theUniversity’s investment philosophy and analyzes the endowment’s fiscal 2005 performance.
In fiscal 2005, total return of the endow-ment’s general investments was 19.2% versus 21.1%in fiscal 2004. The market value of the endowmentincreased from $22.6 billion to $25.9 billion duringfiscal 2005, exceeding annual performance bench-marks by 5%. The change in market value includesall endowment activity: investment appreciation anddepreciation; funds distributed to the Schools anddepartments for operations; new gifts and pledges;departmental additions to the endowment from
unrestricted fund and gift balances; and the use ofendowment appreciation for specific purposesapproved by the Corporation.
The University’s endowment spending policy strives to sustain the purchasing power of theendowment while providing a reliable stream ofincome for operations. Accordingly, the Universityaims to distribute between 4.5% and 5.0% of theendowment’s market value annually. In fiscal 2005,endowment distributions resulted in a spending rate of 4.5%.
Continuing donor support, strong invest-ment management, and fiscal moderation will berequired to ensure the endowment’s future strength.
0
5
15
20
25
$30
1974
1985
1980
1990
1995
2000
2005
10
1974 Principal and appreciation Capitalized income Gifts and other changes CPI growth
$900
750
600
450
300
150
0
1974
1985
1980
1990
1995
2000
2005
* To allow for comparability with years prior to fiscal 1995, this chart does not include pledge balances and interests in perpetual trusts.

18 Harvard University
Review of capital activities
In fiscal 2005, the University was engaged in 329 construction and renovation projects.
The University’s property holdings include 23.2 million square feet of space in more than 600
buildings, as well as over 200 acres of land intended for long-term development.
A P P R O A C H T O C A P I TA L I S S U E S
The University employs a comprehensive planningstrategy to assess current and future space require-ments while considering the impact of growth onthe neighboring communities. Within this planningstrategy, the University continues to pursue propertydevelopment and acquisition in Cambridge and Boston.
The planning process for the University’snew and existing space in Allston continued through-out fiscal 2005. The University collaborated with theBoston Redevelopment Authority to finalize a NorthAllston Neighborhood Strategic Plan, the product ofa multi-year, community-centered planning process.Negotiations around critical issues involving theUniversity’s ability to use the land in Allston for thecreation of a new teaching, research, and residentialcampus concluded favorably with the completedplan, which will form the basis for proposed institu-tional uses in the future. In June 2005, an externalplanning firm prepared an interim report proposingpreliminary ideas and options for a basic campusand urban framework in Allston. The report hasbeen distributed broadly to facilitate discussionamong the University community, the City of Boston,the Allston neighborhood, and other regional groups.
In an effort to further demonstrate its commitment toward the Allston community, theUniversity has pledged $1.2 million to fund land-scape improvements and business development inAllston, including the creation of a city-run career andbusiness resource center. This center will support localbusiness operations and assist Allston residents withcareer planning.
The University intends to continue collabo-rating with the Allston community, the City of Boston,the faculty, students, and others across the University
as planning for the Allston campus progresses. Inthe coming year, the University will organize struc-tured opportunities for all interested parties to hearabout emerging ideas and options, contribute theirthoughts, and help to ensure that the decisions made best reflect the long-term interests of both theUniversity and its neighbors.
Strategic developments and planning alsooccurred in Cambridge during fiscal 2005. Discussionscontinued regarding planned construction in thearea north of the main Cambridge campus for Facultyof Arts and Sciences (fas) and Law School (hls)facilities projects. The University secured buildingpermits and commenced construction on two fasbuildings: the Northwest Science Building and theLaboratory for Integrated Science and Engineering. At hls, planning for a major new building containingadded academic and student-related space is underway.In addition, the University completed a comprehensiveCambridge campus transportation study to assess thecumulative impacts of the proposed developmentsand provide guidelines for future capital projects.
During fiscal 2005, the University madeprogress toward its goal of providing housing to 50%of its graduate students. In Boston, the Universitycontinued its participation in the Fenway mixed-useproject, which will include affiliate apartments. TheUniversity received permits for two new constructionprojects in the Riverside area of Cambridge that willprovide more than 300 units of new housing, primarilyto graduate students. As a part of these Cambridgeprojects, the University will also be developing morethan 34 units of affordable housing and creating nearlythree quarters of an acre of new public open space inthe Riverside area.

0
75
150
225
300
375
450
525
600
$675
1986
1987
1988
1989
1990
1991
1992
1993
1994
1995
1996
1997
1998
1999
2000
2001
2002
2003
2004
2005
A N N U A L F A C I L I T Y E X P E N D I T U R E S
In millions of dollars
Review of capital activities Harvard University 19
The University’s property holdings comprised 23.2million square feet of space at the end of fiscal 2005.The University’s physical plant must meet diverseneeds and requirements, including security, energyefficiency, accessibility, and 24-hour use. Studenthousing occupies 6.7 million square feet; offices andclassrooms, 4.7 million square feet; laboratories, 4.4million square feet; libraries, 1.6 million square feet;and other facilities including athletic, health care,and administrative facilities, as well as museumsand commercial space, 5.8 million square feet.
The University invested $469.9 million in329 active capital projects and acquisitions in fiscal2005, compared with $409.9 million and 356 activeprojects in fiscal 2004. Investments in new construc-tion and renovations included: 46% for laboratories,classrooms, and offices; 22% for libraries, museums, and assembly spaces; 3% for housing; and 29% for
athletic and other facilities. Strategic acquisitions in Allston and Cambridge also added to theUniversity’s plant.
Capital projects were funded by $40.8 millionof gifts, $23.5 million of unrestricted balances, and$19.0 million of endowment, with the remainderfinanced by debt. For more than 20 years, theUniversity has employed a strategy of financing capitalprojects with bonds. This strategy has enabled newconstruction as well as renewal and improvement ofexisting facilities, while allowing payments for theprojects to occur over time. The University’s out-standing debt totaled $2.8 billion at the end of fiscal2005, a 9% increase over the prior year balance.
T H E P H Y S I C A L P L A N T
Capital expenditures Five-year average 2005 dollars

20 Harvard University Review of capital activities
N E W C O N S T R U C T I O N A N D A C Q U I S I T I O N S
New construction and acquisitions accounted for39% and 19%, respectively, of the University’s capitalexpenditures during fiscal 2005. In Cambridge, construction was completed on the Oxford Streetunderground garage. In the Longwood MedicalArea, the School of Dental Medicine opened its newResearch and Education Building in December2004. The facility contains three floors of researchlaboratories focused on bone biology and pathologyas well as two floors dedicated to education. Thisnew structure has enabled five formerly off-siteresearch programs to come together in a singlebuilding. In addition, the University purchased sixproperties in Allston and two in Cambridge, adding382,000 and 13,500 square feet, respectively, toexisting holdings.
Significant progress on two fas constructionprojects in the north campus continued: the Laboratoryfor Integrated Science and Engineering (lise) andthe Biology Research Infrastructure (bri) building.The lise facility will enable interaction among facultyand students in the areas of physics, chemistry, biol-ogy, engineering, and materials science. The lisewill also include laboratory space for the Center forNanoscale Science Structures, as well as clean-roomand vibration-free underground research space forwork in materials science and nanotechnology. Thebri building, located under the Biological Laboratoriescourtyard, will house a multiscientist support facilityfor fas research.
Construction commenced in the northwestcampus on the new 520,000 square-foot fas laboratorybuilding, which will house the Center for BrainScience and the department of Systems Biology,as well as other multidisciplinary scientific efforts. The Northwest Science Building will include offices,classrooms, teaching and research laboratories, a chilled-water plant, and an electrical substation.
The new building will be used by neuroscientists,biologists, bioengineers, and astrophysics researchers,among others, and is slated for completion in fiscal 2008.
The fas Center for Government andInternational Studies (cgis) project was completedin September 2005. cgis will co-locate the Governmentdepartment and various centers for regional andinternational studies while also accommodating arange of academic and administrative uses, includingfaculty offices, graduate student workspace, lecturehalls, various seminar rooms, a library, the Harvard-mit Data Center (a research center for quantitativesocial science data), and a cafe.
Work on a new building located on MountAuburn Street in Cambridge continued as well. Thebuilding is intended to house strategic programs ofthe University Library, which provides essential services to the over 90 units of the library system.These programs include: the Weissman PreservationCenter, with a specially equipped laboratory for theconservation of the University’s rarest and mostvaluable manuscripts, images, and bound volumes;the Office for Information Systems and its LibraryDigital Initiative; the Harvard Depository adminis-trators; and the global Open Collections Program,among other initiatives.
At the Dumbarton Oaks complex inWashington, D.C., significant progress was made in the construction of a new library that will providemuch needed program space and allow for the relocation and consolidation of the library collection.The library, the recently completed central plant, a service and maintenance building, and the ongoing renovations to other existing buildingscomprise a comprehensive multi-year capital construction and renewal program currently underway at Dumbarton Oaks.

Review of capital activities Harvard University 21
With a physical plant whose history spans nearlyfour centuries, the University is committed to renovation and renewal as a means of preserving itsarchitectural assets and creatively adapting space tomeet evolving needs. Investment in the existingphysical plant represented 42% of total capitalexpenditures in fiscal 2005.
Renovations completed in September 2005at Memorial Church included replacement of theslate roof and installation of a new heating, ventila-tion, and air conditioning system, among other necessary repairs and safety improvements to maintain this historic building. Major renovations to Loeb House began late in the fiscal year, strivingto preserve yet modernize the building in a mannerappropriate for its use by the Office of theGoverning Boards.
The Radcliffe Institute for Advanced Studycompleted renovations at Schlesinger Library inJanuary 2005. In addition to reviving some of itshistoric spaces and adding systems to ensure thelong-term preservation of the library’s collections,the project included installation of many modernamenities for students and researchers. The Institutealso began renovating the Radcliffe Gym. The Gymwill be converted into a spacious lecture hall for fellows’ presentations and other events, as well asoffice space for Institute staff. This project is the second phase of the Radcliffe capital plan and is animportant step in co-locating central meeting spacesand the core of the fellowship intellectual activities,as well as the overall consolidation of Institute staff,fellows, and programs into Radcliffe Yard.
University Operations Services (uos) beganwork on two significant projects at Blackstone Station,the primary source of power for over 200 Harvardbuildings on both the Cambridge and Allston cam-puses. An office renovation project will refurbish the existing service building space and consolidateuos operations at the Blackstone location. A secondBlackstone project will replace the 1930-vintagesteam plant boiler and associated support equipmentto ensure reliable, efficient, and environmentallyresponsible steam production to support campuspower demands.
At Harvard Business School (hbs), Baker Libraryrenovations were completed in September 2005.The historic lobby, reading room, and north facadewere restored, and a new space was constructed toaccommodate faculty, library, and research offices aswell as book stacks, seminar rooms, and informalstudent gathering spaces. Aldrich Hall renovationswere also completed, updating a total of 16 classroomsover two years with state-of-the-art technology whilerefurbishing the adjacent hallways and study alcoves.The renovation of Hamilton Hall, which began infiscal 2005, will convert the existing space to 72 single rooms with private baths, several small kitchenettes, and group study rooms.
At the Law School, renovations concluded at Harkness Commons, resulting in improved diningfacilities and social gathering spaces. Also at hls,the Hemenway Gymnasium project, a joint effort ofhls, fas, and the Athletic Department, was completed.The renovation included rebuilding three squash courtsto international size, consolidating and upgrading thelocker rooms, and creating an expanded state-of-the-art fitness facility.
Several projects aimed to improve the overallundergraduate student experience at the University.Work on the Malkin Athletic Center (mac) was com-pleted prior to the beginning of the 2004-05 academicyear, and the Quadrangle Recreational AthleticCenter (qrac) renovations concluded in September2005. The mac now has an expanded exercise spaceand new athletic equipment. Changes to the qraccombined improvements to the athletic facility withrenovation of space for a dance studio and perfor-mance center. One of the qrac’s basketball courtswas converted into a two-level dance space, includinga practice studio, green room, changing room, andcostume storage space. Additionally, the building’scardiovascular exercise area was reconfigured andrefurbished.
Renovations also occurred at Hilles Library,Widener Library, and Sever Hall. Hilles Library wasconsolidated to one floor, freeing space for studentorganization offices and meeting areas. The libraryproject was completed in October 2005. Other Hillesrenovations are expected to resume later in fiscal 2006.
R E N O VAT I O N A N D R E N E W A L

22 Harvard University Review of capital activities
The Widener Library project was completed, resultingin reconfigured administrative spaces and two newreading rooms. Original architectural features and fin-ishes were restored throughout Widener. The peri-odicals and reading rooms on the first floor wererenovated, a microform reading room adjacent to theperiodicals room was created, and the second floorreading room was restored to its original configura-tion. Sever Hall improvements were completed inSeptember 2005 and included work on both theexterior and interior of the historic building. Thefourth floor of Sever is now dedicated to the Visualand Environmental Studies department andincludes three new screening rooms, two studioclassrooms, and faculty and staff offices, in additionto video-viewing stations and a new library.
Other renovation projects included LokerCommons, the Dunster and Mather dining halls,and the new College Theater, formerly known as theHasty Pudding building. The reconfiguration ofLoker Commons concluded at the beginning of the2004-05 academic year, adding a late night grill and
providing space for undergraduate student gatheringsand functions. Finalized in September 2005, theDunster and Mather improvements mark the last of the University’s multi-year series of dining hallrenovations. The kitchen shared by both Dunsterand Mather Houses was outfitted with the latestenergy-efficient technologies. Also, the dining hallswere redesigned, providing students with improvedtraffic-flow serving areas, modernized facilities, andbeautified eating spaces. Late in fiscal 2005, renovationplans for the new College Theater were finalized.Three quarters of the structure will be razed, and thehistoric front facade will be preserved and restored.In addition to a comprehensive renovation, this project will create a high quality theater for under-graduates with improved support space, rehearsalrooms, and student offices. The renovated newCollege Theater building will enable students tostage public performances and learn theater craft ina contemporary facility, while also helping to satisfythe high demand for student performance space.
0
5
10
15
20
25
30
$35
1986
1987
1988
1989
1990
1991
1992
1993
1994
1995
1996
1997
1998
1999
2000
2001
2002
2003
2004
2005
14.6%12.2% 10.1%
6.3%8.2%
C O M P A R I S O N O F D E B T T O T O TA L A S S E T S *
Dollar amounts in billions
*
Endowment assets Other assets Total debt Ratio of debt to total assets%
Assets are net of pledges, interests in perpetual trusts, and securities pledged to counterparties.

Harvard University 23
Annual report of the HarvardManagement Company
Harvard Management Company (HMC), a wholly owned subsidiary of Harvard University,
was founded in 1974 to manage the University’s endowment, pension assets, working capital,
and deferred giving accounts. HMC is governed by a Board of Directors that is appointed by
the President and Fellows of the University.
As of June 30, 2005, HMC managed $31.4 billion, of which $29.4 billion resided in the
General Investment Account (GIA), a pooled fund that consists primarily of endowment assets.
The information presented in this report relates to the GIA.
T H E P O L I C Y P O R T F O L I O
The cornerstone for the management of the giais the Policy Portfolio, the long-term asset mix thatis most likely to meet the University’s long-termreturn goals with the appropriate level of risk. It serves as the benchmark against which the performance of the actual portfolio is measured.The components of the Policy Portfolio at the end of fiscal 2005 are shown below:
Domestic equities 15%Foreign equities 10Emerging markets 5Private equities 13
Absolute return funds 12High-yield securities 5Commodities 13Real estate 10
Domestic bonds 11Foreign bonds 5Inflation-indexed bonds 6Cash (5)
TOTAL 100%
Several points about the Policy Portfolio are worthnoting. First, it is a diversified portfolio with anattractive expected return-to-risk ratio. It includes a higher allocation to foreign securities and commodity-based assets and a lower allocation to domestic fixed-income assets than the typicalinstitutional fund. Second, while performance willbe measured against the Policy Portfolio, the actualasset mix in the portfolio may differ from the Policy Portfolio at any point in time. For instance, if domestic equities are perceived to be overvalued,the actual portfolio may hold only 12% in domesticequities compared with the 15% weight in the PolicyPortfolio. If these tactical asset allocation decisionsare correct, on balance, the actual portfolio will tendto outperform the Policy Portfolio. Also, if hmcsucceeds in outperforming the benchmarks for theindividual asset classes (for example, the Lehman 5+ year Treasury Index for the domestic bond sector),the actual portfolio will outperform the PolicyPortfolio. The Policy Portfolio is regularly reviewedand modifications are made periodically in light ofexperience and changing circumstances.

24 Harvard University Annual report of the Harvard Management Company
T O TA L R E T U R NHarvard Policy tucs
Fiscal year gia* portfolio median1996 26.0% 22.3% 17.6%1997 25.8 20.0 20.31998 20.5 17.1 17.91999 12.2 18.9 11.22000 32.2 18.6 10.4
FIVE-YEAR ANNUAL RATE 23.2 19.4 15.4
2001 (2.7) (9.8) (5.7)2002 (0.5) (4.5) (5.9)2003 12.5 8.3 4.02004 21.1 16.4 16.22005 19.2 14.2 10.5
FIVE-YEAR ANNUAL RATE 9.5 4.4 3.6
TEN-YEAR ANNUAL RATE 16.1% 11.6% 9.4%
Total return on the gia for the year ended June 30, 2005 was 19.2%, calculated on a time-weightedbasis. This return is net of all fees and expenses,and including the impact of revenue-sharing agree-ments with certain fund managers, and compareswith a 14.2% return on the Policy Portfolio.
The table below shows total return on the gia for each of the past ten years. The PolicyPortfolio is shown for comparison, as is the Trust
Universe Comparison Service (tucs) Median, a universe of more than 100 funds with assets ofover $1.0 billion. As the numbers indicate, endow-ment returns on average have exceeded returns on the Policy Portfolio and the tucs Median by a substantial margin.
F I S C A L 2005 I N V E S T M E N T R E S U LT S
*Net of all fees and expenses, and including the impact of revenue-sharing agreements with certain fund managers.
A S S E T A L L O C AT I O N
2005 2004Domestic equities $ 5,332 18.2% $ 4,779 18.8%Foreign equities 3,848 13.1 3,447 13.6Emerging markets 1,782 6.0 1,829 7.2Private equities 2,358 8.0 1,968 7.7Subtotal 13,320 45.3 12,023 47.3
Absolute return funds 3,837 13.1 2,907 11.4High-yield securities 1,831 6.2 1,497 5.9Commodities 3,675 12.5 2,986 11.8Real estate 1,940 6.6 1,420 5.6Subtotal 11,283 38.4 8,810 34.7
Domestic bonds 2,411 8.2 1,708 6.7Foreign bonds 1,192 4.1 826 3.3Inflation-indexed bonds 1,589 5.4 1,446 5.7Cash (417) (1.4) 595 2.3Subtotal 4,775 16.3 4,575 18.0
TOTAL $ 29,378 100.0% $ 25,408 100.0%
The table below shows the breakdown by asset category of the General Investment Account as of June 30, 2005 and 2004 (dollar amounts in millions):

Annual report of the Harvard Management Company Harvard University 25
Annualized ten-year performance by asset class isshown in the graph below. The graph provides theUniversity’s annualized returns, net of all fees andexpenses, and including the impact of revenue-sharingagreements with certain fund managers, as well asthe performance of the relevant benchmark. All
returns are calculated on a time-weighted basis withthe exception of private equities, real estate, andcommodities, which are calculated on a dollar-weighted basis. Individual benchmarks arerepresentative of each asset class and are approvedby the Board of Directors.
R E S U LT S B Y A S S E T C L A S S
TotalForeign bonds
Domesticbonds
Real estateCommoditiesHigh-yieldsecurities
Privateequities
Emergingmarkets
Foreignequities
Domesticequities
Absolutereturn funds*
Inflation-indexed bonds*
0%
5%
10%
15%
20%
25%
30%
35%
The active management of a diverse portfolioinvolves inherent risks essential to meeting thelong-term return objectives of the endowment. The primary risk factors include market risk, creditrisk, liquidity risk, and operational risk. The manage-ment of these risks is the responsibility of the Boardof Directors, its subcommittees, and senior manage-ment, who determine the objectives and policiesthat guide the management of the endowment.Subcommittees include the Corporate Governanceand Nomination Committee, the Finance Committee,the Valuation Committee, the ComplianceCommittee, and the Compensation Committee.
Collectively, hmc has implemented a series of riskmanagement processes to identify and quantify therisks to which the University is exposed, establishthe proper mitigating controls, and monitor compliance with risk mitigation strategies. Riskmanagement techniques are structured around fundamental principles including clearly definedpolicies and procedures; segregation of duties withclear reporting lines; strong management informa-tion systems, measurement, and analytical tools;disciplined relationship management; and independent review.
R I S K M A N A G E M E N T
* Absolute return funds and inflation-indexed bonds have been held for less than ten years. For these asset classes, the hmc return and the benchmarkreflect annualized performance of 6.75 years and 6.00 years, respectively.
hmc Return BenchmarkA N N U A L I Z E D T E N - Y E A R P E R F O R M A N C E B Y A S S E T C L A S S

26 Harvard University Annual report of the Harvard Management Company
1) Market risk is defined as the sensitivity of incomeand capital to variations in interest rates, foreignexchange rates, equity prices, commodity prices,and other market-driven rates and prices. Marketrisk also considers the correlation risk amonginvestments and the liquidity of the underlyingpositions. Market risk is measured as the potentialgain or loss resulting from a price change at a givenprobability over a specific time period; this is alsodescribed as value at risk. Value at risk is monitoredand reviewed frequently by the Board of Directorsand senior management to ensure that exposuresare consistent with approved limits and guidelines.Stress tests are also conducted to determine howpotential changes in market conditions couldimpact the market risk of the portfolio.
2) Credit risk is defined as the risk of loss arisingfrom a counterparty’s failure or inability to meetpayment or performance terms of a contract. hmcmanages credit risk by establishing strict credit policies, setting concentration limits and approvalprocedures, and monitoring exposure continuously.hmc enters into arrangements with counterpartiesbelieved to be creditworthy and requires collateral tothe maximum extent possible. Limits are establishedfor each counterparty based on their creditworthiness.
3) Liquidity risk considers the risk of loss arisingfrom the inability to meet funding commitments.The objective of liquidity risk management is toensure the ability to meet the endowment’s financialobligations. Effective management of liquidity riskrequires the ability to project and understand all
cash flows and potential future commitments. Italso involves the identification and prioritization of sources of liquidity. Cash is managed actively by a centralized staff responsible for understandingfunding requirements and evaluating sources of liquidity. Liquidity measures are employed to ensurethat the University maintains adequate liquidity and is prepared for periods of stress.
4) Operational risk is the risk of loss resulting from inadequate or failed internal processes or systems, errors by employees, or external events.The management of these risks is primarily theresponsibility of the business line managers in eachfunctional area. hmc manages operational risk byidentifying areas of risk, monitoring compliance,promoting best practices, and implementing internalcontrols and robust systems. The results of theseactivities are reviewed frequently by senior management.
Jack Meyer, President and ceo of hmc since 1990,and the fixed income management team departedOctober 1, 2005 to form their own firm. MohamedA. El-Erian, currently a Managing Director at PacificInvestment Management Company (pimco), hasbeen appointed President and Chief ExecutiveOfficer of hmc, commencing early in 2006. PeterNadosy, an hmc Board member and former Presidentof Morgan Stanley Asset Management, is serving asInterim Chief Investment Officer until Mr. El-Erianassumes his post.
James F. Rothenberg
Chair
HMC Board of Directors

renovations at baker library
Renovations were completed at Baker Library, the physical and
intellectual center of Harvard Business School (hbs). Baker Library
provides a range of facilities, activities, and services that support the
exchange of knowledge and information among members of the hbs
community, while also serving as a resource for scholars worldwide.
Numerous technological resources were added during the renovations,
including advanced research tools and “The Exchange,” a gathering
place where students, faculty, and staff can view and discuss the
latest business and financial news from around the globe.
F I N A N C I A L S TAT E M E N T S
28 Balance sheets
29 Statements of changes in net assets
with General Operating Account detail
30 Statements of changes in net assets
of the endowment
31 Statements of cash flows
32 Notes to financial statements
53 Report of independent auditors

28 Harvard University Financial statements
Balance sheetswith summarized financial information as of June 30, 2004
In thousands of dollars 2005 2004ASSETS:Cash and cash equivalents (Notes 3 and 4) $ 1,565,629 $ 1,404,626Working capital investments, at market (Notes 3 and 4) 2,383,781 1,866,964Receivables, net (Note 5) 171,616 159,112Prepayments and deferred charges 77,810 64,686Notes receivable, net (Note 6) 269,544 257,161Pledges receivable, net (Note 7) 644,843 721,803Fixed assets, net (Note 8) 3,797,838 3,468,897Interests in perpetual trusts held by others (Note 9) 251,917 245,277Investment portfolio, at market (Notes 3 and 4) 26,418,985 24,472,444Market value of securities pledged to counterparties (Notes 3 and 4) 19,947,959 27,401,077
TOTAL ASSETS 55,529,922 60,062,047
LIABILITIES:Accounts payable 401,049 437,348Deposits and other liabilities 356,256 293,753Securities lending and other liabilities associated with investment portfolio (Notes 3 and 4) 20,343,700 28,897,526Liabilities due under life income fund agreements (Note 10) 568,112 492,138Bonds and notes payable (Note 11) 2,849,129 2,604,714Pension and other accrued retirement obligations (Note 12) 396,399 343,282Government loan advances (Note 6) 56,856 56,045
TOTAL LIABILITIES 24,971,501 33,124,806
NET ASSETS $ 30,558,421 $ 26,937,241
Temporarily PermanentlyUnrestricted restricted restricted 2005 2004
NET ASSETS:General Operating Account (Note 13) $ 3,061,167 $ 1,054,561 $ 81,866 $ 4,197,594 $ 3,935,474Endowment (Note 9) 4,032,215 17,899,424 3,921,409 25,853,048 22,587,305Life income funds (Note 10) 0 164,355 343,424 507,779 414,462
TOTAL NET ASSETS $ 7,093,382 $ 19,118,340 $ 4,346,699 $ 30,558,421 $ 26,937,241
The accompanying notes are an integral part of the financial statements.
June 30
June 30
June 30

Financial statements Harvard University 29
Temporarily Permanently
In thousands of dollars Unrestricted restricted restricted 2005 2004
REVENUE:
Student income:
Undergraduate program $ 200,047 $ 200,047 $ 190,619
Graduate programs 307,695 307,695 287,102
Board and lodging 112,609 112,609 106,736
Continuing education and executive programs 155,113 155,113 145,281
Scholarships applied to student income (Note 14) (189,000) (189,000) (173,437)
Total student income 586,464 0 0 586,464 556,301
Sponsored research support (Notes 15 and 16):
Federal government—direct costs 367,600 367,600 342,026
Federal government—indirect costs 143,457 143,457 131,474
Non-federal sponsors—direct costs 31,306 71,926 103,232 106,621
Non-federal sponsors—indirect costs 6,606 5,545 12,151 9,048
Total sponsored research support 548,969 77,471 0 626,440 589,169
Gifts for current use (Note 16) 97,993 89,779 187,772 153,518
Investment income:
Endowment income distributed for operations (Note 9) 134,895 719,862 854,757 807,645
Income on working capital investments distributed for operations 115,648 7,929 123,577 111,833
Interest received on student, faculty, and staff loans 6,232 6,232 6,544
Total investment income 256,775 727,791 0 984,566 926,022
Other operating income (Note 17) 415,694 415,694 372,696
Net assets released from restrictions (Note 2) 860,135 (860,135) 0 0
TOTAL REVENUE 2,766,030 34,906 0 2,800,936 2,597,706
EXPENSES:
Salaries and wages 1,093,179 1,093,179 1,036,028
Employee benefits (Note 12) 313,844 313,844 304,281
Scholarships and other student awards (Note 14) 94,116 94,116 89,414
Supplies and equipment 206,660 206,660 187,362
Space and occupancy 296,125 296,125 265,821
Depreciation (Note 8) 196,563 196,563 182,138
Other expenses (Note 18) 556,886 556,886 495,875
TOTAL EXPENSES 2,757,373 0 0 2,757,373 2,560,919
NET REVENUE 8,657 34,906 0 43,563 36,787
OTHER PROVISIONS AND CREDITS:
Change in appreciation, net of operating distribution 20,196 8,808 29,004 449,699
Change in undistributed general investment income 82,144 126,203 208,347 (66,848)
TOTAL OTHER PROVISIONS AND CREDITS 102,340 135,011 0 237,351 382,851
CAPITAL CHANGES:
Net change in pledge balances (Note 7) (11,889) (11,889) (10,098)
Capital gifts for loan funds and facilities (Note 16) 10,401 836 11,237 29,790
Transfers between General Operating Account and endowment 73,949 (97,106) (334) (23,491) 51,135
Transfers between General Operating Account and life income funds (Note 10) 5,335 14 5,349 5,632
Non-operating net assets released from restrictions (Note 2) 51,846 (53,044) 1,198 0 0
TOTAL CAPITAL CHANGES 125,795 (146,303) 1,714 (18,794) 76,459
GENERAL OPERATING ACCOUNT NET CHANGE DURING THE YEAR 236,792 23,614 1,714 262,120 496,097
Endowment net change during the year 657,580 2,443,322 164,841 3,265,743 3,292,570
Life income funds net change during the year (Note 10) 24,107 69,210 93,317 52,318
NET CHANGE DURING THE YEAR 894,372 2,491,043 235,765 3,621,180 3,840,985
Net assets, beginning of year 6,199,010 16,627,297 4,110,934 26,937,241 23,096,256
NET ASSETS, end of year $ 7,093,382 $ 19,118,340 $ 4,346,699 $ 30,558,421 $ 26,937,241
The accompanying notes are an integral part of the financial statements.
Statements of changes in net assets with General Operating Account detailwith summarized financial information for the year ended June 30, 2004 For the year ended
June 30

30 Harvard University Financial statements
Statements of changes in net assets of the endowmentwith summarized financial information for the year ended June 30, 2004
Temporarily PermanentlyIn thousands of dollars Unrestricted restricted restricted 2005 2004
Gifts for capital (Note 16) $ 11,170 $ 41,079 $ 233,410 $ 285,659 $ 257,767
Investment return (Notes 3, 4, and 9):Endowment income from general investments 59,745 312,151 371,896 192,843Change in realized and unrealized appreciation during year 643,763 3,029,301 3,673,064 3,607,677
Total investment return 703,508 3,341,452 0 4,044,960 3,800,520Endowment income distributed for operations (134,895) (719,862) (854,757) (807,645)Change in undistributed general investment income (29,892) (149,161) (179,053) 59,681Net investment return after distributions 538,721 2,472,429 0 3,011,150 3,052,556
Transfers between endowment and General Operating Account:Unexpended income capitalized/(decapitalized) (2,575) 6,537 5,967 9,929 14,985Gifts capitalized 4 12,508 399 12,911 3,699Other (71,378) 78,061 (6,032) 651 (69,819)
Total transfers (73,949) 97,106 334 23,491 (51,135)
Capitalization of life income funds (Note 10) 4,426 8,070 12,496 9,472Net change in endowment pledge balances (Note 7) (7,404) (56,925) (64,329) (1,588)Net change in interests in perpetual trusts held by others (Note 9) 6,640 6,640 29,960Other changes (6) (9,101) (257) (9,364) (4,462)Net assets released from restrictions (Note 2) 181,644 (155,213) (26,431) 0 0NET CHANGE DURING THE YEAR 657,580 2,443,322 164,841 3,265,743 3,292,570
Net assets of the endowment, beginning of year 3,374,635 15,456,102 3,756,568 22,587,305 19,294,735
NET ASSETS OF THE ENDOWMENT, end of year $ 4,032,215 $ 17,899,424 $ 3,921,409 $ 25,853,048 $ 22,587,305
The accompanying notes are an integral part of the financial statements.
For the year ended
June 30

Financial statements Harvard University 31
For the year ended
June 30
Statements of cash flows
In thousands of dollars 2005 2004CASH FLOWS FROM OPERATING ACTIVITIES:Change in net assets $ 3,621,180 $ 3,840,985Adjustments to reconcile change in net assets to net cash provided by/(used by) operating activities:
Provision for depreciation 196,563 182,138Increase in pension and retirement obligations 53,117 65,029Increase in interests in perpetual trusts held by others (6,640) (29,960)Increase in liabilities due under life income fund agreements 75,974 72,723Net gain on sale of investments (2,980,921) (2,157,674)Net unrealized appreciation on investments (1,417,186) (2,069,157)Gifts restricted for capital purposes (372,830) (352,870)
Changes in operating assets and liabilities:Working capital investments (516,817) (984,589)Receivables, net (12,504) 40,344Prepayments and deferred charges (13,124) 1,574Pledges receivable, net 76,960 10,912Accounts payable (36,299) 22,467Deposits and other liabilities 62,503 36,605
NET CASH PROVIDED BY/(USED BY) OPERATING ACTIVITIES (1,270,024) (1,321,473)
CASH FLOWS FROM INVESTING ACTIVITIES:Loans made to students, faculty, and staff (52,184) (51,425)Payments received on student, faculty, and staff loans 42,406 53,498 Increase in other notes receivable (2,605) (296)Proceeds from sale of investments 27,778,809 33,928,651Purchase of investments (17,741,834) (26,116,555)Additions to fixed assets (525,504) (482,609)NET CASH PROVIDED BY/(USED BY) INVESTING ACTIVITIES 9,499,088 7,331,264
CASH FLOWS FROM FINANCING ACTIVITIES:Proceeds from issuance of debt 629,901 371,913Debt repayments (385,486) (14,109)Gifts restricted for capital purposes 372,830 352,870Advances under security lending agreements 5,897,964 15,708,183Payments under security lending agreements (14,584,081) (22,771,455)Increase in government loan advances 811 590NET CASH PROVIDED BY/(USED BY) FINANCING ACTIVITIES (8,068,061) (6,352,008)
NET CHANGE IN CASH AND CASH EQUIVALENTS 161,003 (342,217)
Cash and cash equivalents, beginning of year 1,404,626 1,746,843
CASH AND CASH EQUIVALENTS, end of year $ 1,565,629 $ 1,404,626
The accompanying notes are an integral part of the financial statements.

32 Harvard University
Notes to financial statements
Harvard University (the “University”) is a private, not-for-profit institution of higher education with approximately6,950 undergraduate and 12,780 graduate students.Established in 1636, the University includes the Faculty of Arts and Sciences, ten graduate and professionalSchools, the Radcliffe Institute for Advanced Study, theDivision of Continuing Education, a variety of researchmuseums and institutes, and an extensive library systemto support the teaching, learning, and research activities
of the Harvard community. The President and Fellows ofHarvard College (the “Corporation”), a governing board ofthe University, has oversight responsibility for all of theUniversity’s financial affairs. The Corporation delegatessubstantial authority to the Schools and departments for themanagement of their individual resources and operations.
The consolidated financial statements include the activitiesof Harvard University as a whole, including all significantaffiliated organizations.
For the purposes of financial reporting, the Universityclassifies resources into three net asset categories pursuant to any donor-imposed restrictions and applicablelaw. Accordingly, the net assets of the University are classified and defined in the accompanying financialstatements in the categories that follow.
Permanently restricted net assets are subject to donor-imposed stipulations that they be invested to providea perpetual source of income to the University. Generally,donors of these assets require the University to maintainand invest the original contribution in perpetuity, but permit the use of some or all investment earnings forgeneral or specific purposes.
Temporarily restricted net assets are subject to legal or donor-imposed stipulations that will be satisfied eitherby actions of the University, the passage of time, or both.These net assets include gifts donated for a particular purpose, amounts subject to time restrictions such asfunds pledged for future payment, or amounts subject tolegal restrictions such as portions of otherwise unrestrictedcapital appreciation, which must be reported as temporarilyrestricted net assets in accordance with Massachusetts law.
Unrestricted net assets are not subject to donor-imposedrestrictions. Funds invested in fixed assets and fundsfunctioning as endowment comprise 74% of unrestrictednet assets. In addition, this category includes unrestrictedgifts and endowment income balances, University-designated loan funds, and other unrestricted designatedand undesignated current funds (see Notes 9 and 13).
Revenues earned, expenses incurred, and income distributed for operations for the purpose of conductingresearch and the programs and services of the Universityare presented as “Net revenue” in the Statements ofChanges in Net Assets with General Operating AccountDetail. Net revenue is the measure of operating activity of the University.
Revenue from sources other than contributions are generally reported as increases in unrestricted net assets.Expenses are reported as decreases in unrestricted netassets. Income earned by restricted fund and gift accountsis initially classified as temporarily restricted net assets andis reclassified as unrestricted net assets when expenses areincurred for their intended purpose.
Unconditional pledges are reported as increases in theappropriate categories of net assets in accordance withdonor restrictions (see Note 7). Gains and losses oninvestments are reported as increases or decreases inunrestricted net assets unless their use is restricted byexplicit donor stipulations or by law. Expirations of temporary restrictions on net assets are reported as reclassifications from temporarily restricted to unrestrictednet assets and appear as “Net assets released from restrictions” and “Non-operating net assets released fromrestrictions” in the Statements of Changes in Net Assets.Funds transferred to the University on behalf of specificbeneficiaries are reported as agency transactions in theBalance Sheets and are not included in the Statements of Changes in Net Assets.
1 . U N I V E R S I T Y O R G A N I Z AT I O N
2 . S U M M A R Y O F S I G N I F I C A N T A C C O U N T I N G P O L I C I E S

Notes to financial statements Harvard University 33
The Balance Sheets display both the assets and corre-sponding liabilities generated by securities lending transactions. These transactions are executed to supportthe investment activities of Harvard ManagementCompany. The University also separately reports the fairvalue of assets for which counterparties have the right topledge or exchange the collateral they have received;assets of the investment portfolio that are unencumberedare reported as “Investment portfolio, at market” in theBalance Sheets.
The University’s vast array of museums and librarieshouses priceless works of art, historical treasures, literaryworks and artifacts. These collections are protected andpreserved for public exhibition, education, research, andthe furtherance of public service. They are neither disposed of for financial gain nor encumbered in anymanner. Accordingly, such collections are not recorded or capitalized for financial statement purposes.
There are certain trusts, held by third parties, in whichHarvard has an interest where the University has notbeen provided with sufficient documentation to recordthe interest. The University’s policy is to record suchinterest when it is estimable and adequate information is obtained.
The University, together with the Harvard-affiliated teachinghospitals, has formed a captive insurance company thatarranges and provides professional liability, general liability,and medical malpractice insurance for its shareholders.Defined portions of claims paid by this company are self-insured. The University also maintains self-insurance programs for automobile liability, property, and workers’compensation. All these programs are supplemented with commercial excess insurance above the University’s self-insured retention. In addition, the University is
self-insured for unemployment, life insurance, disability,the primary senior health plan, and, as of January 1, 2005,all health plans for active employees. The University’sclaims liabilities are recognized as claims are incurred,including claims incurred but not reported, and areincluded in operating expenses.
The University is a tax-exempt organization under Section 501(c)(3) of the Internal Revenue Code.
The preparation of financial statements in accordancewith generally accepted accounting principles requiresmanagement to make estimates and assumptions thataffect reported amounts and disclosures. Actual resultscould differ from those estimates. The financial statementsinclude certain prior year summarized comparative information in total but not by net asset class. Such information does not include sufficient detail to constitutea presentation in conformity with generally acceptedaccounting principles. Accordingly, such informationshould be read in conjunction with the University’s financial statements for the year ended June 30, 2004,from which the summarized information was derived.Certain prior year amounts have been reclassified to conform to current year presentation.

34 Harvard University Notes to financial statements
3 . P O O L E D G E N E R A L I N V E S T M E N T S
The following are the significant accounting policies ofthe University related to pooled general investments:
a) Investments are presented at fair market value basedon trade date positions as of June 30. Instruments listedor traded on a securities exchange are valued at the lastsale price on the primary exchange where the security istraded. Investments in publicly traded securities that aresubject to restrictions limiting their salability are discountedfrom the current public market price to levels that reflectthe estimated cost of those restrictions. Non-exchangetraded debt instruments are valued using independentpricing services or by broker/dealers who actively makemarkets in these securities. Options contracts, forwardcontracts, interest rate exchange agreements, and interestrate cap and floor agreements are valued using modelswith externally verifiable model inputs, or by using independent broker quotes. Private equity, real estate,commodities, and absolute return funds consist primarilyof investments that are not readily marketable. Investmentsin these categories, which are managed externally, are valued utilizing the most current information provided by the general partner. Direct investments are valued utilizing discounted cash flow and other industry standardmethodologies. Where applicable, independent appraisersand engineers are utilized to assist in the valuation. Thesevalues are determined under the direction of, and subjectto approval by, the Valuation Committee of the HarvardManagement Company Board of Directors.
b) The preparation of financial statements requires management to make estimates and assumptions aboutthe effects of matters that are inherently uncertain. Theaccounting policies considered potentially significant inthis respect are the valuation of derivative instruments,absolute return funds, private equities, real estate, and certain commodities. Values for these instruments areoften estimated using techniques such as discounted cashflow analysis and comparisons to similar instruments.Estimates developed using these methods are subjectiveand require judgment regarding significant matters suchas the amount and timing of future cash flows and theselection of discount rates that appropriately reflect marketand credit risks. Estimates, by their nature, are based on judgment and available information. Changes inassumptions could have a significant effect on the fairvalue of these instruments. Actual results could differfrom these estimates and could have a material impact onthe financial statements.
c) The University amortizes bond premiums and accretesbond discounts.
d) The University utilizes a number of subsidiary entitiesto support the investment activities of the endowment.The consolidated financial statements include all assetsand liabilities associated with these entities.
e) The collateral advanced under security borrowing agreements is in the form of cash. The minimum collateralthe University requires by contract on each stock loan andrepurchase agreement is 100% of the market value of thesecurity loaned. Collateral is moved as is required by fluctuations in the market value of the security loaned.
The University's investment strategy incorporates a diversified asset allocation approach and maintains, withindefined limits, exposure to the movements of the worldequity, fixed-income, commodities, real estate, and privateequity markets. A core investment portfolio is structuredto mirror the market exposures defined by the PolicyPortfolio and is considered to be “unhedged” as representedby “Total investments” in the following table. The PolicyPortfolio is the long-term asset mix that is most likely tomeet the University’s long-term return goals with theappropriate level of risk. It serves as the benchmarkagainst which the performance of the actual portfolio ismeasured. In addition, the University seeks to enhance thereturns of certain asset classes through strategies designedto capture mispricings in specific financial instrumentswithout changing the fundamental risk profile of the coreinvestment account. These strategies generally involve several distinct but highly correlated financial instrumentsthat are weighted to neutralize market risk. Depending onthe characteristics of the financial instruments, the specificpositions within a given strategy may be recorded on theasset or liability sections of the following table.
The following table delineates securities pledged to counterparties, where the counterparty has the right, by contract or custom, to sell or repledge the securities. The fair value of collateral pledged to counterparties thatcannot be sold or repledged as of June 30, 2005 was$967.9 million and as of June 30, 2004 was $688.5 million. The fair value of collateral accepted by theUniversity as of June 30, 2005 was $4,468.6 million andas of June 30, 2004 was $3,757.1 million. The portion ofthis collateral that was sold or repledged as of June 30,2005 was $3,007.7 million and as of June 30, 2004 was$1,020.8 million.
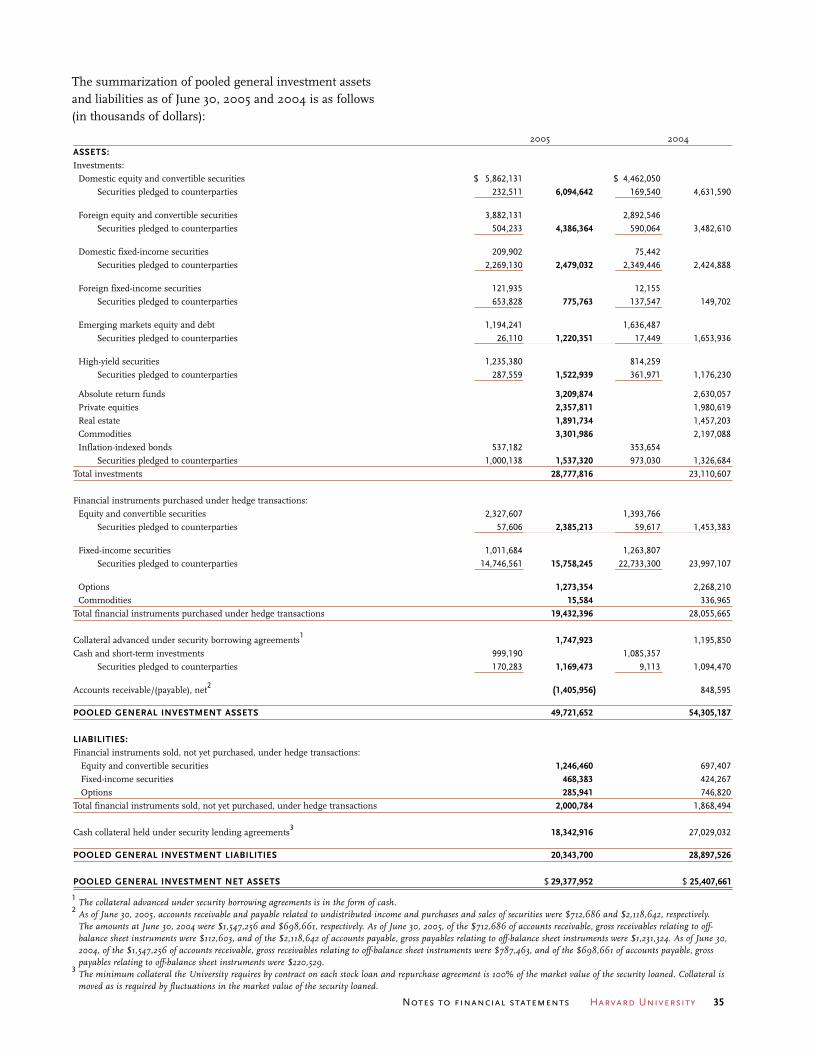
Notes to financial statements Harvard University 35
The summarization of pooled general investment assetsand liabilities as of June 30, 2005 and 2004 is as follows(in thousands of dollars):
1The collateral advanced under security borrowing agreements is in the form of cash.
2As of June 30, 2005, accounts receivable and payable related to undistributed income and purchases and sales of securities were $712,686 and $2,118,642, respectively. The amounts at June 30, 2004 were $1,547,256 and $698,661, respectively. As of June 30, 2005, of the $712,686 of accounts receivable, gross receivables relating to off-balance sheet instruments were $112,603, and of the $2,118,642 of accounts payable, gross payables relating to off-balance sheet instruments were $1,231,324. As of June 30, 2004, of the $1,547,256 of accounts receivable, gross receivables relating to off-balance sheet instruments were $787,463, and of the $698,661 of accounts payable, gross payables relating to off-balance sheet instruments were $220,529.
3The minimum collateral the University requires by contract on each stock loan and repurchase agreement is 100% of the market value of the security loaned. Collateral is moved as is required by fluctuations in the market value of the security loaned.
2005 2004
ASSETS:
Investments:
Domestic equity and convertible securities $ 5,862,131 $ 4,462,050
Securities pledged to counterparties 232,511 6,094,642 169,540 4,631,590
Foreign equity and convertible securities 3,882,131 2,892,546
Securities pledged to counterparties 504,233 4,386,364 590,064 3,482,610
Domestic fixed-income securities 209,902 75,442
Securities pledged to counterparties 2,269,130 2,479,032 2,349,446 2,424,888
Foreign fixed-income securities 121,935 12,155
Securities pledged to counterparties 653,828 775,763 137,547 149,702
Emerging markets equity and debt 1,194,241 1,636,487
Securities pledged to counterparties 26,110 1,220,351 17,449 1,653,936
High-yield securities 1,235,380 814,259
Securities pledged to counterparties 287,559 1,522,939 361,971 1,176,230
Absolute return funds 3,209,874 2,630,057
Private equities 2,357,811 1,980,619
Real estate 1,891,734 1,457,203
Commodities 3,301,986 2,197,088
Inflation-indexed bonds 537,182 353,654
Securities pledged to counterparties 1,000,138 1,537,320 973,030 1,326,684
Total investments 28,777,816 23,110,607
Financial instruments purchased under hedge transactions:
Equity and convertible securities 2,327,607 1,393,766
Securities pledged to counterparties 57,606 2,385,213 59,617 1,453,383
Fixed-income securities 1,011,684 1,263,807
Securities pledged to counterparties 14,746,561 15,758,245 22,733,300 23,997,107
Options 1,273,354 2,268,210
Commodities 15,584 336,965
Total financial instruments purchased under hedge transactions 19,432,396 28,055,665
Collateral advanced under security borrowing agreements1
1,747,923 1,195,850
Cash and short-term investments 999,190 1,085,357
Securities pledged to counterparties 170,283 1,169,473 9,113 1,094,470
Accounts receivable/(payable), net2 (1,405,956) 848,595
POOLED GENERAL INVESTMENT ASSETS 49,721,652 54,305,187
LIABILITIES:
Financial instruments sold, not yet purchased, under hedge transactions:
Equity and convertible securities 1,246,460 697,407
Fixed-income securities 468,383 424,267
Options 285,941 746,820
Total financial instruments sold, not yet purchased, under hedge transactions 2,000,784 1,868,494
Cash collateral held under security lending agreements3
18,342,916 27,029,032
POOLED GENERAL INVESTMENT LIABILITIES 20,343,700 28,897,526
POOLED GENERAL INVESTMENT NET ASSETS $ 29,377,952 $ 25,407,661

36 Harvard University Notes to financial statements
The University uses a variety of financial instrumentswith off-balance sheet risk involving contractual or optionalcommitments for future settlement. These includefutures, options, interest rate exchange agreements, interestrate cap and floor agreements, and forward purchase andsale agreements, which are exchange traded or executedover the counter. These instruments are primarily used inthe arbitrage strategies that enhance the returns of certain asset classes without increasing the market risk tothe underlying asset class (see “hedged” market exposurein the following tables). The market risk of a strategy isinfluenced by the relationship between the financialinstruments with off-balance sheet risk and the offsettingpositions recorded on the Balance Sheets. The Universitycontrols market risk through the use of industry standardanalytical tools that measure the market exposure of each
position within a strategy. The strategies are monitoreddaily and positions are frequently adjusted in response tochanges in the financial markets. Financial instrumentswith off-balance sheet risk are also used by the Universityto adjust the market exposure of a given asset class with-out changing the underlying instruments in the coreinvestment portfolio (see “unhedged” market exposure in the following tables).
The following table summarizes the market exposure(expressed in cash market equivalents as discussed on thefollowing page), net ending fair value, net average fairvalue, and credit exposure relative to the financial instru-ments with off-balance sheet risk as of June 30, 2005 (inthousands of dollars):
Net ending fair value of Net
Market exposure off-balance sheet p0sitions average
Long Long Short fair Credit
unhedged hedged hedged Unhedged Hedged value exposure*
Equity futures $ 225,450 $ 0 $ (566,336) $ 0 $ 1,148 $ 1,071 $ 40,026
Equity options 26,133 128,171 (159,872) 26,133 34,952 55,472 3,746
Equity exchange agreements 583,699 8,521 (809,079) 27,993 (18,302) 10,526 856
Total equity instruments 835,282 136,692 (1,535,287) 54,126 17,798 67,069 44,628
Fixed-income futures 0 0 (225,459) 0 321 253 321
Fixed-income options 0 473,098 (3,124,060) 0 379,164 572,964 274
Interest exchange agreements 124,678 1,901,762 (18,683,492) 1,079 (953,654) (350,508) 0
Interest rate caps and floors 119,853 9,688,425 (1,848,720) 3,022 94,832 267,012 1,784
Total fixed-income instruments 244,531 12,063,285 (23,881,731) 4,101 (479,337) 489,721 2,379
Commodity futures 0 0 (77,613) 0 0 0 398
Commodity options 0 9 (10) 0 (60) 25,926 0
Commodity exchange agreements 1,168,997 0 (34,806) 0 183 9,125 80
Total commodity instruments 1,168,997 9 (112,429) 0 123 35,051 478
Currency forwards 1,028,901 973,103 (2,009,843) (7) (7,833) (6,353) 974
Currency options 0 2,554,030 (509,310) 0 236,159 376,085 0
TOTAL $ 3,277,711 $ 15,727,119 $ (28,048,600) $ 58,220 $ (233,090) $ 961,573 $ 48,459
* Credit exposures primarily represent cash or securities advanced by the University to meet legal margin requirements in connection with future,forward, and option contracts.

Notes to financial statements Harvard University 37
The following table summarizes the market exposure(expressed in cash market equivalents as discussedbelow), net ending fair value, net average fair value and
credit exposure relative to the financial instrumentswith off-balance sheet risk as of June 30, 2004 (in thousands of dollars):
Net ending fair value of Net
Market exposure off-balance sheet p0sitions average
Long Long Short fair Credit
unhedged hedged hedged Unhedged Hedged value exposure*
Equity futures $ 228,150 $ 7,610 $ (848,357) $ 0 $ (188) $ 3,164 $ 52,963
Equity options 11,857 87,014 (38,055) 11,857 26,524 43,943 1,026
Equity exchange agreements 333,440 31,492 (268,753) (15,521) 17,544 8,954 377
Total equity instruments 573,447 126,116 (1,155,165) (3,664) 43,880 56,061 54,366
Fixed-income futures 29,411 114,356 (320,653) 0 20 (416) 1,800
Fixed-income options 531 1,828,160 (5,809,972) 2,023 712,500 676,278 2,651
Interest exchange agreements 314,976 7,074,374 (33,870,004) 968 571,309 (628,713) 805
Interest rate caps and floors 7,894 17,843,634 (1,558,156) 20,684 328,015 481,597 3,301
Total fixed-income instruments 352,812 26,860,524 (41,558,785) 23,675 1,611,844 528,746 8,557
Commodity futures 0 0 (86,369) 0 0 0 1,661
Commodity options 0 122,694 (273,490) 0 84,818 29,206 13
Commodity exchange agreements 880,000 547,438 (490,189) 0 92,133 200 4,988
Total commodity instruments 880,000 670,132 (850,048) 0 176,951 29,406 6,662
Currency forwards 1,071,187 2,075,857 (3,127,351) 7,121 12,572 5,905 73
Currency options 0 5,210,907 (1,860,145) 0 448,477 580,751 1,071
Private put agreements related to
real estate investments 5,000 0 0 0 0 0 0
TOTAL $ 2,882,446 $ 34,943,536 $ (48,551,494) $ 27,132 $ 2,293,724 $ 1,200,869 $ 70,729
* Credit exposures primarily represent cash or securities advanced by the University to meet legal margin requirements in connection with future,forward, and option contracts.
Financial instruments with off-balance sheet risk arerecorded on the balance sheet at fair value. Fair value isa function of the characteristics of the individual financialinstruments and their relationship to current marketconditions, as well as the length of time each instrumenthas been held. For example, domestic futures contracts,which expire periodically, are subject to daily cash settlements and, as such, the end-of-day fair value ofthese contracts is zero. In contrast, interest rate exchangeagreements may be held for the life of a strategy and mayreflect significant unrealized gains and losses dependingon the change in value since the inception of the contract.The cash market equivalent of exposure represents thenotional value of the off-balance sheet instrumentadjusted for its correlation to its underlying index orasset. Market exposure is only meaningful when relatedto the corresponding positions recorded on the BalanceSheets. Fair value and market exposure do not accurately
measure risk. A more appropriate indicator of marketrisk is the net exposure of all positions (on- and off-balance sheet) expressed in market-risk equivalents, or value at risk.
Financial instruments with off-balance sheet risk necessarily involve counterparty credit exposure. The policy of the University is to require collateral to the maximum extent possible under normal trading practices. Collateral is moved on a daily basis as isrequired by fluctuations in the market. The collateral is generally in the form of debt obligations issued bythe U.S. Treasury. In the event of counterparty default,the University has the right to use the collateral to offset the loss associated with the replacements of the agreements. The University enters into arrangementsonly with counterparties believed to be creditworthy.

38 Harvard University Notes to financial statements
The University’s investment holdings as of June 30, 2005 and 2004 are summarized in the following tables(in thousands of dollars):
2005 2004
2005 2004
4. I N V E S T M E N T H O L D I N G S
Specific credit limits are established for counterparties,based on their individual credit ratings. Credit limits aremonitored daily and are adjusted according to policy.
The asset allocation of the University’s portfolio involvesexposure to a diverse set of markets. The investmentswithin these markets involve various risks such as interestrate, market, sovereign, and credit risks. The Universityanticipates that the value of its investments may, fromtime to time, fluctuate substantially as a result of these risks.
The University has entered into debt service put agree-ments in connection with its real estate investments.Under specific circumstances, these put agreementsgrant those who lend to certain investments held in theseportfolios the right to sell senior secured loans to theUniversity at a designated price. These put agreementshave been valued by the University under policies previouslydescribed. The University has also entered into agreements,
primarily with private equity partnerships, that requireperiodic cash contributions totaling approximately$3,461.2 million through fiscal 2015.
For the year ended June 30, 2005, the total return on the pooled general investments was 19.2%, or $4,777.6million, net of all expenses and fees, and including theimpact of revenue-sharing agreements with certain fundmanagers. This compares with 21.1%, or $4,391.7 million,in fiscal 2004 (see Note 4).
Subsequent to June 30, 2005, the University entered intoan agreement to sell a significant portion of timber assetsin a single transaction.
* Short-term investments include working capital investments and cash and cash equivalents. Cash and cash equivalents of $1,565,629 and $1,404,626 as of June 30, 2005 and 2004, respectively, consist principally of funds deposited in cash management accounts with maturities when purchased of fewer than 90 days.
Pooledgeneral Other
investments investments Total TotalShort-term investments* $ 3,408,911 $ 540,499 $ 3,949,410 $ 3,271,590Investment portfolio 26,364,782 54,203 26,418,985 24,472,444Securities pledged to counterparties 19,947,959 0 19,947,959 27,401,077Securities lending and other liabilities associated
with the investment portfolio (20,343,700) 0 (20,343,700) (28,897,526)
TOTAL INVESTMENT HOLDINGS $ 29,377,952 $ 594,702 $ 29,972,654 $ 26,247,585
Investment holdings are comprised of:
Pooledgeneral Other
investments investments Total TotalShort-term investments* $ 3,408,911 $ 540,499 $ 3,949,410 $ 3,271,590Endowment investments 25,192,841 28,963 25,221,804 21,898,372Life income fund investments 612,218 463,673 1,075,891 906,600Pension investments, internally designated 24,574 0 24,574 26,772Postretirement health investments, internally designated 125,997 0 125,997 97,913Other investments, principally interest rate swaps 13,411 (438,433) (425,022) 46,338
TOTAL INVESTMENT HOLDINGS $ 29,377,952 $ 594,702 $ 29,972,654 $ 26,247,585

Notes to financial statements Harvard University 39
The major components of receivables, net of reserves fordoubtful accounts of $3.7 million and $2.5 million, as ofJune 30, 2005 and 2004, respectively, were as follows (in thousands of dollars):
2005 2004Investment income $ 8,953 $ 0U.S. Government,
principally related to research 38,562 36,080Non-federal sponsored research 6,343 5,044Students 10,614 9,102Other 107,144 108,886
TOTAL RECEIVABLES, NET $ 171,616 $ 159,112
5 . R E C E I VA B L E S
The University employs a unit method of accounting for pooled general investments. Each participating fundenters into and withdraws from the pooled investmentaccount based on monthly unit market values. Changes inthe market value of investments are distributed proportion-ately to each fund that participates in the investment pool.Net general investment income distributed during the
year is allocated on a per unit basis to each participatingfund (see Note 3).
The changes in the market value and income of partici-pating units for the years ended June 30, 2005 and 2004were as follows:
2005 2004Unit value at end of year $ 1,425.68 $ 1,215.68Unit value at beginning of year 1,215.68 1,013.51
Change in realized and unrealized appreciation 210.00 202.17Net income earned on general investments 21.16 10.79
TOTAL UNIT RETURN ON POOLED GENERAL INVESTMENTS* $ 231.16 $ 212.96
TOTAL UNIT RETURN PERCENTAGE USING MONTHLY COMPOUNDING* 19.2% 21.1%
Other investments are managed separately from thepooled general investment account. These investmentsconsist primarily of interest rate exhange agreements(interest rate swaps), fixed-income securities (principallygovernment securities and certificates of deposit held forthe University’s working capital needs) and various managed bond and equity portfolios associated with life
income funds. Those investments that are not readilymarketable are carried either at cost or a nominal value.Income on other investments is recorded and distributedwhen received.
A summary of the University’s total return on invest-ments is presented below (in thousands of dollars):
2005 2004Return on pooled general investments:
Realized and unrealized gains $ 4,339,695 $ 4,169,484Investment income 437,903 222,224
Total return on pooled general investments 4,777,598 4,391,708Other investment income and gains/(losses) (363,711) 104,499
TOTAL RETURN ON INVESTMENTS* $ 4,413,887 $ 4,496,207
* Net of all fees and expenses, and including the impact of revenue-sharing agreements with certain fund managers.
* Net of all fees and expenses, and including the impact of revenue-sharing agreements with certain fund managers.

40 Harvard University Notes to financial statements
Unconditional promises to donate to the University in the future are recorded as pledges receivable in the yearspromised at the present value of expected cash flows, netof an allowance for uncollectible pledges. Pledges receivableincluded in the financial statements as of June 30, 2005and 2004 are expected to be realized as follows (in thousands of dollars):
2005 2004Within one year $ 97,501 $ 106,797Between one and five years 390,002 427,187More than five years 240,768 275,599Less: discount and allowance for
uncollectible pledges (83,428) (87,780)
TOTAL PLEDGES RECEIVABLE, NET $ 644,843 $ 721,803
A discount of $36.2 million and $42.4 million for theyears ended June 30, 2005 and 2004, respectively, wascalculated using a discount factor based on the appropriateU.S. Treasury Note rate.
Pledges receivable have been designated for the followingpurposes (in thousands of dollars):
2005 2004Gifts for current use $ 130,250 $ 134,723Non-federal sponsored research 101,049 108,154Loan funds and facilities 34,217 35,270General Operating Account balances 265,516 278,147
Endowment 379,327 443,656
TOTAL PLEDGES RECEIVABLE, NET $ 644,843 $ 721,803
Because of uncertainties with regard to their realizabilityand valuation, bequest intentions and other conditionalpromises are not estimated by management and are recognized as assets if and when the specified conditionsare met.
7 . P L E D G E S R E C E I VA B L E
Notes receivable as of June 30, 2005 and 2004 were asfollows (in thousands of dollars):
2005 2004Student notes receivable:
Government revolving loans $ 60,586 $ 63,211Institutional loans 59,984 52,251Federally insured loans 8,019 13,149
Total student notes receivable 128,589 128,611
Faculty and staff notes receivable 118,794 108,994Other notes receivable 22,161 19,556
TOTAL NOTES RECEIVABLE, NET $ 269,544 $ 257,161
In addition to administering institutional loan programs,the University participates in various federal loan programs.Federally insured loans are generally repaid over a ten-year period and earn interest at an adjustable rate thatapproximates the 90-day U.S. Treasury Bill rate plus 3.0%.Principal and interest payments on these loans are insuredby the American Student Assistance Corporation and arereinsured by the federal government.
Government revolving loans are funded principally withfederal advances to the University under the Perkins LoanProgram and certain other programs. These advancestotaled $56.9 million and $56.0 million as of June 30,2005 and 2004, respectively, and are classified as liabilities.Interest earned on the revolving and institutional loanprograms is reinvested to support additional loans. Therepayment and interest rate terms of the institutionalloans vary considerably.
Notes receivable under federally guaranteed student loan programs are subject to significant restrictions.Accordingly, it is not practicable to determine the fairvalue of such notes receivable.
Notes receivable from faculty and staff are comprised primarily of mortgages and educational loans. Mortgagesinclude shared appreciation loans and loans that bearinterest at the applicable federal rate. In addition, certainmortgages bear interest at the current market rate, whichmay be subsidized for an initial period. The educationalloans are primarily zero-interest loans.
6. N O T E S R E C E I VA B L E

Notes to financial statements Harvard University 41
8 . F I X E D A S S E T S
Fixed assets are shown at cost or at fair value as of the date of the gift, net of accumulated depreciation.Depreciation is computed using the straight-line methodover the estimated useful lives of the assets.
The major categories of fixed assets as of June 30, 2005and 2004 are summarized as follows (in thousands ofdollars):
Estimateduseful life
2005 2004 (in years)Housing facilities $ 811,923 $ 798,881 35Research facilities 1,244,856 1,198,698 *Classroom and office facilities 926,520 751,653 35Libraries 340,711 242,057 35Museums and assembly facilities 210,840 205,579 35Athletic facilities 109,133 106,274 35Service facilities 267,911 200,593 35Other facilities and land 880,943 795,677 **Construction in progress 288,816 328,749 n/aEquipment 401,242 334,999 ***Total fixed assets at cost 5,482,895 4,963,160Less: accumulated depreciation (1,685,057) (1,494,263)
TOTAL FIXED ASSETS, NET $ 3,797,838 $ 3,468,897
* Estimated useful lives of components range from 10 to 45 years.
** The estimated useful life of other facilities is 35 years.
*** Estimated useful lives of equipment range from 3 to 8 years.
Fixed assets include both facilities and equipment.Equipment includes general and scientific equipment,computers, software, furniture, and vehicles.
The costs of research facilities are separated into the shell, roof, finishes, fixed equipment, and services. Thesecomponents are separately depreciated. The average useful life for research facilities is 19 years.
Certain University facilities are subject to restrictions asto use, structural modifications, and ownership transfer.
9. E N D O W M E N T F U N D S
Harvard’s endowment consists of approximately 10,840separate funds established over many years for a widevariety of purposes. Endowment fund balances, includingfunds functioning as endowment, are classified andreported as either permanently restricted, temporarilyrestricted, or unrestricted net assets, in accordance withdonor specifications. Net unrealized losses on permanentlyrestricted endowment funds are classified as a reductionto unrestricted net assets until such time as the marketvalue equals or exceeds book value. Although funds functioning as endowment are not subject to permanentdonor restrictions, decisions to spend their principal
require the approval of the Corporation. All but a smallfraction of the endowment is invested in the pooled general investment account (see Notes 3 and 4).
The University is also the beneficiary of certain perpetualtrusts held and administered by others. The estimated fairvalues of trust assets, which approximate the present valuesof expected future cash flows from the trusts, are recognizedas assets and revenue when the trusts are established.

42 Harvard University Notes to financial statements
Endowment funds as of June 30, 2005 and 2004 aresummarized below (in thousands of dollars):
2005 2004Temporarily Permanently
Unrestricted restricted restricted Total TotalEndowment funds $ 0 $ 15,581,397 $ 3,366,898 $ 18,948,295 $ 16,593,304
Funds functioning as endowment:Departmental funds 3,065,149 2,123,010 0 5,188,159 4,400,661University funds 967,066 118,284 0 1,085,350 904,407
Pledge balances 0 76,733 302,594 379,327 443,656Interests in perpetual trusts held by others 0 0 251,917 251,917 245,277
TOTAL ENDOWMENT FUNDS $ 4,032,215 $ 17,899,424 $ 3,921,409 $ 25,853,048 $ 22,587,305
The University’s endowment income distribution policiesare designed to preserve the value of the endowment inreal terms (after inflation) and to generate a predictablestream of spendable income. Endowment investmentsare managed to achieve the maximum long-term totalreturn. As a result of this emphasis on total return, theproportion of the annual income distribution funded bydividend and interest income or by capital gains may varysignificantly from year to year. Amounts withdrawn fromendowment capital gains to fund the fiscal 2005 and 2004distributions totaled $767.7 million and $644.9 million,respectively.
The portion of investment returns earned on endowmentand distributed each year is based on a rate (stated in dollarsper unit) that is approved by the Corporation. This rate isnot based on a specific formula, nor is it directly tied to
current investment returns. Rather, it reflects expectationsabout long-term returns and inflation rates and seeks tomaintain the distribution rate at between 4.5% and 5.0%of the market value of the endowment. The table belowshows the total return on endowment for the past five fis-cal years, as well as the distribution rate for the followingfiscal years.
Endowment income capitalized to endowment principalis available to meet future spending needs, subject to theapproval of the Corporation.
Endowment investment returns (dollar amounts in thousands) Distribution rate1,2
Fiscal Interest and Net Total Total As a % ofyear dividends appreciation return3 return %2,3 Per unit market value2005 $ 371,896 $ 3,673,064 $ 4,044,960 19.2% $ 60.99 4.3%2004 192,843 3,607,677 3,800,520 21.1 54.17 4.52003 252,524 1,807,171 2,059,695 12.5 49.70 4.92002 378,999 (474,416) (95,417) (0.5) 47.11 5.12001 354,368 (844,638) (490,270) (2.7) 45.32 4.8
FIVE-YEAR TOTAL $ 1,550,630 $ 7,768,858 $ 9,319,488
1Since current year interest and dividends are used to fund the following year’s distribution, these represent distribution rates for the following fiscal year.2Total return %, distribution rate per unit, and distribution rate as a % of market value are calculated in relation to pooled general investments.3Total return and total return % are net of all expenses and fees, and include the impact of revenue-sharing agreements with certain fund managers.

Notes to financial statements Harvard University 43
10 . L I F E I N C O M E F U N D S
As of June 30, 2005, the University held life income funds—pooled funds, gift annuities, and charitable remaindertrusts—for approximately 1,900 donors. These funds areheld in trust for one or more beneficiaries, and generallypay lifetime income to those beneficiaries, after which theprincipal is made available to the University in accordancewith donor intentions. When a trust is established, lifeincome fund net assets are recorded at fair market value,net of related liabilities for the present value of estimatedfuture payments due to beneficiaries and net of obligationsunder charitable remainder trusts due to other institutions.
As of June 30, 2005, life income fund assets totaled$1,075.9 million, with corresponding liabilities foramounts due to beneficiaries of $473.7 million andamounts due to other institutions of $94.4 million. Gifts for capital to life income funds are presented at fullvalue. The discounted present value of these gifts was$27.6 million and $23.1 million for fiscal 2005 and 2004,respectively. The changes in life income fund net assetsfor fiscal 2005 and 2004 were as follows (in thousands of dollars):
2005 2004Temporarily Permanently
restricted restricted Total TotalGifts for capital (Note 16) $ 21,659 $ 54,275 $ 75,934 $ 65,313
Investment return:Investment income 9,230 18,585 27,815 19,629Change in realized and unrealized appreciation 44,375 89,359 133,734 98,771
Total investment return 53,605 107,944 161,549 118,400
Payments to annuitants (16,706) (33,641) (50,347) (43,568)Life income funds converted to endowment (4,426) (8,070) (12,496) (9,472)Life income funds transferred to General Operating Account (5,335) (14) (5,349) (5,632)Change in liabilities due under life income agreements (24,690) (51,284) (75,974) (72,723)NET INCREASE DURING THE YEAR 24,107 69,210 93,317 52,318
Total life income funds, beginning of year 140,248 274,214 414,462 362,144
TOTAL LIFE INCOME FUNDS, end of year $ 164,355 $ 343,424 $ 507,779 $ 414,462

44 Harvard University Notes to financial statements
Interest payments on a cash basis totaled $94.6 millionand $77.1 million for fiscal 2005 and 2004, respectively.Interest expense was $96.9 million and $76.8 million forfiscal 2005 and 2004, respectively. Excluding maturity of commercial paper and other notes payable, as well asunamortized discounts and premiums, scheduled principal payments are (in thousands of dollars):
11 . B O N D S A N D N O T E S P AYA B L E
*Series N, DD, and FF principal are net of $1.2 million, $1.0 million, and $0.2 million of discounts, respectively. Series Z, AA, and 2005A principal
include premiums of $1.7 million, $0.7 million, and $5.1 million, respectively.
Bonds and notes payable as of June 30, 2005 and 2004are summarized as follows (in thousands of dollars):
Fiscal year Principal payments2006 $ 13,9602007 135,6102008 20,6802009 21,5352010 19,460Thereafter 1,814,645
TOTAL PRINCIPAL PAYMENTS $ 2,025,890
Fiscal Remaining One-yearyear years to effective Outstanding principal
of issue maturity interest rate 2005 2004TAX-EXEMPT BONDS AND NOTES PAYABLE:Variable-rate bonds and notes:
Series L - Weekly 1990 19 4.6% $ 71,140 $ 71,140Series R - Weekly 2000-2005 45 1.7 117,160 103,670Series Y - Weekly 2000 30 5.4 117,905 117,905Series BB - Weekly 2001 29 1.7 196,700 196,700Series HH - Weekly 2004 29 5.8 92,235 92,235Series GG-1 - Weekly 2005 24 4.5 205,935 0
Commercial Paper (Series EE) Various Various 1.7 318,792 519,434Total variable-rate bonds and notes 3.2 1,119,867 1,101,084
Fixed-rate bonds:Series N 1992 15 6.3 78,848* 78,771Series P 1995 27 5.5 103,530 104,730Series Z 2001 11 5.1 101,834* 110,194Series AA 2001 4 5.5 20,025* 24,769Series DD 2002 30 5.0 134,884* 134,852Series FF 2003 32 5.1 275,973* 275,968Series 2005A 2005 31 5.0 94,205* 0Radcliffe College Series 1997 1998 1 4.7 175 575
Total fixed-rate bonds 5.2 809,474 729,859TOTAL TAX-EXEMPT BONDS AND NOTES PAYABLE 4.0 1,929,341 1,830,943
TAXABLE BONDS AND NOTES PAYABLE:Commercial paper Various Various 5.0 413,031 336,977Fixed-rate bonds 1992 2 8.1 115,000 115,000Series CC 2001 26 7.0 247,000 247,000Series GG-2 2005 8 4.5 58,465 0
TOTAL TAXABLE BONDS AND NOTES PAYABLE 6.0 833,496 698,977
OTHER NOTES PAYABLE Various Various Various 86,292 74,794
TOTAL BONDS AND NOTES PAYABLE 4.6% $ 2,849,129 $ 2,604,714
Notes to financial statements Harvard University 45
In fiscal 2005, the University issued $205.9 million intax-exempt weekly variable-rate Series GG-1 bonds and$58.5 million in taxable weekly variable-rate Series GG-2bonds to finance a new research facility. The Series GG-1and Series GG-2 bonds mature in July 2029 and 2013, respectively. Also in fiscal 2005, the University issued$94.2 million (including a premium of $5.1 million) intax-exempt fixed-rate bonds to finance a range ofUniversity capital projects. These Series 2005A bondsmature in 2036.
In fiscal 2005, the sixth tranche of Series R currentrefunding bonds was issued. This tranche totaled $13.5million and brought the total amount outstanding underthis series to $117.2 million. These bonds, which are in a weekly reset variable-rate mode, represent a currentrefunding of tax-exempt principal payments madethroughout the calendar year.
In fiscal 2004, the University initiated its affiliate housingbond program with the issuance of $92.2 million ofSeries HH tax-exempt weekly variable-rate bonds. Also infiscal 2004, the University reauthorized its existing tax-exempt commercial paper program (Series EE). With thisaction, the authorized limit on the program was raisedfrom $300.0 million to $650.0 million.
Based on quoted market prices, the estimated fair value of the University’s outstanding bonds and notes payable,including accrued interest, was $2,837.8 million and$2,582.7 million as of June 30, 2005 and 2004, respectively.
In the event that the University receives notice of anyoptional tender on its variable-rate bonds, or if the bondsbecome subject to mandatory tender, the purchase priceof the bonds will be paid from the remarketing of such bonds. However, if the remarketing proceeds areinsufficient, the University will have a general obligationto purchase the bonds tendered.
In August 2005, the University issued $105.6 million(including a premium of $5.1 million) of tax-exempt fixed-rate bonds. These Series 2005B bonds will mature in2032. The bonds’ proceeds are currently in escrow andwill be used to refund the outstanding Series P bonds in November 2005.
Interest rate exchange agreements The Universityhas entered into various interest rate exchange agreementsin order to convert variable-rate borrowings to a fixed rate,thereby managing the interest cost and risk associatedwith its outstanding debt. The interest rate exchangeagreements were not entered into for trading or speculativepurposes. Under the terms of these agreements, theUniversity pays a fixed rate, determined at inception, andreceives a variable rate on the respective notional principalamounts. Each of these exchanges is collateralized, asdescribed in Note 3. The interest rates in the precedingschedule reflect any applicable exchange agreements.
The fair value of interest rate exchange agreements is theestimated amount that the University would have receivedor (paid), including accrued interest, to terminate theagreements on the dates of the Balance Sheets, taking intoaccount the creditworthiness of the underlying counter-parties. The notional amount and fair value of interestrate exchange agreements were $3,723.8 million and$(461.2) million, respectively, as of June 30, 2005 and$1,376.6 million and $(58.4) million, respectively, as ofJune 30, 2004. The substantial increase in the notionalamount of agreements outstanding reflects that inDecember 2004, the University entered into a series offorward interest rate agreements relating to the fundingof future University capital projects, including planneddevelopment in Allston.
The fair value of these agreements is included in the“Investment portfolio, at market” line in the BalanceSheets. The change in unrealized depreciation that was recognized for the interest rate exchange agreements wasapproximately $402.8 million and $61.7 million for fiscal2005 and 2004, respectively. The loss realized from themonthly settling of these agreements was $35.5 millionand $28.7 million for fiscal 2005 and 2004, respectively. All unrealized and realized gains and losses from interestrate exchange agreements are included in the “Change inappreciation, net of operating distribution” line in theStatements of Changes in Net Assets with General OperatingAccount Detail.

46 Harvard University Notes to financial statements
The accumulated benefit obligation for pension benefitsat June 30, 2005 and 2004 was $565.6 million and$495.7 million, respectively.
12 . E M P L O Y E E B E N E F I T S
The University offers current employees a choice ofhealth plans, dental plans, short-term and long-term disability plans, life insurance, tuition assistance, and a variety of other benefits such as subsidized passes forpublic transportation and for Harvard athletic facilities. In addition, the University has pension plans coveringsubstantially all employees.
The University uses a measurement date of June 30 forits pension and postretirement health plans.
Pension benefits Faculty members and certain long service administrative officers participate in defined contribution plans that are funded on a current basis. All staff and hourly employees are covered by a retirementprogram that includes a defined benefit component, a defined contribution component, or a combination of the two.
In accordance with erisa requirements, the Universityhas established a trust to hold plan assets for its definedbenefit pension plans. The market value of the trust’s assets
was $709.6 million and $640.0 million as of June 30,2005 and 2004, respectively. In addition, the Universityhad internally designated and invested $24.6 million and$26.8 million as of June 30, 2005 and 2004, respectively,for its defined benefit pension plans. The Universityrecorded expenses for its defined contribution plans of$76.8 million and $61.6 million for fiscal 2005 and2004, respectively.
Postretirement health benefits The University provides defined benefit postretirement health coverageand life insurance to substantially all of its employees. As of June 30, 2005, the University had internally designated and invested $126.0 million to fund thepostretirement health benefit accrued liability of $371.8million. As of June 30, 2004, the University had internallydesignated and invested $97.9 million to fund an accruedliability of $316.5 million.
2005 2004 2005 2004In thousands of dollars Pension benefits Other benefitsCHANGE IN PROJECTED BENEFIT OBLIGATION
Benefit obligation at beginning of year $ 580,457 $ 583,588 $ 504,965 $ 491,656Service cost 12,783 14,737 19,368 23,080Interest cost 34,462 34,796 26,554 29,949Plan participants’ contributions 0 0 2,770 2,868Actuarial (gain)/loss 38,537 (18,941) (19,062) (28,247)Benefits paid (33,877) (33,723) (13,849) (14,341)PROJECTED BENEFIT OBLIGATION, end of year $ 632,362 $ 580,457 $ 520,746 $ 504,965

Notes to financial statements Harvard University 47
WEIGHTED-AVERAGE ASSUMPTIONS USED TO DETERMINE BENEFIT OBLIGATIONS AS OF JUNE 30:
Discount rate 5.25% 6.25% 5.25% 6.25%Rate of compensation increase 4.00% 4.00% n/a n/a
WEIGHTED-AVERAGE ASSUMPTIONS USED TO DETERMINE THE NET PERIODIC BENEFIT (INCOME)/COST FOR THE YEARS ENDED JUNE 30:
Discount rate 6.25% 6.00% 6.25% 6.00%Expected return on plan assets for the year 8.00% 7.75% 8.00% 7.75%Rate of compensation increase 4.00% 5.00% 4.00% 5.00%
For measurement purposes, a 9.0% annual rate ofincrease in the per capita cost of covered health care
benefits was assumed for 2006, decreasing gradually to a 5.0% annual rate in 2010 and all years thereafter.
2005 2004 2005 2004In thousands of dollars Pension benefits Other benefitsCHANGE IN PLAN ASSETS
Fair value of plan assets at beginning of year $ 639,952 $ 575,366 $ 0 $ 0Actual return on plan assets 103,564 98,309 0 0Employer contributions 0 0 11,079 11,473Plan participants’ contributions 0 0 2,770 2,868Benefits paid (33,877) (33,723) (13,849) (14,341)FAIR VALUE OF PLAN ASSETS, end of year $ 709,639 $ 639,952 $ 0 $ 0
ACCRUED BENEFIT LIABILITY
Funded status $ 77,277 $ 59,494 $ (520,746) $ (504,965)Unrecognized actuarial (gain)/loss (72,635) (51,632) 89,562 120,987Unamortized unrecognized portion of net obligation at transition 0 0 48,497 54,560Unamortized prior service cost/(credit) (29,216) (34,634) 10,862 12,908ACCRUED BENEFIT LIABILITY $ (24,574) $ (26,772) $ (371,825) $ (316,510)
2005 2004 2005 2004In thousands of dollars Pension benefits Other benefitsCOMPONENTS OF NET PERIODIC BENEFIT (INCOME)/COST
Service cost $ 12,783 $ 14,737 $ 19,369 $ 23,080Interest cost 34,462 34,796 26,554 29,949Expected return on plan assets and reserves (46,686) (48,160) (7,569) (6,083)Amortization of the:
Unrecognized transition obligation 0 0 6,062 6,062Recognized prior service (credit)/cost (5,418) (5,418) 2,046 2,046Recognized actuarial (gain)/loss (2,447) (3,127) 980 6,620
Net periodic benefit (income)/cost (7,306) (7,172) 47,442 61,674
Investment return on invested reserves 5,108 6,068 18,951 15,932TOTAL PERIODIC (INCOME)/COST $ (2,198) $ (1,104) $ 66,393 $ 77,606
Expected Expected Medicarebenefit payments Part D subsidies
In thousands of dollars Pension Other2006 $ 33,254 $ 18,189 $ 1,2882007 33,555 19,717 2,7732008 34,375 21,195 2,9782009 35,442 22,675 3,1752010 36,530 24,189 3,3752011–2015 206,090 148,535 20,911

48 Harvard University Notes to financial statements
The expected return on plan assets is determined by utilizing Harvard Management Company’s capital marketsmodel, which takes into account the expected real return,before inflation, for each of the pension portfolio’s assetclasses, as well as the correlation of any one asset class toevery other asset class. This model runs the real returns andcorrelations and derives an expected real return for theentire portfolio, given the percentage weighting allocated to each asset class.
After calculating the expected real return, an assessment is made to accommodate the expected inflation rate for theforthcoming period. The final expected return on assets isthe aggregate of the expected real return plus the expectedinflation rate.
Assumed health care trend rates have a significant effect on the amounts reported for the health care plan. A one percentage point change in assumed health care trend rateswould have the following effects:
The University’s investment strategy for the pension portfolio is to manage the assets across a broad and diversified range of investment categories, both domesticand international. The objective is to achieve a risk-adjustedreturn that is in line with the long-term obligations thatthe University has to the pension plan beneficiaries. The investment program is also managed to comply withall erisa regulations. The “Other” asset category consistsof absolute return funds, commodities, and cash.
The Medicare Prescription Drug Improvement andModernization Act of 2003 (the “Act”) was signed intolaw in December 2003. The Act provides certain prescrip-tion drug-related benefits for retirees, as well as subsidiesfor employers providing actuarial equivalent subsidies totheir retirees. In January 2004, the Financial AccountingStandards Board (the “fasb”) issued a Staff Position permitting companies to defer accounting for the effectsof the Act. The University elected this deferral for fiscal2004. As such, the University’s postretirement benefitobligation and net periodic postretirement benefit cost asof June 30, 2004 do not reflect the effects of the Act. The University believes that benefits provided to certain
participants will be at least actuarially equivalent toMedicare Part D and, accordingly, the University will beentitled to the Medicare Part D subsidy.
In May 2004, the fasb issued Staff Position fas 106-2,“Accounting and Disclosure Requirements Related to the Medicare Prescription Drug Improvement andModernization Act of 2003” (“fsp 106-2”). fsp 106-2requires that the effects of the federal subsidy be consideredan actuarial gain that is recognized in the same manneras other actuarial gains and losses. It also requires thatemployers who sponsor postretirement health care plans that provide prescription drug benefits make certain disclosures.
The University adopted fsp 106-2 prospectively as of July 1, 2004. The expected subsidy reduced the accumu-lated postretirement benefit obligation at July 1, 2004 by$68.2 million and the net periodic cost for fiscal 2005 by $10.9 million.
2005 2004One percentage One percentage One percentage One percentage
In thousands of dollars point decrease point increase point decrease point increaseEffect on total of service cost and interest cost components $ (8,051) $ 10,522 $ (9,420) $ 12,332Effect on the postretirement benefit obligation (71,540) 89,878 (70,573) 88,900
2006 Target 2005 Actual 2004 ActualASSET ALLOCATION BY CATEGORY FOR THE PENSION PORTFOLIO:
Equity securities 50.0% 50.3% 49.3%Debt securities 20.0 20.1 20.6Real estate 9.0 8.6 8.8Other 21.0 21.0 21.3TOTAL ALL ASSET CATEGORIES 100.0% 100.0% 100.0%

Notes to financial statements Harvard University 49
The General Operating Account (goa) consists of the general or current funds of the University as well as theassets, liabilities, and obligations related to student andfaculty loans and facilities. The goa accepts, manages,and pays interest on deposits made by University departments, invests surplus working capital, makesloans, and arranges external financing for major capitalprojects. It is used to manage, control, and execute all
University financial transactions, except for those relatedto investment activities conducted by the HarvardManagement Company.
The major components of the goa net asset balances as of June 30, 2005 and 2004 are summarized as follows (inthousands of dollars):
2005 2004Temporarily Permanently
Unrestricted restricted restricted Total TotalDepartmental balances:
Unexpended endowment income $ 113,990 $ 505,769 $ 0 $ 619,759 $ 450,509Unexpended gift balances 67,854 206,331 0 274,185 339,311Pledge balances 0 242,786 0 242,786 263,313Loan funds 30,262 0 81,866 112,128 111,035Funds for construction 0 18,486 0 18,486 48,382Funds invested in fixed assets 1,248,158 0 0 1,248,158 1,189,028Other departmental purposes 432,167 0 0 432,167 407,743
Total departmental balances 1,892,431 973,372 81,866 2,947,669 2,809,321
University balances 1,168,736 81,189 0 1,249,925 1,126,153
TOTAL GOA NET ASSET BALANCES $ 3,061,167 $ 1,054,561 $ 81,866 $ 4,197,594 $ 3,935,474
13 . G E N E R A L O P E R AT I N G A C C O U N T
14 . S T U D E N T F I N A N C I A L A I D
Financial aid granted to students in fiscal 2005 and 2004is summarized as follows (in thousands of dollars):
Approximately 65% and 68% of scholarships and other student awards for fiscal 2005 and 2004, respectively,were funded by gifts, endowment income, and sponsored support.
2005 2004Scholarships applied to student income $ 189,000 $ 173,437Scholarships and other student awards paid directly to students 94,116 89,414Total scholarships and other student awards 283,116 262,851
Student employment 56,722 51,866Student loans 26,189 25,255Agency financial aid* 13,740 12,999TOTAL STUDENT FINANCIAL AID $ 379,767 $ 352,971
* Represents aid from sponsors for which the University acts as an agent for the recipient.

50 Harvard University Notes to financial statements
Gifts that are available for current purposes are classifiedas either “Gifts for current use” or “Non-federal sponsoredresearch grants,” as appropriate. Gifts that have beenrestricted by the donor or designated by the Corporationfor construction, loan funds, endowment, or similar purposes are classified as “Gifts for capital.” Gifts for current use, non-federal sponsored research grants, and giftsfor capital are classified as unrestricted, temporarilyrestricted, or permanently restricted net assets in accordance with donor specifications.
Gifts for the years ended June 30, 2005 and 2004 aresummarized as follows (in thousands of dollars):
2005 2004Gifts for current use $ 187,772 $ 153,518Non-federal sponsored research grants 78,442 85,445
Gifts for capital:Endowment funds 285,659 257,767Life income funds* 75,934 65,313Loan funds and facilities 11,237 29,790
Total gifts for capital 372,830 352,870
TOTAL GIFTS $ 639,044 $ 591,833
16 . G I F T S
* Gifts for capital to life income funds are presented at full value.
The discounted present value of these gifts was $27,566 and $23,062
for fiscal 2005 and 2004, respectively.
15 . S P O N S O R E D R E S E A R C H
Total expenditures funded by U.S. government sponsorsor by institutions that subcontract federally sponsoredresearch to the University were $511.1 million and $473.5 million in fiscal 2005 and 2004, respectively.Approximately 95% of federal research support for theyears ended June 30, 2005 and 2004 was received by theMedical School, the School of Public Health, and theFaculty of Arts and Sciences. The University’s principalsource of federal research funds is the Department ofHealth and Human Services. The University also has manynon-federal sources of sponsored support, including corporations, foundations, state and local governments,foreign governments, and research institutes.
Research grants and contracts normally provide for therecovery of direct and indirect costs. The University recognizes revenue associated with direct costs as therelated costs are incurred. Recovery of related indirectcosts is generally recorded at fixed or predetermined ratesnegotiated with the federal government and other sponsors.Predetermined federal indirect cost rates have been established for the University Area, the Medical School,and the School of Public Health through fiscal 2006.Funds received for federally sponsored research activityare subject to audit.

Notes to financial statements Harvard University 51
The major components of other operating income for the years ended June 30, 2005 and 2004 were as follows(in thousands of dollars):
2005 2004Publications $ 75,445 $ 76,901Rental and parking 93,389 78,503Royalties from patents,
copyrights, and trademarks 57,818 50,697Other student income 24,413 20,698Nonstudent health and clinic fees 23,409 23,472Other 141,220 122,425
TOTAL OTHER OPERATING INCOME $ 415,694 $ 372,696
17 . O T H E R O P E R AT I N G I N C O M E
The major components of other expenses for the years ended June 30, 2005 and 2004 were as follows (in thousands of dollars):
2005 2004Services purchased $ 274,355 $ 226,088Subcontract expenses
under sponsored projects 83,441 79,794Travel 53,532 51,779Publishing 39,392 40,702Telephone 10,777 11,110Other 95,389 86,402
TOTAL OTHER EXPENSES $ 556,886 $ 495,875
18 . O T H E R E X P E N S E S
19 . F U N C T I O N A L C L A S S I F I C AT I O N O F E X P E N S E S
Expenses are allocated functionally on a direct basis.Interest, depreciation, and operations and maintenanceexpenses are allocated based on square footage.
Expenses by functional classification for the years endedJune 30, 2005 and 2004 were as follows (in thousands ofdollars):
2005 2004Instruction $ 754,267 $ 709,869Research 624,660 585,709Libraries 173,977 162,781Academic support 225,867 225,804Scholarships and other student awards 94,116 89,414Student services 110,179 101,686Institutional support 451,367 378,449Auxiliary services 322,940 307,207
TOTAL EXPENSES $ 2,757,373 $ 2,560,919

52 Harvard University Notes to financial statements
20. C O M M I T M E N T S A N D C O N T I N G E N C I E S
The University receives funding from federal governmentagencies and private entities for research and other spon-sored activities conducted under grants and contracts.These grants and contracts provide for reimbursement ofdirect and indirect costs. The costs recovered by theUniversity in support of sponsored research are subject to audit and adjustment.
In the spring of 2004, the University together with theHarvard-affiliated teaching hospitals, the MassachusettsInstitute of Technology (mit), and the Whitehead Institutefor Biomedical Research established the Eli and Edythe L. Broad Institute (the “Broad Institute”). The BroadInstitute is a collaborative biomedical research institutewithin mit that is jointly governed by the University, mit,and the Broad Foundation. The Institute is focused onapplying knowledge of the human genome to clinicalmedicine and making such knowledge widely available tothe scientific community.
In connection with the founding of the Broad Institute,the University and mit agreed to strive to jointly raise $20.0 million per year in gifts and non-federal grants andawards to support the Institute’s endeavors. In the eventthis fundraising goal is not reached, the University hasagreed to provide mit with a portion of the shortfall, subject to certain conditions. The University’s obligationfor such payments will not exceed $20.0 million over theinitial five-year term, or $30.0 million in total if the termis extended for a second five years. The University will makepayments and record the corresponding expenses as theseconditions are met. The University had a $4.0 millioncommitment to mit as of June 30, 2005, which wasappropriately recorded as a liability in the financial state-ments. No such commitment existed as of June 30, 2004.
The University and mit will equally share certain laboratory construction fit-out costs for the Broad Institute’snew building, which is expected to be completed in April2006. The University’s portion of these costs is expectedto be approximately $13.0 million. If the University’s participation in the collaboration terminates under certain
circumstances, the University may also be obligated to pay mit up to $5.0 million to compensate mit for expenses incurred in connection with the lease for thenew building. In addition, the University expects to sharewith mit in ongoing facilities improvement costs ofapproximately $4.0 million per year for up to ten years.Some of the University’s contributions to the fit-out andon-going capital costs will be reimbursed in the futurethrough indirect cost recoveries associated with theInstitute’s grant funding.
In April 1997, the Harvard Institute for InternationalDevelopment (hiid) learned of an investigation by the Inspector General’s Office of the U.S. Agency forInternational Development (usaid). usaid had awardedamounts to hiid under two cooperative agreements toprovide assistance to Russia in implementing economicand legal reforms. In September 2000, the United Statesfiled an eleven-count civil complaint against the Universityand others. The district court has since dismissed orentered judgment for the University on all counts againstit, except for one count alleging breach of contract.Regarding this breach of contract count, the Universityentered into an agreement during fiscal 2005 to pay thegovernment $26.5 million. This liability was appropriatelyrecorded in the financial statements as of June 30, 2005.Payment was made in early fiscal 2006.
The University is a defendant in various other legalactions arising out of the normal course of its operations.Although the final outcome of such actions cannot currently be determined, the University believes thateventual liability, if any, will not have a material effect on the University’s financial position.

Harvard University 53
Report of independent auditors
To the Board of Overseers of Harvard College:
In our opinion, the accompanying Balance Sheet and the related Statements of Changes in Net Assets with General Operating Account Detail, Changes in Net Assets of the Endowment, and Cash Flows present fairly, in all material respects, the financialposition of Harvard University (the “University”) at June 30, 2005, and the changes in itsnet assets of the general operating account and endowment funds and its cash flows forthe year then ended in conformity with accounting principles generally accepted in the United States of America. These financial statements are the responsibility of theUniversity’s management. Our responsibility is to express an opinion on these financialstatements based on our audit. The prior year summarized comparative information hasbeen derived from the University’s fiscal 2004 financial statements, and in our reportdated October 1, 2004, we expressed an unqualified opinion on those financial statements. We conducted our audit of these statements in accordance with auditingstandards generally accepted in the United States of America. Those standards requirethat we plan and perform the audit to obtain reasonable assurance about whether thefinancial statements are free of material misstatement. An audit includes examining, on a test basis, evidence supporting the amounts and disclosures in the financial statements, assessing the accounting principles used and significant estimates made by management, and evaluating the overall financial statement presentation. We believethat our audit provides a reasonable basis for our opinion.
October 11, 2005


S U P P L E M E N TA L I N F O R M AT I O N
56 Pooled general investments
58 Gifts available for current purposes
59 Gifts for capital
60 Endowment funds by department
62 Endowment and income information
for the major academic units
Potential locations of science development in Allston
56 Harvard University Supplemental information
Pooled general investments
The “Asset allocation” for the General Investment Accountis based on the Policy Portfolio as described in the unau-dited Annual Report of the Harvard Management Company.The Policy Portfolio is the asset mix that is most likely tomeet the long-term needs of the University with theappropriate level of risk. While the Policy Portfolio definesthe University’s market risk profile, Harvard ManagementCompany (hmc) undertakes a number of diversified arbi-trage activities to enhance the returns without changingthe portfolio’s risk profile. These trades are subtle andcomplex and tend to have a long volatility bias. The focusof these return enhancement strategies is to identify mispricings of specific financial instruments relative toother similar instruments. Once these mispricings areidentified, a series of long and short transactions areundertaken to capture the mispricings and to remain neutral to changes in the value of the underlying assetclass. These offsetting positions are taken in both instru-ments recorded on the summary of assets and liabilities(balance sheet cash positions) and in off-balance sheetproducts (futures, options, over-the-counter exchangeagreements, and forwards), as exhibited in Note 3 to theUniversity’s financial statements.
The accompanying table combines the balance sheet and the off-balance sheet financial instruments in a form consistent with hmc’s approach to the management ofthe General Investment Account. The table categorizesthe information presented in the financial statements intogroupings reflecting the type of strategy. There are severalkey points to be noted:
a) The “Balance sheet cash positions” are the assets andliabilities shown on the summary of assets and liabilitiesincluded in Note 3 to the University’s financial statements.
b) The on-balance sheet and off-balance sheet positions,both long and short, net to the core market exposure ofthe portfolio, which approximates the market exposure of the Policy Portfolio.
c) The off-balance sheet amounts represent the marketexposure on the notional value of the forwards, futures,options, and exchange agreements included in Note 3 tothe University’s financial statements.
d) From a market exposure standpoint, hmc uses on-balance sheet and off-balance sheet financial instrumentsinterchangeably.
The “Asset class” column describes the basic assets of the Policy Portfolio broken down into its major categorieswith the addition of a series of diversified arbitrageaccounts related to the equity, commodity, and fixed-income portfolios. The arbitrage accounts represent thepositions taken in value-added strategies to enhance thereturns of the underlying Policy Portfolio. The “Other”asset class represents on-balance sheet and off-balancesheet positions that are not subject to market risk, butwhich may be subject to credit risk. Included in this category are financial instruments such as cash, premiumspaid or received on option positions, and balances relatedto securities lending (collateral held under security lendingagreements) and securities borrowing (collateral advancedunder security borrowing agreements).
The remainder of the schedule shows the on-balancesheet and off-balance sheet positions of the specificinvestment categories. The “Balance sheet cash positions”columns show the financial positions that are reported onthe pooled general investment balance sheet. Thesecolumns include ownership or short sales in stock andbond positions, as well as investments in real estate, commodities, and private equities, either directly orthrough limited partnerships.
The “Forwards,” “Futures,” “Options,” and “Exchangeagreements” columns represent the long and short valuesof the off-balance sheet positions. Option positions havebeen adjusted to reflect the market exposure of the under-lying assets. Fixed-income futures have been adjusted toreflect duration weighting where appropriate. The positionsin these categories are primarily used for the value-addedarbitrage transactions, but may also be used to adjust thecore asset mix in a non-disruptive and cost-effective manner.
The “Net market exposure” column aggregates long and short exposure across all types of instruments andmay differ from the “Asset allocation” as reported in the unaudited Annual Report of the Harvard ManagementCompany. The balance sheet cash positions and off-balance sheet amounts are reported in accordance withgenerally accepted accounting principles and do not necessarily reflect “market risk” exposure amounts. For instance, in the equity area, the University owns convertible debt positions hedged by equity. The balancesheet reflects the market value of the convertible debt;

Supplemental information Harvard University 57
however, depending on the conversion features of thebond and the volatility of the underlying equity, the convertible debt will have significantly less equity marketexposure than the amount recorded on the balance sheet.In the fixed-income area, a fully hedged strategy designedto capture shifts in the yield curve may reflect a mismatchin long and short market exposure due to the duration ofthe underlying instruments. In some instances, optionstrategies have been employed to take advantage of market volatility. While these strategies may appear togenerate unhedged market exposure, the potential lossesare limited to the option premium, which is comparativelysmall relative to the indicated exposure.
The activities of arbitrage accounts are focused on addingvalue to the Policy Portfolio, taking advantage of mispricingsin a variety of financial instruments, and creating a well-diversified set of specific strategies. The market, credit,legal, operational, and liquidity risks associated with thesestrategies are monitored on a daily basis by an internal,
independent risk management group. This risk manage-ment group utilizes a number of different methodologiesto evaluate and control the various risks of the core portfoliosand value-added strategies. Individual strategies and port-folios are reviewed to monitor value at risk, compliancewith cash and margin requirements, and adherence tocredit risk limits established by hmc for each counter-party. All positions other than private equity, certain commodities and real estate are marked to market on a daily basis, with applicable profit and loss statementsgenerated for each strategy. Risk monitoring and controlis described in greater detail in the unaudited AnnualReport of the Harvard Management Company, beginning on page 23.
Total
market
exposure Netmarket Asset
ASSET CLASS Long Short Long Short Long Short Long Short Long Short Long Short exposure allocationEquity:
Domestic 6,095 - - - 225 - - - - - 6,320 - 6,320 5,332
Absolute return 3,210 - - - - - - - - - 3,210 - 3,210 3,837
Foreign 4,386 - - - - - - - - - 4,386 - 4,386 3,848
Emerging markets 1,220 - - - - - 26 - 584 (34) 1,830 (34) 1,796 1,782
Arbitrage accounts 2,385 (1,246) - - - (566) 128 (160) 9 (775) 2,522 (2,747) (225) -
Total equity market exposure 17,296 (1,246) - - 225 (566) 154 (160) 593 (809) 18,268 (2,781) 15,487 14,799
Fixed-income:Domestic 2,479 - - - - - - - - (85) 2,479 (85) 2,394 2,411
Foreign 776 - - - - - 120 (4) 125 (346) 1,021 (350) 671 1,192
High-yield securities 1,523 - - - - - - - - - 1,523 - 1,523 1,831
Inflation-indexed 1,537 - - - - - - - - - 1,537 - 1,537 1,589
Arbitrage accounts 15,758 (1,515) - - - (225) 10,162 (4,969) 1,902 (18,252) 27,822 (24,961) 2,861 -
Total fixed-income market exposure 22,073 (1,515) - - - (225) 10,282 (4,973) 2,027 (18,683) 34,382 (25,396) 8,986 7,023
Commodities:Core 3,302 - - - - (78) - - 1,169 - 4,471 (78) 4,393 3,675
Arbitrage accounts 16 - - - - - - - - (35) 16 (35) (19) -
Total commodities market exposure 3,318 - - - - (78) - - 1,169 (35) 4,487 (113) 4,374 3,675
Private equities 2,358 - - - - - - - - - 2,358 - 2,358 2,358
Real estate 1,892 - - - - - - - - - 1,892 - 1,892 1,940
Total market exposure 46,937 (2,761) - - 225 (869) 10,436 (5,133) 3,789 (19,527) 61,387 (28,290) 33,097 29,795
Cash and other:Cash and cash equivalents 1,169 - - - - - - - - - (417)Collateral advanced on borrowings 1,748 - - - - - - - - - - -
Collateral held on loans - (17,296) - - - - - - - - - -
Accounts receivable (1,406) - - - - - - - - - - -
Option premium 1,274 (287) - - - - - - - - - -
Total cash and other 2,785 (17,583) - - - - - - - - - (417)
NET ASSETS PER BALANCE SHEET 49,722 (20,344) - - - - - - - - - 29,378
Balance sheet
cash positions Forwards Futures OptionsExchange
agreements
Market exposure of off-balance sheet instrumentsYear ended June 30, 2005 (in millions of dollars)

58 Harvard University Supplemental information
Non-federal Gifts for sponsored
Year ended June 30, 2005 (in thousands of dollars) current use research grantsFACULTIES:Faculty of Arts and Sciences $ 54,531 $ 14,651Business School 15,283School of Dental Medicine 386 51Graduate School of Design 2,606 160Divinity School 1,131 379Graduate School of Education 4,355 4,632John F. Kennedy School of Government 19,966 7,561Law School 12,669 4,100Medical School 41,211 22,958School of Public Health 6,910 20,451Radcliffe Institute for Advanced Study 2,655 570 TOTAL FACULTIES 161,703 75,513
OTHER ACADEMIC DEPARTMENTS:Arnold Arboretum 288Harvard University Art Museums 3,342 240Joint Center for Housing Studies 1,427 826 Nieman Foundation 62 272Villa I Tatti 720 337TOTAL OTHER ACADEMIC DEPARTMENTS 5,839 1,675
SERVICE DEPARTMENTS:Harvard University Press 3University Health Services 5TOTAL SERVICE DEPARTMENTS 8 0
CENTRAL ADMINISTRATION:Memorial Church 516President’s Initiatives 17,432 4University Library 2,016 1,250Other 258TOTAL CENTRAL ADMINISTRATION 20,222 1,254
TOTAL GIFTS AVAILABLE FOR CURRENT PURPOSES $ 187,772 $ 78,442
Gifts available for current purposes

Supplemental information Harvard University 59
Endowment Construction LoanYear ended June 30, 2005 (in thousands of dollars) funds funds funds TotalFACULTIES:Faculty of Arts and Sciences $ 78,024 $ 2,067 $ 262 $ 80,353Business School 102,304 5,691 14 108,009 School of Dental Medicine 94 295 389 Graduate School of Design 648 648Divinity School 1,386 1,386 Graduate School of Education 558 435 993 John F. Kennedy School of Government 6,579 475 7,054 Law School 23,547 250 190 23,987Medical School 29,511 484 370 30,365 School of Public Health 6,135 6,135Radcliffe Institute for Advanced Study 8,850 73 8,923 TOTAL FACULTIES 257,636 9,770 836 268,242
OTHER ACADEMIC DEPARTMENTS:Arnold Arboretum 1,352 1,352 Harvard University Art Museums 1,025 18 1,043Nieman Foundation 3 283 286 Villa I Tatti 1,757 330 2,087 TOTAL OTHER ACADEMIC DEPARTMENTS 4,137 631 0 4,768
SERVICE DEPARTMENTS:Harvard University Press 156 156University Health Services 12 12University Operations Services 10 10TOTAL SERVICE DEPARTMENTS 178 0 0 178
CENTRAL ADMINISTRATION:Memorial Church 493 493President’s Initiatives 22,287 22,287 University Library 752 752 Other 176 176 TOTAL CENTRAL ADMINISTRATION 23,708 0 0 23,708
TOTAL ENDOWMENT, CONSTRUCTION, AND LOAN FUNDS $ 285,659 $ 10,401 $ 836 296,896
LIFE INCOME FUNDS:Charitable Remainder Annuities and Unitrusts 58,691Gift Annuities 15,691 Harvard Balanced Fund 653 Harvard Growth Fund 571 Harvard Life Return Fund 328TOTAL LIFE INCOME FUNDS 75,934
TOTAL GIFTS FOR CAPITAL $ 372,830
Gifts for capital

60 Harvard University Supplemental information
Year ended June 30, 2005 (dollar amounts in thousands) Endowment principalParticipating
Book value Gifts and Book value Market value unitsJuly 1, 2004 other changes June 30, 2005 June 30, 2005 June 30, 2005
FACULTIES:Faculty of Arts and Sciences $ 2,491,100 $ 98,189 $ 2,589,289 $ 11,711,315 8,201,977Business School 572,999 116,358 689,357 1,923,709 1,341,179School of Dental Medicine 29,672 141 29,813 158,759 111,357Graduate School of Design 59,768 580 60,348 321,190 225,289 Divinity School 76,367 2,749 79,116 455,271 319,337Graduate School of Education 93,181 2,216 95,397 389,178 272,977John F. Kennedy School of Government 219,746 5,633 225,379 765,781 532,173Law School 301,292 31,495 332,787 1,278,171 896,256Medical School 750,877 93,003 843,880 2,922,663 2,049,390 School of Public Health 159,014 8,723 167,737 848,137 594,900Radcliffe Institute for Advanced Study 202,562 7,529 210,091 404,234 283,464 TOTAL FACULTIES 4,956,578 366,616 5,323,194 21,178,408 14,828,299
OTHER ACADEMIC DEPARTMENTS:Arnold Arboretum 39,027 4,949 43,976 222,827 156,295Harvard University Art Museums 104,612 2,445 107,057 470,861 328,538 Joint Center for Housing Studies 0 0 0 0 0Nieman Foundation 15,238 (249) 14,989 102,487 71,886 Villa I Tatti 45,055 4,983 50,038 197,851 138,777TOTAL OTHER ACADEMIC DEPARTMENTS 203,932 12,128 216,060 994,026 695,496
SERVICE DEPARTMENTS:Harvard University Press 16,254 3,491 19,745 77,042 54,039University Health Services 3,610 4,384 7,994 36,834 25,836University Operations Services 818 10 828 4,012 2,814TOTAL SERVICE DEPARTMENTS 20,682 7,885 28,567 117,888 82,689
Central Administration 541,974 19,006 560,980 2,931,482 2,064,287
SUBTOTAL 5,723,166 405,635 6,128,801 25,221,804 17,670,771
Pledges outstanding 443,656 (64,329) 379,327 379,327Interests in perpetual trusts held by others 245,277 6,640 251,917 251,917
TOTAL $ 6,412,099 $ 347,946 $ 6,760,045 $ 25,853,048 17,670,771
Endowment funds by department

Supplemental information Harvard University 61
Year ended June 30, 2005 (in thousands of dollars) Endowment incomeUnexpended Investment Unexpended
income income Other receipts Fund income incomeJuly 1, 2004 distributed and transfers availed of June 30, 2005
FACULTIES:Faculty of Arts and Sciences $ 99,439 $ 366,313 $ (43,058) $ (324,965) $ 97,729 Business School 346 58,743 3,262 (61,926) 425 School of Dental Medicine 893 4,999 89 (5,057) 924 Graduate School of Design 1,305 10,147 998 (11,395) 1,055 Divinity School 6,635 14,430 1,114 (15,427) 6,752 Graduate School of Education 2,648 12,212 684 (11,286) 4,258 John F. Kennedy School of Government 11,416 23,991 3,764 (26,767) 12,404Law School 9,981 38,983 730 (40,281) 9,413Medical School 82,898 89,047 (1,999) (74,092) 95,854School of Public Health 34,712 26,987 (1,889) (24,796) 35,014Radcliffe Institute for Advanced Study 4,688 12,094 (1,415) (11,469) 3,898 TOTAL FACULTIES 254,961 657,946 (37,720) (607,461) 267,726
OTHER ACADEMIC DEPARTMENTS:Arnold Arboretum 1,733 7,616 (183) (7,966) 1,200 Harvard University Art Museums 5,197 14,737 (3,811) (10,268) 5,855 Joint Center for Housing Studies 41 0 39 (80) 0 Nieman Foundation 2,076 3,268 (21) (3,423) 1,900Villa I Tatti 2,466 6,053 (365) (5,431) 2,723TOTAL OTHER ACADEMIC DEPARTMENTS 11,513 31,674 (4,341) (27,168) 11,678
SERVICE DEPARTMENTS:Harvard University Press 4,410 2,413 4,345 (9,560) 1,608University Health Services 144 1,051 (2) (1,049) 144University Operations Services 156 128 (127) 0 157 TOTAL SERVICE DEPARTMENTS 4,710 3,592 4,216 (10,609) 1,909
Central Administration 41,420 91,602 (39,812) (49,231) 43,979
TOTAL $ 312,604 $ 784,814 $ (77,657) $ (694,469) $ 325,292

62 Harvard University Supplemental information
Endowment and income information for the major academic units
The charts and graphs in this section present summaries of endowment and income informationfor each of the University’s major academic units, as well as for the University as a whole.
The endowment graphs display the growth since 1974of the major components of the endowment: 1974appreciated principal, capitalized income, and giftsand other changes. To allow for comparability withyears prior to fiscal 1995, endowment values excludepledge balances and interests in perpetual trusts.
The income charts show the major components of income in fiscal 1995 and 2005. Shown beloweach of these charts is the ten-year compoundgrowth rate after inflation for total income.
On October 1, 1999, Harvard University andRadcliffe College merged and established theRadcliffe Institute for Advanced Study (rias).Therefore, the information for rias is presentedbeginning with fiscal 2000.
U N I V E R S I T Y
Real growth rate of income 1995–2005: 4.3%
Endowment growth (in billions of dollars) Sources of income (% of total)
1974 Principal
and appreciation
Capitalized income Gifts and other
changes
1995 2005
Students 26% 21%
Endowment incomedistributed for operations
21% 31%
Current use gifts 7%7%
Sponsored research support 24% 22%
Other 22% 19%
0
5
15
20
25
$30
1974
1985
1980
1990
1995
2000
2005
10

Supplemental information Harvard University 63
F A C U LT Y O F A R T S A N D S C I E N C E S
B U S I N E S S S C H O O L
Real growth rate of income 1995–2005: 4.0%
Real growth rate of income 1995–2005: 4.1%
Endowment growth (in billions of dollars) Sources of income (% of total)
Endowment growth (in billions of dollars) Sources of income (% of total)
1995 2005
Students 33% 22%
Endowment incomedistributed for operations
30% 47%
Current use gifts 6%
7%
Sponsored research support 21% 17%
Other 10% 7%
1995 2005
Students 43% 41%
Endowment incomedistributed for operations
11% 19%
Current use gifts 9%5%
Other 37% 35%
0.0
2.4
4.8
7.2
9.6
$12.0
1974
1980
1985
1990
1995
2000
2005
0.0
0.4
0.8
1.6
$2.0
1.2
1974
1980
1985
1990
1995
2000
2005
1974 Principal
and appreciation
Capitalized income Gifts and other
changes

64 Harvard University Supplemental information
S C H O O L O F D E N TA L M E D I C I N E
G R A D U AT E S C H O O L O F D E S I G N
Endowment growth (in millions of dollars) Sources of income (% of total)
1974 Principal
and appreciation
Capitalized income Gifts and other
changes
1995 2005
Students 28% 15%
Endowment incomedistributed for operations
14% 20%
Current use gifts2% 1%
Sponsored research support 20% 21%
Other 36% 43%
1995 2005
Students 52% 42%
Endowment incomedistributed for operations
29% 37%
Current use gifts 4% 8%
Sponsored research support 7% 2%
Other 8% 11%
0
35
70
140
105
$175
1974
1980
1985
1990
1995
2000
2005
0
65
130
195
260
$325
1974
1980
1985
1990
1995
2000
2005
Endowment growth (in millions of dollars) Sources of income (% of total)
Real growth rate of income 1995–2005: 4.9%
Real growth rate of income 1995–2005: 4.9%

Supplemental information Harvard University 65
D I V I N I T Y S C H O O L
G R A D U AT E S C H O O L O F E D U C AT I O N
Real growth rate of income 1995–2005: 5.3%
Endowment growth (in millions of dollars) Sources of income (% of total)
Endowment growth (in millions of dollars) Sources of income (% of total)
Real growth rate of income 1995–2005: 5.0%
1995 2005
Students 23%
10%
Endowment incomedistributed for operations
47% 66%
Current use gifts 5% 5%
Sponsored research support 8% 2%
Other 17% 17%
1995 2005
Students 38% 35%
Endowment incomedistributed for operations
15% 23%
Current use gifts 8%
7%
Sponsored research support 28% 21%
Other 11% 14%
0
95
190
285
380
$475
1974
1980
1985
1990
1995
2000
2005
0
80
160
240
320
$400
1974
1980
1985
1990
1995
2000
2005
1974 Principal
and appreciation
Capitalized income Gifts and other
changes

66 Harvard University Supplemental information
1995 2005
Students 31% 29%
Endowment incomedistributed for operations
18% 23%
Current use gifts 14% 18%
Sponsored research support 21% 22%
Other 16% 8%
J O H N F . K E N N E D Y S C H O O L O F G O V E R N M E N T
L AW S C H O O L
Real growth rate of income 1995–2005: 7.7%
Real growth rate of income 1995–2005: 4.5%
Endowment growth (in billions of dollars) Sources of income (% of total)
1974 Principal
and appreciation
Capitalized income Gifts and other
changes
1995 2005
Students 56% 46%
Endowment incomedistributed for operations
22% 34%
Current use gifts 10% 10%
Sponsored research support 2% 4%Other 10% 6%
0
160
320
480
640
$800
1974
1980
1985
1990
1995
2000
2005
0
0.3
0.6
0.9
1.2
$1.5
1974
1980
1985
1990
1995
2000
2005
Endowment growth (in millions of dollars) Sources of income (% of total)

Supplemental information Harvard University 67
M E D I C A L S C H O O L
S C H O O L O F P U B L I C H E A LT H
Real growth rate of income 1995–2005: 6.7%
Real growth rate of income 1995–2005: 5.7%
Endowment growth (in billions of dollars) Sources of income (% of total)
Endowment growth (in millions of dollars) Sources of income (% of total)
1995 2005
Students 9% 6%
Endowment incomedistributed for operations
15% 19%
Current use gifts3% 8%
Sponsored research support 51% 46%
Other 22% 21%
1995 2005
Students 8% 7%
Endowment incomedistributed for operations
9% 12%
Current use gifts 6% 3%
Sponsored research support 71% 76%
Other 6%2%
0.0
0.6
1.2
1.8
2.4
$3.0
1974
1980
1985
1990
1995
2000
2005
0
180
360
540
720
$900
1974
1980
1985
1990
1995
2000
2005
1974 Principal
and appreciation
Capitalized income Gifts and other
changes

68 Harvard University Supplemental information
2000 2005
Students 6% 5%
Endowment incomedistributed for operations
52% 68%
Current use gifts 34% 14%
Sponsored research support 6%
5%
Other 2% 8%
R A D C L I F F E I N S T I T U T E F O R A D VA N C E D S T U D Y *
0
90
180
270
360
$450
1999
2000
2001
2002
2003
2004
2005
Endowment growth (in millions of dollars) Sources of income (% of total)
1999 Principal
and appreciation
Gifts and other
changes
Real growth rate of income 2000–2005: (0.6)%
* On October 1, 1999, Harvard University and Radcliffe College merged
and established the Radcliffe Institute for Advanced Study (rias).
Therefore, the information for rias is presented beginning with fiscal 2000.

2 Letter from the President
4 Letter to the Board of Overseers
8 Analysis of financial results
16 Review of endowment results
18 Review of capital activities
23 Annual report of the Harvard
Management Company
27 Financial statements
55 Supplemental information
con
cept
,des
ign
and
cove
rph
oto
gra
ph:s
amet
zbl
acks
ton
eas
soci
ates
,bo
sto
nph
oto
gra
phy:
tom
kate
s;pa
ge7:
ken
td
ayto
n,i
nse
t:jo
hn
chas
e,h
arva
rdu
niv
ersi
tyn
ews
off
ice;
pag
e55
:co
ope
r,ro
bert
son
&pa
rtn
ers,
llp;
back
cove
r:ju
stin
ide,
har
vard
un
iver
sity
new
so
ffic
e
