financial report - learnfrombarryprework
TRANSCRIPT

2016Financial RepoRt
Fiscal YeaR ended December 31, 2016
10.1

We are the world’s leading manufacturer of both planes and trains, operating under four reportable segments: Business Aircraft, Commercial Aircraft, Aerostructures and Engineering Services and Transportation. We are providing more efficient, sustainable and enjoyable transportation solutions. Our products, services, and most of all, our 66,000 dedicated and highly skilled employees are what makes us a global leader in mobility and innovation. As at the date of this report, we have 73 production and engineering sites in 29 countries and a worldwide network of service centres.
All amounts in this financial report are in US dollars unless otherwise indicated.(1) For fiscal year 2016. (2) As at December 31, 2016. (3) As at December 31, 2016, including contractual and inactive employees. Some 4,100 Product Development Engineering, Corporate office and other employees are not allocated to a reportable segment.
BuSinESS AirCrAfT
Designs and manufactures industry-leading business jets and offers, when combined, the most comprehensive product portfolio of all business aircraft manufacturers. Business Aircraft also provides world-class aftermarket services for its expertly engineered Learjet, Challenger and Global aircraft with more than 60 service and maintenance facilities around the world.
Revenues(1) $5.7 billion
Order backlog(2) $15.4 billion
Employees(3) 9,400
COmmerCial airCraft
Designs and manufactures a broad portfolio of commercial aircraft in the 60- to 150-seat market segments, including the Q400 turboprop, the CRJ700, CRJ900 and CRJ1000 regional jets as well as the only aircraft optimized for the 100- to 150-seat market segment, the C Series single-aisle aircraft. Commercial Aircraft provides aftermarket services for these aircraft as well as for the 20- to 59-seat range category.
Revenues(1) $2.6 billion
Order backlog, in units(1)
436
Employees(3) 5,350
aerOsturuCtures and EnginEEring SErviCES
Designs and manufactures complex metallic and advanced composite aircraft structural components for original equipment manufacturers, including fuselages, wings and engine nacelles. It also provides aftermarket component repair and overhaul, as well as other engineering services for both internal and external clients.
Revenues(1) $1.5 billion
External order backlog(2) $42 million
Employees(3) 10,000
transpOrtatiOn
Provides the most comprehensive product range and services offering in the rail industry. Covers the full spectrum of rail solutions, ranging from complete trains to subsystems, services, system integration, signalling and e-mobility solutions.
Revenues(1) $7.6 billion
Order backlog(2) $30.1 billion
Employees(3) 37,150
10.2

BOMBARDIER INC. FINANCIAL REPORT - FISCAL YEAR ENDED DECEMBER 31, 2016 1
UNLEASHING VALUE THROUGH SOLID EXECUTIONAfter having successfully de-risked Bombardier in 2016, our focus is shifting to building earnings power and generating stronger free cash flow. All elements are in place to execute our plan and early results clearly show that we are on the right path to achieve our 2020 goals and create sustainable value for our shareholders.
Dear Shareholders,
Over the past year, we made great progress executing our turnaround plan and setting a strong foundation for the future. From a financial performance perspective, we delivered high quality results, exceeding our commitments. We also de-risked our business by strengthening our balance sheet and achieving our program milestones. And finally, we took the hard actions necessary to put our turnaround plan in full motion and position Bombardier to deliver strong growth in 2017 and beyond.
I am incredibly proud of what the Bombardier team accomplished in 2016 and very excited about the opportunities ahead of us to fully unleash the value of the Bombardier portfolio.
As we look to the future, we see tremendous value creation opportunities across Bombardier. We have four strong franchises that are well positioned in growth markets. Our rail business has one of the broadest and newest product offerings in the industry. We have one of the best business aircraft franchises in the world, and will be introducing new class defining aircraft with the Global 7000 and Global 8000 program. Our commercial aircraft business has tremendous growth opportunities with the new C Series aircraft family and we have world-class research, design and manufacturing capabilities in our Aerostructures business and Engineering organization.
With the continued disciplined execution of our turnaround plan, we are confident in our ability to unlock Bombardier’s full potential and achieve our 2020 goals. We are equally confident in our ability to achieve our long-term vision for
Bombardier, which is to build the most advanced planes and trains in the world; to create value for our customers; to be the market leader in each of our business segments; and to deliver superior value to our shareholders in any market environment.
The milestones achieved by the Bombardier team in 2016 both demonstrate the early benefits of our turnaround plan and highlight the clear path we are on to realize our goals and vision. Among the most notable accomplishments were:
• Achieving High Quality Financial Results: We delivered full-year results above our EBIT and free cash flow(1) guidance ranges; we exceeded our margin targets in Transportation, Business Aircraft and Commercial Aircraft; and our year-over-year cash performance has improved by almost $800 million.
• Successfully De-Risked the Business: We successfully completed the first and critical de-risking phase of our turnaround plan. By closing the CDPQ and Government of Québec equity investments, extending our credit facilities and refinancing $1.4 billion of senior notes and extending their maturity dates to 2021, we have secured the liquidity necessary to fully execute the final two phases of our turnaround plan: building earnings and cash flow, and starting in 2019, to de-leverage our balance sheet.
(1) Non-GAAP financial measure. Refer to the Non-GAAP financial measures section for a definition of this metric.

2 BOMBARDIER INC. FINANCIAL REPORT - FISCAL YEAR ENDED DECEMBER 31, 2016
• Delivering Strong Program Execution: From a program execution perspective, 2016 was a remarkable year. We completed the certification of both C Series aircraft models; we greatly improved the quality of our backlog with the Air Canada and Delta contracts; and we successfully placed both C Series models into service, with outstanding in-service performance and reliability. The Global 7000 business jet also achieved its first flight with a high level of maturity demonstrating that the lessons learned from the C Series are being fully captured.
• Placing our Transformation in Full Motion: Bombardier ended 2016 with our operations transformation in full motion. The actions taken, including launching two major restructuring initiatives to reduce costs and improve efficiencies in our own manufacturing facilities and across our supply chain, have put us on track to deliver a 3% EBIT margin improvement by 2020.(1)
We also demonstrated our disciplined approach to working capital management and capital allocation, which will support cash generation well into the future.
With the business stabilized and a clear strategy in place, we begin 2017 with powerful momentum and a clear focus on growing revenues and earnings. Over the next four years, we expect our revenues to grow significantly as we (i) reap the benefits of the large aerospace investments we’ve made over the past few years, (ii) execute on our $30 billion rail backlog and (iii) capture additional value related to servicing large installed fleets in both our rail and aerospace businesses, which include approximately 7,000 aircraft in service and more than 100,000 train cars in operation. Combining these growth opportunities with our new lower cost structure will allow us to deliver powerful earnings acceleration and strong free cash flow generation.
In closing, 2016 was a year of great progress. Of course, this progress reflects the dedication, hard work and willingness of 66,000 employees around the world to embrace change and support our turnaround plan. On behalf of all our shareholders, I thank our employees for their many contributions and for making our vision possible.
And while we are proud of our progress, we also know that we are still less than half-way through our turnaround plan. We know there is still much more work ahead of us. We fully understand that we need to continue to reduce costs, further leverage our scale, meet our program milestones, accelerate the creation of true centres of excellence and seize all growth opportunities. Simply put, we need to continue to execute our financial plan and meet our customer commitments.
We clearly recognize that our customers have made us leaders in each of our segments. They have choices and how we perform determines whether they will continue to choose us in the future. We are grateful for the confidence and trust they have placed in Bombardier in the past year, and are committed to finding better, faster and more efficient ways to deliver value and support their success in 2017 and in the years ahead.
With respect to our financial targets, we reaffirm, with increased confidence, the goals established when we launched our turnaround plan in the fall of 2015, including growing revenues to $25 billion, EBIT margins of 7-8%, and generating sustainable free cash flows between $750 million and $1 billion by 2020.(1) As we demonstrated with our performance this year, we have the right team, the right strategy and the ability to execute and deliver on these commitments.
Alain Bellemare President and Chief Executive Officer
(1) Please refer to the Guidance and forward-looking statements section in Overview for the forward-looking disclaimer. Also refer to the Strategic priorities section in Overview for the assumptions related to the forward-looking statements.

BOMBARDIER INC. FINANCIAL REPORT - FISCAL YEAR ENDED DECEMBER 31, 2016 3
BOMBARDIER INC.MANAGEMENT’S DISCUSSION AND ANALYSIS
For the fiscal year ended December 31, 2016
PAGEOVERVIEW
BUSINESS AIRCRAFT
COMMERCIAL AIRCRAFT
AEROSTRUCTURES AND ENGINEERING SERVICES
TRANSPORTATION
OTHER
All amounts in this report are expressed in U.S. dollars, and all amounts in the tables are in millions of U.S. dollars, unless otherwise indicated.
This MD&A is the responsibility of management and has been reviewed and approved by the Board of Directors of Bombardier Inc. (the “Corporation” or “Bombardier”). This MD&A has been prepared in accordance with the requirements of the Canadian Securities Administrators. The Board of Directors is responsible for ensuring that we fulfill our responsibilities for financial reporting and is ultimately responsible for reviewing and approving the MD&A. The Board of Directors carries out this responsibility principally through its Audit Committee. The Audit Committee is appointed by the Board of Directors and is comprised entirely of independent and financially literate directors. The Audit Committee reports its findings to the Board of Directors for its consideration when it approves the MD&A and financial statements for issuance to shareholders.
The data presented in this MD&A is structured by reportable segment: Business Aircraft, Commercial Aircraft, Aerostructures and Engineering Services and Transportation, which is reflective of our organizational structure effective as of January 1, 2015.
The results of operations and cash flows for the fourth quarter are not necessarily indicative of the results of operations and cash flows for the full fiscal year.
IFRS and non-GAAP measuresThis MD&A contains both IFRS and non-GAAP measures. Non-GAAP measures are defined and reconciled to the most comparable IFRS measure (see the Non-GAAP financial measures and Liquidity and capital resources sections in Overview and each reportable segment's Analysis of results section).
Materiality for disclosuresWe determine whether information is material based on whether we believe a reasonable investor’s decision to buy, sell or hold securities of the Corporation would likely be influenced or changed if the information were omitted or misstated.
Certain totals, subtotals and percentages may not agree due to rounding.
The Financial Report for fiscal year 2016 comprises the message from our President and Chief Executive Officer to shareholders, this MD&A and our consolidated financial statements.
5
40
56
75
83
100

4 BOMBARDIER INC. FINANCIAL REPORT - FISCAL YEAR ENDED DECEMBER 31, 2016
The following table shows the abbreviations used in the MD&A and the consolidated financial statements.
Term Description Term DescriptionAFS Available for sale GAAP Generally accepted accounting principlesBPS Basis points GDP Gross domestic productCAGR Compound annual growth rate HFT Held for tradingCCTD Cumulative currency translation difference IAS International Accounting Standard(s)CDPQ Caisse de dépôt et placement du Québec IASB International Accounting Standards BoardCGU Cash generating unit IFRIC International Financial Reporting Interpretation
CommitteeCIS Commonwealth of Independent StatesCSALP C Series Aircraft Limited Partnership IFRS International Financial Reporting Standard(s)DB Defined benefit L&R Loans and receivablesDC Defined contribution MD&A Management’s discussion and analysisDDHR Derivative designated in a hedge relationship NCI Non-controlling interestsDSU Deferred share unit NMF Information not meaningfulEBIT Earnings (loss) before financing expense, financing
income and income taxesOCI Other comprehensive income (loss)PP&E Property, plant and equipment
EBITDA Earnings (loss) before financing expense, financingincome, income taxes, amortization and impairmentcharges on PP&E and intangible assets
PSG Performance security guaranteePSU Performance share unitR&D Research and development
EBT Earnings (loss) before income taxes RSU Restricted share unitEIS Entry-into-service RVG Residual value guaranteeEPS Earnings (loss) per share attributable to equity
holders of Bombardier Inc.SG&A Selling, general and administrativeU.K. United Kingdom
FTV Flight test vehicle U.S. United States of AmericaFVTP&L Fair value through profit and loss

BOMBARDIER INC. / 2016 FINANCIAL REPORT / OVERVIEW 5
OVERVIEWPAGE
HIGHLIGHTS OF THE YEAR Highlights of our results for the fiscal yearKey events
KEY PERFORMANCE MEASURES ANDMETRICS
Key performance measures and associated metrics that we use to monitor our progress on a consolidated basisKey financial data for the last five years
STRATEGIC PRIORITIES Our roadmap to 2020
GUIDANCE AND FORWARD-LOOKINGSTATEMENTS
Guidance and disclaimers in connection with our forward-looking statements
CONSOLIDATED RESULTS OF OPERATIONS Our consolidated results for the fourth quarter and fiscal yearended December 31, 2016
CONSOLIDATED FINANCIAL POSITION Explanations of significant variances in our assets, liabilitiesand equity
LIQUIDITY AND CAPITAL RESOURCES Our cash flows, available short-term capital resources,expected future liquidity requirements and credit ratings
CAPITAL STRUCTURE Global metrics we use to monitor our capital structure
RETIREMENT BENEFITS Overview of our retirement benefit plans, associated risks andrelated mitigation strategies as well as key financial data
RISK MANAGEMENT Our key financing and market risks and related mitigationstrategies
NON-GAAP FINANCIAL MEASURES Definitions of our non-GAAP financial measures andreconciliations to the most comparable IFRS measures
6
8
9
12
14
19
20
26
27
32
36

6 BOMBARDIER INC. FINANCIAL REPORT - FISCAL YEAR ENDED DECEMBER 31, 2016
HIGHLIGHTS OF THE YEAR
Unleashing value through solid executionExceeded profitability andfree cash flow guidance
Executed key productdevelopment milestones
De-riskedliquidity
Transformation infull motion
REVENUES EBIT DILUTED EPS OPERATING CASH FLOWS
$16.3 billion ($58 million) ($0.48) $137 million
LIQUIDITY(1) EBIT BEFORE SPECIAL ITEMS(2) ADJUSTED EPS(2) FREE CASH FLOW USAGE(2)
$4.5 billion $427 million ($0.15) ($1.1 billion)
RESULTSFor the fiscal years ended December 31 2016 2015 VarianceRevenues $ 16,339 $ 18,172 (10)%EBIT $ (58) $ (4,838) nmfEBIT margin (0.4)% (26.6)% nmfEBIT before special items(2) $ 427 $ 554 (23)%EBIT margin before special items(2) 2.6 % 3.0 % (40) bpsEBITDA before special items(2) $ 798 $ 992 (20)%EBITDA margin before special items(2) 4.9 % 5.5 % (60) bpsNet loss $ (981) $ (5,340) nmfDiluted EPS (in dollars) $ (0.48) $ (2.58) nmfAdjusted net income (loss)(2) $ (268) $ 326 nmfAdjusted EPS (in dollars)(2) $ (0.15) $ 0.14 nmfNet additions to PP&E and intangible assets $ 1,201 $ 1,862 (35)%Cash flows from operating activities 137 20 nmfFree cash flow usage(2) $ (1,064) $ (1,842) 42 %As at December 31 2016 2015Available short-term capital resources(1) $ 4,477 $ 4,014 12 %
KEY HIGHLIGHTS AND EVENTS
• Our results for 2016 reflect overall improved performance:• We completed the de-risking phase of our turnaround plan by, amongst other actions, resetting our
deliveries and revenues in line with market demand.• In 2016, we continued to launch and execute several strategic initiatives driving improved financial
performance. As such, we exceeded our consolidated profitability(3) and free cash flow(2) guidance. Our 2016 consolidated revenues were in line with guidance.
• EBIT margins before special items(2) improved materially in the following segments:• Business Aircraft reached 6.4%, up from 4.4%;• Aerostructures and Engineering Services finished at 8.0%, up from 5.8%; and• Transportation generated 7.4%, up from 5.6%.
• Free cash flow usage(2) improved by $778 million mainly due to reduced product development spend following certification of both the CS100 and CS300 aircraft as well as our disciplined approach to working capital management and capital allocation in line with our transformation plan.
(1) Defined as cash and cash equivalents plus the amount available under our revolving credit facilities.(2) Non-GAAP financial measures. Refer to the Non-GAAP financial measures, Consolidated results of operations and Liquidity and capital
resources sections for definitions of these metrics and reconciliations to the most comparable IFRS measures.(3) Profitability guidance is based on EBIT before special items, which is a non-GAAP financial measure.

BOMBARDIER INC. / 2016 FINANCIAL REPORT / OVERVIEW 7
KEY HIGHLIGHTS AND EVENTS (CONTINUED)
• We achieved major milestones in key aircraft programs:• Commercial Aircraft reached a historic milestone in 2016 as it certified and brought to market both
variants of the C Series aircraft, the first all-new clean-sheet designed family of single-aisle aircraft in the 100- to 150-seat segment in nearly 30 years. In 2016, we also solidified the backlog with several significant orders, including Delta Air Lines and Air Canada. At EIS, the program had over 350 aircraft in our firm order backlog and approximately 600 aircraft when including options. With a total of seven aircraft delivered by year end, both the CS100 and CS300 aircraft are delivering on their operating cost advantage, superior operating flexibility, exceptional performance and range, as well as passenger comfort.
• On November 4, 2016, we successfully completed the maiden flight of the first Global 7000 FTV with a high level of maturity, demonstrating that the lessons learned from the C Series aircraft program are being fully captured. The Global 7000 and Global 8000 aircraft program will set the standard for a new category of large business jets. The Global 7000 aircraft is the first and only clean-sheet business jet with four living spaces.
• We secured the liquidity necessary to execute our turnaround plan:• We closed the CDPQ equity investment in Transportation and the Government of Québec equity
investment (through Investissement Québec) in the C Series aircraft program, totalling $2.5 billion.• We extended our credit facilities through 2019 and refinanced $1.4 billion of senior notes, extending their
maturity dates to 2021.• We continue our transformation initiatives on the roadmap to 2020:
• We are gaining traction on our transformation initiatives, aiming to increase manufacturing efficiency, reduce bill of materials, and streamline indirect costs. We are already executing on over 80% of the cost savings initiatives targeting a 300-bps improvement in margins by 2020, including workforce optimization efforts.
• We launched two major restructuring initiatives in 2016 with the goal to resize our organization in line with current business needs and increase our competitiveness:• In February 2016, we announced workforce reductions of an estimated 7,000 production and non-
production employees throughout 2016 and 2017.(1) These reductions have been largely achieved in 2016 as planned.
• In October 2016, we announced further restructuring actions, including streamlining administrative and non-production functions across the organization, workforce optimization and site specialization. Approximately 7,500 positions are expected to be impacted through 2018.(2)
• These workforce optimizations will be partially offset by strategic hiring to support ramp-up for key growth programs including the C Series and the Global 7000 and Global 8000 aircraft programs, major rail contract wins, as well as to support our growth strategy in aftermarket businesses.
• These organizational restructuring actions are expected to reach annual savings of between $500 million and $600 million by the end of 2018.(2)
• Over the course of 2016, we recorded restructuring charges of $215 million, consisting mainly of severance, as special items. We anticipate recording a further $250 million to $300 million in restructuring charges, to be reported as special items when accrued, in 2017.(2)
(1) The planned manpower reduction included approximately 2,000 contractual workers and 800 product development engineers, the latter of which, are not allocated to a reportable segment.
(2) Forward-looking statement. See the forward-looking statements disclaimer.

8 BOMBARDIER INC. FINANCIAL REPORT - FISCAL YEAR ENDED DECEMBER 31, 2016
KEY PERFORMANCE MEASURES AND METRICSThe table below summarizes key performance measures and associated metrics evaluated only on a consolidated basis. Our reportable segments use multiple other key performance measures to evaluate various key metrics. Refer to each reportable segment’s Key performance measures and metrics section for further details.
KEY PERFORMANCE MEASURES AND ASSOCIATED METRICSProfitability • Diluted EPS and adjusted EPS(1), as measures of global performance.Liquidity • Available short-term capital resources(2), as a measure of liquidity adequacy.Capitalstructure
• Adjusted EBIT(1) to adjusted interest(1) ratio, as a measure of interest coverage. • Adjusted debt(1) to adjusted EBITDA(1) ratio, as a measure of financial leverage.• Weighted-average long-term debt maturity, as a measure of debt term structure.
Five-year summaryFor the fiscal years ended and as atDecember 31 2016 2015 2014 2013 2012Profitability
Revenues $ 16,339 $ 18,172 $ 20,111 $ 18,151 $ 16,414EBIT $ (58) $ (4,838) $ (566) $ 923 $ 666EBIT margin (0.4)% (26.6)% (2.8)% 5.1% 4.1%EBIT before special items(1)(3) $ 427 $ 554 $ 923 $ 893 $ 806EBIT margin before special items(1)(3) 2.6 % 3.0 % 4.6 % 4.9% 4.9%EBITDA(1) $ 323 $ (100) $ 1,117 $ 1,314 $ 1,030EBITDA before special items(1)(3) $ 798 $ 992 $ 1,340 $ 1,284 $ 1,170Net income (loss) $ (981) $ (5,340) $ (1,246) $ 572 $ 470Adjusted net income (loss)(1) $ (268) $ 326 $ 648 $ 608 $ 671Diluted EPS (in dollars) $ (0.48) $ (2.58) $ (0.74) $ 0.31 $ 0.25Adjusted EPS (in dollars)(1) $ (0.15) $ 0.14 $ 0.35 $ 0.33 $ 0.36
LiquidityNet additions to PP&E and intangible assets $ 1,201 $ 1,862 $ 1,964 $ 2,287 $ 2,074Cash flows from operating activities $ 137 $ 20 $ 847 $ 1,380 $ 1,438Free cash flow usage(1) $ (1,064) $ (1,842) $ (1,117) $ (907) $ (636)Available short-term capital resources(2) $ 4,477 $ 4,014 $ 3,846 $ 4,837 $ 3,967
Capital structureInterest coverage ratio(4) 0.8 1.5 3.1 2.8 3.2Financial leverage ratio(4) 9.7 7.3 4.7 5.4 4.2Weighted-average long-term debt maturity (in years) 5.8 6.3 6.4 6.4 7.4
(1) Non-GAAP financial measures. Refer to the Non-GAAP financial measures, Consolidated results of operations and Liquidity and capital resources sections for definitions of these metrics and reconciliations to the most comparable IFRS measures in 2016 and 2015.
(2) Defined as cash and cash equivalents plus the amount available under the revolving credit facilities.(3) Refer to the Consolidated results of operations section for details of special items recorded in 2016 and 2015. In 2014, the special items
related to impairment and other charges of $1.4 billion related to the decision to pause the Learjet 85 aircraft program and $273 million of net write-downs of deferred tax assets following that decision, $142 million of restructuring charges, a $43-million loss on repurchase of long-term debt, and a $18-million gain on resolution of a litigation in connection with Part IV of the Québec Income Tax Act of which $8 million was recorded in financing income. In 2013, the special items related to a $43-million gain on resolution of a litigation in connection with capital tax, of which $12 million was recorded in financing income, a $24-million inventory write-down and a $23-million gain on disposal of a business. In 2012, the special items related to $119 million of restructuring charges in Transportation, a $40-million gain on resolution of a litigation in connection with capital tax, of which $17 million was recorded in financing income, a $19-million loss related to flooding in New Jersey, U.S. and a $25-million foreign exchange hedging loss.
(4) Refer to the Capital structure and Non-GAAP financial measures sections for computations of these ratios.

BOMBARDIER INC. / 2016 FINANCIAL REPORT / OVERVIEW 9
STRATEGIC PRIORITIES
Roadmap to 2020: Unleashing value through solid execution2016 was the first full year of our five-year transformation plan. A transition year marked by the achievement of key milestones on the C Series and Global 7000 and Global 8000 aircraft programs, and by a strengthened liquidity position. This solid execution and the launch of transformation initiatives allowed us to complete the first phase, the de-risking phase, of the plan.
We are now focused on the second phase of our transformation plan, building earnings and free cash flows, to unleash the value of our portfolio of products and services. Numerous initiatives support this transformation, providing us with a solid foundation on which to reach our 2020 objectives of approximately 10% annual revenue growth, expanding margins and strong cash flow generation.(1)
Our 2020 objectives(1)
Consolidated
Growth Revenues above $25 billion.
Profitability(2) EBIT margin in the range of 7% and 8%.
Free cash flow(2) Free cash flow(2) of more than 80% of net income.
Business Aircraft
Growth Revenues above $10 billion.
Profitability(2) EBIT margin in the range of 8% and 10%.
Commercial AircraftGrowth Revenues above $5.5 billion.
Profitability(2) Positive EBIT.
Aerostructures andEngineering Services
Growth Revenues above $2.5 billion.
Profitability(2) EBIT margin in the range of 9% and 11%.
TransportationGrowth Revenues above $10 billion.
Profitability(2) EBIT margin above 8%.
Revenues
Our strong product portfolio and large installed fleets in both the aerospace and in the rail businesses position us well to reach our target of more than $25 billion in revenues by 2020.(1)
At EIS, the C Series aircraft program had over 350 aircraft in the firm order backlog, and approximately 600 aircraft when including options, securing most deliveries through 2020. The aircraft program is positioned to capture a large share of future orders for 100- to 150-seat aircraft. We expect to deliver 90 to 120 aircraft per year by 2020. This will support Commercial Aircraft’s growth target to revenues of more than $5.5 billion by 2020.(1)
(1) See Forward-looking statements in boxed text below for details regarding the assumptions on which the objectives are based. Also see forward-looking statements disclaimer in the Guidance and forward-looking statements section.
(2) Profitability objectives are based on EBIT margin before special items. EBIT before special items and free cash flow are non-GAAP measures. Refer to the Non-GAAP financial measures section for definitions of these metrics.

10 BOMBARDIER INC. FINANCIAL REPORT - FISCAL YEAR ENDED DECEMBER 31, 2016
The Global 7000 aircraft is on track to enter into service in the second half of 2018. Its performance, in terms of range, low speed handling, technological innovation and comfort, is setting the standard for large ultra-long range business jets. In conjunction with the future EIS of the Global 7000 and Global 8000 aircraft program, with stabilizing market conditions and a positive economic outlook,(2) Business Aircraft revenues are targeted to double to more than $10 billion by 2020.(1)
Transportation will further leverage its broad portfolio of products and services to offer its customers complete mobility solutions covering rolling stock, signaling, system integration and operation and maintenance services. The positive outlook for the global rail industry(2) confirmed by the Association of the European Rail Industry (UNIFE)(3) as well as Transportation’s consistent annual book-to-bill ratio(4) of at least 1.0 over the last 5 years, support Transportation’s plans to reach its 2020 target of more than $10 billion in revenue.(1)
In addition, with approximately 7,000 aircraft in service and 100,000 train cars in operation, we see significant opportunities to service a greater share of the large fleets of Bombardier planes and trains. More specifically, Business Aircraft targets increasing its aftermarket revenues by approximately 50% by 2020. The recent opening of its Greater London, U.K., service centre and its planned expansion of service centres in Tucson and Fort Lauderdale in the U.S. are some initiatives that should allow us to capture a larger portion of this high margin activity through the current and growing installed fleet. Transportation continues to strengthen its position in the rail aftermarket and also aims to increase its aftermarket revenues by 2020.(1)
Profitability
Our transformation is driving EBIT growth to reach target margins of between 5% and 6% in 2018 and between 7% and 8% by 2020.(1)
We are already executing on more than 80% of identified cost savings initiatives of our operational transformation, which are expected to generate more than $750 million in EBIT by 2020. This represents an improvement of more than 300 basis points from 2016 EBIT margin before special items.(5) Examples of transformation initiatives include:• Driving labour efficiency: In 2016, we made two organizational restructuring announcements, which are
expected to reach annual savings of between $500 million and $600 million by the end of 2018;• Creating centres of excellence in the aerospace segments and in Transportation: We are specializing our
manufacturing and engineering footprints as well as creating shared administrative resource centres to deliver efficiencies and cost savings;
• Reduce supplier bill of materials: We are harnessing our scale and reducing our number of suppliers to deliver more than 200 basis points in direct cost savings by 2020; and
• Controlling indirect costs: We have created a global organization to manage indirect goods and services and plan to reduce spend by 2% per year until 2020.(1)
Free cash flow
Our five-year plan is targeting free cash flow(5) break-even by 2018, generating positive free cash flow beginning in 2019 and positive free cash flow generation between $750 million to $1.0 billion by 2020.(1)
Working capital initiatives and sustainable capital allocation combined with profitable revenue growth and margin expansion are increasing free cash flow significantly. Already in 2016, the first year of our transformation plan, the various initiatives have generated in excess of $500 million of free cash flow, mainly by optimizing working capital.
This will support the third and final phase of our five-year plan which consists of de-leveraging our balance sheet, thereby driving strong shareholder value.(1) See Forward-looking statements in boxed text below for details regarding the assumptions on which the objectives are based. Also see
forward-looking statements disclaimer in the Guidance and forward-looking statements section. (2) Please refer to the Industry and economic environment sections in the respective reportable segments for more details.(3) The UNIFE World Rail Market Study published in September 2016.(4) Defined as new orders over revenues.(5) Non-GAAP financial measure. Refer to the Non-GAAP financial measures for definition of this metric.

BOMBARDIER INC. / 2016 FINANCIAL REPORT / OVERVIEW 11
Forward-looking statements Forward-looking statements(1) in this section of the MD&A are based on the following material assumptions:
All segments• normal execution and delivery of current firm orders and projects in the backlog;• our ability to execute and deliver business model enhancement initiatives;• the ability to understand customer needs and portfolio of products and services to drive increasing market demand and secure key
strategic orders;• successful deployment and execution of growth strategies, including the aftermarket businesses; • continued deployment and execution of leading initiatives according to plan to improve revenue conversion into higher earnings and
free cash flows(2), through improved procurement cost, controlled spending and labour efficiency;• delivering on the transformation plan targets, through restructurings and other initiatives addressing the direct and indirect cost
structure, focusing on sustained cost reductions and operational improvements, while reducing working capital consumption;• the ability to leverage the global manufacturing footprint and transfer best practices and technology across production sites, and by
leveraging lower cost geographies and emerging economies;• the ability of the supply base to support product development, planned production rates and the execution of projects;• the ability to identify and enter into further risk sharing partnerships;• the effectiveness of disciplined capital deployment measures in new programs and products to drive revenue growth;• the ability to recruit and retain highly skilled resources to deploy the product development and project execution strategy;• competitive global environment and global economic conditions to remain similar;• the stability of foreign exchange rates; and• the ability to have sufficient liquidity to execute the strategic plan, to meet financial covenants and to pay down long-term debt or
refinance bank facilities and maturities starting in 2019.Aerospace segments• the alignment of production rates to market demand;• increased level of aircraft deliveries and improving pricing environment starting in 2018;• the ability to ramp up production and deliveries of new programs, focusing on the C Series aircraft program including learning curve
improvements, and meet scheduled EIS date for the Global 7000 and Global 8000 aircraft program;• our ability to strengthen our market position and product value proposition for the CRJ Series and Q400 aircraft programs;• continued ability to capture and win campaigns and projects based on market forecasts(3), leading to estimated future order intake; and• the reduction of investments and development spend to normalized levels, in line with depreciation by 2019.Transportation• revenue conversion and phase out of our legacy contracts;• a sustained level of public sector spending;• the realization of upcoming tenders and our ability to capture them based on market forecasts(4), leading to estimated future order
intake;• the ability to transfer best practices and technology across production; and• successful deployment and execution of growth strategies, including the value chain approach and the creation of ecosystems, site
specialization and the creation of engineering centres of excellence, and the evolution of the revenue mix towards more signaling and systems and operations and maintenance contracts.
For a discussion of the material risk factors associated with the forward-looking information, refer to the Risks and uncertainties section inOther.
(1) Also refer to the Guidance and forward-looking statements section for the forward-looking statements disclaimer.(2) Non-GAAP measure. Refer to the Non-GAAP measures for definition of this metric.(3) Demand forecast for aerospace segments is based on the analysis of main market indicators, including real GDP growth, industry
confidence, wealth creation, corporate profitability within the aerospace customer base, aircraft utilization, pre-owned business jet inventory levels, aircraft shipments and billings, passenger traffic levels, fuel prices, airline profitability, pilot scope clauses, environmental regulations, globalization of trade, installed base and average age of the fleet, replacement demand, new aircraft programs and non-traditional markets and their accessibility. For more details, refer to the market indicators in the Industry and economic environment sections of the aerospace segments.
(4) Demand forecast in the Transportation segment is based on sustained level of public sector spending and the continuation of favourable megatrends, including urbanization and environmental awareness trends, the densification of cities and demand for mobility and digitalization solutions. For more details, refer to the market indicators in the Industry and economic environment section.

12 BOMBARDIER INC. FINANCIAL REPORT - FISCAL YEAR ENDED DECEMBER 31, 2016
GUIDANCE AND FORWARD-LOOKING STATEMENTS
Latest guidance for 2016 What we did in 2016 What’s next for 2017(1)
Consolidated
Growth Revenues of approximately$16.5 billion.
Revenues of$16.3 billion.
Excluding currency impacts,revenues in 2017 are expectedto be higher than in 2016, withpercentage growth in the low-single digits.
Profitability(2) EBIT before special items(2) in the range of $350 million to $400 million.
EBIT before special items(2) of $427 million.
EBIT before special items(2) in the range of $530 million to $630 million.
Free cash flow(2)
Free cash flow usage(2) in the range of $1.15 billion to $1.45 billion.
Free cash flow usage(2) of $1.1 billion.
Free cash flow usage(2) in the range of $750 million to $1.0 billion.
Business Aircraft
Growth and deliveries
Revenues of approximately$5.5 billion.
Above 150 deliveries.
Revenues of$5.7 billion.
163 deliveries.
Revenues of approximately$5.0 billion.
Approximately 135 deliveries.Profitability(2) EBIT margin before special
items(2) above 6.0%. EBIT margin before special items(2) of 6.4%.
EBIT margin before special items(2) of approximately 7.5%.
CommercialAircraft
Growth and deliveries
Revenues of approximately$2.7 billion.
Between 85 to 90 deliveries.
Revenues of$2.6 billion.
86 deliveries.
Revenues of approximately$2.9 billion.
Between approximately 80 to85 deliveries.
Profitability(2) Negative EBIT before special items(2) of approximately $450 million, mainly due to the dilutive impact of the initial years of production of the C Series aircraft program.(3)
Negative EBIT before special items(2) of $417 million.
Negative EBIT before special items(2) of approximately $400 million, mainly due to the dilutive impact of the initial years of production of the C Series aircraft program.(3)
AerostructuresandEngineeringServices
Growth Revenues of approximately$1.6 billion, mainly fromintersegment contracts withBusiness Aircraft andCommercial Aircraft.
Revenues of$1.5 billion, of which$1.1 billion was fromintersegment contracts.
Revenues of approximately$1.7 billion, mainly fromintersegment contracts withBusiness Aircraft andCommercial Aircraft.
Profitability(2) EBIT margin before special items(2) of approximately 8.0%.
EBIT margin before special items(2) of 8.0%.
EBIT margin before special items(2) above 8.5%.
Transportation
Growth Revenues of approximately$8.0 billion, based on thecurrent foreign exchange ratesin 2016.
Revenues of$7.6 billion.
Revenues of approximately$8.5 billion, based on theassumption that foreignexchange rates will remainstable in 2017 compared to2016.
Profitability(2) EBIT margin before special items(2) above 6.5%.
EBIT margin before special items(2) of 7.4%.
EBIT margin before special items(2) of approximately 7.5%.
In November 2016, we indicated that on a consolidated basis, we were in line to achieve our 2016 revenue and profitability(2) guidance. We refined our revenue guidance from a range of between $16.5 billion and $17.5 billion to approximately $16.5 billion and we narrowed the range of EBIT before special items(2) from between $200 million and $400 million to between $350 million and $400 million. In 2016, we exceeded guidance for consolidated profitability(2) and our consolidated revenues were in line with our guidance.(1) See each reportable segment’s Guidance and forward-looking statements section and the forward-looking statements disclaimer hereafter
for details regarding the assumptions on which the guidance is based. (2) Profitability guidance is based on EBIT before special items or EBIT margin before special items. EBIT before special items and free cash
flow (usage) are non-GAAP measures. Free cash flow (usage) includes cash flows related to special items. Refer to the Non-GAAP financial measures section for definitions of these metrics and the Consolidated results of operations and Liquidity and capital resources sections, as well as each reportable segment’s Analysis of results section for reconciliations to the most comparable IFRS measures in 2016.
(3) Early production units in a new aircraft program require higher costs than units produced later in the program and the selling prices of early units are generally lower.

BOMBARDIER INC. / 2016 FINANCIAL REPORT / OVERVIEW 13
In September 2016, we revised our consolidated free cash flow usage(1) guidance from a range of $1.0 billion to $1.3 billion to the range of $1.15 billion to $1.45 billion, following the revised delivery forecast for the C Series aircraft program as a result of engine delivery delays. Our 2016 free cash flow usage(1) was better than the lower end of our guidance range.
For further detail on the 2016 and 2017 guidance by reportable segment, refer to each reportable segment’s Guidance and forward-looking statements section. For further detail on the 2016 free cash flow usage see the Liquidity and capital resources section.(1) Non-GAAP financial measure. Free cash flow (usage) includes cash flows related to special items. Refer to the Non-GAAP financial
measures section for a definition of this metric and the Liquidity and capital resources sections for reconciliations to the most comparable IFRS measures in 2016.
This MD&A includes forward-looking statements, which may involve, but are not limited to: statements with respect to our objectives, guidance, targets, goals, priorities, market and strategies, financial position, beliefs, prospects, plans, expectations, anticipations, estimates and intentions; general economic and business outlook, prospects and trends of an industry; expected growth in demand for products and services; product development, including projected design, characteristics, capacity or performance; expected or scheduled entry-into-service of products and services, orders, deliveries, testing, lead times, certifications and project execution in general; competitive position; the expected impact of the legislative and regulatory environment and legal proceedings on our business and operations; available liquidities and ongoing review of strategic and financial alternatives; the impact and expected benefits of the investment by the Government of Québec in the C Series Aircraft Limited Partnership and of the private placement of a minority stake in Transportation by the CDPQ on our operations, infrastructure, opportunities, financial condition, access to capital and overall strategy; and the impact of such investments on our balance sheet and liquidity position.
Forward-looking statements can generally be identified by the use of forward-looking terminology such as “may”, “will”, “shall”, “can”, “expect”, “estimate”, “intend”, “anticipate”, “plan”, “foresee”, “believe”, “continue”, “maintain” or “align”, the negative of these terms, variations of them or similar terminology. By their nature, forward-looking statements require management to make assumptions and are subject to important known and unknown risks and uncertainties, which may cause our actual results in future periods to differ materially from forecast results set forth in forward-looking statements. While management considers these assumptions to be reasonable and appropriate based on information currently available, there is risk that they may not be accurate.
Certain factors that could cause actual results to differ materially from those anticipated in the forward-looking statements include, but are not limited to, risks associated with general economic conditions, risks associated with our business environment (such as risks associated with the financial condition of the airline industry, business aircraft customers, and the rail industry; trade policy; increased competition; political instability and force majeure), operational risks (such as risks related to developing new products and services; development of new business; the certification and homologation of products and services; fixed-price and fixed-term commitments and production and project execution; pressures on cash flows based on project-cycle fluctuations and seasonality; our ability to successfully implement and execute our strategy and transformation plan; doing business with partners; product performance warranty and casualty claim losses; regulatory and legal proceedings; the environment; dependence on certain customers and suppliers; human resources; reliance on information systems; reliance on and protection of intellectual property rights; and adequacy of insurance coverage), financing risks (such as risks related to liquidity and access to capital markets; retirement benefit plan risk; exposure to credit risk; substantial existing debt and interest payment requirements; certain restrictive debt covenants and minimum cash levels; financing support provided for the benefit of certain customers; and reliance on government support), market risks (such as risks related to foreign currency fluctuations; changing interest rates; decreases in residual values; increases in commodity prices; and inflation rate fluctuations). For more details, see the Risks and uncertainties section in Other. For additional information with respect to the assumptions underlying the forward-looking statements made in this MD&A, refer to the Guidance and forward-looking statements sections in each reportable segment.
Readers are cautioned that the foregoing list of factors that may affect future growth, results and performance is not exhaustive and undue reliance should not be placed on forward-looking statements. The forward-looking statements set forth herein reflect management’s expectations as at the date of this report and are subject to change after such date. Unless otherwise required by applicable securities laws, we expressly disclaim any intention, and assume no obligation to update or revise any forward-looking statements, whether as a result of new information, future events or otherwise. The forward-looking statements contained in this MD&A are expressly qualified by this cautionary statement.
14 BOMBARDIER INC. FINANCIAL REPORT - FISCAL YEAR ENDED DECEMBER 31, 2016
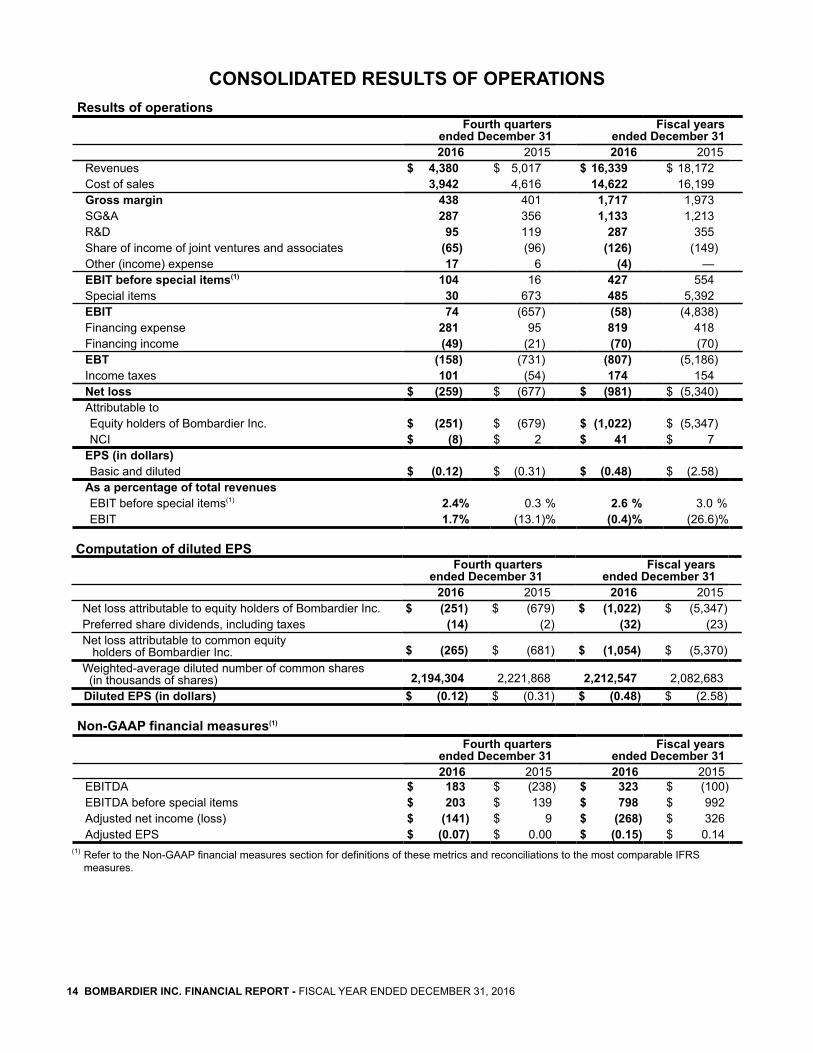
CONSOLIDATED RESULTS OF OPERATIONSResults of operations
Fourth quarters ended December 31
Fiscal years ended December 31
2016 2015 2016 2015Revenues $ 4,380 $ 5,017 $ 16,339 $ 18,172Cost of sales 3,942 4,616 14,622 16,199Gross margin 438 401 1,717 1,973SG&A 287 356 1,133 1,213R&D 95 119 287 355Share of income of joint ventures and associates (65) (96) (126) (149)Other (income) expense 17 6 (4) —EBIT before special items(1) 104 16 427 554Special items 30 673 485 5,392EBIT 74 (657) (58) (4,838)Financing expense 281 95 819 418Financing income (49) (21) (70) (70)EBT (158) (731) (807) (5,186)Income taxes 101 (54) 174 154Net loss $ (259) $ (677) $ (981) $ (5,340)Attributable toEquity holders of Bombardier Inc. $ (251) $ (679) $ (1,022) $ (5,347)NCI $ (8) $ 2 $ 41 $ 7
EPS (in dollars)Basic and diluted $ (0.12) $ (0.31) $ (0.48) $ (2.58)
As a percentage of total revenuesEBIT before special items(1) 2.4% 0.3 % 2.6 % 3.0 %EBIT 1.7% (13.1)% (0.4)% (26.6)%
Computation of diluted EPSFourth quarters
ended December 31Fiscal years
ended December 312016 2015 2016 2015
Net loss attributable to equity holders of Bombardier Inc. $ (251) $ (679) $ (1,022) $ (5,347)Preferred share dividends, including taxes (14) (2) (32) (23)Net loss attributable to common equity holders of Bombardier Inc. $ (265) $ (681) $ (1,054) $ (5,370)Weighted-average diluted number of common shares (in thousands of shares) 2,194,304 2,221,868 2,212,547 2,082,683Diluted EPS (in dollars) $ (0.12) $ (0.31) $ (0.48) $ (2.58)
Non-GAAP financial measures(1)
Fourth quarters ended December 31
Fiscal years ended December 31
2016 2015 2016 2015EBITDA $ 183 $ (238) $ 323 $ (100)EBITDA before special items $ 203 $ 139 $ 798 $ 992Adjusted net income (loss) $ (141) $ 9 $ (268) $ 326Adjusted EPS $ (0.07) $ 0.00 $ (0.15) $ 0.14
(1) Refer to the Non-GAAP financial measures section for definitions of these metrics and reconciliations to the most comparable IFRS measures.

BOMBARDIER INC. / 2016 FINANCIAL REPORT / OVERVIEW 15
Reconciliation of segment to consolidated resultsFourth quarters
ended December 31Fiscal years
ended December 312016 2015 2016 2015
RevenuesBusiness Aircraft $ 1,651 $ 2,086 $ 5,741 $ 6,996Commercial Aircraft 699 644 2,617 2,395Aerostructures and Engineering Services 319 443 1,549 1,797Transportation 1,948 2,164 7,574 8,281Corporate and Elimination (237) (320) (1,142) (1,297)
$ 4,380 $ 5,017 $ 16,339 $ 18,172EBIT before special items(1)
Business Aircraft $ 100 $ 28 $ 369 $ 308Commercial Aircraft (141) (87) (417) (170)Aerostructures and Engineering Services 30 (9) 124 104Transportation 181 123 560 465Corporate and Elimination (66) (39) (209) (153)
$ 104 $ 16 $ 427 $ 554Special ItemsBusiness Aircraft $ 1 $ 380 $ (108) $ 1,560Commercial Aircraft 3 240 486 3,800Aerostructures and Engineering Services 6 — (4) (1)Transportation 20 — 164 —Corporate and Elimination — 53 (53) 33
$ 30 $ 673 $ 485 $ 5,392EBITBusiness Aircraft $ 99 $ (352) $ 477 $ (1,252)Commercial Aircraft (144) (327) (903) (3,970)Aerostructures and Engineering Services 24 (9) 128 105Transportation 161 123 396 465Corporate and Elimination (66) (92) (156) (186)
$ 74 $ (657) $ (58) $ (4,838)(1) Non-GAAP financial measure. Refer to the Non-GAAP financial measures section for a definition of this metric.

16 BOMBARDIER INC. FINANCIAL REPORT - FISCAL YEAR ENDED DECEMBER 31, 2016
Analysis of consolidated results
Detailed analyses of revenues and EBIT are provided in each reportable segment’s Analysis of results section.
Special items
Special items comprise items which do not reflect our core performance or where their separate presentation will assist users in understanding our results for the period, such as the impact of restructuring charges and significant impairment charges and reversals.
Special items were as follows:
Fourth quarters ended December 31
Fiscal years ended December 31
Ref 2016 2015 2016 2015Onerous contracts provision - C Series aircraft program 1 $ — $ — $ 492 $ —Restructuring charges 2 35 — 215 9Pension obligation 3 — — (139) —Loss on repurchase of long-term debt 4 86 — 86 22Impairment and other charges - Learjet 85 aircraft program 5 (5) — (59) 1,163Tax litigation 6 — 50 40 50Foreign exchange gains related to the sale of a minority stake in Transportation 7 — — (38) —Transaction costs related to the conversion option embedded in the CDPQ investment 8 — — 8 —Impairment and other charges - C Series aircraft program 9 — — — 3,235Changes in estimates and fair value 10 — — — 353Impairment charge - CRJ1000 aircraft program 11 — 243 — 243Write-off of deferred costs 12 — 194 — 194Termination of sales representative and distribution agreements 13 — 133 — 133Impairment charge - Learjet family of aircraft 14 — 53 — 53Tax impacts of special items 15 (1) — (20) 106
$ 115 $ 673 $ 585 $ 5,561Of which is presented in
Special items in EBIT $ 30 $ 673 $ 485 $ 5,392Financing expense - loss on repurchase of long-term debt 4 86 — 86 22Financing expense - interest related to tax litigation 6 — — 26 —Financing expense - transaction costs related to the conversion option embedded in the CDPQ investment 8 — — 8 —Financing expense - loss on financial instruments 10 — — — 41Income taxes - effect of special items 15 (1) — (20) 106
$ 115 $ 673 $ 585 $ 5,561
1. Represents an onerous contracts provision in conjunction with the closing of C Series aircraft firm orders in the second quarter of 2016. The special item is net of $24 million in Corporate and Elimination.
2. In fiscal year 2016, restructuring charges were comprised of severance charges of $227 million, partially offset by curtailment gains of $22 million, and impairment charges of PP&E of $10 million, related to restructuring actions announced in February 2016 and October 2016 (severance charges of $28 million, curtailment gains of $3 million, and impairment charges of PP&E of $10 million in the fourth quarter ended December 31, 2016).
In 2015, included restructuring charges of $13 million related to the workforce reduction announced in January 2015 as a result of the decision to pause the Learjet 85 aircraft program, partially offset by $4 million of adjustments to restructuring provisions recorded in 2014.

BOMBARDIER INC. / 2016 FINANCIAL REPORT / OVERVIEW 17
3. Bombardier had a constructive obligation for discretionary ad hoc indexation increases to certain pension plans. Following a communication to plan members that we do not expect to grant such increases in the foreseeable future in line with our current practice, the constructive obligation amounting to $139 million was reversed.
4. In the fourth quarter and fiscal year ended December 31, 2016, represents the loss related to the redemption of the $650-million and $750-million Senior Notes due 2018. In fiscal year 2015, represents the loss related to the redemption of the $750-million Senior Notes due 2016.
5. In 2015, represents an impairment charge of $919 million on aerospace program tooling (including a credit of $6 million in Corporate and Elimination), inventory write-downs, write-downs of other assets, PP&E and other intangible assets, other provisions and other financial liabilities of $244 million, as a result of the cancellation of the Learjet 85 aircraft program due to the lack of sales following the prolonged market weakness.
Based on the ongoing activities with respect to the cancellation of the Learjet 85 aircraft program, in 2016 we reduced the related provisions by $59 million, of which $5 million was recorded in the fourth quarter. The reduction in provisions is treated as a special item since the original provisions were also recorded as special charges in 2014 and 2015.
6. Represents a change in the estimates used to determine the provision related to tax litigation.
7. Represents foreign exchange gains related to the reorganization of Transportation under one holding entity necessary to facilitate the placement of a minority stake investment in Transportation.
8. Represents transaction costs attributable to the conversion option embedded in the CDPQ investment in BT Holdco.
9. Represents an impairment charge of $3.1 billion on aerospace program tooling, and inventory write-downs and other provisions of $165 million, following the completion of an in-depth review of the C Series aircraft program as well as discussions with the Government of Québec which resulted in the October 2015 memorandum of understanding. The special item includes a credit of $14 million in Corporate and Elimination.
10. Represents an increase in provisions for credit guarantees and RVGs as a result of changes in assumptions concerning residual value curves of regional aircraft due to difficult market conditions for regional pre-owned aircraft and a higher probability that the guaranteed party will exercise the RVG given the recent experience with respect to RVGs and a loss on certain financial instruments due to changes in estimated fair value.
11. Represents an impairment charge of $243 million on the remaining CRJ1000 aircraft program development costs. The impairment was due to the lack of recent order intake as well as low firm order backlog for the CRJ1000 aircraft, mainly stemming from pilot scope clauses in the U.S., which have restricted the use, number and seating capacity of regional aircraft flying on behalf of network carriers. Over the near term, we do not anticipate scope clause relaxation in the U.S., during which time, we will not be able to sell the CRJ1000 aircraft in the U.S. market. The special item included a charge of $3 million in Corporate and Elimination.
12. Mainly related to restructuring of customer commercial agreements.
13. Costs incurred in connection with the termination of third-party sales representative and distribution agreements to increase the number of direct-to-market channels.
14. Represents an impairment charge on the remaining Learjet family aerospace program tooling, following the prolonged market weakness in the light business aircraft category.
15. In 2015, represents net write-downs of deferred income tax assets, mainly due to the reorganization and consolidation of Transportation under one holding entity necessary to facilitate the planned placement of a minority stake investment in Transportation. These write-downs had a significant impact on the effective income tax rate in 2015.

18 BOMBARDIER INC. FINANCIAL REPORT - FISCAL YEAR ENDED DECEMBER 31, 2016
Net financing expense
Net financing expense amounted to $232 million and $749 million, respectively, for the fourth quarter and fiscal year ended December 31, 2016, compared to $74 million and $348 million for the corresponding periods last fiscal year.
The $158-million increase for the fourth quarter is mainly due to:• a loss on repurchase of long-term debt(1) ($86 million), recorded as a special item; • lower borrowing costs capitalized to PP&E and intangible assets following type certification of the CS100
and CS300 aircraft in December 2015 and July 2016, respectively ($44 million); and• higher interest on long-term debt, after the effect of hedges ($22 million).Partially offset by:• higher financing income from changes in discount rates of provisions ($16 million).
The $401-million increase for the fiscal year is mainly due to:• lower borrowing costs capitalized to PP&E and intangible assets following type certification of the CS100
and CS300 aircraft in December 2015 and July 2016, respectively ($183 million);• higher interest on long-term debt, after the effect of hedges ($76 million);• a higher loss on repurchase of long-term debt(1) ($64 million), recorded as special items; and• interest related to a tax litigation provision ($26 million), recorded as a special item.
(1) In the fourth quarter and fiscal year ended December 31, 2016, represents the loss related to the redemption of the $650-million and $750-million Senior Notes due 2018. In fiscal year 2015, represents the loss related to the redemption of the $750-million Senior Notes due 2016.
Income taxes
The effective income tax rates for the fourth quarter and fiscal year ended December 31, 2016 were (63.9)% and (21.6)%, respectively, compared to the statutory income tax rate in Canada of 26.8%.
The negative effective income tax rates in the fourth quarter and fiscal year ended December 31, 2016, are mainly due to:
• the net non-recognition of income tax benefits related to tax losses and temporary differences; and• the write-down of deferred income tax assets.
The effective income tax rates for the fourth quarter and fiscal year ended December 31, 2015 were 7.4% and (3.0)%, respectively, compared to the statutory income tax rate in Canada of 26.8%.
For the fourth quarter ended December 31, 2015, the lower effective tax rate was mainly due to the net non-recognition of income tax benefits related to tax losses and temporary differences mainly due to the impairment charges recorded as special items in relation to the CRJ1000 aircraft program and Learjet family of aircraft as well the other special items recorded in the fourth quarter of 2015.
The negative effective income tax rate in fiscal year 2015 was due to:• the net non-recognition of income tax benefits related to tax losses and temporary differences mainly due
to the impairment and other charges recorded as special items related to the C Series aircraft program and Learjet 85 aircraft program; and
• the net write-downs of deferred income tax assets, mainly due to the reorganization and consolidation of Transportation under one holding entity necessary to facilitate the planned investment in a minority stake in Transportation recorded as a special item.
Partially offset by:• the positive impacts of the income tax rate differential of foreign subsidiaries.

BOMBARDIER INC. / 2016 FINANCIAL REPORT / OVERVIEW 19
CONSOLIDATED FINANCIAL POSITIONThe total assets decreased by $77 million in the fiscal year, including a negative currency impact of $527 million related to foreign exchange. The $450-million increase excluding currency impacts is mainly explained by:• a $1.2-billion increase in aerospace program
tooling including $344 million of acquired development costs carried out by our vendors and recognized at the first delivery of the CS100 aircraft. See the Investment in product development tables in Business Aircraft and Commercial Aircraft for details; and
• a $916-million increase in cash and cash equivalents. See the Free cash flow usage and the Variation in cash and cash equivalents tables for details.
Partially offset by:• a $1.0-billion decrease in gross inventories
mainly in Business Aircraft’s aerospace program inventories;
• a $226-million decrease in other assets mainly due to a decrease in retirement benefit assets;
• a $155-million decrease in trade and other receivables mainly in Transportation; and
• a $134-million increase in advances and progress billings related to Transportation.
The total liabilities and equity decreased by $77 million in the fiscal year, including a currency impact of $527 million. The $450-million increase excluding currency impacts is mainly explained by:• a $761-million increase in equity, mainly due to
the issuance of NCI of $2.2 billion due to the sale of convertible shares of BT Holdco to CDPQ and the investment by the Government of Québec in the CSALP, partially offset by a net loss of $1.0 billion and other comprehensive loss of $610 million of which $692 million relates to a loss on remeasurement of defined benefit plans;
• a $521-million increase in the retirement benefit liability. See the Variation in net retirement benefit liability table for details; and
• a $271-million increase in provisions mainly due to the onerous contracts provision recorded in conjunction with the closing of C Series aircraft firm orders.
Partially offset by: • a $709-million decrease in trade and other
payables mainly in Business Aircraft and Transportation; and
• a $451-million decrease in advances on aerospace programs mainly in Business Aircraft, partially offset by Commercial Aircraft.
* Includes a deficit of $3.5 billion as at December 31, 2016 and $4.1 billion as at December 31, 2015.

20 BOMBARDIER INC. FINANCIAL REPORT - FISCAL YEAR ENDED DECEMBER 31, 2016
LIQUIDITY AND CAPITAL RESOURCES
Free cash flowFree cash flow (usage)(1)
Fourth quarters ended December 31
Fiscal years ended December 31
2016 2015 2016 2015Net loss $ (259) $ (677) $ (981) $ (5,340)Non-cash items
Amortization 99 123 371 438Impairment charges on PP&E and intangible assets 10 296 10 4,300Deferred income taxes 121 (55) 31 63Share of income of joint ventures and associates (65) (96) (126) (149)Loss on repurchase of long-term debt 86 — 86 22Other — — 3 11
Dividends received from joint ventures and associates 31 18 141 77Net change in non-cash balances 800 1,461 602 598Cash flows from operating activities 823 1,070 137 20Net additions to PP&E and intangible assets (327) (543) (1,201) (1,862)Free cash flow (usage)(1) 496 527 (1,064) (1,842)Net interest and income taxes received (paid) (139) 48 (651) (348)Free cash flow (usage) before net interest and income taxes received or paid(1) $ 635 $ 479 $ (413) $ (1,494)
Our free cash flow usage(1) of $1.1 billion for the year was better than our lower end of the range provided in our guidance.
The $31-million deterioration of free cash flow(1) for the fourth quarter is mainly due to:• a negative period-over-period variation in net change in non-cash balances before special items(2) recorded
during the fourth quarters of 2016 and 2015 ($304 million) mainly due to:• negative variances in other assets, other liabilities and net other financial assets and liabilities; • severance payments related to our transformation actions; and• the ramp-up in production for the C Series aircraft program.
Partially offset by:• improved working capital reflecting our transformation plan.
Partially offset by:• lower net additions to PP&E and intangible assets ($216 million) following certification of both the CS100
and CS300 aircraft.
The $778-million improvement of free cash flow usage(1) for the fiscal year is mainly due to:• lower net additions to PP&E and intangible assets ($661 million) following certification of both the CS100
and CS300 aircraft; and• a positive period-over-period variation in net change in non-cash balances before special items(2) recorded
during 2016 and 2015 ($621 million) mainly due to:• improved working capital reflecting our transformation plan.
Partially offset by:• negative variances in net other financial assets and liabilities and retirement benefits liability, excluding
the impact of the remeasurement of defined benefit plans included in OCI;• the ramp-up in production for the C Series aircraft program; and• severance payments related to our transformation actions.
(1) Non-GAAP financial measures. Refer to the Non-GAAP financial measures section for definitions of these metrics.(2) Special items presented in EBIT, except impairment charges on PP&E and intangible assets. Refer to the Consolidated results of operations
for details regarding special items. Also refer to the Reconciliation of EBITDA before special items and EBITDA to EBIT table in the Non-GAAP financial measures section.

BOMBARDIER INC. / 2016 FINANCIAL REPORT / OVERVIEW 21
Partially offset by:• higher net loss before non-cash items and special items(1) recorded during 2016 and 2015 ($568 million),
mainly due to higher interest expense and the ramp-up in production for the C Series aircraft program.
Net change in non-cash balancesFor the fourth quarter ended December 31, 2016, the $800-million inflow is mainly due to:
• a decrease in inventories, mainly related to Business Aircraft’s aerospace program inventories for the medium and large aircraft categories and a decrease in Transportation’s inventories following deliveries, partly offset by ramp-up in production.
Partially offset by:• a decrease in Business Aircraft’s advances on aerospace programs, mainly in the medium and large
aircraft categories, partially offset by an increase in Commercial Aircraft’s advances on aerospace programs in all aircraft categories.
For the fourth quarter ended December 31, 2015, the $1.5-billion inflow was mainly due to:• a decrease in Transportation’s inventories following deliveries, partly offset by ramp-up in production;• a decrease in Business Aircraft’s aerospace program inventories; • a decrease in other assets mainly related to the write-off of deferred costs due to the restructuring of
customer commercial agreements recorded as a special item;• an increase in other liabilities in Transportation mainly related to sales taxes;• a decrease in net other financial assets and liabilities mainly due to the termination of third-party sales
representative and distribution agreements recorded as a special item and the settlement of an interest rate swap agreement; and
• an increase in trade and other payables. Partially offset by:
• a decrease in Business Aircraft’s advances on aerospace programs mainly resulting from lower order intake than deliveries;
• a decrease in Transportation’s advances and progress billings following deliveries, partly offset by advances on existing contracts and new orders; and
• an increase in Transportation’s trade and other receivables.
For the fiscal year ended December 31, 2016, the $602-million inflow is mainly due to:• a decrease in Business Aircraft’s inventories mainly in the large and medium aircraft categories as well as
in pre-owned aircraft;• an increase in Transportation’s advances and progress billings on new orders and existing contracts;• an increase in Commercial Aircraft’s advances on aerospace programs mainly for the C Series aircraft
program;• an increase in provisions, mainly due to the C Series aircraft program onerous contracts provision
recorded as a special item in the second quarter; and• a decrease in trade and other receivables, mainly in Transportation.
Partially offset by:• a decrease in Business Aircraft’s advances on aerospace programs;• a decrease in trade and other payables, mainly in Business Aircraft and Transportation;• a change in retirement benefit liability, excluding the impact of the remeasurement of defined benefit plans
included in OCI, mainly related to employer contributions and the reversal of a constructive obligation for discretionary ad hoc indexation increases to certain pensions, recorded as a special item in the second quarter, following a communication to plan members that we do not expect to grant such increases in the foreseeable future in line with our current practice; and
• an increase in Commercial Aircraft’s inventories, mainly due to the C Series aircraft program, due to the ramp-up in production and including the impacts of write-downs on early production units(2), partially offset by a decrease in regional aircraft.
(1) Special items presented in EBIT, except impairment charges on PP&E and intangible assets. Refer to the Consolidated results of operations for details regarding special items. Also refer to the Reconciliation of EBITDA before special items and EBITDA to EBIT table in the Non-GAAP financial measures section.
(2) Early production units in a new aircraft program require higher costs than units produced later in the program and the selling prices of early units are generally lower.

22 BOMBARDIER INC. FINANCIAL REPORT - FISCAL YEAR ENDED DECEMBER 31, 2016
For the fiscal year ended December 31, 2015, the $598-million inflow was mainly due to:• an increase in provisions, mainly for Commercial Aircraft, including an increase in provisions for credit and
RVGs as well as other provisions recorded in special items, and Business Aircraft, including the impacts of the Learjet 85 aircraft program cancellation recorded in special items;
• a decrease in net other financial assets and liabilities, mainly due to the termination of third-party sales representative and distribution agreements recorded as a special item and the settlement of an interest rate swap agreement;
• a decrease in Business Aircraft’s aerospace program inventories; • an increase in Transportation’s advances and progress billings on existing contracts and new orders;• an increase in retirement benefits liability mainly related to Transportation; • a decrease in other assets mainly related to the write-off of deferred costs due to the restructuring of
customer commercial agreements recorded as a special item; and • a decrease in Business Aircraft finished product inventories mainly in pre-owned aircraft inventories.
Partially offset by:• a decrease in advances on aerospace programs mainly resulting from lower order intake than deliveries;
and• an increase in Transportation’s inventories following ramp-up of production ahead of deliveries.
Available short-term capital resources
We continuously monitor our level of liquidity, including available short-term capital resources and cash flows from operations, to meet expected requirements, including the support of product development initiatives and to ensure financial flexibility. In evaluating our liquidity requirements, we take into consideration historic volatility and seasonal needs, the maturity profile of long-term debt, the funding of product development programs, the level of customer advances, working capital requirements, the economic environment and access to capital markets. We use scenario analyses to stress-test cash flow projections.
Variation in cash and cash equivalentsFourth quarters
ended December 31Fiscal years
ended December 312016 2015 2016 2015
Balance at the beginning of period/fiscal year $ 3,392 $ 2,344 $ 2,720 $ 2,489Net proceeds from the sale of minority stakes in subsidiaries (1) — 2,418 —Repayments of long-term debt (1,510) (15) (1,566) (831)Net proceeds from issuance of long-term debt 1,366 — 1,367 2,218Free cash flow (usage)(1) 496 527 (1,064) (1,842)Effect of exchange rate changes on cash and cash equivalents (153) (36) (252) (104)Dividends paid to NCI (33) — (77) —Purchase of Class B shares held in trust under the PSU and RSU plans — — (43) (9)Dividends paid (4) (5) (17) (19)Net change in short-term borrowings (84) — — —Net proceeds from issuance of shares — — — 822Proceeds from investment in financing structure — — — 150Net variation in AFS investments in securities — — — (10)Other (85) (95) (102) (144)
Balance at the end of period/fiscal year $ 3,384 $ 2,720 $ 3,384 $ 2,720(1) Non-GAAP financial measure. Refer to the Non-GAAP financial measures section for a definition of this metric and the Free cash flow
(usage) table hereinbefore for reconciliations to the most comparable IFRS measure.
On February 11, 2016, we closed the sale and received gross proceeds of $1.5 billion from the CDPQ for an investment in convertible shares in Transportation’s newly-created holding company, Bombardier Transportation (Investment) UK Limited (BT Holdco). The CDPQ’s shares are convertible into a 30% common equity stake of BT Holdco, subject to annual adjustments related to performance. The funds from the investment were distributed to the Corporation in the first quarter of 2016 and are being used for general corporate purposes. The parties have agreed that Bombardier will maintain a consolidated cash position at the end of each quarter of at least

BOMBARDIER INC. / 2016 FINANCIAL REPORT / OVERVIEW 23
$1.25 billion. This requirement was met as at the end of each quarter of 2016. In the event Bombardier’s cash position falls below that level, the Board of Directors of Bombardier will create a Special Initiatives Committee composed of three independent directors acceptable to the CDPQ to develop an action plan to improve cash. The implementation of the plan, once agreed with the CDPQ, will be overseen by the Special Initiatives Committee. Refer to the Sale of a minority share section in Transportation for more detail.
On June 30, 2016, we closed the $1.0-billion investment by the Government of Québec (through Investissement Québec) in return for a 49.5% equity stake in a newly created limited partnership, the CSALP, to which we have transferred the assets, liabilities and obligations of the C Series aircraft program. On June 30, 2016 and September 1, 2016, we received the investment in two installments of $500 million each. The proceeds of the investment are being used entirely for the cash flow purposes of the C Series aircraft program. Refer to the Strategic partnership section in Commercial Aircraft for more detail.
Subsequent to the end of the fiscal year, we announced that the Government of Canada will provide $372 million Canadian dollars (approximately $283 million) over four years in repayable contributions in relation to the Global 7000 and Global 8000 as well as the C Series aircraft programs, to be repaid through royalties on aircraft delivery, which further enhances our financial flexibility as we execute our plan.
Available short-term capital resourcesAs at
December 31, 2016 December 31, 2015Cash and cash equivalents $ 3,384 $ 2,720Available revolving credit facilities 1,093 1,294Available short-term capital resources $ 4,477 $ 4,014
Our available short-term capital resources include cash and cash equivalents and the amounts available under our two unsecured revolving credit facilities. These facilities are available for cash drawings for the general needs of the Corporation. Under these facilities, the same financial covenants must be met as for our letter of credit facilities. Refer to the Financial covenants section for details.
In March and April 2016, respectively, we extended the maturity dates of Transportation’s €500-million and the $750-million(1) unsecured revolving credit facilities to October 2018 and June 2019, respectively. During the second quarter of 2016, Transportation’s €500-million unsecured revolving credit facility was increased to €658 million ($693 million) and the $750-million(1) unsecured revolving credit facility was decreased to $400 million, in light of our cash position. In October 2016, we further extended the maturity date of Transportation’s €658-million ($693-million) unsecured revolving credit facility by one year to October 2019.(1) Available for other than Transportation’s usage.
Some totals do not agree due to rounding.
Letter of credit facilities
Letter of credit facilities are only available for the issuance of letters of credit. As these facilities are unfunded commitments from banks, they typically provide better pricing for the Corporation than credit facilities that are available for cash drawings. Letters of credit are generally issued in support of performance obligations and advance payments received from customers.

24 BOMBARDIER INC. FINANCIAL REPORT - FISCAL YEAR ENDED DECEMBER 31, 2016
In April 2016, we extended the availability periods of Transportation’s €3.64-billion and the $600-million(1) letter of credit facilities by one year to May 2019 and June 2019, respectively. Also in April 2016, the committed amount under the $600-million(1) letter of credit facility was decreased to $400 million. In May 2016, the committed amount under Transportation’s €3.64-billion letter of credit facility was decreased to €3.31 billion ($3.5 billion).
As at December 31, 2016, we had $3.9 billion committed under the Transportation and the $400-million(1) letter of credit facilities ($4.6 billion as at December 31, 2015). Letters of credit issued under these facilities amounted to $3.4 billion as at December 31, 2016 ($3.4 billion as at December 31, 2015).
In addition to the outstanding letters of credit mentioned above, letters of credit of $1.9 billion were outstanding under various bilateral agreements and $206 million under the PSG facility as at December 31, 2016 ($1.7 billion and $173 million, respectively, as at December 31, 2015).
We also use numerous bilateral bonding facilities with insurance companies to support Transportation’s operations. An amount of $2.9 billion was outstanding under such facilities as at December 31, 2016 ($2.6 billion as at December 31, 2015).
See Note 31 – Credit facilities, to the consolidated financial statements, for additional information.(1) Available for other than Transportation’s usage.
Financial covenants
Under the Transportation and the $400-million(1) letter of credit facilities and our two unsecured revolving credit facilities available for cash drawings, we must maintain various financial covenants, which must be met on a quarterly basis.
The $400-million(1) letter of credit facility and the $400 million unsecured revolving facility include financial covenants requiring a minimum EBITDA to fixed charges ratio, a maximum gross debt threshold, a minimum EBITDA threshold and a minimum liquidity level of $750 million at the end of each quarter, all calculated based on an adjusted consolidated basis (i.e. excluding Transportation).
Transportation’s €3.31-billion ($3.5-billion) letter of credit facility and €658-million ($693 million) unsecured revolving facility financial covenants require a minimum liquidity level of €600 million ($632 million), a minimum equity level and a maximum debt to EBITDA ratio at the end of each quarter, all calculated on a Transportation stand-alone basis.
These terms and ratios are defined in the respective agreements and do not correspond to our global metrics or to any specific terms used in the MD&A. Minimum liquidity is not defined as comprising only cash and cash equivalents as presented in the consolidated statement of financial position. A breach of any of these agreements or the inability to comply with these covenants could result in a default under these facilities, which would permit our banks to request immediate defeasance or cash cover of all outstanding letters of credit, and bond holders and other lenders to declare amounts owed to them to be immediately payable.
The financial covenants under these credit facilities were all met on a quarterly basis throughout 2016 and 2015. (1) Available for other than Transportation’s usage.
On balance sheet sale and leaseback facilities
Business Aircraft enters into sale and leaseback facilities with third parties under which it can sell certain pre-owned business aircraft and lease them back for a period not greater than 24 months. We have the right to buy the aircraft back during the term of the lease for predetermined amounts. As at December 31, 2016, we had sale and leaseback facilities with third parties under which a total of $25 million was outstanding as at December 31, 2016 ($133 million as at December 31, 2015).

BOMBARDIER INC. / 2016 FINANCIAL REPORT / OVERVIEW 25
Future liquidity requirements
Our aerospace segments require capital to develop industry-leading products and to seize strategic opportunities to increase competitiveness and execute growth strategies. We take advantage of favourable capital market conditions when they materialize to extend debt maturity, reduce cost of funds and increase diversity of capital resources.
On an on-going basis, we manage our liabilities by taking into consideration expected free cash flows(1), debt repayments and other material cash outlays expected to occur in the future. We have a financing plan to position ourselves with a flexible and strong financial profile whereby we access capital markets, depending on market conditions, for the issuance of equity and new long-term debt capital. (1) Non-GAAP financial measure. Refer to the Non-GAAP financial
measures section for a definition of this metric.
In line with this financing plan, in December 2016, we issued unsecured Senior Notes of $1.4 billion, bearing a coupon rate of 8.75% and due on December 1, 2021. The proceeds from the Senior Notes was used to finance the optional early redemption of the $750-million Senior Notes bearing interest at 5.50% due in September 2018 and the $650-million Senior Notes bearing interest at 7.50% due in March 2018. The weighted average long-term debt maturity was 5.8 years as at December 31, 2016. There is no significant debt maturing before 2019.
Expected timing of future liquidity requirementsDecember 31, 2016
TotalLess than
1 year 1 to 3 years 3 to 5 years ThereafterLong-term debt(1) $ 8,596 $ 31 $ 623 $ 3,113 $ 4,829Interest payments 3,618 590 1,162 991 875Operating lease obligations 979 143 224 137 475Purchase obligations(2) 12,446 4,120 7,004 1,276 46Trade and other payables 3,239 3,176 17 1 45Other financial liabilities 1,404 107 218 275 804Derivative financial liabilities 457 426 30 — 1
$ 30,739 $ 8,593 $ 9,278 $ 5,793 $ 7,075(1) Includes principal repayments only. (2) Purchase obligations represent contractual agreements to purchase goods or services in the normal course of business that are legally
binding and specify all significant terms, including fixed or minimum quantities to be purchased; fixed, minimum, variable or indexed price provisions; and the appropriate timing of the transaction. These agreements are generally cancellable with a substantial penalty. Purchase obligations are generally matched with revenues over the normal course of operations.
The table above presents the expected timing of contractual liquidity requirements. Other payments contingent on future events, such as payments in connection with credit and residual value guarantees related to the sale of aircraft and product warranties have not been included in the above table because of the uncertainty of the amount and timing of payments arising from their contingent nature. In addition, required pension contributions have not been reflected in this table as such contributions depend on periodic actuarial valuations for funding purposes. For 2017, contributions to retirement benefit plans are estimated at approximately $350 million (see the Retirement benefits section for more details). The amounts presented in the table represent the undiscounted payments and do not give effect to the related hedging instruments, if applicable.
Our available short-term capital resources of $4.5 billion give us sufficient liquidity to execute our plan. We consider that these resources will enable the development of new products to enhance our competitiveness and

26 BOMBARDIER INC. FINANCIAL REPORT - FISCAL YEAR ENDED DECEMBER 31, 2016
support our growth; will allow the payment of dividends, if and when declared by the Board of Directors; and will enable us to meet all other expected financial requirements in the foreseeable future.
Creditworthiness
We assess and manage creditworthiness using the global metrics as described in the Capital structure section. We continuously monitor our capital structure to ensure sufficient liquidity to fund product development programs. Our goal is to strengthen our global metrics and credit ratings. Our objective also includes improving our leverage metrics by gradually de-leveraging the balance sheet with strategic long-term debt repayments in line with active management of consolidated liquidity, weighted-average cost of capital and term structure.
Credit RatingsInvestment-grade rating Bombardier Inc.’s rating
February 15, 2017 December 31, 2015Fitch Ratings Ltd. BBB- B BMoody’s Investors Service, Inc. Baa3 B2 B2Standard & Poor’s Rating Services BBB- B- B
Over the long term, we believe that we will be in a good position to improve our credit ratings as we progress towards profitability targets and return to a more normalized level of investment in product development.
CAPITAL STRUCTUREWe analyze our capital structure using global metrics, which are based on a broad economic view of the Corporation, in order to assess the creditworthiness of the Corporation. These global metrics are managed and monitored in order to achieve an investment-grade profile.
Reconciliations of these measures to the most comparable IFRS financial measures are in the Non-GAAP financial measures section. Adjusted EBIT and adjusted EBITDA exclude special items, such as restructuring charges, significant impairment charges and reversals, as well as other significant unusual items, which we do not consider to be representative of our core performance.
Our objectives with regard to the global metrics are as follows:• adjusted EBIT to adjusted interest ratio greater than 5.0; and• adjusted debt to adjusted EBITDA ratio lower than 2.5.
Interest coverage ratioFiscal year ended December 31
2016 2015Adjusted EBIT(1) $ 498 $ 777Adjusted interest(1) $ 618 $ 503Adjusted EBIT to adjusted interest ratio 0.8 1.5
(1) Non-GAAP financial measures. Refer to the Non-GAAP financial measures section for definitions of these metrics and reconciliations to the most comparable IFRS measures.
The interest coverage ratio deteriorated as a result of:• lower adjusted EBIT, mainly due to lower EBITDA before special items as a result of the ramp up of the
C Series aircraft program as well as lower interest received, attributable to the interest portion related to the settlement of an interest-rate swap agreement recognized in the fourth quarter of 2015; and
• higher adjusted interest, due to higher interest paid, mainly attributable to unsecured Senior Notes issued in March 2015, as well as higher rates following the settlement of the interest-rate swap agreement in 2015.

BOMBARDIER INC. / 2016 FINANCIAL REPORT / OVERVIEW 27
Financial leverage ratioAs at and for the fiscal year ended December 31
2016 2015Adjusted debt(1) $ 9,184 $ 9,289Adjusted EBITDA(1) $ 943 $ 1,278Adjusted debt to adjusted EBITDA ratio 9.7 7.3
While adjusted debt remained stable, the financial leverage ratio deteriorated as a result of lower adjusted EBITDA, mainly due to lower EBITDA before special items(1) as a result of the ramp up of the C Series aircraft program as well as lower interest received, attributable to the interest portion related to the settlement of an interest-rate swap agreement recognized in the fourth quarter of 2015.
These global metrics do not represent the calculations required for bank covenants. They represent our key business metrics and as such are used to analyze our capital structure. For compliance purposes, we regularly monitor our bank covenants to ensure they are all met.
In addition to the above global metrics, we separately monitor our net retirement benefit liability which amounted to $2.5 billion as at December 31, 2016 ($1.9 billion as at December 31, 2015). The measurement of this liability is dependent on numerous key long-term assumptions such as discount rates, future compensation increases, inflation rates and mortality rates. In recent years, this liability has been particularly volatile due to changes in discount rates. Such volatility is exacerbated by the long-term nature of the obligation. We closely monitor the impact of the net retirement benefit liability on our future cash flows and we have introduced significant risk mitigation initiatives in recent years to gradually reduce key risks associated with the retirement benefit plans. See the Retirement benefits section for further details.(1) Non-GAAP financial measures. Refer to the Non-GAAP financial measures section for definitions of these metrics and reconciliations to the
most comparable IFRS measures.
RETIREMENT BENEFITS
Overview of retirement benefit plans
Bombardier sponsors several Canadian and foreign retirement benefit plans consisting of funded and unfunded pension plans, as well as other unfunded defined benefit plans. Funded plans are plans for which segregated plan assets are invested in trusts. Unfunded plans are plans for which there are no segregated plan assets, as the establishment of segregated plan assets is generally not permitted or not in line with local practice. Therefore unfunded plans will always be in a deficit position.
Pension plans are categorized as DB or DC. DB plans specify the amount of benefits an employee is to receive at retirement, while DC plans specify how contributions are determined. As a result, there is no deficit or surplus for DC plans. Hybrid plans are a combination of DB and DC plans.
F: Forecast
Retirement benefit contributions to DB pension plans have remained stable at $262 million in 2016, compared to $264 million the previous year, and is expected to remain at a similar level in 2017.

28 BOMBARDIER INC. FINANCIAL REPORT - FISCAL YEAR ENDED DECEMBER 31, 2016
Net retirement benefit liability
The decrease in discount rates is the main reason for the increase of $615 million in the net retirement benefit liability from $1.9 billion as at December 31, 2015 to $2.5 billion as at December 31, 2016.
* Includes liability arising from minimum funding requirement and impact of asset ceiling test, if any.

BOMBARDIER INC. / 2016 FINANCIAL REPORT / OVERVIEW 29
Variation in net retirement benefit liabilityBalance as at December 31, 2015 $ 1,908 (1)
Changes in discount rates and other financial assumptions 1,259Other net actuarial gains on defined benefit obligations (1)Service costs 104Changes in foreign exchange rates (65)Employer contributions (273)Actuarial gains on pension plan assets (494)Accretion on net retirement benefit obligation 66Other 19
Balance as at December 31, 2016 $ 2,523 (1)
(1) Includes retirement benefit assets of $124 million as at December 31, 2016 ($251 million as at December 31, 2015) included in Other assets.
The value of plan assets is highly dependent on the pension funds’ asset performance and on the level of contributions. The performance of the financial markets is a key driver in determining the funds’ asset performance as assets in the plans are composed mostly of publicly traded equity and fixed income securities. IFRS requires that the excess (deficit) of actual return on plan assets compared to the estimated return be reported as an actuarial gain or loss in OCI. The estimated return on plan assets must be calculated using the discount rate that is used to measure the net retirement benefit liability, which is derived using high-quality corporate bond yields. During 2016, as the actual gain on plan assets ($804 million) was above expected return, an actuarial gain of $494 million was recognized.
DB plan contributions are estimated at $263 million for 2017. The future level of contributions will be impacted by the evolution of market interest rates and the actual return on plan assets.
* Mainly comprised of changes in discount rates.** Other is mainly comprised of changes in other actuarial
assumptions, experience adjustments and impact of asset ceiling.
In Canada and the U.S., since September 1, 2013, all new non-unionized employees join DC plans (they no longer have the option of joining DB or hybrid plans). In the U.K., eight of nine DB plans are closed to new members. Employees who are members of a DB or hybrid plan closed to new members continue to accrue service in their original plan. As a result of these changes, contributions to DC plans have increased over the past several years. In 2016, DC pension contributions totaled $84 million. These contributions are estimated at $87 million for 2017.
Investment Policy
The investment policies are established to achieve a long-term investment return so that, in conjunction with contributions, the plans have sufficient assets to pay for the promised benefits while maintaining a level of risk that is acceptable given the tolerance of plan stakeholders. See below for more information regarding risk management initiatives.

30 BOMBARDIER INC. FINANCIAL REPORT - FISCAL YEAR ENDED DECEMBER 31, 2016
The target asset allocation is determined based on expected economic and market conditions, the maturity profile of the plans’ liabilities, the funded status of the respective plans and the plan stakeholders’ tolerance to risk.
The plans’ investment strategy is to invest broadly in fixed income and equity securities and to have a smaller portion of the funds’ assets invested in real return asset securities (including global infrastructure and real estate listed securities).
As at December 31, 2016, the average target asset allocation was as follows: • 52%, 54% and 51% in fixed income securities, for Canadian, U.K. and U.S. plans, respectively;• 38%, 31% and 44% in equity securities, for Canadian, U.K. and U.S. plans, respectively; and• 10%, 15% and 5% in real return asset securities, for Canadian, U.K. and U.S. plans, respectively.
In addition, to mitigate interest rate risk, interest rate hedging overlay portfolios (comprised of long-term interest rate swaps and/or long-term bond forwards) were implemented in November 2016 for a small plan and will be implemented for other plans when the market will be favourable and the plans’ triggers will be reached.
The plan administrators have also established dynamic de-risking strategies. As a result, asset allocation will likely become more conservative in the future and interest rate hedging overlay portfolios are likely to be established as plan funding status and market conditions continue to improve. Bombardier Inc. Pension Asset Management Services monitors the de-risking triggers on a daily basis to ensure timely and efficient implementation of these strategies. The Corporation and administrators periodically undertake asset and liability studies to determine the appropriateness of the investment policies and de-risking strategies.
Risk management initiatives
Our pension plans are exposed to various risks, including equity, interest rate, inflation, foreign exchange, liquidity and longevity risks. Several risk strategies and policies have been put in place to mitigate the impact these risks could have on the funded status of DB plans and on the future level of contributions. The following is a description of key risks together with the mitigation measures in place to address them.
Equity riskEquity risk results from fluctuations in equity prices. This risk is managed by maintaining diversification of portfolios across geographies, industry sectors and investment strategies.
Interest rate riskInterest rate risk results from fluctuations in the fair value of plan assets and liabilities due to movements in interest rates. This risk is managed by reducing the mismatch between the duration of plan assets and the duration of pension obligation. This is accomplished by having a portion of the portfolio invested in long-term fixed income securities and interest rate hedging overlay portfolios.
Inflation riskInflation risk is the risk that benefits indexed to inflation increase significantly as a result of changes in inflation rates. To manage this risk, the benefit indexation has been capped in certain plans and a portion of plan assets has been invested in real return fixed income securities and real return asset securities.
Foreign exchange riskCurrency risk exposure arises from fluctuations in the fair value of plan assets denominated in a currency other than the currency of the plan liabilities. Currency risk is managed with foreign currency hedging strategies as per plan investment policies.
Liquidity riskLiquidity risk stems from holding assets which cannot be readily converted to cash when needed for the payment of benefits or to rebalance the portfolios. Liquidity risk is managed through investments in treasury bills, government bonds and equity futures and by having no investments in private placements or hedge funds.

BOMBARDIER INC. / 2016 FINANCIAL REPORT / OVERVIEW 31
Longevity riskLongevity risk is the risk that increasing life expectancy results in longer-than-expected benefit payments. This risk is mitigated by using the most recent mortality and mortality improvement tables to set the level of contributions.
Retirement benefit cost
Bombardier had a constructive obligation for discretionary ad hoc indexation increases to certain pension plans. Following a communication to plan members that we do not expect to grant such increases in the foreseeable future in line with our current practice, the constructive obligation amounting to $139 million was reversed, and recorded as a special item. Mainly as a result of this reversal, the retirement benefit cost decreased in 2016 to $171 million.
The following table provides the components of the retirement benefit cost, for fiscal years:
2016 2015Pensionbenefits
Otherbenefits Total
Pensionbenefits
Otherbenefits Total
DB plans $ 154 $ 17 $ 171 $ 381 $ 19 $ 400DC plans 84 — 84 78 — 78Total retirement benefit cost $ 238 $ 17 $ 255 $ 459 $ 19 $ 478Related to
Funded DB plans $ 114 n/a $ 114 $ 340 n/a $ 340Unfunded DB plans $ 40 $ 17 $ 57 $ 41 $ 19 $ 60DC plans $ 84 n/a $ 84 $ 78 n/a $ 78
Recorded as followsEBIT expense or capitalized cost $ 183 $ 6 $ 189 $ 399 $ 7 $ 406Financing expense $ 55 $ 11 $ 66 $ 60 $ 12 $ 72
n/a: Not applicable
The retirement benefit cost for fiscal year 2017 for DB plans is estimated at $356 million, of which $279 million relates to EBIT expense or capitalized cost and $77 million relates to net financing expense.
Sensitivity analysis
The net retirement benefit liability is highly dependent on discount rates, expected inflation rates, expected rates of compensation increase, life expectancy assumptions and actual return on plan assets. The discount rates represent the market rate for high-quality corporate fixed-income investments at the end of the reporting period consistent with the currency and estimated term of the benefit obligations. As a result, discount rates change based on market conditions.
A 0.25 percentage point increase in one of the following weighted-average actuarial assumptions would have the following effects, all other actuarial assumptions remaining unchanged:
Increase (decrease)Retirement benefit cost
for fiscal year 2017Net retirement benefit liability
as at December 31, 2016(Forecast)
Discount rate $ (28) $ (479)Inflation rate $ 5 $ 120Rate of compensation increase $ 8 $ 85

32 BOMBARDIER INC. FINANCIAL REPORT - FISCAL YEAR ENDED DECEMBER 31, 2016
A one-year increase in life expectancy for all DB plan beneficiaries would impact plans in major countries as follows:
IncreaseRetirement benefit cost
for fiscal year 2017Net retirement benefit liability as
at December 31, 2016(Forecast)
Canada $ 7 $ 107U.K. $ 4 $ 100U.S. $ 2 $ 31
Details regarding assumptions used are provided in Note 22 – Retirement benefits, to the consolidated financial statements.
RISK MANAGEMENTActive risk management has been one of our priorities for many years and is a key component of our corporate strategy framework. To achieve our risk management objectives, we have embedded risk management activities in the operational responsibilities of management and made these activities an integral part of the overall governance, planning, decision making, organizational and accountability structure.
For each risk or category of risks, the risk management process includes activities performed in a continuous cycle. Risk assessment, including risk identification, analysis and evaluation, ensures that each risk is analyzed to identify the consequence and likelihood of the risk occurring and the adequacy of existing controls. Each reportable segment is responsible for implementing the appropriate structures, processes and tools to allow proper identification of risks. Once the risks have been identified, analyzed and evaluated, risk mitigation identifies the actions to be implemented by management. Each reportable segment has implemented risk management processes that are embedded in governance and activities to achieve the objectives of our Corporate Risk Management Policy.
In addition, every year, the Corporate Audit Services and Risk Assessment (CASRA) team assesses our major risks. Senior management reviews this risk assessment and develops action plans to address the identified risks.
Source: International Organization for Standardization(ISO) 31000:2009
The Board of Directors is ultimately responsible for reviewing the overall risks faced by the Corporation. The Board exercises its duty through the Finance and Risk Management Committee, consisting of five independent directors, which reviews material business risks and the measures that management takes to monitor, control and manage such risks, including the adequacy of policies, procedures and controls designed by management to assess and manage these risks. To complement the annual CASRA review of major risks, each reportable segment, in coordination with CASRA, has implemented an annual review process that results in standardized heat maps.
A primary area of focus is product development, where our biggest opportunities to create value reside, and also our most significant risks. Recognizing the long-term nature of product development activities and the significant human and financial resources required, we follow a rigorous gated product development process, ensuring early identification and efficient mitigation of potential risks. At the heart of this process is our Bombardier Engineering System, followed for all programs throughout the product development cycle. This process is constantly refined to integrate the lessons learned from our own programs and from the industry. Specific milestones must be met

BOMBARDIER INC. / 2016 FINANCIAL REPORT / OVERVIEW 33
before a product can move from one stage of development to another. The gates consist of exit reviews with different levels of management and leading experts to demonstrate technical feasibility, customer acceptance and financial return.
The development of aerospace products falls under the leadership of the Vice President, Product Development and Chief Engineer who has launched a comprehensive product management transformation initiative, which involves all product development and product management stakeholders. We continuously apply what we learn on one program to the other programs, by sharing ideas and learning in our various functional committees and through regular peer reviews, bringing together the expertise across all platforms to drive alignment and common approaches, establish best practices and leverage the knowledge and experience of our people. This review confirms the availability of human and financial resources, the maturity and manufacturing readiness of new technologies and the overall strength of the business case. We have also designed disclosure controls and procedures to provide reasonable assurance that material information relating to the Corporation is properly communicated and that information required to be disclosed in public filings is recorded, processed, summarized and reported within the time periods specified in securities legislation. Refer to the Controls and procedures section in Other for more details.
Key exposures to financing and market risks and related mitigation strategies
Our operations are exposed to various financing and market risks. The following is a description of our key exposures to those risks together with the strategies in place to mitigate them. Market risks associated with pension plans are discussed in the Retirement benefits section.
Exposure to foreign exchange risk
Our main exposures to foreign currencies are managed in accordance with the Foreign Exchange Risk Management Policy in order to mitigate the impact of foreign exchange rate movements. This policy requires each reportable segment’s management to identify all actual and potential foreign currency exposures arising from their operations. This information is communicated to the Corporate office central treasury function, which has the responsibility to execute hedging transactions in accordance with policy requirements. In addition, the central treasury function manages balance sheet exposures to foreign currency movements by matching asset and liability positions. This program consists mainly in matching long-term debt in a foreign currency with assets denominated in the same currency.
Foreign exchange management
Owner Hedged exposures Hedging policy(1) Risk-mitigation strategiesAerospacereportablesegments
Forecast cash outflowsdenominated in a currency otherthan the functional currency ofthe entity incurring the cashflows, mainly in Canadian dollarsand pounds sterling.
Hedge 85% of the identifiedexposures for the first threemonths, 75% for the next 15months and up to 50% for thefollowing six months.
Use of forward foreign exchangecontracts, mainly to sell U.S. dollars andbuy Canadian dollars and poundssterling.
Transportation Forecast cash inflows andoutflows denominated in acurrency other than the functionalcurrency of the entity incurringthe cash flows.
Hedge 100% of the identifiedexposures at the time of orderintake.
Use of forward foreign exchangecontracts, mainly to sell or purchaseCanadian dollars, euros, U.S. dollars,Swiss francs, Swedish kronor and otherWestern European currencies.
(1) Deviations from the policy are allowed, subject to pre-authorization and maximum pre-determined risk limits.

34 BOMBARDIER INC. FINANCIAL REPORT - FISCAL YEAR ENDED DECEMBER 31, 2016
Owner Hedged exposures Hedging policy(1) Risk-mitigation strategiesCorporateoffice
Forecast cash outflows other than interest, denominated in a currency other than the functional currency of the entity incurring the cash flows, mainly in Canadian dollars.
Hedge 85% of the identifiedexposures for the first 18months and up to 75% for thefollowing six months.
Use of forward foreign exchangecontracts mainly to sell U.S. dollars andbuy Canadian dollars.
Interest cash outflows incurrencies other than the U.S.dollar, i.e. the euro and theCanadian dollar.
Hedge 100% of the identifiedexposure unless theexposure is recognized as aneconomic hedge of anexposure arising from thetranslation of financialstatements in foreigncurrencies to the U.S. dollar.
Use of forward foreign exchange contracts mainly to sell U.S. dollars and buy euros and Canadian dollars.
Balance sheet exposures,including long-term debt and netinvestments in foreign operationswith non-U.S. dollar functionalcurrencies.
Hedge 100% of the identifiedexposures affecting theCorporation’s net income.
Asset/liability management techniques. Designation of long-term debt as hedges of our net investments in foreign operations with non-U.S. dollar functional currencies.
(1) Deviations from the policy are allowed, subject to pre-authorization and maximum pre-determined risk limits.
Aerospace reportable segmentsThe hedged portion of our aerospace reportable segments’ significant foreign currency denominated costs for the fiscal years ending December 31, 2017 and 2018 was as follows as at December 31, 2016:
Canadian dollars Pounds sterlingFor fiscal years 2017 2018 2017 2018Business Aircraft expected costs denominated in foreign currency $1,368 $1,407 — —Commercial Aircraft expected costs denominated in foreign currency $748 $823 — —Aerostructures and Engineering Services expected costs denominated in foreign currency $234 $249 £304 £307Hedged portion of expected costs denominated in foreign currency 81% 42% 85% 41%Weighted-average hedge rates – foreign currency/USD 0.7745 0.7642 1.5078 1.3084
Sensitivity analysisA U.S. one-cent change in the value of the Canadian dollar compared to the U.S. dollar would impact Business Aircraft, Commercial Aircraft and Aerostructures and Engineering Services’ expected costs for the year ending December 31, 2017 by approximately $14 million, $7 million and $2 million, respectively, before giving effect to forward foreign exchange contracts ($3 million, $1 million and less than $1 million impacts, respectively, after giving effect to such contracts).
A U.S. one-cent change in the value of the pound sterling compared to the U.S. dollar would impact Aerostructures and Engineering Services’ expected costs for the fiscal year ending December 31, 2017 by approximately $3 million, before giving effect to forward foreign exchange contracts (less than $1 million impact after giving effect to such contracts).

BOMBARDIER INC. / 2016 FINANCIAL REPORT / OVERVIEW 35
Transportation and Corporate officeTransportation’s foreign currency exposure, arising from its long-term contracts, spreads over many years. Such exposures are generally entirely hedged at the time of order intake, contract-by-contract, for a period that is often shorter than the maturity of the cash flow exposure. Upon maturity of the hedges, Transportation enters into new hedges in a rollover strategy for periods up to the maturity of the cash flow exposure. As such, Transportation’s results of operations are not significantly exposed to gains and losses from transactions in foreign currencies, but remain exposed to translation and cash flow risks on a temporary basis. On a cumulative basis, however, cash outflows or inflows upon rollover of these hedges are offset by cash inflows or outflows in opposite directions when the cash flow exposure materializes.
The identified cash flow exposures at our Corporate office are not significant and mainly arise from expenses denominated in Canadian dollars. Balance sheet exposure at Corporate office arises mainly from investments in foreign operations and long-term debt. Despite our risk mitigation strategies, the impact of foreign currency fluctuations on equity can be significant given the size of our investments in foreign operations with non-U.S. dollar functional currencies, mainly the euro.
Sensitivity analysisFor investments in foreign operations exposed to foreign currency movements, a 1% fluctuation of the relevant currencies as at December 31, 2016 would have impacted equity, before the effect of income taxes, by $11 million.
Exposure to credit risk
The effective monitoring and controlling of credit risk is a key component of our risk management activities. Credit risk is monitored on an ongoing basis using different systems and methodologies depending on the underlying exposure.
Credit risk management
Owner Key risks Risk mitigation measures initiated by managementCorporateoffice
Through normal treasuryactivities, we are exposedto credit risk throughderivative financialinstruments and investinginstruments.
Credit risks arising from treasury activities are managed by a central treasuryfunction in accordance with the Corporate Foreign Exchange Risk ManagementPolicy and the Corporate Investment Management Policy. The objective ofthese policies is to minimize exposure to credit risk from treasury activities byensuring that we transact strictly with investment-grade financial institutions andmoney market funds, based on pre-established consolidated counterparty risklimits per financial institution and fund.
Allreportablesegments
We are exposed to creditrisk through tradereceivables arising fromnormal commercialactivities and lendingactivities, related primarilyto aircraft loans and leasereceivables provided tocustomers in connectionwith the sale of commercialaircraft.
Credit risks arising from normal commercial activities and lending activities aremanaged and controlled by each reportable segment, in accordance with theCorporate office policy. Customer credit ratings and credit limits are analyzedand established by internal credit specialists, based on inputs from externalrating agencies, recognized rating methods and our experience with thecustomers. The credit risk and credit limits are dynamically reviewed based onfluctuations in the customers’ financial results and payment behaviour. Thesecustomer credit ratings and credit limits are critical inputs in determining theconditions under which credit or financing is extended to customers, includingobtaining collateral to reduce exposure to losses. Specific governance is inplace to ensure that credit risk arising from large transactions is analyzed andapproved by the appropriate level of management before financing or creditsupport is offered to the customer.
CommercialAircraft
In connection with the saleof certain products, mainlycommercial aircraft, wemay provide creditguarantees in the form oflease and loan paymentguarantees. Substantiallyall financial supportinvolving potential creditrisk lies with regional airlinecustomers.
Credit guarantees provide support through contractually limited payments to the guaranteed party to mitigate default-related losses. Credit guarantees are usually triggered if customers do not perform during the term of the financing under the relevant financing arrangements. In the event of default, we usually act as agent for the guaranteed parties for the repossession, refurbishment and re-marketing of the underlying assets.This exposure arising from credit guarantees is partially mitigated by the net benefit expected from the estimated value of aircraft and other assets available to mitigate exposure under these guarantees. In addition, lease subsidy liabilities would be extinguished in the event of credit default by certain customers.
36 BOMBARDIER INC. FINANCIAL REPORT - FISCAL YEAR ENDED DECEMBER 31, 2016
Exposure to liquidity risk
The management of exposure to liquidity risk requires a constant monitoring of expected cash inflows and outflows, which is achieved through maintenance of detailed forecasts of cash flows and liquidity position, as well as long-term operating and strategic plans. Liquidity adequacy is continually monitored, taking into consideration historical volatility, the economic environment, seasonal needs, the maturity profile of indebtedness, access to capital markets, the level of customer advances, working capital requirements, the funding of product development and other financial commitments. We engage in certain working capital financing initiatives such as the sale of receivables, aircraft sale and leaseback transactions and the negotiation of extended payment terms with certain suppliers. We continually monitor any financing opportunities to optimize our capital structure and maintain appropriate financial flexibility.
Exposure to interest rate risk
Our future cash flows are exposed to fluctuations from changing interest rates, arising mainly from assets and liabilities indexed to variable interest rates, including fixed-rate long-term debt synthetically converted to variable interest rates. For these items, cash flows could be impacted by a change in benchmark rates such as LIBOR, Euribor or Banker’s Acceptance. The Corporate office central treasury function manages these exposures as part of the overall risk management policy.
We are also exposed to gains and losses on certain assets and liabilities as a result of changes in interest rates, principally financial instruments carried at fair value and credit and residual value guarantees. The financial instruments carried at fair value include certain aircraft loans and lease receivables, investments in securities, investments in financing structures, lease subsidies and derivative financial instruments.
Sensitivity analysisA 100-basis point increase in interest rates impacting the measurement of financial instruments carried at fair value and credit and residual value guarantees, excluding net retirement benefit liabilities, would have negatively impacted EBT for fiscal year 2016 by $10 million.
NON-GAAP FINANCIAL MEASURESThis MD&A is based on reported earnings in accordance with IFRS and on the following non-GAAP financial measures:
Non-GAAP financial measuresEBITDA Earnings (loss) before financing expense, financing income, income taxes, amortization and
impairment charges on PP&E and intangible assets.EBIT before specialitems
EBIT excluding the impact of restructuring charges, significant impairment charges and reversals,as well as other significant unusual items.
EBITDA before specialitems
EBIT before special items, amortization and impairment charges on PP&E and intangible assets.
Adjusted net income(loss)
Net income (loss) excluding special items, accretion on net retirement benefit obligations, certainnet gains and losses arising from changes in measurement of provisions and of financialinstruments carried at FVTP&L and the related tax impacts of these items.
Adjusted EPS EPS calculated based on adjusted net income attributable to equity holders of Bombardier Inc.,using the treasury stock method, giving effect to the exercise of all dilutive elements.
Free cash flow (usage) Cash flows from operating activities less net additions to PP&E and intangible assets.Free cash flow (usage)before net interest andincome taxes paid orreceived
Free cash flow (usage) excluding cash paid and received for interest and income taxes, as perthe consolidated statements of cash flows.
Adjusted debt Long-term debt as presented in the consolidated statements of financial position adjusted for thefair value of derivatives (or settled derivatives) designated in related hedge relationships plusshort-term borrowings, sale and leaseback obligations and the net present value of operatinglease obligations.

BOMBARDIER INC. / 2016 FINANCIAL REPORT / OVERVIEW 37
Non-GAAP financial measuresAdjusted EBIT EBIT before special items plus interest adjustment for operating leases and interest received (as
per the supplemental information provided in the consolidated statements of cash flows, adjusted,if needed, for the settlement of fair value hedge derivatives before their contractual maturitydates).
Adjusted EBITDA Adjusted EBIT plus amortization and impairment charges on PP&E and intangible assets, andamortization adjustment for operating leases.
Adjusted interest Interest paid, as per the supplemental information provided in the consolidated statements ofcash flows, plus accretion expense on sale and leaseback obligations and interest adjustment foroperating leases.
We believe that providing certain non-GAAP financial measures in addition to IFRS measures provides users of our Financial Report with enhanced understanding of our results and related trends and increases the transparency and clarity of the core results of our business. For these reasons, a significant number of users of the MD&A analyze our results based on these financial measures. EBIT before special items, EBITDA before special items, adjusted net income and adjusted EPS exclude items that do not reflect our core performance or where their exclusion will assist users in understanding our results for the period. We believe these measures help users of our MD&A to better analyze results, enabling better comparability of our results from one period to another and with peers.
We analyze our capital structure using global metrics, based on adjusted EBIT, adjusted EBITDA, adjusted interest and adjusted debt. Refer to the Capital structure section for more detail.
Non-GAAP financial measures are mainly derived from the consolidated financial statements but do not have standardized meanings prescribed by IFRS. The exclusion of certain items from non-GAAP performance measures does not imply that these items are necessarily non-recurring. From time to time, we may exclude additional items if we believe doing so would result in a more transparent and comparable disclosure. Other entities in our industry may define the above measures differently than we do. In those cases, it may be difficult to compare the performance of those entities to ours based on these similarly-named non-GAAP measures.
Reconciliations of non-GAAP financial measures to the most comparable IFRS financial measures are provided in the tables hereafter, except for the following reconciliations:
• EBIT before special items to EBIT – see the Results of operations tables in the reportable segments and the Consolidated results of operations section; and
• free cash flow usage before net interest and income taxes received or paid and free cash flow usage to cash flows from operating activities – see the Free cash flow usage table in the Liquidity and capital resources section.
Reconciliation of EBITDA before special items and EBITDA to EBITFourth quarters
ended December 31Fiscal years
ended December 312016 2015 2016 2015
EBIT $ 74 $ (657) $ (58) $ (4,838)Amortization 99 123 371 438Impairment charges on PP&E and intangible assets(1) 10 296 10 4,300EBITDA 183 (238) 323 (100)Special items excluding impairment charges on PP&E and intangible assets(1) 20 377 475 1,092EBITDA before special items $ 203 $ 139 $ 798 $ 992
(1) Refer to the Consolidated results of operations section for details regarding special items.

38 BOMBARDIER INC. FINANCIAL REPORT - FISCAL YEAR ENDED DECEMBER 31, 2016
Reconciliation of adjusted net income (loss) to net loss and computation of adjusted EPSFourth quarters ended December 31
2016 2015(per share) (per share)
Net loss $ (259) $ (677)Adjustments to EBIT related to special items(1) 30 $ 0.01 673 $ 0.30Adjustments to net financing expense related to:
Loss on repurchase of long-term debt(1) 86 0.04 — —Accretion on net retirement benefit obligations 16 0.01 17 0.01Net change in provisions arising from changes in interest ratesand net loss on certain financial instruments (12) (0.01) (5) 0.00
Tax impact of special(1) and other adjusting items (2) 0.00 1 0.00Adjusted net income (loss) (141) 9Net (income) loss attributable to NCI 8 (2)Preferred share dividends, including taxes (14) (2)Adjusted net income (loss) attributable to equity holders of Bombardier Inc. $ (147) $ 5Weighted-average diluted number of common shares (in thousands) 2,194,304 2,221,868Adjusted EPS $ (0.07) $ 0.00
Reconciliation of adjusted EPS to diluted EPS (in dollars)Fourth quarters ended December 31
2016 2015Diluted EPS $ (0.12) $ (0.31)Impact of special(1) and other adjusting items 0.05 0.31Adjusted EPS $ (0.07) $ 0.00
Reconciliation of adjusted net income (loss) to net loss and computation of adjusted EPSFiscal years ended December 312016 2015
(per share) (per share)Net loss $ (981) $ (5,340)
Adjustments to EBIT related to special items(1) 485 $ 0.22 5,392 $ 2.59Adjustments to net financing expense related to:
Loss on repurchase of long-term debt(1) 86 0.04 22 0.01Accretion on net retirement benefit obligations 66 0.03 72 0.03Net change in provisions arising from changes in interest rates and net loss (gain) on certain financial instruments(1) 63 0.03 75 0.04
Interest portion of gains related to special items(1) 26 0.01 — —Transaction costs related to the conversion option embedded in the CDPQ investment(1) 8 0.01 — —
Tax impact of special(1) and other adjusting items (21) (0.01) 105 0.05Adjusted net income (loss) (268) 326
Net (income) loss attributable to NCI (41) (7)Preferred share dividends, including taxes (32) (23)
Adjusted net income (loss) attributable to equity holders of Bombardier Inc. $ (341) $ 296Weighted-average diluted number of common shares (in thousands) 2,212,547 2,082,683Adjusted EPS $ (0.15) $ 0.14
Reconciliation of adjusted EPS to diluted EPS (in dollars)Fiscal years ended December 312016 2015
Diluted EPS $ (0.48) $ (2.58)Impact of special(1) and other adjusting items 0.33 2.72Adjusted EPS $ (0.15) $ 0.14
(1) Refer to the Consolidated results of operations section for details regarding special items.

BOMBARDIER INC. / 2016 FINANCIAL REPORT / OVERVIEW 39
Reconciliation of adjusted debt to long-term debtAs at December 31
2016 2015Long-term debt $ 8,769 $ 8,979Adjustment for the fair value of derivatives designated (or settled derivatives) in related hedge relationships (278) (386)Long-term debt, net 8,491 8,593Sale and leaseback obligations 25 133Operating lease obligations(1) 668 563Adjusted debt $ 9,184 $ 9,289
Reconciliation of adjusted EBITDA and adjusted EBIT to EBITFiscal years ended December 31
2016 2015EBIT $ (58) $ (4,838)Special items(2) 485 5,392Interest received 20 156Interest adjustment for operating leases(3) 51 67Adjusted EBIT 498 777Amortization adjustment for operating leases(4) 74 63Amortization 371 438Adjusted EBITDA $ 943 $ 1,278
Reconciliation of adjusted interest to interest paidFiscal years ended December 31
2016 2015Interest paid $ 565 $ 427Accretion expense on sale and leaseback obligations 2 9Interest adjustment for operating leases(3) 51 67Adjusted interest $ 618 $ 503
(1) Discounted using the average five-year U.S. Treasury Notes plus the average credit spread, given our credit rating, for the corresponding period.
(2) Refer to the Consolidated results of operations section for details regarding special items.(3) Represents the interest cost of a debt equivalent to operating lease obligations included in adjusted debt, bearing interest at the average
five-year U.S. swap rate plus the average credit default swap spread for the related period, given our credit rating.(4) Represents a straight-line amortization of the amount included in adjusted debt for operating leases, based on a nine-year amortization
period.

40 BOMBARDIER INC. FINANCIAL REPORT - FISCAL YEAR ENDED DECEMBER 31, 2016
BUSINESS AIRCRAFTThe data presented in this MD&A contains both IFRS and non-GAAP measures. Non-GAAP measures are defined and reconciled to the most comparable IFRS measure. See the Non-GAAP financial measures section in Overview for further detail.
PAGEKEY PERFORMANCE MEASURESAND METRICS
Key performance measures and associated metrics that we use tomonitor our progress
HIGHLIGHTS OF THE YEAR Highlights of the fiscal year with regard to our results and key events
PROFILE Overview of our operations and products and services
INDUSTRY AND ECONOMICENVIRONMENT
Industry and economic factors affecting our business
ANALYSIS OF RESULTS Financial performance for the fourth quarter and fiscal year ended December 31, 2016Update on investments in product developmentDeliveries, orders, order backlog and workforce
GUIDANCE AND FORWARD-LOOKING STATEMENTS
What we said, what we did and what’s nextAssumptions and risks related to our forward-looking statements
KEY PERFORMANCE MEASURES AND METRICSThe table below summarizes our most relevant key performance measures and related metrics.
KEY PERFORMANCE MEASURES AND ASSOCIATED METRICSGrowth andcompetitivepositioning
• Order backlog, as a measure of future revenues. • Book-to-bill ratio(1), as an indicator of future revenues. • Revenues and delivery units, as measures of growth. • Market share (in terms of revenues and units delivered), as measures of our competitive positioning.
Profitability • EBIT, EBIT margin, EBIT before special items(2) and EBIT margin before special items(2), as measures of performance.
Liquidity • Free cash flow(2), as a measure of liquidity generation. Customersatisfaction
• On-time aircraft deliveries, as a measure of meeting our commitment to customers. • Fleet dispatch reliability, as a measure of our products’ reliability. • Regional availability of parts and material to support customer requests, as a measure of meeting
customer needs for the entire life of the aircraft.Execution • Achievement of program development milestones, as a measure of flawless execution.
(1) Defined as the ratio of net orders received over aircraft deliveries, in units.(2) Non-GAAP financial measures. Refer to the Non-GAAP financial measures section in Overview for definitions of these metrics.
40
41
42
44
48
54

BOMBARDIER INC. / 2016 FINANCIAL REPORT / BUSINESS AIRCRAFT 41
HIGHLIGHTS OF THE YEAR
Aligned business to current market conditions, while achieving key milestones on the Global 7000 and Global 8000 aircraft program
REVENUES EBIT MARGINEBIT MARGIN
BEFORE SPECIAL ITEMS(1)
NET ADDITIONS TOPP&E & INTANGIBLE
ASSETSORDER BACKLOG
$5.7 billion 8.3% 6.4% $721 million $15.4 billion
RESULTSFor the fiscal years ended December 31 2016 2015 VarianceRevenues $ 5,741 $ 6,996 (18)%Aircraft deliveries (in units) 163 199 (36)Net orders (in units)(2) 114 (24) 138Book-to-bill ratio(3) 0.7 nmf nmfEBIT $ 477 $ (1,252) nmfEBIT margin 8.3% (17.9)% nmfEBIT before special items(1) $ 369 $ 308 20 %EBIT margin before special items(1) 6.4% 4.4 % 200 bpsEBITDA before special items(1)
.$ 528 $ 492 7 %
EBITDA margin before special items(1) 9.2% 7.0 % 220 bpsNet additions to PP&E and intangible assets $ 721 $ 722 — %As at December 31 2016 2015Order backlog (in billions of dollars) $ 15.4 $ 17.2 (10)%
(1) Non-GAAP financial measures. Refer to the Non-GAAP financial measures section in Overview for definitions of these metrics and to the Analysis of results section for reconciliations to the most comparable IFRS measures.
(2) The net orders for 2016 and 2015 include 38 cancellations and 143 cancellations, respectively. (3) Ratio of net orders received over aircraft deliveries, in units.
KEY HIGHLIGHTS AND EVENTS
• Business aircraft’s 2016 financial performance exceeded guidance on all fronts, delivering a total of 163 aircraft, while reaching revenues of $5.7 billion and EBIT margins before special items(1) of 6.4%. The planned revenue decrease, was compensated by a 200-bps increase in profitability, mainly resulting from proactive management of production rates in line with market demand, as well as business model enhancements and transformation initiatives.
• Financial results for 2016 demonstrated our continued focus on driving sustainable margin expansion through increasing production efficiency, transforming our cost structure, improving our production agility and the enhancement to our pre-owned aircraft business.
• We also made significant progress on the development of the Global 7000 and Global 8000 aircraft program, setting the standard for a new category of large business jets. We successfully completed, on November 4, 2016, the maiden flight of the first Global 7000 FTV, dedicated to testing basic system functionality and assessing the handling and flying qualities of the aircraft. The Global 7000 aircraft is the first and only clean-sheet business jet with four living spaces. Engineered with a next-generation transonic wing design, the aircraft offers a steep approach capability and short field performance, coupled with highly efficient engines, the largest cabin in this category and a highly advanced cockpit.(2)
• In line with our strategy to grow our aftermarket business, during the year, we announced plans to expand our service centre network in strategic locations such as at the Biggin Hill Airport in London, England, in Fort Lauderdale, Florida, Tucson, Arizona and in Tianjin, China. We are currently ramping up capabilities at these facilities.
(1) Non-GAAP financial measures. Refer to the Non-GAAP financial measures section in Overview for definitions of these metrics and to the Analysis of results section for reconciliations to the most comparable IFRS measures.
(2) See the Global 7000 and Global 8000 aircraft program disclaimer at the end of this MD&A.
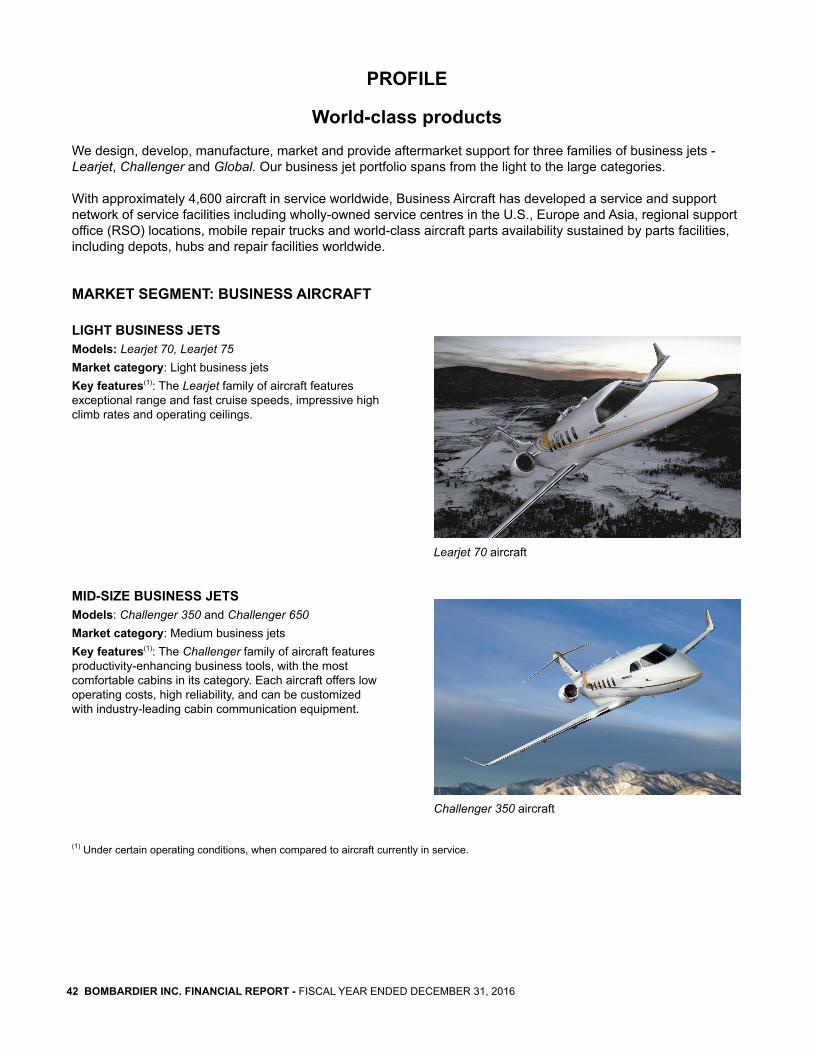
42 BOMBARDIER INC. FINANCIAL REPORT - FISCAL YEAR ENDED DECEMBER 31, 2016
PROFILE
World-class productsWe design, develop, manufacture, market and provide aftermarket support for three families of business jets - Learjet, Challenger and Global. Our business jet portfolio spans from the light to the large categories.
With approximately 4,600 aircraft in service worldwide, Business Aircraft has developed a service and support network of service facilities including wholly-owned service centres in the U.S., Europe and Asia, regional support office (RSO) locations, mobile repair trucks and world-class aircraft parts availability sustained by parts facilities, including depots, hubs and repair facilities worldwide.
MARKET SEGMENT: BUSINESS AIRCRAFT
LIGHT BUSINESS JETSModels: Learjet 70, Learjet 75Market category: Light business jets Key features(1): The Learjet family of aircraft features exceptional range and fast cruise speeds, impressive high climb rates and operating ceilings.
Learjet 70 aircraft
MID-SIZE BUSINESS JETSModels: Challenger 350 and Challenger 650Market category: Medium business jetsKey features(1): The Challenger family of aircraft features productivity-enhancing business tools, with the most comfortable cabins in its category. Each aircraft offers low operating costs, high reliability, and can be customized with industry-leading cabin communication equipment.
Challenger 350 aircraft
(1) Under certain operating conditions, when compared to aircraft currently in service.

BOMBARDIER INC. / 2016 FINANCIAL REPORT / BUSINESS AIRCRAFT 43
LARGE BUSINESS JETSModels: Global 5000, Global 6000, Global 7000(1) and Global 8000(1)
Market category: Large business jetsKey features(2): The flagship Global aircraft family covers the large jet category with four aircraft models that offer performance, comfort, and productivity for long-range missions and the fastest in-flight internet connectivity worldwide. The segment-defining Global 7000 aircraft extends the family with even longer range and will link virtually any key city pair worldwide, non-stop. The Global 7000 aircraft will enter into service in the second half of 2018.
Global 7000 aircraft
(1) Currently under development. See the Global 7000 and Global 8000 aircraft program disclaimer at the end of this MD&A.(2) Under certain operating conditions, when compared to aircraft currently in service. RAFT
MARKET SEGMENT: CUSTOMER SERVICES
MAINTENANCEServices portfolio: Extensive capabilities to accommodate maintenance, refurbishment and modification of business aircraft, component repair and overhaul services as well as dispatching mobile repair teams to customers’ aircraft.Key features: Offering worldwide service and support through wholly-owned service centres, authorized service facilities including line maintenance facilities, one wholly-owned line maintenance station, Bombardier mobile response vehicles and one aircraft.
PARTS AND SMART SERVICESServices portfolio: Providing new and used parts, as well as repairs to customer owned parts, and a growing portfolio of innovative cost-per-flight-hour parts and maintenance plans available for Learjet, Challenger and Global aircraft. Options include Smart Parts, Smart Parts Plus, Smart Parts Preferred and Smart Parts Maintenance Plus.Key features: Supporting 24/7 parts support with parts facilities worldwide anchored by two major hubs in Chicago and Frankfurt. A sophisticated inventory management system ensures worldwide parts availability throughout the depot and hub network as well as the wholly-owned service centres. Repair facilities in North America and Europe provide repair services on customer owned parts. Unlimited access to Parts Express to shuttle parts in support of aircraft-on-ground requirements. From coverage on exchanges and repairs of airframe components, including flight deck avionics, Smart Services provides budget predictability and worldwide parts availability.
CUSTOMER SUPPORTServices portfolio: Comprehensive portfolio of business aircraft customer support including 24-hour customer response centres, customer services engineering, a network of field service personnel, customer response team trucks, regional support offices, technical publications, and EIS support.Key features: Providing operators with a single point of contact, 24 hours a day, 365 days a year, for all critical and aircraft-on-the-ground requests and supporting all customer requirements from EIS throughout ownership of the aircraft by leveraging a global support network of strategically located teams.
TRAININGServices portfolio: Providing a complete range of flight crew and technical training services on business aircraft at two facilities and through a network of strategic partnerships worldwide. We also provide technical service on site at customer locations.
Key features: One of the only business jet manufacturers which provides training on its own aircraft programs. Training is provided through custom state-of-the art classroom technology systems, and a suite of high fidelity training devices and certified Level D Full Flight Simulators.

44 BOMBARDIER INC. FINANCIAL REPORT - FISCAL YEAR ENDED DECEMBER 31, 2016
INDUSTRY AND ECONOMIC ENVIRONMENT
Stabilizing market dynamics with long-term positive outlook2016 in reviewAs predicted in our 2016 market forecast,(1) business aviation industry deliveries decreased in 2016 as a result of original equipment manufacturers (OEMs) adjusting to market dynamics. In recent months, the market is showing signs of improvement in the industry confidence index, U.S. corporate profits and pre-owned business jet inventory levels. As well, the industry continues to improve its book-to-bill ratio.
World GDP growth in 2016 stands at 2.2%,(2) due to modest growth in developed markets combined with the soft recovery in emerging markets. The UBS Business Jet Market Index, a measure of industry confidence, has increased in the fourth quarter of 2016 to 51 points, and is now above the threshold of market stability. Forecast U.S. Corporate profits for 2016 also increased to $2.1 trillion.(3) As well, the inventory of pre-owned aircraft expressed as a percentage of the overall fleet has been stable at a healthy level. The positive trend in these key market drivers should stimulate demand for business aircraft.
The following key indicators are used to monitor the health of the business aviation market in the short term:
Indicator Current situation StatusIndustryconfidence
The UBS Business Jet Market Index, which measures industry confidence, increased in the fourthquarter of 2016, mainly due to increased customer interest and an improved outlook on businessconditions. The worldwide index is currently at 51, the highest level since the first quarter of 2015and back above the threshold of market stability.
Corporateprofits
Forecast U.S. corporate profits have increased year-over-year by 2.1% to $2.1 trillion for 2016.(3)
Pre-ownedbusiness jetinventorylevels
The total number of pre-owned aircraft available for sale as a percentage of the total in-service fleet has slightly decreased over the past year and is at 11.3%. We consider this level of pre-owned inventory to be within the normal historical range for the overall market.
In the light category, the level of pre-owned business aircraft inventory has slightly increased.In the medium category, the level of pre-owned business aircraft has decreased. In the large category, the level of pre-owned business aircraft inventory has slightly decreased in the current year and remains below what we consider to be the normal range for the overall market.
Aircraftutilizationrates
Business jet utilization in the U.S. slightly increased by 0.2% in 2016 compared to 2015. Businessjet utilization in Europe remained essentially the same in 2016 compared to 2015.
Aircraftshipmentsand billings
In the business aircraft market categories in which we compete, business aircraft deliveries and total billings declined in 2016 compared to 2015 due to several OEMs realigning production to market demand.(4)
Identifies a favourable, neutral or negative status, respectively, in the market categories in which we compete, based on the current environment. (1) Bombardier Business Aircraft Market Forecast for the 10-year period from 2016 to 2025 released in May 2016 and available at
ir.bombardier.com.(2) According to “Oxford Economics Global Data Report” dated January 16, 2017. (3) According to the U.S. Bureau of Economic Analysis News Release dated December 22, 2016.(4) Based on our estimates and public disclosure records of certain competitors.

BOMBARDIER INC. / 2016 FINANCIAL REPORT / BUSINESS AIRCRAFT 45
Source: UBS* The UBS Business Jet Market Index is a measure of market
confidence of industry professionals, gathered through bi-monthly surveys of brokers, dealers, manufacturers, fractional providers, financiers and others.
Source: U.S. Federal Aviation Administration (FAA) website
Sources: JETNET and Ascend online* As a percentage of total business jet fleet, excluding very light jets. Shaded area indicates what we consider to be the normal range
of total pre-owned business jet inventory available for sale, i.e. between 11% and 14%.
Source: Eurocontrol
Short-term outlookWe project the continued stabilization of the business jet market due to a better economic outlook combined with the introduction of new aircraft models and technologies. GDP growth for North America and Europe is estimated to be 2.2% and 1.7%, respectively for 2017, while emerging markets are forecast to gradually come out of their respective economic slowdowns.(1)
(1) According to “Oxford Economics Global Data Report” dated January 16, 2017.

46 BOMBARDIER INC. FINANCIAL REPORT - FISCAL YEAR ENDED DECEMBER 31, 2016
Long-term outlook The overall market for business jets is expected to show strong long-term growth. We anticipate significant growth to be driven by continued wealth creation in mature markets, increased penetration of business jets in emerging markets, and the introduction of new aircraft programs. Replacement demand is expected to remain steady as pre-owned aircraft inventory levels and residual values normalize. Demand from charter and fractional operators is also expected to remain stable, making business travel more and more accessible worldwide.
In May 2016, we released our annual business aircraft market forecast for the 10-year period for calendar years 2016 to 2025. The “Bombardier Business Aircraft Market Forecast” estimates a total of 8,300 business jet deliveries, representing approximately $250 billion in industry revenues.(1)(2) More than half of industry revenues are expected to be driven by demand for large aircraft.
The worldwide business aircraft fleet is expected to increase from approximately 16,200 aircraft at the end of 2015 to approximately 22,500 aircraft in 2025. North America is expected to receive the greatest number of new business jet deliveries in the 10-year period with 3,930 aircraft, followed by Europe with 1,530 aircraft. Notably, Latin America is expected to become the third largest market for business jet deliveries, with 790 deliveries between 2016 and 2025.
Emerging markets, such as Greater China, CIS, Middle East and South Asia, are expected to have a strong and positive impact on the business aircraft market in the long term as well, with growth forecast to exceed the global average.
(1) As stated in our “Business Aircraft Market Forecast”, published in May 2016 and available at ir.bombardier.com.(2) Unit values are based on Business & Commercial Aviation (B&CA) Magazine and Purchase Planning Handbook 2016 list prices.

BOMBARDIER INC. / 2016 FINANCIAL REPORT / BUSINESS AIRCRAFT 47
BUSINESS AIRCRAFT FLEET EVOLUTION BY CATEGORY 2016-2025*
* In units. As stated in our “Business Aircraft Market Forecast”, published in May 2016 and available at ir.bombardier.com.
BUSINESS AIRCRAFT FLEET EVOLUTION BY GEOGRAPHIC REGION 2016-2025*
* In units. As stated in our “Business Aircraft Market Forecast”, published in May 2016 and available at ir.bombardier.com.
** Includes 305, 165, 130 and 10 retirements for Latin America, Rest of world, Europe and Greater China regions, respectively.
Customer services
Business Aircraft’s worldwide customer services network includes wholly owned service centres, parts hubs, parts depots, line maintenance facilities, regional support offices, customer response centres, mobile customer response teams, training centres as well authorized service facilities and authorized training providers.
The demand for service and support is driven by the size of the fleet of Bombardier business aircraft, by the number of hours flown by said fleet and the average age of the fleet. Based on business aircraft’s large installed base, we will continue to focus on these high margin activities.
Market indicators
Indicator Current situation StatusInstalledbase
The installed base for active in-service Bombardier business aircraft increased by 2.4% to 4,595 in 2016 compared to 2015.(1)
Averageannualflighthours
Based on our estimates, Bombardier business aircraft average annual flight hours slightly increased by 0.6% in 2016 compared to last year.
Averageage of fleet
Typically, aircraft direct maintenance costs increase as an aircraft ages. Therefore, the average age of the fleet of Bombardier aircraft will impact the size of the maintenance market. The average age of the Bombardier business aircraft fleet remained essentially the same in 2016 compared to 2015.(1)
Identifies a favourable, neutral or negative status, respectively, in the market categories in which we compete, based on the current environment.(1) Based on data obtained from Ascend fleet database by Flightglobal.
Short-term outlookBased on the market indicators above, the demand for parts and service programs is expected to grow. We continue to actively seek out strategic locations for expansion in order to move closer to customers, further improve response times and build stronger relationships around the globe.

48 BOMBARDIER INC. FINANCIAL REPORT - FISCAL YEAR ENDED DECEMBER 31, 2016
Historically, the U.S. represented the largest share of the fleet for business aircraft, however, wealth creation and economic development in non-traditional markets is driving a shift in the proportion of the business aircraft fleet outside of the U.S. This trend in demand impacts the geographical layout of our support network. In non-traditional markets, the strategy is to increase our local customer-support presence and leverage third parties to deploy the full span of services.
Long-term outlookThe continued growth of the installed base is expected to stimulate demand for customer services. While traditional markets such as North America and Europe should dominate in terms of market size, the fleet growth in non-traditional markets should create new opportunities for aftermarket services.
ANALYSIS OF RESULTS
Exceeded guidance on all fronts
Results of operationsFourth quarters
ended December 31Fiscal years
ended December 312016 2015 2016 2015
Revenues $ 1,651 $ 2,086 $ 5,741 $ 6,996EBITDA before special items(1) $ 150 $ 83 $ 528 $ 492Amortization(2) 50 55 159 184EBIT before special items(1) 100 28 369 308Special items 1 380 (108) 1,560EBIT $ 99 $ (352) $ 477 $ (1,252)EBIT margin before special items(1) 6.1% 1.3 % 6.4% 4.4 %EBIT margin 6.0% (16.9)% 8.3% (17.9)%
(1) Non-GAAP financial measures. Refer to the Non-GAAP financial measures section in Overview for definitions of these metrics.(2) Amortization is included in cost of sales, SG&A and R&D expense based on the underlying function of the asset.
RevenuesThe $435-million and $1,255-million decreases for the fourth quarter and the fiscal year, respectively, are mainly due to planned lower aircraft deliveries following our decision to reduce production rates in 2015 and a return to a normal historical level of revenues from sales of pre-owned aircraft.

BOMBARDIER INC. / 2016 FINANCIAL REPORT / BUSINESS AIRCRAFT 49
Special itemsSpecial items comprise items which do not reflect our core performance or where their separate presentation will assist users in understanding our results for the period, such as the impact of restructuring charges and significant impairment charges and reversals.
Special items in EBIT were as follows:
Fourth quarters ended December 31
Fiscal years ended December 31
Ref 2016 2015 2016 2015Pension obligation 1 $ — $ — $ (63) $ —Impairment and other charges - Learjet 85 aircraft program 2 (5) — (59) 1,169Restructuring charges 3 6 — 14 11Write-off of deferred costs 4 — 194 — 194Termination of sales representative and distribution agreements 5 — 133 — 133Impairment charge - Learjet family of aircraft 6 — 53 — 53
$ 1 $ 380 $ (108) $ 1,560EBIT margin impact (0.1)% (18.2)% 1.9% (22.3)%
1. Bombardier had a constructive obligation for discretionary ad hoc indexation increases to certain pension plans. Following a communication to plan members that we do not expect to grant such increases in the foreseeable future in line with our current practice, the constructive obligation amounting to $63 million was reversed.
2. In 2015, represents an impairment charge of $925 million on aerospace program tooling as well as a $244 million charge related to the write-downs of inventory and other assets as well as the recording of other provisions and other financial liabilities, as a result of the cancellation of the Learjet 85 aircraft program due to the lack of sales following the prolonged market weakness. A credit of $6 million related to this special item is included in Corporate and Elimination.
In 2016, based on the ongoing activities with respect to the cancellation of the Learjet 85 aircraft program, we reduced the related provisions by $59 million, of which $5 million was recorded in the fourth quarter. The reduction in provisions is treated as a special item since the original provisions were also recorded as special charges in 2014 and 2015.
3. In 2016, represents restructuring charges related to the restructuring actions announced in February and October 2016.
In 2015, the special items mainly related to a $13-million restructuring charge for the workforce reduction of 1,000 employees associated with the Learjet 85 aircraft program.
4. Mainly related to restructuring of customer commercial agreements.
5. Costs incurred in connection with the termination of third-party sales representative and distribution agreements to increase the number of direct-to-market channels.
6. Represents an impairment charge on the remaining Learjet family aerospace program tooling, following the prolonged market weakness in the light business aircraft category.
EBIT marginThere was an increase of 22.9 percentage points in EBIT margin for the fourth quarter ended December 31, 2016 compared to the same period last fiscal year. The EBIT margin before special items (see explanation of special items above) increased by 4.8 percentage points, mainly as a result of:
• favourable impacts of business model enhancements related to pre-owned aircraft activities; and• higher overall aircraft margin.

50 BOMBARDIER INC. FINANCIAL REPORT - FISCAL YEAR ENDED DECEMBER 31, 2016
There was an increase of 26.2 percentage points in EBIT margin for the fiscal year ended December 31, 2016 compared to last fiscal year. The EBIT margin before special items (see explanation of special items above) for the fiscal year increased by 2.0 percentage points, mainly as a result of:
• favourable impacts of business model enhancements related to pre-owned aircraft activities;• higher margins on customer services activities; and• a favourable mix of aircraft deliveries.Partially offset by:• lower absorption of SG&A expenses; and• lower profitability in the light aircraft category, which included inventory write-downs, offset the favourable
margin in the large and medium aircraft categories.
The Global 7000 aircraft has completed its maiden flight and is now in the testing phase
Investment in product developmentFourth quarters
ended December 31Fiscal years
ended December 312016 2015 2016 2015
Program tooling(1) $ 220 $ 194 $ 710 $ 674R&D expense(2) 2 1 6 4
$ 222 $ 195 $ 716 $ 678As a percentage of revenues 13.4% 9.3% 12.5% 9.7%
(1) Net amount capitalized in aerospace program tooling.(2) Excluding amortization of aerospace program tooling of $38 million and $120 million, respectively, for the fourth quarter and fiscal year
ended December 31, 2016 ($39 million and $125 million, respectively, for the fourth quarter and fiscal year ended December 31, 2015), as the related investments are already included in aerospace program tooling.
Program tooling additions mainly relate to the development of the Global 7000 and Global 8000 aircraft program.
The carrying amount of business aircraft program tooling(1) as at December 31, 2016 was $2.6 billion, compared to $2.0 billion as at December 31, 2015. The increase in the net carrying value of business aircraft program tooling as at December 31, 2016 is mainly due to tooling additions for the Global 7000 and Global 8000 aircraft program. (1) Capitalized borrowing costs included in the business aircraft aerospace program tooling balance amounted to $266 million as at
December 31, 2016 ($157 million as at December 31, 2015).
Reconciliation of the carrying amount of aerospace program toolingBalance as at December 31, 2015 $ 2,041Investment in product development 710Amortization of aerospace program tooling (120)Balance as at December 31, 2016 $ 2,631
Recognizing the long-term nature of product development activities, as well as the significant human and financial resources required, a gated product development process is followed focusing on early identification and mitigation of potential risks. All programs follow the Bombardier Engineering System throughout the product development cycle. The product development process is constantly refined to integrate the lessons learned from our programs and from the industry. The stages in the process are described hereafter and specific milestones must be met before a product can move from one stage of development to another. The gates consist of exit reviews with different levels of management and technical experts to demonstrate feasibility, customer acceptance and financial return. Designing products with minimal environmental impacts throughout their entire lifecycle is central to our product responsibility strategy. In addition to the Design for Environment approach, health and safety considerations are also embedded in product design.

BOMBARDIER INC. / 2016 FINANCIAL REPORT / BUSINESS AIRCRAFT 51
PRODUCT DEVELOPMENT PROCESSStage DescriptionConceptual definition JTAP Joint Technical Assessment Phase - Preliminary review with potential partners and
suppliers to analyze technologies desired to build or modify an aircraft.JCDP Joint Conceptual Definition Phase - Cooperative effort with potential partners and
suppliers to perform a configuration trade-off study and define the system architecture and functionality.
Launch preparation Continuation of the design definition and technical activities.Creation of a project plan to define the schedule, cost, scope, statement of work andresource requirements for the program.
Preliminary definition JDP Joint Definition Phase - Joint determination with partners and suppliers of the technical design of the aircraft and sharing of the work required. Optimization of the aircraft design with respect to manufacturing, assembly and total life-cycle costs.
Detail definition DDP Detailed Design Phase - Preparation of detailed production drawings and confirmation of the design based on the preliminary design definition agreed in the previous phase.
Product definition release Formal issue of the engineering drawings to manufacturing, allowing for the completionof tool designs and the assembly of the first produced aircraft.
Product certification Completion of certification activities to demonstrate that the aircraft complies with theoriginal design requirements and all regulatory airworthiness standards.
Program completion Conclusion of final design activity.Preparation for EIS.
The Global 7000 and Global 8000 aircraft programOn November 4, 2016, we completed the successful maiden flight of the first Global 7000 flight test vehicle, FTV1, dedicated to testing basic system functionality and assessing the handling and flying qualities of the aircraft. In December, the Global 7000 FTV1 arrived at Bombardier’s Flight Testing Centre in Wichita. In parallel to the flight test program, we are completing work on the Global 7000 aircraft interior test rig, which will simulate real-world flexing and bending conditions of the fuselage. In addition, a second rig is testing cabin systems integration to ensure all systems operate with the highest level of reliability when the aircraft enters into service. Progress continues on building the program’s other Global 7000 FTVs, all of which are in various stages of production and assembly. The Global 7000 and Global 8000 aircraft program manufacturing process makes use of the highest caliber technology, including a state-of-the-art automated positioning system using laser-guided measuring to join the wing structure to the fuselage with a very high level of precision.
The engine supplier received engine certification from the U.S. Federal Aviation Administration (FAA) in April 2016. The category-defining Global 7000 aircraft is expected to enter into service in the second half of 2018. It will set the standard for a new category of large business jets, as the first and only clean-sheet business jet with four living spaces.

52 BOMBARDIER INC. FINANCIAL REPORT - FISCAL YEAR ENDED DECEMBER 31, 2016
Aircraft deliveries exceeded guidance in a challenging environmentBusiness aircraft deliveries
Fourth quarters ended December 31
Fiscal years ended December 31
(in units) 2016 2015 2016 2015Light
Learjet 70/75 11 11 24 32Medium
Challenger 300/350 19 18 62 68Challenger 605/650 11 14 26 25Challenger 850 — — — 1
LargeGlobal 5000/Global 6000 13 21 51 73
54 64 163 199
Deliveries in the fourth quarter ended December 31, 2016 include the sale of one aircraft to Commercial Aircraft who will modify the aircraft with specialized aircraft solutions to suit the needs of an external customer for mission requirements. In our consolidated financial statements, the revenue and margin associated with this aircraft have been reversed and will be recognized when Commercial Aircraft completes the specialized work on the aircraft.
For the three-year period ended December 31, 2016, we captured a 36% market share in the overall market in which we compete, based on revenue, and 32% of the market share based on units delivered. We were the market leader in terms of units delivered and second in terms of revenues. This compares with a market share of 35% and 33%, based on revenues and units delivered respectively for the three-year period ended December 31, 2015; we were also the market leader in terms of units delivered and second in terms of revenues.(1)
(1) Based on our estimates, competitors’ public disclosure, the General Aviation Manufacturers Association (GAMA) shipment reports, Ascend Flight Global and B&CA Magazine list prices.
Significant increase in gross ordersNet orders
Fourth quarters ended December 31
Fiscal years ended December 31
(in units) 2016 2015 2016 2015Gross orders 30 31 152 119Cancellations (8) (50) (38) (143)Net orders 22 (19) 114 (24)

BOMBARDIER INC. / 2016 FINANCIAL REPORT / BUSINESS AIRCRAFT 53
We received significantly higher gross orders in 2016 compared to 2015. In 2015, we took proactive actions to improve the quality of the order backlog, which contributed to a lower level of cancellations in 2016 compared to the previous year.
The net negative orders for the fourth quarter ended December 31, 2015 are mainly due to the cancellation of 24 firm orders, following the restructuring of certain customer commercial agreements.
In addition to the cancellation of 24 firm orders in the fourth quarter of 2015, the net negative orders for fiscal year 2015 are due to cancellations of 74 Learjet 85 aircraft orders, of which 64 orders were canceled in the third quarter of 2015 following our decision to cancel the aircraft program due to the lack of sales following the prolonged market weakness.
Industry-leading backlogOrder backlog
As at(in billions of dollars) December 31, 2016 December 31, 2015
$ 15.4 $ 17.2
Book-to-bill ratio(1)
Fourth quarters ended December 31
Fiscal years ended December 31
2016 2015 2016 2015Net orders 22 (19) 114 (24)Deliveries 54 64 163 199
0.4 nmf 0.7 nmf(1) Defined as net orders received over aircraft deliveries, in units.
The decrease in order backlog as at December 31, 2016 reflects lower order intake than deliveries for business aircraft.
The order backlog and the production horizon for programs are monitored to align production rates to reflect market demand.
The gross book-to-bill ratio, defined as gross orders received over aircraft deliveries in units, was 0.9 for the year ended December 31, 2016 compared to 0.6 for the same period last year.

54 BOMBARDIER INC. FINANCIAL REPORT - FISCAL YEAR ENDED DECEMBER 31, 2016
WorkforceTotal number of employees
As atDecember 31, 2016 December 31, 2015
Permanent(1) 9,000 10,100Contractual(2) 400 300
9,400 10,400Percentage of permanent employees covered by collective agreements 41% 43%
(1) Including inactive employees.(2) Including non-employees and agency outsourced personnel.
The workforce as at December 31, 2016 decreased by 1,000 employees, or 10%, when compared to last year.
This reduction is mainly related to our decision, in February 2016, to take steps to optimize our workforce with a combination of manpower reduction and strategic hiring in line with our transformation plan. The workforce reductions announced in February 2016 have been essentially achieved during fiscal year 2016.
The reduction also includes initial impacts of our October 2016 announcement to take further restructuring actions, including streamlining administrative and non-production functions across the organization and workforce optimization, partially offset by strategic hiring to support ramp-up for the Global 7000 and Global 8000 aircraft program as well as our growth strategy in aftermarket business.
Our incentive-based compensation plan for non-unionized employees across our sites rewards the collective efforts of our employees in achieving our objectives using performance indicator targets. A total of 5,550 employees worldwide, or 62% of permanent employees, participate in the program. In 2016, as part of this program, incentive-based compensation was linked to the achievement of targeted results, based on EBIT before special items and free cash flow.
GUIDANCE AND FORWARD-LOOKING STATEMENTS
Latest guidance for 2016 What we did in 2016 What’s next for 2017(1)
Growth anddeliveries
Revenues of approximately$5.5 billion.
Above 150 deliveries.
Revenues of $5.7 billion.
163 deliveries.
Revenues of approximately $5.0 billion.
Approximately 135 deliveries. Profitability(2) EBIT margin before special items(2)
above 6.0%. EBIT margin before special items(2) of 6.4%.
EBIT margin before special items(2) of approximately 7.5%.
Update on 2016 guidance
In November 2016, we indicated Business Aircraft was in line to achieve revenue, delivery and profitability(2) guidance for 2016. Revenues had benefited from a favourable mix with higher proportion of medium and large aircraft, compared to the original forecast. EBIT before special items(2) also reflected stronger operational performance. Based on results for the first nine months of 2016, we refined revenue guidance for 2016 from greater than $5.0 billion and approximately 150 deliveries to approximately $5.5 billion and over 150 deliveries. We also refined profitability guidance(2) for 2016 from approximately 6% to greater than 6%. (1) See Forward-looking statements in boxed text below for details regarding the assumptions on which the guidance is based. Also see forward-
looking statements disclaimer in Overview.(2) Profitability guidance is based on EBIT margin before special items. Refer to the Non-GAAP financial measures section in Overview for a
definition of this metric and to the Analysis of results section for a reconciliation to the most comparable IFRS measure for 2016.

BOMBARDIER INC. / 2016 FINANCIAL REPORT / BUSINESS AIRCRAFT 55
Our 2016 revenues and profitability results have both exceeded the revised guidance provided in November 2016, reaching $5.7 billion in revenues and 6.4% in EBIT margin before special items, while deliveries reached 163 units, well above the revised guidance of 150 units. The additional deliveries relative to guidance stem from capturing market opportunities, particularly in the fourth quarter. The combination of higher deliveries with a higher proportion of medium and large aircraft explains the stronger revenues and EBIT performance. The higher EBIT performance is largely attributable to stronger operational performance driven by progress on transformation initiatives.
Our strategy to achieve 2017 guidance
2017 will see a planned revenue reduction to $5.0 billion, supported by 135 deliveries, mainly reflecting an adjustment to volumes of Learjet family of aircraft. Delivery profiles for the Challenger and Global families of aircraft are generally expected to continue from production levels set in the later part of 2016. While prudently re-setting revenues to a lower level for 2017, Business Aircraft will continue to expand its margin, both in dollars and percentage, towards approximately 7.5%,(1)(2) mainly driven by progress on transformation initiatives and active management towards a higher quality backlog.
(1) See Forward-looking statements in boxed text below for details regarding the assumptions on which the guidance is based. Also see forward-looking statements disclaimer in Overview.
(2) Profitability guidance is based on EBIT margin before special items. Refer to the Non-GAAP financial measures section in Overview for a definition of this metric.
Forward-looking statements Forward-looking statements(1) in this section of the MD&A are based on: • deliveries based on current firm order backlog and estimated future order intake;(2) • a lower level of aircraft deliveries in fiscal year 2017 compared to fiscal year 2016, mainly due to the production rate reset
on the Learjet 75 aircraft, and growth from customer services;• the alignment of production rates to market demand;• the continued deployment and execution of key transformation initiatives, especially those impacting direct and indirect
procurement costs, labour efficiency and working capital improvement;• our ability to execute and deliver business model enhancement initiatives;• our ability to meet scheduled EIS dates and planned costs for the Global 7000 and Global 8000 aircraft program;• our ability to recruit and retain highly skilled resources to deploy our product development strategy;• the ability of our supply base to support planned production rates;• competitive global environment and global economic conditions to remain similar; and• stability of foreign exchange rates.(1) Also refer to the Guidance and forward-looking statements section in Overview.(2) Demand forecast is based on the analysis of main market indicators, including real GDP growth, industry confidence, corporate
profitability within our customer base, pre-owned business jet inventory levels, aircraft utilization, aircraft shipments and billings, installed base and average age of the fleet. For more details, refer to the market indicators in the Industry and economic environment section.
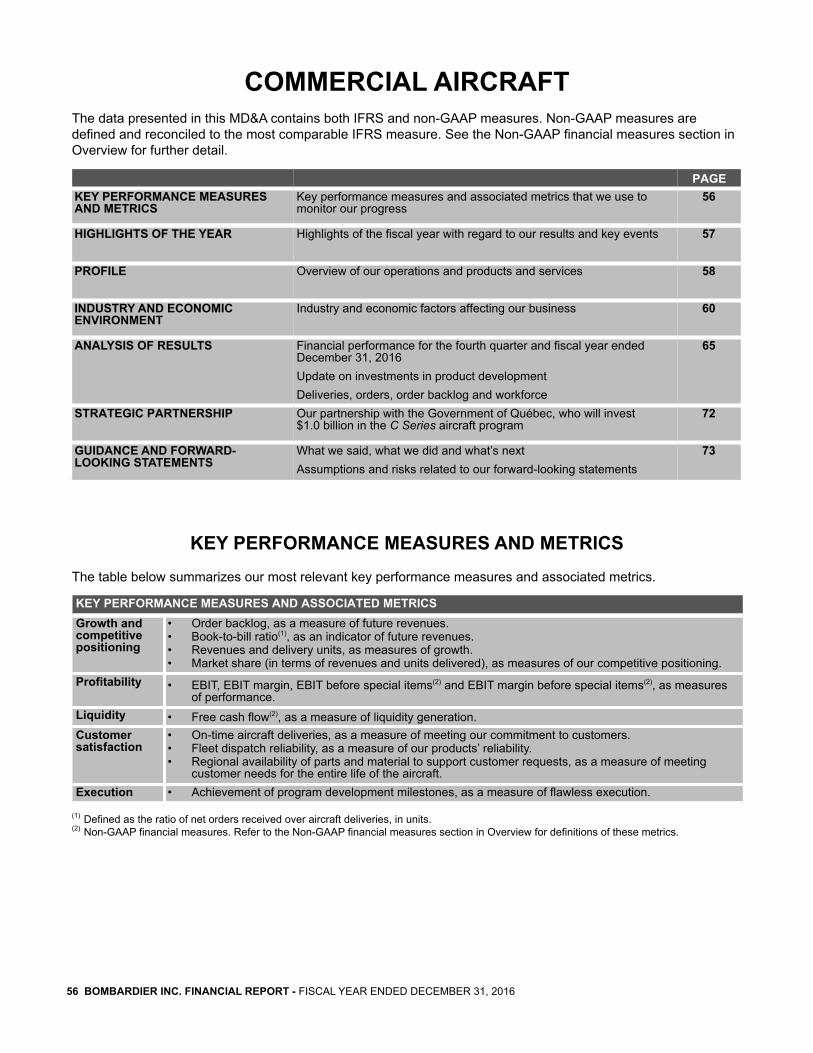
56 BOMBARDIER INC. FINANCIAL REPORT - FISCAL YEAR ENDED DECEMBER 31, 2016
COMMERCIAL AIRCRAFTThe data presented in this MD&A contains both IFRS and non-GAAP measures. Non-GAAP measures are defined and reconciled to the most comparable IFRS measure. See the Non-GAAP financial measures section in Overview for further detail.
PAGEKEY PERFORMANCE MEASURES AND METRICS
Key performance measures and associated metrics that we use tomonitor our progress
HIGHLIGHTS OF THE YEAR Highlights of the fiscal year with regard to our results and key events
PROFILE Overview of our operations and products and services
INDUSTRY AND ECONOMIC ENVIRONMENT
Industry and economic factors affecting our business
ANALYSIS OF RESULTS Financial performance for the fourth quarter and fiscal year ended December 31, 2016Update on investments in product developmentDeliveries, orders, order backlog and workforce
STRATEGIC PARTNERSHIP Our partnership with the Government of Québec, who will invest $1.0 billion in the C Series aircraft program
GUIDANCE AND FORWARD-LOOKING STATEMENTS
What we said, what we did and what’s nextAssumptions and risks related to our forward-looking statements
KEY PERFORMANCE MEASURES AND METRICSThe table below summarizes our most relevant key performance measures and associated metrics.
KEY PERFORMANCE MEASURES AND ASSOCIATED METRICSGrowth andcompetitivepositioning
• Order backlog, as a measure of future revenues. • Book-to-bill ratio(1), as an indicator of future revenues. • Revenues and delivery units, as measures of growth. • Market share (in terms of revenues and units delivered), as measures of our competitive positioning.
Profitability • EBIT, EBIT margin, EBIT before special items(2) and EBIT margin before special items(2), as measures of performance.
Liquidity • Free cash flow(2), as a measure of liquidity generation. Customersatisfaction
• On-time aircraft deliveries, as a measure of meeting our commitment to customers. • Fleet dispatch reliability, as a measure of our products’ reliability. • Regional availability of parts and material to support customer requests, as a measure of meeting
customer needs for the entire life of the aircraft.Execution • Achievement of program development milestones, as a measure of flawless execution.
(1) Defined as the ratio of net orders received over aircraft deliveries, in units.(2) Non-GAAP financial measures. Refer to the Non-GAAP financial measures section in Overview for definitions of these metrics.
56
57
58
60
65
72
73

BOMBARDIER INC. / 2016 FINANCIAL REPORT / COMMERCIAL AIRCRAFT 57
HIGHLIGHTS OF THE YEAR
C Series family of aircraft begins revenue generation
REVENUES EBIT EBIT BEFORE SPECIAL ITEMS(1)
NET ADDITIONS TOPP&E & INTANGIBLE
ASSETSORDER BACKLOG
$2.6 billion ($903 million) ($417 million) $392 million 436 units
RESULTSFor the fiscal years ended December 31 2016 2015 VarianceRevenues $ 2,617 $ 2,395 9 %Aircraft deliveries (in units) 86 76 10Net orders (in units) 161 51 110Book-to-bill ratio(2) 1.9 0.7 1.2EBIT $ (903) $ (3,970) nmfEBIT margin (34.5)% nmf nmfEBIT before special items(1) $ (417) $ (170) (145)%EBIT margin before special items(1) (15.9)% (7.1)% (880) bpsEBITDA before special items(1) $ (353) $ (66) nmfEBITDA margin before special items(1) (13.5)% (2.8)% (1070) bpsNet additions to PP&E and intangible assets $ 392 $ 963 (59)%As at December 31 2016 2015Order backlog (in units) 436 361 75
(1) Non-GAAP financial measures. Refer to the Non-GAAP financial measures section in Overview for definitions of these metrics and to the Analysis of results section for reconciliations to the most comparable IFRS measures.
(2) Ratio of net orders received over aircraft deliveries, in units.
KEY HIGHLIGHTS AND EVENTS
• Commercial aircraft’s financial performance for 2016 was marked by the production ramp-up and the start of the revenue-generating phase of the C Series aircraft program. Revenues and deliveries were in line with guidance. The EBIT loss compares favourably relative to guidance, stemming from strong execution while ramping up production and cost control during the initial months following EIS, supported by the reliability of the aircraft in service. Our focus is now on improving efficiency while ramping up to full production, continuing to increase our order backlog, delivering the C Series aircraft and providing customer support.
• Commercial Aircraft reached a historic milestone in 2016 as it certified and brought to market both variants of the C Series aircraft, the first all-new clean-sheet designed family of single-aisle aircraft in the 100- to 150-seat segment in nearly 30 years. With a total of seven aircraft delivered by year end, both the CS100 and CS300 aircraft are delivering on their operating cost advantage, superior operating flexibility, exceptional performance and range, as well as passenger comfort. • We delivered the first CS100 aircraft to launch operator Swiss International Air Lines (SWISS) on
June 29, 2016 and supported their preparation for commercial service which began on July 15, 2016.• On November 28, 2016, the first CS300 aircraft was delivered to launch operator Air Baltic Corporation
AS (airBaltic). The aircraft’s first commercial flight took place on December 14, 2016.• During the year, significant orders solidified the C Series aircraft program in the 100- to 150-seat category. A
total of 129 firm orders and 80 options were added to the backlog, from Delta Air Lines, Air Canada, airBaltic and Air Tanzania, with a combined value of $10.1 billion at list prices. In conjunction with the firm orders recorded in the second quarter, we recorded an onerous contract provision of $492 million on a consolidated basis. At EIS, the program had over 350 aircraft in our firm order backlog and approximately 600 aircraft when including options.
• During the year, we closed the $1.0-billion investment by the Government of Québec (through Investissement Québec) in return for a 49.5% equity stake in a newly-created limited partnership, the C Series Aircraft Limited Partnership (CSALP), which will carry on the operations related to our C Series aircraft program and continues to be consolidated in our financial results.

58 BOMBARDIER INC. FINANCIAL REPORT - FISCAL YEAR ENDED DECEMBER 31, 2016
PROFILE
A leading portfolio of aircraft in the 60- to 150-seat categoriesWe design and manufacture a broad portfolio of commercial aircraft in the 60- to 150-seat categories, including, the CRJ700, CRJ900 and CRJ1000 regional jets as well as the clean-sheet C Series mainline jets and the Q400 turboprop. We provide aftermarket services for these aircraft as well as for the 20- to 59-seat range category. There are approximately 2,300 active Bombardier aircraft currently in service. We also provide solutions for governments, agencies and specialized organizations worldwide by modifying business and commercial aircraft to suit customer needs for different mission requirements.
MARKET SEGMENT: COMMERCIAL AIRCRAFT
COMMERCIAL JETSModels: CS100 and CS300Market category: 100- to 150-seat commercial jetsKey features(1): Comprised of the CS100 and the larger CS300 airliner, the C Series family of aircraft represents the fusion of performance and technology. The result is aircraft that deliver unmatched performance and economics in the 100- to 150-seat market segment. Setting a new standard in single-aisle cabin design and flexibility, the C Series aircraft offer an unrivaled passenger experience with larger seats, overhead bins and windows. The aircraft’s groundbreaking geared turbofan engine, combined with the aircraft’s advanced aerodynamics, delivers reduced fuel burn, noise, and emissions.
C Series family of aircraft
REGIONAL JETSModels: CRJ700, CRJ900 and CRJ1000Market category: 60- to 100-seat regional jetsKey features(1): Designed for hub expansion and point-to-point services, the CRJ Series aircraft family is optimized for medium to long distance regional routes. The most successful regional aircraft program, the CRJ Series family, features best-in-class operating costs, fuel burn and emissions. The CRJ Series aircraft family now includes an improved cabin with a more open entrance area and greater on-board storage capacity, delivering an enhanced passenger experience.
CRJ900 aircraft
(1) Under certain operating conditions, when compared to aircraft currently in service for short-haul flights up to 500 NM.

BOMBARDIER INC. / 2016 FINANCIAL REPORT / COMMERCIAL AIRCRAFT 59
TURBOPROPSModel: Q400Market category: 60- to 90-seat turbopropsKey features(1): With its jet-like speed and an extended range, industry-leading passenger experience and reduced environmental footprint, the Q400 aircraft is versatile and can be adapted to meet varied operational requirements. It is the only in-production turboprop that can be configured to accommodate up to 90 passengers. The cargo-passenger combi Q400 aircraft is available in various configurations and offers cargo capacity while accommodating passengers. (1) Under certain operating conditions, when compared to aircraft
currently in service for short-haul flights up to 500 NM.Q400 aircraft
SPECIALIZED AIRCRAFT Models: Various Bombardier business and commercial aircraft Key features: Provides solutions for governments, agencies and specialized organizations worldwide by modifying commercial and business aircraft to suit customer needs for different mission requirements including: maritime patrol, medical and government VIP transport, intelligence surveillance, reconnaissance and communication platforms, and military transport.
MARKET SEGMENT: CUSTOMER SERVICES
MAINTENANCE SERVICESServices portfolio: Extensive capabilities to accommodate aircraft maintenance, refurbishment and modification for commercial aircraft.Key features: Offering worldwide service and support through wholly-owned or operated service centres, authorized service facilities (ASF) and mobile repair teams.
PARTS AND SMART SERVICESServices portfolio: Providing new and used parts, initial provisioning services, tooling, repair of customer-owned parts, rentals, and Smart Parts program.Key features: Supporting customers for all their parts needs with parts distribution hubs, and parts depots worldwide. The Smart Parts program provides budget predictability and cost protection for our customers.
CUSTOMER SUPPORT Services portfolio: Comprehensive portfolio of customer services including: regional support offices, 24-hour customer response centres, technical publications, engineering solutions, maintenance planning, customer liaison pilots, a network of field service personnel, mobile repair teams, start-up technicians, EIS support, and e-services.Key features: Providing operators with a single point of contact, 24 hours a day, 365 days a year, for all critical and aircraft-on-the-ground requests. In 2016, the strength of the customer service network across the globe continued to grow, with the extension of several ASF agreements across the Q Series and CRJ Series platforms and the addition of an European C Series platform ASF.
TRAININGServices portfolio: A complete range of flight crew and technical training services on commercial and specialized aircraft at our facility and through a network of strategic partnerships and collaborations worldwide. In addition, we have approved third-party training providers to provide worldwide training services under our oversight.Key features: As an original equipment manufacturer (OEM), we quickly modify courseware and training devices to reflect ongoing aircraft enhancements and provide a wide portfolio of training solutions to suit our customers’ needs.

60 BOMBARDIER INC. FINANCIAL REPORT - FISCAL YEAR ENDED DECEMBER 31, 2016
INDUSTRY AND ECONOMIC ENVIRONMENT
Strong fundamentals supporting the positive long-term outlook for the 100-150 seat commercial aircraft category
The commercial aircraft market continues its strong performance as passenger traffic levels and airline financial performance maintained impressive levels in 2016. The following key indicators are used to monitor the health of the commercial airline industry in the short term:
Indicator Current situation StatusPassengertraffic levels
The demand for new aircraft is primarily driven by the demand for air travel. Scheduled domestic and international passenger traffic, measured by revenue passenger kilometres (RPK), were 5.7% and 6.7% higher, respectively, for the year-to-date period ended December 2016 compared to the same period last year.(1) For domestic commercial air travel specifically, increases in China, the U.S. and India account for most of the 5.7% increase in RPK compared to the same period last year, which was partially offset by a decline in Brazil. On the international commercial air travel side, increases in Asia Pacific, Europe and the Middle-East account for most of the 6.7% increase in RPK compared to the same period last year.(1)
Airlines achieved both domestic and international average passenger load factors of 82.2% and 79.6%, respectively, for the year-to-date period ended December 2016 compared to 81.5% and 79.7%, respectively, for the same period last year. In the first half of 2016, the upward trend in passenger traffic moderated due to headwinds from high-profile terrorist attacks, political instability and subdued economic activity. However in the second half of the year, passengers adjusting to the uncertain environment and a moderate upturn in the global economic cycle led to an acceleration in the upward trend in passenger traffic.(1)
During 2016, regional passenger traffic measured by RPK for the four leading U.S. network carriers and their affiliates(2), which represent a major portion of the regional airline passenger traffic in the U.S., our largest market, slightly increased by 0.8% compared to 2015.These airlines achieved an average passenger load factor of 80.3% in 2016, down from the 81.4%experienced in 2015.
Fuel prices Planning is difficult for airlines when the price for one of the largest components of their operating costs remains volatile. The average annual price of Brent crude oil decreased from $52 per barrel in 2015 to $44 in 2016. Following the decision by the Organization of the Petroleum Exporting Countries (OPEC) at its November 2016 meeting to limit crude oil supply and signs that non-OPEC suppliers will follow suit, oil prices rose to a 17-month high in December. At the end of 2016, the price stood at $55 per barrel. During the first week of February 2017, the price was approximately $56 per barrel.(3) The futures market is now pricing in a weak upward trend in oil prices with prices remaining relatively low until 2020.(1)
Although low fuel prices could lead some airlines to delay their decision to renew their fleet in the short term, it should continue to help improve airline profitability, which in turn would provide an opportunity for airlines to reinvest in their fleets. The high volatility in crude oil prices should result in continued demand for more fuel efficient aircraft.
Airlineprofitability
Airline financial performance slightly improved in 2016. Airline profits are estimated to be $35.6 billion in 2016, a record high and a seventh consecutive year of positive net profits for the industry. North American airlines are expected to generate the highest profit in terms of dollars and profit margins due to a combination of consolidation, helping to increase load factors, ancillaries and lower fuel costs, followed by airlines in Europe and Asia-Pacific. Airline financial performance is forecast to weaken in 2017 with total profits of $29.8 billion as a result of higher anticipated fuel costs and expected reduction in passenger growth as the demand stimulus from lower oil prices tapers off.(4) With record-high profitability levels, airlines should be more inclined to reinvest in their fleets.
Identifies a favourable, neutral or negative status, respectively, in the market categories in which we compete, based on the current environment. (1) Per IATA’s December 2016 “Air Passenger Market Analysis and Airlines Financial Monitor” reports.(2) Delta Air Lines, American Airlines, United Airlines, and Alaska Air.(3) According to the U.S. Energy Information Administration’s (EIA) website.(4) Per IATA’s forecast in the “Economic Performance of the Airline Industry” December 2016 year-end report.
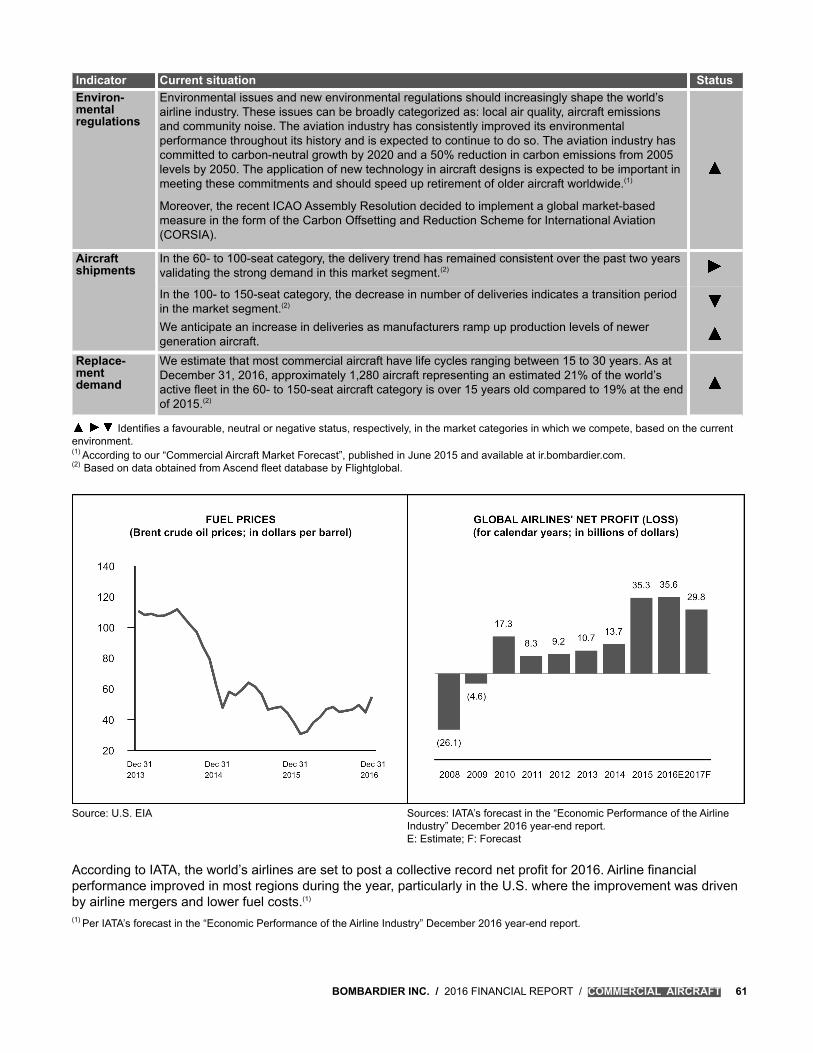
BOMBARDIER INC. / 2016 FINANCIAL REPORT / COMMERCIAL AIRCRAFT 61
Indicator Current situation StatusEnviron-mentalregulations
Environmental issues and new environmental regulations should increasingly shape the world’s airline industry. These issues can be broadly categorized as: local air quality, aircraft emissions and community noise. The aviation industry has consistently improved its environmental performance throughout its history and is expected to continue to do so. The aviation industry has committed to carbon-neutral growth by 2020 and a 50% reduction in carbon emissions from 2005 levels by 2050. The application of new technology in aircraft designs is expected to be important in meeting these commitments and should speed up retirement of older aircraft worldwide.(1)
Moreover, the recent ICAO Assembly Resolution decided to implement a global market-based measure in the form of the Carbon Offsetting and Reduction Scheme for International Aviation (CORSIA).
Aircraftshipments
In the 60- to 100-seat category, the delivery trend has remained consistent over the past two years validating the strong demand in this market segment.(2)
In the 100- to 150-seat category, the decrease in number of deliveries indicates a transition period in the market segment.(2) We anticipate an increase in deliveries as manufacturers ramp up production levels of newer generation aircraft.
Replace-mentdemand
We estimate that most commercial aircraft have life cycles ranging between 15 to 30 years. As at December 31, 2016, approximately 1,280 aircraft representing an estimated 21% of the world’s active fleet in the 60- to 150-seat aircraft category is over 15 years old compared to 19% at the end of 2015.(2)
Identifies a favourable, neutral or negative status, respectively, in the market categories in which we compete, based on the current environment. (1) According to our “Commercial Aircraft Market Forecast”, published in June 2015 and available at ir.bombardier.com.(2) Based on data obtained from Ascend fleet database by Flightglobal.
Source: U.S. EIA Sources: IATA’s forecast in the “Economic Performance of the Airline Industry” December 2016 year-end report.E: Estimate; F: Forecast
According to IATA, the world’s airlines are set to post a collective record net profit for 2016. Airline financial performance improved in most regions during the year, particularly in the U.S. where the improvement was driven by airline mergers and lower fuel costs.(1)
(1) Per IATA’s forecast in the “Economic Performance of the Airline Industry” December 2016 year-end report.

62 BOMBARDIER INC. FINANCIAL REPORT - FISCAL YEAR ENDED DECEMBER 31, 2016
The state of the world economy and those of individual countries are key factors in the demand for air travel. As such, the health of the aerospace industry is a function of general economic conditions, with a lag typically between economic recovery and the time it takes to reflect on the original equipment manufacturers’ deliveries and revenues. Real GDP growth is a widely accepted measure of economic activity. Worldwide real GDP increased by 2.2% in 2016, which is lower than the 2.7% increase in 2015.(1)
Short-term outlook The current overall positive trend in market indicators as well as the future anticipated growth in GDP rates are expected to further increase the demand for air travel and the demand for new aircraft is expected to follow. The world economy is projected to grow by 2.6% in 2017 and 2.9% in 2018 and 2.8% in 2019.(1)
We believe that the market for larger regional aircraft and smaller mainline aircraft should grow in North America as airlines continue to focus on fleet optimization, fuel-efficiency and reducing environmental impacts. The GDP in the U.S., the largest market for commercial aircraft, is expected to grow at 2.3% in 2017, 2.5% in 2018 and 1.8% in 2019, compared to 1.6% in 2016.(1)
In Europe, the GDP is expected to grow at 1.7% in 2017, 2018 and 2019.(1) In this context, we do not expect much growth in demand for regional aircraft in Europe. European airlines are likely to continue to focus on consolidation and operational restructuring.
In regions with high growth potential for commercial aviation such as in Greater China and India, growth in 2017 is expected to be at 6.3% and 6.7%, respectively, compared to 6.7% and 7.1% in 2016, respectively. In recovering economies like the CIS and Latin America, after a decline in 2016, the expected growth in 2017 is 1.6% and 1.1% respectively.(1)
The strong correlation between passenger traffic and economic growth in non-traditional markets should translate into continued aircraft demand in the near future. This demand is expected to be met by a combination of pre-owned and new aircraft.(1) According to “Oxford Economics Global Data Report” dated January 16, 2017.
Long-term outlookWe remain confident that continuing economic growth should increase demand for air travel over the next 20 years. The financial outlook for the world’s airlines is improving as economic growth returns to most regions.
In June 2015, we released our global market forecast for the 20-year period from 2015 to 2034.(1)
The “Commercial Aircraft Market Forecast” predicts 12,700 aircraft deliveries for 60- to 150-seat commercial aircraft in the next 20 years.
The 20-year deliveries are valued at $650 billion, largely in the 100- to 150-seat segment.(2) Over the next 20 years, 5,000 60- to 150-seat commercial aircraft are expected to be retired. (1) Available at ir.bombardier.com.(2) Revenues are based on estimated segment 2014 list prices.
* As stated in our “Commercial Aircraft Market Forecast”, published in June 2015 and available at ir.bombardier.com**Unit values based on Business & Commercial Aviation (B&CA) magazine 2014 list prices.

BOMBARDIER INC. / 2016 FINANCIAL REPORT / COMMERCIAL AIRCRAFT 63
The forecast deliveries are expected to arise from replacement demand in established markets, such as North America and Europe, and fleet growth potential in emerging markets. North America is expected to account for the greatest number of 60- to 150-seat commercial aircraft deliveries, followed by Greater China, Europe and Latin America.
COMMERCIAL AIRCRAFT FLEET EVOLUTION BY CATEGORY 2015-2034*
* In units. As stated in our “Commercial Aircraft Market Forecast”, published in June 2015 and available at ir.bombardier.com.
Most new 60- to 150-seat aircraft deliveries to mature aviation markets such as North America, Europe, Oceania and Northeast Asia (Japan and South Korea) are expected to replace retiring aircraft fleets.
In emerging markets, demand for air travel is growing with increasing GDP and an expanding middle class. The airline industries in the emerging regions of Other Asia-Pacific, Greater China, India, Latin America and the CIS are at different stages of maturity, but all are expected to require aircraft with different seat capacities and operating economics to meet passenger demand.
In the long-term, the worldwide 60- to 150-seat fleet is forecast to grow to 15,000 units by 2034. Approximately 55% of the forecast deliveries are in the 100- to 150-seat segment, for a value of approximately $460 billion.(1)(2) Airlines in this segment, who have been constrained to the currently available technology on these aircraft, are anticipated to witness a major fleet transformation. The aircraft in service today in this market segment are older than larger single-aisle aircraft. There had been little activity to renew the fleet in this segment and as of today, the C Series is the only clean-sheet design for this market and has entered into service in 2016. While there are other redesigned aircraft expected to enter the market, the C Series offers superior economics and passenger comfort. We anticipate to capture a leading share of the 7,000 deliveries in the 100- to 150-seat aircraft market over the next 20 years.(1) Environmental regulations and the requirement to upsize from regional aircraft should provide positive growth for this segment of the market.
The 60- to 100-seat aircraft market should see substantial growth over the forecast period with demand for 5,700 aircraft worth $190 billion.(1)(2) Overall, demand for regional aircraft in the 60- to 100-seat aircraft market is expected to be approximately equally split between turboprops and jets in terms of units.(1) According to our “Commercial Aircraft Market Forecast”, published in June 2015 and available at ir.bombardier.com.(2) Revenues are based on estimated segment 2014 list prices.

64 BOMBARDIER INC. FINANCIAL REPORT - FISCAL YEAR ENDED DECEMBER 31, 2016
Customer services
Commercial Aircraft’s worldwide customer services network includes wholly-owned or operated service centres, parts hubs, parts depots, regional support offices, customer response centres, mobile repair team, training centre, as well as authorized service facilities and authorized training providers.
The demand for customer services is driven by the size of the fleet of Bombardier commercial aircraft, the number of hours flown by said fleet and the average age of the fleet.
Customer services market indicators
Indicator Current situation StatusInstalledbase
The installed base for active in-service Bombardier commercial aircraft increased in 2016 to 2,326 aircraft compared to 2,210 in 2015.(1)
Averagedaily flighthours
Based on our estimates, Bombardier aircraft average daily flight hours decreased by approximately 1.3% for commercial aircraft for the 12-month period ended October 31, 2016 compared to the same period last year.
Averageage of fleet
Typically, aircraft direct maintenance costs increase as an aircraft ages. Therefore, the average age of the fleet of Bombardier aircraft is expected to impact the size of the maintenance market. There has been a slight increase in the average age of the Bombardier commercial aircraft fleet in 2016 compared to 2015.(1)
Identifies a favourable, neutral or negative status, respectively, in the market categories in which we compete, based on the current environment.(1) Based on data obtained from Ascend fleet database by Flightglobal.
Short-term outlookHistorically, the U.S. represented the largest share of deliveries for commercial aircraft; however, wealth creation and economic development in non-traditional markets is driving a shift in the proportion of commercial aircraft delivered outside of the U.S. This trend in demand impacts the geographical layout of our support network. In the non-traditional markets, the strategy is to increase our local customer services presence and leverage third-parties to deploy the full span of services.
Long-term outlookThe continued growth of the installed base is expected to stimulate demand for customer services. While traditional markets such as North America and Europe should dominate in terms of market size, the fleet growth in non-traditional markets is accelerating and creating new opportunities for customer services.
In the next 10 years, commercial aircraft industry deliveries should see the highest growth rates in emerging economies such as South Asia and China. This growing demand, along with our customer services offerings, is expected to drive growth outside of traditional markets.(1)
Airline financial performance has been improving in the past years to achieve record high levels,(2) but margins are still driven by major cost drivers such as labour, maintenance, and fuel. Operators are increasingly relentless in managing costs, including focusing significant attention on managing maintenance expenses.
The global commercial air transport fleet stands at over 27,000 aircraft, approximately 33% of which are domiciled in North America and 25% of the global fleet is in Europe. Asia-Pacific, including China and India, has slightly more than 25% of the world’s fleet.(3) This composition will change over the next 10 years. North America’s share is expected to decline 7%, as its net growth is constrained by significant re-fleeting efforts of the large operators. The Asian markets are expected to see the highest growth rates, making it the largest world region over this forecast period and thus the centre of development for the maintenance, repair and overhaul (MRO) industry.(4)
The 2015 commercial air global MRO demand was $64.3 billion. It is expected to grow to $96 billion by 2025 at a CAGR of 4.1% per annum.(3)
(1) As stated in our “Commercial Aircraft Market Forecast”, published in June 2015 and available at ir.bombardier.com.(2) Per IATA’s forecast in the “Economic Performance of the Airline Industry” December 2016 year-end report.(3) According to the “MRO Market Update & Industry Trends” presentation at the Aviation Week MRO Europe on October 18-20, 2016 by ICF
International.(4) According to the “2016 Global Fleet and MRO Market Economic Assessment” report prepared by CAVOK, a division of Oliver Wyman.OM

BOMBARDIER INC. / 2016 FINANCIAL REPORT / COMMERCIAL AIRCRAFT 65
ANALYSIS OF RESULTS
Strong execution while ramping up production of C Series aircraftResults of operations
Fourth quarters ended December 31
Fiscal years ended December 31
2016 2015 2016 2015Revenues $ 699 $ 644 $ 2,617 $ 2,395EBITDA before special items(1) $ (127) $ (58) $ (353) $ (66)Amortization(2) 14 29 64 104EBIT before special items(1) (141) (87) (417) (170)Special items 3 240 486 3,800EBIT $ (144) $ (327) $ (903) $ (3,970)EBIT margin before special items(1) (20.2)% (13.5)% (15.9)% (7.1)%EBIT margin (20.6)% (50.8)% (34.5)% nmf
(1) Non-GAAP financial measures. Refer to the Non-GAAP financial measures section in Overview for definitions of these metrics.(2) Amortization is included in cost of sales, SG&A and R&D expense based on the underlying function of the asset.
RevenuesThe $55-million and the $222-million increases for the fourth quarter and the fiscal year, respectively, are mainly due to higher revenues from sales of new and pre-owned aircraft, partially offset by lower revenues due to the sale of our amphibious aircraft program.

66 BOMBARDIER INC. FINANCIAL REPORT - FISCAL YEAR ENDED DECEMBER 31, 2016
Special itemsSpecial items comprise items which do not reflect our core performance or where their separate presentation will assist users in understanding our results for the period, such as the impact of restructuring charges and significant impairment charges and reversals.
The special items were as follows:
Fourth quarters endedDecember 31
Fiscal years endedDecember 31
Ref 2016 2015 2016 2015Onerous contracts provision - C Series aircraft program 1 $ — $ — $ 516 $ —Pension obligation 2 — — (33) —Restructuring charge 3 3 — 3 (1)Impairment and other charges - C Series aircraft program 4 — — — 3,249Changes in estimates and fair value 5 — — — 312Impairment charge - CRJ1000 aircraft program tooling 6 — 240 — 240
$ 3 $ 240 $ 486 $ 3,800EBIT margin impact (0.4)% (37.3)% (18.6)% nmf
1. In conjunction with the closing of C Series firm orders in the second quarter of 2016, on a consolidated basis, we recorded an onerous contracts provision of $492 million, net of $24 million included in Corporate and Elimination.
2. Bombardier had a constructive obligation for discretionary ad hoc indexation increases to certain pension plans. Following a communication to plan members that we do not expect to grant such increases in the foreseeable future in line with our current practice, the constructive obligation amounting to $33 million was reversed.
3. In 2016, represents restructuring charges related to the restructuring actions announced in October 2016.
The restructuring charge in 2015 related to an adjustment to a restructuring provision recorded in 2014.
4. Represents an impairment charge of $3.1 billion on aerospace program tooling, and inventory write-downs and other provisions of $179 million, following the completion of an in-depth review of the C Series aircraft program as well as discussions with the Government of Québec which resulted in the October 2015 memorandum of understanding. An offset of $14 million related to this special item is included in Corporate and Elimination.
5. Related to an increase in provisions for credit guarantees and RVGs as a result of changes in assumptions concerning residual value curves of regional aircraft due to difficult market conditions for regional pre-owned aircraft and a higher probability that the guaranteed party will exercise the RVG given the recent experience with respect to RVG and a loss on certain financial instruments due to changes in estimated fair value.
6. Represents an impairment charge of $240 million on the remaining CRJ1000 aircraft program development costs. The impairment was due to the lack of recent order intake as well as low firm order backlog for the CRJ1000 aircraft, mainly stemming from pilot scope clauses in the U.S., which have restricted the use, number and seating capacity of regional aircraft flying on behalf of network carriers. Over the near term, we do not anticipate scope clause relaxation in the U.S., during which time, we will not be able to sell the CRJ1000 aircraft in the U.S. market. A charge of $3 million related to this special item is included in Corporate and Elimination.

BOMBARDIER INC. / 2016 FINANCIAL REPORT / COMMERCIAL AIRCRAFT 67
EBIT marginThere was a significant increase in EBIT margin for the fourth quarter ended December 31, 2016 compared to the same period last fiscal year. The EBIT margin before special items (see explanation of special items above) for the fourth quarter decreased by 6.7 percentage points mainly as a result of:
• higher other expenses related to a net negative variance of provisions for credit and residual value guarantees and financial instruments carried at fair value; and
• losses related to the C Series aircraft program as a result of the ramp-up in production, mainly related to early production units.(1)
There was a significant increase in EBIT margin for the fiscal year compared to the same period last year. The EBIT margin before special items (see explanation of special items above) for the fiscal year decreased by 8.8 percentage points mainly as a result of:
• losses related to the C Series aircraft program as a result of the ramp-up in production, mainly related to early production units;(1)
• higher other expenses related to a net negative variance of provisions for credit and residual value guarantees and financial instruments carried at fair value; and
• lower margins related to aircraft deliveries.Partially offset by:• lower R&D expenses, mainly due to lower amortization of aerospace program tooling as a result of the
lower carrying amount of the CRJ aircraft family program development costs; and• a one-time write-down of used spares inventory related to the CRJ200 aircraft program recorded in the
third quarter of 2015.(1) Early production units in a new aircraft program require higher costs than units produced later in the program and the selling prices of early
units are generally lower.
Both variants of the game-changing C Series aircraft program achieved EIS
Investment in product developmentFourth quarters
ended December 31Fiscal years
ended December 312016 2015 2016 2015
Program tooling(1) $ 113 $ 220 $ 365 $ 937R&D expense(2) 2 1 4 3
$ 115 $ 221 $ 369 $ 940As a percentage of revenues 16.5% 34.3% 14.1% 39.2%
(1) Net amount capitalized in aerospace program tooling, as well as the amount that was paid to suppliers upon delivery of the aircraft for acquired development costs carried out by them.
(2) Excluding amortization of aerospace program tooling of $10 million and $24 million, respectively, for the fourth quarter and fiscal year ended December 31, 2016 ($12 million and $60 million, respectively, for the fourth quarter and fiscal year ended December 31, 2015), as the related investments are already included in aerospace program tooling.
Program tooling additions relate to the development of the C Series aircraft program. For the fourth quarter and fiscal year ended December 31, 2016, program tooling additions declined compared to the same periods last year as the C Series aircraft program have been certified.
The carrying amount of commercial aircraft program tooling(1) as at December 31, 2016 was $2.6 billion, compared to $1.9 billion as at December 31, 2015. The increase in the net carrying value of commercial aircraft program tooling as at December 31, 2016 is mainly due to tooling additions for the C Series aircraft program. (1) Capitalized borrowing costs included in the commercial aircraft aerospace program tooling balance amounted to $299 million as at
December 31, 2016 ($294 million as at December 31, 2015).

68 BOMBARDIER INC. FINANCIAL REPORT - FISCAL YEAR ENDED DECEMBER 31, 2016
Reconciliation of the carrying amount of aerospace program tooling
Balance as at December 31, 2015 $ 1,914Investment in product development 352Acquired development costs carried out by vendors(1) 344Amortization of aerospace program tooling (24)Balance as at December 31, 2016 $ 2,586
(1) Amount recognized as aerospace program tooling at the first delivery of the CS100 aircraft that is related to acquired development costs carried out by our vendors. The amount is a non-cash item as it is repayable upon future delivery of the aircraft and will impact the net additions to PP&E and intangible assets in the cash flow once the payments are made to the suppliers upon delivery of the aircraft.
The C Series aircraft program The CS100 airliner obtained its EASA and U.S. FAA type validations following the type certification received from Transport Canada. The first CS100 aircraft was delivered to SWISS on June 29, 2016 and entered into commercial service on July 15, 2016.
After obtaining its type certification from Transport Canada, the CS300 aircraft obtained EASA and U.S. FAA type validation. The first CS300 aircraft was delivered to launch operator airBaltic on November 28, 2016 and the aircraft’s first commercial flight took place on December 14, 2016.
Both the CS100 and CS300 are demonstrating a high level of reliability for an all-new aircraft.
Environmental Product DeclarationOn September 26, 2016, an environmental product declaration (EPD®) on the CS100 aircraft was published by the International EPD® System disclosing information about the aircraft’s environmental impact throughout its life cycle. The publication of the EPD® was a first in the aerospace industry.
Same Type RatingTransport Canada, the EASA and the FAA have concluded operational evaluations on the CS100 and CS300 aircraft and determined both models will share a common pilot type rating. The Same Type Rating (STR), which reflects more than 99 per cent parts commonality between the two aircraft, allows operators to benefit from the cost-effective, minimal training required to transition pilots from one model to the other. The aircraft’s commonality also extends to maintenance procedures and ground handling and offers cost savings opportunities to customers.
Performance resultsFlight and aircraft structural test performance results have exceeded original targets for fuel burn, payload, range and airfield performance.(1)
(1) Key performance targets under certain operating conditions when compared to aircraft currently in production for flights of 500 nautical miles.
Production ramp-up and customer support activitiesOur focus will be to ramp up to full production, deliver aircraft and provide full support to our customers:
• The C Series aircraft’s full-flight simulator is playing a significant role in pilot training for both aircraft variants.
• In June 2016, we launched the C Series aircraft program’s new state-of-the-art Customer Response Centre (CRC) in Mirabel, Canada. The CRC, which is already supporting C Series customers, provides 24/7/365 access to technical services, engineering expertise and global material services.
• During the year, we announced 10-year and 5-year Smart Parts agreements with SWISS and airBaltic respectively. Under the agreements, we will provide comprehensive component maintenance, repair and overhaul services, access to a strategically located spare part exchange pool and on-site inventory based at the airlines’ respective main hub.

BOMBARDIER INC. / 2016 FINANCIAL REPORT / COMMERCIAL AIRCRAFT 69
Higher level of deliveries driven by EIS of both C Series aircraft models
Aircraft deliveriesFourth quarters
ended December 31Fiscal years
ended December 31(in units) 2016 2015 2016 2015Commercial jets
CS100 3 — 5 —CS300 2 — 2 —
Regional jetsCRJ700 — — 1 2CRJ900 5 6 37 38CRJ1000 3 3 8 4
TurbopropsQ400 10 10 33 29
Amphibious — 1 — 323 20 86 76
Deliveries of commercial aircraft for the fiscal year ended December 31, 2016 increased compared to last year, mainly due to the EIS of the C Series family of aircraft in 2016.
For the three-year period ended December 31, 2016, we captured 29% of the market in the 60- to 100-seat category based on units delivered. This compares to a market share of 28% for the three-year period ended December 31, 2015.(1)
(1) Our estimates based on delivery data available from Ascend fleet database by Flightglobal.
Pivotal year for C Series order intakeNet orders
Fourth quarters ended December 31
Fiscal years ended December 31
(in units) 2016 2015 2016 2015Commercial jets
CS100 — — 75 —CS300 2 — 42 —
Regional jetsCRJ700 — — — 2CRJ900 — 18 19 25CRJ1000 — — — (2)
TurbopropsQ400 7 3 25 26
9 21 161 51

70 BOMBARDIER INC. FINANCIAL REPORT - FISCAL YEAR ENDED DECEMBER 31, 2016
The increase in orders in the year ended December 31, 2016 compared to last year is due to significant orders for the C Series family of aircraft in the second quarter of 2016.
The cancellations during the fiscal year ended December 31, 2016 is due to the August 2016 restructuring of the purchase agreement signed in 2013 with Moscow-based leasing company Ilyushin Finance Co. (IFC) to align with their current market needs. The firm order has been modified from 32 CS300 aircraft with options for an additional 10 CS300 aircraft to 20 CS300 aircraft and one Q400 turboprop with options for five additional Q400 aircraft.
The following significant orders were received during the fiscal year ended December 31, 2016:
Customer Firm order Value(1) Options(2)
Fourth quarterUnited Republic of Tanzania (Tanzania)(3) 2 CS300 & 1 Q400 $ 200 —Philippine Airlines, Inc. (Philippines) 5 Q400 $ 165 —
Second quarterDelta Air Lines, Inc. (U.S.) 75 CS100 $ 5,600 50 CS100Air Canada (Canada) 45 CS300 $ 3,800 30 CS300Air Baltic Corporation AS (Latvia) 7 CS300 $ 506 —Industrial Bank Financial Leasing Co., Ltd. (also known as CIB Leasing) (China) 10 CRJ900 $ 472 —WestJet Encore Ltd. (Canada) 9 Q400 $ 293 —Chorus Aviation Inc. (Canada) 5 CRJ900 $ 229 —
(1) Value of firm order based on list prices.(2) Not included in the order backlog.(3) The aircraft will be operated by Air Tanzania.
Subsequent to the end of the fiscal year, Cityjet signed a firm purchase agreement for 6 CRJ900 aircraft with options for an additional 4 aircraft. Based on list price, the firm order is valued at $280 million and could increase to $467 million if CityJet exercises all its options. This order is not included in the order backlog as at December 31, 2016.

BOMBARDIER INC. / 2016 FINANCIAL REPORT / COMMERCIAL AIRCRAFT 71
Order backlog and book-to-bill ratioCommercial aircraft order backlog and options
As at December 312016 2015
(in units) Firm orders Options Firm orders OptionsCommercial jets
CS100 118 (1) 99 53 (1) (2) 49CS300 235 (1) 133 190 (1) (2) 113
Regional jetsCRJ700 9 — 10 —CRJ900 26 18 44 24CRJ1000 17 — 25 9
TurbopropsQ400 31 12 39 77
436 262 361 272(1) The total of 353 orders includes 137 firm orders with conversion rights to the other C Series aircraft model as at December 31, 2016 (total of
243 orders includes 86 firm orders with conversion rights to the other C Series aircraft model as at December 31, 2015).(2) On June 15, 2015, we announced that launch operator SWISS has converted 10 of its 30 firm-ordered CS100 aircraft to the larger CS300
aircraft.
Book-to-bill ratio(1)
Fourth quarters ended December 31
Fiscal years ended December 31
2016 2015 2016 2015Net orders 9 21 161 51Deliveries 23 20 86 76
0.4 1.1 1.9 0.7(1) Ratio of net orders received over aircraft deliveries, in units.
The order backlog and the production horizon for programs are monitored to align production rates to reflect market demand.
Republic Airways Holdings Inc. (Republic) announced in February 2016 that it and certain of its subsidiaries have filed voluntary petitions to reorganize under Chapter 11 of the U.S. Bankruptcy Code. On October 20, 2016, Republic and Bombardier entered into an amendment, which provides for the deferral of the scheduled aircraft payments to Bombardier and the scheduled aircraft deliveries to Republic for the 40 CS300 aircraft under the original purchase agreement. The U.S. Bankruptcy Court for the Southern District of New York approved the amendment on December 8, 2016.

72 BOMBARDIER INC. FINANCIAL REPORT - FISCAL YEAR ENDED DECEMBER 31, 2016
Workforce
Total number of employeesAs at December 31
2016 2015Permanent(1) 4,800 4,500Contractual(2) 550 550
5,350 5,050Percentage of permanent employees covered by collective agreements 42% 38%
(1) Including inactive employees.(2) Including non-employees and agency outsourced personnel.
The workforce as at December 31, 2016 increased by 300 employees, or 6%, when compared to previous year.
The increase is mainly related to a higher workforce to support the production ramp-up of the C Series aircraft program.
However, the increase was partially offset by initial impacts of our October 2016 announcement to take further restructuring actions, including streamlining administrative and non-production functions across the organization, workforce optimization and site specialization, partially offset by strategic hiring to support ramp-up for the C Series aircraft program as well as our growth strategy in aftermarket business.
Our incentive-based compensation plan for non-unionized employees across Commercial Aircraft sites rewards the collective efforts of our employees in achieving our objectives using performance indicator targets. A total of 2,800 employees worldwide, or 58% of permanent employees, participate in the program. In 2016, as part of this program, incentive-based compensation was linked to the achievement of targeted results, based on EBIT before special items and free cash flow.
STRATEGIC PARTNERSHIP
Government of Québec’s investment in the C Series aircraft program On June 30, 2016, we closed the $1.0-billion investment by the Government of Québec (through Investissement Québec) in return for a 49.5% equity stake in a newly-created limited partnership, the C Series Aircraft Limited Partnership (CSALP), to which we have transferred the assets, liabilities and obligations of the C Series aircraft program. CSALP is owned 50.5% by Bombardier Inc. and, as a subsidiary of Bombardier, will carry on the operations related to our C Series aircraft program. CSALP continues to be consolidated in our financial results.
On June 30 and September 1, 2016, we received the investment in two installments of $500 million each. The proceeds of the investment are being used entirely for cash flow purposes of the C Series aircraft program. Under the terms of the limited partnership agreement, we have committed to invest additional capital contributions to CSALP up to a maximum amount of $1.0 billion in case of any liquidity shortfall in CSALP. Additional capital contributions by Bombardier would increase our ownership interest in CSALP.
Also on June 30 and September 1, 2016 we issued, in the name of Investissement Québec, warrants exercisable for a total number of 100,000,000 Class B Subordinate Voting Shares in the capital of Bombardier Inc., exercisable for a period of five years at an exercise price per share equal to $1.72 U.S. dollars, being the equivalent of $2.21 Canadian dollars using the exchange rate at the date of execution of the subscription agreement.
The investment contemplates a continuity undertaking providing that we maintain in the Province of Québec, for a period of 20 years, CSALP’s operational, financial and strategic headquarters, manufacturing and engineering activities, policies, practices and investment plans for research and development, in each case in respect of the

BOMBARDIER INC. / 2016 FINANCIAL REPORT / COMMERCIAL AIRCRAFT 73
design, manufacture and marketing of the CS100 and CS300 aircraft and after-sales services for these aircraft and that we will operate the facilities located in Mirabel, Canada for these purposes.
Subject to certain conditions, we have the right to repurchase Investissement Québec’s interest in CSALP at fair market value.
GUIDANCE AND FORWARD-LOOKING STATEMENTS
Latest guidance for 2016 What we did in 2016 What’s next for 2017(1)
Growth anddeliveries
Revenues of approximately $2.7 billion.
Between 85 to 90 deliveries.
Revenues of $2.6 billion.
86 deliveries.
Revenues of approximately $2.9 billion.
Between approximately 80 to 85deliveries.
Profitability(2) Negative EBIT before special items(2) of approximately $450 million, mainly due to the dilutive impact of the initial years of production of the C Series aircraft program.(3)
Negative EBIT before special items(2) of $417 million.
Negative EBIT before special items(2) of approximately $400 million, mainly due to the dilutive impact of the initial years of production of the C Series aircraft program.(3)
(1) See Forward-looking statements in boxed text below for details regarding the assumptions on which the guidance is based. Also see forward-looking statements disclaimer in Overview.
(2) Profitability guidance is based on EBIT before special items. Refer to the Non-GAAP financial measures section in Overview for a definition of this metric and to the Analysis of results section for a reconciliation to the most comparable IFRS measure for 2016.
(3) Early production units in a new aircraft program require higher costs than units produced later in the program and the selling prices of early units are generally lower.
Update on 2016 guidance
In September 2016, we revised the delivery forecast for the C Series aircraft program for 2016, from 15 to 7 aircraft, as a result of engine delivery delays by our supplier Pratt & Whitney. Mainly as a result of this delivery adjustment, we updated Commercial Aircraft delivery guidance for 2016 from approximately 95 deliveries to between 85 to 90 aircraft. Also our free cash flow usage target for the C Series aircraft program in 2016 was revised to approximately $1.15 billion and total 2016 Commercial Aircraft revenues were revised from approximately $3.0 billion to approximately $2.7 billion. We delivered 2016 revenues of $2.6 billion on 86 deliveries, in line with our revised 2016 guidance.
In November 2016, following the successful EIS of the C Series aircraft program, we increased 2016 Commercial Aircraft profitability guidance from negative EBIT before special items(1) of approximately $550 million to approximately $450 million, based on strong execution while ramping-up production and cost control during the initial months following EIS, supported by the reliability of the CS100 aircraft in service. For the full year, negative 2016 EBIT before special items(1) of $417 million exceeded our revised guidance as a result of continuing strong execution and cost control as the CS300 aircraft entered into service.(1) Profitability guidance is based on EBIT before special items. Refer to the Non-GAAP financial measures section in Overview for a definition
of this metric and to the Analysis of results section for a reconciliation to the most comparable IFRS measure for 2016.

74 BOMBARDIER INC. FINANCIAL REPORT - FISCAL YEAR ENDED DECEMBER 31, 2016
Our strategy to achieve 2017 guidance
2017 is expected to see acceleration in the production ramp-up of the C Series aircraft family, to between 30 and 35 planned deliveries, in line with our five-year plan. Our production approach for the CRJ Series family and Q400 aircraft will consist of rate adjustments to approximately 50 deliveries in 2017, reflecting our backlog.(1)
The profitability guidance for 2017 is negative EBIT before special items of approximately $400 million.(2) As production of the C Series aircraft program ramps up, we expect that the dilutive impact of the initial years of production of the aircraft program will be partially offset by the expected savings as we mature the production learning curve and leverage stronger operational performance driven by transformation initiatives.(1) (1) See Forward-looking statements in boxed text below for details regarding the assumptions on which the guidance is based. Also see
forward-looking statements disclaimer.(2) Profitability guidance is based on EBIT before special items. Refer to the Non-GAAP financial measures section in Overview for a definition
of this metric.
Forward-looking statements:Forward-looking statements(1) in this section of the MD&A are based on: • deliveries based on current firm order backlog and estimated future order intake;(2)
• ability to ramp-up production and deliveries and meet planned costs of the C Series aircraft program, including learning curve improvements;
• our ability to strengthen our market position and product value proposition for the CRJ Series and Q400 aircraft programs;
• the alignment of production rates to market demand;• the continued deployment and execution of key transformation initiatives, especially those impacting direct and indirect
procurement costs, labour efficiency and working capital improvement;• our ability to recruit and retain highly skilled resources;
• the ability of our supply base to support planned production rates;
• competitive global environment and global economic conditions to remain similar; and
• stability of foreign exchange rates.(1) Also see the Guidance and forward-looking statements section in Overview.(2) Demand forecast is based on the analysis of main market indicators, including real GDP growth, passenger traffic levels, fuel prices,
airline profitability, environmental regulations, aircraft shipments, replacement demand, installed base, aircraft utilization rates and average age of fleet. For more details, refer to the market indicators in the Industry and economic environment section.

BOMBARDIER INC. / 2016 FINANCIAL REPORT / AEROSTRUCTURES AND ENGINEERING SERVICES 75
AEROSTRUCTURES AND ENGINEERING SERVICESThe data presented in this MD&A contains both IFRS and non-GAAP measures. Non-GAAP measures are defined and reconciled to the most comparable IFRS measure. See the Non-GAAP financial measures section in Overview for further detail.
PAGEKEY PERFORMANCE MEASURES AND METRICS
Key performance measures and associated metrics that we use tomonitor our progress
HIGHLIGHTS OF THE YEAR Highlights of the fiscal year with regard to our results and key events
PROFILE Overview of our operations and products and services
INDUSTRY AND ECONOMIC ENVIRONMENT
Industry and economic factors affecting our business
ANALYSIS OF RESULTS Financial performance for the fourth quarter and fiscal year ended December 31, 2016External order intake, external order backlogOur workforce
GUIDANCE AND FORWARD-LOOKING STATEMENTS
What we said, what we did and what’s nextAssumptions and risks related to our forward-looking statements
KEY PERFORMANCE MEASURES AND METRICSThe table below summarizes our most relevant key performance measures and associated metrics.
KEY PERFORMANCE MEASURES AND ASSOCIATED METRICSGrowth and competitivepositioning
• Revenue, as a measure of growth. • Market share in terms of revenues, as a measure of our competitive positioning.
Profitability • EBIT, EBIT margin, EBIT before special items(1) and EBIT margin before special items(1), as measures of performance.
Liquidity • Free cash flow(1), as a measure of liquidity generation. Customer satisfaction • On-time delivery of aerostructures, as a measure of meeting our commitment to customers.Execution • Achievement of program development milestones, as a measure of flawless execution.
(1) Non-GAAP financial measures. Refer to the Non-GAAP financial measures section in Overview for definitions of these metrics.
75
76
77
78
79
82

76 BOMBARDIER INC. FINANCIAL REPORT - FISCAL YEAR ENDED DECEMBER 31, 2016
HIGHLIGHTS OF THE YEAR
Contributing to Bombardier’s improved operating performance
REVENUES EBIT MARGIN EBIT MARGIN BEFORE SPECIAL ITEMS(1)
$1.5 billion 8.3% 8.0%
RESULTSFor the fiscal years ended December 31 2016 2015 VarianceRevenues $ 1,549 $ 1,797 (14)%External order intake 392 474 (17)%External book-to-bill ratio(2) 0.9 0.9 —EBIT $ 128 $ 105 22 %EBIT margin 8.3% 5.8% 250 bpsEBIT before special items(1) $ 124 $ 104 19 %EBIT margin before special items(1) 8.0% 5.8% 220 bpsEBITDA before special items(1) $ 175 $ 154 14 %EBITDA margin before special items(1) 11.3% 8.6% 270 bpsNet additions to PP&E and intangible assets $ 20 $ 26 (23)%As at December 31 2016 2015External order backlog $ 42 $ 80 (48)%
(1) Non-GAAP financial measures. Refer to the Non-GAAP financial measures section in Overview for definitions of these metrics and the Analysis of results section for reconciliations to the most comparable IFRS measures.
(2) Ratio of new external orders over external revenues.
KEY HIGHLIGHTS AND EVENTS
• We have achieved revenue and profitability guidance for 2016. • In February 2016, we decided to optimize our workforce with a combination of manpower reductions and
strategic hiring. Approximately 80% of these 2,500 workforce reductions were achieved during fiscal year 2016. In October 2016, we announced further restructuring actions, including streamlining administrative and non-production functions across the organization, workforce optimization and site specialization, partially offset by strategic hiring to support ramp-up for the C Series aircraft program and Global 7000 and Global 8000 aircraft program.

BOMBARDIER INC. / 2016 FINANCIAL REPORT / AEROSTRUCTURES AND ENGINEERING SERVICES 77
PROFILE
World class capabilitiesSpecialized in aerostructures manufacturing and engineering services, Aerostructures and Engineering Services designs and builds aerostructures for Bombardier and other aircraft and aerostructure manufacturers. Aerostructures and Engineering Services is the largest aerostructures supplier for Bombardier’s sustaining programs as well as for the C Series and the Global 7000 and Global 8000 programs, providing structures such as cockpits, all-composite wings for the C Series aircraft program and the rear fuselage for the Global 7000 and Global 8000 aircraft program. Our key focus over the short to medium term remains to develop new technologies, deliver on-time and achieve cost savings to drive competitiveness of our current sustaining programs and programs under development.
Our people, capabilities and state-of-the-art technologies provide customers with products and services in the following areas:
• Design, manufacturing and aftermarket support for complex composite and metallic aerostructures, including:cockpit and fuselage components;horizontal stabilizers, vertical stabilizers and tailcones;complete composite wings, including wing sub-assemblies and components; andengine nacelles.
• Design, manufacturing and aftermarket support for associated aircraft systems including:electrical harnesses;tubing components; andhigh pressure ducting.
• Engineering solutions including:aircraft structures design and stress analysis; andground test services.
We are present on four continents including manufacturing and engineering sites in Montréal, Canada; Belfast, Northern Ireland; Querétaro, Mexico; and Casablanca, Morocco. In addition, there are service centres in Dallas, U.S. and in Belfast, Northern Ireland, which provide maintenance services for structures, including major modifications and repairs.

78 BOMBARDIER INC. FINANCIAL REPORT - FISCAL YEAR ENDED DECEMBER 31, 2016
INDUSTRY AND ECONOMIC ENVIRONMENTKey drivers of the aerostructures market are strongly linked to factors such as economic growth (GDP per capita), political stability, air passenger traffic and aircraft retirement rates. More specifically, this market is driven by the number of new products in development or upgrades to existing platforms as well as growth in production rates and backlogs in various aircraft sectors.
The following key indicators are used to monitor the health of the aerostructures and engineering services industry in the short term:
Indicator Current situation StatusNumber of new products indevelopment or upgrades toexisting platforms by originalequipment manufacturers
Development of new single-aisle products could be launched in the next decade while other new programs are expected to enter the market from China and Russia.(1) In the business aircraft market, several new programs are expected to enter into service by 2020.(2)
Original equipmentmanufacturer productionrates / units delivered
The order backlogs of commercial aircraft original equipment manufacturers in the industry remain at strong levels.(3) Bombardier is ramping-up its C Series aircraft program. Despite the fact that certain original equipment manufacturers decreased production rates on business aircraft programs, the market is expected to continue its stabilization.(4)
Identifies a favourable, neutral or negative status, respectively, in the market categories in which we compete, based on the current environment.
(1) Based on “Counterpoint Market Intelligence Limited (CPMIL) 2016 - The twelfth review of the Aerostructures Market” from Counterpoint.(2) Based on our “Business Aircraft Market Forecast”, published in May 2016 and available on Bombardier’s dedicated investor relations
website at ir.bombardier.com.(3) Based on “Morgan Stanley Research, Airlines+A&D Update” dated January 23, 2017.(4) Refer to the Industry and economic environment section in Business Aircraft for details.
Given that the industry’s revenues are generated from original equipment manufacturers in the aerospace market, it is subject to the same industry and economic drivers described in Business Aircraft and Commercial Aircraft. Refer to the Industry and economic environment sections of Business Aircraft and Commercial Aircraft for further discussion of the overall aerospace market which influences the aerostructures business.
The current status of some market drivers are expected to have a positive impact over the short-term for the aerostructures industry. The commercial aircraft market continues its strong performance as passenger traffic levels and airline financial performance maintained impressive levels in 2016. Meanwhile, we project the continued stabilization of the business jet market due to a better economic outlook combined with the introduction of new aircraft models and technologies, as supported by the markedly improved industry confidence to above the threshold of market stability,(1) increased U.S. corporate profits and a stable level of pre-owned aircraft inventory. Overall, we remain confident in the long-term potential for significant growth in the aircraft industry.
In 2016, a referendum took place whereby British citizens voted to exit the European Union, commonly known as “Brexit”, which could create uncertainty in the region.
The long-term outlook for Aerostructures and Engineering Services remains strong. Our relevant and accessible market for aerostructures and related aftermarket (including components repair and overhaul, spare parts and other engineering services) is currently estimated to be a $63-billion market worldwide, with forecast annual growth of 3.9% to 2026.(2) The market is predominantly composed of the manufacture of wings and fuselages, mostly for large commercial aircraft. (1) As measured by the UBS Business Jet Market index. See Industry and economic environment section in Business Aircraft for details.(2) Our relevant and accessible aerostructures market is the world market for civil aviation aerostructures and aftermarket services, excluding
the share of markets associated with contracts that are awarded to local players without open competition. Based on data from “Counterpoint Market Intelligence Limited (CPMIL) 2016 - The twelfth review of the Aerostructures Market” from Counterpoint and “ICF International - Aerostructures & Components MRO Market Overview, April 28, 2016”.

BOMBARDIER INC. / 2016 FINANCIAL REPORT / AEROSTRUCTURES AND ENGINEERING SERVICES 79
ANALYSIS OF RESULTS
Stronger operational performance
Results of operationsFourth quarters
ended December 31Fiscal years
ended December 312016 2015 2016 2015
RevenuesIntersegment revenues $ 215 $ 321 $ 1,119 $ 1,290External revenues 104 122 430 507
$ 319 $ 443 $ 1,549 $ 1,797EBITDA before special items(1) $ 42 $ 3 $ 175 $ 154Amortization(2) 12 12 51 50EBIT before special items(1) 30 (9) 124 104Special items 6 — (4) (1)EBIT $ 24 $ (9) $ 128 $ 105EBIT margin before special items(1) 9.4% (2.0)% 8.0% 5.8%EBIT margin 7.5% (2.0)% 8.3% 5.8%
(1) Non-GAAP financial measures. Refer to the Non-GAAP financial measures section in Overview for definitions of these metrics.(2) Amortization is included in cost of sales, SG&A and R&D expense based on the underlying function of the asset.
RevenuesThe $124-million decrease for the three-month period is due to:
• lower intersegment revenues ($106 million), mainly due to lower volume for business and commercial regional aircraft, due to rate adjustments; and
• lower external revenues ($18 million), mainly due to lower volume, partially offset by an increase in aftermarket sales.
The $248-million decrease for the fiscal year is due to: • lower intersegment revenues ($171 million), mainly due to lower volume for business aircraft related to
production rate decreases implemented in 2015, partially offset by higher volume for the C Series aircraft program related to the production ramp-up; and
• lower external revenues ($77 million), mainly due to lower volume, partially offset by an increase in aftermarket sales.
Special itemsSpecial items comprise items which do not reflect our core performance or where their separate presentation will assist users in understanding our results for the period, such as the impact of restructuring charges and significant impairment charges and reversals.
The special items for fiscal year 2016 represent:• a $43-million decrease in the pension obligation. Bombardier had a constructive obligation for
discretionary ad hoc indexation increases to certain pension plans. Following a communication to plan members that we do not expect to grant such increases in the foreseeable future in line with our current practice, the constructive obligation was reversed; and
• restructuring charges of $39 million related to the restructuring actions announced in February and October 2016, of which $6 million was recognized in the fourth quarter.
The special item in fiscal year 2015 related to an adjustment to a restructuring provision recorded in 2014.

80 BOMBARDIER INC. FINANCIAL REPORT - FISCAL YEAR ENDED DECEMBER 31, 2016
EBIT marginThe EBIT margin for the fourth quarter ended December 31, 2016 increased by 9.5 percentage points compared to the same period last fiscal year. The EBIT margin before special items (see explanation of special items above) for the fourth quarter increased by 11.4 percentage points, mainly as a result of the following items, which include timing elements:
• higher margins on intersegment commercial aircraft contracts, mainly due to the recognition of expected losses on early units of the C Series aircraft program, under long-term contract accounting recognized in 2015, partially offset by lower margins on regional aircraft;
• lower pension expense as a result of changes to a pension plan under a new collective agreement executed in 2015, which increased retirement benefit obligations in 2015; and
• higher margin on aftermarket sales.
The EBIT margin percentage for the fiscal year ended December 31, 2016 increased by 2.5 percentage points compared to last fiscal year. The EBIT margin before special items (see explanation of special items above) for the fiscal year increased by 2.2 percentage points, mainly as a result of:
• the recognition of lower expected losses on early units of the C Series aircraft program, under long-term contract accounting;
• higher margins on external contracts, mainly due to lower costs resulting from improved performance, as well as improved pricing;
• lower pension expense as a result of changes to a pension plan under a new collective agreement executed in 2015, which increased retirement benefit obligations in 2015; and
• higher margin on aftermarket sales.
Order backlog and book-to-bill ratioExternal order backlog
As atDecember 31, 2016 December 31, 2015
$ 42 $ 80
External order intake and book-to-bill ratioFourth quarters ended
December 31Fiscal years
ended December 312016 2015 2016 2015
External order intake $ 84 $ 103 $ 392 $ 474External book-to-bill ratio(1) 0.8 0.8 0.9 0.9
(1) Ratio of new external orders over external revenues.

BOMBARDIER INC. / 2016 FINANCIAL REPORT / AEROSTRUCTURES AND ENGINEERING SERVICES 81
WorkforceTotal number of employees
As atDecember 31, 2016 December 31, 2015
Permanent(1) 8,950 10,400Contractual(2) 1,050 1,700
10,000 12,100Percentage of permanent employees covered by collective agreements 70% 70%
(1) Including inactive employees.(2) Including non-employees and agency outsourced personnel.
The workforce as at December 31, 2016 decreased by 2,100 employees, or 17%, when compared to last year.
This reduction is mainly related to our decision, in February 2016, to take steps to optimize our workforce with a combination of manpower reduction and strategic hiring in line with our transformation plan. Aerostructures and Engineering Services planned to reduce its workforce by an estimated 2,500 production and non-production employees throughout 2016 and 2017.(1) Approximately 80% of these 2,500 workforce reductions were achieved during fiscal year 2016.
In October 2016, we announced further restructuring actions, including streamlining administrative and non-production functions across the organization, workforce optimization and site specialization, partially offset by strategic hiring to support ramp-up for the C Series aircraft program and Global 7000 and Global 8000 aircraft program as well as our growth strategy in aftermarket business.
Our incentive-based compensation plan for non-unionized employees across our sites rewards the collective efforts of our employees in achieving our objectives using performance indicator targets. A total of 3,400 employees worldwide, or 38% of permanent employees, participate in the program. In 2016, as part of this program, incentive-based compensation was linked to the achievement of targeted results, based on EBIT before special items and free cash flow.
Our agreement with Unite the Union and the General Machinists & Boilermakers in Belfast, Northern Ireland, expired in January 2016. We are currently in discussion with the union to renew the collective agreement.(1) Forward-looking statement. See the forward-looking statements disclaimer.

82 BOMBARDIER INC. FINANCIAL REPORT - FISCAL YEAR ENDED DECEMBER 31, 2016
GUIDANCE AND FORWARD-LOOKING STATEMENTS
Latest guidance for 2016 What we did in 2016 What’s next for 2017(1)
Growth Revenues of approximately$1.6 billion, mainly fromintersegment contracts withBusiness Aircraft and CommercialAircraft.
Revenues of $1.5 billion, of which$1.1 billion was from intersegmentcontracts.
Revenues of approximately$1.7 billion, mainly fromintersegment contracts withBusiness Aircraft and CommercialAircraft.
Profitability(2) EBIT margin before special items(2) of approximately 8.0%.
EBIT margin before special items(2) of 8.0%.
EBIT margin before special items(2) above 8.5%.
Update on 2016 guidance
In November 2016, we revised Aerostructures and Engineering Services’ revenue guidance for 2016 from approximately $1.8 billion to approximately $1.6 billion, mainly due to production alignment with our internal customers, Business Aircraft and Commercial Aircraft. Our 2016 revenue of $1.5 billion is in line with our revised guidance.
In addition, we increased our profitability guidance(2) for 2016 from approximately 7.5% to approximately 8.0%, mainly driven by transformation initiatives benefiting mostly the second half of 2016. Our 2016 EBIT before special items(2) of 8.0% is in line with our revised guidance.
Our strategy to achieve 2017 guidance
2017 revenues are expected to improve to approximately $1.7 billion driven by intersegment contracts with Business Aircraft and Commercial Aircraft, which includes the ramp-up of C Series aircraft program cockpit and wing production. 2017 is expected to see margin expansion to EBIT before special items(2) above 8.5% leveraging stronger operational performance driven by transformation initiatives.(1)
(1) See Forward-looking statements in boxed text below for details regarding the assumptions on which the guidance is based. Also see forward-looking statements disclaimer in Overview.
(2) Profitability guidance is based on EBIT margin before special items. Refer to the Non-GAAP financial measures section in Overview for a definition of this metric and to the Analysis of results section for a reconciliation to the most comparable IFRS measure for 2016.
Forward-looking statements:Forward-looking statements(1) in this section of the MD&A are based on:
• a higher level of production in fiscal year 2017 compared to fiscal year 2016;(2)
• ability to ramp-up production and deliveries and meet planned costs of the C Series aircraft program, including learning curve improvements;
• the continued deployment and execution of key transformation initiatives, especially those impacting direct and indirect procurement costs, labour efficiency and working capital improvement;
• the ability of our global manufacturing footprint to leverage lower cost geographies and emerging economies;
• our ability to meet scheduled EIS dates and planned costs for new aircraft programs;
• our ability to recruit and retain highly skilled resources;
• the ability of our supply base to support our planned production rates;
• competitive global environment and global economic conditions to remain similar; and
• stability of foreign exchange rates.(1) Also see the Guidance and forward-looking statements section in Overview.(2) Demand forecast is based on the main market indicators including number of new products in development or upgrades to existing
platforms by original equipment manufacturers and production rates. For details refer to the market indicators in the Industry and economic environment section.

BOMBARDIER INC. / 2016 FINANCIAL REPORT / TRANSPORTATION 83
TRANSPORTATIONThe data presented in this MD&A contains both IFRS and non-GAAP measures. Non-GAAP measures are defined and reconciled to the most comparable IFRS measure. See the Non-GAAP financial measures section in Overview for further detail.
PAGEKEY PERFORMANCE MEASURES AND METRICS
Key performance measures and associated metrics that we use tomonitor our progress
HIGHLIGHTS OF THE YEAR Highlights of the fiscal year with regard to our results and key events
PROFILE Overview of our operations and products and services
INDUSTRY AND ECONOMIC ENVIRONMENT
Industry and economic factors affecting our business
ANALYSIS OF RESULTS Financial performance for the fourth quarter and fiscal year ended December 31, 2016Orders, order backlog and workforce
SALE OF A MINORITY SHARE CDPQ’s $1.5-billion convertible share investment in our railtransportation business
GUIDANCE AND FORWARD-LOOKING STATEMENTS
What we said, what we did and what’s next Assumptions and risks related to our forward-looking statements
KEY PERFORMANCE MEASURES AND METRICSThe table below summarizes our most relevant key performance measures and associated metrics.
KEY PERFORMANCE MEASURES AND ASSOCIATED METRICSGrowth and competitive positioning
• Order backlog, as a measure of future revenues.• Book-to-bill ratio(1), as an indicator of future revenues. • Revenues by product segments and the geographic diversification of revenues, as measures of growth
and sustainability of competitive positioning.• Market position, as a measure of our competitive positioning.
Profitability • EBIT, EBIT margin, EBIT before special items(2) and EBIT margin before special items(2), as measures of performance.
Liquidity • Free cash flow(2), as a measure of liquidity generation.
Customersatisfaction
• Various customer satisfaction metrics, focusing on the four main dimensions: sales and prices, customer orientation, project execution and product offering.
Execution • Achievement of product development and delivery milestones, as a measure of flawless execution.
(1) Defined as new orders over revenues.(2) Non-GAAP financial measure. Refer to the Non-GAAP financial measures section in Overview for definitions of these metrics and to the
Analysis of results section for reconciliations to the most comparable IFRS measures in 2016 and 2015.
83
84
85
89
92
97
98

84 BOMBARDIER INC. FINANCIAL REPORT - FISCAL YEAR ENDED DECEMBER 31, 2016
HIGHLIGHTS OF THE YEAR
Transformation supporting margin growth and strong order intake
REVENUES EBIT MARGINEBIT MARGIN
BEFORE SPECIAL ITEMS(1)
ORDER INTAKE ORDER BACKLOG
$7.6 billion 5.2% 7.4% $8.5 billion $30.1 billion
RESULTSFor the fiscal years ended December 31 2016 2015 VarianceRevenues $ 7,574 $ 8,281 (9)%Order intake (in billions of dollars) $ 8.5 $ 8.8 (3)%Book-to-bill ratio(2) 1.1 1.1 —EBIT $ 396 $ 465 (15)%EBIT margin 5.2% 5.6% (40) bpsEBIT before special items(1) $ 560 $ 465 20 %EBIT margin before special items(1) 7.4% 5.6% 180 bpsEBITDA before special items(1) $ 657 $ 564 16 %EBITDA margin before special items(1) 8.7% 6.8% 190 bpsNet additions to PP&E and intangible assets $ 116 $ 155 (25)%As at December 31 2016 2015Order backlog (in billions of dollars) $ 30.1 $ 30.4 (1)%
(1) Non-GAAP financial measures. Refer to the Non-GAAP financial measures section in Overview for definitions of these metrics and to the Analysis of results section for reconciliations to the most comparable IFRS measures.
(2) Defined as new orders over revenues.
KEY HIGHLIGHTS AND EVENTS
• Our operational transformation is gaining traction. During 2016, the EBIT margin before special items(1) of 7.4% exceeded our profitability guidance. Our 2016 revenues of $7.6 billion are lower than guidance, which is mainly attributed to our active project management resulting in the continued deferral of certain revenue under long-term contract accounting.
• Strong order intake of $8.5 billion across all product segments and geographic regions, leading to a book-to-bill ratio of 1.1 for the fiscal year and bringing the backlog to $30.1 billion at year end:• In September 2016, we signed contracts with Angel Trains and Abellio Greater Anglia in the U.K. to
supply 665 AVENTRA vehicles and maintenance services for Abellio’s East Anglia rail franchise. The contracts are valued at a total of $1.2 billion;
• In November and December 2016, SNCF in France exercised options for 40 OMNEO Premium double deck Electrical Multiple Units (EMUs) and 52 additional Francilien EMUs for a total value of $990 million;
• In December 2016, we signed a framework agreement with Austrian Federal Railways (ÖBB), Austria, for the delivery of up to 300 TALENT 3 EMUs, valued at up to $1.9 billion based on list price, under which ÖBB holds several call-offs for trainsets to be used for regional and suburban rail transport. The first call-off order under the framework contract for 21 TALENT 3 EMUs was also signed in December and is valued at $156 million based on list price.
• On February 11, 2016, we closed the sale to the CDPQ of a $1.5-billion equity investment in convertible shares representing a 30% stake in Bombardier Transportation (Investment) UK Limited (BT Holdco), which following the completion of a corporate reorganization, owns essentially all of the assets and liabilities of Bombardier’s Transportation business segment. BT Holdco continues to be controlled by Bombardier Inc. and consolidated in its results.
(1) Non-GAAP financial measures. Refer to the Non-GAAP financial measures section in Overview for definitions of these metrics and to the Analysis of results section for reconciliations to the most comparable IFRS measures.

BOMBARDIER INC. / 2016 FINANCIAL REPORT / TRANSPORTATION 85
KEY HIGHLIGHTS AND EVENTS (CONTINUED)
• Continually driving new state-of-the-art mobility solutions:• In September 2016, we launched our TALENT 3 trains and introduced our MOVIA Maxx platform concept
and OPTIFLO signalling system at InnoTrans, the world’s largest fair for transport technology, held in Berlin, Germany.
• In December 2016, Kuala Lumpur’s new INNOVIA Metro 300 system started passenger service. The new driverless trains are equipped with Linear Induction Motor propulsion technology allowing for operation on tighter curves, with less noise and greatly reduced wheel and track wear.
• During fiscal year 2016, the workforce reductions of approximately 3,200 employees in Transportation announced in February 2016 were achieved, and we recognized restructuring charges of $159 million in special items. In October 2016, as we continue our transformation plan, we announced further restructuring actions, including streamlining our administrative and non-production functions across the organization and leveraging our worldwide footprint to create centres of excellence for design, engineering and manufacturing activities. The impact of these restructuring actions on overall employment will be partially offset by strategic hiring to support major rail contract wins as well as our growth strategy in aftermarket business.
PROFILE
The broadest and most innovative portfolio in the industry serving customers worldwide
Transportation offers a portfolio of efficient products and services in the rail industry, covering the full spectrum of rail solutions, ranging from complete trains to sub-systems, services, system integration and signalling. Based on this suite of innovative technologies, we have won orders across all product segments and major geographies, underlining the competitiveness of our products and services worldwide.
We have production and engineering sites and service centres around the world. The global headquarters is located in Berlin, Germany.
MARKET SEGMENT: ROLLING STOCK
INTERCITY, HIGH-SPEED TRAINS, AND VERY HIGH-SPEED TRAINSApplication: Equipment for medium and long-distance operations.Major products: REGINA, TWINDEXX Express and ZEFIRO familyKey features: Solutions offering very high operating flexibility, high comfort and safety standards for the passengers in combination with high efficiency, covering the full spectrum of speed requirements: intercity (160-200 km/h), high-speed (200-250 km/h) and very high-speed (250-380 km/h).
ZEFIRO very high speed train

86 BOMBARDIER INC. FINANCIAL REPORT - FISCAL YEAR ENDED DECEMBER 31, 2016
COMMUTER AND REGIONAL TRAINSApplication: Suburban and regional rail transit for urban centres and surrounding regions.Major products: AVENTRA, OMNEO, SPACIUM, TALENT 2, TALENT 3, TWINDEXX Vario, ELECTROSTARKey features: Broad product line featuring electric, diesel and dual mode multiple unit trains/vehicles, along with locomotive-hauled coaches in both single- and double-deck configurations. Our modular train platforms offer very high flexibility to transit authorities and operators, as well as high levels of comfort and capacity.
LIGHT RAIL VEHICLESApplication: Efficient surface transit in urban centres and surrounding suburban conurbations.Major products: FLEXITY family (FLEXITY 2, ELF, Freedom, High / Low Floor and Tram-Train)Key features: Our broad portfolio of FLEXITY vehicles feature high technical capabilities and performance coupled with low life-cycle costs. Based on adaptable modular platforms our vehicle range offers a full spectrum of smart innovative light rail solutions to enhance the connectivity and identity of cities worldwide.
METROSApplication: High-capacity mobility for urban mass transit.
AVENTRA Electric Multiple Unit
FLEXITY tram
Major products: MOVIA and INNOVIA platforms Key features: Flexible modular product platform adaptable to the requirements of customers across diverse markets, with a track record for rapid, reliable, cost and energy efficient operation, including driverless solutions. In January 2017, we won a GOOD DESIGNTM award for the design of our Swedish MOVIA Metro C30 project for the city of Stockholm.
ELECTRIC AND DIESEL LOCOMOTIVESApplication: Locomotives for intercity, regional and freight rail service.Major products: TRAXX platform, ALP electric and dual-power locomotivesKey features: Versatile product platform offering electric, diesel-electric, dual-power and multi-system propulsion, last-mile diesel or battery drive features. Innovative solutions increase power and reliability in combination with high energy efficiency. Homologated in several countries in Europe, enabling cross-border service.
PROPULSION AND CONTROLSApplication: Complete propulsion and control product portfolio for all rail vehicles and e-mobility applications,
TRAXX dual power locomotive
delivering electric power to the wheels and the rest of the vehicles with strong reliability, power efficiency and high safety.Major products: Products of the MITRAC platform, including traction and auxiliary converters for underframe, rooftop and machine room mounting; drives (motors and gears), train control management systems (TCMS), high voltage equipment and complete system solutions. Innovative train to wayside communication solutions round off the portfolio.Key features: A leader in reliability, modular design, high safety (SIL 2 compliance), energy efficiency, integration of new technologies and ease of maintenance, which keep initial investments and life cycle costs low.

BOMBARDIER INC. / 2016 FINANCIAL REPORT / TRANSPORTATION 87
BOGIES Application: Complete spectrum of bogies which match the entire range of Bombardier vehicles as well as third-party rail vehicles around the globe.Major products: FLEXX bogies portfolio including latest technologies: FLEXX Eco, FLEXX Urban, FLEXX Speed, FLEXX Power and the award-winning WAKO TechnologyKey features: Advanced product technology and complete aftermarket services covering the full spectrum of rolling stock applications. Our track-friendly bogies are designed to ensure safe and smooth operation and reduce wheel and rail wear, minimizing operational costs and noise.
MARKET SEGMENT: SERVICES
MATERIAL SOLUTIONSApplication: Supply chain, spare parts inventory management, obsolescence management and technical support services for rail operators.Key features: Advanced material supply solutions together with global engineering and purchasing power through global network of parts and components suppliers. Logistics capability to source and deliver what is needed, when needed, where needed.
FLEET MANAGEMENT Application: Comprehensive portfolio of fleet and operations management services.Key features: Robust and effective ‘back office’ solutions support rail operators in delivering their ‘front line’ service every day. Engineering expertise, whole life maintenance techniques and tools optimize availability, reliability, punctuality, safety and cost over the whole life cycle of the fleet.
ASSET LIFE MANAGEMENT, COMPONENT RE-ENGINEERING AND OVERHAULApplication: Upgrade, life extension and overhaul of rail vehicles and components.Key features: Broad portfolio of system and component upgrades executed at our specialized facilities and customer sites. We leverage our engineering and supply chain strength to bring operational performance and whole life cost advantages.
MARKET SEGMENT: SYSTEM AND SIGNALLING
MASS TRANSIT AND AIRPORT SYSTEMSApplication: Fully Automated People Mover (APM), metro, monorail and light rail systems.Major products: INNOVIA APM 300 system, INNOVIA Monorail 300 system, INNOVIA Metro 300 system, FLEXITY 2 tram system Key features: Broad rolling stock portfolio for urban and airport applications that can be customized to provide a complete turnkey system solution. Strong track record for reliability and availability across 60 complete systems around the world.
INNOVIA Monorail 300 systemMAINLINE SYSTEMS Application: System solutions for intercity and high-speed applications covering medium- to long-distance operations.Key features: Turnkey approach to provide reliable rail systems for mainline applications featuring very high passenger comfort and safety standards. Highly experienced in systems integration and engineering.

88 BOMBARDIER INC. FINANCIAL REPORT - FISCAL YEAR ENDED DECEMBER 31, 2016
OPERATIONS AND MAINTENANCE OF SYSTEMSApplication: Operations and maintenance (O&M) services for fully automated transit and mass transit systems.Key features: Strong O&M experience in automated, driverless technologies, including APM, metro and monorail systems, as well as fleet management solutions for urban and intercity transportation systems.
MASS TRANSIT SIGNALLINGApplication: Rail control and signalling solutions for mass transit systems such as metros, light rail or APMs.Major products: CITYFLO solutionKey features: Complete portfolio of solutions ranging from manual applications (GoA 0) to fully automated Communication-Based Train Control (GoA 4), which helps to increase infrastructure capacity and can be installed without interruption to service.
MAINLINE SIGNALLING Application: Rail control and signalling solutions for mainline railways ranging from freight traffic to regional and commuter, intercity and very high speed lines.Major products: INTERFLO and EBI Cab Automatic Train Control onboard equipmentKey features: Complete portfolio ranging from conventional signalling systems to communication based solutions using the European Rail Traffic Management System technology, operating in several countries inside and outside of Europe.
INTERFLO mainline signaling
INDUSTRIAL SIGNALLING Application: Rail control and signalling solutions for the industrial sector, major applications in the surface and sub-surface mining and industrial freight industries.Major products: INTERFLO 150 solutionKey features: Innovative signalling system technologies used to increase transport capacity in a secure and cost effective manner. Our technology covers the whole process, enhancing not only the underground operation, but also the transfer of ore from the excavation site to the transportation hub.
OPTIFLO - SERVICE SOLUTIONS FOR SIGNALLINGApplication: Comprehensive portfolio of services for mass transit, mainline and industrial sector rail infrastructure and signalling solutions.Key features: Infrastructure management, technical support, cyber security assessment and other service solutions tailored to ensure the highest levels of availability and reliability as well as cost effective maintenance of rail control and signalling solutions.

BOMBARDIER INC. / 2016 FINANCIAL REPORT / TRANSPORTATION 89
INDUSTRY AND ECONOMIC ENVIRONMENT
Good prospects for the rail industry and urban mobility solutions worldwide
The future outlook for the rail market remains positive supported by favourable long-term trends in the rail industry. Urbanization, population growth, and government policies aimed at reducing greenhouse gas emissions are expected to continue to positively impact demand for public transportation.
The following key indicators are used to monitor the health of the rail market:
Indicator Current situation StatusPopulationgrowth andmassurbanization
The worldwide population is expected to increase from approximately 7.3 to 9.7 billion by 2050, together with the share of people living in urban areas growing from 54% to 66% in the same time period.(1) Population growth and urbanization create an increasing demand for high capacity public transport solutions especially in congested cities and areas.
Environmental awareness
Governments increasingly commit to long-term climate and energy goals. Measures to reach these goals include investments in eco-friendly transport solutions such as rail transport. Rail is responsible for 3.5% of the transport energy-related CO2 emissions compared to 73.5% for road transportation.(2)
Public funding Most of the rolling stock business is conducted with rail operators backed by the public sector. Rail infrastructure investments are expected to grow, as governments and multilateral institutions continue to fund projects in the rail industry to support and foster economic development. However public indebtedness and austerity measures may impede public tender processes for some new rail projects.
Liberalization Liberalization attracts more private operators to enter the market and invest in new rail equipment and services. The European Commission supports the liberalization of domestic passenger rail services within the European Union.
Digitalization The world is entering into the fourth industrial revolution broadly called the “digital industryrevolution“. Rail has already introduced this fourth revolution technology and is projected tocontinue to develop digitalized mobility solutions in order to help operators improve trainpunctuality and reliability and passenger experience. While better serving our customers,digitalization of our manufacturing tools and processes will change our way of working,reducing complexity, development costs and ensuring faster time-to-market.
Identifies a favourable, neutral or negative status, respectively, in the market categories in which we compete, based on our view of the current environment.(1) According to the United Nations: “World Urbanization Prospects: The 2014 Revision” and “World Population Prospects: The 2015 Revision”.(2) According to the International Union of Railways: “Railway Handbook 2016. Energy Consumption & CO2 Emissions”.
The Association of the European Rail Industry (UNIFE) confirmed its positive outlook for the global rail industry in its World Rail Market Study published in September 2016. The study expects the overall accessible rail market(1) to grow with a CAGR of 3.2% over the next five years, compared to a CAGR of 2.7% in the previous survey from 2014. Transportation’s relevant and accessible market(1) is expected to grow even faster with a CAGR of 3.4% over the next 5 years, compared to a CAGR of 2.5% in the previous survey.(2)
The positive future market outlook is mainly based on mature rail markets such as Western Europe and North America, which are consistently investing in the modernization and replacement of their rolling stock fleets. Furthermore, investments to upgrade and modernize signalling systems will further drive established rail markets such as Western Europe. (1) The overall accessible rail market is the world rail market, excluding the share of markets associated with contracts that are awarded to
local players without open-bid competition. Transportation’s relevant and accessible market also excludes the infrastructure, freight wagon and shunter segments.
(2) Based on data from UNIFE World Rail Market Study “Forecast 2016 to 2021” published in September 2016, based on 60 countries representing more than 95% of the world rail market. As large rail projects may significantly impact yearly volume, single year market volumes can be subject to a high degree of volatility. UNIFE therefore focuses on three-year average annual market volumes in order to facilitate comparison between different periods. UNIFE data is updated every two years and is published in euro. An exchange rate of 1€ = $1.1826, the average cumulative exchange rate over the 2014-16 period, was used to convert all figures. Figures for 2014-16 were extrapolated based on UNIFE data for 2013-15 and 2016-18.

90 BOMBARDIER INC. FINANCIAL REPORT - FISCAL YEAR ENDED DECEMBER 31, 2016
The accessible rail control market is also expected to pursue high relative growth in Eastern Europe, Asia-Pacific and the CIS. Supported by a growing rolling stock installed base and gradual liberalization, the services market is expected to grow. Particularly in mature markets, smaller private rail operators emerge and often outsource their maintenance requirements while larger incumbents tend to further outsource their services needs which, to date, were mostly performed in-house.
From a legislation point of view, in 2016, a referendum took place whereby British citizens voted to exit the European Union, commonly known as “Brexit”, which could create uncertainty in the region. Other initiatives however, such as the Fourth Railway Package of the European Union Commission and other regulations regarding the implementation of Positive Train Control in the U.S. will further support the rail industry to continue to improve the degree of liberalization and safety of rail transportation.
Source: UNIFE World Rail Market Study “Forecast 2016 to 2021” and extrapolated figures.
EuropeIn 2016, the order volume remained stable in Europe, reaching levels similar to 2015. Significant orders for commuter and regional trains were placed in the U.K., Germany, France and Italy, including sizeable service agreements. In addition, a large high-speed train contract was awarded in the Netherlands. In Eastern Europe investments were carried on in the commuter and regional trains segment in Poland and Hungary and metro projects were awarded in Turkey and Bulgaria.
The outlook for Europe in the coming years remains positive. Large orders are expected to be tendered in the high-speed train and metro segments, and many mid-sized orders are expected in Germany, the U.K. and France in the commuter and regional train and light rail vehicle (LRV) segments. In Eastern Europe, the LRV and commuter and regional trains segments are expected to drive the market volume.
Source: UNIFE World Rail Market Study “Forecast 2016 to 2021” and extrapolated figures.
*Transportation’s relevant and accessible rail market is the world rail market, excluding the share of markets associated with contracts that are awarded to local players without open-bid competition, and excluding the infrastructure, freight wagon and shunter segments.

BOMBARDIER INC. / 2016 FINANCIAL REPORT / TRANSPORTATION 91
North AmericaThe North American market indicated a strong increase compared to the preceding year. Urban mobility solutions played a major role with orders awarded in Baltimore, U.S., in the LRV segment along with a long term services contract, and in Chicago and Boston, U.S. in the metro segment. A large high-speed train order was also tendered in the U.S. In the second half of 2016, in Canada and the U.S. several mid-sized operation and maintenance agreements were awarded in the commuter and regional trains segment.
In the coming years LRV is expected to remain the biggest segment in terms of volume in North America, as local authorities have started to modernize and upgrade their fleets in order to meet increased demand and address traffic congestion. Several noteworthy opportunities are predicted in the metro and automated people mover segments, such as the potential tender for operation and maintenance of a new metro in Montreal, Canada. Over the next couple of years in Mexico, local authorities are expected to invest in new urban solutions and to upgrade current metro and LRV fleets.
Source: UNIFE World Rail Market Study “Forecast 2016 to 2021” and extrapolated figures.
Asia-PacificIn Asia-Pacific, the order volume declined compared to last year, due to large orders awarded in China and India for very high-speed trains and locomotives in 2015. In 2016, major projects were signed in Australia and Thailand, including operation and maintenance contracts, in the commuter and regional train segment. In addition, significant metro orders were awarded in the Philippines, India and China. In Taiwan and South Korea sizable rolling stock and service contracts were awarded for automated metro systems, underlying the interest of operators to shift towards more digitalized mobility solutions.
China is forecast to resume its investment in the very high-speed train segment. Further investment is also expected in the monorail segment both in Thailand and China. While in India and Australia we expect opportunities in the commuter and regional train segment.
Source: UNIFE World Rail Market Study “Forecast 2016 to 2021” and extrapolated figures.
*Transportation’s relevant and accessible rail market is the world rail market, excluding the share of markets associated with contracts that are awarded to local players without open-bid competition, and excluding the infrastructure, freight wagon and shunter segments.

92 BOMBARDIER INC. FINANCIAL REPORT - FISCAL YEAR ENDED DECEMBER 31, 2016
Rest of world(1)
In the Rest of the world region, the level of activity decreased compared to the previous year due to a large service contract related to regional trains awarded in Russia, as well as in Doha, Qatar, for a metro system, in 2015. Furthermore, the locomotives segment continued to be volatile, with less tenders issued over the course of 2016.
Urban transit solutions are expected to drive activity in coming years, with substantial orders in the metro segment in Peru, Russia and Egypt on the horizon. Moreover, opportunities are also expected in the commuter and regional trains and locomotives segments. (1) The Rest of world region includes South America, Central America,
Africa, the Middle East and the CIS.
Source: UNIFE World Rail Market Study “Forecast 2016 to 2021” and extrapolated figures.
ANALYSIS OF RESULTS
We have significantly improved our profitabilityResults of operations
Fourth quarters ended December 31
Fiscal years ended December 31
2016 2015 2016 2015RevenuesExternal revenues $ 1,946 $ 2,162 $ 7,567 $ 8,275Intersegment revenues 2 2 7 6
$ 1,948 $ 2,164 $ 7,574 $ 8,281EBITDA before special items(1) $ 205 $ 150 $ 657 $ 564Amortization 24 27 97 99EBIT before special items(1) 181 123 560 465Special items 20 — 164 —EBIT $ 161 $ 123 $ 396 $ 465EBIT margin before special items(1) 9.3% 5.7% 7.4% 5.6%EBIT margin 8.3% 5.7% 5.2% 5.6%
(1) Non-GAAP financial measures. Refer to Non-GAAP financial measures sections in Overview for definitions of these metrics.

BOMBARDIER INC. / 2016 FINANCIAL REPORT / TRANSPORTATION 93
External revenues by geographic regionFourth quarters ended December 31 Fiscal years ended December 31
2016 2015 2016 2015Europe(1) $ 1,298 67% $ 1,476 68% $ 4,946 65% $ 5,345 64%North America 302 15% 294 14% 1,228 16% 1,297 16%Asia-Pacific(1) 233 12% 285 13% 936 13% 1,047 13%Rest of world(1)(2) 113 6% 107 5% 457 6% 586 7%
$ 1,946 100% $ 2,162 100% $ 7,567 100% $ 8,275 100%(1) The decreases in Europe reflect negative currency impacts of $73 million for the fourth quarter and $160 million for the fiscal year ended
December 31, 2016, while the decreases in Asia-Pacific and Rest of world region in the fiscal year reflect negative currency impacts of $22 million and $40 million, respectively.
(2) The Rest of world region includes South America, Central America, Africa, the Middle East and the CIS.
RevenuesTotal external revenues for the fourth quarter and fiscal year ended December 31, 2016, have decreased by $216 million and $708 million, respectively, compared to the same periods last fiscal year. Excluding negative currency impacts of $78 million and $222 million, respectively, revenues have decreased by $138 million, or 6%, and $486 million, or 6%, in the fourth quarter and fiscal year ended respectively, compared to the same periods last fiscal year.
The $138-million decrease excluding currency impact for the fourth quarter is mainly explained by: • lower activities in rolling stock in Europe and Asia-Pacific following completion of some metro contracts in
both regions, some commuter and regional train and light rail vehicle contracts in Europe and some propulsion contracts in Asia-Pacific, partly compensated by ramp-up in production related to some intercity train contracts in Europe ($128 million); and
• lower activities in signalling in Europe and in systems in Asia-Pacific, mainly due to contracts nearing completion ($68 million).
Partially offset by:• higher activities in systems in the Rest of world region and in signalling in Asia-Pacific ($35 million).
The $486-million decrease excluding currency impact for the fiscal year is mainly explained by: • lower activities in systems and in signalling in the Rest of world region, Asia-Pacific and Europe, and in
systems in North America, mainly due to contracts nearing completion ($304 million); and• lower activities in rolling stock in Europe and North America following completion of some metro and
locomotive contracts in both regions, some light rail vehicle contracts in Europe and some commuter and regional train contracts in North America, as well as active project management and stronger cash discipline, including overall optimization of our supply chain, which delayed recognition of revenue under long-term contract accounting, partly compensated by ramp-up in production related to some intercity train contracts in Europe ($270 million).
Partially offset by:• higher activities in rolling stock in the Rest of world region and Asia-Pacific mainly due to ramp-up in
production related to commuter and regional train contracts in both regions and some locomotive contracts in the Rest of world region ($91 million).
Special itemsSpecial items comprise items which do not reflect our core performance or where their separate presentation will assist users in understanding our results for the period, such as the impact of restructuring charges and significant impairment charges and reversals.
The special items for 2016 represent:• restructuring charges of $159 million related to the restructuring actions announced in 2016, of which
$20 million were recorded in the fourth quarter representing severance provisions of $10 million and impairment of PP&E of $10 million; and
• a foreign exchange loss of $5 million related to the reorganization of Transportation under one holding entity necessary to facilitate the placement of a minority stake in Transportation recorded in the first quarter.

94 BOMBARDIER INC. FINANCIAL REPORT - FISCAL YEAR ENDED DECEMBER 31, 2016
EBIT margin The EBIT margin for the fourth quarter increased by 2.6 percentage points compared to the same period last year. The EBIT margin before special items (see explanation of special items above) for the quarter increased by 3.6 percentage points, mainly as a result of:
• higher margin in systems, services and signalling; • favourable impact from sales mix on margin due to increased services revenues; and• lower R&D and SG&A expenses.Partially offset by: • lower margin in rolling stock; and • lower share of income from joint ventures and associates.
The EBIT margin for the fiscal year decreased by 0.4 percentage points compared to last year. The EBIT margin before special items (see explanations of special items above) for the year increased by 1.8 percentage points mainly as a result of:
• higher margin in signalling and services; and • lower R&D expenses. Partially offset by: • lower margin in systems.
Significant orders in all segments worldwide resulting in book-to-bill of 1.1Order backlog
As atDecember 31, 2016 December 31, 2015
(in billions of dollars) $ 30.1 $ 30.4
In 2016, we achieved higher order intake than revenues ($0.9 billion), which was offset by the weakening of some foreign currencies versus the U.S. dollar as at December 31, 2016, compared to December 31, 2015 ($1.2 billion), mainly the pound sterling and the euro, resulting in an overall decrease in the order backlog.
Order intake and book-to-bill ratioFourth quarters
ended December 31Fiscal years
ended December 312016 2015 2016 2015
Order intake (in billions of dollars) $ 2.3 $ 3.4 $ 8.5 $ 8.8Book-to-bill ratio(1) 1.2 1.6 1.1 1.1
(1) Ratio of new orders over revenues.
ORDER INTAKE BY REGION(for fiscal years; in billions of dollars)
ORDER INTAKE AND BOOK-TO-BILL RATIO (for fiscal years)

BOMBARDIER INC. / 2016 FINANCIAL REPORT / TRANSPORTATION 95
Excluding negative currency impacts, the order intake for the fourth quarter and fiscal year decreased by $1.1 billion and $74 million, respectively, compared to the same periods last fiscal year. The order intake for the fourth quarter and fiscal year ended December 31, 2016 reflect negative currency impacts of $57 million and $295 million, respectively. Nevertheless, the new orders are mainly based on existing platforms and include a higher share of services, signalling and systems contracts, further improving the overall backlog quality.
In 2016, we won several orders across various regions and product segments, including several significant orders in Europe, and maintained a leading position(1) in our relevant and accessible rail market(2) with a cumulative order intake of $29.9 billion over the past three years. (1) Based on a rolling 36-month order intake with latest data published by companies publishing order intake for at least 36 months.(2) Our relevant and accessible rail market is the world rail market, excluding the share of markets associated with contracts that are awarded
to local players without open-bid competition, and excluding the infrastructure, freight wagon and shunter segments.
The significant orders obtained during the fiscal year ended December 31, 2016 were as follows:
Customer Country Product or serviceNumber of cars
Marketsegment Value
Fourth quarterSociété Nationale des Chemins de
fer Français (SNCF)France OMNEO Electrical Multiple
Units (EMUs)400 Rolling stock $ 620
SNCF France Francilien EMUs 364 Rolling stock $ 370
Agence Métropolitaine deTransport (AMT)
Canada 8 years of operations and fleet maintenance (O&M) services
n/a Services $ 246
Austrian Federal Railways (ÖBB) Austria TALENT 3 EMUs 126 Rolling stock $ 156(1)
Göteborgs Spårvägar Sweden FLEXITY trams 40 Rolling stock $ 109(2)
Third quarterAngel Trains Ltd U.K. AVENTRA EMUs 665 Rolling stock $ 1,100
Metrolinx Canada BiLevel commuter rail cars 125 Rolling stock $ 328
Arriva CrossCountry Trains (XC) U.K. Fleet maintenance services n/a Services $ 302
Abellio Greater Anglia U.K. Fleet maintenance services n/a Services $ 108
Second quarterLandesnahverkehrsgesellschaft
Niedersachsen mbH (LNVG)Germany Fleet maintenance services n/a Services $ 393
Abellio Rail Südwest GmbH Germany TALENT 2 EMUs 167 Rolling stock $ 244
Akiem S.A. France TRAXX locomotives 26 Rolling stock $ 107(1)
First quarterCity of Edmonton Canada FLEXITY trams, signalling and
related depot equipment; O&M services(3)
n/a Rolling stock,Services,System andsignalling
$ 280(2)
Israel Railways (ISR) Israel TWINDEXX Vario double-deck coaches
60 Rolling stock $ 120
(1) Based on list price.(2) Contract signed as part of a consortium. Only our share of the value is stated. (3) Operations and maintenance of the light rail transit system performed together with other consortium partners over a 30-year period.n/a: Not applicable

96 BOMBARDIER INC. FINANCIAL REPORT - FISCAL YEAR ENDED DECEMBER 31, 2016
The firm order with ÖBB for 21 TALENT 3 EMUs is part of a framework agreement signed in December 2016 for the delivery of up to 300 TALENT 3 EMUs, valued at up to $1.9 billion based on list price. Under this framework agreement ÖBB holds several call-offs for trainsets to be used for regional and suburban rail transport.
Subsequent to the end of the fiscal year, in January 2017, we received an official notice from SNCF, France, to supply, in consortium with Alstom, 71 new trains for the RER lines D and E of the Île-de-France (greater Paris) network. The order, which is not included in our order backlog as at December 31, 2016, is valued at $1.22 billion for the Alstom-Bombardier consortium with our share of the contract valued at $395 million. This first order is part of a framework contract also signed in January. Syndicat des transports d’Île-de-France (STIF) has dedicated an estimated $3.97 billion in financing for up to 255 trains (130 for the RER line D and 125 for the RER line E), their largest financing to date.
WorkforceTotal number of employees
As atDecember 31, 2016 December 31, 2015
Permanent(1) 33,050 34,650Contractual 4,100 4,750
37,150 39,400
Percentage of permanent employees covered by collective agreements 65% 65%(1) Including inactive employees.
In February 2016, we decided to take steps to optimize our workforce with a combination of manpower reduction and strategic hiring in line with our transformation plan. The workforce reductions of approximately 3,200 of Transportation’s production and non-production employees have been achieved during fiscal year 2016. These measures mainly impacted the permanent and contractual workforce in Europe and the contractual workforce in North America. During 2016, these workforce reductions were partially offset by hiring in certain growth areas, notably to support the ramp-up of strategic programs and projects worldwide, resulting in an increased contractual workforce in Asia-Pacific. The reduction of permanent headcount in the Rest of world region is mainly due to timing of work on orders received.
WORKFORCE BY GEOGRAPHIC REGION(as at)
In October 2016, we announced further restructuring actions as we continue to execute our five-year transformation plan. These actions support our efforts to build our earnings growth potential and highlight our focus on improving productivity, reducing costs and optimizing our worldwide footprint to deliver increased value to customers and shareholders. Specific actions to be taken include streamlining our administrative and non-production functions across the organization and leveraging our worldwide footprint to create centres of excellence for design, engineering and manufacturing activities. The impact of these restructuring actions on overall employment will be partially offset by strategic hiring to support major rail contract wins as well as our growth strategy in aftermarket business.
Our incentive-based employee compensation rewards the collective efforts of our employees in achieving our objectives, using performance indicator targets. A total of 2,550 employees worldwide, or 8% of permanent employees, participate in the program. In 2016, as part of this program, incentive-based compensation was linked to the achievement of targeted results, based on EBIT before special items and free cash flow.

BOMBARDIER INC. / 2016 FINANCIAL REPORT / TRANSPORTATION 97
SALE OF A MINORITY SHARE
Sale of a 30% stake in Bombardier Transportation to the CDPQ for $1.5 billion
On February 11, 2016, we closed the sale to the CDPQ of a $1.5-billion convertible share investment in Bombardier Transportation’s newly-created holding company, Bombardier Transportation (Investment) UK Limited (BT Holdco). Under the terms of the investment, Bombardier Inc. sold voting shares convertible into a 30% common equity stake of BT Holdco to the CDPQ, subject to annual adjustments related to performance.
Following the completion of the previously-announced corporate reorganization, BT Holdco owns essentially all of the assets and liabilities of Bombardier’s Transportation business segment, its operational headquarters remains in Germany and it continues to be consolidated in Bombardier’s financial results.
Key terms of the investment The CDPQ is entitled to its pro-rata portion (on an as-converted basis, initially equal to 30% of BT Holdco common shares) of any dividends declared.
Dividends are payable in cash or, subject to certain conditions, in additional convertible shares at the option of BT Holdco (any such issuance to increase the CDPQ’s participation).
Performance incentives The terms of the transaction provide strong performance incentives for Transportation. For each of the first five years following the closing date, the CDPQ’s ownership (on conversion) and return may be subject to upward or downward annual adjustments, based on performance targets jointly agreed to as part of Transportation’s business plan.
If Transportation outperforms its business plan, the CDPQ’s percentage of ownership on conversion of its shares decreases by 2.5% annually, down to a minimum threshold of 25%. In this circumstance, the convertible shares’ minimum return also decreases from 9.5% to a floor of 7.5%.
Conversely, should Transportation underperform relative to its plan, the CDPQ’s percentage of ownership on conversion of its shares will increase by 2.5% annually, up to a maximum of 42.5% over a five-year period. In this case, the convertible shares’ minimum return also increases from 9.5% up to 12%.
As at December 31, 2016, the CDPQ’s percentage of ownership on conversion of its shares would be 30% since Transportation has met its performance target for fiscal year 2016. As a result, the CDPQ’s minimum return for 2017 will be 9.5%.
Shareholders rights and exit Under the terms of the investment, the CDPQ has standard minority protection rights, including: pre-emptive rights, a right of first offer, and tag-along rights, and Bombardier has a right of first offer and customary drag-along rights, in each case subject to certain conditions.
Bombardier has the ability to buy back the CDPQ’s investment upon specified terms at any time on or after the third anniversary of the closing of the investment, at the higher of the fair market value (on an as-converted basis) or a minimum of 15% compounded annual return to the CDPQ.
At any time on or after February 11, 2021, and provided that Bombardier has not exercised its right to buy back the CDPQ’s investment before then, the CDPQ will have the right to cause BT Holdco to proceed with a secondary initial public offering (IPO) or a sale of 100% of its shares.
In the case of an IPO, the conversion ratio of the CDPQ’s shares will be adjusted so that, immediately prior to the IPO, the CDPQ receives shares having a value equal to the higher of: (i) the value of its shares, on an as-converted basis, based on the implied value of the IPO; or (ii) the minimum return adjusted for any distributions, in

98 BOMBARDIER INC. FINANCIAL REPORT - FISCAL YEAR ENDED DECEMBER 31, 2016
both cases taking into account changes, if any, resulting from the effect of the performance incentives. The CDPQ’s shares would be sold in priority to Bombardier’s shares as part of the secondary IPO.
In the case of a sale of 100% of the BT Holdco shares, the CDPQ will have the right to receive an amount equal to the higher of: (i) the value of its shares, on an as-converted basis, based on the implied value of the sale to a third party; or (ii) the minimum return adjusted for any distributions, in both cases taking into account changes, if any, resulting from the effect of the performance incentives.
Upon a change of control of Bombardier Inc. or, in certain circumstances, of BT Holdco, the CDPQ will have the right to require an IPO or a sale of 100% of the BT Holdco shares and to receive the higher of: (i) the value of the common shares held by the CDPQ on an as-converted basis, based on the implied value of the IPO or sale to a third party, as discussed above; or (ii) a minimum three-year 15% compounded annual return (or at any time after three years, a 15% compounded annual return).
Other details of the transaction The parties have agreed to a consolidated Bombardier cash position at the end of each quarter of at least $1.25 billion. This requirement was met as at the end of each quarter of 2016. In the event Bombardier’s cash position falls below that level, the Board of directors of Bombardier will create a Special Initiatives Committee composed of three independent directors acceptable to the CDPQ, who would be responsible to develop an action plan to improve cash. The implementation of the plan, once agreed with the CDPQ, would be overseen by the Special Initiatives Committee.
Warrants The investment included the issuance by Bombardier to the CDPQ of warrants exercisable for a total number of 105,851,872 Class B shares (subordinate voting) in the capital of Bombardier Inc. (Class B Subordinate Voting Shares). The warrants are exercisable until February 11, 2023 at an exercise price per Class B Subordinate Voting Share equal to $1.66, the U.S. dollar equivalent of $2.21 CDN at the date of execution of the subscription agreement.
GUIDANCE AND FORWARD-LOOKING STATEMENTS
Latest guidance for 2016 What we did in 2016 What’s next for 2017(1)
Growth Revenues of approximately$8.0 billion, based on thecurrent foreign exchange ratesin 2016.
Revenues of $7.6 billion. Revenues of approximately $8.5 billion,based on the assumption that foreignexchange rates will remain stable in2017 compared to 2016.
Profitability(2) EBIT margin before special items(2) above 6.5%.
EBIT margin before special items(2) of 7.4%.
EBIT margin before special items(2) of approximately 7.5%.
Update on 2016 guidance
In November 2016, we revised Transportation’s revenue guidance for 2016 from approximately $8.5 billion based on stable foreign exchange rates in 2016 compared to 2015, to approximately $8.0 billion based on foreign exchange rates at that time. The revision was mainly due to active project management as we apply stronger cash discipline and de-risk project execution, and also encompassed changes in exchange rates during 2016. This in turn is deferring recognition of certain costs and associated recognition of revenue under long-term contract accounting. Our 2016 revenues of $7.6 billion are lower than our revised guidance and are mainly attributed to continued deferral of certain revenue under long-term contract accounting. (1) See forward-looking statements in boxed text below for details regarding the assumptions on which the guidance is based. Also see
forward-looking statements disclaimer in Overview.(2) Profitability guidance is based on EBIT margin before special items. Refer to the Non-GAAP financial measures section in Overview for a
definition of this metric and to the Analysis of results section for a reconciliation to the most comparable IFRS measure for 2016.
BOMBARDIER INC. / 2016 FINANCIAL REPORT / TRANSPORTATION 99
Also in November 2016, we indicated Transportation was in line to exceed original profitability guidance(1) of above 6%, mainly driven by transformation initiatives and stronger contract execution. We increased profitability guidance(1) for 2016 to above 6.5%. 2016 EBIT margin before special items(1) of 7.4% has exceeded the revised guidance mainly driven by good progress on transformation initiatives and stronger contract execution, particularly in our Chinese joint ventures. (1) Profitability guidance is based on EBIT margin before special items. Refer to the Non-GAAP financial measures section in Overview for a
definition of this metric and to the Analysis of results section for a reconciliation to the most comparable IFRS measure for 2016.
Our strategy to achieve 2017 guidance
2017 planned revenues of approximately $8.5 billion is attributed to strong 2016 order intake of $8.5 billion and book-to-bill ratio of 1.1, leading to a backlog of $30.1 billion. New orders are mainly based on existing platforms and include a higher share of services, signalling and systems contracts, further improving the overall backlog quality and reducing pressure on critical resources. EBIT before special items of approximately 7.5% planned in 2017 is driven by the benefits of transformation initiatives, partially offset by increased investment in structural transformation to create engineering and manufacturing centres of excellence, as well as higher investments in standardized product and service platforms. As we are moving forward with the transformation of our company, our future profitability growth remains based on three pillars: revenue conversion and mix, a systematic products and services offering, and continuation of operational transformation.
Forward-looking statementsForward-looking statements(1) in this section of the MD&A are based on:• normal contract execution of current order backlog and the continued deployment and execution of key transformation
initiatives, especially those impacting direct and indirect procurement costs, labour efficiency and working capital improvement;
• the realization of upcoming tenders and our ability to capture them; • our ability to transfer best practices and technology across production;• our ability to execute and deliver business model enhancement initiatives;• our ability to recruit and retain highly skilled resources to deploy our product development and project execution strategy; • revenue conversion and phase out of our legacy contracts;• a sustained level of public sector spending;• the ability of our supply base to support the execution of projects; • competitive global environment and global economic conditions to remain similar; and • stability of foreign exchange rates.(1) Also see the Guidance and forward-looking statements section in Overview.

100 BOMBARDIER INC. FINANCIAL REPORT - FISCAL YEAR ENDED DECEMBER 31, 2016
OTHERPAGE
OFF-BALANCE SHEET ARRANGEMENTS
RISKS AND UNCERTAINTIES
ACCOUNTING AND REPORTING DEVELOPMENTS
FINANCIAL INSTRUMENTS
RELATED PARTY TRANSACTIONS
CRITICAL JUDGMENTS AND ACCOUNTING ESTIMATES
CONTROLS AND PROCEDURES
FOREIGN EXCHANGE RATES
SHAREHOLDER INFORMATION
SELECTED FINANCIAL INFORMATION
QUARTERLY DATA (UNAUDITED)
HISTORICAL FINANCIAL SUMMARY
OFF-BALANCE SHEET ARRANGEMENTSFactoring facilities
In the normal course of its business, Transportation has set up factoring facilities under which it can sell, without credit recourse, qualifying trade receivables. For more details, refer to Note 16 - Trade and other receivables, to the consolidated financial statements.
Credit and residual value guarantees
In connection with the sale of certain of our products, mainly commercial aircraft, we have provided financing support in the form of credit and residual value guarantees to enhance the ability of certain customers to arrange third-party financing for their acquisitions.
Credit guarantees provide support through contractually limited payments to the guaranteed party to mitigate default-related losses. Credit guarantees are triggered if customers do not perform during the term of the financing under the relevant financing arrangements. The remaining terms of these financing arrangements range from 1 to 10 years. In the event of default, we usually act as an agent for the guaranteed parties for the repossession, refurbishment and re-marketing of the underlying assets. We typically receive a fee for these services.
Residual value guarantees provide protection to the guaranteed parties in cases where the market value of the underlying asset falls below the guaranteed value at an agreed-upon date. In most cases, these guarantees are provided as part of a customer financing arrangement (these arrangements have remaining terms ranging from 1 to 11 years). The value of the underlying asset may be adversely affected by a number of factors. To mitigate the exposure, the financing arrangements generally require the aircraft used as collateral to meet certain contractual return conditions in order to exercise the guarantee. If a residual value guarantee is exercised, it
100
101
115
117
118
118
124
125
126
127
128
129

BOMBARDIER INC. / 2016 FINANCIAL REPORT / OTHER 101
provides for a contractually limited payment to the guaranteed parties, which is typically a specified maximum amount of the first losses incurred by the guaranteed party. A claim under the guarantee may typically be made only at the end of the financing arrangement, upon the sale of the underlying asset to a third party.
When credit and residual value guarantees are provided in connection with a financing arrangement for the same underlying asset, residual value guarantees can only be exercised if the credit guarantee expires without having been exercised and, as such, the guarantees are mutually exclusive.
For more details, refer to Note 38 – Commitments and contingencies, to the consolidated financial statements.
Financing commitments
We sometimes provide financing support to facilitate our customers’ access to capital. This support may take a variety of forms, including providing assistance to customers in accessing and structuring debt and equity for aircraft acquisitions or providing assurance that debt and equity are available to finance such acquisitions.
As at December 31, 2016, we had no commitments to arrange financing for customers in relation to the future sale of aircraft.
Financing structures related to the sale of commercial aircraft
In connection with the sale of commercial aircraft, we have provided credit and/or residual value guarantees and subordinated debt to, and retained residual interests in, certain entities created solely to provide financing related to the sale of commercial aircraft. Commercial Aircraft also provides administrative services to certain of these entities in return for a market fee.
Typically, these entities are financed by third-party long-term debt and equity. Often, equity investors benefit from tax incentives. The aircraft serve as collateral for the entities’ long-term debt.
For more details, refer to Note 37 – Unconsolidated structured entities, to the consolidated financial statements.
RISKS AND UNCERTAINTIESWe operate in industry segments which present a variety of risk factors and uncertainties. The risks and uncertainties described below are those that we currently believe could materially affect our business activities, financial condition, cash flows and results of operations, but are not necessarily the only risks and uncertainties that we face. If any of these risks, or any additional risks and uncertainties presently unknown to us or that we currently consider as being not material, actually occur or become material risks, our business activities, financial condition, cash flows and results of operations could be materially adversely affected.
General economicrisk
General economic risk is the risk of potential loss due to unfavourable economic conditions. These factors include, but are not limited to, government budget compression, reduced levels of public and private capital expenditures, declining business confidence, political and economic pressures, including those arising from increasing government deficits and sovereign debt overruns, and crises in the credit markets.
Businessenvironment risk
Business environment risk is the risk of potential loss due to external risk factors. These factors may include the financial condition of the airline industry (including scope clauses in pilot union agreements restricting the operation of smaller jetliners by major airlines or by their regional affiliates) and business aircraft customers, the financial condition of the rail industry, trade policy, as well as increased competition from other businesses including new entrants in market segments in which we compete. In addition, political instability and force majeure events such as acts of terrorism, natural disasters, global health risks, or the outbreak of war or continued hostilities in certain regions of the world could result in lower orders or the rescheduling or cancellation of part of the existing order backlog for some of our products.

102 BOMBARDIER INC. FINANCIAL REPORT - FISCAL YEAR ENDED DECEMBER 31, 2016
Operational risk Operational risk is the risk of potential loss due to the nature of our operations. Sources of operational risk include development of new products and services, development of new business and the complexity of obtaining certification and homologation of products and services. In addition, the large and complex projects that are characteristic of our businesses are often structured as fixed-price contracts and thus exposed to production and project execution risks. Furthermore, our cash flows are subject to pressures based on project-cycle fluctuations and seasonality and our businesses are capital intensive, which require that we regularly incur significant capital expenditures and investment over multi-year periods prior to realizing cash flows under a project. Other sources of operational risk include our ability to successfully implement our strategy and transformation plan, actions of business partners, product performance warranty and casualty claim losses, the use of estimates and judgments in accounting, regulatory and legal conditions, environmental, health and safety issues, as well as dependence on customers, suppliers (including supply chain management) and human resources. We are also subject to risks related to problems with reliance on information systems, reliance on and protection of intellectual property rights and adequacy of insurance coverage.
Financing risk Financing risk is the risk of potential loss due to the liquidity of our financial assets includingcounterparty credit risk, access to capital markets, restrictive debt covenants, financing supportprovided for the benefit of certain customers and government support.
Market risk Market risk is the risk of potential loss due to adverse movements in market factors including foreigncurrency fluctuations, changing interest rates, decreases in residual values of assets, increases incommodity prices and inflation rate fluctuations.
General economic riskThe markets in which we operate may from time to time be affected by a number of local, regional and global factors. Since our sales and operations are undertaken around the world, including through manufacturing and production capacity in Europe and in North America, and partnerships and joint ventures in regions such as Asia and Africa, we may be directly or indirectly affected by an unfavourable political or economic slowdown occurring within these geographic zones and our business may be exposed to a number of related risks, such as fluctuations in exchange rates and restrictions on the transfer of capital.
Should the current uncertain global economic situation persist over time or deteriorate, should the economic headwinds in certain countries, regions or key markets intensify or spread to other countries, or should the global economic environment deteriorate, this could, in particular, result in potential buyers postponing the purchase of our products or services, lower order intake, order cancellations or deferral of deliveries, lower availability of customer financing, an increase in our involvement in customer financing, downward pressure on selling prices, increased inventory levels, decreased level of customer advances, slower collection of receivables, reduction in production activities, paused or discontinued production of certain products, termination of employees or adverse impacts on suppliers.
Brexit
On June 23, 2016, a referendum took place whereby British citizens voted to exit the European Union, commonly known as “Brexit”. Bombardier could be impacted by Brexit in both our aerospace and rail businesses. In 2016, 45% of our revenues were generated in Europe, of which 18% was generated in the U.K.
Brexit could result in increased geopolitical and economic risks and could cause disruptions to and create uncertainty surrounding our businesses, including affecting our relationships with existing and future customers, suppliers and employees, which could in turn have an adverse effect on our financial results and operations. There could also be greater restrictions on imports and exports between the U.K. and European Union countries and could also result in increased regulatory complexities.
The announcement of Brexit caused significant currency exchange fluctuations. The U.S. dollar strengthened against other currencies, particularly the pound sterling and the euro. Our revenues are denominated mainly in U.S. dollars for aircraft sales and mainly in euro and other currencies for our rail business. The strengthening of the U.S. dollar relative to these other currencies could adversely affect our results of operations, particularly in the rail business, where a potential devaluation of the local currency or of the euro relative to the U.S. dollar coupled with potential increased inflation risk, may expose us to losses and could impair our customers’ purchasing power.

BOMBARDIER INC. / 2016 FINANCIAL REPORT / OTHER 103
Business environment risk
Financial condition of the airline industry and business aircraft customers
The airline industry’s financial condition and viability, including airlines’ ability to secure financing, can influence the demand for our commercial aircraft. The nature of the airline industry makes it difficult to predict when economic downturns or recoveries will impact the industry, and economic cycles may be longer than expected. Continued cost pressures and efforts to achieve acceptable profitability in the airline industry may constrain the selling price of our aerospace products. Scope clauses in pilot union agreements in the U.S. restrict the operation of smaller jetliners by major airlines or by their regional affiliates and, therefore, may restrict demand in the regional aircraft market.
The purchase of aerospace products and services may represent a significant investment for a corporation, an individual or a government. When economic or business conditions are unfavourable, potential buyers may delay the purchase of our aerospace products and services. The availability of financing is also an important factor and credit scarcity can cause customers to either defer deliveries or cancel orders.
An increased supply of used aircraft as companies restructure, downsize or discontinue operations could also add downward pressure on the selling price of new and used business and commercial aircraft. We could then be faced with the challenge of finding ways to further reduce costs and improve productivity to sustain a favourable market position at acceptable profit margins. The loss of any major commercial airline or fractional ownership or charter operator as a customer or the termination of a contract could significantly impact our financial results.
Financial condition of the rail industry
The rail industry has historically been resilient during economic downturns. Challenging economic and financial conditions in specific areas, however, may have a negative impact on some rail operators. As customers deal with budget pressures and discipline and even austerity measures, it may result in projects being reduced in size, postponed or even cancelled. Such actions by public or private rail operators may negatively impact our order intake and revenues and put significant pressure on our cost structure and prices. These conditions may be exacerbated in times of declining investment activity.
A significant proportion of our rail business in any given period relies on government agencies and other public institutions, which have historically represented the vast majority of the value of the orders that we book annually. The amount public institutions are able to invest and spend depends on complex political and economic factors and could vary from one fiscal year to the next. Economic slowdown and public budgetary restrictions can cause a decrease in infrastructure investments, delays in placing orders and delays in executing contracts or payments, as well as a decrease in fiscal and other incentive-based measures to promote research and development. In periods of over-indebtedness (or of a sovereign debt crisis), the implementation of austerity or public spending reduction programs can lead to a negative impact on the volume of orders placed for transportation infrastructure projects.
In addition, intense competition in the rail industry and demands by customers in the current economic environment have resulted in certain adverse impacts, including the lower level and later receipt of advance payments. This evolution of contract terms may adversely impact our cash flows and may require us to obtain and deploy increased amounts of capital from other sources, including factoring facilities, which may adversely affect our return on equity, financial condition and results of operations. In addition, there can be no assurance that if such customer payment and advances terms continue to evolve in a manner adverse to the manufacturers we will be able to access sufficient replacement working capital to finance the execution of projects on acceptable terms or at all.

104 BOMBARDIER INC. FINANCIAL REPORT - FISCAL YEAR ENDED DECEMBER 31, 2016
Trade policy
As a globally operating organization, our businesses are subject to government policies related to import and export restrictions and business acquisitions, support for export sales, and world trade policies including specific regional trade practices. As a result, we are exposed to risks associated with changing priorities by government and supranational agencies.
In addition, protectionist trade policies and changes in the political and regulatory environment in the markets in which we operate, such as foreign exchange import and export controls, tariffs and other trade barriers and price or exchange controls, could affect our business in several national markets, impact our sales and profitability and make the repatriation of profits difficult, and may expose us to penalties, sanctions and reputational damage.
Increased competition from other businesses including new entrants in market segments in which we compete
In the aerospace market segments in which we compete, competitors are developing numerous aircraft programs, with entries-into-service expected throughout the next decade. We face the risk that market share may be eroded if potential customers opt for competitors’ products. We may also be negatively impacted if we are not able to meet product support expectations or provide an international presence for our diverse customer base.
In the rail market, we face intense competition in the markets and geographies in which we operate. We face competition from strong competitors, some of which are larger and may have greater resources in a given business or region, as well as competitors from emerging markets and new entrants, which may have a better cost structure. Some rail transportation market segments in which we operate, and some of the significant market participants in our businesses, are undergoing consolidation. Such consolidation may increase pressure on prices and profit margins, as well as on payment terms and conditions, manufacturing timeframes and the technologies proposed and services provided to clients, which could weaken our position in certain markets. Furthermore, certain competitors might be more effective and faster in capturing available market opportunities, which in turn may negatively impact our results, revenues and market share.
Political instability
Political instability, which may result from various factors, including social or economic factors, in certain regions of the world may be prolonged and unpredictable. Any prolonged political instability in markets in which we participate could lead to delays or cancellation of orders, deliveries or projects in which we have invested significant resources, particularly when the customers are state-owned or state-controlled entities.
Geopolitical and economic risks, international sanctions and the recent decreases in the price of oil affecting many energy-exporting nations have raised new concerns in international economies. Beyond any immediate impact, these developments may also negatively affect the evolution of the global economy.
In addition, geopolitical events in the geographic areas in which we operate can increase difficulties relative to the conditions under which the contracts we have signed are executed, extend execution periods or trigger unexpected legislative or regulatory changes that could significantly increase the costs of execution initially projected for these contracts and which could have a material adverse effect on our business, financial condition, cash flows and results of operations.
Force majeure events or natural disasters
Force majeure events and natural disasters (including seismic and severe weather-related events such as ice storms, hurricanes, flooding, tornadoes or other calamities) are unpredictable and may have significant adverse results such as: personal injury or fatality; damage to or destruction of ongoing projects, facilities or equipment; environmental damage; delays or cancellations of orders and deliveries; delays in the receipt of materials from our suppliers; delays in projects; or legal liability.

BOMBARDIER INC. / 2016 FINANCIAL REPORT / OTHER 105
Operational risk
Developing new products and services
Changes resulting from global trends such as climate change, volatile fuel prices, the growth of developing markets, urbanization, population growth and demographic factors influence customer demands in our main aerospace and rail transportation markets. To remain competitive and meet customers’ needs, we are required to anticipate these changes and must continuously develop and design new products, improve existing products and services and invest in and develop new technologies. Introducing new products or technologies requires a significant commitment to R&D investment, including maintaining a significant level of highly skilled employees. Furthermore, our investments in new products or technologies may or may not be successful.
Our results may be impacted if we invest in products that are not accepted in the marketplace, if customer demand or preferences change, if new products are not approved by regulatory authorities (or if we fail to designor obtain homologation or accreditation for new products or technologies), are not brought to market in a timely manner, in particular, as compared to our competitors, or if our products become obsolete. We may incur cost overruns in developing new products and there is the risk that our products will not meet performance specifications to which we have committed to customers.
Our results could also be negatively impacted if we fail to design or obtain accreditation for new technologies and platforms on budget and in a timely manner. Further, our long-term growth, competitiveness and continued profitability are dependent on our ability to anticipate and adapt to changes in markets and to reduce the costs of producing high-quality, new and existing products, to continue to develop our product mix and to align our global presence with worldwide market opportunities.
In a highly competitive environment, we are and will remain exposed to the risk that more innovative or more competitive products, services or technologies are developed by competitors or introduced on the market more quickly or that the products we develop are not accepted by the market.
Business development
Our businesses are dependent on obtaining new orders and customers, thus continuously replenishing our order backlog. Our results may be negatively impacted if we are unable to effectively execute strategies to gain access to new markets, capture growth or successfully establish roots in new markets. Our book-to-bill ratio, which we define as new orders over revenues or units delivered, is an indicator that we use to track potential future revenues. However, the realization of revenues from new orders is based on certain assumptions, including the assumption that our relevant contracts will be performed in full in accordance with their terms. The termination or modification of any one or more major contracts may have a material and adverse effect on future revenues. We cannot guarantee that we will realize all of the revenues initially anticipated in our new orders, and any such shortfall may be significant.
Although we have developed and continue to develop our presence in many geographic markets, access to certain markets can prove to be difficult to secure, particularly if there is a local competitor benefiting from a stronghold in its home market. These types of situations could put us in an unfavourable position relative to some of our competitors and present challenges to our strategy and competitive strength in those zones.
Certification and homologation process
We are subject to stringent certification and approval requirements, as well as to the ability of regulatory bodies to perform these assessments on a timely basis, which vary by country and can delay the certification of our products. Non-compliance with current or future regulatory requirements imposed by Transport Canada (TC), the U.S. Federal Aviation Administration (FAA), the European Aviation Safety Agency (EASA), the Transport Safety Institute in the U.S. or other regulatory authorities could result in service interruption of our products, fewer sales or slower deliveries, an unplanned build-up of inventories, reduction in inventory values or impairment of assets.

106 BOMBARDIER INC. FINANCIAL REPORT - FISCAL YEAR ENDED DECEMBER 31, 2016
The marketing and EIS of our rail products require compliance with rail transportation security standards that differ widely at the global level and are governed by various relevant regulatory authorities. This creates a complex process for securing the homologation of trains. The process for securing the homologation of trains is highly involved and may take longer and be more costly than initially anticipated due to the extent of testing and other supporting technical elements required by the relevant authorities, which elements may change over time. Our contracts increasingly include language that requires us to bear the risks and obligations associated with the homologation process, including risks relating to changes in law or regulation or the interpretation or application of regulations in respect of homologation.
Delays caused by the homologation process, or increased engineering or production costs relating to homologation, may lead to delays in our ability to deliver our products and complete our contracts, as well as contract cost overruns relative to our estimates and models and the payment of significant penalties or damages, service interruptions affecting the products, or even the risk of cancellation of all or a portion of the contract in extreme cases of prolonged delays. There can be no assurance regarding the time frame required for obtaining certification or homologation.
Fixed-price and fixed-term commitments and production and project execution
We have historically offered, and expect to continue to offer, a significant portion of our products through pre-agreed fixed-price contracts with a stipulated delivery schedule, rather than contracts under which payment is determined solely on a time-and-material basis. Generally, we cannot terminate contracts unilaterally.
We are exposed to risks associated with these fixed-price contracts, including unexpected technological problems, difficulties with partners, subcontractors and suppliers, logistical difficulties and other execution issues that could lead to cost overruns, late delivery penalties or delays in receiving milestone payments. We may also incur late delivery penalties if we are unable to increase production rates sufficiently quickly to meet our commitments. In addition, due to the nature of the bidding process, long-term contract revenues are based, in part, on cost estimates. Our estimates of the costs for completing a project are subject to a number of assumptions, including future economic conditions, cost and availability of labour and raw materials, labour productivity, employment levels and salaries, facility utilization rates, inflation rates, foreign exchange rates and construction and technical standards to be applied to the project, and are influenced by the nature and complexity of the work to be performed. Due to the complexity and the length of many of the projects in which we participate, the actual investment, costs and productivity may differ materially from what we had initially modelled or anticipated. In addition, many of our contracts contain requirements to comply with mandatory performance levels for the equipment we deliver or a fixed delivery schedule. If we are unable to comply with these obligations, our clients could request the payment of contractual penalties, or terminate the contract in question, or even claim compensation.
The revenue, cash flow and profitability of large, complex, long-term projects vary significantly in accordance with the progress of the project and depend on a variety of factors, some of which are beyond our control, such as specification modifications and change orders demanded by the customer, increasing regulatory requirements in relation to homologation, unexpected technological problems, logistical difficulties and other execution issues that could lead to engineering cost and time overruns, production cost overruns, late delivery penalties and liquidated damages payments and postponement or delays in contract execution. In the context of large, complex, long-term contracts, such overruns and issues can be material in terms of cost and time, may lead to withholding of payment by customers or risk of cancellation of all or a portion of contract by the customer, and may have a material adverse impact on our business, results, cash flows, financial position and reputation. In addition, we may incur late delivery penalties in the event of an inability to increase production rates quickly enough to meet commitments under such large contracts. The profit margins generated by some of these contracts can, as a result, prove to be lower than those initially projected, or even be zero-margin or loss contracts.
In addition, many of our long-term contracts are signed with customers that are governmental or quasi-public entities. These types of customers require that we comply with project bidding and open market specifications, which may limit our ability to negotiate certain contractual terms and conditions and can force us to accept less favourable conditions. For example, customers may require manufacturers to bear an increasing proportion of the homologation regulatory risk, may insist on payment schedules that reduce or eliminate advance payments or that lead to negative cash-flow during the execution of a project, and may require mandatory technical performance

BOMBARDIER INC. / 2016 FINANCIAL REPORT / OTHER 107
levels and requirements associated with the issuance of parent company guarantees and bonds. For the most part, our rail transportation business is subject to public procurement protocols, which often take the form of adherence contracts that cannot be amended in any meaningful sense, causing bidders to risk disqualification if they attempt to reflect contingencies or special considerations in their offers. Moreover, public procurement protocols often feature specifications that are subject to numerous change orders, which may result in disputes regarding allocation of costs in respect of such change orders or specification modifications. These particularities could potentially expose our business to significant additional risks or costs that could adversely affect the profitability of our projects.
Additionally, for certain projects, contracts in our rail transportation business impose manufacturing or purchasing requirements in the countries in which the project is being executed. Such contracts may require us to build local production capacities, partner with local entities, and/or secure third-party purchases from local suppliers. Such terms and conditions can lead to pressures on costs, target volumes and execution.
Cash flows and capital expenditures
Our businesses are cyclical and highly capital intensive due to their nature. In the ordinary course of our business, the structure and duration of many of our complex, long-term projects and product development programs require us to invest significantly in engineering, development and production for many years before deliveries are made and the product begins to generate cash flow. In addition, we are regularly required to incur capital expenditures in order to, among other matters, maintain equipment, increase operating efficiency, develop and design new products, improve existing products and services, invest in and develop new technologies and maintain a significant level of highly skilled employees. Our ability to negotiate and collect customer advances and progress payments is therefore an important element of our cash flow and working capital management. However, intense competition in the markets in which we operate and demands by customers in the current economic environment have resulted in fewer and lower advance payments, which could place significant financial pressures on our operations. Discrepancies between our disbursements and amounts received on orders placed, or even any reduction in the overall volume of orders placed or a deterioration of the payment terms on these orders has an automatic adverse impact on the evolution in working capital requirements and results of operations.
Seasonality
In addition, our cash flows are, to a certain degree, subject to seasonal fluctuations and we expect a disproportionate amount of our cash flows from operations to be received or paid by us during our fourth quarter. We expect this trend to continue. While the payment terms with certain of our vendors extend beyond the amount of time necessary to collect proceeds from our customers, no assurance can be given that we will be able to maintain such terms. As a result of fourth quarter cash receipts, at December 31 of each year, our cash and cash equivalents balances typically reach their highest level (other than as a result of cash flows provided by or used in investing and financing activities). Our interim results can be affected by these seasonal fluctuations.
Deployment and execution of strategic initiatives related to cost reductions and working capital improvement
In 2015, we launched the multi-phased, multi-year Bombardier transformation plan focusing on three priorities: improve cash generation, reduce costs and drive performance. As with any large, company-wide transformation there are inherent risks in the timing of the deployment and in the planned value to be achieved. More specifically, the timing and magnitude of the specific initiatives and subsequent benefits, if any, could be affected by a multitude of external and internal factors including, but not limited to: the evolution of the demands and requirements of our businesses, variations in planned production volumes and schedules, the outcome of negotiations with suppliers and unions, changing legislation, changes in socio-economic conditions in the countries in which we operate, evolutions in the labour market for key talent, and changes in the priorities of the business. There can be no assurance that these initiatives, or other initiatives, will enable us to reach our objectives, or that any such measures will be implemented successfully or within the set time frame. A failure to successfully implement our strategy and transformation initiatives, or if such measures prove insufficient, could have an adverse impact on our business activities, financial condition, profitability and outlook.

108 BOMBARDIER INC. FINANCIAL REPORT - FISCAL YEAR ENDED DECEMBER 31, 2016
Business partners
In some of the projects carried out through consortia or other partnership vehicles in which we participate, partners are jointly and severally liable to the customer. The success of these partnerships is dependent on satisfactory performance by us and our business partners. Failure of the business partners to fulfill their contractual obligations could result in additional financial and performance obligations, which could result in increased costs, unforeseen delays or impairment of assets. In addition, a partner withdrawing from a consortium during the bid phase may result in the loss of a potential order.
In order to penetrate new markets and strengthen our partnerships, we have implemented a number of joint ventures and partnerships in various countries and regions, such as Africa, the Middle East and Asia (in particular, China). These operations involve certain risks, in particular in relation to potential political or economic instability depending on the countries, in the difficulties that may arise in evaluating assets and liabilities relating to these operations, in integrating people, activities, technologies and products, as well as in implementing governance and compliance systems and procedures.
Product performance warranty and casualty claim losses
The products that we manufacture are highly complex and sophisticated and may contain defects that are difficult to detect or correct. These products are subject to detailed specifications, which are listed in the individual contracts with customers, as well as to stringent certification or approval requirements. Defects may be found in products before and after they are delivered to the customer. When discovered, we may incur significant additional costs to modify and/or retrofit our products and we may not be able to correct defects in a timely manner or at all. The occurrence of defects and failures in our products could give rise to non-conformity costs, including warranty and damage claims, negatively affect our reputation and profitability and result in the loss of customers. Correcting such defects could require significant investment.
In addition, due to the nature of our business, liability claims may arise from accidents, incidents or disasters involving products and services that we have provided, including claims for serious personal injuries or death. These accidents may be caused by climatic factors or human error.
If any of our products is proven to have quality issues, fails to meet the national or industrial standards or has potential risks to the safety of human and properties, we may have to recall such products, be subject to penalties, have our operating licences or permits revoked, suspend production and sale of our products, or be ordered to take corrective measures. A product recall may also affect our reputation and brand name, result in a decreased demand for our products and lead to stricter scrutiny by regulatory agencies over our operations.
We cannot be certain that current insurance coverage will be sufficient to cover one or more substantial claims. Furthermore, there can be no assurance that we will be able to obtain insurance coverage at acceptable levels and costs in the future.
Regulatory and legal risks
We are subject to numerous risks relating to current and future regulations, as well as legal proceedings, both present or that may arise in the future. For example, the harmonization of the European railway market through the new European standards will require investment to upgrade our existing products to comply with regulatory requirements, without which regulatory authorities and thus our customer may not accept our products. Unavailability of compliant products may lead to a loss of market share.
We may become party to lawsuits in the ordinary course of business, including those involving allegations of late deliveries of goods or services, product liability, product defects, quality problems and intellectual property infringement. Material losses may be incurred related to litigation beyond the limits or outside the coverage of current insurance and existing provisions for litigation-related losses may not be sufficient to cover the ultimate loss or expenditure. In addition, employee, agent, supplier or partner misconduct or failure to comply with anti-bribery and other government laws and regulations could harm our reputation, reduce revenues and profitability,
BOMBARDIER INC. / 2016 FINANCIAL REPORT / OTHER 109
and subject us to criminal and civil enforcement actions. Moreover, legal proceedings resulting in judgments or findings against us may harm our reputation and place us at a disadvantage for future orders or contract awards.
Also refer to Note 38 – Commitments and contingencies, to our consolidated financial statements, for information regarding current investigations in Transportation and the dispute with Metrolinx as well as the lawsuit filed by Triumph Aerostructures LLC.
Environmental, health and safety risks
Our products, as well as our manufacturing and service activities, are subject to environmental laws and regulations in each of the jurisdictions in which we operate, governing, among other things, product performance or materials content, energy use and greenhouse gas emissions, air, water and noise pollution, the use, storage, labelling, transportation and disposal or release of hazardous substances, human health and safety risks arising from the exposure to hazardous or toxic materials or defective products and the remediation of soil and groundwater contamination on or under our properties (whether or not caused by us), or on or under other properties and caused by our current or past operations, including our disposal of hazardous wastes at third party sites. These laws and regulations may cause us to incur costs, including fines, damages, criminal or civil sanctions and remediation costs, or experience interruptions in our operations, and may negatively impact the market for our products.
Environmental, health and safety regulatory requirements, or enforcement thereof, may become more stringent in the future and we may incur additional costs to be compliant with such future requirements or enforcement. In addition, we may have contractual or other liabilities for environmental matters relating to businesses, products or properties that we have in the past closed, sold or otherwise disposed of, or will close, sell or dispose of in the future.
Dependence on customers
While we have a varied customer base, in any given period a limited number of contracts or customers may account for a significant portion of our revenues for some of our products. Although we constantly seek to expand our customer base, we believe that in any given period revenues and results may continue to be significantly affected by a limited number of customers due to the nature of some of our products. Consequently, the loss of such a customer or changes to their orders could result in fewer sales and/or a lower market share. Since the majority of our rail transportation customers are governments or public-sector companies or operate under public contracts, our order intake is also dependent to a significant degree on public-sector budgets and spending policies.
Dependence on suppliers
Our manufacturing operations are dependent on a limited number of suppliers for the delivery of raw materials (mainly aluminum, advanced aluminum alloy and titanium) and major systems (such as engines, wings, nacelles, landing gear, avionics, flight controls and fuselages) for our aerospace products, and raw materials (mainly steel and aluminum), services (mainly engineering, civil and electrical subcontracts) and major systems (such as brakes, doors, heating, ventilation and air conditioning) for our rail transportation products.
Disruptions in our supply chain can impact our ability to deliver on schedule. Moreover, failure by one or more suppliers to meet performance specifications, quality standards or delivery schedules could adversely affect our ability to meet our commitments to customers, in particular if we are unable to purchase the key components and parts from those suppliers upon agreed terms or in a cost-effective manner and if we cannot find alternative suppliers on commercially acceptable terms in a timely manner. We may not be able to recover any costs or liability we incur (including liability to our customers) as a result of any such failure from the applicable supplier, which could have a material adverse effect on our financial condition and results of our operations.
Some of our suppliers participate in the development of products such as aircraft or rolling stock platforms. The advancement of many of our new product development programs also relies on the performance of these key suppliers and, therefore, supplier delays which go unmitigated could result in delays to a program as a whole.

110 BOMBARDIER INC. FINANCIAL REPORT - FISCAL YEAR ENDED DECEMBER 31, 2016
These suppliers subsequently deliver major components and own some of the intellectual property related to key components they have developed. Our contracts with these suppliers are therefore on a long-term basis. The replacement of such suppliers, if possible, could be costly and take a significant amount of time.
Human resources (including collective agreements)
Employment market competition is fierce when it comes to hiring the highly qualified managers and specialists needed to complete the work we require, particularly in certain emerging countries. In many of our business areas we intend to expand our business activities, for which we will need highly skilled employees. The success of our development plans depends, in part, on our ability to develop skills, to retain employees, and to recruit and integrate additional managers and skilled employees. Human resource risk includes the risk of delays in the recruitment of or inability to retain and motivate highly skilled employees, including those involved in R&D and manufacturing activities that are essential to our success. There is no guarantee that we will be successful in recruiting, integrating and retaining such employees as needed to accompany our business development, in particular in emerging countries. Conversely, the measures to adapt headcount to evolution in demand may result in pressures from our workforce and social risks, which may have an adverse impact on our expected costs reductions and production capacities.
In addition, we are party to several collective agreements that are due to expire at various times in the future. An inability to renew these collective agreements on mutually agreeable terms, as they become subject to renegotiation from time to time, could result in work stoppages or other labour disturbances such as strikes, walkouts or lock-outs, and/or increased costs of labour, which could adversely affect our ability to deliver products and services in a timely manner and on budget and could adversely affect our financial condition and results.
Additionally, as a result of our continuing review of our businesses and processes to reduce cost, improve our manufacturing platform, and better position ourselves in the marketplace, it may be necessary to curtail production or permanently shut down facilities, leading to the transfer of employees to new production facilities and processes or to the reduction of our workforce. This could materially adversely impact our relationship with our employees, as well as result in asset write-downs at affected facilities.
Reliance on information systems
We may face certain security threats, including cybersecurity threats, to the confidentiality, availability and integrity of our systems. Information contained on our systems include proprietary or sensitive information on our customers, suppliers, partners, employees, business information, research and development activities and our intellectual property. Our partners and suppliers also face risks of unauthorized access to their information systems which may contain our confidential information.
Management supervises and maintains control, enforcement and monitoring systems designed to prevent, detect and respond to unauthorized activity in our systems. We rely on our partners and suppliers to do the same. However, considering the complexity and evolving nature of the threats, we cannot ensure that the measures taken will be sufficient to counter any such unauthorized access to information systems, nor that our assessment and mitigation measures are sufficient. A system failure, cyberattack or a breach of systems could result in disruption of activities and operational delays, significant financial or information losses, diminished competitive advantage and/or reputational harm.
Reliance on and protection of intellectual property
We regularly apply for new patents and actively manage our intellectual property portfolio to secure our technological position. However, our patents and other intellectual property may not prevent competitors from independently developing, or obtaining through licensing, alternative technologies that are substantially equivalent or superior to ours, and we cannot provide assurance that the measures we have taken will be sufficient to prevent any misappropriation of our intellectual property. Furthermore, we cannot assure that all our registration applications will be successful, or our registered intellectual property rights will not be subject to any objection. If the steps we have taken and the protection afforded by law do not adequately safeguard our intellectual property rights, or we are not able to register or defend our intellectual property rights, and our competitors exploit our

BOMBARDIER INC. / 2016 FINANCIAL REPORT / OTHER 111
intellectual property in the manufacture and sale of competing products in the markets we operate, such events could materially and adversely affect our business.
We could also face claims by others that we are improperly using intellectual property owned by them or otherwise infringing their rights in intellectual property. Irrespective of the validity or the successful assertion of such claims, we could incur costs in either defending or settling any intellectual property disputes alleging infringement. Adverse rulings in any litigation or proceeding could result in the loss of our proprietary rights and subject us to significant liabilities or even business disruption. Any potential intellectual property litigation against us could also force us to, among other things, cease selling the challenged products, develop non-infringing alternatives or obtain licences from owner of the infringed intellectual property. We may not be successful in developing such alternatives or in obtaining such licences on reasonable terms or at all, which could damage our reputation and affect our financial condition and profitability.
Adequacy of insurance coverage for our business, products and properties
We maintain insurance policies in accordance with the needs of our business. However, we cannot guarantee that our insurance policies will provide adequate coverage should we face extraordinary occurrences that result in losses. We may not obtain certain insurance coverage or may experience difficulties in obtaining the insurance coverage we need at acceptable levels and costs in the future, which could materially and adversely affect our business, financial condition and results of operations. We do not carry any insurance for business interruption or loss of profit arising from accidents at any of our manufacturing facilities or other disruptions of our operations.
Accidents or natural disasters may also result in significant property damage, disruption of our operations and personal injuries or fatalities, and our insurance coverage may be inadequate to cover such losses. In the event of an uninsured loss or a loss in excess of our insured limits, we could suffer damage to our reputation and/or lose all or a portion of our production capacity as well as future revenues expected to be generated by the relevant facilities. Any material loss not covered by our insurance could adversely affect our business, financial condition and results of operations.
Financing risk
Liquidity and access to capital markets
Our businesses are cyclical and highly capital intensive. In the ordinary course of our business, we rely on cash and cash equivalents, cash flows generated by operations, capital market resources such as debt and equity and other financing arrangements such as revolving credit facilities and receivables factoring facilities to satisfy our financing needs. There can be no assurance that such working capital cash sources will be available to us in the future on acceptable terms or at all.
Our ability to achieve our business and cash generation plans is based on a number of assumptions which involve significant judgments and estimates of future performance, borrowing capacity and credit availability, which cannot at all times be assured.
From time to time, we undertake various financing initiatives to solidify our liquidity position. We plan to continue to explore various initiatives such as certain business activities’ potential participation in industry consolidation. There are no assurances that we will be able to implement these or any other strategic options on favourable terms and timing or at all, and, if implemented, that such actions would have the planned results.
While we believe that our expected cash flows from operating activities, combined with available short-term capital resources will enable the development of new products to enhance competitiveness and support growth and will enable us to meet all other expected financial requirements in the foreseeable future, there can be no assurance that this will be the case.
If our cash flows and other capital resources are insufficient to fund the required work on our ongoing contracts, programs and projects, as well as our capital expenditures and debt service obligations, we could be forced to

112 BOMBARDIER INC. FINANCIAL REPORT - FISCAL YEAR ENDED DECEMBER 31, 2016
reduce or delay deliveries, investments and capital expenditures or to seek additional debt or equity capital. We may not be able to obtain alternative capital resources, if necessary, on favourable terms or at all.
A decline in credit ratings, a significant reduction in the surety or financing market global capacity, widening credit spreads, changes in our outlook or guidance, significant changes in market interest rates or general economic conditions or an adverse perception by banks and capital markets of our financial condition or prospects could all significantly increase our cost of financing or impede our ability to access financial markets. Our credit ratings may be impacted by many factors, including factors outside of our control relating to the industries or countries and regions in which we operate, and, accordingly, no assurance can be given that our credit ratings may not be downgraded in the future. Actual or anticipated changes or downgrades in our credit ratings, including any announcement that our ratings are under further review for a downgrade, may increase our cost of financing.
Our right to convert into cash certain deposits or investments, held in financing structures to guarantee our obligations, may be subject to restrictions. Additionally, in some countries, cash generated by operations may be subject to restrictions on the right to convert and/or repatriate money and may thus not be available for immediate use.
Retirement benefit plan risk
We are required to make contributions to a number of pension plans, most of which are presently in a deficit position. Pension funding requirements are dependent on regulatory requirements and on the valuations of plan assets and liabilities, which are subject to a number of factors, including expected returns on plan assets, long-term interest rates, as well as applicable actuarial practices and various other assumptions. The potential requirement to make additional contributions as a result of changes to regulations, actuarial assumptions or other factors may reduce the amount of funds available for operating purposes, thus limiting our financial flexibility and weakening our financial condition.
There is no assurance that retirement benefit plan assets will earn the expected rates of return. The ability of our retirement benefit plan assets to earn these expected rates of return depends in large part on the performance of capital markets. Market conditions also affect the discount rates used to calculate our net retirement benefit liabilities and could also impact our retirement benefit costs, cash funding requirements and liquidity position.
The net retirement benefit liability is highly sensitive to variations to the underlying discount rate, which represents the market rate for high-quality corporate fixed-income investments at the end of each reporting period consistent with the currency and estimated term of the benefit obligations. As a result, the discount rates change is based on market conditions.
Credit risk
We are exposed to credit risk through our derivative financial instruments and other investing activities carried out as part of our normal treasury activities, as well as through our trade receivables arising from normal commercial activities and through financing activities provided to our aerospace customers primarily in the form of aircraft loans and lease receivables. Reduced liquidity may result if our customers or other counterparties are unable to make payment of amounts owed to us, or delay these payments, and we may incur impairment losses on these assets. Furthermore, if our customers experience deteriorating credit quality, we may need to provide additional direct or indirect financing support to maintain sales, increasing our exposure to credit risk, or reduce our customers’ credit limits, which could negatively affect our revenues.
We also have exposure to banks in the form of periodically placed deposits and credit commitments. In the event the banks with which we transact are unable to withstand regulatory or liquidity pressures, credit facilities, including letter of credit facilities, may become unavailable or we may not be able to extend such facilities upon their maturity.

BOMBARDIER INC. / 2016 FINANCIAL REPORT / OTHER 113
Substantial debt and significant interest payment requirements
We currently have, and expect to continue to have, a substantial amount of debt and significant interest payment requirements. Our level of indebtedness could have significant consequences, including the following:• it may be more difficult to satisfy our obligations with respect to our indebtedness;• our vulnerability to general adverse economic and industry conditions may be increased;• we may be required to dedicate a substantial portion of our cash flows from operations to interest and
principal repayments on our indebtedness, reducing the availability of cash flows to fund capital expenditures, working capital, acquisitions, new business initiatives and other general corporate purposes;
• our flexibility in planning for, or reacting to, changes in our businesses and the industries in which we operate may be limited;
• we may be placed at a disadvantage compared to our competitors that have less debt or greater financial resources;
• it may limit, along with the financial and other restrictive covenants to which we are subject, among other things, our ability to borrow additional funds on commercially reasonable terms, or at all;
• we may be required to monetize assets on terms that are unfavourable to us; and• we may be required to offer debt or equity securities on terms that are not favourable to us or our
shareholders.
For more information regarding our long-term debt, see Note 27 - Long-term debt, to our consolidated financial statements.
Restrictive debt covenants
The indentures governing certain of our indebtedness, revolving credit facilities and letter of credit facilities contain covenants that, among other things, restrict our ability, and in some cases the ability of our subsidiaries, to: • incur additional debt and provide guarantees;• repay subordinated debt;• create or permit certain liens;• use the proceeds from the sale of assets and capital stock of subsidiaries;• pay dividends and make certain other disbursements;• allow our subsidiaries to pay dividends or make other payments;• engage in certain transactions with affiliates; and• enter into certain consolidations, mergers or transfers of all or certain assets.
These restrictions could impair our ability to finance future operations or capital needs, or engage in other business activities that may be beneficial.
We are subject to various financial covenants under our letter of credit facilities and unsecured revolving credit facilities which must be met on a quarterly basis. The $400-million letter of credit facility(1) and the $400-million unsecured revolving facility(1) include financial covenants requiring a minimum EBITDA to fixed charges ratio, maximum gross debt and minimum EBITDA thresholds and a minimum liquidity level of $750 million, all calculated based on an adjusted consolidated basis (i.e. excluding Transportation). Transportation’s €3.31-billion letter of credit facility and €658-million unsecured revolving facility require a minimum liquidity level of €600 million as well as a minimum equity level and a maximum debt to EBITDA ratio, all calculated on a Transportation stand-alone basis.(2)
(1) Available for other than Transportation’s usage.(2) These terms and ratios are defined in their respective agreements and do not correspond to our global metrics or to specific terms used in
the MD&A. Minimum liquidity is not defined as solely based on cash and cash equivalents as presented in the consolidated statement of financial position.
Our ability to comply with these covenants may also be affected by events beyond our control. A breach of any of these agreements or our inability to comply with these covenants could result in a default under these facilities, which would permit our banks to request immediate defeasance or cash cover of all outstanding letters of credit, and our bond holders and other lenders to declare amounts owed to them to be immediately payable. If any of these facilities is accelerated, or we are subject to significant cash cover calls, we may not have access to

114 BOMBARDIER INC. FINANCIAL REPORT - FISCAL YEAR ENDED DECEMBER 31, 2016
sufficient liquidity or credit to refinance such facilities on terms acceptable to us or at all. Furthermore, if we incur additional debt in the future, we may be subject to additional covenants, which may be more restrictive than those to which we are subject now. In addition, failure to comply with the obligations contained in our existing or future indentures or loan agreements could require us to immediately cash cover, or repay debt under other agreements that may contain cross-acceleration or cross-default provisions. There can be no assurance that we would be able to obtain waivers or amendments of any such defaults, or be able to cash cover or refinance such facilities, on terms acceptable to us or at all.
Financing support provided for the benefit of certain customers
From time to time, we provide aircraft financing support to customers. We may provide, directly or indirectly, credit and residual value guarantees or guarantee of a maximum credit spread, to support financing for certain customers such as airlines or to support financing by certain special purpose entities created solely i) to purchase our commercial aircraft and to lease those aircraft to airline companies or ii) to purchase financial assets such as loans and lease receivables related to the sale of our commercial aircraft. Under these arrangements, we are obligated to make payments to a guaranteed party in the event that the original debtor or lessee does not make the loan or lease payments, or if the market or resale value of the aircraft is below the guaranteed residual value amount at an agreed-upon date. A substantial portion of these guarantees has been extended to support original debtors or lessees with less than investment grade credit ratings.
Government support
From time to time, we receive various types of government financial support. Some of these financial support programs require the repayment of amounts to the government at the time of product delivery. The level of government support reflects government policy and depends on fiscal spending levels and other political and economic factors. We cannot predict if future government-sponsored support will be available. The loss of or any substantial reduction in the availability of government support could negatively impact our liquidity assumptions related to the development of aircraft or rail products and services. In addition, any future government support received by our competitors could have a negative impact on our competitiveness, sales and market share.
Market risk
Foreign exchange risk
Our financial results are reported in U.S. dollars and a significant portion of our sales and operating costs are transacted in currencies other than U.S. dollars, most often euros, Canadian dollars, pounds sterling, Swiss francs, Swedish kronor and Mexican pesos. In situations where we are not fully hedged, our results of operations are affected by movements in these currencies against the U.S. dollar. Significant fluctuations in relative currency values against the U.S. dollar could thus have a significant impact on our future profitability. Additionally, the settlement timing of foreign currency derivatives could significantly impact our liquidity.
Interest rate risk
Changes in interest rates may result in fluctuations in our future cash flows related to variable-rate financial assets and liabilities, including long-term fixed-rate debt synthetically converted to variable interest rates. Changes in interest rates may also affect our future cash flows related to commitments to provide financing support to facilitate customers’ access to capital. For these items, cash flows could be impacted by changes in benchmark rates such as Libor, Euribor or Bankers’ Acceptance. In addition, we are exposed to gains and losses arising from changes in interest rates, including marketability risk, through our financial instruments carried at fair value such as certain aircraft loans and lease receivables, investments in securities and certain derivatives.

BOMBARDIER INC. / 2016 FINANCIAL REPORT / OTHER 115
Residual value risk
We are exposed to residual value risks through RVGs provided in support of commercial aircraft sales. These RVGs may be provided either directly to an airline, a lessor or to a financing party that participates in a long-term financing associated with the sale of commercial aircraft. RVGs are offered as a strip of the value of an aircraft with a ceiling and a floor. If the underlying aircraft is sold at the end of the financing period (or during this period in limited circumstances), the resale value is compared to the RVG strip. We are required to make payments under these RVGs when the resale value of the aircraft falls below the ceiling of the strip covered by the guarantee, but our payment is capped at the floor of the strip if the resale value of the aircraft is below that level.
Commodity price risk
We are exposed to commodity price risk relating principally to fluctuations in the cost of materials used in our supply chain, such as aluminum, advanced aluminum alloy, titanium, steel and other materials that we use to manufacture our products, and which represent a significant portion of our cost of sales. We do not maintain significant inventories of raw materials and components and parts. The prices and availabilities of raw materials and components and parts may vary significantly from period to period due to factors such as consumer demand, supply, market conditions and costs of raw materials. In particular, raw materials required for our operations, may be subject to pricing cyclicality and periodic shortages from time to time. We cannot guarantee that corresponding variations in cost will be fully reflected in contract prices, and we may be unable to recoup these raw material price increases, which could affect the profitability of such contracts.
Inflation risk
Our aerospace businesses are exposed to inflation risk relating to fluctuations in costs and revenue for aircraft orders received but for which the delivery of the aircraft will take place several years in the future. Revenues for these orders are adjusted for price escalation clauses linked to inflation. At Transportation, contract cost estimates are subject to inflation rate assumptions. Estimated revenues at completion are adjusted for price escalation clauses, several of which are linked to inflation. Fluctuations in inflation rates could nevertheless have a significant impact on our future profitability if the inflation rate assumption used varies from the actual inflation rate, and this is a particularly acute risk in respect of large long-term contracts which may have an impact on our results for several years.
ACCOUNTING AND REPORTING DEVELOPMENTS
Future changes in accounting policiesFinancial instruments
In July 2014, the IASB completed the three-part project to replace IAS 39, Financial instruments: recognition and measurement by issuing IFRS 9, Financial instruments. IFRS 9, Financial instruments includes classification and measurement of financial assets and financial liabilities, a forward-looking ‘expected loss’ impairment model and a substantially-reformed approach to hedge accounting.
IFRS 9 uses a new approach to determine whether a financial asset is measured at amortized cost or fair value, replacing the multiple rules in IAS 39. The approach in IFRS 9 is based on how an entity manages its financial instruments and the contractual cash flow characteristics of the financial assets. Most of the requirements in IAS 39 for classification and measurement of financial liabilities were carried forward in IFRS 9. However, the portion of the changes in fair value related to the entity’s own credit risk, in measuring a financial liability at FVTP&L, will be presented in OCI rather than in the statement of income.

116 BOMBARDIER INC. FINANCIAL REPORT - FISCAL YEAR ENDED DECEMBER 31, 2016
IFRS 9 also introduced a new expected-loss impairment model that will require more timely recognition of expected credit losses. Specifically, the new standard requires entities to account for expected credit losses from when financial instruments are first recognized and to recognize full lifetime expected losses on a more timely basis.
Lastly, IFRS 9 introduced a new hedge accounting model, together with corresponding disclosures about risk management activities. The new hedge accounting model represents a substantial overhaul of hedge accounting that will enable entities to better reflect their risk management activities in their financial statements.
IFRS 9 will be effective for our fiscal year beginning on January 1, 2018. We are currently assessing the impact of the adoption of this standard on our consolidated financial statements. We do not expect significant hedge accounting differences in respect of our aerospace segments. We continue to analyze the application of hedge accounting under the new standard in respect of long-term contracts in our Transportation segment. Our preliminary analysis has not identified significant recognition or measurement differences in respect of classification and measurement.
Revenue Recognition
In May 2014, the IASB released IFRS 15, Revenue from contracts with customers, which supersedes IAS 11, Construction Contracts, and IAS 18, Revenue as well as other related interpretations. The core principle of IFRS 15 is that an entity should recognize revenue to depict the transfer of promised goods or services to customers in an amount that reflects the consideration to which the entity expects to be entitled in exchange for those goods or services. Revenue is recognized when, or as, the customer obtains control of the goods or services.
The standard will be effective for our fiscal year beginning on January 1, 2018, and as a result IFRS 15 will be adopted in the first quarter of 2018. At that time we will restate our 2017 results, with an opening adjustment to equity as at January 1, 2017.
We are continuing to assess the impact of the new standard on our consolidated financial statements.
The majority of long-term manufacturing and service contracts at Transportation currently accounted for under the percentage-of-completion method are expected to meet the requirements for revenue recognition over time. We anticipate our accounting for customer options will change, in particular with respect to when the options are considered in estimated revenues at completion. This change will result in the deferral of revenue and margin and a reduction of equity at transition. We are currently assessing whether the new standard will result in the deferral of revenue recognition in respect of certain variable consideration such as estimated price escalation and penalties.
Revenues from the sale of new aircraft will continue to be recognized when the aircraft have been delivered.
We are assessing whether there is a significant financing component on orders where timing of cash receipts and revenue recognition differ substantially.
IFRS 15 indicates IAS 37, Provisions, Contingent liabilities and Contingent Assets, should be applied to onerous contracts but contains no other requirements as to their measurement. When the new revenue standard is adopted all loss provisions for contracts with customers will need to follow the same policy. We are assessing whether it would be appropriate to measure loss provisions on contracts with customers based on all costs that will be attributed to a contract, consistent with the approach currently used for long-term contracts. This change in accounting policy, if adopted, would increase the amount of onerous contract provisions and result in a reduction of equity at transition.
While these changes will impact the timing of revenue and margin recognition, and will result in a reduction of equity at transition, there will be no changes to the treatment of cash flows and cash will still be collected in line with contractual terms.
We will provide further updates during the course of 2017 as we advance in our assessment.

BOMBARDIER INC. / 2016 FINANCIAL REPORT / OTHER 117
Leases
In January 2016, the IASB released IFRS 16, Leases, to replace the previous leases Standard, IAS 17, Leases, and related Interpretations. IFRS 16 sets out the principles for the recognition, measurement, presentation and disclosure of leases for both parties to a contract, the customer (lessee) and the supplier (lessor). IFRS 16 eliminates the classification of leases as either operating leases or finance leases and introduces a single lessee accounting model. IFRS 16 also substantially carries forward the lessor accounting requirements. Accordingly, a lessor continues to classify its leases as operating leases or finance leases, and to account for those two types of leases differently.
IFRS 16 will be effective for our fiscal year beginning on January 1, 2019. We are currently evaluating the impact the adoption of this standard will have on our consolidated financial statements. Where we are a lessee, we expect IFRS 16 will result in on-balance sheet recognition of most of our leases that are considered operating leases under IAS 17. This will result in the gross-up of the balance sheet through the recognition of a right-of-use asset and a liability for the present value of the future lease payments. Depreciation expense on the right-of-use asset and interest expense on the lease liability will replace the operating lease expense.
FINANCIAL INSTRUMENTSAn important portion of the consolidated balance sheets is composed of financial instruments. Our financial assets include cash and cash equivalents, trade and other receivables, aircraft loans and lease receivables, investments in securities, investments in financing structures, long-term contract receivables, restricted cash and derivative financial instruments with a positive fair value. Our financial liabilities include trade and other payables, long-term debt, short-term borrowings, lease subsidies, government refundable advances, vendor non-recurring costs, sale and leaseback obligations and derivative financial instruments with a negative fair value. Derivative financial instruments are mainly used to manage exposure to foreign exchange and interest rate risks. They consist mostly of forward foreign exchange contracts and interest rate swap agreements.
The use of financial instruments exposes us primarily to credit, liquidity and market risks, including foreign exchange and interest rate risks. A description on how we manage these risks is included in the Risk management section of Overview and in Note 33 – Financial risk management, to the consolidated financial statements.
Fair value of financial instruments
All financial instruments are required to be recognized at their fair value on initial recognition, plus transaction costs for financial instruments not at FVTP&L. Subsequent measurement is at amortized cost or fair value depending on the classifications of the financial instruments. Financial instruments classified as FVTP&L or AFS are carried at fair value, while all others are carried at amortized cost. The classification of financial instruments as well as the revenues, expenses, gains and losses associated with these instruments are provided in Note 2 - Summary of significant accounting policies and in Note 14 – Financial instruments, to the consolidated financial statements.
Note 34 - Fair value of financial instruments, to the consolidated financial statements, provides a detailed description of the methods and assumptions used to determine the fair values of financial instruments. These values are point-in-time estimates that may change in subsequent reporting periods due to market conditions or other factors. Fair value is determined by reference to quoted prices in the principal market for that instrument to which we have immediate access. However, there is no active market for most of our financial instruments. In the absence of an active market, we determine fair value based on internal or external valuation models, such as stochastic models, option-pricing models and discounted cash flow models. Fair value determined using valuation models requires the use of assumptions concerning the amount and timing of estimated future cash flows, discount rates, the creditworthiness of the borrower, the aircraft’s expected future value, default probability, generic industrial bond spreads and marketability risk. In determining these assumptions, we use primarily external, readily observable market inputs, including factors such as interest rates, credit ratings, credit spreads, default probabilities, currency rates, and price and rate volatilities, as applicable. Assumptions or inputs that are

118 BOMBARDIER INC. FINANCIAL REPORT - FISCAL YEAR ENDED DECEMBER 31, 2016
not based on observable market data are used when external data are unavailable. These calculations represent management’s best estimates. Since they are based on estimates, the fair values may not be realized in an actual sale or immediate settlement of the instruments.
Note 34 – Fair value of financial instruments, to the consolidated financial statements, also provides a three-level fair value hierarchy, categorizing financial instruments by the inputs used to measure their fair value. The fair value hierarchy gives the highest priority to unadjusted quoted prices in active markets (Level 1) and the lowest priority to unobservable inputs (Level 3). In cases where the inputs used to measure fair value are categorized within different levels of hierarchy, the fair value measurement is reported at the lowest level of the input that is significant to the entire measurement. Assessing the significance of a particular input to the fair value measurement in its entirety requires judgment, taking into account factors specific to the asset or liability. The fair value hierarchy is not meant to provide insight on the liquidity characteristics of a particular asset or on the degree of sensitivity of an asset or liability to other market inputs or factors.
We consider gains and losses arising from certain changes in fair value of financial instruments incidental to our core performance, such as those arising from changes in market yields, as our intention is to continue to hold these instruments for the foreseeable future. These gains and losses are excluded from adjusted net income and adjusted EPS to provide users of the financial statements a better understanding of the core results of our business and enable better comparability of results from one period to another and with peers.
In connection with the sale of commercial aircraft, we hold financial assets and have incurred financial liabilities, measured at fair value, some of which are reported as Level 3 financial instruments, including certain aircraft loans and lease receivables, certain investments in financing structures and lease subsidies. The fair values of these financial instruments are determined using various assumptions, with the assumption on marketability risk being the most likely to change the fair value significantly from period to period. The fair value of aircraft loans and lease receivables was also moderately impacted by credit rating changes in the recent past.
Sensitivity analysisOur main exposures to changes in fair value of financial instruments are related to changes in foreign exchange, interest rates, aircraft residual value curves, credit ratings and marketability adjustments. Note 33 – Financial risk management and Note 34 – Fair value of financial instruments, to the consolidated financial statements, present sensitivity analyses assuming variations in foreign exchange and interest rates.
RELATED PARTY TRANSACTIONSRelated parties, as defined by IFRS, are our joint ventures, associates and key management personnel. A description of our transactions with these related parties is included in Note 36 – Transactions with related parties, to the consolidated financial statements.
CRITICAL JUDGMENTS AND ACCOUNTING ESTIMATESOur significant accounting policies and use of estimates and judgment are described in Note 2 – Summary of significant accounting policies and Note 4 – Use of estimates and judgment, to the consolidated financial statements. The preparation of financial statements in conformity with IFRS requires the use of estimates and judgment. Critical accounting estimates, which are evaluated on a regular ongoing basis and can change from period to period, are described in this section. An accounting estimate is considered critical if:
• the estimate requires us to make assumptions about matters that are highly uncertain at the time the estimate is made; and
• we could have reasonably used different estimates in the current period, or changes in the estimate are reasonably likely to occur from period to period that would have a material impact on our financial condition, our changes in financial condition or our results of operations.
BOMBARDIER INC. / 2016 FINANCIAL REPORT / OTHER 119
Our best estimates regarding the future are based on the facts and circumstances available at the time estimates are made. We use historical experience, general economic conditions and trends, as well as assumptions regarding probable future outcomes as the basis for determining estimates. Estimates and their underlying assumptions are reviewed periodically and the effects of any changes are recognized immediately. Actual results will differ from the estimates used, and such differences could be material.
Our budget and strategic plan cover a five-year period and are fundamental information used as a basis for many estimates necessary to prepare financial information. We prepare a budget and a strategic plan covering a five-year period, on an annual basis, using a process whereby a detailed one-year budget and four-year strategic plan are prepared by each reportable segment and then consolidated. Cash flows and profitability included in the budget and strategic plan are based on existing and future contracts and orders, general market conditions, current cost structures, anticipated cost variations and in-force collective agreements. The budget and strategic plan are subject to approval at various levels, including senior management and the Board of Directors. We use the budget and strategic plan, as well as additional projections or assumptions, to derive the expected results for periods thereafter. We then track performance as compared to the budget and strategic plan at various levels within the Corporation. Significant variances in actual performance are a key trigger to assess whether certain estimates used in the preparation of financial information must be revised.
The following areas require management’s most critical estimates and judgments. The sensitivity analyses below should be used with caution as the changes are hypothetical and the impact of changes in each key assumption may not be linear.
Long-term contracts
Transportation conducts most of its business under long-term manufacturing and service contracts and the aerospace segments have some long-term maintenance service contracts, as well as design and development contracts for third parties. Revenues and margins from long-term contracts relating to the designing, engineering or manufacturing of specially designed products (including rail vehicles, vehicle overhaul and signaling contracts) and service contracts are recognized using the percentage-of-completion method of accounting. The long-term nature of these contracts requires estimates of total contract costs and revenues at completion.
Estimated revenues at completion are adjusted for change orders, anticipated options for additional assets, claims, performance incentives, price escalation clauses and other contract terms that provide for the adjustment of prices. If it is probable that changes in revenues will occur and the amount can be measured reliably, they are included in estimated revenues at completion.
Contract costs include material, direct labour, manufacturing overhead and other costs, such as warranty and freight. Estimated contract costs at completion incorporate forecasts for material usage and costs, including escalation clauses, labour hours and costs, foreign exchange rates (including the effect of hedges) and labour productivity. These costs are influenced by the nature and complexity of the work to be performed, as well as the impact of change orders and potential delays in delivery. Cost estimates are based mainly on historical performance trends, economic trends, collective agreements and contracts signed with suppliers. We apply judgment to determine the probability that we will incur additional costs from delays or other penalties and such costs, if probable, are included in estimated costs at completion.
Recognized revenues and margins are subject to revisions as contracts progress towards completion. We conduct quarterly reviews of estimated costs and revenues to completion on a contract-by-contract basis, including a review of escalation assumptions. In addition, a detailed annual review is performed on a contract-by-contract basis as part of the budget and strategic plan process. The effect of any revision may be significant and is recorded by way of a cumulative catch-up adjustment in the period in which the estimates are revised.
Sensitivity analysisA 1% increase in the estimated future costs to complete all ongoing long-term contracts would have decreased Transportation’s gross margin for 2016 by approximately $86 million.

120 BOMBARDIER INC. FINANCIAL REPORT - FISCAL YEAR ENDED DECEMBER 31, 2016
Aerospace program tooling
Our aerospace segments capitalize development costs as aerospace program tooling when certain criteria for deferral are met. Aerospace program tooling is amortized over the expected number of aircraft to be produced, beginning on the date of completion of the first aircraft of a program, and an impairment test is performed at least annually for aircraft programs under development and for specific programs when there is an indication that the asset may be impaired. An impairment charge is recorded when the recoverable amount of a group of assets generating independent cash inflows (a CGU) is less than the carrying value of those assets. The recoverable amounts of aerospace CGUs are based on fair value less costs of disposal, generally determined using a discounted cash flow model.
If key estimates change significantly, amortization expense may be understated or capitalized costs may not be recoverable and aerospace program tooling may be overstated.
Aerospace program tooling amortization and the calculation of recoverable amounts used in impairment testing require estimates of the expected number of aircraft to be delivered over the life of each program. The expected number of aircraft is based on management’s aircraft market forecasts and our expected share of each market. Such estimates are reviewed in detail as part of the budget and strategic plan process. For purposes of impairment testing, we exercise judgment to identify independent cash inflows to identify CGUs by family of aircraft. Other key estimates used to determine the recoverable amount include the applicable discount rate, the expected future cash flows over the remaining life of each program, which include costs to complete the development activities, if any, as well as potential upgrades and derivatives expected over the life of the program. The estimated cost of potential upgrades and derivatives is based on past experience with previous programs. The expected future cash flows also include cash flows from aftermarket activities, as well as expected cost savings due to synergies from the perspective of a market participant.
The discount rate is based on a weighted average cost of capital calculated using market-based inputs, available directly from financial markets or based on a benchmark sampling of representative publicly-traded companies in the aerospace sector. The recoverable amounts were established during the fourth quarter of 2016, using a post-tax discount rate of 10.0%.
The estimated future cash flows for the first five years are based on the budget and strategic plan. After the initial five years, long-range forecasts prepared by management are used. Forecast future cash flows are based on management’s best estimate of future sales under existing firm orders, expected future orders, timing of payments based on expected delivery schedules, revenues from related services, procurement costs based on existing contracts with suppliers, labour costs, general market conditions, foreign exchange rates and applicable income tax rates.
Given that an annual impairment test is required for aircraft programs under development, an assessment was prepared for the Global 7000 and Global 8000 aircraft program and we concluded there was no impairment.
Since the C Series aircraft program recently entered into service and given that a significant impairment charge was recorded in 2015, an assessment was prepared again this year and we concluded there was no impairment.
In 2015, we recorded significant impairment charges related to multiple aircraft programs. Based on our 2016 annual assessment, there is no indication that previously recognized impairment losses may no longer exist or may have decreased.
Sensitivity analysis The following analyses are presented in isolation from one another, i.e. all other estimates left unchanged:
A 10% decrease, evenly distributed over future periods, in the expected future net cash inflows for the Global 7000 and Global 8000 aircraft program and the C Series aircraft program would not have resulted in an impairment charge in fiscal year 2016.

BOMBARDIER INC. / 2016 FINANCIAL REPORT / OTHER 121
An increase of 100-basis points in the discount rate used to perform the impairment tests would not have resulted in an impairment charge in fiscal year 2016 for the Global 7000 and Global 8000 aircraft program and the C Series aircraft program.
Goodwill
Goodwill is related to the DaimlerChrysler Rail Systems GmbH (Adtranz) acquisition in May 2001. This goodwill is monitored by management at the Transportation operating segment level. An impairment assessment is performed at least annually, and whenever circumstances such as significant declines in expected sales, earnings or cash flows indicate that it is more likely than not that goodwill might be impaired. We selected the fourth quarter to perform an annual impairment assessment of goodwill.
During the fourth quarter of 2016, an impairment test was completed. The recoverable amount of the Transportation operating segment was calculated based on fair value less cost to sell using a discounted cash flow model. We did not identify any impairment.
Estimated future cash flows were based on the budget and strategic plan for the first 5 years and a growth rate of 1% was applied to derive a terminal value beyond the initial 5-year period. The post-tax discount rate is also a key estimate in the discounted cash flow model and was based on a representative weighted average cost of capital. The post-tax discount rate used to calculate the recoverable amount in fiscal year 2016 was 8.5%.
Sensitivity analysis A 100-basis point change in the post-tax discount rate would not have resulted in an impairment charge in 2016.
Valuation of deferred income tax assets
To determine the extent to which deferred income tax assets can be recognized, we estimate the amount of probable future taxable profits that will be available against which deductible temporary differences and unused tax losses can be utilized. Such estimates are made as part of the budget and strategic plan by tax jurisdiction on an undiscounted basis and are reviewed on a quarterly basis. We exercise judgment to determine the extent to which realization of future taxable benefits is probable, considering factors such as the number of years to include in the forecast period, the history of taxable profits and availability of prudent tax planning strategies. See Note 12 - Income taxes for more details.
Tax contingencies
Uncertainties exist with respect to the interpretation of complex tax regulations, changes in tax laws, and the amount and timing of future taxable income. Given the wide range of our international business relationships and the long-term nature and complexity of existing contractual agreements, differences arising between our actual results and the assumptions made, or future changes to such assumptions, could necessitate future adjustments to tax expense or recovery already recorded. We establish tax provisions for possible consequences of audits by the tax authorities of each country in which we operate. The amount of such provisions is based on various factors, such as experience from previous tax audits and differing interpretations of tax regulations by the taxable entity and the relevant tax authority. Such differences in interpretation may arise for a wide variety of issues depending on the conditions prevailing in the domicile of each legal entity.
Credit and residual value guarantees
Credit and residual value guarantees are generally provided to airlines or to participants in financing structures created in connection with the sale of commercial aircraft. A corresponding provision is recorded, measured at the amounts expected to be paid under the guarantees using an internal valuation model based on stochastic simulations.

122 BOMBARDIER INC. FINANCIAL REPORT - FISCAL YEAR ENDED DECEMBER 31, 2016
The amounts expected to be paid under the guarantees may depend on whether credit defaults occur during the term of the original financing. When a credit default occurs, the credit guarantee may be called upon. In the absence of a credit default the RVG may be triggered. In both cases, the guarantees can only be called upon if there is a loss upon the sale of the aircraft. Therefore, the value of the guarantee is in large part impacted by the future value of the underlying aircraft, as well as on the likelihood that credit or residual value guarantees will be called upon at the expiry of the financing arrangements. Aircraft residual value curves, prepared by management based on information from external appraisals and adjusted to reflect specific factors of the current aircraft market and a balanced market in the medium and long term, are used to estimate the underlying aircraft future value. The amount of the liability is also significantly impacted by the current market assumption for interest rates since payments under these guarantees are mostly expected to be made in the medium to long term. Other key estimates in calculating the value of the guarantees include default probabilities, estimated based on published credit ratings when available or, when not available, on internal assumptions regarding the credit risk of customers. The estimates are reviewed on a quarterly basis.
Sensitivity analysis The following analyses are presented in isolation from one another, i.e. all other estimates left unchanged:
Assuming a decrease of 10% in the residual value curves of all commercial aircraft as at December 31, 2016, Commercial Aircraft’s EBIT for 2016 would have been negatively impacted by $28 million.
Assuming an increase of 10% in the likelihood that residual value guarantees will be called upon at the expiry of the financing arrangements as at December 31, 2016, Commercial Aircraft’s EBIT for 2016 would have been negatively impacted by $57 million.
Assuming a 100-basis point decrease in interest rates as at December 31, 2016, Commercial Aircraft’s EBT for 2016 would have been negatively impacted by $12 million. Assuming a 100-basis point increase in interest rates as at December 31, 2016, Commercial Aircraft’s EBT for 2016 would have been positively impacted by $12 million.
Retirement and other long-term employee benefits
The actuarial valuation process used to measure pension and other post-employment benefit costs, assets and obligations is dependent on assumptions regarding discount rates, compensation and pre-retirement benefit increases, inflation rates, health-care cost trends, as well as demographic factors such as employee turnover, retirement and mortality rates. The impacts from changes in discount rates and, when significant, from key events and other circumstances, are recorded quarterly.
Discount rates are used to determine the present value of the expected future benefit payments and represent the market rates for high-quality corporate fixed-income investments consistent with the currency and the estimated term of the retirement benefit liabilities.
As the Canadian high-quality corporate bond market, as defined under IFRS, includes relatively few medium- and long-term maturity bonds, we establish the discount rate for our Canadian pension and other post-employment plans by constructing a yield curve using three maturity ranges. The first maturity range of the curve is based on observed market rates for AA-rated corporate bonds with maturities of less than six years. In the longer maturity ranges, due to the smaller number of high-quality bonds available, the curve is derived using market observations and extrapolated data. The extrapolated data points are created by adding a term-based yield spread over long-term provincial bond yields. This term-based spread is extrapolated between a base spread and a long spread. The base spread is based on the observed spreads between AA-rated corporate bonds and AA-rated provincial bonds for the 5 to 10 years to maturity range. The long spread is determined as the spread required at the point of average maturity of AA-rated provincial bonds in the 11 to 30 years to maturity range such that the average AA-rated corporate bond spread above AA-rated provincial bonds is equal to the extrapolated spread derived by applying the ratio of the observed spreads between A-rated corporate bonds and AA-rated provincial bonds for the 11 to 30 years to maturity range over the 5 to 10 years to maturity range, to the base spread. For maturities longer than the average maturity of AA-rated provincial bonds in the 11 to 30 years to maturity range, the spread is assumed to remain constant at the level of the long spread.

BOMBARDIER INC. / 2016 FINANCIAL REPORT / OTHER 123
We determine the expected rates of compensation increases considering the current salary structure, as well as historical and anticipated wage increases, in the context of current economic conditions.
See Note 22 – Retirement benefits, to the consolidated financial statements, for further details regarding assumptions used and sensitivity analysis to changes in critical actuarial assumptions.
Consolidation
We consolidate entities when, based on an evaluation of the substance of our relationship, we establish that we control the investee. We control an investee when we are exposed to, or have rights to, variable returns from our involvement with the investee and the ability to use power over the investee to affect the amount of our returns. This evaluation includes the use of judgment to determine whether rights held by NCI, such as the CDPQ’s rights in respect of BT and Investissement Québec’s rights in respect of CSALP, are protective in nature as opposed to substantive. We reassess the initial determination of control if facts or circumstances indicate that there may be changes to one or more elements of control.
From time to time, we participate in structured entities where voting rights are not the dominant factor in determining control. In these situations, we may use a variety of complex estimation processes involving both qualitative and quantitative factors to determine whether we are exposed to, or have rights to, significant variable returns. The quantitative analyses involve estimating the future cash flows and performance of the investee and analyzing the variability in those cash flows. The qualitative analyses involve consideration of factors such as the purpose and design of the investee and whether we are acting as an agent or principal. There is a significant amount of judgment exercised in evaluating the results of these analyses as well as in determining if we have power to affect the investee’s returns, including an assessment of the impact of potential voting rights, contractual agreements and de facto control.
Onerous contract provision
An onerous contract provision is recorded if it is more likely than not that the unavoidable costs of meeting the obligations under a firm contract, other than long-term contracts related to designing, engineering or manufacturing specifically designed products and service contracts for which revenue is recognized using the percentage of completion method of accounting, exceed the economic benefits expected to be received under the contract. Judgment is used to determine which costs are considered unavoidable and the calculation of the unavoidable costs require estimates of expected future costs, including anticipated future cost reductions related to performance improvements and transformation initiatives. Unavoidable costs exclude the allocation of certain indirect overheads which are included in the cost of inventories, such as amortization. As early production units in a new aircraft program require higher costs than units produced later in the program, cost estimates also depend on expected delivery schedules. The estimates are reviewed on a quarterly basis.
CDPQ investment equity and derivative liability components
The convertibles shares issued to the CDPQ contain no obligation for Bombardier to deliver cash or other financial assets to the CDPQ. Judgment was used to conclude that the CDPQ’s convertible share investment in BT Holdco is considered a compound instrument comprised of an equity component, representing the discretionary dividends and liquidation preference, and a liability component that reflects a derivative to settle the instrument by delivering a variable number of common shares of BT Holdco, as opposed to the entire instrument being characterized as a liability. We present convertible shares in equity (NCI) and derivative component as a liability.
The fair value of the convertible shares at issuance was assigned to its respective equity and derivative liability components so that no gain or loss arose from recognizing each component separately, the fair value of the derivative liability being established first and the residual amount allocated to the equity component. The liability component is remeasured quarterly using management’s best estimate of the present value of the settlement amount. Management uses an internal valuation model based on stochastic simulations to estimate the fair value of the conversion option embedded in the BT Holdco convertible shares. The fair value of the embedded conversion option is based on the difference in value between: the convertible shares’ accrued liquidation

124 BOMBARDIER INC. FINANCIAL REPORT - FISCAL YEAR ENDED DECEMBER 31, 2016
preference based on the minimum return entitlement; and the fair value of the common shares on an as converted basis. This value is dependent on Transportation meeting the performance incentives agreed upon with the CDPQ, the timing of exercise of the conversion rights and the applicable conversion rate. The simulation model generates multiple Transportation performance scenarios over the expected term of the option, using the best estimate of Transportation’s expected results over the remaining term of the instrument and a standard deviation derived from historic results. Fair value of the shares on an as-converted basis is calculated using an EBIT multiple, which is based on market data, to determine the enterprise value. The discount rate used is also determined using market data. Management uses internal assumptions to determine the term of the instrument and the future performance of Transportation, derived from the budget and strategic plan.
See Note 34 - Fair value of financial instruments for a sensitivity analysis on the variability in the fair value of the conversion option as a result of a reasonably likely change in the expected future performance of Transportation.
CONTROLS AND PROCEDURESIn compliance with the Canadian Securities Administrators’ Regulation we have filed certificates signed by the Chief Executive Officer (“CEO”) and the Chief Financial Officer (“CFO”) that, among other things, report on the design and effectiveness of disclosure controls and procedures and the design and effectiveness of internal controls over financial reporting.
Disclosure controls and procedures
The CEO and the CFO have designed disclosure controls and procedures, or have caused them to be designed under their supervision, in order to provide reasonable assurance that:• material information relating to the Corporation has been made known to them; and• information required to be disclosed in the Corporation’s filings is recorded, processed, summarized and
reported within the time periods specified in securities legislation.
An evaluation was carried out, under the supervision of the CEO and the CFO, of the design and effectiveness of our disclosure controls and procedures. Based on this evaluation, the CEO and the CFO concluded that the disclosure controls and procedures are effective.
Internal controls over financial reporting
The CEO and the CFO have also designed internal controls over financial reporting, or have caused them to be designed under their supervision, in order to provide reasonable assurance regarding the reliability of financial reporting and the preparation of financial statements for external purposes in accordance with IFRS.
An evaluation was carried out, under the supervision of the CEO and the CFO, of the design and effectiveness of our internal controls over financial reporting. Based on this evaluation, the CEO and the CFO concluded that the internal controls over financial reporting are effective, using the criteria set forth by the Committee of Sponsoring Organizations of the Treadway Commission (COSO) on Internal Control – Integrated Framework (2013 Framework).
Changes in internal controls over financial reporting
No changes were made to our internal controls over financial reporting that occurred during the quarter and fiscal year ended December 31, 2016 that have materially affected, or are reasonably likely to materially affect, our internal controls over financial reporting.

BOMBARDIER INC. / 2016 FINANCIAL REPORT / OTHER 125
FOREIGN EXCHANGE RATESWe are subject to currency fluctuations from the translation of revenues, expenses, assets and liabilities of foreign operations with non-U.S. dollar functional currencies, mainly the euro, pound sterling and other European currencies, and from transactions denominated in foreign currencies, mainly the Canadian dollar and pound sterling.
The foreign exchange rates used to translate assets and liabilities into U.S. dollars were as follows, as at:
December 31, 2016 December 31, 2015 Increase/(Decrease)Euro 1.0541 1.0887 (3%)Canadian dollar 0.7430 0.7202 3%Pound sterling 1.2312 1.4833 (17%)
The average foreign exchange rates used to translate revenues and expenses into U.S. dollars were as follows, for the fourth quarters ended:
December 31, 2016 December 31, 2015 DecreaseEuro 1.0812 1.0954 (1%)Canadian dollar 0.7497 0.7501 0%Pound sterling 1.2416 1.5176 (18%)
The average foreign exchange rates used to translate revenues and expenses into U.S. dollars were as follows, for the fiscal years ended:
December 31, 2016 December 31, 2015 DecreaseEuro 1.1072 1.1092 0%Canadian dollar 0.7549 0.7838 (4%)Pound sterling 1.3561 1.5280 (11%)

126 BOMBARDIER INC. FINANCIAL REPORT - FISCAL YEAR ENDED DECEMBER 31, 2016
SHAREHOLDER INFORMATION
Authorized, issued and outstanding share data, as at February 14, 2017
AuthorizedIssued and
outstandingClass A Shares (multiple voting)(1) 3,592,000,000 313,900,550Class B Shares (subordinate voting)(2) 3,592,000,000 1,879,142,745 (3)
Series 2 Cumulative Redeemable Preferred Shares 12,000,000 9,692,521Series 3 Cumulative Redeemable Preferred Shares 12,000,000 2,307,479Series 4 Cumulative Redeemable Preferred Shares 9,400,000 9,400,000
(1) Ten votes each, convertible at the option of the holder into one Class B Subordinate Voting Share.(2) Convertible at the option of the holder into one Class A Share under certain conditions.(3) Net of 53,533,118 Class B Subordinate Voting Shares purchased and held in trust in connection with the PSU and RSU plans.
Warrant, share option, PSU, DSU and RSU data as at December 31, 2016Warrants issued and outstanding 205,851,872Options issued and outstanding under the share option plans 97,039,186PSUs, DSUs and RSUs issued and outstanding under the PSU, DSU and RSU plans 64,061,479Class B Subordinate Voting Shares held in trust to satisfy PSU and RSU obligations 53,533,118
InformationBombardier Inc.Investor Relations800 René-Lévesque Blvd. WestMontréal, Québec, Canada H3B 1Y8Telephone: +1 514 861 9481, extension 13273Fax: +1 514 861 2420Email: [email protected]
Additional information relating to the Corporation, including the annual information form, are available on SEDAR at sedar.com or on Bombardier’s dedicated investor relations website at ir.bombardier.com.
Global 7000 and Global 8000 aircraft program is currently in development, and as such is subject to changes in family strategy, branding, capacity, performance, design and/or systems. All specifications and data are approximate, may change without notice and are subject to certain operating rules, assumptions and other conditions. This document does not constitute an offer, commitment, representation, guarantee or warranty of any kind.
ALP, AVENTRA, BiLevel, Bombardier, Challenger, Challenger 300, Challenger 350, Challenger 605, Challenger 650, Challenger 850, CITYFLO, CRJ, CRJ200, CRJ700, CRJ900, CRJ1000, CRJ Series, C Series, CS100, CS300, EBI, ELECTROSTAR, FlexCare, FLEXITY, FLEXX, Global, Global 5000, Global 6000, Global 7000, Global 8000, INNOVIA, INTERFLO, Learjet, Learjet 70, Learjet 75, Learjet 85, MITRAC, MOVIA, OMNEO, OPTIFLO, Parts Express, Q400, Q Series, REGINA, Smart Parts, Smart Parts Plus, Smart Parts Maintenance Plus, Smart Parts Preferred, Smart Services, SPACIUM, TALENT, TRAXX, TWINDEXX, WAKO and ZEFIRO are trademarks of Bombardier Inc. or its subsidiaries.
The printed version of this financial report uses Rolland Opaque paper, containing 30% post-consumer fibres, certified Eco-Logo, processed chlorine free. Using this paper, instead of virgin paper, saves the equivalent of 58 mature trees, 2,574 kg of waste, 23,577 kg of CO2 emissions (equivalent to the annual emissions of 8 cars) and 210,008 litres of water.
Bombardier Inc., 800 René-Lévesque Blvd. West, Montréal, Québec, Canada H3B 1Y8Telephone: +1 514 861 9481; fax: +1 514 861 2420; website: bombardier.com
Un exemplaire en français est disponible sur demande adressée auprès du service des Relations avec les investisseurs ou sur le site Internet de la Société dédié aux relations avec les investisseurs, à l’adresse ri.bombardier.com.

BOMBARDIER INC. / 2016 FINANCIAL REPORT / OTHER 127
SELECTED FINANCIAL INFORMATION
The following selected financial information has been derived from, and should be read in conjunction with, the consolidated financial statements for fiscal years ended December 31, 2016, 2015 and 2014.
The following table provides selected financial information for the last three fiscal years.
Fiscal years ended December 31 2016 2015 2014Revenues $ 16,339 $ 18,172 $ 20,111Net income (loss) attributable to equity holders of Bombardier Inc. $ (1,022) $ (5,347) $ (1,260)
EPS (in dollars)Basic and diluted $ (0.48) $ (2.58) $ (0.74)
Cash dividends declared per share (in Canadian dollars)Class A Shares (multiple voting) $ — $ — $ 0.10Class B Shares (subordinate voting) $ — $ — $ 0.10Series 2 Preferred Shares $ 0.68 $ 0.70 $ 0.75Series 3 Preferred Shares $ 0.78 $ 0.78 $ 0.78Series 4 Preferred Shares $ 1.56 $ 1.56 $ 1.56
As at December 31 2016 2015 2014Total assets $ 22,826 $ 22,903 $ 27,614Non-current financial liabilities $ 9,737 $ 9,527 $ 8,229
The quarterly data table is shown hereafter.
February 15, 2017
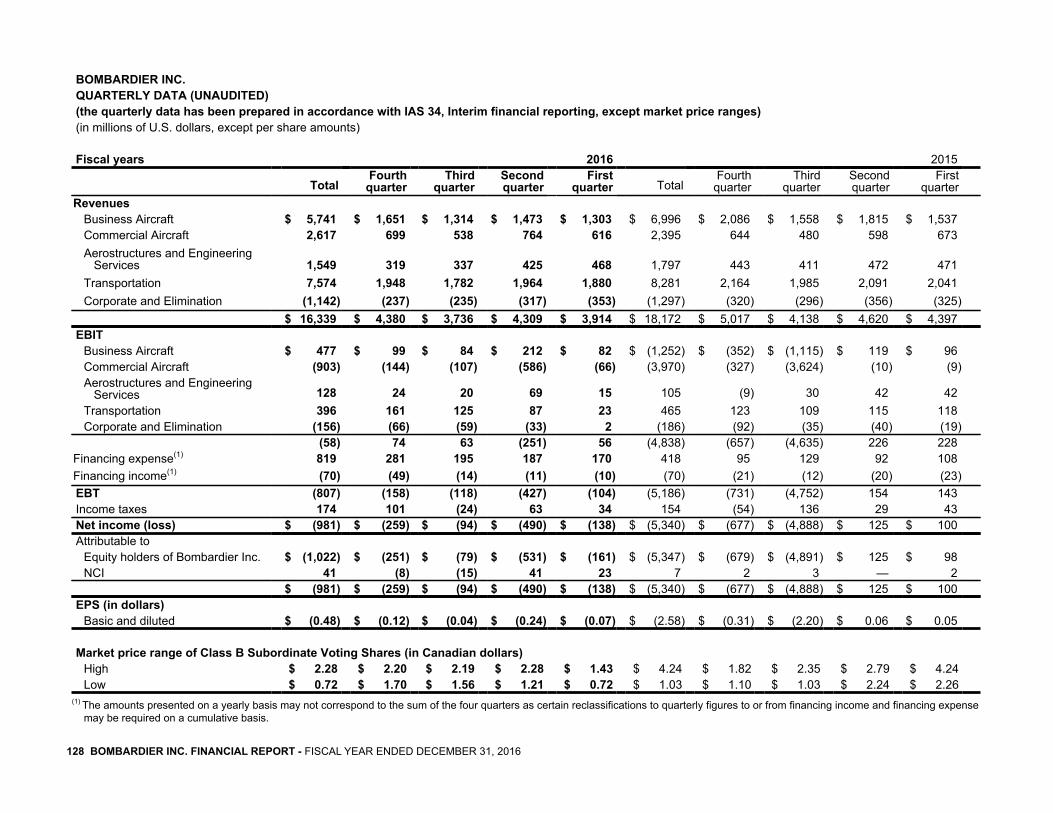
128 BOMBARDIER INC. FINANCIAL REPORT - FISCAL YEAR ENDED DECEMBER 31, 2016
BOMBARDIER INC.QUARTERLY DATA (UNAUDITED)(the quarterly data has been prepared in accordance with IAS 34, Interim financial reporting, except market price ranges)(in millions of U.S. dollars, except per share amounts)
Fiscal years 2016 2015
TotalFourth
quarterThird
quarterSecondquarter
Firstquarter Total
Fourthquarter
Thirdquarter
Secondquarter
Firstquarter
Revenues
Business Aircraft $ 5,741 $ 1,651 $ 1,314 $ 1,473 $ 1,303 $ 6,996 $ 2,086 $ 1,558 $ 1,815 $ 1,537Commercial Aircraft 2,617 699 538 764 616 2,395 644 480 598 673Aerostructures and Engineering Services 1,549 319 337 425 468 1,797 443 411 472 471Transportation 7,574 1,948 1,782 1,964 1,880 8,281 2,164 1,985 2,091 2,041Corporate and Elimination (1,142) (237) (235) (317) (353) (1,297) (320) (296) (356) (325)
$ 16,339 $ 4,380 $ 3,736 $ 4,309 $ 3,914 $ 18,172 $ 5,017 $ 4,138 $ 4,620 $ 4,397EBIT
Business Aircraft $ 477 $ 99 $ 84 $ 212 $ 82 $ (1,252) $ (352) $ (1,115) $ 119 $ 96Commercial Aircraft (903) (144) (107) (586) (66) (3,970) (327) (3,624) (10) (9)Aerostructures and Engineering Services 128 24 20 69 15 105 (9) 30 42 42Transportation 396 161 125 87 23 465 123 109 115 118Corporate and Elimination (156) (66) (59) (33) 2 (186) (92) (35) (40) (19)
(58) 74 63 (251) 56 (4,838) (657) (4,635) 226 228Financing expense(1) 819 281 195 187 170 418 95 129 92 108Financing income(1) (70) (49) (14) (11) (10) (70) (21) (12) (20) (23)EBT (807) (158) (118) (427) (104) (5,186) (731) (4,752) 154 143Income taxes 174 101 (24) 63 34 154 (54) 136 29 43Net income (loss) $ (981) $ (259) $ (94) $ (490) $ (138) $ (5,340) $ (677) $ (4,888) $ 125 $ 100Attributable to
Equity holders of Bombardier Inc. $ (1,022) $ (251) $ (79) $ (531) $ (161) $ (5,347) $ (679) $ (4,891) $ 125 $ 98NCI 41 (8) (15) 41 23 7 2 3 — 2
$ (981) $ (259) $ (94) $ (490) $ (138) $ (5,340) $ (677) $ (4,888) $ 125 $ 100EPS (in dollars)
Basic and diluted $ (0.48) $ (0.12) $ (0.04) $ (0.24) $ (0.07) $ (2.58) $ (0.31) $ (2.20) $ 0.06 $ 0.05
Market price range of Class B Subordinate Voting Shares (in Canadian dollars)High $ 2.28 $ 2.20 $ 2.19 $ 2.28 $ 1.43 $ 4.24 $ 1.82 $ 2.35 $ 2.79 $ 4.24Low $ 0.72 $ 1.70 $ 1.56 $ 1.21 $ 0.72 $ 1.03 $ 1.10 $ 1.03 $ 2.24 $ 2.26
(1) The amounts presented on a yearly basis may not correspond to the sum of the four quarters as certain reclassifications to quarterly figures to or from financing income and financing expense may be required on a cumulative basis.
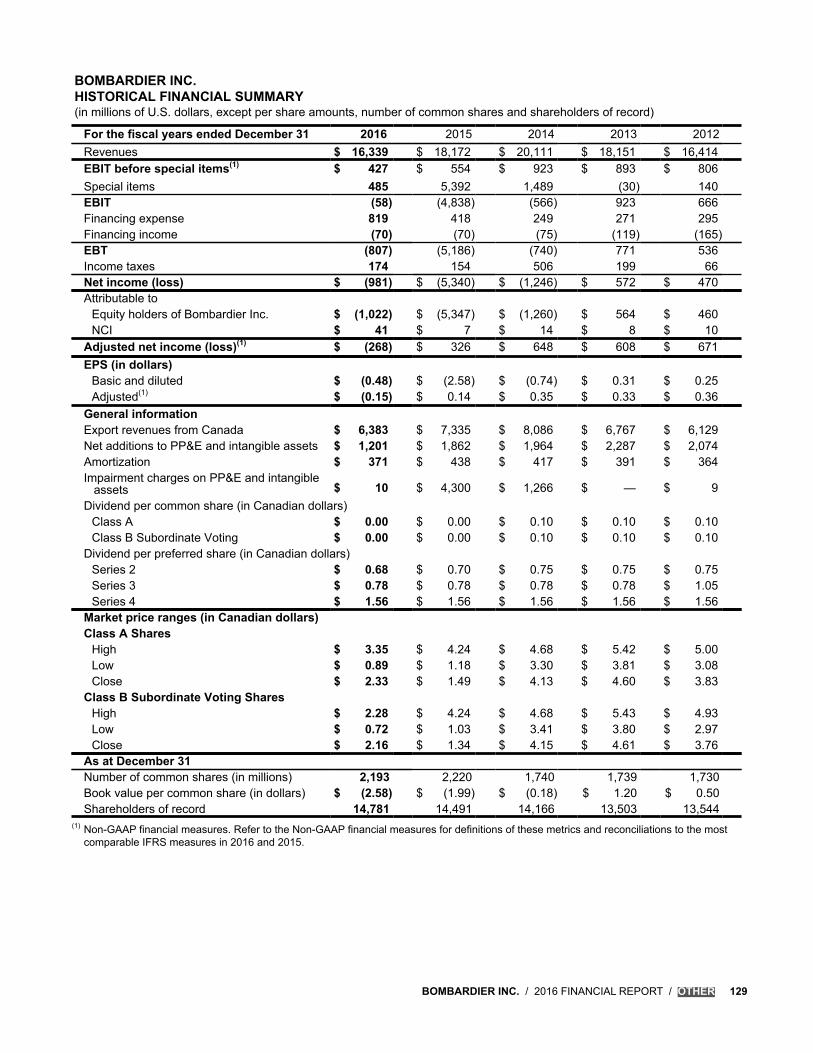
BOMBARDIER INC. / 2016 FINANCIAL REPORT / OTHER 129
BOMBARDIER INC.HISTORICAL FINANCIAL SUMMARY(in millions of U.S. dollars, except per share amounts, number of common shares and shareholders of record)
For the fiscal years ended December 31 2016 2015 2014 2013 2012Revenues $ 16,339 $ 18,172 $ 20,111 $ 18,151 $ 16,414EBIT before special items(1) $ 427 $ 554 $ 923 $ 893 $ 806Special items 485 5,392 1,489 (30) 140EBIT (58) (4,838) (566) 923 666Financing expense 819 418 249 271 295Financing income (70) (70) (75) (119) (165)EBT (807) (5,186) (740) 771 536Income taxes 174 154 506 199 66Net income (loss) $ (981) $ (5,340) $ (1,246) $ 572 $ 470Attributable to
Equity holders of Bombardier Inc. $ (1,022) $ (5,347) $ (1,260) $ 564 $ 460NCI $ 41 $ 7 $ 14 $ 8 $ 10
Adjusted net income (loss)(1) $ (268) $ 326 $ 648 $ 608 $ 671EPS (in dollars)
Basic and diluted $ (0.48) $ (2.58) $ (0.74) $ 0.31 $ 0.25Adjusted(1) $ (0.15) $ 0.14 $ 0.35 $ 0.33 $ 0.36
General informationExport revenues from Canada $ 6,383 $ 7,335 $ 8,086 $ 6,767 $ 6,129Net additions to PP&E and intangible assets $ 1,201 $ 1,862 $ 1,964 $ 2,287 $ 2,074Amortization $ 371 $ 438 $ 417 $ 391 $ 364Impairment charges on PP&E and intangible assets $ 10 $ 4,300 $ 1,266 $ — $ 9Dividend per common share (in Canadian dollars)
Class A $ 0.00 $ 0.00 $ 0.10 $ 0.10 $ 0.10Class B Subordinate Voting $ 0.00 $ 0.00 $ 0.10 $ 0.10 $ 0.10
Dividend per preferred share (in Canadian dollars)Series 2 $ 0.68 $ 0.70 $ 0.75 $ 0.75 $ 0.75Series 3 $ 0.78 $ 0.78 $ 0.78 $ 0.78 $ 1.05Series 4 $ 1.56 $ 1.56 $ 1.56 $ 1.56 $ 1.56
Market price ranges (in Canadian dollars)Class A Shares
High $ 3.35 $ 4.24 $ 4.68 $ 5.42 $ 5.00Low $ 0.89 $ 1.18 $ 3.30 $ 3.81 $ 3.08Close $ 2.33 $ 1.49 $ 4.13 $ 4.60 $ 3.83
Class B Subordinate Voting SharesHigh $ 2.28 $ 4.24 $ 4.68 $ 5.43 $ 4.93Low $ 0.72 $ 1.03 $ 3.41 $ 3.80 $ 2.97Close $ 2.16 $ 1.34 $ 4.15 $ 4.61 $ 3.76
As at December 31Number of common shares (in millions) 2,193 2,220 1,740 1,739 1,730Book value per common share (in dollars) $ (2.58) $ (1.99) $ (0.18) $ 1.20 $ 0.50Shareholders of record 14,781 14,491 14,166 13,503 13,544
(1) Non-GAAP financial measures. Refer to the Non-GAAP financial measures for definitions of these metrics and reconciliations to the most comparable IFRS measures in 2016 and 2015.

130 BOMBARDIER INC. FINANCIAL REPORT - FISCAL YEAR ENDED DECEMBER 31, 2016
BOMBARDIER INC.HISTORICAL FINANCIAL SUMMARY (CONTINUED)CONSOLIDATED STATEMENTS OF FINANCIAL POSITION
As at December 31 2016 2015 2014 2013 2012AssetsCash and cash equivalents $ 3,384 $ 2,720 $ 2,489 $ 3,397 $ 2,557Trade and other receivables 1,291 1,473 1,538 1,492 1,311Inventories 5,844 6,978 7,970 8,234 7,540Other financial assets 336 450 530 637 443Other assets 441 484 592 626 564Current assets 11,296 12,105 13,119 14,386 12,415
PP&E 1,949 2,061 2,092 2,066 1,933Aerospace program tooling 5,174 3,975 6,823 6,606 4,770Goodwill 1,855 1,978 2,127 2,381 2,316Deferred income taxes 705 761 875 1,231 1,421Investments in joint ventures and associates 332 356 294 318 311Other financial assets 915 870 1,328 1,568 1,339Other assets 600 797 956 807 670Non-current assets 11,530 10,798 14,495 14,977 12,760
$ 22,826 $ 22,903 $ 27,614 $ 29,363 $ 25,175LiabilitiesTrade and other payables $ 3,239 $ 4,040 $ 4,216 $ 4,089 $ 3,310Provisions 822 1,108 990 881 1,000Advances and progress billings in excess of long-term contract inventories 1,539 1,408 1,698 2,352 1,763Advances on aerospace programs 1,550 2,002 3,339 3,228 3,053Other financial liabilities 608 991 1,010 1,009 455Other liabilities 2,175 2,274 2,182 2,227 2,212Current liabilities 9,933 11,823 13,435 13,786 11,793
Provisions 1,444 918 562 584 608Advances on aerospace programs 1,535 1,534 1,608 1,688 1,600Long-term debt 8,738 8,908 7,627 6,988 5,360Retirement benefits 2,647 2,159 2,629 2,161 2,999Other financial liabilities 999 619 602 717 601Other liabilities 1,019 996 1,096 990 957Non-current liabilities 16,382 15,134 14,124 13,128 12,125
26,315 26,957 27,559 26,914 23,918Equity (deficit)Attributable to equity holders of Bombardier Inc. (5,243) (4,067) 42 2,426 1,211Attributable to NCI 1,754 13 13 23 46
(3,489) (4,054) 55 2,449 1,257$ 22,826 $ 22,903 $ 27,614 $ 29,363 $ 25,175

BOMBARDIER INC. FINANCIAL REPORT - FISCAL YEAR ENDED DECEMBER 31, 2016 - FINANCIAL STATEMENTS 131
BOMBARDIER INC.CONSOLIDATED FINANCIAL STATEMENTS
For the fiscal years endedDecember 31, 2016 and 2015
132 BOMBARDIER INC. FINANCIAL REPORT - FISCAL YEAR ENDED DECEMBER 31, 2016
MANAGEMENT’S RESPONSIBILITY FOR FINANCIAL REPORTING
The consolidated financial statements and MD&A of Bombardier Inc. and all other information in the financial report are the responsibility of management and have been reviewed and approved by the Board of Directors.
The consolidated financial statements have been prepared by management in accordance with IFRS as issued by the International Accounting Standards Board. The MD&A has been prepared in accordance with the requirements of Canadian Securities Administrators. The financial statements and MD&A include items that are based on best estimates and judgments of the expected effects of current events and transactions. Management has determined such items on a reasonable basis in order to ensure that the financial statements and MD&A are presented fairly in all material respects. Financial information presented in the MD&A is consistent with that in the consolidated financial statements.
Bombardier Inc.’s Chief Executive Officer (CEO) and Chief Financial Officer (CFO) have designed disclosure controls and procedures and internal controls over financial reporting, or have caused them to be designed under their supervision, to provide reasonable assurance that material information relating to Bombardier Inc. has been made known to them; and information required to be disclosed in Bombardier Inc.’s filings is recorded, processed, summarized and reported within the time periods specified in Canadian securities legislation.
Bombardier Inc.’s CEO and CFO have also evaluated the effectiveness of Bombardier Inc.’s disclosure controls and procedures and internal controls over financial reporting as of the end of the fiscal year 2016. Based on this evaluation, the CEO and the CFO concluded that the disclosure controls and procedures and internal controls over financial reporting were effective as of that date, using the criteria set forth by the Committee of Sponsoring Organizations of the Treadway Commission (COSO) on Internal Control – Integrated Framework (2013 framework). In addition, based on this assessment, they determined that there were no material weaknesses in internal control over financial reporting as of the end of the fiscal year 2016. In compliance with the Canadian Securities Administrators’ National Instrument 52-109, Bombardier Inc.’s CEO and CFO have provided a certification related to Bombardier Inc.’s annual disclosure to the Canadian Securities Administrators, including the consolidated financial statements and MD&A.
The Board of Directors is responsible for ensuring that management fulfills its responsibilities for financial reporting and is ultimately responsible for reviewing and approving the consolidated financial statements and MD&A. The Board of Directors carries out this responsibility principally through its Audit Committee.
The Audit Committee is appointed by the Board of Directors and is comprised entirely of independent and financially literate directors. The Audit Committee meets periodically with management, as well as with the internal and independent auditors, to review the consolidated financial statements, independent auditors’ report, MD&A, auditing matters and financial reporting issues, to discuss internal controls over the financial reporting process, and to satisfy itself that each party is properly discharging its responsibilities. In addition, the Audit Committee has the duty to review the appropriateness of the accounting policies and significant estimates and judgments underlying the consolidated financial statements as presented by management, and to review and make recommendations to the Board of Directors with respect to the independence and the fees of the independent auditors. The Audit Committee reports its findings to the Board of Directors for its consideration when it approves the consolidated financial statements and MD&A for issuance to shareholders.
The consolidated financial statements have been audited by Ernst & Young LLP, the independent auditors, in accordance with Canadian generally accepted auditing standards on behalf of the shareholders. The independent auditors have full and free access to the Audit Committee to discuss their audit and related matters.
Alain Bellemare John Di Bert, CPA, CA President and Chief Executive Officer Senior Vice President and Chief Financial Officer
February 15, 2017

BOMBARDIER INC. FINANCIAL REPORT - FISCAL YEAR ENDED DECEMBER 31, 2016 - AUDITORS’ REPORT 133
INDEPENDENT AUDITORS’ REPORT
TO THE SHAREHOLDERS OF BOMBARDIER INC.
We have audited the accompanying consolidated financial statements of Bombardier Inc. which comprise the consolidated statements of financial position as at December 31, 2016, 2015 and January 1, 2015, and the consolidated statements of income, comprehensive income, changes in equity and cash flows for fiscal years ended December 31, 2016 and 2015, and a summary of significant accounting policies and other explanatory information.
Management’s Responsibility for the consolidated financial statements Management is responsible for the preparation and fair presentation of these consolidated financial statements in accordance with International Financial Reporting Standards, as issued by the International Accounting Standards Board, and for such internal control as Management determines is necessary to enable the preparation of consolidated financial statements that are free from material misstatement, whether due to fraud or error.
Auditors’ Responsibility Our responsibility is to express an opinion on these consolidated financial statements based on our audits. We conducted our audits in accordance with Canadian generally accepted auditing standards. Those standards require that we comply with ethical requirements and plan and perform the audit to obtain reasonable assurance about whether the consolidated financial statements are free from material misstatement.
An audit involves performing procedures to obtain audit evidence about the amounts and disclosures in the consolidated financial statements. The procedures selected depend on the auditors’ judgment, including the assessment of the risks of material misstatement of the consolidated financial statements, whether due to fraud or error. In making those risk assessments, the auditors consider internal control relevant to the entity’s preparation and fair presentation of the consolidated financial statements in order to design audit procedures that are appropriate in the circumstances, but not for the purpose of expressing an opinion on the effectiveness of the entity’s internal control. An audit also includes evaluating the appropriateness of accounting policies used and the reasonableness of accounting estimates made by Management, as well as evaluating the overall presentation of the consolidated financial statements. We believe that the audit evidence we have obtained in our audits is sufficient and appropriate to provide a basis for our audit opinion.
Opinion In our opinion, the consolidated financial statements present fairly, in all material respects, the financial position of Bombardier Inc. as at December 31, 2016, 2015 and January 1, 2015, and its financial performance and its cash flows for fiscal years ended December 31, 2016 and 2015 in accordance with International Financial Reporting Standards, as issued by the International Accounting Standards Board.
(1)
Ernst & Young LLPMontréal, Canada
February 15, 2017
(1) CPA auditor, CA, public accountancy permit no. A112431

134 BOMBARDIER INC. FINANCIAL REPORT - FISCAL YEAR ENDED DECEMBER 31, 2016
CONSOLIDATED FINANCIAL STATEMENTSFor fiscal years 2016 and 2015 (Tabular figures are in millions of U.S. dollars, unless otherwise indicated)
Consolidated financial statementsNotes to the consolidated financial statements1. BASIS OF PREPARATION2. SUMMARY OF SIGNIFICANT ACCOUNTING POLICIES3. FUTURE CHANGES IN ACCOUNTING POLICIES4. USE OF ESTIMATES AND JUDGMENT5. SEGMENT DISCLOSURE6. RESEARCH AND DEVELOPMENT7. OTHER INCOME8. SPECIAL ITEMS9. FINANCING EXPENSE AND FINANCING INCOME10. NON-CONTROLLING INTEREST11. EMPLOYEE BENEFITS COSTS12. INCOME TAXES13. EARNINGS PER SHARE14. FINANCIAL INSTRUMENTS15. CASH AND CASH EQUIVALENTS16. TRADE AND OTHER RECEIVABLES17. INVENTORIES18. OTHER FINANCIAL ASSETS19. OTHER ASSETS20. PROPERTY, PLANT AND EQUIPMENT21. INTANGIBLE ASSETS22. RETIREMENT BENEFITS23. TRADE AND OTHER PAYABLES24. PROVISIONS25. OTHER FINANCIAL LIABILITIES26. OTHER LIABILITIES27. LONG-TERM DEBT28. SHARE CAPITAL29. SHARE-BASED PLANS30. NET CHANGE IN NON-CASH BALANCES31. CREDIT FACILITIES32. CAPITAL MANAGEMENT33. FINANCIAL RISK MANAGEMENT34. FAIR VALUE OF FINANCIAL INSTRUMENTS35. INVESTMENTS IN JOINT VENTURES AND ASSOCIATES36. TRANSACTIONS WITH RELATED PARTIES37. UNCONSOLIDATED STRUCTURED ENTITIES38. COMMITMENTS AND CONTINGENCIES
136141141141152154159162163163165166169170172172175175176177178179180182191192193193194195198201201203204208212212213213

BOMBARDIER INC. FINANCIAL REPORT - FISCAL YEAR ENDED DECEMBER 31, 2016 - FINANCIAL STATEMENTS 135
The following table shows the abbreviations used in the consolidated financial statements.
Term Description Term DescriptionAFS Available for sale FVTP&L Fair value through profit and lossBPS Basis points HFT Held for tradingCCTD Cumulative currency translation difference IAS International Accounting Standard(s)CDPQ Caisse de dépôt et placement du Québec IASB International Accounting Standards BoardCGU Cash generating unit IFRS International Financial Reporting Standard(s)CSALP C Series Aircraft Limited Partnership L&R Loans and receivablesDB Defined benefit MD&A Management’s discussion and analysisDC Defined contribution NCI Non-controlling interestsDDHR Derivative designated in a hedge relationship OCI Other comprehensive income (loss)DSU Deferred share unit PP&E Property, plant and equipmentEBIT Earnings (loss) before financing expense, financing
income and income taxesPSG Performance security guaranteePSU Performance share unit
EBITDA Earnings (loss) before financing expense, financingincome, income taxes, amortization and impairmentcharges on PP&E and intangible assets
R&D Research and developmentRSU Restricted share unitRVG Residual value guarantee
EBT Earnings (loss) before income taxes SG&A Selling, general and administrativeEIS Entry-into-service U.K. United KingdomEPS Earnings (loss) per share attributable to equity
holders of Bombardier Inc.U.S. United States of America

BOMBARDIER INC. FINANCIAL REPORT - FISCAL YEAR ENDED DECEMBER 31, 2016 - FINANCIAL STATEMENTS 136
BOMBARDIER INC.CONSOLIDATED STATEMENTS OF INCOMEFor the fiscal years ended December 31(in millions of U.S. dollars, except per share amounts)
Notes 2016 2015Revenues $ 16,339 $ 18,172Cost of sales 17 14,622 16,199Gross margin 1,717 1,973SG&A 1,133 1,213R&D 6 287 355Share of income of joint ventures and associates 35 (126) (149)Other income 7 (4) —Special items 8 485 5,392EBIT (58) (4,838)Financing expense 9 819 418Financing income 9 (70) (70)EBT (807) (5,186)Income taxes 12 174 154Net loss $ (981) $ (5,340)Attributable to
Equity holders of Bombardier Inc. $ (1,022) $ (5,347)NCI 41 7
$ (981) $ (5,340)EPS (in dollars) 13
Basic and diluted $ (0.48) $ (2.58)
The notes are an integral part of these consolidated financial statements.

BOMBARDIER INC. FINANCIAL REPORT - FISCAL YEAR ENDED DECEMBER 31, 2016 - FINANCIAL STATEMENTS 137
BOMBARDIER INC.CONSOLIDATED STATEMENTS OF COMPREHENSIVE INCOMEFor the fiscal years ended December 31(in millions of U.S. dollars)
Notes 2016 2015Net loss $ (981) $ (5,340)OCI
Items that may be reclassified to net incomeNet change in cash flow hedges
Foreign exchange re-evaluation (3) 12Net gain (loss) on derivative financial instruments 26 (508)Reclassification to income or to the related non-financial asset(1)(2) 310 449Income taxes 12 (82) (6)
251 (53)AFS financial assets
Net unrealized loss (1) (5)CCTD
Net investments in foreign operations (178) (94)Net gain on related hedging items — 2
(178) (92)Items that are never reclassified to net income
Retirement benefitsRemeasurement of defined benefit plans(3) (755) 592Income taxes 12 73 (11)
(682) 581Total OCI (610) 431Total comprehensive loss $ (1,591) $ (4,909)Attributable to
Equity holders of Bombardier Inc. $ (1,564) $ (4,914)NCI (27) 5
$ (1,591) $ (4,909)(1) Includes $252 million of loss reclassified to the related non-financial asset for fiscal year 2016 ($327 million of loss for fiscal year 2015).(2) $76 million of net deferred gain is expected to be reclassified from OCI to the carrying amount of the related non-financial asset or to income
during fiscal year 2017.(3) Includes net actuarial gains (losses).
The notes are an integral part of these consolidated financial statements.

BOMBARDIER INC. FINANCIAL REPORT - FISCAL YEAR ENDED DECEMBER 31, 2016 - FINANCIAL STATEMENTS 138
BOMBARDIER INC.CONSOLIDATED STATEMENTS OF FINANCIAL POSITIONAs at(in millions of U.S. dollars)
December 31 December 31 January 1Notes 2016 2015 2015
AssetsCash and cash equivalents 15 $ 3,384 $ 2,720 $ 2,489Trade and other receivables 16 1,291 1,473 1,538Inventories 17 5,844 6,978 7,970Other financial assets 18 336 450 530Other assets 19 441 484 592Current assets 11,296 12,105 13,119PP&E 20 1,949 2,061 2,092Aerospace program tooling 21 5,174 3,975 6,823Goodwill 21 1,855 1,978 2,127Deferred income taxes 12 705 761 875Investments in joint ventures and associates 332 356 294Other financial assets 18 915 870 1,328Other assets 19 600 797 956Non-current assets 11,530 10,798 14,495
$ 22,826 $ 22,903 $ 27,614LiabilitiesTrade and other payables 23 $ 3,239 $ 4,040 $ 4,216Provisions 24 822 1,108 990Advances and progress billings in excess of long-term contract inventories 17 1,539 1,408 1,698Advances on aerospace programs 1,550 2,002 3,339Other financial liabilities 25 608 991 1,010Other liabilities 26 2,175 2,274 2,182Current liabilities 9,933 11,823 13,435Provisions 24 1,444 918 562Advances on aerospace programs 1,535 1,534 1,608Long-term debt 27 8,738 8,908 7,627Retirement benefits 22 2,647 2,159 2,629Other financial liabilities 25 999 619 602Other liabilities 26 1,019 996 1,096Non-current liabilities 16,382 15,134 14,124
26,315 26,957 27,559Equity (deficit)Attributable to equity holders of Bombardier Inc. (5,243) (4,067) 42Attributable to NCI 10 1,754 13 13
(3,489) (4,054) 55$ 22,826 $ 22,903 $ 27,614
Commitments and contingencies 38
The notes are an integral part of these consolidated financial statements.
On behalf of the Board of Directors,
Pierre Beaudoin Sheila Fraser, FCPA, FCA Director Director

BOMBARDIER INC. FINANCIAL REPORT - FISCAL YEAR ENDED DECEMBER 31, 2016 - FINANCIAL STATEMENTS 139
BOMBARDIER INC.CONSOLIDATED STATEMENTS OF CHANGES IN EQUITYFor the fiscal years ended (in millions of U.S. dollars)
Attributable to equity holders of Bombardier Inc.
Share capitalRetained earnings
(deficit) Accumulated OCI
Preferredshares
Commonshares Warrants
Otherretainedearnings
(deficit)
Remea-surement
lossesContributed
surplus
AFSfinancial
assetsCash flow
hedges CCTD Total NCI
Totalequity
(deficit)As at January 1, 2015 $ 347 $ 1,381 $ — $ 1,151 $ (2,661) $ 92 $ 12 $ (322) $ 42 $ 42 $ 13 $ 55
Total comprehensive incomeNet income (loss) — — — (5,347) — — — — — (5,347) 7 (5,340)OCI — — — — 581 — (5) (53) (90) 433 (2) 431
— — — (5,347) 581 — (5) (53) (90) (4,914) 5 (4,909)Issuance of share capital — 822 — — — — — — — 822 — 822Dividends
Preferred shares — — — (23) — — — — — (23) — (23)Capital distribution — — — — — — — — — — (4) (4)Shares distributed - DSU plans — 1 — — — — — — — 1 — 1Shares purchased - RSU plans — (9) — — — — — — — (9) — (9)Share-based expense — — — — — 14 — — — 14 — 14Purchase of NCI — — — — — — — — — — (1) (1)
As at December 31, 2015 $ 347 $ 2,195 $ — $ (4,219) $ (2,080) $ 106 $ 7 $ (375) $ (48) $ (4,067) $ 13 $ (4,054)Total comprehensive income
Net income (loss) — — — (1,022) — — — — — (1,022) 41 (981)OCI — — — — (692) — (1) 252 (101) (542) (68) (610)
— — — (1,022) (692) — (1) 252 (101) (1,564) (27) (1,591)Issuance of warrants(1) — — 73 — — — — — — 73 — 73Issuance of NCI(1) — — — 368 — — — — — 368 1,845 2,213Dividends
Preferred shares — — — (32) — — — — — (32) — (32)Dividends to NCI — — — — — — — — — — (77) (77)Shares purchased - PSU plans — (43) — — — — — — — (43) — (43)Share-based expense — — — — — 22 — — — 22 — 22
As at December 31, 2016 $ 347 $ 2,152 $ 73 $ (4,905) $ (2,772) $ 128 $ 6 $ (123) $ (149) $ (5,243) $ 1,754 $ (3,489)(1)
Related to the convertible shares issued to the CDPQ in relation to the sale of a minority stake in Transportation, which are compound instruments, and the minority stake in the C Series Aircraft Limited Partnership issued to the Government of Québec. See Note 10 – Non-controlling interest for more details.
The notes are an integral part of these consolidated financial statements.

140 BOMBARDIER INC. FINANCIAL REPORT - FISCAL YEAR ENDED DECEMBER 31, 2016
BOMBARDIER INC.CONSOLIDATED STATEMENTS OF CASH FLOWSFor the fiscal years ended December 31(in millions of U.S. dollars)
Notes 2016 2015Operating activitiesNet loss $ (981) $ (5,340)Non-cash items
Amortization 20, 21 371 438Impairment charges on PP&E and intangible assets 8, 20, 21 10 4,300Deferred income taxes 12 31 63Gains on disposals of PP&E and intangible assets 7 (19) (3)Share of income of joint ventures and associates 35 (126) (149)Share-based expense 29 22 14Loss on repurchase of long-term debt 8 86 22
Dividends received from joint ventures and associates 141 77Net change in non-cash balances 30 602 598Cash flows from operating activities 137 20Investing activitiesAdditions to PP&E and intangible assets (1,255) (1,879)Proceeds from disposals of PP&E and intangible assets 54 17Proceeds from investment in financing structure — 150Additions to AFS investments in securities — (64)Proceeds from disposal of AFS investments in securities — 54Other 6 (12)Cash flows from investing activities (1,195) (1,734)Financing activitiesNet proceeds from issuance of long-term debt 27 1,367 2,218Repayments of long-term debt 27 (1,566) (831)Dividends paid(1) (17) (19)Purchase of Class B Shares held in trust under the PSU and RSU plans (43) (9)Net proceeds from issuance of shares 28 — 822Issuance of NCI, net of transaction costs(2) 2,418 —Dividends to NCI (77) —Other (108) (132)Cash flows from financing activities 1,974 2,049Effect of exchange rates on cash and cash equivalents (252) (104)Net increase in cash and cash equivalents 664 231Cash and cash equivalents at beginning of year 2,720 2,489Cash and cash equivalents at end of year $ 3,384 $ 2,720Supplemental information(3)(4)
Cash paid forInterest $ 565 $ 427Income taxes $ 111 $ 92
Cash received forInterest $ 20 $ 156Income taxes $ 5 $ 15
(1) Related to preferred shares. (2) Related to the convertible shares issued to the CDPQ in relation to the sale of a minority stake in Transportation, which are compound
instruments, and the minority stake in the C Series Aircraft Limited Partnership issued to the Government of Québec. See Note 10 – Non-controlling interest for more details.
(3) Amounts paid or received for interest are reflected as cash flows from operating activities, except if they were capitalized in PP&E or intangible assets, in which case they are reflected as cash flows from investing activities. Amounts paid or received for income taxes are reflected as cash flows from operating activities.
(4) Interest paid comprises interest on long-term debt after the effect of hedges, if any, excluding up-front costs paid related to the negotiation of debts or credit facilities. Interest received comprises interest received related to cash and cash equivalents, investments in securities, loans and lease receivables after the effect of hedges and the interest portion related to the settlement of an interest-rate swap, if any.
The notes are an integral part of these consolidated financial statements.

BOMBARDIER INC. FINANCIAL REPORT - FISCAL YEAR ENDED DECEMBER 31, 2016 - NOTES 141
NOTES TO THE CONSOLIDATED FINANCIAL STATEMENTSFor the fiscal years ended December 31, 2016 and 2015 (Tabular figures are in millions of U.S. dollars, unless otherwise indicated)
1. BASIS OF PREPARATION
Bombardier Inc. is incorporated under the laws of Canada. The consolidated financial statements include the accounts of Bombardier Inc. and its subsidiaries (“the Corporation” or “our” or “we”). The Corporation is a manufacturer of transportation equipment, including business and commercial aircraft, as well as major aircraft structural components, and rail transportation equipment and systems, and is a provider of related services. The Corporation carries out its operations in four distinct segments: Business Aircraft, Commercial Aircraft, Aerostructures and Engineering Services and Transportation. The main activities of the Corporation are described in Note 5 - Segment disclosure.
The Corporation’s consolidated financial statements for fiscal years 2016 and 2015 were authorized for issuance by the Board of Directors on February 15, 2017.
Statement of complianceThe Corporation’s consolidated financial statements are expressed in U.S. dollars and have been prepared in accordance with IFRS, as issued by the IASB.
2. SUMMARY OF SIGNIFICANT ACCOUNTING POLICIES
The accounting policies set out below have been applied consistently to all periods presented in these consolidated financial statements, unless otherwise stated.
Basis of consolidationSubsidiaries – Subsidiaries are fully consolidated from the date of acquisition and continue to be consolidated until the date control over the subsidiaries ceases.
The Corporation consolidates investees, including structured entities when, based on the evaluation of the substance of the relationship with the Corporation, it concludes that it controls the investees. The Corporation controls an investee when it is exposed, or has rights, to variable returns from its involvement with the investee and has the ability to affect those returns through its power over the investee.
The Corporation’s principal subsidiaries, whose revenues or assets represent more than 10% of total revenues or more than 10% of total assets of Aerospace or Transportation segments, are as follows:
Subsidiary LocationC Series Aircraft Limited Partnership CanadaBombardier Transportation GmbH GermanyBombardier Transportation (Holdings) UK Ltd U.K.Bombardier Transport France S.A.S. FranceLearjet Inc. U.S.
Revenues and assets of these subsidiaries combined with those of Bombardier Inc. totalled 66% of consolidated revenues and 75% of consolidated assets for fiscal year 2016 (70% and 74% for fiscal year 2015).

142 BOMBARDIER INC. FINANCIAL REPORT - FISCAL YEAR ENDED DECEMBER 31, 2016
Joint ventures – Joint ventures are those entities over which the Corporation exercises joint control, requiring unanimous consent of the parties sharing control of relevant activities such as, strategic financial and operating decision making and where the parties have rights to the net assets of the arrangement. The Corporation recognizes its interest in joint ventures using the equity method of accounting.
Associates – Associates are entities in which the Corporation has the ability to exercise significant influence over the financial and operating policies. Investments in associates are accounted for using the equity method of accounting.
Foreign currency translationThe consolidated financial statements are expressed in U.S. dollars, the functional currency of Bombardier Inc. The functional currency is the currency of the primary economic environment in which an entity operates. The functional currency of most foreign subsidiaries is their local currency, the euro, Pound sterling, various other European currencies and the U.S. dollar in Transportation, and mainly the U.S. dollar in the aerospace segments.
Foreign currency transactions – Transactions denominated in foreign currencies are initially recorded in the functional currency of the related entity using the exchange rates in effect at the date of the transaction. Monetary assets and liabilities denominated in foreign currencies are translated using the closing exchange rates. Any resulting exchange difference is recognized in income except for exchange differences related to retirement benefits asset and liability, as well as financial liabilities designated as hedges of the Corporation’s net investments in foreign operations, which are recognized in OCI. Non-monetary assets and liabilities denominated in foreign currencies and measured at historical cost are translated using historical exchange rates, and those measured at fair value are translated using the exchange rate in effect at the date the fair value is determined. Revenues and expenses are translated using the average exchange rates for the period or the exchange rate at the date of the transaction for significant items.
Foreign operations – Assets and liabilities of foreign operations whose functional currency is other than the U.S. dollar are translated into U.S. dollars using closing exchange rates. Revenues and expenses, as well as cash flows, are translated using the average exchange rates for the period. Translation gains or losses are recognized in OCI and are reclassified in income on disposal or partial disposal of the investment in the related foreign operation.
The exchange rates for the major currencies used in the preparation of the consolidated financial statements were as follows:
Exchange ratesas at
Average exchange ratesfor fiscal years
December 31 December 31 January 12016 2015 2015 2016 2015
Euro 1.0541 1.0887 1.2141 1.1072 1.1092Canadian dollar 0.7430 0.7202 0.8633 0.7549 0.7838Pound sterling 1.2312 1.4833 1.5587 1.3561 1.5280
Revenue recognition Long-term contracts – Revenues from long-term contracts related to designing, engineering or manufacturing specifically designed products (including rail vehicles, vehicles overhaul and signaling contracts) and service contracts are recognized using the percentage-of-completion method of accounting. The percentage of completion is generally determined by comparing the actual costs incurred to the total costs anticipated for the entire contract, excluding costs that are not representative of the measure of performance. Estimated revenues at completion are adjusted for change orders, anticipated options for additional assets, claims, performance incentives, price escalation clauses and other contract terms that provide for the adjustment of prices. If it is probable that changes in revenues will occur, and the amount can be measured reliably, they are included in estimated revenues at completion. If a contract review indicates a negative gross margin, the entire expected loss on the contract is recognized in cost of sales in the period in which the negative gross margin is identified. When the contract outcome cannot be measured reliably, revenue is recognized only to the extent that the expenses incurred are expected to be recovered.

BOMBARDIER INC. FINANCIAL REPORT - FISCAL YEAR ENDED DECEMBER 31, 2016 - NOTES 143
When a contract covers a number of products, the construction of each product is treated as a separate contract when (1) separate proposals have been submitted for each product, (2) each product has been subject to separate negotiation, and (3) the costs and revenues of each product can be identified. A group of contracts, whether with a single customer or with several customers, are treated as a single contract when (1) the group of contracts is negotiated as a single package, (2) the contracts are so closely interrelated that they are, in effect, part of a single project with an overall profit margin, and (3) the contracts are performed concurrently or in a continuous sequence. Options for additional assets are treated as a separate contract when (1) the asset differs significantly in design, technology or function from the asset or assets covered by the original contract or (2) the price of the asset is negotiated without regard to the original contract price.
Aerospace programs – Revenues from the sale of new aircraft are recognized when the aircraft has been delivered, risks and rewards of ownership have been transferred to the customer, the amount of revenue can be measured reliably, and collection of the related receivable is reasonably assured. All costs incurred or to be incurred in connection with the sale, including warranty costs and sales incentives, are charged to cost of sales or as a deduction from revenues at the time revenue is recognized.
Multiple deliverables – Sales of goods and services sometimes involve the provision of multiple components. In these cases, the Corporation determines whether the contract or arrangement contains more than one unit of accounting. When certain criteria are met, such as when the delivered item has value to the customer on a stand-alone basis, the recognition criteria are applied to the separate identifiable components of a single transaction to reflect the substance of the transaction. Conversely, two or more transactions may be considered together for revenue recognition purposes, when the commercial effect cannot be understood without reference to a series of transactions as a whole. Revenue is allocated to the separate components based on their relative fair value.
Other – Revenues from the sale of pre-owned aircraft and spare parts are recognized when the goods have been delivered, risks and rewards of ownership have been transferred to the customer, the amount of revenue can be measured reliably, and collection of the related receivable is reasonably assured.
Government assistance and refundable advancesGovernment assistance, including investment tax credits, is recognized when there is a reasonable assurance that the assistance will be received and that the Corporation will comply with all relevant conditions. Government assistance related to the acquisition of inventories, PP&E and intangible assets is recorded as a reduction of the cost of the related asset. Government assistance related to current expenses is recorded as a reduction of the related expenses.
Government refundable advances are recorded as a financial liability if there is reasonable assurance that the amount will be repaid. Government refundable advances provided to the Corporation to finance research and development activities on a risk-sharing basis are considered part of the Corporation’s operating activities and are therefore presented as cash flows from operating activities in the statement of cash flows.
Special itemsSpecial items comprise items which do not reflect the Corporation’s core performance or where their separate presentation will assist users of the consolidated financial statements in understanding the Corporation’s results for the period. Such items include, among others, the impact of restructuring charges and significant impairment charges and reversals.
Income taxesThe Corporation applies the liability method of accounting for income taxes. Deferred income tax assets and liabilities are recognized for the future income tax consequences of temporary differences between the carrying amounts of assets and liabilities and their respective tax bases, and for tax losses carried forward. Deferred income tax assets and liabilities are measured using the substantively enacted tax rates that will be in effect for the year in which the differences are expected to reverse.
Deferred income tax assets are recognized to the extent that it is probable that future taxable income will be available against which the deductible temporary differences and unused tax losses can be utilized.

144 BOMBARDIER INC. FINANCIAL REPORT - FISCAL YEAR ENDED DECEMBER 31, 2016
Deferred income tax assets and liabilities are recognized directly in income, OCI or equity based on the classification of the item to which they relate.
Earnings per shareBasic EPS is computed based on net income attributable to equity holders of Bombardier Inc. less dividends on preferred shares, including taxes, divided by the weighted-average number of Class A Shares (multiple voting) and Class B Shares (subordinate voting) outstanding during the fiscal year.
Diluted EPS are computed using the treasury stock method, giving effect to the exercise of all dilutive elements. CDPQ’s convertible share investment in BT Holdco is factored into diluted EPS by adjusting net income attributable to equity holders of Bombardier Inc. to reflect their share of Transportation’s earnings on an as converted basis. See Note 10 – Non-controlling interest for more details.
Financial instrumentsA financial instrument is any contract that gives rise to a financial asset of one party and a financial liability or equity instrument of another party. Financial assets of the Corporation include cash and cash equivalents, trade and other receivables, aircraft loans and lease receivables, investments in securities, investments in financing structures, long-term contract receivables, restricted cash and derivative financial instruments with a positive fair value. Financial liabilities of the Corporation include trade and other payables, long-term debt, short-term borrowings, lease subsidies, government refundable advances, vendor non-recurring costs, sale and leaseback obligations and derivative financial instruments with a negative fair value.
Financial instruments are recognized in the consolidated statement of financial position when the Corporation becomes a party to the contractual obligations of the instrument. On initial recognition, financial instruments are recognized at their fair value plus, in the case of financial instruments not at FVTP&L, transaction costs that are directly attributable to the acquisition or issue of financial instruments. Subsequent to initial recognition, financial instruments are measured according to the category to which they are classified, which are: a) financial instruments classified as HFT, b) financial instruments designated as FVTP&L, c) AFS financial assets, d) L&R, or e) other than HFT financial liabilities. Their classification is determined by management on initial recognition based on the purpose for their acquisition. Financial instruments are subsequently measured at amortized cost, unless they are classified as AFS or HFT or designated as FVTP&L, in which case they are subsequently measured at fair value.
A financial asset is derecognized when the rights to receive cash flows from the asset have expired, or the Corporation has transferred its rights to receive cash flows from the asset and either (a) the Corporation has transferred substantially all the risks and rewards of the asset, or (b) the Corporation has neither transferred nor retained substantially all the risks and rewards of the asset, but has transferred control of the asset.
For transactions where it is not obvious whether the Corporation has transferred or retained substantially all the risks and rewards of ownership, the Corporation performs a quantitative analysis to compare its exposure to the variability in asset cash flows before and after the transfer. Judgment is applied in determining a number of reasonably possible scenarios that reflect the expected variability in the amount and timing of net cash flows, and then in assigning each scenario a probability with greater weighting being given to those outcomes which are considered more likely to occur.
A financial liability is derecognized when the obligation under the liability is discharged or cancelled or expires. When an existing liability is replaced by another from the same creditor on substantially different terms, or the terms of the liability are substantially modified, such an exchange or modification is treated as the derecognition of the original liability and the recognition of a new liability. The difference in the respective carrying amounts is recognized in the statement of income.
a) Financial instruments classified as HFT
Cash and cash equivalents – Cash and cash equivalents consist of cash and highly liquid investments held with investment-grade financial institutions and money market funds, with maturities of three months or less from the date of acquisition.
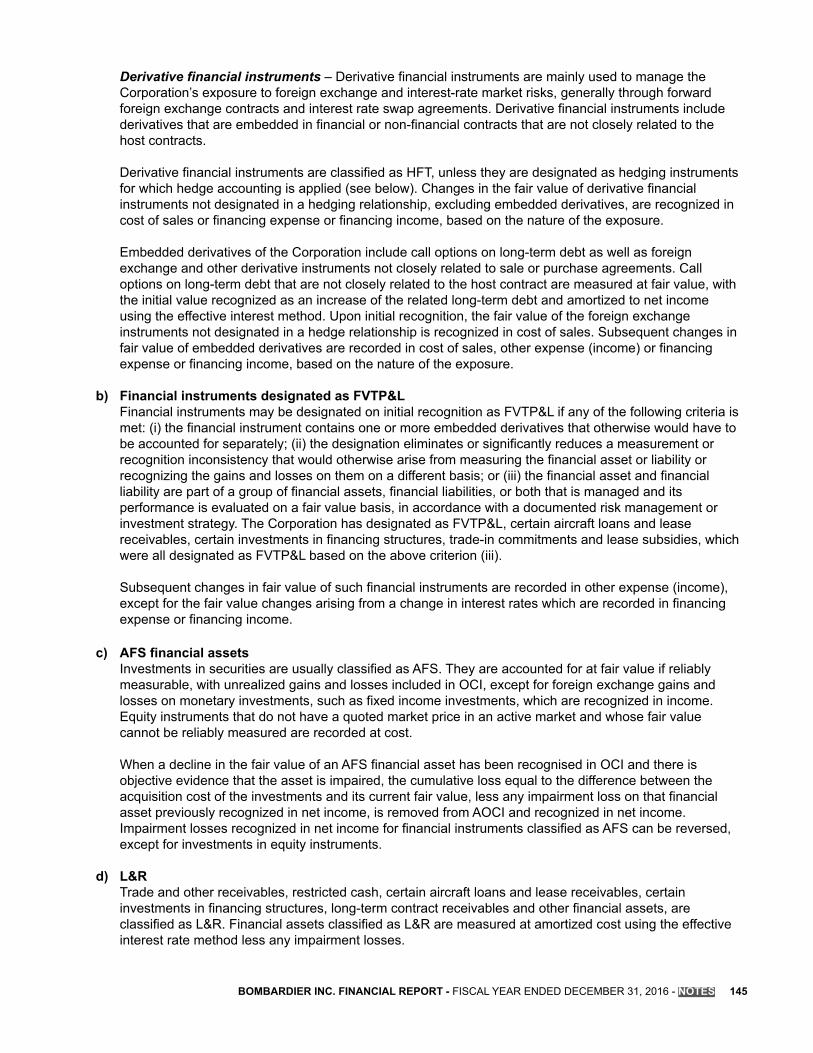
BOMBARDIER INC. FINANCIAL REPORT - FISCAL YEAR ENDED DECEMBER 31, 2016 - NOTES 145
Derivative financial instruments – Derivative financial instruments are mainly used to manage the Corporation’s exposure to foreign exchange and interest-rate market risks, generally through forward foreign exchange contracts and interest rate swap agreements. Derivative financial instruments include derivatives that are embedded in financial or non-financial contracts that are not closely related to the host contracts.
Derivative financial instruments are classified as HFT, unless they are designated as hedging instruments for which hedge accounting is applied (see below). Changes in the fair value of derivative financial instruments not designated in a hedging relationship, excluding embedded derivatives, are recognized in cost of sales or financing expense or financing income, based on the nature of the exposure.
Embedded derivatives of the Corporation include call options on long-term debt as well as foreign exchange and other derivative instruments not closely related to sale or purchase agreements. Call options on long-term debt that are not closely related to the host contract are measured at fair value, with the initial value recognized as an increase of the related long-term debt and amortized to net income using the effective interest method. Upon initial recognition, the fair value of the foreign exchange instruments not designated in a hedge relationship is recognized in cost of sales. Subsequent changes in fair value of embedded derivatives are recorded in cost of sales, other expense (income) or financing expense or financing income, based on the nature of the exposure.
b) Financial instruments designated as FVTP&LFinancial instruments may be designated on initial recognition as FVTP&L if any of the following criteria is met: (i) the financial instrument contains one or more embedded derivatives that otherwise would have to be accounted for separately; (ii) the designation eliminates or significantly reduces a measurement or recognition inconsistency that would otherwise arise from measuring the financial asset or liability or recognizing the gains and losses on them on a different basis; or (iii) the financial asset and financial liability are part of a group of financial assets, financial liabilities, or both that is managed and its performance is evaluated on a fair value basis, in accordance with a documented risk management or investment strategy. The Corporation has designated as FVTP&L, certain aircraft loans and lease receivables, certain investments in financing structures, trade-in commitments and lease subsidies, which were all designated as FVTP&L based on the above criterion (iii).
Subsequent changes in fair value of such financial instruments are recorded in other expense (income), except for the fair value changes arising from a change in interest rates which are recorded in financing expense or financing income.
c) AFS financial assetsInvestments in securities are usually classified as AFS. They are accounted for at fair value if reliably measurable, with unrealized gains and losses included in OCI, except for foreign exchange gains and losses on monetary investments, such as fixed income investments, which are recognized in income. Equity instruments that do not have a quoted market price in an active market and whose fair value cannot be reliably measured are recorded at cost.
When a decline in the fair value of an AFS financial asset has been recognised in OCI and there is objective evidence that the asset is impaired, the cumulative loss equal to the difference between the acquisition cost of the investments and its current fair value, less any impairment loss on that financial asset previously recognized in net income, is removed from AOCI and recognized in net income. Impairment losses recognized in net income for financial instruments classified as AFS can be reversed, except for investments in equity instruments.
d) L&RTrade and other receivables, restricted cash, certain aircraft loans and lease receivables, certain investments in financing structures, long-term contract receivables and other financial assets, are classified as L&R. Financial assets classified as L&R are measured at amortized cost using the effective interest rate method less any impairment losses.

146 BOMBARDIER INC. FINANCIAL REPORT - FISCAL YEAR ENDED DECEMBER 31, 2016
Trade receivables as well as other financial assets classified as L&R are subject to periodic impairment review and are classified as impaired when there is objective evidence that an impairment loss has been incurred. The amount of the loss is measured as the difference between the asset’s carrying amount and the present value of estimated future cash flows discounted at the original effective interest rate. If, in a subsequent period, the amount of the impairment loss decreases and the decrease can be related objectively to an event occurring after the impairment was recognized, the previously recognized impairment loss is reversed.
e) Other than HFT financial liabilitiesTrade and other payables, short-term borrowings, long-term debt, government refundable advances, vendor non-recurring costs, sale and leaseback obligations and certain other financial liabilities are classified as other than HFT liabilities and are measured at amortized cost using the effective interest rate method.
Hedge accountingDesignation as a hedge is only allowed if, both at the inception of the hedge and throughout the hedge period, the changes in the fair value of the derivative and non-derivative hedging financial instruments are expected to substantially offset the changes in the fair value of the hedged item attributable to the underlying risk exposure.
The Corporation formally documents all relationships between the hedging instruments and hedged items, as well as its risk management objectives and strategy for undertaking various hedge transactions. This process includes linking all derivatives to forecasted cash flows or to a specific asset or liability. The Corporation also formally documents and assesses, both at the hedge’s inception and on an ongoing basis, whether the hedging instruments are highly effective in offsetting the changes in the fair value or cash flows of the hedged items. There are three permitted hedging strategies.
Fair value hedges – The Corporation generally applies fair value hedge accounting to certain interest-rate derivatives and forward foreign exchange contracts hedging the exposures to changes in the fair value of recognised financial assets and financial liabilities. In a fair value hedge relationship, gains or losses from the measurement of derivative hedging instruments at fair value are recorded in net income, while gains or losses on hedged items attributable to the hedged risks are accounted for as an adjustment to the carrying amount of hedged items and are recorded in net income.
Cash flow hedges – The Corporation generally applies cash flow hedge accounting to forward foreign exchange contracts and interest-rate derivatives entered into to hedge foreign exchange risks on forecasted transactions and recognized assets and liabilities. In a cash flow hedge relationship, the portion of gains or losses on the hedging item that is determined to be an effective hedge is recognized in OCI, while the ineffective portion is recorded in net income. The amounts recognized in OCI are reclassified in net income as a reclassification adjustment when the hedged item affects net income. However, when an anticipated transaction is subsequently recorded as a non-financial asset, the amounts recognized in OCI are reclassified in the initial carrying amount of the related asset.
Hedge of net investments in foreign operations – The Corporation generally designates certain long-term debt as hedges of its net investments in foreign operations. The portion of gains or losses on the hedging instrument that is determined to be an effective hedge is recognized in OCI, while the ineffective portion is recorded in net income. The amounts recognized in OCI are reclassified in net income when corresponding exchange gains or losses arising from the translation of the foreign operations are recorded in net income.
The portion of gains or losses on the hedging instrument that is determined to be an effective hedge is recorded as an adjustment of the cost or revenue of the related hedged item. Gains and losses on derivatives not designated in a hedge relationship and gains and losses on the ineffective portion of effective hedges are recorded in cost of sales or financing expense or financing income for the interest component of the derivatives or when the derivatives were entered into for interest rate management purposes.
Hedge accounting is discontinued prospectively when it is determined that the hedging instrument is no longer effective as a hedge, the hedging instrument is terminated or sold, or upon the sale or early termination of the hedged item.

BOMBARDIER INC. FINANCIAL REPORT - FISCAL YEAR ENDED DECEMBER 31, 2016 - NOTES 147
Leases The determination of whether an arrangement is or contains a lease is based on the substance of the arrangement and requires an assessment of whether the arrangement conveys a right to use the asset. When substantially all risks and rewards of ownership are transferred from the lessor to the lessee, lease transactions are accounted for as finance leases. All other leases are accounted for as operating leases.
When the Corporation is the lessee – Leases of assets classified as finance leases are presented in the consolidated statements of financial position according to their nature. The interest element of the lease payment is recognized over the term of the lease based on the effective interest rate method and is included in financing expense. Payments made under operating leases are recognized in income on a straight-line basis over the term of the lease.
When the Corporation is the lessor – Assets subject to finance leases, mainly commercial aircraft, are initially recognized at an amount equal to the net investment in the lease and are included in aircraft lease receivables. Interest income is recognized over the term of the applicable leases based on the effective interest rate method. Assets under operating leases, mostly pre-owned regional and business aircraft, are included in PP&E. Lease income from operating leases is recognized on a straight-line basis over the term of the lease and is included in revenues.
Inventory valuation Long-term contracts – Long-term contract inventories include materials, direct labour, manufacturing overhead and other costs incurred in bringing the inventories to their present location and condition, as well as estimated contract margins. Advances and progress billings received on account of work performed for long-term contracts are deducted from related long-term contract inventories. Advances and progress billings received in excess of related long-term contract inventories are shown as liabilities.
Aerospace program and finished products – Aerospace program work in progress, raw materials, and finished product inventories are valued at the lower of cost or net realizable value. Cost is generally determined using the unit cost method, except for the cost of spare part inventory that is determined using the moving average method. The cost of manufactured inventories comprises all costs that are directly attributable to the manufacturing process, such as materials, direct labour, manufacturing overhead, and other costs incurred in bringing the inventories to their present location and condition. Net realizable value is the estimated selling price in the ordinary course of business less the estimated costs of completion and the estimated selling costs, except for raw materials for which it is determined using replacement cost. The Corporation estimates the net realizable value using both external and internal aircraft valuations, including information developed from the sale of similar aircraft in the secondary market.
Impairment of inventories – Inventories are written down to net realizable value when the cost of inventories is determined not to be recoverable. When the circumstances that previously caused inventories to be written down no longer exist or when there is clear evidence of an increase in net realizable value because of changed economic circumstances, the amount of the write-down is reversed.
Retirement and other long-term employee benefits Retirement benefit plans are classified as either defined benefit plans or defined contribution plans.
Defined benefit plans Retirement benefit liability or asset recognised on the consolidated statement of financial position is measured at the difference between the present value of the defined benefit obligation and the fair value of plan asset at the reporting date. When the Corporation has a surplus in a defined benefit plan, the value of any plan asset recognized is restricted to the asset ceiling - i.e. the present value of economic benefits available in the form of refunds from the plan or reductions in future contributions to the plan (“asset ceiling test”). A minimum liability is recorded when legal minimum funding requirements for past services exceed economic benefits available in the form of refunds from the plan or reductions in future contributions to the plan. A constructive obligation is recorded as a defined benefit obligation when there is no realistic alternative but to pay employee benefits. Retirement benefit liability or asset includes the effect of any asset ceiling, minimum liability and constructive obligation.

148 BOMBARDIER INC. FINANCIAL REPORT - FISCAL YEAR ENDED DECEMBER 31, 2016
The cost of pension and other benefits earned by employees is actuarially determined for each plan using the projected unit credit method, and management’s best estimate of salary escalation, retirement ages, life expectancy, inflation, discount rates and health care costs. Plan assets are assets that are held by a long-term employee benefit fund or qualifying insurance policies. These assets are measured at fair value at the end of the reporting period, which is based on published market mid-price information in the case of quoted securities. The discount rates are determined at each reporting date by reference to market yields at the end of the reporting period on high quality corporate fixed-income investments consistent with the currency and the estimated terms of the related retirement benefit liability.
The remeasurement gains and losses (including the foreign exchange impact) arising on the plan assets and defined benefit obligation and the effect of any asset ceiling and minimum liability are recognized directly in OCI in the period in which they occur and are never reclassified to net income. Past service costs (credits) are recognized directly in income in the period in which they occur.
The accretion on net retirement benefit obligations is included in financing income or financing expense. The remaining components of the benefit cost are either capitalized as part of labour costs and included in inventories and in certain PP&E and intangible assets during their construction, or are recognized directly in income. The benefit cost recorded in net income is allocated to labour costs based on the function of the employee accruing the benefits.
Defined contribution plansContributions to defined contribution plans are recognized in net income as incurred or are either capitalized as part of labour costs and included in inventories and in certain PP&E and intangible assets during their construction. The benefit cost recorded in net income is allocated to labour costs based on the function of the employee accruing the benefits.
Other long-term employee benefits – The accounting method is similar to the method used for defined benefit plans, except that all actuarial gains and losses are recognized immediately in income. Other long-term employee benefits are included in other liabilities.
Property, plant and equipmentPP&E are carried at cost less accumulated amortization and impairment losses. The cost of an item of PP&E includes its purchase price or manufacturing cost, borrowing costs as well as other costs incurred in bringing the asset to its present location and condition. If the cost of certain components of an item of PP&E is significant in relation to the total cost of the item, the total cost is allocated between the various components, which are then separately depreciated over the estimated useful lives of each respective component. The amortization of PP&E is computed on a straight-line basis over the following useful lives:
Buildings 5 to 75 yearsEquipment 2 to 15 yearsOther 3 to 20 years
The amortization method and useful lives are reviewed on a regular basis, at least annually, and changes are accounted for prospectively. The amortization expense and impairments are recorded in cost of sales, SG&A or R&D expenses based on the function of the underlying asset or in special items. Amortization of assets under construction begins when the asset is ready for its intended use.
When a significant part is replaced or a major inspection or overhaul is performed, its cost is recognized in the carrying amount of the PP&E if the recognition criteria are satisfied, and the carrying amount of the replaced part or previous inspection or overhaul is derecognized. All other repair and maintenance costs are charged to income when incurred.

BOMBARDIER INC. FINANCIAL REPORT - FISCAL YEAR ENDED DECEMBER 31, 2016 - NOTES 149
Intangible assets Internally generated intangible assets include development costs (mostly aircraft prototype design and testing costs) and internally developed or modified application software. These costs are capitalized when certain criteria for deferral such as proven technical feasibility are met. The costs of internally generated intangible assets include the cost of materials, direct labour, manufacturing overheads and borrowing costs and exclude costs which were not necessary to create the asset, such as identified inefficiencies.
Acquired intangible assets include the cost of development activities carried out by vendors for which the Corporation controls the underlying output from the usage of the technology, as well as the cost related to externally acquired licences, patents and trademarks.
Intangible assets are recorded at cost less accumulated amortization and impairment losses and include goodwill, aerospace program tooling, as well as other intangible assets such as licenses, patents and trademarks. Other intangible assets are included in other assets.
Amortization of aerospace program tooling begins at the date of completion of the first aircraft of the program. Amortization of other intangibles begins when the asset is ready for its intended use. Amortization expense is recognized as follows:
Method Estimated useful lifeAerospace program tooling Unit of production Expected number of aircraft to be produced(1)
Other intangible assetsLicenses, patents and trademarks Straight-line 3 to 20 yearsOther Straight-line 3 to 5 years
(1) As at December 31, 2016, the remaining number of units to fully amortize the aerospace program tooling, except for aerospace program tooling under development, is expected to be produced over the next 14 years.
The amortization methods and estimated useful lives are reviewed on a regular basis, at least annually, and changes are accounted for prospectively. The amortization expense is recorded in cost of sales, SG&A or R&D expenses based on the function of the underlying assets.
The Corporation does not have indefinite-life intangible assets, other than goodwill. Goodwill represents the excess of the purchase price over the fair value of the identifiable net assets acquired in a business acquisition. After initial recognition, goodwill is measured at cost less any accumulated impairment losses.
Borrowing costsBorrowing costs consist of interest on long-term debt and other costs that the Corporation incurs in connection with the borrowing of funds. Borrowing costs directly attributable to the acquisition, construction or production of a qualifying asset are capitalised as part of the cost of that asset and are deducted from the financing expense to which they relate. The Corporation suspends the capitalisation of borrowing costs during extended periods in which it suspends active development of a qualifying asset. All other borrowing costs are expensed in the period they occur.
Impairment of PP&E and intangible assets The Corporation assesses at each reporting date whether there is an indication that a PP&E or intangible asset may be impaired. If any indication exists, the Corporation estimates the recoverable amount of the individual asset, when possible.
When the asset does not generate cash inflows that are largely independent of those from other assets or group of assets, the asset is tested at the CGU level. Most of the Corporation’s non-financial assets are tested for impairment at the CGU level. The recoverable amount of an asset or CGU is the higher of its fair value less costs to sell and its value in use.
• The fair value less costs to sell reflects the amount the Corporation could obtain from the asset’s disposal in an arm’s length transaction between knowledgeable, willing parties, after deducting the costs of disposal. If there is no binding sales agreement or active market for the asset, the fair value is assessed by using appropriate valuation models dependent on the nature of the asset or CGU, such as discounted cash flow models.

150 BOMBARDIER INC. FINANCIAL REPORT - FISCAL YEAR ENDED DECEMBER 31, 2016
• The value in use is calculated using estimated net cash flows, with detailed projections generally over a five-year period and subsequent years being extrapolated using a growth assumption. The estimated net cash flows are discounted to their present value using a discount rate before income taxes that reflects current market assessments of the time value of money and the risk specific to the asset or CGU.
When the recoverable amount is less than the carrying value of the related asset or CGU, the related assets are written down to their recoverable amount and an impairment loss is recognized in net income.
For PP&E and intangible assets other than goodwill, an assessment is made at each reporting date as to whether there is any indication that previously recognized impairment losses may no longer exist or may have decreased. If such indication exists, the Corporation estimates the recoverable amount of the asset or CGU. A previously recognized impairment loss is reversed only if there has been a change in the estimates used to determine the recoverable amount since the last impairment loss was recognized. A reversal of an impairment loss reflects an increase in the estimated service potential of an asset. The reversal of impairment losses is limited to the amount that would bring the carrying value of the asset or CGU to the amount that would have been recorded, net of amortization, had no impairment loss been recognized for the asset or CGU in prior years. Such reversal is recognized to income in the same line item where the original impairment was recognized.
Intangible assets not yet available for use and goodwill are reviewed for impairment at least annually or more frequently if circumstances such as significant declines in expected sales, earnings or cash flows indicate that it is more likely than not that the asset or CGU might be impaired. Impairment losses relating to goodwill are not reversed in future periods.
Provisions Provisions are recognised when the Corporation has a present legal or constructive obligation as a result of a past event, it is probable that an outflow of resources will be required to settle the obligation and the cost can be reliably estimated. These liabilities are presented as provisions when they are of uncertain timing or amount. Provisions are measured at their present value.
Product warranties – A provision for warranty cost is recorded in cost of sales when the revenue for the related product is recognized. The interest component associated with product warranties, when applicable, is recorded in financing expense. The cost is estimated based on a number of factors, including the historical warranty claims and cost experience, the type and duration of warranty coverage, the nature of products sold and in service and counter-warranty coverage available from the Corporation’s suppliers. Claims for reimbursement from third parties are recorded if their realization is virtually certain. Product warranties typically range from one to five years, except for aircraft structural and bogie warranties that extend up to 20 years.
Credit and residual value guarantees – Credit and residual value guarantees related to the sale of aircraft are recorded at the amount the Corporation expects to pay under these guarantees when the revenue for the related product is recognized. Subsequent to initial recognition, changes in the value of these guarantees are recorded in other expense (income), except for the changes in value arising from a change in interest rates, which are recorded in financing expense or financing income.
Credit guarantees provide support through contractually limited payments to the guaranteed party to mitigate default-related losses. Credit guarantees are triggered if customers do not perform during the term of the financing.
Residual value guarantees provide protection, through contractually limited payments, to the guaranteed parties in cases where the market value of the underlying asset falls below the guaranteed value. In most cases, these guarantees are provided as part of a financing arrangement.
Restructuring provisions – Restructuring provisions are recognised only when the Corporation has an actual or a constructive obligation. The Corporation has a constructive obligation when a detailed formal plan identifies the business or part of the business concerned, the location and number of employees affected, a detailed estimate of the associated costs and an appropriate timeline. Furthermore, the affected employees or worker councils must have been notified of the plan’s main features.

BOMBARDIER INC. FINANCIAL REPORT - FISCAL YEAR ENDED DECEMBER 31, 2016 - NOTES 151
Onerous contracts – If it is more likely than not that the unavoidable costs of meeting the obligations under a firm contract, other than a long-term contract with a customer, exceed the economic benefits expected to be received under it, a provision for onerous contracts is recorded in cost of sales, except for the interest component, which is recorded in financing expense. Unavoidable costs include anticipated cost overruns, as well as expected costs associated with late delivery penalties and technological problems, and exclude the allocation of certain indirect overheads which are included in the cost of inventories such as amortization. Provisions for onerous contracts are measured at the lower of the expected cost of fulfilling the contract and the expected cost of terminating the contract.
Termination benefits – Termination benefits are usually paid when employment is terminated before the normal retirement date or when an employee accepts voluntary redundancy in exchange for these benefits. The Corporation recognizes termination benefits when it is demonstrably committed, through a detailed formal plan without possibility of withdrawal, to terminate the employment of current employees.
Environmental costs – A provision for environmental costs is recorded when environmental claims or remedial efforts are probable and the costs can be reasonably estimated. Legal asset retirement obligations and environmental costs of a capital nature that extend the life, increase the capacity or improve the safety of an asset or that mitigate, or prevent environmental contamination that has yet to occur, are included in PP&E and are generally amortized over the remaining useful life of the underlying asset. Costs that relate to an existing condition caused by past operations and that do not contribute to future revenue generation are expensed and included in cost of sales.
Litigation – A provision for litigation is recorded in case of legal actions, governmental investigations or proceedings when it is probable that an outflow of resources will be required to settle the obligation and the cost can be reliably estimated.
Share-based payments Equity-settled share-based payment plans – Equity-settled share-based payments are measured at fair value at the grant date. For the PSUs, DSUs and RSUs, the value of the compensation is measured based on the closing price of a Class B Share (subordinate voting) of the Corporation on the Toronto Stock Exchange adjusted to take into account the terms and conditions upon which the shares were granted, if any, and is based on the PSUs, DSUs and RSUs that are expected to vest. For share option plans, the value of the compensation is measured using a Black-Scholes option pricing model. The effect of any change in the number of options, PSUs, DSUs and RSUs that are expected to vest is accounted for in the period in which the estimate is revised. Compensation expense is recognized on a straight-line basis over the vesting period, with a corresponding increase in contributed surplus. Any consideration paid by plan participants on the exercise of stock options is credited to share capital.
Cash-settled share-based payments – Cash-settled share-based payments are measured at fair value at the grant date with a corresponding liability. Until the liability is settled, the fair value of the liability is remeasured at the end of each reporting period and at the date of settlement, with any changes in fair value recognised in income. Limited PSUs, DSUs and RSUs are cash-settled share-based payments, for which the value of the compensation is measured based on the closing price of a Class B Share (subordinate voting) of the Corporation on the Toronto Stock Exchange adjusted to take into account the terms and conditions upon which the shares were granted, if any, and is based on the PSUs, DSUs and RSUs that are expected to vest.
Employee share purchase plan – The Corporation’s contributions to the employee share purchase plan are measured at cost and accounted for in the same manner as the related employee payroll costs. Compensation expense is recorded at the time of the employee contribution.

152 BOMBARDIER INC. FINANCIAL REPORT - FISCAL YEAR ENDED DECEMBER 31, 2016
3. FUTURE CHANGES IN ACCOUNTING POLICIES
Financial instruments In July 2014, the IASB completed the three-part project to replace IAS 39, Financial instruments: recognition and measurement by issuing IFRS 9, Financial instruments. IFRS 9, Financial instruments includes classification and measurement of financial assets and financial liabilities, a forward-looking ‘expected loss’ impairment model and a substantially-reformed approach to hedge accounting.
IFRS 9 uses a new approach to determine whether a financial asset is measured at amortized cost or fair value, replacing the multiple rules in IAS 39. The approach in IFRS 9 is based on how an entity manages its financial instruments and the contractual cash flow characteristics of the financial assets. Most of the requirements in IAS 39 for classification and measurement of financial liabilities were carried forward in IFRS 9. However, the portion of the changes in fair value related to the entity’s own credit risk, in measuring a financial liability at FVTP&L, will be presented in OCI rather than in the statement of income.
IFRS 9 also introduced a new expected-loss impairment model that will require more timely recognition of expected credit losses. Specifically, the new standard requires entities to account for expected credit losses from when financial instruments are first recognized and to recognize full lifetime expected losses on a more timely basis.
Lastly, IFRS 9 introduced a new hedge accounting model, together with corresponding disclosures about risk management activities. The new hedge accounting model represents a substantial overhaul of hedge accounting that will enable entities to better reflect their risk management activities in their financial statements.
IFRS 9 will be effective for the Corporation’s fiscal year beginning on January 1, 2018. The Corporation is currently assessing the impact of the adoption of this standard on its consolidated financial statements. The Corporation does not expect significant hedge accounting differences in respect of aerospace segments. The Corporation continues to analyze the application of hedge accounting under the new standard in respect of long-term contracts in the Transportation segment. The Corporation’s preliminary analysis has not identified significant recognition or measurement differences in respect of classification and measurement.
Revenue Recognition In May 2014, the IASB released IFRS 15, Revenue from contracts with customers, which supersedes IAS 11, Construction Contracts, and IAS 18, Revenue as well as other related interpretations. The core principle of IFRS 15 is that an entity should recognize revenue to depict the transfer of promised goods or services to customers in an amount that reflects the consideration to which the entity expects to be entitled in exchange for those goods or services. Revenue is recognized when, or as, the customer obtains control of the goods or services.
For the Corporation the standard comes into effect January 1, 2018, and as a result IFRS 15 will be adopted in the first quarter of 2018. At that time the Corporation will restate its 2017 results, with an opening adjustment to equity as at January 1, 2017.
The Corporation is continuing to assess the impact of the new standard on its consolidated financial statements.
The majority of long-term manufacturing and service contracts at Transportation currently accounted for under the percentage-of-completion method are expected to meet the requirements for revenue recognition over time. The Corporation anticipates its accounting for customer options will change, in particular with respect to when the options are considered in estimated revenues at completion. This change will result in the deferral of revenue and margin and a reduction of equity at transition. The Corporation is currently assessing whether the new standard will result in the deferral of revenue recognition in respect of certain variable consideration such as estimated price escalation and penalties.
Revenues from the sale of new aircraft will continue to be recognized when the aircraft have been delivered.

BOMBARDIER INC. FINANCIAL REPORT - FISCAL YEAR ENDED DECEMBER 31, 2016 - NOTES 153
The Corporation is assessing whether there is a significant financing component on orders where timing of cash receipts and revenue recognition differ substantially.
IFRS 15 indicates IAS 37, Provisions, Contingent liabilities and Contingent Assets, should be applied to onerous contracts but contains no other requirements as to their measurement. When the new revenue standard is adopted all loss provisions for contracts with customers will need to follow the same policy. The Corporation is assessing whether it would be appropriate to measure loss provisions on contracts with customers based on all costs that will be attributed to a contract, consistent with the approach currently used for long-term contracts. This change in accounting policy, if adopted, would increase the amount of onerous contract provisions and result in a reduction of equity at transition.
While these changes will impact the timing of revenue and margin recognition, and will result in a reduction of equity at transition, there will be no changes to the treatment of cash flows and cash will still be collected in line with contractual terms.
The Corporation will provide further updates during the course of 2017 as it advances in its assessment. Leases In January 2016, the IASB released IFRS 16, Leases, to replace the previous leases Standard, IAS 17, Leases, and related Interpretations. IFRS 16 sets out the principles for the recognition, measurement, presentation and disclosure of leases for both parties to a contract, the customer (lessee) and the supplier (lessor). IFRS 16 eliminates the classification of leases as either operating leases or finance leases and introduces a single lessee accounting model. IFRS 16 also substantially carries forward the lessor accounting requirements. Accordingly, a lessor continues to classify its leases as operating leases or finance leases, and to account for those two types of leases differently.
IFRS 16 will be effective for the Corporation’s fiscal year beginning on January 1, 2019. The Corporation is currently evaluating the impact the adoption of this standard will have on its consolidated financial statements. Where the Corporation is a lessee, the Corporation expect IFRS 16 will result in on-balance sheet recognition of most of its leases that are considered operating leases under IAS 17. This will result in the gross-up of the balance sheet through the recognition of a right-of-use asset and a liability for the present value of the future lease payments. Depreciation expense on the right-of-use asset and interest expense on the lease liability will replace the operating lease expense.

154 BOMBARDIER INC. FINANCIAL REPORT - FISCAL YEAR ENDED DECEMBER 31, 2016
4. USE OF ESTIMATES AND JUDGMENT
The application of the Corporation’s accounting policies requires management to use estimates and judgments that can have a significant effect on the revenues, expenses, comprehensive income, assets and liabilities recognized and disclosures made in the consolidated financial statements. Estimates and judgments are significant when:
• the outcome is highly uncertain at the time the estimates and judgments are made; and • if different estimates or judgments could reasonably have been used that would have had a material
impact on the consolidated financial statements.
Management’s best estimates regarding the future are based on the facts and circumstances available at the time estimates are made. Management uses historical experience, general economic conditions and trends, as well as assumptions regarding probable future outcomes as the basis for determining estimates. Estimates and their underlying assumptions are reviewed periodically and the effects of any changes are recognized immediately. Actual results will differ from the estimates used, and such differences could be material.
Management’s budget and strategic plan cover a five-year period and are fundamental information used as a basis for many estimates necessary to prepare financial information. Management prepares a budget and strategic plan covering a five-year period, on an annual basis, using a process whereby a detailed one-year budget and four-year strategic plan are prepared by each reportable segment and then consolidated. Cash flows and profitability included in the budget and strategic plan are based on existing and future contracts and orders, general market conditions, current cost structures, anticipated cost variations and in-force collective agreements. The budget and strategic plan are subject to approval at various levels, including senior management and the Board of Directors. Management uses the budget and strategic plan, as well as additional projections or assumptions, to derive the expected results for periods thereafter. Management then tracks performance as compared to the budget and strategic plan at various levels within the Corporation. Significant variances in actual performance are a key trigger to assess whether certain estimates used in the preparation of financial information must be revised.
The following areas require management’s most critical estimates and judgments. The sensitivity analyses below should be used with caution as the changes are hypothetical and the impact of changes in each key assumption may not be linear.
Long-term contracts – Transportation conducts most of its business under long-term manufacturing and service contracts and the aerospace segments have some long-term maintenance service contracts, as well as design and development contracts for third parties. Revenues and margins from long-term contracts relating to the designing, engineering or manufacturing of specially designed products (including rail vehicles, vehicles overhaul and signaling contracts) and service contracts are recognized using the percentage-of-completion method of accounting. The long-term nature of these contracts requires estimates of total contract costs and revenues at completion.
Estimated revenues at completion are adjusted for change orders, anticipated options for additional assets, claims, performance incentives, price escalation clauses and other contract terms that provide for the adjustment of prices. If it is probable that changes in revenues will occur, and the amount can be measured reliably, they are included in estimated revenues at completion.
Contract costs include material, direct labour, manufacturing overhead and other costs, such as warranty and freight. Estimated contract costs at completion incorporate forecasts for material usage and costs, including escalation clauses, labour hours and costs, foreign exchange rates (including the effect of hedges) and labour productivity. These costs are influenced by the nature and complexity of the work to be performed, as well as the impact of change orders and potential delays in delivery. Cost estimates are based mainly on historical performance trends, economic trends, collective agreements and contracts signed with suppliers. Management applies judgment to determine the probability that the Corporation will incur additional costs from delays or other penalties and such costs, if probable, are included in estimated costs at completion.

BOMBARDIER INC. FINANCIAL REPORT - FISCAL YEAR ENDED DECEMBER 31, 2016 - NOTES 155
Recognized revenues and margins are subject to revisions as contracts progress towards completion. Management conducts quarterly reviews of estimated costs and revenues to completion on a contract-by-contract basis, including a review of escalation assumptions. In addition, a detailed annual review is performed on a contract-by-contract basis as part of the budget and strategic plan process. The effect of any revision may be significant and is recorded by way of a cumulative catch-up adjustment in the period in which the estimates are revised.
Sensitivity analysisA 1% increase in the estimated future costs to complete all ongoing long-term contracts would have decreased Transportation’s gross margin for fiscal year 2016 by approximately $86 million.
Aerospace program tooling – Aerospace program tooling amortization and the calculation of recoverable amounts used in impairment testing require estimates of the expected number of aircraft to be delivered over the life of each program. The expected number of aircraft is based on management’s aircraft market forecasts and the Corporation’s expected share of each market. Such estimates are reviewed in detail as part of the budget and strategic plan process. For purposes of impairment testing, management exercises judgment to identify independent cash inflows to identify CGUs by family of aircraft. Other key estimates used to determine the recoverable amount include the applicable discount rate, the expected future cash flows over the remaining life of each program, which include costs to complete the development activities, if any, as well as potential upgrades, and derivatives expected over the life of the program. The estimated cost of potential upgrades and derivatives is based on past experience with previous programs. The expected future cash flows also include cash flows from aftermarket activities, as well as expected cost savings due to synergies from the perspective of a market participant. The inputs used in the discounted cash flow model are Level 3 inputs (inputs that are not based on observable market data).
The discount rate is based on a weighted average cost of capital calculated using market-based inputs, available directly from financial markets or based on a benchmark sampling of representative publicly-traded companies in the aerospace sector. The recoverable amounts were established during the fourth quarter of 2016, using a post-tax discount rate of 10%.
The estimated future cash flows for the first five years are based on the budget and strategic plan. After the initial five years, long-range forecasts prepared by management are used. Forecast future cash flows are based on management’s best estimate of future sales under existing firm orders, expected future orders, timing of payments based on expected delivery schedules, revenues from related services, procurement costs based on existing contracts with suppliers, labour costs, general market conditions, foreign exchange rates and applicable income tax rates.
Since an annual impairment test is required for aircraft programs under development, an assessment was prepared for the Global 7000 and Global 8000 aircraft program and the Corporation concluded there was no impairment.
Since the C Series aircraft program recently entered into service and a large impairment charge was recorded in 2015, an assessment was prepared again this year and the Corporation concluded there was no impairment.
In fiscal year 2015, the Corporation recorded an impairment charge of $3,070 million on the C Series aircraft program aerospace program tooling, an impairment charge of $919 million related to the remaining Learjet 85 aircraft development costs, an impairment charge of $243 million related to the remaining balance on the CRJ1000 aircraft program development costs and an impairment charge of $53 million related to the remaining Learjet family development costs. Based on the 2016 annual assessment, there is no indication that previously recognized impairment losses may no longer exist or may have decreased. See Note 21 - Intangible assets for more details.

156 BOMBARDIER INC. FINANCIAL REPORT - FISCAL YEAR ENDED DECEMBER 31, 2016
Sensitivity analysis The following analyses are presented in isolation from one another, i.e. all other estimates left unchanged:
A 10% decrease, evenly distributed over future periods, in the expected future net cash inflows for the Global 7000 and Global 8000 aircraft program and the C Series aircraft program would not have resulted in an impairment charge in fiscal year 2016.
An increase of 100-basis points in the discount rate used to perform the impairment tests would not have resulted in an impairment charge in fiscal year 2016 for the Global 7000 and Global 8000 aircraft program and the C Series aircraft program.
Goodwill – The recoverable amount of the Transportation operating segment, the group of CGUs at which level goodwill is monitored by management, is based on fair value less costs of disposal using a discounted cash flow model. During the fourth quarter of 2016, the Corporation completed its annual goodwill impairment test for the Transportation segment and did not identify any impairment. The fair value measurement is categorized within Level 3 of the fair value hierarchy.
Estimated future cash flows were based on the budget and strategic plan for the first 5 years and a growth rate of 1% was applied to derive a terminal value beyond the initial 5-year period. The post-tax discount rate is also a key estimate in the discounted cash flow model and was based on a representative weighted average cost of capital. The post-tax discount rate used to calculate the recoverable amount in fiscal year 2016 was 8.5%. A 100-basis point change in the post-tax discount rate would not have resulted in an impairment charge in 2016.
Valuation of deferred income tax assets – To determine the extent to which deferred income tax assets can be recognized, management estimates the amount of probable future taxable profits that will be available against which deductible temporary differences and unused tax losses can be utilized. Such estimates are made as part of the budget and strategic plan by tax jurisdiction on an undiscounted basis and are reviewed on a quarterly basis. Management exercises judgment to determine the extent to which realization of future taxable benefits is probable, considering factors such as the number of years to include in the forecast period, the history of taxable profits and availability of prudent tax planning strategies. See Note 12 - Income taxes for more details.
Tax contingencies – Uncertainties exist with respect to the interpretation of complex tax regulations, changes in tax laws, and the amount and timing of future taxable income. Given the wide range of international business relationships and the long-term nature and complexity of existing contractual agreements, differences arising between the actual results and the assumptions made, or future changes to such assumptions, could necessitate future adjustments to tax expense or recovery already recorded. The Corporation establishes tax provisions for possible consequences of audits by the tax authorities of each country in which it operates. The amount of such provisions is based on various factors, such as experience from previous tax audits and differing interpretations of tax regulations by the taxable entity and the relevant tax authority. Such differences in interpretation may arise for a wide variety of issues depending on the conditions prevailing in the domicile of each legal entity.
Credit and residual value guarantees – The Corporation uses an internal valuation model based on stochastic simulations. The amounts expected to be paid under the guarantees may depend on whether credit defaults occur during the term of the original financing. When a credit default occurs, the credit guarantee may be called upon. In the absence of a credit default the residual value guarantee may be triggered. In both cases, the guarantees can only be called upon if there is a loss upon the sale of the aircraft. Therefore, the value of the guarantee is in large part impacted by the future value of the underlying aircraft, as well as on the likelihood that credit or residual value guarantees will be called upon at the expiry of the financing arrangements. Aircraft residual value curves, prepared by management based on information from external appraisals and adjusted to reflect specific factors of the current aircraft market and a balanced market in the medium and long term, are used to estimate the underlying aircraft future value. The amount of the liability is also significantly impacted by the current market assumption for interest rates since payments under these guarantees are mostly expected to be made in the medium to long term. Other key estimates in calculating the value of the guarantees include default probabilities, estimated based on published credit ratings when available or, when not available, on internal assumptions regarding the credit risk of customers. The estimates are reviewed on a quarterly basis.

BOMBARDIER INC. FINANCIAL REPORT - FISCAL YEAR ENDED DECEMBER 31, 2016 - NOTES 157
Sensitivity analysisThe following analyses are presented in isolation from one another, i.e. all other estimates left unchanged:
Assuming a decrease of 10% in the residual value curves of all commercial aircraft as at December 31, 2016, Commercial Aircraft’s EBIT for 2016 would have been negatively impacted by $28 million.
Assuming an increase of 10% in the likelihood that residual value guarantees will be called upon at the expiry ofthe financing arrangements as at December 31, 2016, Commercial Aircraft’s EBIT for 2016 would have beennegatively impacted by $57 million.
Assuming a 100-basis point decrease in interest rates as at December 31, 2016, Commercial Aircraft’s EBT for 2016 would have been negatively impacted by $12 million. Assuming a 100-basis point increase in interest rates as at December 31, 2016, Commercial Aircraft’s EBT for 2016 would have been positively impacted by $12 million.
Retirement and other long-term employee benefits – The actuarial valuation process used to measure pension and other post-employment benefit costs, assets and obligations is dependent on assumptions regarding discount rates, compensation and pre-retirement benefit increases, inflation rates, health-care cost trends, as well as demographic factors such as employee turnover, retirement and mortality rates. The impacts from changes in discount rates and, when significant, from key events and other circumstances, are recorded quarterly.
Discount rates are used to determine the present value of the expected future benefit payments and represent the market rates for high-quality corporate fixed-income investments consistent with the currency and the estimated term of the retirement benefit liabilities. As the Canadian high-quality corporate bond market, as defined under IFRS, includes relatively few medium- and long- term maturity bonds, the discount rate for the Corporation’s Canadian pension and other post-employment plans is established by constructing a yield curve using three maturity ranges. The first maturity range of the curve is based on observed market rates for AA-rated corporate bonds with maturities of less than six years. In the longer maturity ranges, due to the smaller number of high-quality bonds available, the curve is derived using market observations and extrapolated data. The extrapolated data points were created by adding a term-based yield spread over long-term provincial bond yields. This term-based spread is extrapolated between a base spread and a long spread. The base spread is based on the observed spreads between AA-rated corporate bonds and AA-rated provincial bonds for the 5 to 10 years to maturity range. The long spread is determined as the spread required at the point of average maturity of AA-rated provincial bonds in the 11 to 30 years to maturity range such that the average AA-rated corporate bond spread above AA-rated provincial bonds is equal to the extrapolated spread derived by applying the ratio of the observed spreads between A-rated corporate bonds and AA-rated provincial bonds for the 11 to 30 years to maturity range over the 5 to 10 years to maturity range, to the base spread. For maturities longer than the average maturity of AA-rated provincial bonds in the 11 to 30 years to maturity range, the spread is assumed to remain constant at the level of the long spread.
Expected rates of compensation increases are determined considering the current salary structure, as well as historical and anticipated wage increases, in the context of current economic conditions.
See Note 22 – Retirement benefits for further details regarding assumptions used and sensitivity analysis to changes in critical actuarial assumptions.
Onerous contract provision – An onerous contract provision is recorded if it is more likely than not that the unavoidable costs of meeting the obligations under a firm contract, other than long-term contracts related to designing, engineering or manufacturing specifically designed products and service contracts for which revenue is recognized using the percentage of completion method of accounting, exceed the economic benefits expected to be received under the contract. Judgment is used to determine which costs are considered unavoidable and the calculation of the unavoidable costs require estimates of expected future costs, including anticipated future cost reductions related to performance improvements and transformation initiatives. Unavoidable costs exclude the allocation of certain indirect overheads which are included in the cost of inventories, such as amortization. As early production units in a new aircraft program require higher costs than units produced later in the program, cost estimates also depend on expected delivery schedules. The estimates are reviewed on a quarterly basis.

158 BOMBARDIER INC. FINANCIAL REPORT - FISCAL YEAR ENDED DECEMBER 31, 2016
CDPQ equity and derivative liability components – The convertibles shares issued to CDPQ contain no obligation for the Corporation to deliver cash or other financial assets to CDPQ. Judgment was used to conclude that the CDPQ’s convertible share investment in BT Holdco is considered a compound instrument comprised of an equity component, representing the discretionary dividends and liquidation preference, and a liability component that reflects a derivative to settle the instrument by delivering a variable number of common shares of BT Holdco, as opposed to the entire instrument being characterized as a liability. The Corporation presents convertible shares in its equity (NCI) and derivative component as a liability.
The fair value of the convertible shares at issuance was assigned to its respective equity and derivative liability components so that no gain or loss arose from recognizing each component separately, the fair value of the derivative liability was established first and the residual amount was allocated to the equity component. The liability component is remeasured quarterly using the Corporation’s best estimate of the present value of the settlement amount. The Corporation uses an internal valuation model based on stochastic simulations to estimate the fair value of the conversion option embedded in the BT Holdco convertible shares. The fair value of the embedded conversion option is based on the difference in value between: the convertible shares’ accrued liquidation preference based on the minimum return entitlement; and the fair value of the common shares on an as converted basis. This value is dependent on Transportation meeting the performance incentives agreed upon with the CDPQ, the timing of exercise of the conversion rights and the applicable conversion rate. The simulation model generates multiple Transportation performance scenarios over the expected term of the option, using the best estimate of Transportation’s expected results over the remaining term of the instrument and a standard deviation derived from historic results. Fair value of the shares on an as-converted basis is calculated using an EBIT multiple, which is based on market data, to determine the enterprise value. The discount rate used is also determined using market data. The Corporation uses internal assumptions to determine the term of the instrument and the future performance of Transportation, derived from the budget and strategic plan.
See Note 34 - Fair value of financial instruments for a sensitivity analysis on the variability in the fair value of the conversion option as a result of a reasonably likely change in the expected future performance of Transportation.
Consolidation – From time to time, the Corporation participates in structured entities where voting rights are not the dominant factor in determining control. In these situations, management may use a variety of complex estimation processes involving both qualitative and quantitative factors to determine whether the Corporation is exposed to, or has rights to, significant variable returns. The quantitative analyses involve estimating the future cash flows and performance of the investee and analyzing the variability in those cash flows. The qualitative analyses involve consideration of factors such as the purpose and design of the investee and whether the Corporation is acting as an agent or principal. There is a significant amount of judgment exercised in evaluating the results of these analyses as well as in determining if the Corporation has power to affect the investee’s returns, including an assessment of the impact of potential voting rights, contractual agreements and de facto control.
Also, the Corporation uses judgment to determine whether rights held by NCI, such as the CDPQ’s rights in respect of BT and Investissement Québec’s rights in respect of CSALP, are protective in nature as opposed to substantive. The Corporation reassesses the initial determination of control if facts or circumstances indicate that there may be changes to one or more elements of control.

BOMBARDIER INC. FINANCIAL REPORT - FISCAL YEAR ENDED DECEMBER 31, 2016 - NOTES 159
5. SEGMENT DISCLOSURE
The Corporation has four reportable segments: Business Aircraft, Commercial Aircraft, Aerostructures and Engineering Services and Transportation. Each reportable segment offers different products and services and mostly requires different technology and marketing strategies.
Business AircraftA global leader in the design, manufacture and aftermarket support for three families of business jets (Learjet, Challenger and Global), spanning from the light to large categories.
Commercial AircraftCommercial Aircraft designs and manufactures a broad portfolio of commercial aircraft in the 60- to 150-seat categories, including the Q400 turboprops, the CRJ Series family of regional jets as well as the all-new C Series mainline jets. Commercial Aircraft provides aftermarket support for these aircraft as well as for the 20- to 59-seat range category.
Aerostructures and Engineering ServicesAerostructures and Engineering Services designs and manufactures major aircraft structural components (such as engine nacelles, fuselages and wings) and provides aftermarket component repair and overhaul as well as other engineering services for both internal and external clients.
Transportation Transportation provides the most comprehensive product range and services offering in the rail industry and covers the full spectrum of rail solutions, ranging from complete trains to subsystems, services, system integration, signalling and e-mobility solutions.
The segmented information is prepared using the accounting policies described in Note 2 – Summary of significant accounting policies.
The revenue recognition policies of Aerostructures and Engineering Services follow the Corporation’s policies for either long-term contracts or aerospace programs depending on the nature of the contracts, except for intersegment contracts for design and engineering activities. Aerostructures and Engineering Services does not recognize revenues and costs for design and engineering work on intersegment contracts, except for the C Series aircraft program, for which profits or losses are recognized on a percentage-of-completion basis.

160 BOMBARDIER INC. FINANCIAL REPORT - FISCAL YEAR ENDED DECEMBER 31, 2016
Management assesses segment performance based on EBIT and EBIT before special items. The segmented results of operations and other information are as follows, for fiscal years:
2016
TransportationBusiness
AircraftCommercial
Aircraft
Aerostructuresand Engineering
ServicesCorporate and
Elimination TotalResults of operationsExternal revenues $ 7,567 $ 5,718 $ 2,617 $ 430 $ 7 $ 16,339Intersegment revenues 7 23 — 1,119 (1,149) —Total revenues 7,574 5,741 2,617 1,549 (1,142) 16,339EBIT before special items 560 369 (417) 124 (209) 427 Special items(1) 164 (108) 486 (4) (53) 485EBIT $ 396 $ 477 $ (903) $ 128 $ (156) (58)Financing expense 819Financing income (70)EBT (807)Income taxes 174Net loss $ (981)Other informationR&D(2) $ 103 $ 126 $ 28 $ 8 $ 22 $ 287Net additions to PP&E and intangible assets(3) $ 116 $ 721 $ 392 $ 20 $ (48) $ 1,201Amortization $ 97 $ 159 $ 64 $ 51 $ — $ 371Impairment charges on PP&E(4) $ 10 $ — $ — $ — $ — $ 10
2015
TransportationBusiness
AircraftCommercial
Aircraft
Aerostructures andEngineering
ServicesCorporate and
Elimination TotalResults of operationsExternal revenues $ 8,275 $ 6,996 $ 2,394 $ 507 $ — $ 18,172Intersegment revenues 6 — 1 1,290 (1,297) —Total revenues 8,281 6,996 2,395 1,797 (1,297) 18,172EBIT before special items 465 308 (170) 104 (153) 554 Special items(1) — 1,560 3,800 (1) 33 5,392EBIT $ 465 $ (1,252) $ (3,970) $ 105 $ (186) (4,838)Financing expense 418Financing income (70)EBT (5,186)Income taxes 154Net loss $ (5,340)Other informationR&D(2) $ 150 $ 129 $ 63 $ 13 $ — $ 355Net additions to PP&E and intangible assets(3) $ 155 $ 722 $ 963 $ 26 $ (4) $ 1,862Amortization $ 99 $ 184 $ 104 $ 50 $ 1 $ 438Impairment charges on intangible assets(5) $ — $ 983 $ 3,310 $ — $ (3) $ 4,290Impairment charges on PP&E(4) $ — $ 10 $ — $ — $ — $ 10
(1) See Note 8 – Special items for more details.(2) Includes tooling amortization. See Note 6 – Research and development for more details. (3) As per the consolidated statements of cash flows. (4) See Note 20 – Property, plant and equipment for more details.(5) See Note 21 – Intangible assets for more details.

BOMBARDIER INC. FINANCIAL REPORT - FISCAL YEAR ENDED DECEMBER 31, 2016 - NOTES 161
The reconciliation of total assets and total liabilities to segmented assets and liabilities is as follows, as at:
December 31, 2016 December 31, 2015 January 1, 2015AssetsTotal assets $ 22,826 $ 22,903 $ 27,614Assets not allocated to segments
Cash and cash equivalents 3,384 2,720 2,489Income tax receivable(1) 41 56 64Deferred income taxes 705 761 875
Segmented assets 18,696 19,366 24,186LiabilitiesTotal liabilities 26,315 26,957 27,559Liabilities not allocated to segments
Interest payable(2) 141 154 124Income taxes payable(3) 222 224 248Long-term debt(4) 8,769 8,979 7,683
Segmented liabilities $ 17,183 $ 17,600 $ 19,504Net segmented assets
Transportation $ (33) $ 354 $ 226Business Aircraft $ 1,448 $ 395 $ 440Commercial Aircraft $ 434 $ 467 $ 3,693Aerostructures and Engineering Services $ 142 $ 434 $ 204Corporate and Elimination $ (478) $ 116 $ 119
(1) Included in other assets.(2) Included in trade and other payables.(3) Included in other liabilities.(4) The current portion of long-term debt is included in other financial liabilities.

162 BOMBARDIER INC. FINANCIAL REPORT - FISCAL YEAR ENDED DECEMBER 31, 2016
The Corporation’s revenues and PP&E and intangible assets are, allocated to countries, as follows:
Revenues for fiscal years (1) PP&E and intangible assets as at (2)
December 31 December 31 January 12016 2015 2016 2015 2015
North AmericaUnited States $ 4,782 $ 5,599 $ 262 $ 300 $ 1,198Canada 1,342 1,312 5,977 4,009 5,839Mexico 114 108 37 36 84
6,238 7,019 6,276 4,345 7,121Europe
Germany 1,613 1,901 938 983 1,092United Kingdom 1,340 1,354 773 1,667 1,801France 1,219 1,118 31 36 43Switzerland 522 384 358 368 368Other 2,694 2,487 635 645 670
7,388 7,244 2,735 3,699 3,974Asia-Pacific
China 442 709 4 6 7Australia 516 605 23 24 28India 154 259 22 21 24Other 547 815 3 4 4
1,659 2,388 52 55 63Other
Russia 255 268 2 1 1Other 799 1,253 25 28 39
1,054 1,521 27 29 40$ 16,339 $ 18,172 $ 9,090 $ 8,128 $ 11,198
(1) Allocated to countries based on the location of the customer.(2) PP&E and intangible assets, excluding goodwill, are attributed to countries based on the location of the assets. Goodwill is attributed to
countries based on the Corporation’s allocation of the related purchase price.
6. RESEARCH AND DEVELOPMENT
R&D expense, net of government assistance, was as follows, for fiscal years:
2016 2015R&D expenditures $ 1,486 $ 1,794Less: development expenditures capitalized to aerospace program tooling (1,345) (1,624)
141 170Add: amortization of aerospace program tooling 146 185
$ 287 $ 355

BOMBARDIER INC. FINANCIAL REPORT - FISCAL YEAR ENDED DECEMBER 31, 2016 - NOTES 163
7. OTHER INCOME
Other income was as follows, for fiscal years:
2016 2015Changes in estimates and fair value(1)(2) $ 29 $ (4)Gains on disposals of PP&E and intangible assets (19) (3)Severance and other involuntary termination costs (including changes in estimates)(1) (6) 20Other (8) (13)
$ (4) $ —(1) Excludes those presented in special items.(2) Includes net loss (gain) on certain financial instruments measured at fair value and changes in estimates related to certain provisions or
certain financial instruments, excluding losses (gains) arising from changes in interest rates.
8. SPECIAL ITEMS
Special items were as follows, for fiscal years:
2016 2015Onerous contracts provision - C Series aircraft program(1) $ 492 $ —Restructuring charges(2) 215 9Pension obligation(3) (139) —Loss on repurchase of long-term debt(4) 86 22Impairment and other charges - Learjet 85 aircraft program(5) (59) 1,163Tax litigation(6) 40 50Foreign exchange gains related to the sale of a minority stake in Transportation(7) (38) —Transaction costs(8) 8 —Impairment and other charges - C Series aircraft program(9) — 3,235Changes in estimates and fair value(10) — 353Impairment charge - CRJ1000 aircraft program(11) — 243Write-off of prepaid sales concessions and deferred contract costs(12) — 194Termination of sales representative and distribution agreements(13) — 133Impairment charge - Learjet family of aircraft(14) — 53Tax impacts of special items(15) (20) 106
$ 585 $ 5,561Of which is presented in
Special items in EBIT $ 485 $ 5,392Financing expense - loss on repurchase of long-term debt(4) 86 22Financing expense - interest related to tax litigation(6) 26 —Financing expense - transaction costs(8) 8 —Financing expense - loss on financial instruments(10) — 41Income taxes - effect of special items (20) 106
$ 585 $ 5,561
1. Represents provision for onerous contracts in conjunction with the closing of C Series aircraft firm orders in the second quarter of 2016.
2. For fiscal year 2016, represents severance charges of $227 million, partially offset by curtailment gains of $22 million, and impairment charges of PP&E of $10 million related to the restructuring actions announced in February 2016 and October 2016. For fiscal year 2015, represents restructuring charges of $13 million related to the workforce reduction announced in January 2015 of approximately 1,000 positions, as a result of the decision to pause the Learjet 85 aircraft program, and a reversal of restructuring provisions taken in prior year of $4 million.
3. The Corporation had a constructive obligation for discretionary ad hoc indexation increases to certain pension plans. Following a communication to plan members that the Corporation does not expect to grant such

164 BOMBARDIER INC. FINANCIAL REPORT - FISCAL YEAR ENDED DECEMBER 31, 2016
increases in the foreseeable future in line with the Corporation’s current practice, the constructive obligation amounting to $139 million was reversed.
4. For fiscal year 2016, represents the loss related to the redemption of the $650-million and $750-million Senior Notes due 2018. For fiscal year 2015, represents the loss related to the redemption of the $750-million Senior Notes due 2016.
5. For fiscal year 2015, represents an impairment charge of $919 million on aerospace program tooling, and inventory write-downs, write-downs of other assets, PP&E and other intangible assets, other provisions and other financial liabilities of $244 million, as a result of the cancellation of the Learjet 85 aircraft program due to the lack of sales following the prolonged market weakness. See Note 17 - Inventories, Note 21 - Intangible assets and Note 24 - Provisions. Based on the ongoing activities with respect to the cancellation of the Learjet 85 aircraft program, the Corporation reduced the related provisions by $59 million for fiscal year 2016. The reduction in provisions is treated as a special item since the original provisions were also recorded as special charges in 2014 and 2015.
6. Represents a change in the estimates used to determine the provision related to tax litigation. 7. Represents foreign exchange gains related to the reorganization of Transportation under one holding entity
necessary to facilitate the investment in a minority stake in Transportation.8. Represents transaction costs attributable to the conversion option embedded in the CDPQ investment in BT
Holdco. See Note 10 – Non-controlling interest for more details. 9. For fiscal year 2015, represents an impairment charge of $3,070 million on aerospace program tooling, and
inventory write-downs and other provisions of $165 million, following the completion of an in-depth review of the C Series aircraft program as well as discussions with the Government of Québec which resulted in the October 2015 memorandum of understanding. See Note 17 - Inventories, Note 21 - Intangible assets and Note 24 - Provisions.
10. For fiscal year 2015, related to an increase in provisions for credit guarantees and RVGs as a result of changes in assumptions concerning residual value curves of regional aircraft due to difficult market conditions for regional pre-owned aircraft and a higher probability that the guaranteed party will exercise the RVG given the recent experience with respect to RVG and a loss on certain financial instruments due to changes in estimated fair value.
11. For fiscal year 2015, represents an impairment charge of $243 million on the remaining CRJ1000 aircraft program development costs. The impairment was due to the lack of recent order intake as well as low firm order backlog for the CRJ1000 aircraft, mainly stemming from pilot scope clauses in the U.S., which have restricted the use, number and seating capacity of regional aircraft flying on behalf of network carriers. Over the near term, we do not anticipate scope clause relaxation in the U.S., during which time, we will not be able to sell the CRJ1000 aircraft in the U.S. market. See Note 21 - Intangible assets.
12. For fiscal year 2015, mainly related to restructuring of customer commercial agreements.13. For fiscal year 2015, costs incurred in connection with the termination of third-party sales representative and
distribution agreements to increase the number of direct-to-market channels.14. For fiscal year 2015, represents an impairment charge of $53 million on the remaining Learjet family
aerospace program tooling following the prolonged market weakness in the light business aircraft category. See Note 21 - Intangible assets.
15. For fiscal year 2015, represents net write-downs of deferred income tax assets, mainly due to the reorganization and consolidation of Transportation under one holding entity necessary to facilitate the planned investment in a minority stake in Transportation.
Restructuring As the Corporation moves forward with its transformation plan, in February 2016 the Corporation decided to optimize its workforce with a combination of manpower reductions and strategic hiring. The goal was to resize the organization in line with current business needs and increase its competitiveness. The company planned to reduce its workforce by an estimated 7,000 production and non-production employees throughout 2016 and 2017. The planned manpower reduction included approximately 2,000 contractual workers and 800 product development engineers, the latter of which, are not allocated to a reportable segment. These reductions have been largely achieved in 2016 as planned.
In October 2016, the Corporation announced further restructuring actions. The Corporation will streamline its administrative and non-production functions across the organization. Approximately 7,500 positions will be impacted as the Corporation executes its workforce optimization and site specialization actions through 2018.

BOMBARDIER INC. FINANCIAL REPORT - FISCAL YEAR ENDED DECEMBER 31, 2016 - NOTES 165
These workforce optimizations will be partially offset by strategic hiring to support the ramp-up for key growth programs, including the C Series and Global 7000 and 8000 aircraft programs, major rail contract wins, as well as to support the growth strategy in aftermarket businesses.
Over the course of the 2016 resizing, the Corporation recorded restructuring charges of $215 million, consisting mainly of severance, as special items. The Corporation anticipates recording $250 million to $300 million in restructuring charges, to be reported as special items when accrued, in 2017.
9. FINANCING EXPENSE AND FINANCING INCOME
Financing expense and financing income were as follows, for fiscal years:
2016 2015Financing expense
Loss on repurchase of long-term debt(1) $ 86 $ 22Net loss on certain financial instruments(2)(3) 80 82Accretion on net retirement benefit obligations 66 72Accretion on other financial liabilities 59 28Tax litigation(4) 26 —Amortization of letter of credit facility costs 24 20Accretion on provisions 13 7Transaction costs(5) 8 —Other 82 30
444 261Interest on long-term debt, after effect of hedges 375 157
$ 819 (6) $ 418 (6)
Financing income
Changes in discount rates of provisions $ (17) $ (7)Other (21) (20)
(38) (27)Interest on cash and cash equivalents (13) (7)Income from investment in securities (11) (15)Interest on loans and lease receivables, after effect of hedges (8) (21)
(32) (43)$ (70) (7) $ (70) (7)
(1) Represents the loss related to the redemption of the $650-million and $750-million Senior Notes due 2018 for fiscal year 2016, which was recorded as a special item ($22 million represents the loss related to the redemption of the $750-million Senior Notes due 2016 for fiscal year 2015, which was recorded as a special item).
(2) Net losses (gains) on certain financial instruments classified as FVTP&L, including losses (gains) arising from changes in interest rates.(3) Includes $41 million of special items for fiscal year 2015. See Note 8 – Special items for more details.(4) Represents a change in the estimates used to determine the provision related to tax litigation. See Note 8 – Special items for more details.(5) Represents transaction costs attributable to the conversion option embedded in the CDPQ investment in BT Holdco. See Note 10 – Non-
controlling interest for more details.(6) Of which $446 million represents the interest expense calculated using the effective interest rate method for financial liabilities classified as
other than HFT for fiscal year 2016 ($192 million for fiscal year 2015).(7) Of which $23 million represents the interest income calculated using the effective interest rate method for financial assets classified as L&R
for fiscal year 2016 ($14 million for fiscal year 2015).
Borrowing costs capitalized to PP&E and intangible assets totalled $122 million for fiscal year 2016, using an average capitalization rate of 5.48% ($305 million and 5.31% for fiscal year 2015). Capitalized borrowing costs are deducted from the related interest expense (i.e. interest on long-term debt or accretion on other financial liabilities, if any).

166 BOMBARDIER INC. FINANCIAL REPORT - FISCAL YEAR ENDED DECEMBER 31, 2016
10. NON-CONTROLLING INTEREST
The summarized statement of financial position for BT Holdco, which has significant NCI, was as follows, as at:
December 31, 2016BT Holdco
Current assets $ 3,885Non-current assets 3,824Total assets $ 7,709
Current liabilities $ 5,413Non-current liabilities 1,440Total liabilities $ 6,853
Net assets $ 856
The selected income and cash flow information for BT Holdco, which has significant NCI, was as follows, for fiscal year:
2016BT Holdco
Revenues $ 7,574Net income $ 9Comprehensive loss $ (392)
Cash flows from operating activities $ 666Cash flows from investing activities $ (80)Cash flows from financing activities $ (322)
The changes to the accumulated NCI for BT Holdco, which has significant NCI, were as follows:
BT HoldcoBalance as at December 31, 2015 $ —
Issuance of NCI 1,281Minimum return entitlement 146OCI (80)Dividends (73)
Balance as at December 31, 2016 $ 1,274
CDPQ investment in BT Holdco On February 11, 2016, Bombardier closed the sale to the CDPQ of a $1.5-billion convertible share investment in Bombardier Transportation’s newly-created holding company, Bombardier Transportation (Investment) UK Limited (BT Holdco). Under the terms of the investment, Bombardier Inc. sold voting shares convertible into a 30% common equity stake of BT Holdco to the CDPQ, subject to annual adjustments related to performance.
Following the completion of the previously announced corporate reorganization, BT Holdco owns essentially all of the assets and liabilities of Bombardier’s Transportation business segment, its operational headquarters remains in Germany and continues to be consolidated in Bombardier’s financial results.
Key terms of the investment The CDPQ is entitled to its pro-rata portion (on an as-converted basis, initially equal to 30% of BT Holdco common shares) of any dividends declared.
Dividends are payable in cash or, subject to certain conditions, in additional convertible shares at the option of BT Holdco (any such issuance to increase the CDPQ’s participation).

BOMBARDIER INC. FINANCIAL REPORT - FISCAL YEAR ENDED DECEMBER 31, 2016 - NOTES 167
Performance incentives The terms of the transaction provide strong performance incentives for Transportation. For each of the first five years following the closing date, the CDPQ’s ownership (on conversion) and return may be subject to upward or downward annual adjustments, based on performance targets jointly agreed to as part of Transportation’s business plan.
If Transportation outperforms its business plan, the CDPQ’s percentage of ownership on conversion of its shares decreases by 2.5% annually, down to a minimum threshold of 25%. In this circumstance, the convertible shares’ minimum return also decreases from 9.5% to a floor of 7.5%.
Conversely, should Transportation underperform relative to its plan, the CDPQ’s percentage of ownership on conversion of its shares will increase by 2.5% annually, up to a maximum of 42.5% over a five-year period. In this case, the convertible shares’ minimum return also increases from 9.5% up to 12%.
As at December 31, 2016, the CDPQ’s percentage of ownership on conversion of its shares would be 30% since Transportation has met its performance target for fiscal year 2016. As a result, the CDPQ’s minimum return for 2017 will be 9.5%.
Shareholders rights and exit Under the terms of the investment, the CDPQ has standard minority protection rights, including: pre-emptive rights, a right of first offer, and tag-along rights, and Bombardier has a right of first offer and customary drag-along rights, in each case subject to certain conditions.
Bombardier has the ability to buy back the CDPQ’s investment upon specified terms at any time on or after the third anniversary of the closing of the investment, at the higher of the fair market value (on an as-converted basis) or a minimum of 15% compounded annual return to the CDPQ.
At any time on or after February 11, 2021, and provided that Bombardier has not exercised its right to buy back the CDPQ’s investment before then, the CDPQ will have the right to cause BT Holdco to proceed with a secondary initial public offering (IPO) or a sale of 100% of its shares.
In the case of an IPO, the conversion ratio of the CDPQ’s shares will be adjusted so that, immediately prior to the IPO, the CDPQ receives shares having a value equal to the higher of: (i) the value of its shares, on an as-converted basis, based on the implied value of the IPO; or (ii) the minimum return adjusted for any distributions, in both cases taking into account changes, if any, resulting from the effect of the performance incentives. The CDPQ’s shares would be sold in priority to Bombardier’s shares as part of the secondary IPO.
In the case of a sale of 100% of the BT Holdco shares, the CDPQ will have the right to receive an amount equal to the higher of: (i) the value of its shares, on an as-converted basis, based on the implied value of the sale to a third party; or (ii) the minimum return adjusted for any distributions, in both cases taking into account changes, if any, resulting from the effect of the performance incentives.
Upon a change of control of Bombardier Inc. or, in certain circumstances, of BT Holdco, the CDPQ will have the right to require an IPO or a sale of 100% of the BT Holdco shares and to receive the higher of: (i) the value of the common shares held by the CDPQ on an as-converted basis, based on the implied value of the IPO or sale to a third party, as discussed above; or (ii) a minimum three-year 15% compounded annual return (or at any time after three years, a 15% compounded annual return).
Other details of the transaction The parties have agreed to a consolidated Bombardier cash position at the end of each quarter of at least $1.25 billion. This condition was met as at December 31, 2016. In the event Bombardier’s cash position falls below that level, the Board of directors of Bombardier will create a Special Initiatives Committee composed of three independent directors acceptable to the CDPQ, who would be responsible to develop an action plan to improve cash. The implementation of the plan, once agreed with the CDPQ, would be overseen by the Special Initiatives Committee.

168 BOMBARDIER INC. FINANCIAL REPORT - FISCAL YEAR ENDED DECEMBER 31, 2016
Warrants The investment included the issuance by Bombardier to the CDPQ of warrants exercisable for a total number of 105,851,872 Class B Shares (subordinate voting) in the capital of Bombardier Inc. (Class B Subordinate Voting Shares). The warrants are exercisable until February 11, 2023 at an exercise price per Class B Subordinate Voting Shares equal to $1.66, the U.S. dollar equivalent of $2.21 CDN at the date of execution of the subscription agreement.
The warrants contain market standard adjustment provisions, including in the event of corporate changes, stock splits, non-cash dividends, distributions of rights, options or warrants to all or substantially all shareholders or consolidations.
Fair value of warrantsThe fair value of warrants as at February 11, 2016 was $0.10 per warrant for a total amount of $11 million. The fair value of each warrant was determined using a Black-Scholes option pricing model, which incorporates the share price at the issuance date, and the following assumptions, as at February 11, 2016:
Risk-free interest rate 0.79%Expected life 7 yearsExpected volatility in market price of shares 42.96%Expected dividend yield 0.00%
CDPQ equity and derivative liability components The convertible shares issued to the CDPQ contain no obligation for Bombardier to deliver cash or other financial assets to the CDPQ. The convertible shares are considered to be a compound instrument comprised of an equity component, representing the discretionary dividends and liquidation preference, and a liability component that reflects a derivative to settle the instrument by delivering a variable number of common shares of BT Holdco. The Corporation presents convertible shares in its equity (NCI) and derivative liability components on the statements of financial position.
The fair value of the convertible shares at issuance was assigned to its respective equity and derivative liability components so that no gain or loss arose from recognizing each component separately. The fair value of the derivative liability is established first, using an internal valuation model based on stochastic simulations. The equity component was determined by deducting the fair value of the derivative liability component from the fair value on the date of issuance of the compound instrument as a whole. The derivative liability is subsequently marked to market with changes in fair value recorded in financing expense or income.
Government of Québec investment in the C Series aircraft programOn June 30, 2016, Bombardier closed the $1.0-billion investment by the Government of Québec (through Investissement Québec) in return for a 49.5% equity stake in a newly-created limited partnership, the C Series Aircraft Limited Partnership (CSALP), to which we have transferred the assets, liabilities and obligations of the C Series aircraft program. CSALP is owned 50.5% by Bombardier Inc. and, as a subsidiary of Bombardier Inc., will carry on the operations related to our C Series aircraft program. CSALP continues to be consolidated in our financial results.
Bombardier received the investment in two installments of $500-million each on June 30, 2016 and September 1, 2016. The proceeds of the investment are being used entirely for cash flow purposes of the C Series aircraft program. Under the terms of the limited partnership agreement, the Corporation has committed to invest additional capital contributions in CSALP up to a maximum amount of $1.0 billion in case of any liquidity shortfall in CSALP. Additional capital contributions by the Corporation would increase its ownership interest in CSALP.
The investment contemplates a continuity undertaking providing that we maintain in the Province of Québec, for a period of 20 years, CSALP’s operational, financial and strategic headquarters, manufacturing and engineering activities, policies, practices and investment plans for research and development, in each case in respect of the design, manufacture and marketing of the CS100 and CS300 aircraft and after-sales services for these aircraft and that we will operate the facilities located in Mirabel, Canada for these purposes.

BOMBARDIER INC. FINANCIAL REPORT - FISCAL YEAR ENDED DECEMBER 31, 2016 - NOTES 169
As at December 31, 2016, CSALP had total assets amounting to $3,933 million, of which $2,535 million was aerospace program tooling ($3,322 million as at June 30, 2016 of which $2,425 million was aerospace program tooling). CSALP has no long-term debt.
Subject to certain conditions, the Corporation has the right to repurchase Investissement Québec’s interest in CSALP at fair market value.
WarrantsAlso on June 30 and September 1, 2016 Bombardier issued, in the name of Investissement Québec, warrants exercisable for a total number of 100,000,000 Class B Subordinate Voting Shares in the capital of Bombardier Inc., exercisable for a period of five years at an exercise price per share equal to $1.72 U.S. dollars, being the equivalent of $2.21 Canadian dollars using the exchange rate at the date of execution of the subscription agreement.
The warrants contain market standard adjustment provisions, including in the event of corporate changes, stock splits, reverse stock splits, non-cash dividends or distributions of rights, options or warrants to all or substantially all shareholders.
Fair value of warrantsThe fair value of warrants as at June 30, 2016 was $0.58 per warrant and as at September 1, 2016 was $0.66 per warrant, for a total amount of $62 million. The fair value of each warrant was determined using a Black-Scholes option pricing model, which incorporates the share price at the issuance date, and the following assumptions, as at June 30, 2016 and as at September 1, 2016:
September 1, 2016 June 30, 2016Risk-free interest rate 0.64% 0.57%Expected life 5 years 5 yearsExpected volatility in market price of shares 48.84% 49.41%Expected dividend yield 0.00% 0.00%
11. EMPLOYEE BENEFIT COSTS
Employee benefit costs(1) were as follows, for fiscal years:
Notes 2016 2015Wages, salaries and other employee benefits $ 4,887 $ 5,411Retirement benefits(2) 22 255 478Share-based expense 29 22 14Restructuring, severance and other involuntary termination costs 7, 8 221 25
$ 5,385 $ 5,928(1) Employee benefit costs include costs capitalized as part of the cost of inventories and other self-constructed assets. (2) Includes defined benefit and defined contribution plans.

170 BOMBARDIER INC. FINANCIAL REPORT - FISCAL YEAR ENDED DECEMBER 31, 2016
12. INCOME TAXES
Analysis of income tax expenseDetails of income tax expense were as follows, for fiscal years:
2016 2015Current income taxes $ 143 $ 91Deferred income taxes 31 63
$ 174 $ 154
The reconciliation of income taxes, computed at the Canadian statutory rates, to income tax expense was as follows, for fiscal years:
2016 2015EBT $ (807) $(5,186)Canadian statutory tax rate 26.8 % 26.8 %Income tax recovery at statutory rate (216) (1,390)Increase (decrease) resulting from
Non-recognition of tax benefits related to tax losses and temporary differences 383 1,618Write-down of deferred income tax assets 72 311Income tax rates differential of foreign subsidiaries and other investees (1) (130)Recognition of previously unrecognized tax losses or temporary differences (65) (284)Permanent differences (6) (49)Effect of substantively enacted income tax rate changes 3 (9)Other 4 87
Income tax expense $ 174 $ 154 (1)
Effective tax rate (21.6)% (3.0)%(1) An income tax expense of $106 million was recorded for fiscal year 2015 as a result of the special item in relation to the reorganization and
consolidation of Transportation under one holding entity necessary to facilitate the planned investment in a minority stake in Transportation.
The Corporation’s applicable Canadian statutory tax rate is the Federal and Provincial combined tax rate applicable in the jurisdiction in which the Corporation operates.
Details of deferred income tax expense were as follows, for fiscal years:
2016 2015Non-recognition of tax benefits related to tax losses and temporary differences $ 383 $ 1,618Origination and reversal of temporary differences (362) (1,573)Write-down of deferred income tax assets 72 311Recognition of previously unrecognized tax losses or temporary differences (65) (284)Effect of substantively enacted income tax rate changes 3 (9)
$ 31 $ 63

BOMBARDIER INC. FINANCIAL REPORT - FISCAL YEAR ENDED DECEMBER 31, 2016 - NOTES 171
Deferred income taxes The significant components of the Corporation’s deferred income tax asset and liability were as follows, as at:
December 31, 2016 December 31, 2015 January 1, 2015Asset Liability Asset Liability Asset Liability
Operating tax losses carried forward $ 1,891 $ — $ 1,928 $ — $ 1,919 $ —Retirement benefits 588 — 459 — 609 —Advance and progress billings in excess of long-term contract inventories and advances on aerospace programs 628 — 817 — 1,007 —Inventories 790 — 469 — 120 —Provisions 809 — 596 — 428 —Other financial assets and other assets (49) — (95) — (161) —PP&E 11 — (30) — (55) —Other financial liabilities and other liabilities 135 — 253 — 231 —Intangible assets (136) — (48) — (436) —Other 99 — 173 — 175 —
4,766 — 4,522 — 3,837 —Unrecognized deferred tax assets (4,061) — (3,761) — (2,962) —
$ 705 $ — $ 761 $ — $ 875 $ —
The changes in the net deferred income tax asset were as follows for the fiscal years:
2016 2015Balance at beginning of year, net $ 761 $ 875
In net income (31) (63)In OCI
Retirement benefits 73 (11)Cash flow hedges (82) (6)
Other(1) (16) (34)Balance at end of year, net $ 705 $ 761
(1) Mainly comprises foreign exchange rate effects.
The net operating losses carried forward and deductible temporary differences for which deferred tax assets have not been recognized amounted to $13,939 million as at December 31, 2016, of which $1,401 million relates to retirement benefits that will reverse through OCI ($12,548 million as at December 31, 2015 of which $1,170 million relates to retirement benefits that will reverse through OCI and $9,688 million as at January 1, 2015 of which $1,718 million relates to retirement benefits that will reverse through OCI). Of these amounts, approximately $10,560 million as at December 31, 2016 has no expiration date ($9,832 million as at December 31, 2015 and $7,383 million as at January 1, 2015) and approximately $2,007 million relates to the Corporation’s operations in Germany where a minimum income tax is payable on 40% of taxable income ($1,846 million as at December 31, 2015 and $2,214 million as at January 1, 2015) and $359 million relate to the Corporation’s operations in France where a minimum income tax is payable on 50% of taxable income ($476 million as at December 31, 2015 and $444 million as at January 1, 2015).
In addition, the Corporation has $1,537 million of unused investment tax credits, most of which can be carried forward for 20 years and $72 million of net capital losses carried forward for which deferred tax assets have not been recognized ($1,467 million and $75 million as at December 31, 2015 and $694 million and $80 million as at January 1, 2015). Net capital losses can be carried forward indefinitely and can only be used against future taxable capital gains.
Net deferred tax assets of $520 million were recognized as at December 31, 2016 ($663 million as at December 31, 2015 and $242 million as at January 1, 2015) in jurisdictions that incurred losses this fiscal year or the preceding fiscal year. Based upon the level of historical taxable income, projections for future taxable income and prudent tax planning strategies, management believes it is probable the Corporation will realize the benefits of these deductible differences and operating tax losses carried forward. See Note 4 – Use of estimates and judgment for more information on how the Corporation determines the extent to which deferred income tax assets are recognized.

172 BOMBARDIER INC. FINANCIAL REPORT - FISCAL YEAR ENDED DECEMBER 31, 2016
No deferred tax liabilities have been recognized on undistributed earnings of the Corporation’s foreign subsidiaries, joint ventures and associates when they are considered to be indefinitely reinvested, as the Corporation has control or joint control over the dividend policy, unless it is probable that these temporary differences will reverse. Upon distribution of these earnings in the form of dividends or otherwise, the Corporation may be subject to corporation and/or withholding taxes. Taxable temporary differences for which a deferred tax liability was not recognized amount to approximately $392 million as at December 31, 2016 ($369 million as at December 31, 2015 and $343 million as at January 1, 2015).
13. EARNINGS PER SHARE
Basic and diluted EPS were computed as follows, for fiscal years:
2016 2015(Number of shares, stock options, PSUs, DSUs, RSUs and warrants in thousands)Net loss attributable to equity holders of Bombardier Inc. $ (1,022) $ (5,347)Preferred share dividends, including taxes (32) (23)Net loss attributable to common equity holders of Bombardier Inc. $ (1,054) $ (5,370)Weighted-average number of common shares outstanding 2,212,547 2,082,683Net effect of stock options, PSUs, DSUs, RSUs, warrants and conversion option — —Weighted-average diluted number of common shares 2,212,547 2,082,683EPS (in dollars)
Basic and diluted $ (0.48) $ (2.58)
The effect of the exercise of stock options, PSUs, DSUs, RSUs and warrants was included in the calculation of diluted EPS in the above table, except for 258,707,646 for fiscal year 2016 (76,722,282 stock options, PSUs, DSUs and RSUs for fiscal year 2015) since the average market value of the underlying shares was lower than the exercise price, or because the predetermined target market price thresholds of the Corporation’s Class B Shares (subordinate voting) or predetermined financial performance targets had not been met or the effect of the exercise would be antidilutive. The calculation of diluted EPS did not include the impact of the CDPQ conversion option since the minimum return entitlement was greater than CDPQ’s shares of the BT Holdco net income on an as converted basis assuming Transportation does not achieve its performance targets.
14. FINANCIAL INSTRUMENTS
Net gains (losses) on financial instruments recognized in income were as follows, for fiscal years:
2016 2015Financial instruments measured at amortized cost
L&R - impairment charges $ (15) $ (7)Financial instruments measured at fair value
FVTP&L - changes in fair valueDesignated as FVTP&L
Financial assets $ 5 $ (101)Financial liabilities $ (18) $ 22
Required to be classified as HFTDerivatives not designated in hedging relationships $ (41) $ (70)Other(1) $ (52) $ (26)
(1) Excluding the interest income portion related to cash and cash equivalents of $13 million for the fiscal year 2016 ($7 million for fiscal year 2015).

BOMBARDIER INC. FINANCIAL REPORT - FISCAL YEAR ENDED DECEMBER 31, 2016 - NOTES 173
Carrying amounts and fair value of financial instrumentsThe classification of financial instruments and their carrying amounts and fair value of financial instruments were as follows as at:
FVTP&L
HFT Designated AFSAmortized
cost(1)
DDHR
Totalcarrying
value Fair valueDecember 31, 2016
Financial assetsCash and cash equivalents $ 3,384 $ — $ — $ — $ — $ 3,384 $ 3,384Trade and other receivables — — — 1,291 — 1,291 1,291Other financial assets 144 227 374 310 196 1,251 1,272
$ 3,528 $ 227 $ 374 $ 1,601 $ 196 $ 5,926 $ 5,947Financial liabilities
Trade and other payables $ — $ 6 n/a $ 3,233 $ — $ 3,239 $ 3,239Long-term debt(2) — — n/a 8,769 — 8,769 8,624Other financial liabilities 259 141 n/a 808 368 1,576 1,616
$ 259 $ 147 n/a $ 12,810 $ 368 $ 13,584 $ 13,479
December 31, 2015Financial assets
Cash and cash equivalents $ 2,720 $ — $ — $ — $ — $ 2,720 $ 2,720Trade and other receivables — — — 1,473 — 1,473 1,473Other financial assets 13 230 348 380 349 1,320 1,326
$ 2,733 $ 230 $ 348 $ 1,853 $ 349 $ 5,513 $ 5,519Financial liabilities
Trade and other payables $ — $ 1 n/a $ 4,039 $ — $ 4,040 $ 4,040Long-term debt(2) — — n/a 8,979 — 8,979 6,767Other financial liabilities 41 135 n/a 702 661 1,539 1,426
$ 41 $ 136 n/a $ 13,720 $ 661 $ 14,558 $ 12,233
January 1, 2015Financial assets
Cash and cash equivalents $ 2,489 $ — $ — $ — $ — $ 2,489 $ 2,489Trade and other receivables — — — 1,538 — 1,538 1,538Other financial assets 43 578 330 422 485 1,858 1,869
$ 2,532 $ 578 $ 330 $ 1,960 $ 485 $ 5,885 $ 5,896Financial liabilities
Trade and other payables $ — $ 18 n/a $ 4,198 $ — $ 4,216 $ 4,216Long-term debt(2) — — n/a 7,683 — 7,683 7,692Other financial liabilities 73 172 n/a 719 592 1,556 1,655
$ 73 $ 190 n/a $ 12,600 $ 592 $ 13,455 $ 13,563(1) Financial assets are classified as L&R and financial liabilities as other than HFT. (2) Includes the current portion of long-term debt. n/a: Not applicable

174 BOMBARDIER INC. FINANCIAL REPORT - FISCAL YEAR ENDED DECEMBER 31, 2016
Offsetting financial assets and financial liabilitiesThe Corporation is subject to enforceable master netting agreements related mainly to its derivative financial instruments and cash and cash equivalents which contain a right of set-off in case of default, insolvency or bankruptcy. The amounts that are subject to the enforceable master netting agreements, but which do not meet some or all of the offsetting criteria, are as follows as at:
Description of recognized financial assets and liabilities
Amount recognizedin the financial
statements
Amounts subjectto master netting
agreements
Net amount notsubject to master
netting agreements
December 31, 2016Derivative financial instruments - assets $ 340 $ (177) $ 163Derivative financial instruments - liabilities $ (627) $ 321 $ (306)Cash and cash equivalents $ 3,384 $ (144) $ 3,240
December 31, 2015Derivative financial instruments - assets $ 362 $ (216) $ 146Derivative financial instruments - liabilities $ (702) $ 455 $ (247)Cash and cash equivalents $ 2,720 $ (239) $ 2,481
January 1, 2015Derivative financial instruments - assets $ 528 $ (271) $ 257Derivative financial instruments - liabilities $ (665) $ 344 $ (321)Cash and cash equivalents $ 2,489 $ (73) $ 2,416
Derivatives and hedging activitiesThe carrying amounts of all derivative and non-derivative financial instruments in a hedge relationship were as follows, as at:
December 31, 2016 December 31, 2015 January 1, 2015Assets Liabilities Assets Liabilities Assets Liabilities
Derivative financial instruments designated as fair value hedges
Interest-rate swaps $ 58 $ — $ 93 $ — $ 226 $ —Derivative financial instruments designated as cash flow hedges(1)
Forward foreign exchange contracts 138 368 256 661 259 592Derivative financial instruments classified as HFT(2)
Forward foreign exchange contracts 58 86 13 41 29 72Interest-rate swaps — — — — — 1Embedded derivative financial instruments
Conversion option — 170 — — — —Call options on long-term debt 11 — — — 14 —Other 75 3 — — — —
144 259 13 41 43 73Total derivative financial instruments $ 340 $ 627 $ 362 $ 702 $ 528 $ 665Non-derivative financial instruments designated as hedges of net investment
Long-term debt $ — $ — $ — $ — $ — $ 23(1) The maximum length of time of derivative financial instruments hedging the Corporation’s exposure to the variability in future cash flows for
anticipated transactions is 24 months as at December 31, 2016.(2) Held as economic hedges, except for embedded derivative financial instruments.
The net losses on hedging instruments designated in fair value hedge relationships and net gains on the related hedged items attributable to the hedged risk recognized in financing expense, amounted to $24 million and $25 million respectively for fiscal year 2016 (net losses of $46 million and net gains of $50 million respectively for fiscal year 2015). The methods and assumptions used to measure the fair value of financial instruments are described in Note 34 – Fair value of financial instruments.

BOMBARDIER INC. FINANCIAL REPORT - FISCAL YEAR ENDED DECEMBER 31, 2016 - NOTES 175
15. CASH AND CASH EQUIVALENTS
Cash and cash equivalents were as follows, as at:
December 31, 2016 December 31, 2015 January 1, 2015Cash $ 1,375 $ 1,235 $ 997Cash equivalents
Term deposits 1,105 746 796Money market funds 904 739 696
Cash and cash equivalents $ 3,384 $ 2,720 $ 2,489
See Note 31 – Credit facilities for details on covenants related to cash and cash equivalents. See Note 10 – Non-controlling interest for details on the agreement with CDPQ related to a consolidated Bombardier cash position of at least $1.25 billion at the end of each quarter.
16. TRADE AND OTHER RECEIVABLES
Trade and other receivables were as follows, as at:
Past due but not impaired (3)
TotalNot past
due less than
90 daysmore than
90 days Impaired (4)
December 31, 2016(1)(2)
Trade receivables, gross $ 1,209 $ 861 $ 118 $ 121 $ 109Allowance for doubtful accounts (44) — — — (44)
1,165 $ 861 $ 118 $ 121 $ 65Other 126Total $ 1,291
December 31, 2015(1)(2)
Trade receivables, gross $ 1,372 $ 908 $ 263 $ 72 $ 129Allowance for doubtful accounts (36) — — — (36)
1,336 $ 908 $ 263 $ 72 $ 93Other 137Total $ 1,473
January 1, 2015(1)(2)
Trade receivables, gross $ 1,453 $ 717 $ 238 $ 381 $ 117Allowance for doubtful accounts (39) — — — (39)
1,414 $ 717 $ 238 $ 381 $ 78Other 124Total $ 1,538
(1) Of which $349 million and $428 million are denominated in euros and other foreign currencies, respectively, as at December 31, 2016 ($390 million and $452 million, respectively, as at December 31, 2015 and $355 million and $475 million, respectively, as at January 1, 2015).
(2) Of which $259 million represents customer retentions relating to long-term contracts as at December 31, 2016 based on normal terms and conditions ($233 million as at December 31, 2015 and $419 million as at January 1, 2015).
(3) Of which $183 million of trade receivables relates to Transportation long-term contracts as at December 31, 2016, of which $121 million were more than 90 days past due ($243 million as at December 31, 2015, of which $69 million were more than 90 days past due and $525 million as at January 1, 2015, of which $376 million were more than 90 days past due). Transportation assesses whether these receivables are collectible as part of its risk management practices applicable to long-term contracts as a whole.
(4) Of which a gross amount of $27 million of trade receivables are individually impaired as at December 31, 2016 ($66 million as at December 31, 2015 and $71 million as at January 1, 2015).

176 BOMBARDIER INC. FINANCIAL REPORT - FISCAL YEAR ENDED DECEMBER 31, 2016
The factors that the Corporation considers to classify trade receivables as impaired are as follows: the customer is in bankruptcy or under administration, payments are in dispute, or payments are in arrears. Further information on financial risk is provided in Note 33 – Financial risk management.
Allowance for doubtful accounts – Changes in the allowance for doubtful accounts were as follows, for fiscal years:
2016 2015Balance at beginning of year $ (36) $ (39)
Provision for doubtful accounts (15) (7)Amounts written-off 4 6Recoveries 2 1Effect of foreign currency exchange rate changes 1 3
Balance at end of year $ (44) $ (36)
Off-balance sheet factoring facilitiesIn the normal course of its business, Transportation has factoring facilities mainly in Europe to which it can sell, without credit recourse, qualifying trade receivables. Trade receivables of €820 million ($864 million) were outstanding under such facilities as at December 31, 2016 (€871 million ($948 million) as at December 31, 2015 and €974 million ($1,183 million) as at January 1, 2015). Trade receivables of €993 million ($1,099 million) were sold to these facilities during fiscal year 2016 (€1,293 million ($1,435 million) during fiscal year 2015).
17. INVENTORIES
Inventories were as follows, as at:
December 31, 2016 December 31, 2015 January 1, 2015Aerospace programs $ 3,187 $ 4,215 $ 4,600Long-term contracts
Production contractsCost incurred and recorded margins 6,995 7,064 7,369Less: advances and progress billings (5,457) (5,490) (5,558)
1,538 1,574 1,811Service contracts
Cost incurred and recorded margins 221 223 310Less: advances and progress billings (6) (17) (17)
215 206 293Finished products(1) 904 983 1,266
$ 5,844 $ 6,978 $ 7,970(1) Finished products include 1 new aircraft not associated with a firm order and 12 pre-owned aircraft, totaling $67 million as at
December 31, 2016 (4 new aircraft and 54 pre-owned aircraft, totaling $279 million as at December 31, 2015 and 1 new aircraft and 57 pre-owned aircraft, totaling $485 million as at January 1, 2015).
Finished products as at December 31, 2016 include $19 million of pre-owned aircraft legally sold to third parties and leased back under sale and leaseback facilities ($81 million as at December 31, 2015 and $248 million as at January 1, 2015). The related sales proceeds are accounted for as sale and leaseback obligations.
The amount of inventories recognized as cost of sales totalled $13,611 million for fiscal year 2016 ($15,232 million for fiscal year 2015). These amounts include $244 million of write-downs for fiscal year 2016 ($359 million for fiscal year 2015). Reversal of write-down of $16 million is recognized for fiscal year 2016 ($7 million for fiscal year 2015). An additional write-down of $57 million was recognized in special items for fiscal year 2015. See note 8 - Special items for more details.

BOMBARDIER INC. FINANCIAL REPORT - FISCAL YEAR ENDED DECEMBER 31, 2016 - NOTES 177
Under certain contracts, title to inventories is vested to the customer as the work is performed, in accordance with contractual arrangements and industry practice. In addition, in the normal course of business, the Corporation provides performance bonds, bank guarantees and other forms of guarantees to customers, mainly in Transportation, as security for advances received from customers pending performance under certain contracts. In accordance with industry practice, the Corporation remains liable to the purchasers for the usual contractor’s obligations relating to contract completion in accordance with predetermined specifications, timely delivery and product performance.
Advances and progress billings received on long-term contracts in progress were $7,002 million as at December 31, 2016 ($6,916 million as at December 31, 2015 and $7,273 million as at January 1, 2015). Revenues include revenues from Transportation long-term contracts, which amounted to $5,849 million for fiscal year 2016 ($6,208 million for fiscal year 2015).
In connection with certain long-term contracts, Transportation enters into arrangements whereby amounts are received from third-party advance providers in exchange for the rights to customer payments. There is no recourse to Transportation if the customer defaults on its payment obligations assigned to the third-party advance provider. Amounts received under these arrangements are included as advances and progress billings in reduction of long-term contracts (production contracts) inventories and amounted to €471 million ($496 million) as at December 31, 2016 (€334 million ($364 million) as at December 31, 2015). The third-party advance providers could request repayment of these amounts if Transportation fails to perform its contractual obligations under the related long-term contract.
18. OTHER FINANCIAL ASSETS
Other financial assets were as follows, as at:
December 31, 2016 December 31, 2015 January 1, 2015Investments in securities(1)(2) $ 380 $ 359 $ 346Derivative financial instruments(3) 340 362 528Long-term contract receivables(4) 231 298 321Investments in financing structures(2) 211 197 360Aircraft loans and lease receivables(2)(5) 64 81 275Restricted cash 10 11 17Other 15 12 11
$ 1,251 $ 1,320 $ 1,858Of which current $ 336 $ 450 $ 530Of which non-current 915 870 1,328
$ 1,251 $ 1,320 $ 1,858(1) Includes $78 million of securities to secure contingent capital contributions to be made in relation to guarantees issued in connection with
the sale of aircraft as at December 31, 2016 ($80 million as at December 31, 2015 and $70 million January 1, 2015).(2) Carried at fair value, except for $2 million of aircraft loans and lease receivables, $6 million of investments in securities and $46 million of
investment in financing structures carried at amortized cost as at December 31, 2016 ($2 million, $11 million and $46 million, respectively, as at December 31, 2015 and $12 million, $16 million and $45 million, respectively, as at January 1, 2015).
(3) See Note 14 – Financial instruments.(4) See Note 33 – Financial risk management.(5) Financing with three airlines represents 75% of the total aircraft loans and lease receivables as at December 31, 2016 (three airlines
represented 64% as at December 31, 2015 and January 1, 2015). Aircraft loans and lease receivables are generally collateralized by the related assets. The value of the collateral is closely related to commercial airline industry performance and aircraft-specific factors (age, type-variant and seating capacity), as well as other factors.

178 BOMBARDIER INC. FINANCIAL REPORT - FISCAL YEAR ENDED DECEMBER 31, 2016
19. OTHER ASSETS
Other assets were as follows, as at:
December 31, 2016 December 31, 2015 January 1, 2015Prepaid sales concessions and deferred contract costs(1) $ 300 $ 341 $ 659Sales tax and other taxes 238 244 238Prepaid expenses 145 174 202Retirement benefits(2) 124 251 159Intangible assets other than aerospace program tooling and goodwill(3) 112 114 156Deferred financing charges 51 72 37Income taxes receivable 41 56 64Other 30 29 33
$ 1,041 $ 1,281 $ 1,548Of which current $ 441 $ 484 $ 592Of which non-current 600 797 956
$ 1,041 $ 1,281 $ 1,548(1) Note 8 – Special items.(2) See Note 22 – Retirement benefits.(3) See Note 21 – Intangible assets

BOMBARDIER INC. FINANCIAL REPORT - FISCAL YEAR ENDED DECEMBER 31, 2016 - NOTES 179
20. PROPERTY, PLANT AND EQUIPMENT
PP&E were as follows, as at:
Land Buildings EquipmentConstruction
in progress Other TotalCost
Balance as at December 31, 2015 $ 87 $ 2,409 $ 1,418 $ 155 $ 406 $ 4,475Additions — 24 55 107 12 198Disposals (6) (22) (68) — (45) (141)Transfers — 19 60 (90) 11 —Effect of foreign currency exchange rate changes (4) (43) (21) (11) — (79)
Balance as at December 31, 2016 $ 77 $ 2,387 $ 1,444 $ 161 $ 384 $ 4,453Accumulated amortization and impairment
Balance as at December 31, 2015 $ — $ (1,216) $ (935) $ — $ (263) $ (2,414)Amortization — (60) (121) — (12) (193)Impairment (1) (6) (3) — — (10)Disposals — 14 47 — 10 71Effect of foreign currency exchange rate changes — 29 14 — (1) 42
Balance as at December 31, 2016 $ (1) $ (1,239) $ (998) $ — $ (266) $ (2,504)Net carrying value $ 76 $ 1,148 $ 446 $ 161 $ 118 $ 1,949
Land Buildings EquipmentConstruction
in progress Other TotalCost
Balance as at January 1, 2015 $ 91 $ 2,413 $ 1,347 $ 171 $ 422 $ 4,444Additions 3 25 61 139 45 273Disposals (2) (11) (52) — (59) (124)Transfers — 70 77 (148) 1 —Effect of foreign currency exchange rate changes (5) (88) (15) (7) (3) (118)
Balance as at December 31, 2015 $ 87 $ 2,409 $ 1,418 $ 155 $ 406 $ 4,475Accumulated amortization and impairment
Balance as at January 1, 2015 $ — $ (1,212) $ (864) $ — $ (276) $ (2,352)Amortization — (75) (108) — (25) (208)Impairment — — (10) — — (10)Disposals — 11 49 — 41 101Effect of foreign currency exchange rate changes — 60 (2) — (3) 55
Balance as at December 31, 2015 $ — $ (1,216) $ (935) $ — $ (263) $ (2,414)Net carrying value $ 87 $ 1,193 $ 483 $ 155 $ 143 $ 2,061
Included in the table are assets under finance lease where the Corporation is the lessee, presented in Other, with cost and accumulated amortization amounting to $234 million and $111 million, respectively, as at December 31, 2016 ($245 million and $105 million, respectively, as at December 31, 2015 and $243 million and $91 million, respectively, as at January 1, 2015).
Also included in the table are aircraft under operating leases where the Corporation is the lessor, presented in Other, with a cost and accumulated amortization amounting to $3 million and $3 million, respectively, as at December 31, 2016 ($46 million and $11 million, respectively, as at December 31, 2015 and $35 million and $14 million, respectively, as at January 1, 2015). Rental income from operating leases and amortization of assets under operating leases amounted to $1 million and $1 million, respectively, for fiscal year 2016 ($6 million and $16 million, respectively, for fiscal year 2015).

180 BOMBARDIER INC. FINANCIAL REPORT - FISCAL YEAR ENDED DECEMBER 31, 2016
21. INTANGIBLE ASSETS
Intangible assets were as follows, as at:
Aerospace program tooling Goodwill Other (1)(2) Total
AcquiredInternally
generated Total (3)
CostBalance as at December 31, 2015 $ 1,864 $ 11,320 $ 13,184 $ 1,978 $ 683 $ 15,845
Additions 516 829 1,345 — 35 1,380Disposals — — — — (4) (4)Effect of foreign currency exchange rate changes — — — (123) (15) (138)
Balance as at December 31, 2016 $ 2,380 $ 12,149 $ 14,529 $ 1,855 $ 699 $ 17,083Accumulated amortization and impairment
Balance as at December 31, 2015 $ (1,449) $ (7,760) $ (9,209) $ — $ (569) $ (9,778)Amortization (3) (143) (146) — (32) (178)Disposals — — — — 2 2Effect of foreign currency exchange rate changes — — — — 12 12
Balance as at December 31, 2016 $ (1,452) $ (7,903) $ (9,355) $ — $ (587) $ (9,942)Net carrying value $ 928 $ 4,246 $ 5,174 $ 1,855 $ 112 $ 7,141
Aerospace program tooling Goodwill Other (1)(2) Total
AcquiredInternally
generated Total (3)
CostBalance as at January 1, 2015 $ 1,639 $ 9,923 $ 11,562 $ 2,127 $ 714 $ 14,403
Additions 225 1,399 1,624 — 20 1,644Disposals — (2) (2) — (14) (16)Effect of foreign currency exchange rate changes — — — (149) (37) (186)
Balance as at December 31, 2015 $ 1,864 $ 11,320 $ 13,184 $ 1,978 $ 683 $ 15,845Accumulated amortization and impairment
Balance as at January 1, 2015 $ (700) $ (4,039) $ (4,739) $ — $ (558) $ (5,297)Amortization (25) (160) (185) — (45) (230)Impairment (724) (3,561) (4,285) — (5) (4,290)Disposals — — — — 8 8Effect of foreign currency exchange rate changes — — — — 31 31
Balance as at December 31, 2015 $ (1,449) $ (7,760) $ (9,209) $ — $ (569) $ (9,778)Net carrying value $ 415 $ 3,560 $ 3,975 $ 1,978 $ 114 $ 6,067
(1) Presented in Note 19 – Other assets.(2) Includes internally generated intangible assets with a cost and accumulated amortization of $365 million and $296 million, respectively, as
at December 31, 2016 ($365 million and $278 million, respectively, as at December 31, 2015 and $367 million and $254 million, respectively, as at January 1, 2015).
(3) Includes intangible assets under development with a cost of $2,467 million as at December 31, 2016 ($3,622 million as at December 31, 2015 and $6,126 million as at January 1, 2015).
Aerospace program toolingThe net carrying value of aerospace program tooling comprises $2,586 million for Commercial Aircraft, $2,631 million for Business Aircraft, $8 million for Aerostructure and Engineering Services and $(51) million for Corporate and Elimination, respectively, as at December 31, 2016 ($1,914 million, $2,041 million, $20 million and nil, respectively, as at December 31, 2015 and $4,347 million, $2,470 million, $9 million and nil, respectively, as at January 1, 2015).

BOMBARDIER INC. FINANCIAL REPORT - FISCAL YEAR ENDED DECEMBER 31, 2016 - NOTES 181
C Series aircraft program In October 2015, the Corporation entered into a memorandum of understanding for the C Series aircraft program with the Government of Québec. Following the completion of an in-depth review of the C Series aircraft program as well as discussions with the Government of Québec which resulted in the memorandum of understanding, the Corporation performed an impairment test on the C Series aircraft program cash generating unit (the “C Series aircraft program”) which principally consists of capitalized development costs. The Corporation determined that the C Series aircraft program carrying amount exceeded its recoverable amount, and accordingly recorded an impairment charge of $3,070 million, in special items, related to the C Series aircraft program development costs in fiscal year 2015. After the impairment charge, the remaining balance of the C Series aerospace program tooling was $1,850 million as at December 31, 2015.
Learjet 85 aircraft program In fiscal year 2015, due to the lack of sales following the prolonged market weakness, the Corporation announced the cancellation of the Learjet 85 aircraft program. As a result, the Corporation recorded an impairment charge on the remaining $919 million of aerospace program tooling related to the Learjet 85 aircraft program development costs and $5 million on other intangibles, in special items.
CRJ1000 aircraft programIn fiscal year 2015, the Corporation performed an impairment test on the CRJ1000 aircraft program development costs since there were indicators of impairment due to the lack of recent order intake as well as low firm order backlog, mainly stemming from pilot scope clauses in the U.S., which have restricted the use, number and seating capacity of regional aircraft flying on behalf of carrier networks. The Corporation determined that the CRJ1000 aircraft program development costs recoverable amount was negligible and therefore recorded an impairment charge of $243 million, in special items, related to the remaining balance.
Learjet family of aircraft In fiscal year 2015, the Corporation performed an impairment test on the Learjet family cash generating unit (the “Learjet family”) which principally consists of capitalized development costs. The Corporation determined that the Learjet family carrying amount exceeded its recoverable amount, and accordingly recorded an impairment charge of $53 million, in special items, related to the Learjet family development costs. The impairment is following the prolonged market weakness in the light business aircraft category. After the impairment charge, the remaining balance of the Learjet family aerospace program tooling was nil.
Recoverable amountThe recoverable amounts of all aerospace assets or CGUs were based on fair value less costs of disposal. The fair value measurements are categorized within Level 3 of the fair value hierarchy. The estimate of the fair value less costs of disposal was determined using forecast future cash flows that are based on management’s risk-adjusted best estimate of future sales under existing firm orders, expected future orders, timing of payments based on expected delivery schedule, revenues from related services, procurement costs based on existing contracts with suppliers, future labour costs, general market conditions, foreign exchange rates and applicable long-range forecasted income tax rates and a post-tax discount rate of 10% based on a weighted average cost of capital calculated using market-based inputs, available directly from financial markets or based on a benchmark sampling of representative publicly-traded companies in the aerospace sector in fiscal year 2016.
Additional information related to the Corporation’s impairment testing methodology for aerospace program tooling is included in Note 4 - Use of estimates and judgment.
GoodwillGoodwill is related primarily to the DaimlerChrysler Rail Systems GmbH (Adtranz) acquisition in May 2001. Goodwill is monitored by management at the Transportation operating segment level. During the fourth quarter of fiscal year 2016, the Corporation completed an impairment test. The Corporation did not identify any impairment. See Note 4 – Use of estimates and judgment for more details.

182 BOMBARDIER INC. FINANCIAL REPORT - FISCAL YEAR ENDED DECEMBER 31, 2016
22. RETIREMENT BENEFITS The Corporation sponsors several funded and unfunded defined benefit pension plans as well as defined contribution pension plans in Canada and abroad, covering a majority of its employees. The Corporation also provides other unfunded defined benefit plans, covering certain groups of employees mainly in Canada and the U.S.
Pension plans are categorized as defined benefit (“DB”) or defined contribution (“DC”). DB plans specify the amount of benefits an employee is to receive at retirement, while DC plans specify how contributions are determined. As a result, there is no deficit or surplus for DC plans. Hybrid plans are a combination of DB and DC plans.
Funded plans are plans for which segregated plan assets are invested in trust. Unfunded plans are plans for which there are no segregated plan assets, as the establishment of segregated plan assets is generally not permitted or not in line with local practice.
FUNDED DB PLANS
The Corporation’s major DB plans reside in Canada, the U.K. and the U.S., therefore very significant portions of the DB pension plan assets and benefit obligation are located in those countries. The following text focuses mainly on plans registered in these three countries.
Governance
Under applicable pension legislations, the administrator of each plan is either the Corporation, in the case of U.S. plans and Canadian plans registered outside of Québec, or a pension committee, board of trustees or corporate trustee in the case of plans registered in Québec and the U.K.
Plan administrators are responsible for the management of plan assets and the establishment of investment policies, which define, for each plan, investment objectives, target asset allocation, risk mitigation strategies, and other elements required by pension legislation.
Plan assets are pooled in three common investment funds (CIFs) for Canadian, U.K. and U.S. plans, respectively, in order to achieve economies of scale and greater efficiency, diversification and liquidity. The CIFs are broken down by sub-funds or asset classes in order to allow each plan to have its own asset allocation given its associated pension obligation liability profile.
The management of the CIFs has been delegated to three (Canadian, U.K. and U.S.) investment committees (ICs). The ICs are responsible for allocating assets among various sub-funds and asset classes in accordance with each plan’s investment policy. They are also responsible for hiring, monitoring and terminating investment managers and have established a multi-manager structure for each sub-fund and asset class. They are supported by Bombardier Inc. Pension Asset Management Services, who oversee the management of the plans’ assets and of the CIFs on a daily basis. Daily administration of the plans is delegated to either Bombardier Inc. or to external pension administration service providers. The administrators, the ICs and Bombardier Inc. also rely on the expertise of external legal advisors, actuaries, auditors and investment consultants.
Benefit Policy
DB plan benefits are based on salary and years of service. In Canada and the U.S., since September 1, 2013, all new non-unionized employees join DC plans (i.e. they no longer have the option of joining DB or hybrid plans). Employees who are members of a DB or hybrid plan closed to new members continue to accrue service in their original plan.
In the U.K., eight out of nine DB plans are closed to new members. New employees join DC plans. Pension entitlements are indexed to inflation according to pension legislation and plan rules.

BOMBARDIER INC. FINANCIAL REPORT - FISCAL YEAR ENDED DECEMBER 31, 2016 - NOTES 183
Funding requirements
Actuarial valuations are conducted by independent firms hired by the Corporation or the administrators, as required by pension legislation. The purpose of the valuations is to determine the plans’ financial position and the annual contributions to be made by the Corporation to fund both benefits accruing in the year (normal cost) and deficits accumulated over prior years. Minimum funding requirements are set out by applicable pension legislations.
Pension plans in Canada are governed under the Supplemental Pension Plans Act in Québec, the Pension Benefits Act in Ontario and the Income Tax Act. Actuarial valuations are required at least every three years. Depending on the jurisdiction and the funded status of the plan, actuarial valuations may be required annually. Contributions are determined by the appointed actuary and cover future service costs and deficits, as prescribed by laws and actuarial practices. Under the laws in effect, minimum contributions are required to amortize the going-concern deficits (established under the assumption that the plan will continue to be in force) over a period up to fifteen years and, for Ontario registered plans, to amortize solvency deficits (established under the assumption that the plan stops its operations and is being liquidated) over a period of five years. Effective December 31, 2015, Quebec legislation funding rules have changed to eliminate the funding of solvency deficits for ongoing plans. Starting in 2016, funding is based on an “enhanced” going-concern valuation, including a stabilization provision. This provision will be funded by special amortization and current service contributions, and by actuarial gains.
Pension plans in the U.S. are mainly governed under the Employee Retirement Income Security Act, the Internal Revenue Code and the Pension Protection Act of 2006. Actuarial valuations are required annually. Contributions are determined by appointed actuaries and cover future service costs and deficits, as prescribed by law. Funding deficits are generally amortized over a period of seven years.
Pension plans in the U.K. are governed under the Pensions Act of 2004. Actuarial valuations are required at least every three years. The funding deficit amortization period is determined jointly by the administrators and the Corporation.
Investment Policy
The investment policies are established to achieve a long-term investment return so that, in conjunction with contributions, the plans have sufficient assets to pay for the promised benefits while maintaining a level of risk that is acceptable given the tolerance of plan stakeholders. See below for more information about risk management initiatives.
The target asset allocation is determined based on expected economic and market conditions, the maturity profile of the plans’ liabilities, the funded status of the respective plans and the plan stakeholders’ tolerance to risk.
The plans’ investment strategy is to invest broadly in fixed income and equity securities and to have a smaller portion of the funds’ assets invested in real return asset securities (global infrastructure and real estate listed securities).
As at December 31, 2016, the average target asset allocation was as follows:
- 52%, 54% and 51% in fixed income securities, for Canadian, U.K. and U.S. plans, respectively; - 38%, 31% and 44% in equity securities, for Canadian, U.K. and U.S. plans, respectively; and - 10%, 15% and 5% in real return asset securities, for Canadian, U.K. and U.S. plans, respectively.
In addition, to mitigate interest rate risk, interest rate hedging overlay portfolios (comprised of long-term interest rate swaps and long-term bond forwards) were implemented in November 2016 for a small plan and will be implemented for other plans when the market will be favourable and the plans’ triggers will be reached.
The plan administrators have also established dynamic de-risking strategies. As a result, asset allocation will likely become more conservative in the future and interest rate hedging overlay portfolios are likely to be established as plan funding status and market conditions continue to improve. Bombardier Inc. Pension Asset Management Services monitors the de-risking triggers on a daily basis to ensure timely and efficient implementation of these strategies. The Corporation and administrators periodically undertake asset and liability studies to determine the appropriateness of the investment policies and de-risking strategies.

184 BOMBARDIER INC. FINANCIAL REPORT - FISCAL YEAR ENDED DECEMBER 31, 2016
Risk management initiatives
The Corporation’s pension plans are exposed to various risks, including equity, interest rate, inflation, foreign exchange, liquidity and longevity risks. Several risk management strategies and policies have been put in place to mitigate the impact these risks could have on the funded status of DB plans and on the future level of contributions by the Corporation. The following is a description of key risks together with the mitigation measures in place to address them.
Equity risk Equity risk results from fluctuations in equity prices. This risk is managed by maintaining diversification of portfolios across geographies, industry sectors and investment strategies.
Interest rate risk Interest rate risk results from fluctuations in the fair value of plan assets and liabilities due to movements in interest rates. This risk is managed by reducing the mismatch between the duration of plan assets and the duration of pension obligation. This is accomplished by having a portion of the portfolio invested in long-term fixed income securities and interest rate hedging overlay portfolios.
Inflation risk Inflation risk is the risk that benefits indexed to inflation increase significantly as a result of changes in inflation rates. To manage this risk, the benefit indexation has been capped in certain plans and a portion of plan assets has been invested in real return fixed income securities and real return asset securities.
Foreign exchange risk Currency risk exposure arises from fluctuations in the fair value of plan assets denominated in a currency other than the currency of the plan liabilities. Currency risk is managed with foreign currency hedging strategies as per plan investment policies.
Liquidity risk Liquidity risk stems from holding assets which cannot be readily converted to cash when needed for the payment of benefits or to rebalance the portfolios. Liquidity risk is managed through investments in treasury bills, government bonds and equity futures and by having no investments in private placements or hedge funds.
Longevity risk Longevity risk is the risk that increasing life expectancy results in longer-than-expected benefit payments. This risk is mitigated by using the most recent mortality and mortality improvement tables to set the level of contributions.
UNFUNDED DB PLANS
Unfunded plans are located in countries where the establishment of funds for segregated plan assets is generally not permitted or not in line with local practice. The Corporation’s main unfunded DB plans are located in Germany. Nearly two thirds of the German unfunded DB plan liability relate to former plan members who no longer accrue future service benefits. The Corporation contributes annually to the Pensions-Sicherungs-Verein, Germany’s pension protection association, which provides protection for pension benefits up to certain limits in the event that plan sponsors become insolvent.
DC PLANS
A growing proportion of employees are participating in DC plans and, as a result, contributions to DC plans have increased over the past several years. The largest DC plans are located in Canada and in the U.S. The plan administrators and ICs oversee the management of DC plan assets.
OTHER PLANS
The Corporation also provides other unfunded defined benefit plans, consisting essentially of post-retirement healthcare coverage, life insurance benefits and retirement allowances. The Corporation provides post-retirement life insurance and post-retirement health care, with provisions that vary between groups of employees in Canada. New non-unionized hires are generally no longer offered post-retirement health care.

BOMBARDIER INC. FINANCIAL REPORT - FISCAL YEAR ENDED DECEMBER 31, 2016 - NOTES 185
RETIREMENT BENEFITS PLANS
The following table provides the components of the retirement benefit cost, for fiscal years:
2016 2015Pensionbenefits
Otherbenefits Total
Pensionbenefits
Otherbenefits Total
Current service cost $ 260 $ 6 $ 266 $ 302 $ 7 $ 309Accretion expense 55 11 66 60 12 72Past service cost (credit) (1) (140) — (140) 25 — 25Curtailment (22) — (22) (4) — (4)Settlement — — — (3) — (3)Other 1 — 1 1 — 1
DB plans 154 17 171 381 19 400DC plans 84 — 84 78 — 78Total retirement benefit cost $ 238 $ 17 $ 255 $ 459 $ 19 $ 478
Related toFunded DB plans $ 114 n/a $ 114 $ 340 n/a $ 340Unfunded DB plans $ 40 $ 17 $ 57 $ 41 $ 19 $ 60DC plans $ 84 n/a $ 84 $ 78 n/a $ 78
Recorded as followsEBIT expense or capitalized cost $ 183 $ 6 $ 189 $ 399 $ 7 $ 406Financing expense $ 55 $ 11 $ 66 $ 60 $ 12 $ 72
(1) Comprises the reversal of constructive obligations of $139 million. See Note 8 – Special items for more details.n/a: Not applicable
Changes in the cumulative amount of remeasurements gains (losses) of defined benefit plans recognized in OCI, and presented as a separate component of deficit, were as follows, for fiscal years:
Gains (losses)Balance as at January 1, 2015 $ (2,661)
Actuarial gains, net 407Effect of exchange rate changes 185Income taxes (11)
Balance as at December 31, 2015 (2,080)Impact of asset ceiling and minimum liability (5)Actuarial losses, net (764)Effect of exchange rate changes 14Income taxes 73
Balance as at December 31, 2016 $ (2,762)

186 BOMBARDIER INC. FINANCIAL REPORT - FISCAL YEAR ENDED DECEMBER 31, 2016
The following tables present the changes in the defined benefit obligation and fair value of pension plan assets, for fiscal years:
2016 2015Pensionbenefits
Otherbenefits Total
Pensionbenefits
Otherbenefits Total
Change in benefit obligationObligation at beginning of year $ 9,722 $ 266 $ 9,988 $ 10,963 $ 327 $ 11,290 Accretion 365 11 376 378 12 390 Current service cost 260 6 266 302 7 309 Plan participants’ contributions 28 — 28 34 — 34 Past service cost (credit) (1) (140) — (140) 25 — 25 Actuarial losses (gains) - changes in financial assumptions 1,247 12 1,259 (336) (4) (340) Actuarial losses (gains) - changes in experience adjustments 21 (5) 16 (125) (14) (139) Actuarial gains - changes in demographic assumptions (16) (1) (17) (21) (1) (22) Benefits paid (333) (11) (344) (334) (12) (346) Curtailment (22) — (22) (4) — (4) Settlement (4) — (4) (10) — (10) Other 1 — 1 (24) (1) (25) Effect of exchange rate changes (620) 5 (615) (1,126) (48) (1,174)Obligation at end of year $ 10,509 $ 283 $ 10,792 $ 9,722 $ 266 $ 9,988Obligation is attributable toActive members $ 5,353 $ 164 $ 5,517 $ 5,035 $ 163 $ 5,198Deferred members 1,603 — 1,603 1,368 — 1,368Retirees 3,553 119 3,672 3,319 103 3,422
$ 10,509 $ 283 $ 10,792 $ 9,722 $ 266 $ 9,988Change in plan assetsFair value at beginning of year $ 8,080 $ — $ 8,080 $ 8,820 $ — $ 8,820 Employer contributions 262 11 273 264 12 276 Plan participants’ contributions 28 — 28 34 — 34 Interest income on plan assets 310 — 310 318 — 318 Actuarial (losses) gains 494 — 494 (94) — (94) Benefits paid (333) (11) (344) (334) (12) (346) Settlement (4) — (4) (7) — (7) Administration costs (13) — (13) (10) — (10) Other — — — (20) — (20) Effect of exchange rate changes (550) — (550) (891) — (891)Fair value at end of year $ 8,274 $ — $ 8,274 $ 8,080 $ — $ 8,080
(1) Comprises the reversal of constructive obligations of $139 million. See Note 8 – Special items for more details.
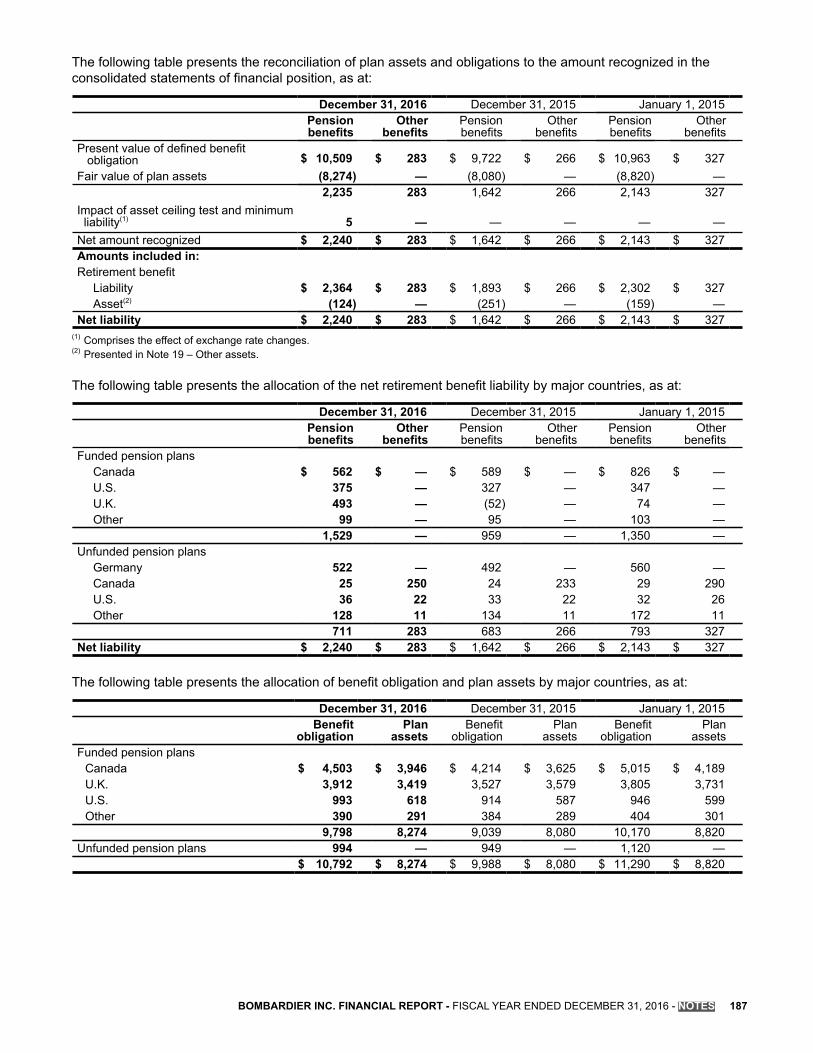
BOMBARDIER INC. FINANCIAL REPORT - FISCAL YEAR ENDED DECEMBER 31, 2016 - NOTES 187
The following table presents the reconciliation of plan assets and obligations to the amount recognized in the consolidated statements of financial position, as at:
December 31, 2016 December 31, 2015 January 1, 2015Pensionbenefits
Otherbenefits
Pensionbenefits
Otherbenefits
Pensionbenefits
Otherbenefits
Present value of defined benefit obligation $ 10,509 $ 283 $ 9,722 $ 266 $ 10,963 $ 327Fair value of plan assets (8,274) — (8,080) — (8,820) —
2,235 283 1,642 266 2,143 327Impact of asset ceiling test and minimum liability(1) 5 — — — — —Net amount recognized $ 2,240 $ 283 $ 1,642 $ 266 $ 2,143 $ 327Amounts included in:Retirement benefit
Liability $ 2,364 $ 283 $ 1,893 $ 266 $ 2,302 $ 327Asset(2) (124) — (251) — (159) —
Net liability $ 2,240 $ 283 $ 1,642 $ 266 $ 2,143 $ 327(1) Comprises the effect of exchange rate changes.(2) Presented in Note 19 – Other assets.
The following table presents the allocation of the net retirement benefit liability by major countries, as at:
December 31, 2016 December 31, 2015 January 1, 2015Pensionbenefits
Otherbenefits
Pensionbenefits
Otherbenefits
Pensionbenefits
Otherbenefits
Funded pension plansCanada $ 562 $ — $ 589 $ — $ 826 $ —U.S. 375 — 327 — 347 —U.K. 493 — (52) — 74 —Other 99 — 95 — 103 —
1,529 — 959 — 1,350 —Unfunded pension plans
Germany 522 — 492 — 560 —Canada 25 250 24 233 29 290U.S. 36 22 33 22 32 26Other 128 11 134 11 172 11
711 283 683 266 793 327Net liability $ 2,240 $ 283 $ 1,642 $ 266 $ 2,143 $ 327
The following table presents the allocation of benefit obligation and plan assets by major countries, as at:
December 31, 2016 December 31, 2015 January 1, 2015Benefit
obligationPlan
assetsBenefit
obligationPlan
assetsBenefit
obligationPlan
assetsFunded pension plans
Canada $ 4,503 $ 3,946 $ 4,214 $ 3,625 $ 5,015 $ 4,189U.K. 3,912 3,419 3,527 3,579 3,805 3,731U.S. 993 618 914 587 946 599Other 390 291 384 289 404 301
9,798 8,274 9,039 8,080 10,170 8,820Unfunded pension plans 994 — 949 — 1,120 —
$ 10,792 $ 8,274 $ 9,988 $ 8,080 $ 11,290 $ 8,820

188 BOMBARDIER INC. FINANCIAL REPORT - FISCAL YEAR ENDED DECEMBER 31, 2016
The fair value of plan assets by level of hierarchy, was as follows, as at:
December 31, 2016Total Level 1 Level 2 Level 3
Cash and cash equivalents $ 779 $ 611 $ 168 $ —Equity securities
U.S. 951 945 — 6U.K. 371 360 11 —Canada 350 350 — —Other 1,102 1,099 — 3
2,774 2,754 11 9Fixed-income securities
Corporate 1,301 — 1,301 —Government 2,351 — 2,351 —Other 27 — 27 —
3,679 — 3,679 —Real return asset securities 925 871 — 54Other 117 — 117 —
$ 8,274 $ 4,236 $ 3,975 $ 63
December 31, 2015Total Level 1 Level 2 Level 3
Cash and cash equivalents $ 804 $ 655 $ 149 $ —Equity securities
U.S. 959 938 15 6U.K. 282 282 — —Canada 343 343 — —Other 1,101 1,098 — 3
2,685 2,661 15 9Fixed-income securities
Corporate 1,288 — 1,288 —Government 2,199 — 2,199 —Other 26 — 26 —
3,513 — 3,513 —Real return asset securities 983 927 — 56Other 95 — 93 2
$ 8,080 $ 4,243 $ 3,770 $ 67
January 1, 2015Total Level 1 Level 2 Level 3
Cash and cash equivalents $ 673 $ 548 $ 125 $ —Equity securities
U.S. 931 927 — 4U.K. 389 371 18 —Canada 359 359 — —Other 1,110 1,110 — —
2,789 2,767 18 4Fixed-income securities
Corporate 1,201 — 1,201 —Government 2,642 — 2,642 —Other 27 — 27 —
3,870 — 3,870 —Real return asset securities 911 911 — —Other 577 — 503 74
$ 8,820 $ 4,226 $ 4,516 $ 78
Plan assets did not include any of the Corporation’s shares, nor any property occupied by the Corporation or other assets used by the Corporation as at December 31, 2016, 2015 and January 1, 2015.

BOMBARDIER INC. FINANCIAL REPORT - FISCAL YEAR ENDED DECEMBER 31, 2016 - NOTES 189
The following table presents the contributions made for fiscal year 2016 and 2015 as well as the estimated contributions for fiscal year 2017:
2017 2016 2015Estimated
Contribution toFunded pension plans $ 226 $ 234 $ 239Unfunded pension plans 27 28 25Other benefits 10 11 12Total defined benefits plans 263 273 276DC pension plans 87 84 78
Total contributions $ 350 $ 357 $ 354
The following table presents information about the maturity profile of the defined benefit obligation expected to be paid, as at:
December 31, 2016Benefits expected to be paid
Within 1 year $ 298Between 1 and 5 years 1,383Between 5 and 10 years 2,241Between 10 and 15 years 2,813Between 15 and 20 years 3,238
$ 9,973
The following table provides the weighted average duration of the defined benefit obligations related to pension plans, as at:
Duration in years as at December 31, 2016Funded pension plans Canada 17.0 U.S. 16.2 U.K. 21.4 Other 13.9Unfunded pension plans Germany 19.3 Canada 13.0 U.S. 14.7 Other 15.4
The following table provides the expected payments to be made under the unfunded plans, as at December 31, 2016:
Germany Other TotalBenefits expected to be paid
Within 1 year $ 16 $ 18 $ 34Between 1 and 5 years 67 81 148Between 5 and 10 years 94 126 220Between 10 and 15 years 111 142 253Between 15 and 20 years 123 151 274
$ 411 $ 518 $ 929

190 BOMBARDIER INC. FINANCIAL REPORT - FISCAL YEAR ENDED DECEMBER 31, 2016
The significant actuarial assumptions reflect the economic situation of each country. The weighted-average assumptions used to determine the benefit cost and obligation were as follows, as at:
December 31, 2016 December 31, 2015 January 1, 2015
(in percentage)Pensionbenefits
Otherbenefits
Pensionbenefits
Otherbenefits
Pensionbenefits
Otherbenefits
Benefit costDiscount rate 3.80% 4.19% 3.69% 4.07% 4.59% 4.97%Rate of compensation increase 3.02% 3.00% 3.26% 3.25% 3.36% 3.25%Inflation rate 2.21% 2.05% 2.21% 2.05% 2.34% 2.40%Ultimate health care cost trend rate n/a 5.12% n/a 4.99% n/a 4.98%Benefit obligationDiscount rate 3.22% 3.95% 3.80% 4.19% 3.69% 4.07%Rate of compensation increase 3.00% 3.00% 3.02% 3.00% 3.26% 3.25%Inflation rate 2.30% 2.25% 2.21% 2.05% 2.21% 2.05%Initial health care cost trend rate n/a 5.23% n/a 5.29% n/a 6.08%Ultimate health care cost trend rate n/a 5.07% n/a 5.12% n/a 4.99%
n/a: Not applicable
The mortality tables and the average life expectancy in years of a member at age 45 or 65 is as follows, as at December 31:
(in years) Life expectancy over 65 for a male member currentlyAged 65 on December Aged 45 on December
Country Mortality tables 2016 2015 2016 2015Canada 2014 Private Sector Mortality Table (“CPM2014Priv”)
projected generationally using the CMPImprovement Scale B (“CPM-B”) 21.7 21.6 22.7 22.7
U.K. SNA07M_CMI 2013 and S1P(M/F)A CMI 2012 22.1 22.1 23.9 23.8U.S. RP-2014 mortality table projected generationally
using the MP-2016 improvement scale(1) 20.9 21.3 22.5 22.9Germany Dr. K Heubeck 2005 19.0 18.9 21.6 21.5
Life expectancy over 65 for a female member currentlyAged 65 on December Aged 45 on December
Country Mortality tables 2016 2015 2016 2015Canada 2014 Private Sector Mortality Table (“CPM2014Priv”)
projected generationally using the CMPImprovement Scale B (“CPM-B”) 24.1 24.0 25.1 25.0
U.K. SNA07M_CMI 2013 and S1P(M/F)A CMI 2012 24.3 24.2 26.2 26.1U.S. RP-2014 mortality table projected generationally
using the MP-2016 improvement scale(1) 22.9 23.3 24.4 24.9Germany Dr. K Heubeck 2005 23.1 22.9 25.6 25.5
(1) RP-2014 mortality table projected generationally using the MP-2015 improvement scale as at December 31, 2015.
A 0.25 percentage point increase in one of the following actuarial assumptions would have the following effects, all other actuarial assumptions remaining unchanged:
Retirement benefit costfor fiscal year
Net retirement benefitliability as at
Assumption 2016 December 31, 2016Discount rate $ (30) $ (479)Rate of compensation increase $ 8 $ 85Inflation rate $ 6 $ 120
A one year additional life expectancy as at December 31, 2016 for all DB plans would increase the net retirement benefit liability by $271 million and the retirement benefit cost for fiscal year 2016 by $16 million, all other actuarial assumptions remaining unchanged.

BOMBARDIER INC. FINANCIAL REPORT - FISCAL YEAR ENDED DECEMBER 31, 2016 - NOTES 191
As at December 31, 2016, the health care cost trend rate for retirement benefits other than pension, which is a weighted-average annual rate of increase in the per capita cost of covered health and dental care benefits, is assumed to be 5.23% and to decrease progressively to 5.07% by calendar year 2024 and then remain at that level for all participants. A one percentage point change in assumed health care cost trend rates would have the following effects, as at December 31, 2016 and for fiscal year 2016:
One percentage pointincrease
One percentage pointdecrease
Effect on the net retirement benefit liability $ 26 $ (23)Effect on the retirement benefit cost $ 2 $ (2)
23. TRADE AND OTHER PAYABLES
Trade and other payables were as follows, as at:
December 31, 2016 December 31, 2015 January 1, 2015Trade payables $ 2,126 $ 2,812 $ 3,037Accrued liabilities 639 613 566Interest 141 154 124Other 333 461 489
$ 3,239 $ 4,040 $ 4,216

192 BOMBARDIER INC. FINANCIAL REPORT - FISCAL YEAR ENDED DECEMBER 31, 2016
24. PROVISIONS
Changes in provisions were as follows, for fiscal years 2016 and 2015:
Productwarranties
Credit andresidual
valueguarantees
Restructuring,severanceand other
terminationbenefits Other (1) Total
Balance as at December 31, 2015 $ 725 $ 670 $ 66 $ 565 $ 2,026Additions 298 14 252 (2) 763 (3) 1,327Utilization (223) (107) (181) (270) (781)Reversals (110) (22) (18) (2) (121) (4) (271)Accretion expense 1 6 — 6 13Effect of changes in discount rates (2) 1 — (16) (17)Effect of foreign currency exchange rate changes (19) — (8) (4) (31)
Balance as at December 31, 2016 $ 670 $ 562 $ 111 $ 923 $ 2,266Of which current $ 521 $ 59 $ 110 $ 132 $ 822Of which non-current 149 503 1 791 1,444
$ 670 $ 562 $ 111 $ 923 $ 2,266
Productwarranties
Credit andresidual
valueguarantees
Restructuring,severanceand other
terminationbenefits Other (1) Total
Balance as at January 1, 2015 $ 773 $ 456 $ 117 $ 206 $ 1,552Additions 360 265 (5) 47 (2) 394 (3) 1,066Utilization (244) (36) (67) (15) (362)Reversals (118) (15) (25) (2) (15) (173)Accretion expense 1 6 — — 7Effect of changes in discount rates (1) (6) — — (7)Effect of foreign currency exchange rate changes (46) — (6) (5) (57)
Balance as at December 31, 2015 $ 725 $ 670 $ 66 $ 565 $ 2,026Of which current $ 562 $ 77 $ 65 $ 404 $ 1,108Of which non-current 163 593 1 161 918
$ 725 $ 670 $ 66 $ 565 $ 2,026(1) Mainly comprised of onerous contract provisions, claims and litigations.(2) See Note 8 – Special items for more details on the addition and the reversal related to restructuring charges. (3) See Note 8 – Special items for more details on the addition related to the C Series aircraft program onerous contracts provision and to the
tax litigation provision for fiscal year 2016 (includes addition of other provisions related to the C Series aircraft program and to the cancellation of the Learjet 85 program for fiscal year 2015).
(4) See Note 8 – Special items for more details on the reversals of Learjet 85 aircraft program cancellation provisions.(5) See Note 8 – Special items for more details on changes in estimates and fair value related to Credit and residual value guarantees.

BOMBARDIER INC. FINANCIAL REPORT - FISCAL YEAR ENDED DECEMBER 31, 2016 - NOTES 193
25. OTHER FINANCIAL LIABILITIES
Other financial liabilities were as follows, as at:
December 31, 2016 December 31, 2015 January 1, 2015Derivative financial instruments(1) $ 627 $ 702 $ 665Government refundable advances 395 411 363Vendor non-recurring costs 351 20 36Lease subsidies(2) 141 135 172Sale and leaseback obligations 25 133 260Current portion of long-term debt(3) 31 71 56Other 37 138 60
$ 1,607 $ 1,610 $ 1,612Of which current $ 608 $ 991 $ 1,010Of which non-current 999 619 602
$ 1,607 $ 1,610 $ 1,612(1) See Note 14 – Financial instruments.(2) The amount contractually required to be paid is $160 million as at December 31, 2016 ($182 million as at December 31, 2015 and
$206 million as at January 1, 2015).(3) See Note 27 – Long-term debt.
Sale and leaseback obligations The Corporation has set up sale and leaseback facilities, which may be used to sell pre-owned business aircraft. For accounting purposes, amounts outstanding under certain of these arrangements are considered financial obligations secured by the pre-owned business aircraft. The arrangements are generally for a term no longer than 24 months. The Corporation may settle the obligation at any time during the arrangement.
26. OTHER LIABILITIES
Other liabilities were as follows, as at:
December 31, 2016 December 31, 2015 January 1, 2015Employee benefits(1) $ 652 $ 647 $ 661Supplier contributions to aerospace programs 650 606 601Accruals for long-term contract costs 579 606 631Deferred revenues 422 397 450Income taxes payable 222 224 248Other taxes payable 163 212 119Other 506 578 568
$ 3,194 $ 3,270 $ 3,278Of which current $ 2,175 $ 2,274 $ 2,182Of which non-current 1,019 996 1,096
$ 3,194 $ 3,270 $ 3,278(1) Comprises all employee benefits excluding those related to retirement benefits, which are reported in the line items Retirement benefits and
in Other assets (see Note 22 – Retirement benefits).

194 BOMBARDIER INC. FINANCIAL REPORT - FISCAL YEAR ENDED DECEMBER 31, 2016
27. LONG-TERM DEBT
Long-term debt was as follows, as at:
December 312016
December 312015
January 12015
Interest rate
Amount incurrency of
origin Currency Contractual (1)
After effectof fair value
hedges Maturity Amount Amount Amount
Senior notes 600 USD 4.75% n/a Apr. 2019 $ 596 $ 594 $ 593
850 USD 7.75% 3-month Libor + 4.14(2)
Mar. 2020 899 916 922
780 EUR 6.13% n/a May 2021 931 985 1,110
1,400(3) USD 8.75% n/a Dec. 2021 1,369 — —
500 USD 5.75% 3-month Libor + 3.36(2)
Mar. 2022 507 510 504
1,200 USD 6.00% 3-month Libor + 3.57(2)
Oct. 2022 1,228 1,234 1,219
1,250 USD 6.13% 3-month Libor + 3.48(2)
Jan. 2023 1,280 1,290 1,277
1,500 USD 7.50% n/a Mar. 2025 1,488 1,487 —
650(4) USD 7.50% n/a n/a — 677 686750(4) USD 5.50% n/a n/a — 740 —750(5) USD 4.25% n/a n/a — — 746
Notes 250 USD 7.45% n/a May 2034 248 248 248Debentures 150 CAD 7.35% n/a Dec. 2026 111 107 129Other(6) Various(7) Various Various(7) n/a 2017-2026 112 191 249
$ 8,769 $ 8,979 $ 7,683Of which current(8) $ 31 $ 71 $ 56Of which non-current 8,738 8,908 7,627
$ 8,769 $ 8,979 $ 7,683(1) Interest on long-term debt as at December 31, 2016 is payable semi-annually, except for the other debts for which the timing of interest
payments is variable. (2) The interest-rate swap agreement related to these Senior Notes were partially settled in the fourth quarter of fiscal year 2015. As these
interest-rate swap were in a fair value hedge relationship, the related deferred gains recorded in the hedged item will be amortized in interest expense up to the maturity of these debts.
(3) New Senior Notes due December 1, 2021 which carry a coupon of 8.750% per annum and were issued at 99.001% of par. The effective yield is 9.00%.
(4) Repurchased pursuant to an optional redemption exercised in December, 2016.
(5) Repurchased pursuant to an optional redemption exercised in April, 2015.
(6) Includes obligations under finance leases.
(7) The notional amount of other long-term debt is $112 million as at December 31, 2016 ($191 million as at December 31, 2015 and $249 million as at January 1, 2015). The contractual interest rate, which represents a weighted average rate, is 5.43% as at December 31, 2016 (4.78% as at December 31, 2015 and 4.46% as at January 1, 2015).
(8) See Note 25 – Other financial liabilities.n/a: Not applicable
All Senior notes and Notes rank pari-passu and are unsecured. The Corporation is subject to various financial covenants under the letter of credit facilities and the two unsecured revolving credit facilities, which must be met on a quarterly basis, see Note 31 - Credit facilities for more details. A breach of any of these agreements or the inability to comply with these covenants could result in a default under these facilities, which would permit the Corporation’s banks to request immediate defeasance or cash cover of all outstanding letters of credit, and bond holders and other lenders to declare amounts owed to them to be immediately payable. These conditions were all met as at December 31, 2016 and 2015 and January 1, 2015.
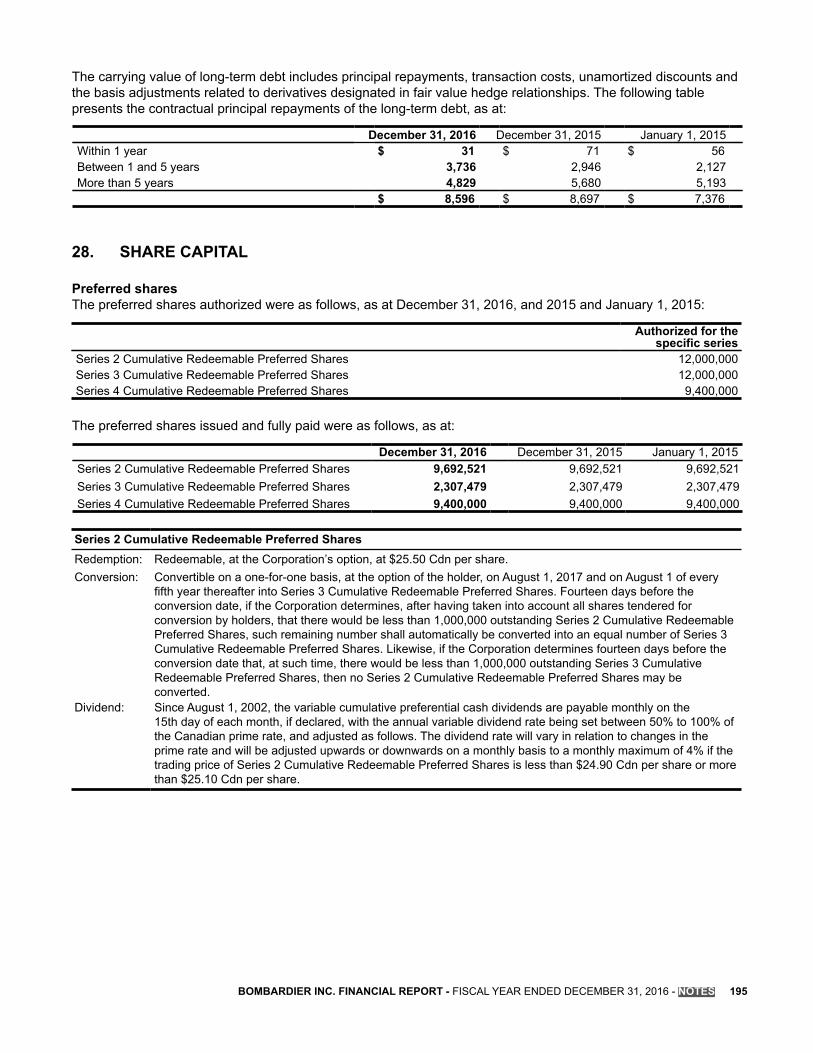
BOMBARDIER INC. FINANCIAL REPORT - FISCAL YEAR ENDED DECEMBER 31, 2016 - NOTES 195
The carrying value of long-term debt includes principal repayments, transaction costs, unamortized discounts and the basis adjustments related to derivatives designated in fair value hedge relationships. The following table presents the contractual principal repayments of the long-term debt, as at:
December 31, 2016 December 31, 2015 January 1, 2015Within 1 year $ 31 $ 71 $ 56Between 1 and 5 years 3,736 2,946 2,127More than 5 years 4,829 5,680 5,193
$ 8,596 $ 8,697 $ 7,376
28. SHARE CAPITAL
Preferred sharesThe preferred shares authorized were as follows, as at December 31, 2016, and 2015 and January 1, 2015:
Authorized for the specific series
Series 2 Cumulative Redeemable Preferred Shares 12,000,000Series 3 Cumulative Redeemable Preferred Shares 12,000,000Series 4 Cumulative Redeemable Preferred Shares 9,400,000
The preferred shares issued and fully paid were as follows, as at:
December 31, 2016 December 31, 2015 January 1, 2015Series 2 Cumulative Redeemable Preferred Shares 9,692,521 9,692,521 9,692,521Series 3 Cumulative Redeemable Preferred Shares 2,307,479 2,307,479 2,307,479Series 4 Cumulative Redeemable Preferred Shares 9,400,000 9,400,000 9,400,000
Series 2 Cumulative Redeemable Preferred SharesRedemption: Redeemable, at the Corporation’s option, at $25.50 Cdn per share.Conversion: Convertible on a one-for-one basis, at the option of the holder, on August 1, 2017 and on August 1 of every
fifth year thereafter into Series 3 Cumulative Redeemable Preferred Shares. Fourteen days before the conversion date, if the Corporation determines, after having taken into account all shares tendered for conversion by holders, that there would be less than 1,000,000 outstanding Series 2 Cumulative Redeemable Preferred Shares, such remaining number shall automatically be converted into an equal number of Series 3 Cumulative Redeemable Preferred Shares. Likewise, if the Corporation determines fourteen days before the conversion date that, at such time, there would be less than 1,000,000 outstanding Series 3 Cumulative Redeemable Preferred Shares, then no Series 2 Cumulative Redeemable Preferred Shares may be converted.
Dividend: Since August 1, 2002, the variable cumulative preferential cash dividends are payable monthly on the 15th day of each month, if declared, with the annual variable dividend rate being set between 50% to 100% of the Canadian prime rate, and adjusted as follows. The dividend rate will vary in relation to changes in the prime rate and will be adjusted upwards or downwards on a monthly basis to a monthly maximum of 4% if the trading price of Series 2 Cumulative Redeemable Preferred Shares is less than $24.90 Cdn per share or more than $25.10 Cdn per share.

196 BOMBARDIER INC. FINANCIAL REPORT - FISCAL YEAR ENDED DECEMBER 31, 2016
Series 3 Cumulative Redeemable Preferred SharesRedemption: Redeemable, at the Corporation’s option, at $25.00 Cdn per share on August 1, 2017 and on August 1 of
every fifth year thereafter.Conversion: Convertible on a one-for-one basis, at the option of the holder, on August 1, 2017 and on August 1 of every
fifth year thereafter into Series 2 Cumulative Redeemable Preferred Shares. Fourteen days before the conversion date, if the Corporation determines, after having taken into account all shares tendered for conversion by holders, that there would be less than 1,000,000 outstanding Series 3 Cumulative Redeemable Preferred Shares, such remaining number shall automatically be converted into an equal number of Series 2 Cumulative Redeemable Preferred Shares. Likewise, if the Corporation determines fourteen days before the conversion date that, at such time, there would be less than 1,000,000 outstanding Series 2 Cumulative Redeemable Preferred Shares, then no Series 3 Cumulative Redeemable Preferred Shares may be converted.
Dividend: For the five-year period from August 1, 2012 and including July 31, 2017, the Series 3 CumulativeRedeemable Preferred Shares carry fixed cumulative preferential cash dividends at a rate of 3.134% or$0.7835 Cdn per share per annum, payable quarterly on the last day of January, April, July and October ofeach year at a rate of $0.195875 Cdn, if declared. For each succeeding five-year period, the applicable fixedannual rate of the cumulative preferential cash dividends calculated by the Corporation shall not be less than80% of the Government of Canada bond yield, as defined in the Restated Articles of Incorporation.
Series 4 Cumulative Redeemable Preferred SharesRedemption: The Corporation may, subject to certain provisions, on not less than 30 nor more than 60 days’ notice, redeem
for cash the Series 4 Cumulative Redeemable Preferred Shares at $25.00 Cdn.Conversion: The Corporation may, subject to the approval of the Toronto Stock Exchange and such other stock exchanges
on which the Series 4 Cumulative Redeemable Preferred Shares are then listed, at any time convert all or any of the outstanding Series 4 Cumulative Redeemable Preferred Shares into fully paid and non-assessable Class B Shares (subordinate voting) of the Corporation. The number of Class B Shares (subordinate voting) into which each Series 4 Cumulative Redeemable Preferred Shares may be so converted will be determined by dividing the then applicable redemption price together with all accrued and unpaid dividends to, but excluding the date of conversion, by the greater of $2.00 Cdn and 95% of the weighted-average trading price of such Class B Shares (subordinate voting) on the Toronto Stock Exchange for the period of 20 consecutive trading days, which ends on the fourth day prior to the date specified for conversion or, if that fourth day is not a trading day, on the trading day immediately preceding such fourth day. The Corporation may, at its option, at any time, create one or more further series of Preferred Shares of the Corporation, into which the holders of Series 4 Cumulative Redeemable Preferred Shares could have the right, but not the obligation, to convert their shares on a share-for-share basis.
Dividend: The holders of Series 4 Cumulative Redeemable Preferred Shares are entitled to fixed cumulative preferential cash dividends, if declared, at a rate of 6.25% or $1.5625 Cdn per share per annum, payable quarterly on the last day of January, April, July and October of each year at a rate of $0.390625 Cdn per share.
Common sharesAll common shares are without nominal or par value.
Class A Shares (multiple voting)Voting rights: Ten votes each.Conversion: Convertible, at any time, at the option of the holder, into one Class B Share (subordinate voting).Dividend: After payment of the priority dividend on the Class B Shares (subordinate voting) mentioned below, the Class
A Shares (multiple voting) shall share equally, share for share, with respect to any additional dividends whichmay be declared in respect of the Class A Shares (multiple voting) and Class B Shares (subordinate voting).These dividends, if declared, shall be payable quarterly on the last day of March, June, September andDecember of each year.

BOMBARDIER INC. FINANCIAL REPORT - FISCAL YEAR ENDED DECEMBER 31, 2016 - NOTES 197
Class B Shares (subordinate voting)Voting rights: One vote each.Conversion: Convertible, at the option of the holder, into one Class A Share (multiple voting): (i) if an offer made to Class A
(multiple voting) shareholders is accepted by the present controlling shareholder (the Bombardier family); or(ii) if such controlling shareholder ceases to hold more than 50% of all outstanding Class A Shares (multiplevoting) of the Corporation.
Dividend: The holders of Class B Shares (subordinate voting) are entitled, in priority to the holders of Class A Shares (multiple voting) to non-cumulative dividends of $0.0015625 Cdn per share, payable quarterly on the last day of March, June, September and December of each year at a rate of $0.000390625 Cdn per share, if declared. After payment of said priority dividend, the Class B Shares (subordinate voting) shall share equally, share for share, with respect to any additional dividends which may be declared in respect of the Class A Shares (multiple voting) and the Class B Shares (subordinate voting). These dividends, if declared, shall be payable quarterly on the last day of March, June, September and December of each year.
The change in the number of common shares issued and fully paid and in the number of common shares authorized was as follows as at:
Class A Shares (multiple voting)December 31, 2016 December 31, 2015
Issued and fully paidBalance at beginning of year 313,900,550 314,273,255
Converted to Class B — (372,705)Balance at end of year 313,900,550 313,900,550Authorized 3,592,000,000 2,742,000,000
Class B Shares (subordinate voting)December 31, 2016 December 31, 2015
Issued and fully paidBalance at beginning of year 1,932,511,397 1,444,132,126
Issuance of shares 164,466 488,006,566Converted from Class A — 372,705
1,932,675,863 1,932,511,397Held in trust under the PSU and RSU plans
Balance at beginning of year (26,194,908) (18,736,908)Purchased (27,338,210) (7,458,000)
(53,533,118) (26,194,908)Balance at end of year 1,879,142,745 1,906,316,489Authorized 3,592,000,000 2,742,000,000
In February 2015, the Corporation announced the closing of a public offering, with an over-allotment option having been exercised in full for an aggregate of 487,840,350 subscription receipts at a price of $2.21 Canadian dollars per subscription receipt for aggregate net proceeds of CDN $1,035 million ($822 million).
Following resolutions approved on March 27, 2015 and April 29, 2016, the number of Class A Shares and Class B Shares (subordinate voting) authorized has increased from 1,892,000,000 to 2,742,000,000 and then to 3,592,000,000.
The change in the number of warrants exercisable was as follows as at:
December 31, 2016 December 31, 2015Balance at beginning of year — —
Issuance of warrants 205,851,872 —Balance at end of year 205,851,872 —

198 BOMBARDIER INC. FINANCIAL REPORT - FISCAL YEAR ENDED DECEMBER 31, 2016
In February 2016, the Corporation issued, in the name of CDPQ, warrants exercisable for a total number of 105,851,872 Class B Shares (subordinate voting) in the capital of Bombardier Inc. (Class B Subordinate Voting Shares), exercisable for a period of seven years at an exercise price per share equal to $1.66 U.S. dollars, being the equivalent of $2.21 Canadian dollars using the exchange rate at the date of execution of the subscription agreement.
Also on June 30 and September 1, 2016 Bombardier issued, in the name of Investissement Québec, warrants exercisable for a total number of 100,000,000 Class B Subordinate Voting Shares in the capital of Bombardier Inc., exercisable for a period of five years at an exercise price per share equal to $1.72 U.S. dollars, being the equivalent of $2.21 Canadian dollars using the exchange rate at the date of execution of the subscription agreement.
Dividends Dividends declared were as follows:
Dividends declared for fiscal years Dividends declared afterDecember 31, 2016 December 31, 2015 December 31, 2016
Total Total TotalPer share
(Cdn$)(in millions
of U.S.$)Per share
(Cdn$)(in millions
of U.S.$)Per share
(Cdn$)(in millions
of U.S.$)Class A common shares 0.00 $ — 0.00 $ — 0.00 $ —Class B common shares 0.00 — 0.00 — 0.00 —
— — —Series 2 Preferred Shares 0.68 5 0.70 5 0.11 1Series 3 Preferred Shares 0.78 1 0.78 2 0.20 —Series 4 Preferred Shares 1.56 11 1.56 12 0.39 3
17 19 4$ 17 $ 19 $ 4
29. SHARE-BASED PLANS
PSU, DSU and RSU plansThe Board of Directors of the Corporation approved a PSU and a RSU plan under which PSUs and RSUs may be granted to executives and other designated employees. The PSUs and the RSUs give recipients the right, upon vesting, to receive a certain number of the Corporation’s Class B Shares (subordinate voting). The RSUs also give certain recipients the right to receive a cash payment equal to the value of the RSUs. The Board of Directors of the Corporation has also approved a DSU plan under which DSUs may be granted to senior officers. The DSU plan is similar to the PSU plan, except that their exercise can only occur upon retirement or termination of employment. During fiscal year 2016, a combined value of $50 million of DSUs, PSUs and RSUs were authorized for issuance ($43 million during fiscal year 2015).
The number of PSUs, DSUs and RSUs has varied as follows, for fiscal years:
2016 2015PSU DSU RSU PSU DSU RSU
Balance at beginning of year 15,627,217 4,883,829 22,332,682 26,045,936 7,666,464 —
Granted 31,233,004 — 1,659,631 248,757 — 22,765,354Exercised (65,790) (351,061) — — (340,432) —Forfeited (7,469,719) (1,854,925) (1,933,389) (10,667,476) (2,442,203) (432,672)
Balance at end of year 39,324,712 2,677,843 (1) 22,058,924 15,627,217 4,883,829 (1) 22,332,682(1) Of which 1,260,639 DSUs are vested as at December 31, 2016 (1,611,700 as at December 31, 2015).
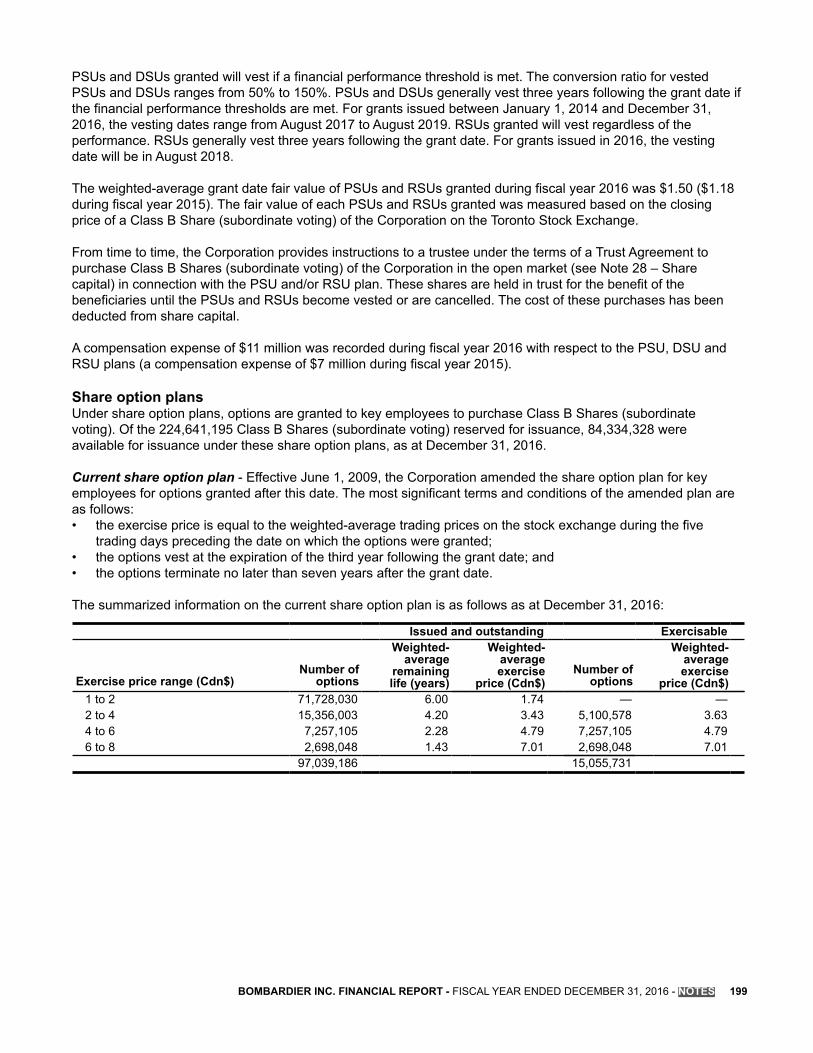
BOMBARDIER INC. FINANCIAL REPORT - FISCAL YEAR ENDED DECEMBER 31, 2016 - NOTES 199
PSUs and DSUs granted will vest if a financial performance threshold is met. The conversion ratio for vested PSUs and DSUs ranges from 50% to 150%. PSUs and DSUs generally vest three years following the grant date if the financial performance thresholds are met. For grants issued between January 1, 2014 and December 31, 2016, the vesting dates range from August 2017 to August 2019. RSUs granted will vest regardless of the performance. RSUs generally vest three years following the grant date. For grants issued in 2016, the vesting date will be in August 2018.
The weighted-average grant date fair value of PSUs and RSUs granted during fiscal year 2016 was $1.50 ($1.18 during fiscal year 2015). The fair value of each PSUs and RSUs granted was measured based on the closing price of a Class B Share (subordinate voting) of the Corporation on the Toronto Stock Exchange.
From time to time, the Corporation provides instructions to a trustee under the terms of a Trust Agreement to purchase Class B Shares (subordinate voting) of the Corporation in the open market (see Note 28 – Share capital) in connection with the PSU and/or RSU plan. These shares are held in trust for the benefit of the beneficiaries until the PSUs and RSUs become vested or are cancelled. The cost of these purchases has been deducted from share capital.
A compensation expense of $11 million was recorded during fiscal year 2016 with respect to the PSU, DSU and RSU plans (a compensation expense of $7 million during fiscal year 2015).
Share option plans Under share option plans, options are granted to key employees to purchase Class B Shares (subordinate voting). Of the 224,641,195 Class B Shares (subordinate voting) reserved for issuance, 84,334,328 were available for issuance under these share option plans, as at December 31, 2016.
Current share option plan - Effective June 1, 2009, the Corporation amended the share option plan for key employees for options granted after this date. The most significant terms and conditions of the amended plan are as follows: • the exercise price is equal to the weighted-average trading prices on the stock exchange during the five
trading days preceding the date on which the options were granted; • the options vest at the expiration of the third year following the grant date; and • the options terminate no later than seven years after the grant date.
The summarized information on the current share option plan is as follows as at December 31, 2016:
Issued and outstanding Exercisable
Exercise price range (Cdn$)Number of
options
Weighted-average
remaininglife (years)
Weighted-averageexercise
price (Cdn$)Number of
options
Weighted-averageexercise
price (Cdn$)1 to 2 71,728,030 6.00 1.74 — —2 to 4 15,356,003 4.20 3.43 5,100,578 3.634 to 6 7,257,105 2.28 4.79 7,257,105 4.796 to 8 2,698,048 1.43 7.01 2,698,048 7.01
97,039,186 15,055,731

200 BOMBARDIER INC. FINANCIAL REPORT - FISCAL YEAR ENDED DECEMBER 31, 2016
No options were exercised during fiscal year 2016 and 2015.
The number of options issued and outstanding under the current share option plan has varied as follows, for fiscal years:
2016 2015
Number ofoptions
Weighted-averageexercise
price (Cdn$)Number of
options
Weighted-averageexercise
price (Cdn$)Balance at beginning of year 74,347,206 2.61 27,811,724 4.39
Granted 29,195,107 1.94 49,704,570 1.69Forfeited (4,486,127) 2.76 (2,808,698) 3.54Expired (2,017,000) 3.45 (360,390) 5.17
Balance at end of year 97,039,186 2.38 74,347,206 2.61Options exercisable at end of year 15,055,731 4.80 13,672,879 4.58
Share-based compensation expense for optionsThe weighted-average grant date fair value of stock options granted during fiscal year 2016 was $0.64 per option ($0.40 per option for fiscal year 2015). The fair value of each option granted was determined using a Black-Scholes option pricing model, which incorporates the share price at the grant date, and the following weighted-average assumptions, for fiscal years:
2016 2015Risk-free interest rate 0.58% 0.79%Expected life 5 years 5 yearsExpected volatility in market price of shares 49% 36.17%Expected dividend yield 0% 0%
A compensation expense of $11 million was recorded during fiscal year 2016 with respect to share option plans ($7 million during fiscal year 2015).
Employee share purchase planUnder the employee share purchase plan, employees of the Corporation are eligible to purchase Class B Shares (subordinate voting) of the Corporation up to a maximum of 20% of their base salary to a yearly maximum of $30,000 Cdn per employee. The Corporation contributed to the plan an amount equal to 20% of the employees’ contributions. The contributions are used to purchase the Corporation’s Class B Shares (subordinate voting) in the open market on monthly investment dates or as otherwise determined by the Corporation, but not less frequently than monthly. The Corporation’s contribution to the plan amounted to $5 million for fiscal year 2016 ($6 million for fiscal year 2015). Shares purchased by the Corporation are subject to a mandatory 12-month holding period that must be completed at the anniversary date of January 1.

BOMBARDIER INC. FINANCIAL REPORT - FISCAL YEAR ENDED DECEMBER 31, 2016 - NOTES 201
30. NET CHANGE IN NON-CASH BALANCES
Net change in non-cash balances was as follows, for fiscal years:
2016 2015Trade and other receivables $ 155 $ (39)Inventories 1,161 786Other financial assets and liabilities, net (130) 385Other assets 200 196Trade and other payables (699) (7)Provisions 269 531Advances and progress billings in excess of long-term contract inventories 183 (199)Advances on aerospace programs (452) (1,411)Retirement benefits liability (159) 196Other liabilities 74 160
$ 602 $ 598
31. CREDIT FACILITIES
Letter of credit facilitiesThe letter of credit facilities and their maturities were as follows, as at:
Amountcommitted
Letters ofcredit issued
Amountavailable Maturity
December 31, 2016Transportation facility $ 3,489 (1) $ 3,311 $ 178 2020 (2)
Corporation excluding Transportation facility 400 136 264 2019 (3)
$ 3,889 $ 3,447 $ 442December 31, 2015
Transportation facility $ 3,963 (1) $ 3,195 $ 768 2019Corporation excluding Transportation facility 600 221 379 2018
$ 4,563 $ 3,416 $ 1,147January 1, 2015
Transportation facility $ 4,249 (1) $ 3,573 $ 676 2018Corporation excluding Transportation facility 600 261 339 2017
$ 4,849 $ 3,834 $ 1,015(1) €3,310 million as at December 31, 2016 (€3,640 million as at December 31, 2015 and €3,500 million as at January 1, 2015).(2) The facility has an initial three year availability period, when new letters of credit can be issued up to the maximum commitment amount of
the facility, plus a one year amortization period during which new letters of credit cannot be issued. The final maturity date of the facility is 2020.
(3) The facility has an initial three year availability period, when new letters of credit can be issued up to the maximum commitment of the facility. The facility can be extended annually on the anniversary date for an additional year subject to approval by a majority of the bank syndicate members.
In addition to the outstanding letters of credit shown in the above table, letters of credit of $1,869 million were outstanding under various bilateral agreements and letters of credit of $206 million under the PSG facility as at December 31, 2016 ($1,721 million and $173 million, respectively, as at December 31, 2015 and $1,731 million and $327 million, respectively, as at January 1, 2015).
The Corporation also uses numerous bilateral bonding facilities with insurance companies to support Transportation’s operations. An amount of $2.9 billion was outstanding under such facilities as at December 31, 2016 ($2.6 billion as at December 31, 2015 and $2.4 billion as at January 1, 2015).

202 BOMBARDIER INC. FINANCIAL REPORT - FISCAL YEAR ENDED DECEMBER 31, 2016
Revolving credit facilities The Corporation has a $400-million unsecured revolving credit facility (“revolving credit facility”) that matures in June 2019 and bears interest at the applicable base rate (Libor, in the case of a U.S. dollar cash drawing) plus a margin. This facility is available for cash drawings for the general working capital needs of the Corporation excluding Transportation. In addition, the Corporation has an unsecured revolving credit facility (“Transportation revolving credit facility”) amounting to €658 million ($693 million), available to Transportation for cash drawings. The facility matures in October 2019 and bears interest at EURIBOR plus a margin. These facilities were unused as of December 31, 2016.
Financial covenantsThe Corporation is subject to various financial covenants under the letter of credit facilities, excluding the PSG facility, and the two unsecured revolving credit facilities, which must be met on a quarterly basis. The $400-million letter of credit and $400-million unsecured revolving credit facility, which are available for the Corporation excluding Transportation, include financial covenants requiring a minimum EBITDA to fixed charges ratio, as well as a maximum gross debt and minimum EBITDA thresholds, all calculated based on an adjusted consolidated basis i.e. excluding Transportation. The Transportation letter of credit and revolving credit facilities include financial covenants requiring minimum equity as well as a maximum debt to EBITDA ratio, all calculated based on Transportation stand-alone financial data. These terms and ratios are defined in the respective agreements and do not correspond to the Corporation’s global metrics as described in Note 32 – Capital management or to the specific terms used in the MD&A. In addition, the Corporation must maintain a minimum Transportation liquidity of €600 million ($632 million). The $400-million letter of credit and $400-million unsecured revolving facilities, which are available for the Corporation excluding Transportation, require minimum liquidity of $750 million at the end of each quarter of fiscal year 2016 (minimum liquidity of $750 million for fiscal year 2015 and $500 million for fiscal year 2014). Minimum liquidity required is not defined as comprising only cash and cash equivalents as presented in the consolidated statement of financial position. These conditions were all met as at December 31, 2016 and 2015 and January 1, 2015.
The Corporation regularly monitors these ratios to ensure it meets all financial covenants, and has controls in place to ensure that contractual covenants are met.

BOMBARDIER INC. FINANCIAL REPORT - FISCAL YEAR ENDED DECEMBER 31, 2016 - NOTES 203
32. CAPITAL MANAGEMENT
The Corporation analyzes its capital structure using global metrics, which are based on a broad economic view of the Corporation, in order to assess the creditworthiness of the Corporation. The Corporation manages and monitors its global metrics such that it can achieve an investment-grade profile.
The Corporation’s objectives with regard to its global metrics are as follows: • adjusted EBIT to adjusted interest ratio greater than 5.0; and• adjusted debt to adjusted EBITDA ratio lower than 2.5.
Global metrics – The following global metrics do not represent the ratios required for bank covenants.
2016 2015Adjusted EBIT(1) $ 498 $ 777Adjusted interest(2) $ 618 $ 503Adjusted EBIT to adjusted interest ratio 0.8 1.5Adjusted debt(3) $ 9,184 $ 9,289Adjusted EBITDA(4) $ 943 $ 1,278Adjusted debt to adjusted EBITDA ratio 9.7 7.3
(1) Represents EBIT before special items plus interest adjustment for operating leases, and interest received as per the supplemental information provided in the consolidated statements of cash flows, adjusted, if needed, for the settlement of fair value hedge derivatives before their contractual maturity dates.
(2) Represents interest paid as per the supplemental information provided in the consolidated statements of cash flows, plus accretion expense on sale and leaseback obligations and interest adjustment for operating leases.
(3) Represents long-term debt adjusted for the fair value of derivatives (or settled derivatives) designated in related hedge relationships plus sale and leaseback obligations and the net present value of operating lease obligations.
(4) Represents adjusted EBIT plus amortization and impairment charges of PP&E and intangible assets and amortization adjustment for operating leases.
In addition to the above global level metrics, the Corporation separately monitors its net retirement benefit liability which amounted to $2.5 billion as at December 31, 2016 ($1.9 billion as at December 31, 2015). The measurement of this liability is dependent on numerous key long-term assumptions such as discount rates, future compensation increases, inflation rates and mortality rates. In recent years, this liability has been particularly volatile due to changes in discount rates. Such volatility is exacerbated by the long-term nature of the obligation. The Corporation closely monitors the impact of the net retirement benefit liability on its future cash flows and has introduced significant risk mitigation initiatives in recent years in this respect.
In order to adjust its capital structure, the Corporation may issue or reduce long-term debt, make discretionary contributions to pension funds, repurchase or issue share capital, or vary the amount of dividends paid to shareholders.
See Note 31 – Credit facilities for a description of bank covenants.

204 BOMBARDIER INC. FINANCIAL REPORT - FISCAL YEAR ENDED DECEMBER 31, 2016
33. FINANCIAL RISK MANAGEMENT
The Corporation is primarily exposed to credit risk, liquidity risk and market risk as a result of holding financial instruments.
Credit risk Risk that one party to a financial instrument will cause a financial loss for the other party by failing todischarge an obligation.
Liquidity risk Risk that an entity will encounter difficulty in meeting its obligations associated with financial liabilities.Market risk Risk that the fair value or future cash flows of a financial instrument will fluctuate because of changes in
market prices, whether those changes are caused by factors specific to the individual financial instrumentor its issuer, or factors affecting all similar financial instruments traded in the market. The Corporation isprimarily exposed to foreign exchange risk and interest rate risk.
Credit risk The Corporation is exposed to credit risk through its normal treasury activities on its derivative financial instruments and other investing activities. The Corporation is also exposed to credit risk through its trade receivables arising from its normal commercial activities. Credit exposures arising from lending activities relate primarily to aircraft loans and lease receivables provided to aerospace customers in connection with the sale of commercial aircraft.
The effective monitoring and controlling of credit risks is a key component of the Corporation’s risk management activities. Credit risks arising from the treasury activities are managed by a central treasury function in accordance with the Corporate Foreign Exchange Risk Management Policy and Corporate Investment Management Policy (the “Policy”). The objective of the policy is to minimize the Corporation’s exposure to credit risk from its treasury activities by ensuring that the Corporation transacts strictly with investment-grade financial institutions and money market funds based on pre-established consolidated counterparty risk limits per financial institution and fund.
Credit risks arising from the Corporation’s normal commercial activities, lending activities and under indirect financing support are managed and controlled by the four reportable segments, Business Aircraft, Commercial Aircraft, Aerostructures and Engineering Services and Transportation. The main credit exposure managed by the segments arises from customer credit risk. Customer credit ratings and credit limits are analyzed and established by internal credit specialists, based on inputs from external rating agencies, recognized rating methods and the Corporation’s experience with the customers. The credit risks and credit limits are dynamically reviewed based on fluctuations in the customer’s financial results and payment behaviour.
These customer credit risk assessments and credit limits are critical inputs in determining the conditions under which credit or financing will be offered to customers, including obtaining collateral to reduce the Corporation’s exposure to losses. Specific governance is in place to ensure that financial risks arising from large transactions are analyzed and approved by the appropriate management level before financing or credit support is offered to the customer.
Credit risk is monitored on an ongoing basis using different systems and methodologies depending on the underlying exposure. Various accounting and reporting systems are used to monitor trade receivables, lease receivables and other direct financings.
Maximum exposure to credit risk – The maximum exposures to credit risk for financial instruments is usually equivalent to their carrying value, as presented in Note 14 – Financial instruments, except for the financial instruments in the table below, for which the maximum exposures were as follows, as at:
December 31, 2016 December 31, 2015 January 1, 2015Aircraft loans and lease receivables $ 46 $ 59 $ 243Investments in financing structures $ 181 $ 169 $ 331Derivative financial instruments $ 326 $ 362 $ 514Investments in securities $ 319 $ 304 $ 295
Credit quality – The credit quality, using external and internal credit rating system, of financial assets that are neither past due nor impaired is usually investment grade, except for aerospace segments’ receivables, aircraft loans and lease receivables and certain investments in financing structures. Aerospace segments’ receivables are

BOMBARDIER INC. FINANCIAL REPORT - FISCAL YEAR ENDED DECEMBER 31, 2016 - NOTES 205
usually not externally or internally quoted, however the credit quality of customers are dynamically reviewed and is based on the Corporation’s experience with the customers and payment behaviour. The Corporation usually holds underlying assets or security deposits as collateral or letters of credit for the receivables. The Corporation’s customers for aircraft loans and lease receivables are mainly regional airlines with a credit rating below investment grade. The credit quality of the Corporation’s aircraft loans and lease receivables portfolio is strongly correlated to the credit quality of the regional airline industry. The financed aircraft is used as collateral to reduce the Corporation’s exposure to credit risk.
Refer to Note 38 – Commitment and Contingencies for the Corporation’s off-balance sheet credit risk, including credit risk related to support provided for sale of aircraft.
Liquidity risk The Corporation manages liquidity risk by maintaining detailed cash forecasts, as well as long-term operating and strategic plans. The management of consolidated liquidity requires a constant monitoring of expected cash inflows and outflows, which is achieved through a detailed forecast of the Corporation’s liquidity position, as well as long-term operating and strategic plans, to ensure adequacy and efficient use of cash resources. The Corporation uses scenario analyses to stress-test cash flow projections. Liquidity adequacy is continually monitored, taking into consideration historical volatility and seasonal needs, stress-test results, the maturity profile of indebtedness, access to capital markets, the level of customer advances, working capital requirements, the funding of product developments and other financial commitments. The Corporation also monitors any financing opportunities to optimize its capital structure and maintain appropriate financial flexibility. In addition, the Corporation engages in certain working capital financing initiatives such as the sale of receivables, aircraft sale and leaseback transactions and the negotiation of extended payment terms with certain suppliers.
Maturity analysis –The maturity analysis of financial assets and financial liabilities, excluding derivative financial instruments, was as follows, as at December 31, 2016:
Carryingamount
Undiscounted cash flows(before giving effect to the related hedging instruments)
Lessthan 1
year1 to 3years
3 to 5years
5 to 10years
Over 10years
With no specific maturity Total
Cash and cash equivalents $ 3,384 $ 3,384 $ — $ — $ — $ — $ — $ 3,384Trade and other receivables $ 1,291 1,156 10 66 8 3 48 1,291Other financial assets(1) $ 911 118 168 82 556 179 70 1,173Assets 4,658 178 148 564 182 118 5,848Trade and other payables $ 3,239 3,176 17 1 — — 45 3,239Other financial liabilities(1) $ 949 107 218 275 566 238 — 1,404Long-term debt Principal $ 8,769 31 623 3,113 4,579 250 — 8,596 Interest 590 1,162 991 735 140 — 3,618Liabilities 3,904 2,020 4,380 5,880 628 45 16,857Net amount $ 754 $ (1,842) $ (4,232) $ (5,316) $ (446) $ 73 $ (11,009)
(1) The carrying amount of other financial assets excludes the carrying amount of derivative financial instruments and the carrying amount of other financial liabilities excludes the carrying amount of derivative financial instruments and the current portion of long-term debt.
Other financial assets include long-term contract receivables maturing in March 2033. Under the respective agreements, the Corporation will receive incentive payments related to the reliability of manufactured trains. Due to future variations in the relevant index and reassessment of the achievement of the reliability targets, the amounts shown in the table above may vary. Also, termination of a related service contract in case of our non-performance would extinguish our right to future payments.
The Corporation, mainly in Transportation, negotiated extended payment terms of 240 days after delivery with certain of its suppliers. Trade payables with these extended terms totaled €272 million ($287 million) and bore interest at a weighted average rate of 1.75% as at December 31, 2016.

206 BOMBARDIER INC. FINANCIAL REPORT - FISCAL YEAR ENDED DECEMBER 31, 2016
Other financial liabilities include government refundable advances. Under the respective agreements, the Corporation is required to pay amounts to governments at the time of the delivery of aircraft. Due to uncertainty about the number of aircraft to be delivered and the timing of delivery of aircraft, the amounts shown in the table above may vary.
The maturity analysis of derivative financial instruments, excluding embedded derivatives, was as follows, as at December 31, 2016:
Nominalvalue (USDequivalent) Undiscounted cash flows (1)
Lessthan 1
year 1 year2 to
3 years3 to
5 yearsOver
5 years TotalDerivative financial assets
Forward foreign exchange contracts $ 6,331 $ 193 $ 1 $ — $ — $ — $ 194Interest-rate derivatives 1,550 27 18 11 4 — 60
$ 7,881 $ 220 $ 19 $ 11 $ 4 $ — $ 254Derivative financial liabilities
Forward foreign exchange contracts $ 12,386 $ (426) $ (30) $ — $ — $ — $ (456)Interest-rate derivatives — — — — — (1) (1)
$ 12,386 $ (426) $ (30) $ — $ — $ (1) $ (457)Net amount $ (206) $ (11) $ 11 $ 4 $ (1) $ (203)
(1) Amounts denominated in foreign currency are translated at the period end exchange rate.
Market riskForeign exchange riskThe Corporation is exposed to significant foreign exchange risks in the ordinary course of business through its international operations, in particular to the Canadian dollar, Pound sterling, Swiss franc, Swedish krona, euro and Mexican peso. The Corporation employs various strategies, including the use of derivative financial instruments and by matching asset and liability positions, to mitigate these exposures.
The Corporation’s main exposures to foreign currencies are identified by the segments and covered by the central treasury function. Foreign currency exposures are mitigated in accordance with the Corporation’s Foreign Exchange Risk Management Policy (the “FX Policy”). The objective of the FX Policy is to mitigate the impact of foreign exchange movements on the Corporation’s consolidated financial statements. Under the FX Policy, potential losses from adverse movements in foreign exchange rates should not exceed Board authorized pre-set limits. Potential loss is defined as the maximum expected loss that could occur if an unhedged foreign currency exposure was exposed to an adverse change of foreign exchange rates over a one-quarter period. The FX Policy also strictly prohibits any speculative foreign exchange transactions that would result in the creation of an exposure in excess of the maximum potential loss approved by the Board of Directors of the Corporation.
Under the FX Policy, it is the responsibility of the segments’ management to identify all actual and potential foreign exchange exposures arising from their operations. This information is communicated to the central treasury group, which has the responsibility to execute the hedge transactions in accordance with the FX Policy.
In order to properly manage their exposures, each segment maintains long-term cash flow forecasts in each currency. The aerospace segments have adopted a progressive hedging strategy while Transportation hedges all its identified foreign currency exposures to limit the effect of currency movements on their results. The segments also mitigate foreign currency risks by maximizing transactions in their functional currency for their operations such as material procurement, sale contracts and financing activities.
In addition, the central treasury function manages balance sheet exposures to foreign currency movements by matching asset and liability positions. This program consists mainly in matching the long-term debt in foreign currency with long-term assets denominated in the same currency.

BOMBARDIER INC. FINANCIAL REPORT - FISCAL YEAR ENDED DECEMBER 31, 2016 - NOTES 207
The Corporation mainly uses forward foreign exchange contracts to manage the Corporation’s exposure from transactions in foreign currencies and to synthetically modify the currency of exposure of certain balance sheet items. The Corporation applies hedge accounting for a significant portion of anticipated transactions and firm commitments denominated in foreign currencies, designated as cash flow hedges. Notably, the Corporation enters into forward foreign exchange contracts to reduce the risk of variability of future cash flows resulting from forecasted sales and purchases and firm commitments.
The Corporation’s foreign currency hedging programs are typically unaffected by changes in market conditions, as related derivative financial instruments are generally held to maturity, consistent with the objective to lock in currency rates on the hedged item. These programs are reviewed annually and amended as necessary to reflect current market conditions or practices.
Sensitivity analysis Foreign exchange risk arises on financial instruments that are denominated in foreign currencies. The foreign exchange rate sensitivity is calculated by aggregation of the net foreign exchange rate exposure of the Corporation’s financial instruments recorded in its statement of financial position. The following impact on EBT for fiscal year 2016 is before giving effect to cash flow hedge relationships.
Effect on EBTVariation CAD/USD GBP/USD USD/EUR GBP/EUR EUR/CHF Other
Gain (loss) +10% $ 44 $ 3 $ (2) $ 53 $ (38) $ (4)
The following impact on OCI for fiscal year 2016 is for derivatives designated in a cash flow hedge relationship. For these derivatives, any change in fair value is mostly offset by the re-measurement of the underlying exposure.
Effect on OCI before income taxesVariation CAD/USD GBP/USD USD/EUR GBP/EUR EUR/CHF Other
Gain +10% $ 247 $ 47 $ 55 $ — $ 7 $ 60
Interest rate risk The Corporation is exposed to fluctuations in its future cash flows arising from changes in interest rates through its variable-rate financial assets and liabilities including long-term debt synthetically converted to variable interest rate (see Note 27 – Long-term debt). For these items, cash flows could be impacted by a change in benchmark rates such as Libor, Euribor or Banker’s Acceptance. These exposures are predominantly managed by a central treasury function as part of an overall risk management policy, including the use of financial instruments, such as interest-rate swap agreements. Derivative financial instruments used to synthetically convert interest-rate exposures consist mainly of interest-rate swap agreements.
In addition, the Corporation is exposed to gains and losses arising from changes in interest rates, which includes marketability risk, through its financial instruments carried at fair value. These financial instruments include certain aircraft loans and lease receivables, certain investments in financing structures, investments in securities, lease subsidies and certain derivative financial instruments.
The Corporation’s interest rate hedging programs are typically unaffected by changes in market conditions, as related derivative financial instruments are generally held to maturity to ensure proper assets/liabilities management matching, consistent with the objective to reduce risks arising from interest rates movements. These programs are reviewed annually and amended as necessary to reflect current market conditions or practices.
Sensitivity analysisThe interest rate risk primarily relates to financial instruments carried at fair value. Assuming a 100-basis point increase in interest rates impacting the measurement of these financial instruments, excluding derivative financial instruments in a hedge relationship, as of December 31, 2016 and 2015, the impact on EBT would have been a negative adjustment of $22 million as at December 31, 2016 and 2015.
208 BOMBARDIER INC. FINANCIAL REPORT - FISCAL YEAR ENDED DECEMBER 31, 2016
34. FAIR VALUE OF FINANCIAL INSTRUMENTS
Fair value amounts disclosed in these consolidated financial statements represent the Corporation’s estimate of the price at which a financial instrument could be exchanged in a market in an arm’s length transaction between knowledgeable, willing parties who are under no compulsion to act. They are point-in-time estimates that may change in subsequent reporting periods due to market conditions or other factors. Fair value is determined by reference to quoted prices in the principal market for that instrument to which the Corporation has immediate access. However, there is no active market for most of the Corporation’s financial instruments. In the absence of an active market, the Corporation determines fair value based on internal or external valuation models, such as stochastic models, option-pricing models and discounted cash flow models. Fair value determined using valuation models requires the use of assumptions concerning the amount and timing of estimated future cash flows, discount rates, the creditworthiness of the borrower, the aircraft’s expected future value, default probability, generic industrial bond spreads and marketability risk. In determining these assumptions, the Corporation uses primarily external, readily observable market inputs, including factors such as interest rates, credit ratings, credit spreads, default probabilities, currency rates, and price and rate volatilities, as applicable. Assumptions or inputs that are not based on observable market data are used when external data are unavailable. These calculations represent management’s best estimates. Since they are based on estimates, the fair values may not be realized in an actual sale or immediate settlement of the instruments.
Methods and assumptionsThe methods and assumptions used to measure fair value for items recorded at FVTP&L and AFS are as follows:
Aircraft loans and lease receivables and investments in financing structures – The Corporation uses an internal valuation model based on stochastic simulations and discounted cash flow analysis to estimate fair value. Fair value is calculated using market data for interest rates, published credit ratings when available, yield curves and default probabilities. The Corporation uses market data to determine the marketability adjustments and also uses internal assumptions to take into account factors that market participants would consider when pricing these financial assets. The Corporation also uses internal assumptions to determine the credit risk of customers without published credit rating. In addition, the Corporation uses aircraft residual value curves reflecting specific factors of the current aircraft market and a balanced market in the medium and long term.
Investments in securities – The Corporation uses discounted cash flow models to estimate the fair value of unquoted investments in fixed-income securities, using market data such as interest-rate.
Lease subsidies – The Corporation uses an internal valuation model based on stochastic simulations to estimate fair value of lease subsidies incurred in connection with the sale of commercial aircraft. Fair value is calculated using market data for interest rates, published credit ratings when available, default probabilities from rating agencies and the Corporation’s credit spread. The Corporation also uses internal assumptions to determine the credit risk of customers without published credit rating.
Derivative financial instruments – Fair value of derivative financial instruments generally reflects the estimated amounts that the Corporation would receive to sell favourable contracts i.e. taking into consideration the counterparty credit risk, or pays to transfer unfavourable contracts i.e. taking into consideration the Corporation’s credit risk, at the reporting dates. The Corporation uses discounted cash flow analyses and market data such as interest rates, credit spreads and foreign exchange spot rate to estimate the fair value of forward agreements and interest-rate derivatives.
The Corporation uses option-pricing models and discounted cash flow models to estimate the fair value of embedded derivatives using applicable market data.
The Corporation uses an internal valuation model based on stochastic simulations to estimate the fair value of the conversion option embedded in the BT Holdco convertible shares. The fair value of the embedded conversion option is based on the difference in value between: the convertible shares’ accrued liquidation preference based on the minimum return entitlement; and the fair value of the common shares on an as converted basis. This value is dependent on the Transportation segment meeting the performance incentives agreed upon with the CDPQ, the timing of exercise of the conversion rights and the applicable conversion rate. The simulation model generates

BOMBARDIER INC. FINANCIAL REPORT - FISCAL YEAR ENDED DECEMBER 31, 2016 - NOTES 209
multiple Transportation performance scenarios over the expected term of the option. Fair value of the shares on an as converted basis is calculated using an EBIT multiple, which is based on market data, to determine the enterprise value. The discount rate used is also determined using market data. The Corporation uses internal assumptions to determine the term of the instrument and the future performance of the Transportation segment.
The methods and assumptions used to measure fair value for items recorded at amortized cost are as follows:
Financial instruments whose carrying value approximates fair value – The fair values of trade and other receivables, certain aircraft loans and lease receivables, certain investments in securities, certain investments in financing structures, restricted cash, trade and other payables, short-term borrowings and sales and leaseback obligations measured at amortized cost, approximate their carrying value due to the short-term maturities of these instruments, because they bear variable interest-rate or because the terms and conditions are comparable to current market terms and conditions for similar items.
Long-term contract receivables – The Corporation uses discounted cash flow analyses to estimate the fair value using market data for interest rates.
Long-term debt – The fair value of long-term debt is estimated using public quotations, when available, or discounted cash flow analyses, based on the current corresponding borrowing rate for similar types of borrowing arrangements.
Government refundable advances and vendor non-recurring costs – The Corporation uses discounted cash flow analyses to estimate the fair value using market data for interest rates and credit spreads.
Fair value hierarchy The following tables present financial assets and financial liabilities measured at fair value on a recurring basis categorized using the fair value hierarchy as follows: • quoted prices (unadjusted) in active markets for identical assets or liabilities (Level 1); • inputs from observable markets other than quoted prices included in Level 1, including indirectly observable
data (Level 2); and • inputs for the asset or liability that are not based on observable market data (Level 3).
Assessing the significance of a particular input to the fair value measurement in its entirety requires judgment. The fair value of financial assets and liabilities by level of hierarchy was as follows, as at December 31, 2016:
Total Level 1 Level 2 Level 3Financial assetsAircraft loans and lease receivables $ 62 $ — $ — $ 62Derivative financial instruments(1) 340 — 340 —Investments in securities 361 (2) 48 313 —Investments in financing structures 165 — — 165
$ 928 $ 48 $ 653 $ 227Financial liabilitiesTrade and other payables $ (6) $ — $ — $ (6)Lease subsidies (141) — — (141)Derivative financial instruments(1) (627) — (457) (170)
$ (774) $ — $ (457) $ (317)(1) Derivative financial instruments consist of forward foreign exchange contracts, interest-rate swap agreements and embedded derivatives.(2) Excludes $13 million of AFS investments carried at cost.

210 BOMBARDIER INC. FINANCIAL REPORT - FISCAL YEAR ENDED DECEMBER 31, 2016
Changes in the fair value of Level 3 financial instruments were as follows, for fiscal years 2016 and 2015:
Aircraft loansand lease
receivables
Investmentsin financing
structures
Trade andother
payablesLease
subsidiesConversion
optionBalance as at January 1, 2015 $ 263 $ 165 $ (18) $ (172) $ —
Net gains (losses) and interest included in net income(1) (54) (12) — 12 —Issuances 10 — (23) — —Settlements (140) (2) 40 25 —
Balance as at December 31, 2015 79 151 (1) (135) —Net gains (losses) and interest included in net income(1) 2 23 — (28) (61)Issuances — — (11) — (120)Settlements (19) (9) 6 22 —Effect of foreign currency exchange rate changes — — — — 11
Balance as at December 31, 2016 $ 62 $ 165 $ (6) $ (141) $ (170)(1) Of which an amount of $2 million represents realized gains for fiscal year 2016, which is recorded in financing income ($11 million
represents realized gains for fiscal year 2015, which is recorded in financing income).
Main assumptions developed internally for Level 3 hierarchyWhen measuring Level 3 financial instruments at fair value, some assumptions are not derived from an observable market. The main assumptions developed internally for aerospace segments’ level 3 financialinstruments relate to credit risks of customers without published credit rating and marketability adjustments to discount rates specific to our financial assets.
These main assumptions are as follows as at December 31, 2016:
Main assumptions (weighted average)
Aircraft loans andlease receivables
Investments in financingstructures Lease subsidies
Internally assigned credit rating Between BB to CCC (B) Between BB- to CCC+ (B+) Between BB- to CCC (B+)Discount rate adjustments
for marketability Between 7.5%
and 9.84% (9.30%)Between 1.75%
and 8.17% (6.44%) n/a
Also, aircraft residual value curves are important inputs in assessing the fair value of certain financial instruments. These curves are prepared by management based on information obtained from external appraisals and reflect specific factors of the current aircraft market and a balanced market in the medium and long term.
The projected future performance of the Transportation segment is an important input for the determination of the fair value of the embedded derivative option in the convertible shares issued to the CDPQ. The projected future performance of the Transportation segment is prepared by management based on budget and strategic plan.

BOMBARDIER INC. FINANCIAL REPORT - FISCAL YEAR ENDED DECEMBER 31, 2016 - NOTES 211
Sensitivity to selected changes of assumptions for Level 3 hierarchyThese assumptions, not derived from an observable market, are established by management using estimates and judgments that can have a significant effect on revenues, expenses, assets and liabilities. Changing one or more of these assumptions to other reasonably possible alternative assumptions, for which the impact on their fair value would be significant, would change their fair value as follows as at December 31, 2016:
Impact on EBT Change of assumptions
Gain (loss)
Change in fair valuerecognized in EBT for
fiscal year 2016
Decrease in aircraftresidual value curves by 5%
Downgrade the internally assigned
credit rating of unrated customers
by 1 notch
Increase the marketability
adjustments by 100 bps
Aircraft loans andlease receivables $ (5) $ (1) $ (2) $ (3)
Investment in financingstructures $ 10 $ (4) $ (11) $ (9)
Lease subsidies $ (18) n/a $ 2 n/a
n/a: Not applicable
Conversion optionSensitivity analysisA 5% decrease in the expected future performance of the Transportation segment would have resulted in a decrease in the fair value with a corresponding gain recognized in EBT for fiscal year 2016 of $18 million.
A 5% increase in the expected future performance of the Transportation segment would have resulted in an increase in the fair value with a corresponding loss recognized in EBT for fiscal year 2016 of $23 million.
Fair value hierarchy for items recorded at amortized cost The following table presents financial assets and financial liabilities measured at amortized cost on a non-recurring basis categorized using the fair value hierarchy as follows: • quoted prices (unadjusted) in active markets for identical assets or liabilities (Level 1); • inputs from observable markets other than quoted prices included in Level 1, including indirectly observable
data (Level 2); and • inputs for the asset or liability that are not based on observable market data (Level 3).
The fair value of financial assets and liabilities by level of hierarchy was as follows, as at December 31, 2016:
Total Level 1 Level 2 Level 3Financial assetsTrade and other receivables $ 1,291 $ — $ 1,291 $ —Other financial assets Investments in financing structures 43 — — 43 Other 288 — — 288
$ 1,622 $ — $ 1,291 $ 331Financial liabilitiesTrade and other payables $ (3,233) $ — $ (3,233) $ —Long-term debt (8,624) — (8,624) —Other financial liabilities Government refundable advances (430) — — (430) Other (418) — — (418)
$ (12,705) $ — $ (11,857) $ (848)

212 BOMBARDIER INC. FINANCIAL REPORT - FISCAL YEAR ENDED DECEMBER 31, 2016
35. INVESTMENTS IN JOINT VENTURES AND ASSOCIATES
In the normal course of business, the Corporation carries out a portion of its businesses through joint ventures and associates, mainly in Transportation.
The Corporation’s aggregate pro rata shares of net income of joint ventures and associates, were as follows, for fiscal years:
2016 2015Joint ventures $ 65 $ 30Associates 61 119Net income $ 126 $ 149
The Corporation has pledged shares in associates, with a carrying value of $24 million as at December 31, 2016($18 million as at December 31, 2015 and January 1, 2015).
36. TRANSACTIONS WITH RELATED PARTIES
The Corporation’s related parties are its joint ventures, associates and key management personnel.
Joint ventures and associatesThe Corporation buys and sells products and services on arm’s length terms with some of its joint ventures and associates in the ordinary course of business. The following table presents the portion of these transactions that is attributable to the interests of the other venturers, and transaction with associates, for fiscal years:
2016 2015Joint
ventures AssociatesJoint
ventures AssociatesSales of products and services, and other income $ 47 $ 23 $ 100 $ 46Purchase of products and services, and other expenses $ 59 $ 26 $ 129 $ —
The following table presents the Corporation’s outstanding balances with joint ventures and associates, as at:
December 31, 2016 December 31, 2015 January 1, 2015Joint
ventures AssociatesJoint
ventures AssociatesJoint
ventures AssociatesReceivables $ 22 $ 8 $ 31 $ 8 $ 39 $ 5Payables $ 2 $ 4 $ 3 $ 2 $ 6 $ 6Advances and progress billing in excess of long-term contract inventories $ 7 $ — $ 4 $ — $ 4 $ —
Compensation paid to key management personnelThe annual remuneration and related compensation costs of the executive and non-executive board members and key Corporate management, defined as the President and Chief Executive Officer of Bombardier Inc., the Presidents and Chief Operating Officers of aerospace segments and Transportation, and the Senior Vice Presidents of Bombardier Inc., were as follows, for fiscal years:
2016 2015Share-based benefits $ 23 $ 19Salaries, bonuses and other short-term benefits 17 12Retirement benefits 3 4Termination and other long-term benefits 1 11
$ 44 $ 46

BOMBARDIER INC. FINANCIAL REPORT - FISCAL YEAR ENDED DECEMBER 31, 2016 - NOTES 213
37. UNCONSOLIDATED STRUCTURED ENTITIES
The following table presents the assets and liabilities of unconsolidated structured entities in which the Corporation had a significant exposure, as at:
December 31, 2016 December 31, 2015 January 1, 2015Assets Liabilities Assets Liabilities Assets Liabilities
Financing structures related to the sale of commercial aircraft $ 5,625 $ 3,014 $ 6,612 $ 4,102 $ 7,380 $ 4,796
The Corporation has provided credit and/or residual value guarantees to certain structured entities created solely to provide financing related to the sale of commercial aircraft.
Typically, these structured entities are financed by third-party long-term debt and by third-party equity investors who benefit from tax incentives. The aircraft serve as collateral for the structured entities long-term debt. The Corporation retains certain interests in the form of credit and residual value guarantees, subordinated debt and residual interests. Residual value guarantees typically cover a percentage of the first loss from a guaranteed value upon the sale of the underlying aircraft at an agreed upon date. The Corporation also provides administrative services to certain of these structured entities in return for a market fee.
The Corporation’s maximum potential exposure was $1.6 billion, of which $371 million was recorded as provisions and related liabilities as at December 31, 2016 ($1.7 billion and $354 million, respectively, as at December 31, 2015 and $1.8 billion and $295 million, respectively, as at January 1, 2015). The Corporation’s maximum exposure under these guarantees is included in Note 38 – Commitments and contingencies.
The Corporation concluded that it did not control these structured entities.
38. COMMITMENTS AND CONTINGENCIES
The Corporation enters into various sale support arrangements, including credit and residual value guarantees and financing rate commitments, mostly provided in connection with sales of commercial aircraft and related financing commitments. The Corporation is also subject to other off-balance sheet risks described in the following table. These off-balance sheet risks are in addition to the commitments and contingencies described elsewhere in these consolidated financial statements. Some of these off-balance sheet risks are also included in Note 37 – Unconsolidated special purposes entities. The maximum potential exposure does not reflect payments expected to be made by the Corporation.
The table below presents the maximum potential exposure for each major group of exposure, as at:
December 31, 2016 December 31, 2015 January 1, 2015Aircraft sales
Residual value (a) $ 1,300 $ 1,669 $ 1,749Credit (a) 1,233 1,248 1,275Mutually exclusive exposure(1) (562) (598) (628)Total credit and residual value exposure $ 1,971 $ 2,319 $ 2,396Trade-in commitments (b) $ 1,721 $ 1,818 $ 2,696Conditional repurchase obligations (c) $ 207 $ 192 $ 204
Other(2)
Credit (d) $ 48 $ 48 $ 48Performance guarantees (e) $ — $ — $ 38
(1) Some of the residual value guarantees can only be exercised once the credit guarantees have expired without exercise. Therefore, the guarantees must not be added together to calculate the combined maximum exposure for the Corporation.
(2) The Corporation has also provided other guarantees (see section f) below).

214 BOMBARDIER INC. FINANCIAL REPORT - FISCAL YEAR ENDED DECEMBER 31, 2016
The Corporation’s maximum exposure in connection with credit and residual value guarantees related to the sale of aircraft represents the face value of the guarantees before giving effect to the net benefit expected from the estimated value of the aircraft and other assets available to mitigate the Corporation’s exposure under these guarantees. Provisions for anticipated losses amounting to $562 million as at December 31, 2016 ($670 million as at December 31, 2015 and $456 million as at January 1, 2015) have been established to cover the risks from these guarantees after considering the effect of the estimated resale value of the aircraft, which is based on information obtained from external appraisals and reflect specific factors of the current aircraft market and a balanced market in the medium and long-term, and the anticipated proceeds from other assets covering such exposures. In addition, lease subsidies, which would be extinguished in the event of credit default by certain customers, amounted to $141 million as at December 31, 2016 ($135 million as at December 31, 2015 and $172 million as at January 1, 2015). The provisions for anticipated losses are expected to cover the Corporation’s total credit and residual value exposure, after taking into account the anticipated proceeds from the sale of underlying aircraft and the extinguishment of certain lease subsidies obligations.
Aircraft sales
a) Credit and residual value guarantees - The Corporation has provided credit guarantees in the form of lease and loan payment guarantees, as well as services related to the remarketing of aircraft. These guarantees, which are mainly issued for the benefit of providers of financing to customers, mature in different periods up to 2026. Substantially all financial support involving potential credit risk lies with regional airline customers. The credit risk relating to three regional airline customers accounted for 72% of the total maximum credit risk as at December 31, 2016 (71% as at December 31, 2015 and January 1, 2015).
In addition, the Corporation may provide a guarantee for the residual value of aircraft at an agreed-upon date, generally at the expiry date of related financing and lease arrangements. The arrangements generally include operating restrictions such as maximum usage and minimum maintenance requirements. The guarantee provides for a contractually limited payment to the guaranteed party, which is typically a percentage of the first loss from a guaranteed value. In most circumstances, a claim under such guarantees may be made only upon resale of the underlying aircraft to a third party.
The following table summarizes the outstanding residual value guarantees, at the earliest exercisable date, and the period in which they can be exercised, as at:
December 31, 2016 December 31, 2015 January 1, 2015Less than 1 year $ 57 $ 90 $ 56From 1 to 5 years 845 991 777From 5 to 10 years 398 580 880From 10 to 15 years — 8 36
$ 1,300 $ 1,669 $ 1,749
b) Trade-in commitments - In connection with the signing of firm orders for the sale of new aircraft, the Corporation enters into specified-price trade-in commitments with certain customers. These commitments give customers the right to trade-in their pre-owned aircraft as partial payment for the new aircraft purchased.
The Corporation’s trade-in commitments were as follows, as at:
December 31, 2016 December 31, 2015 January 1, 2015Less than 1 year $ 231 $ 271 $ 687From 1 to 3 years 600 204 627Thereafter 890 1,343 1,382
$ 1,721 $ 1,818 $ 2,696
c) Conditional repurchase obligations - In connection with the sale of new aircraft, the Corporation enters into conditional repurchase obligations with certain customers. Under these obligations, the Corporation agrees to repurchase the initial aircraft at predetermined prices, during predetermined periods or at predetermined dates, conditional upon mutually acceptable agreement for the sale of a new aircraft. At the time the Corporation enters into an agreement for the sale of a subsequent aircraft and the customer exercises its right to partially pay for the

BOMBARDIER INC. FINANCIAL REPORT - FISCAL YEAR ENDED DECEMBER 31, 2016 - NOTES 215
subsequent aircraft by trading-in the initial aircraft to the Corporation, a conditional repurchase obligation is accounted for as a trade-in commitment.
The Corporation’s conditional repurchase obligations, as at the earliest exercise date, were as follows, as at:
December 31, 2016 December 31, 2015 January 1, 2015Less than 1 year $ 158 $ 173 $ 195From 1 to 3 years 49 19 9Thereafter — — —
$ 207 $ 192 $ 204
Other guarantees
d) Credit and residual value guarantees - In connection with the sale of certain transportation rail equipment, the Corporation has provided a credit guarantee of lease payments amounting to $48 million as at December 31, 2016 ($48 million as at December 31, 2015 and January 1, 2015). This guarantee matures in 2025.
e) Performance guarantees - In certain projects carried out through consortia or other partnership vehicles in Transportation, partners may be jointly and severally liable to the customer for a default by the other partners. In such cases partners would normally provide counter indemnities to each other. These obligations and guarantees typically extend until final product acceptance by the customer and in some cases to the warranty period.
The Corporation’s maximum net exposure to projects for which the exposure of the Corporation is capped, amounted to $38 million as at January 1, 2015, assuming all counter indemnities are fully honoured. For projects where the Corporation’s exposure is not capped, such exposure has been determined in relation to the Corporation’s partners’ share of the total contract value. Under this methodology, the Corporation’s net exposure is not significant, assuming all counter indemnities are fully honoured. Such joint and several obligations and guarantees have been rarely called upon in the past.
f) Other - In the normal course of its business, the Corporation has entered into agreements that include indemnities in favour of third parties, mostly tax indemnities. These agreements generally do not contain specified limits on the Corporation’s liability and therefore, it is not possible to estimate the Corporation’s maximum liability under these indemnities.
Operating leasesThe Corporation leases buildings and equipment and assumes aircraft operating lease obligations in connection with the sale of new aircraft. Future minimum lease payments, mostly related to buildings and equipment, under non-cancellable operating leases are due as follows, as at:
December 31, 2016 December 31, 2015 January 1, 2015Within 1 year $ 143 $ 146 $ 165Between 1 to 5 years 361 346 438More than 5 years 475 346 512
$ 979 $ 838 $ 1,115
Rent expense was $170 million for fiscal year 2016 ($181 million for fiscal year 2015).
Other commitmentsThe Corporation also has purchase obligations, under various agreements, made in the normal course of business. The purchase obligations are as follows, as at:
December 31, 2016 December 31, 2015 January 1, 2015Within 1 year $ 4,120 $ 6,485 $ 7,061Between 1 to 5 years 8,280 3,925 4,141More than 5 years 46 56 233
$ 12,446 $ 10,466 $ 11,435

216 BOMBARDIER INC. FINANCIAL REPORT - FISCAL YEAR ENDED DECEMBER 31, 2016
The purchase obligations of the Corporation include capital commitments for the purchase of PP&E and intangible assets amounting to $373 million and $415 million, respectively, as at December 31, 2016 ($176 million and $489 million as at December 31, 2015 and $196 million and $432 million as at January 1, 2015).
Litigation In the normal course of operations, the Corporation is a defendant in certain legal proceedings currently pending before various courts in relation to product liability and contract disputes with customers and other third parties. The Corporation intends to vigorously defend its position in these matters.
While the Corporation cannot predict the final outcome of all legal proceedings pending as at December 31, 2016, based on information currently available, management believes that the resolution of these legal proceedings will not have a material adverse effect on its financial position.
TransportationSince the fourth quarter of 2016, one of the Corporation’s subsidiaries is cooperating with police authorities in relation to an on-going investigation against unidentified suspects alleging unethical actions but without providing any particulars. The investigation is ongoing but at this time no charges have been laid against either the Corporation, its subsidiary, or any of its employees. The underlying contract in Transportation that has given rise to this matter is currently also being audited by a multilateral financial institution pursuant to a contractual right. The audit is still ongoing and no results have been communicated to the Corporation or its subsidiary. The Corporation’s policy is to comply with all applicable laws and it is fully cooperating with the investigation and the audit. Due to the nature of these proceedings, it is not possible at this time to identify potential outcomes or consequences, if any, for the Corporation in connection therewith.
Investigation in Brazil On March 20, 2014, Bombardier Transportation Brasil Ltda (“BT Brazil”), a wholly owned subsidiary of the Corporation, received notice that it was among the 18 companies and over 100 individuals named in administrative proceedings initiated by governmental authorities in Brazil, including the Administrative Council for Economic Protection (“CADE”), and the Sao Paulo Public Prosecutor’s office, following previously disclosed investigations carried on by such governmental authorities with respect to allegations of cartel activity in the public procurement of railway equipment and the construction and maintenance of railway lines in Sao Paulo and other areas. Since the service of process in 2014 on BT Brazil, the competition authority has decided to detach the proceedings against 43 individuals whom it claims to have been difficult to serve process and has also issued additional technical notes dealing with various procedural objections raised by the defendant corporations and individuals. BT Brazil is currently contesting before the courts both the decision to detach the proceedings against 43 individuals and decisions by CADE restricting physical access to some of the forensic evidence.
BT Brazil as a result of the administrative proceedings initiated by CADE in 2014 became a party as defendant to legal proceedings brought by the Sao Paulo State prosecution service against it and other companies for alleged ‘administrative improbity’ in relation to refurbishment contracts awarded in 2009 by the Sao Paulo metro operator CMSP and for ‘cartel’ in relation to a five year-maintenance contract with the Sao Paulo urban transit operator CPTM signed in 2002. In September 2015, the prosecution service of Sao Paulo announced a second public civil action for ‘cartel’ in relation to the follow-on five year maintenance contract covering the period 2007 to 2012. In addition, BT Brazil was served notice and joined in December 2014 a civil suit as co-defendant first commenced by the Sao Paulo state government against Siemens AG in the fall of 2013 and with which the State government seeks to recover loss for alleged cartel activities.
Companies found to have engaged in unlawful cartel conduct are subject to administrative fines, state actions for repayment of overcharges and potentially disqualification for a certain period. The Corporation and BT Brazil continue to cooperate with investigations relating to the administrative proceedings and intend to defend themselves vigorously.

BOMBARDIER INC. FINANCIAL REPORT - FISCAL YEAR ENDED DECEMBER 31, 2016 - NOTES 217
Triumph litigationTriumph Aerostructures LLC (“Triumph”), a supplier to the Corporation on the Global 7000 and Global 8000 aircraft program, filed a lawsuit against the Corporation with the Québec Superior Court, District of Montréal on December 22, 2016 seeking approximately $340 million in compensation for alleged directed changes by the Corporation to the wing requirements that Triumph claims are outside the scope of the contract as well as for alleged delays and disruption in connection with the contract. The Corporation intends to vigorously defend itself against the claims asserted in the litigation, and, at the appropriate time, file its claims against Triumph to recover the costs incurred by the Corporation for the two year adjournment of the EIS of the Global 7000 announced in July 2015 and for other program disruptions attributable to Triumph. Despite the litigation, Triumph remains bound under the contract to support the Global 7000 and 8000 program.
Metrolinx In July 2016, Bombardier Transportation Canada Inc. received a notice of default in respect of its contract to supply 182 Light vehicles to Metrolinx. The contract was entered into on June 14, 2010. The value of the contract is $770 million CDN ($573 million). The Corporation is actively opposing the notice of default utilizing the Dispute Resolution Process under the contract. On October 28, 2016, Metrolinx served Bombardier Transportation Canada Inc. with a Notice of Intention to Terminate the Contract on the basis of the notice of default. In order to prevent Metrolinx from serving a notice of termination until such time as the dispute resolution process is concluded including all adjudication by the Dispute Resolution Panel and any subsequent appeals, the Corporation filed an application in Ontario Superior Court on February 10, 2017 seeking an order maintaining the status quo and declaring that Metrolinx is not permitted to terminate the contract. The Corporation intends to fulfill its obligations under the Contract.
Bombardier, Challenger, CRJ, CRJ 1000, CRJ Series, CS100, CS300, C Series, Global, Global 7000, Global 8000, Learjet, Learjet 85 and Q400 are trademarks of Bombardier Inc. or its subsidiaries.

218 BOMBARDIER INC. FINANCIAL REPORT - FISCAL YEAR ENDED DECEMBER 31, 2016
INVESTOR INFORMATIONOur Board of Directors
BOARD MEMBERS(1)
Pierre Beaudoin Executive Chairman of the Board of Directors of BombardierLaurent Beaudoin Chairman EmeritusAlain Bellemare President and Chief Executive Officer of BombardierJoanne Bissonnette Corporate DirectorJ. R. André Bombardier Vice Chairman of the Board of Directors of BombardierMartha Finn Brooks Corporate DirectorJean-Louis Fontaine Vice Chairman of the Board of Directors of BombardierSheila Fraser Corporate DirectorAugust W. Henningsen Corporate DirectorDaniel Johnson Counsel, McCarthy Tétrault LLPJean C. Monty Corporate DirectorVikram Pandit Chairman and Chief Executive Officer of the Orogen Group (a company leveraging
opportunities for the financial services industry)Patrick Pichette Advisor to Google Inc. (an Internet related services and products company)Carlos E. Represas Corporate DirectorBeatrice Weder di Mauro Professor of International Macroeconomics, Johannes Gutenberg University Mainz
BOARD COMMITTEES
Boardcommittees Board representation(1) ResponsibilitiesAudit Committee Sheila Fraser (Chair)
Jean C. MontyVikram PanditBeatrice Weder di Mauro
• Help the directors meet their responsibilities with respect to accountability• Assist in maintaining good communication between the directors and Ernst & Young, Bombardier’s independent auditors• Assist in maintaining the independence of Ernst & Young• Maintain the credibility and objectivity of our financial reports• Investigate and assess any material risk
Finance and Risk Management Committee
Patrick Pichette (Chair)Martha Finn BrooksAugust W. HenningsenVikram PanditCarlos E. Represas
• Review Bombardier’s material financial risks and its monitoring, control and risk management• Review adequacy of policies, procedures and controls in place for risk management• Review and monitor significant or unusual transactions and/or projects related to ongoing activities, business opportunities, mergers, acquisitions, divestitures, significant asset sales or purchases and equity investments• Monitor matters or activities related to or involving Bombardier’s financial standing
CorporateGovernance andNominationCommittee
Carlos E. Represas (Chair)Martha Finn BrooksDaniel JohnsonJean C. Monty
• Monitor selection criteria and credentials for Board candidates• Monitor Board and Committees’ composition and performance• Monitor Board remuneration
HumanResources andCompensationCommittee
Jean C. Monty (Chair)August W. HenningsenPatrick PichetteCarlos E. Represas
• Oversee succession planning of the President and CEO and other selected senior positions• Assess performance of the President and CEO• Review and approve total executive compensation policy accounting for base salary, short-term and long-term incentives as well as pension, benefits and perquisites
(1) As at December 31, 2016. Supplemental information regarding our Board of Directors can be found on our website at bombardier.com.

BOMBARDIER INC / 2016 FINANCIAL REPORT / INVESTOR INFORMATION 219
STOCK EXCHANGE LISTINGSClass A Shares and Class B Subordinate Voting Shares Toronto (Canada)Preferred Shares, Series 2, Series 3 and Series 4 Toronto (Canada)
Stock listing ticker BBD (Toronto)
FISCAL YEAR 2017 FINANCIAL RESULTS
First quarterly report May 11, 2017
Second quarterly report July 28, 2017
Third quarterly report November 2, 2017
2017 Annual Financial Report February 15, 2018
PREFERRED DIVIDEND PAYMENT DATESPayment subject to approval by the Board of Directors
Series 2Record date Payment date Record date Payment date2016-12-30 2017-01-15 2017-06-30 2017-07-152017-01-31 2017-02-15 2017-07-31 2017-08-152017-02-28 2017-03-15 2017-08-31 2017-09-152017-03-31 2017-04-15 2017-09-29 2017-10-152017-04-28 2017-05-15 2017-10-31 2017-11-152017-05-31 2017-06-15 2017-11-30 2017-12-15
Series 3 Series 4Record date Payment date Record date Payment date2017-01-13 2017-01-31 2017-01-13 2017-01-312017-04-14 2017-04-30 2017-04-14 2017-04-302017-07-14 2017-07-31 2017-07-14 2017-07-312017-10-13 2017-10-31 2017-10-13 2017-10-31
Please note that unless stated otherwise, all dividends paid by Bombardier since January 2006 on all of its common and preferred shares are considered “eligible dividends” as per the Canadian Income Tax Act and any corresponding provincial or territorial legislation. The same designation applies under the Quebec Taxation Act for dividends declared after March 23, 2006.

220 BOMBARDIER INC. FINANCIAL REPORT - FISCAL YEAR ENDED DECEMBER 31, 2016
Contact Information
Bombardier Inc.800 René-Lévesque Blvd. WestMontréal, QuébecCanada H3B 1Y8Investor relationsTel.: +1 514 861 9481, extension 13273Fax: +1 514 861 2420Email: [email protected].: +1 514 861 9481, extension 13390Fax: +1 514 861 2420
DUPLICATIONAlthough Bombardier strives to ensure that registered shareholders receive only one copy of corporate documents, duplication is unavoidable if securities are registered under different names and addresses. If this is the case, please call Computershare Investor Services at one of the following numbers:+1 514 982 7555 or +1 800 564 6253 (toll-free, North America only) or send an email [email protected].
ONLINE INFORMATIONFor additional information, we invite you to visit our websites at:bombardier.com and ir.bombardier.com
TRANSFER AGENT AND REGISTRARShareholders with inquiries concerning their shares should contact:
Computershare Investor Services Inc.100 University Avenue, 8th FloorToronto, OntarioCanada M5J 2Y1or1500 Robert-Bourassa Blvd., Suite 700Montréal, QuébecCanada H3A 3S8Tel.: +1 514 982 7555 or +1 800 564 6253(toll-free, North America only)Fax: +1 416 263 9394 or +1 888 453 0330(toll-free, North America only)Email: [email protected]
AUDITORSErnst & Young LLP800 René-Lévesque Blvd. WestMontréal, QuébecCanada H3B 1X9
ANNUAL MEETINGThe annual meeting of shareholders will be held on Thursday, May 11, 2017, at 10:00 a.m. at the following address:
Bombardier Global Completion Centre200 Côte-Vertu Road WestDorval, Québec, Canada H4S 2A3
The annual meeting will also be broadcast live on our website at bombardier.com.

Global 7000 and Global 8000 aircraft program is currently in development, and as such is subject to changes in family strategy, branding, capacity, performance, design and/or systems. All specifications and data are approximate, may change without notice and are subject to certain operating rules, assumptions and other conditions. This document does not constitute an offer, commitment, representation, guarantee or warranty of any kind.
ALP, AVENTRA, BiLevel, Bombardier, Challenger, Challenger 300, Challenger 350, Challenger 605, Challenger 650, Challenger 850, CITYFLO, CRJ, CRJ200, CRJ700, CRJ900, CRJ1000, CRJ Series, C Series, CS100, CS300, EBI, ELECTROSTAR, FlexCare, FLEXITY, FLEXX, Global, Global 5000, Global 6000, Global 7000, Global 8000, INNOVIA, INTERFLO, Learjet, Learjet 70, Learjet 75, Learjet 85, MITRAC, MOVIA, OMNEO, OPTIFLO, Parts Express, Q400, Q Series, REGINA, Smart Parts, Smart Parts Plus, Smart Parts Maintenance Plus, Smart Parts Preferred, Smart Services, SPACIUM, TALENT, TRAXX, TWINDEXX, WAKO and ZEFIRO are trademarks of Bombardier Inc. or its subsidiaries.
fPSfor positioning only
FSC® is not responsible for calculatingresources saved when using this paper.
Printed in CanadaISBN: 978-2-923797-38-0Legal deposit, Bibliothèque etArchives nationales du QuébecAll rights reserved.© 2017 Bombardier Inc. or its subsidiaries
The printed version of this annual report uses paper containing 30% post-consumer fibres,certified EcoLogo, processed chlorine free. Using this paper, instead of virgin paper, saves:
58mature trees, equivalent to the area of
4 tennis courts
2,574 kgof waste, or the
contents of 53 garbage cans
23,577 kg of CO2,
equivalent to the annual
emissions of 8 cars
210,008 litresof water, equal to one person’s
consumption of water in 600 days
Data issued by the paper manufacturer.
10.3

bombaRdieR.com
10.4