financial reporting using microsoft excel - sedonaoffice · pdf file2014 sedonaoffice users...
TRANSCRIPT

Financial Reporting Using Microsoft Excel
Presented By:
Jim Lee

2014 SedonaOffice Users Conference Financial Reporting Using Excel Marco Island, Florida Presented By: Jim Lee
Page 2 of 34
Table of Contents Financial Reporting Overview ................................................................................................ 4 Reporting Periods.................................................................................................................................................................... 4 Microsoft Excel ......................................................................................................................................................................... 4
SedonaOffice General Ledger Structure ................................................................................. 5 Invoice Example ....................................................................................................................................................................... 5 General Ledger Account Code ............................................................................................................................................ 6 Branch Code ............................................................................................................................................................................... 6 Category Code ........................................................................................................................................................................... 7 Fiscal Year ................................................................................................................................................................................... 7 Monthly Period ......................................................................................................................................................................... 7 GL Mask ....................................................................................................................................................................................... 7
Extracting the GL Data from SedonaOffice to Excel ................................................................ 8 The GL Summary Table ......................................................................................................................................................... 8 GL Summary Update Wizard............................................................................................................................................... 8
Importing the SedonaOffice GL Data into Excel .................................................................... 11
Understanding the GL Data .................................................................................................. 15 GL Data Elements................................................................................................................................................................... 15 The Zero (0) Period – Balance Sheet Accounts Only ............................................................................................... 16 Retained Earnings Account ............................................................................................................................................... 16
GL Account, Branch and Category Codes .............................................................................. 17
Excel Commands ................................................................................................................. 18 Concatenate ............................................................................................................................................................................. 18 Sumif ........................................................................................................................................................................................... 18
Setting up your “Template” Excel Spreadsheet .................................................................... 19 The Variables Tab .................................................................................................................................................................. 19
Creating a Simple Income Statement ................................................................................... 20 Report Header ......................................................................................................................................................................... 20 Report Data .............................................................................................................................................................................. 20
GL Mask ........................................................................................................................................................................................... 20 Data Selection .............................................................................................................................................................................. 20 GL Data ........................................................................................................................................................................................... 21
Copy and Paste Additional Rows .................................................................................................................................... 21 Summing Data and Format ................................................................................................................................................ 21 Setting the Print Area ........................................................................................................................................................... 24
Adding a Year-to-Date column to the Income Statement ...................................................... 25 The SUMIF for YTD ............................................................................................................................................................... 25
Creating a Balance Sheet ..................................................................................................... 27 Retained Earnings Balance ................................................................................................................................................ 27 Net Income (Loss) for the Current Fiscal Year .......................................................................................................... 27

2014 SedonaOffice Users Conference Financial Reporting Using Excel Marco Island, Florida Presented By: Jim Lee
Page 3 of 34
Creating a Budget ................................................................................................................ 30 Actual to Budget – Income Statement ........................................................................................................................... 31
Month to Date Budget .............................................................................................................................................................. 31 Yearly Budget ............................................................................................................................................................................... 31
Branch Level Income Statement........................................................................................... 33
Category Level Income Statement........................................................................................ 34

2014 SedonaOffice Users Conference Financial Reporting Using Excel Marco Island, Florida Presented By: Jim Lee
Page 4 of 34
Financial Reporting Overview Balance sheets, income statements and other financial statements are essential for understanding a company’s financial status and performance. This guide illustrates the steps for creating different types of financial statements using the general ledger data from SedonaOffice.
Reporting Periods The reports created using the tools described herein are period end reports. Reports can be run for a complete year, year-to-date, quarterly or monthly periods. They are not meant to be used for mid-month, weekly or daily financial reports.
Microsoft Excel All the reports as reviewed within this guide are created using Microsoft Excel. For purposes of this guide Microsoft Excel 2007 has been used. Excel 2007 or higher is highly recommended as it has expanded capabilities to handle over one million rows of data.

2014 SedonaOffice Users Conference Financial Reporting Using Excel Marco Island, Florida Presented By: Jim Lee
Page 5 of 34
SedonaOffice General Ledger Structure Before we begin, let’s review the SedonaOffice General Ledger Structure. Understanding of this and how transactions are created in SedonaOffice is essential to create useful financial reports. Let’s start off by looking at the creation of a general ledger transaction. Remember there are many different ways a general ledger transaction is created in SedonaOffice, but each has the same characteristics upon completion.
Invoice Example This is a simple service invoice.
Below is the journal information for the invoice created.

2014 SedonaOffice Users Conference Financial Reporting Using Excel Marco Island, Florida Presented By: Jim Lee
Page 6 of 34
General Ledger Account Code The first segment of each transaction is the GL Account. The collection of GL accounts within your accounting system is called the Chart of Accounts.
Branch Code The next segment to a transaction is the Branch GL Code. This code is setup in the Branch setup in SedonaOffice. Each Branch requires a unique GL Code (including any inactive Branches).

2014 SedonaOffice Users Conference Financial Reporting Using Excel Marco Island, Florida Presented By: Jim Lee
Page 7 of 34
Category Code The third segment is the Category GL Code. This code is setup in the Category setup in SedonaOffice. Each Category requires a unique GL Code (including any inactive Branches).
Fiscal Year The fourth element of each transaction is the fiscal year. This is automatically set based on the posting period for the entry.
Monthly Period The last element of the general ledger transaction is the monthly period. This is automatically set based on the posting period for the entry.
GL Mask The GL Mask is the complete set of GL Data created for each line in a transaction. The GL Mask is made up of 5 parts:
GL Code – Branch – Category – Fiscal Year – Period The separator used by SedonaOffice is a ‘-‘ (dash). Therefore it is highly recommended you do not use a dash in any of your GL Codes. In the invoice example above we have three lines of GL Data. Here is the complete GL Code for each line.
1) Debit to Accounts Receivable 11000-20-000-2007-12 2) Credit to Income 40010-20-101-2007-12 3) Credit to Sales Tax Liability 24030-20-000-2007-12
NOTE: The Category GL Code for balance sheet accounts is always all zeros. In this case it is ‘000’.

2014 SedonaOffice Users Conference Financial Reporting Using Excel Marco Island, Florida Presented By: Jim Lee
Page 8 of 34
Extracting the GL Data from SedonaOffice to Excel GL data must be extracted from SedonaOffice for use in building financial reports in Excel. But don’t worry; this is an easy process using the tools provided by SedonaOffice.
The GL Summary Table The GL Summary Table resides in your SedonaOffice database and is the data source for your Excel-based financial statements. Refreshing the table can take up to 20 minutes depending on the size of your database, but should be much less for properly configured servers.
GL Summary Update Wizard Select the SedonaOffice Client Tools to begin the process of updating the GL Data.
Select the GL Summary Update Wizard option then press Open.

2014 SedonaOffice Users Conference Financial Reporting Using Excel Marco Island, Florida Presented By: Jim Lee
Page 9 of 34
Choose the SedonaOffice database to update then press Next.
Wait for the process to finish; it can take up to 20 minutes based on the size of your database and configuration of your server.
2014 SedonaOffice Users Conference Financial Reporting Using Excel Marco Island, Florida Presented By: Jim Lee
Page 10 of 34
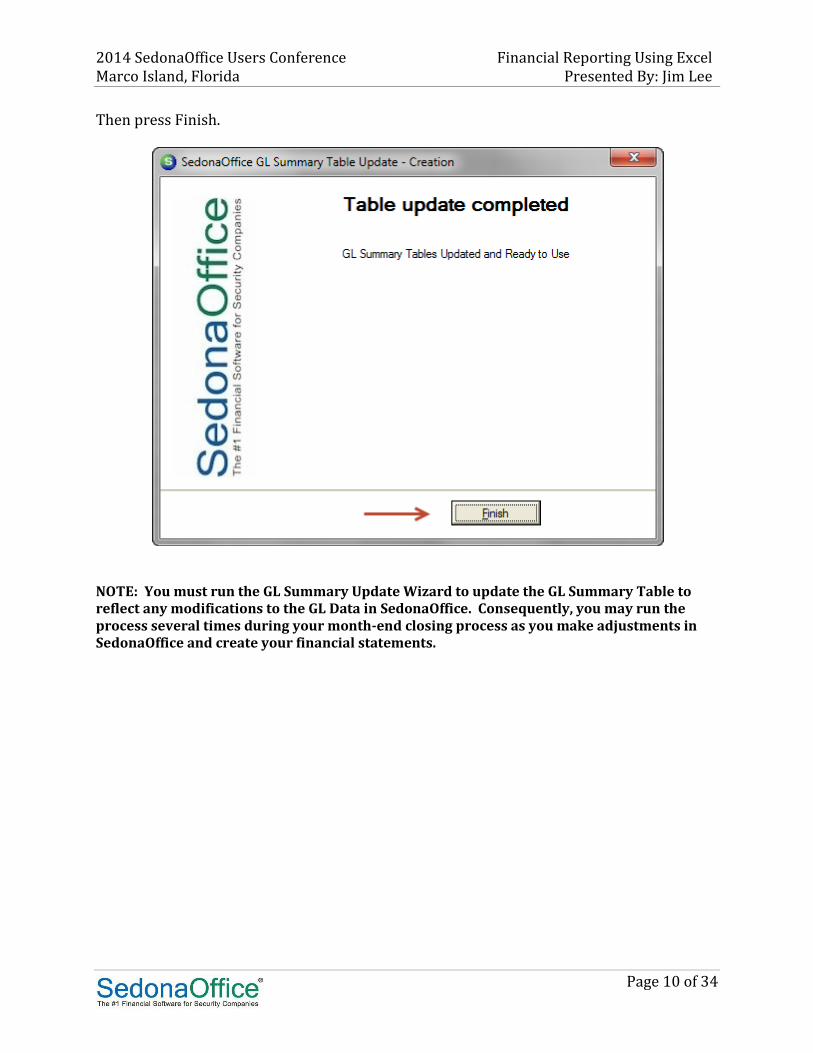
Then press Finish.
NOTE: You must run the GL Summary Update Wizard to update the GL Summary Table to reflect any modifications to the GL Data in SedonaOffice. Consequently, you may run the process several times during your month-end closing process as you make adjustments in SedonaOffice and create your financial statements.

2014 SedonaOffice Users Conference Financial Reporting Using Excel Marco Island, Florida Presented By: Jim Lee
Page 11 of 34
Importing the SedonaOffice GL Data into Excel Let’s now review how to import the GL Data into Microsoft Excel. In this example we are going to use the feature in Excel to Query an External Data Source using Microsoft Query. This feature is available in most recent versions of Excel.
If you have not already done so, you will need to create a Data Source connection to your SedonaOffice database.
2014 SedonaOffice Users Conference Financial Reporting Using Excel Marco Island, Florida Presented By: Jim Lee
Page 12 of 34
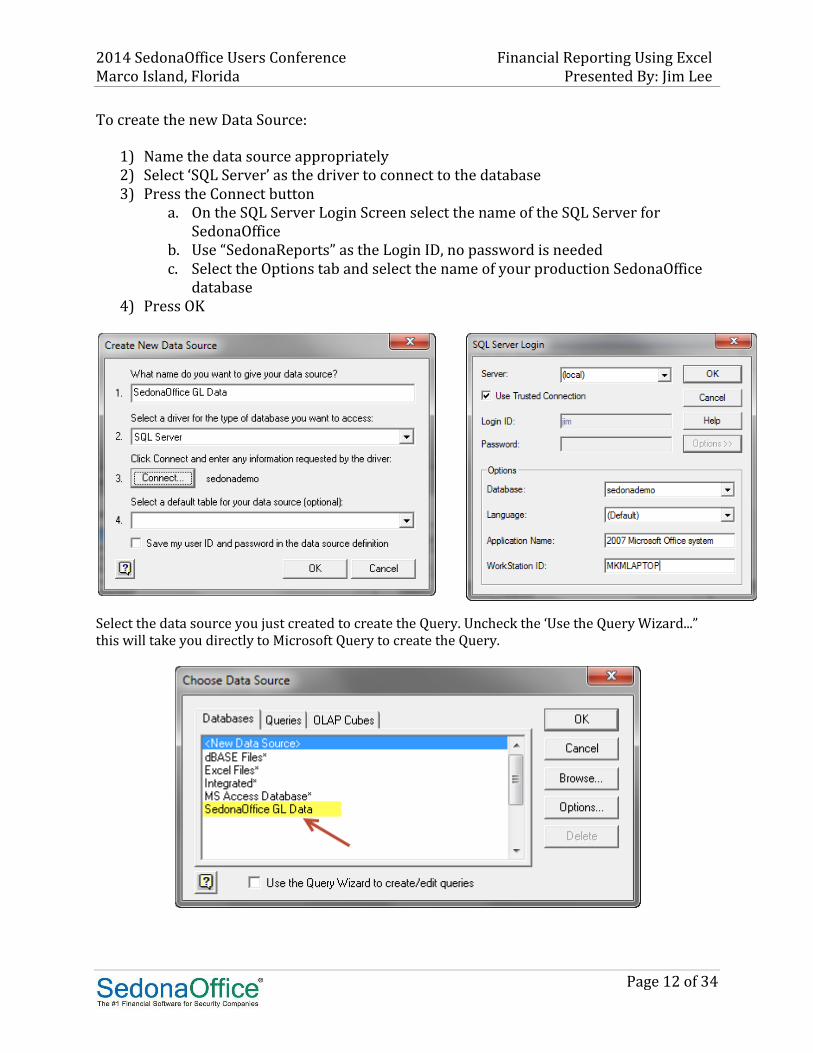
To create the new Data Source:
1) Name the data source appropriately 2) Select ‘SQL Server’ as the driver to connect to the database 3) Press the Connect button
a. On the SQL Server Login Screen select the name of the SQL Server for SedonaOffice
b. Use “SedonaReports” as the Login ID, no password is needed c. Select the Options tab and select the name of your production SedonaOffice
database 4) Press OK
Select the data source you just created to create the Query. Uncheck the ‘Use the Query Wizard...” this will take you directly to Microsoft Query to create the Query.

2014 SedonaOffice Users Conference Financial Reporting Using Excel Marco Island, Florida Presented By: Jim Lee
Page 13 of 34
Select the “SO_Complete_GL_Total_YTD” table to use in the Query. Then click Close.
Next, select the data fields and criteria for the data to be returned. Select all the data elements in the Table. While it doesn’t really matter what order to display the data fields, using the order as shown below will be more logical when viewed with Excel.

2014 SedonaOffice Users Conference Financial Reporting Using Excel Marco Island, Florida Presented By: Jim Lee
Page 14 of 34
Since this table can contain thousands if not hundreds of thousands of records, it is best to use some criteria to limit the data that returns. Criteria Selections:
1) YTD_Net <> $0 – By selecting this option only data with values will be returned.
2) Fiscal Year >= 2011 – In this case only years 2011, 2012 and 2013 are needed so limit the data to only these fiscal years.
3) Fiscal Year < 2014 – In this case since 2014 has been created we can remove these entries since were still reporting on 2013.
4) Net_Amount <>$0 – This is included as an ‘OR’ selection. This is necessary to return the Retained Earnings account (more on this later).
Now that we have completed the Query, click the Return Data icon, and the GL Data will be returned to Excel.

2014 SedonaOffice Users Conference Financial Reporting Using Excel Marco Island, Florida Presented By: Jim Lee
Page 15 of 34
Understanding the GL Data Now that the GL Data has been retrieved, let’s take a close look at what we have.
GL Data Elements
Account_Cast – The Account_Cast is the complete GL Mask that includes the GL Account Code, Branch, Category, Fiscal Year and Period. There is one unique Account_Cast for each accounting period of the unique combination of GL Code, Branch and Category.
Debit_Amount – The Debit_Amount is the current period debit total for all transactions
with this Account_Cast.
Credit_Amount – The Credit_Amount is the current period credit total for all transactions with this Account_Cast.
Net_Amount – The Net_Amount is the current period net balance based on the Balance_Rule for the GL Account.
YTD_Debit – The YTD_Debit is the running balance of the YTD Debits for the Account_Cast.
YTD_Credit – The YTD_Credit is the running balance of the YTD Credits for the Account_Cast.
YTD_Net – The YTD_Net is the running YTD total for the GL Account based on the Balance_Rule.
Balance_Rule – The Balance_Rule specifies if the GL Account is a debit or credit balance account.
o 1 = Debit Balance – The Net amounts are calculated as Debit – Credit o 2 = Credit Balance – The Net amounts are calculated as Credit – Debit

2014 SedonaOffice Users Conference Financial Reporting Using Excel Marco Island, Florida Presented By: Jim Lee
Page 16 of 34
The Zero (0) Period – Balance Sheet Accounts Only Balance sheet accounts will contain a 0 (zero) period which is the YTD carry forward from the previous fiscal year. Income Statement GL Accounts do not have a 0 (zero) period as each new fiscal year these accounts begin accumulating new.
Retained Earnings Account The Retained Earnings account’s GL Data is carried forward in the 0 (zero) period record only, and the carry forward retained earnings is in the Net_Amount bucket. You’ll need to remember this when you put together your balance sheet.

2014 SedonaOffice Users Conference Financial Reporting Using Excel Marco Island, Florida Presented By: Jim Lee
Page 17 of 34
GL Account, Branch and Category Codes Before we begin creating the financial statements, let’s discuss the things you need to consider when building your GL Codes. When creating your codes you will want to use a numbering sequence that is logical to the way you want to present your financial reports. Let’s review a few examples. Let’s say you have 3 different bank accounts; the checking account, the payroll account and a savings account. When you prepare your balance sheet you may want to display each account on the report or you may want to consolidate the three accounts into one. For our example we want to consolidate them. So we’ll give them the following GL Account Codes:
10010 – Checking Account 10020 – Payroll Account 10030 – Savings Account
With this numbering scheme each of the bank accounts begins with a ‘100’. This will allow us to select all the bank accounts by selecting a mask of ‘100*’ when selecting the bank accounts. (We’ll review this further when we build the reports) You can use this same numbering scheme for all the different GL Codes as well as for Branches and Categories. NOTE: Setting up the proper GL Codes is essential to creating your financial statements.

2014 SedonaOffice Users Conference Financial Reporting Using Excel Marco Island, Florida Presented By: Jim Lee
Page 18 of 34
Excel Commands Here are the Excel commands needed to build the financial reports.
Concatenate The Concatenate command is necessary to build the GL Mask for the selection of data to report on. The purpose of the Concatenate command is to join several text strings into one text string.
Sumif The Sumif command is used to bring back the data based on the results of the Concatenate value created. The Sumif command is used to add (sum) cells based on a given condition.

2014 SedonaOffice Users Conference Financial Reporting Using Excel Marco Island, Florida Presented By: Jim Lee
Page 19 of 34
Setting up your “Template” Excel Spreadsheet The financial statement spreadsheet you build is really a template in that you will be able to use the same spreadsheet month after month. You simply refresh the GL Data and modify a few variables to produce your financial reports for a specific month. Like any spreadsheet, be sure to create a back-up copy each time you make modifications to the template.
The Variables Tab In the sample below are a set of Variables that will be used for the financial statements. Some of these variables are fixed while others will need to be updated each month. As we build the financial statements you will see how the data is used.

2014 SedonaOffice Users Conference Financial Reporting Using Excel Marco Island, Florida Presented By: Jim Lee
Page 20 of 34
Creating a Simple Income Statement Let’s start out by creating a very simple income statement.
Report Header For the header we start off with the company name. In this case we use the following command. This command returns the value from the Variables tab that contains the company name.
For the title of the income statement, we typed in “INCOME STATEMENT” For the period ending line, we use the following command, which brings in the month and year from the Variables tab.
Report Data In this example we are going to break our income into four different lines. For this example we are going to mask the lines of data using a GL Mask.
GL Mask Let’s review how we retrieve and format a row of data. The first row of data is the installation revenue. In this example all the installation revenue GL Codes have been mapped to begin with “400”, therefore to return all the GL Data with these values we select a GL Mask of “400*”
Data Selection The next key element to return the correct GL Data is the Data Selection. The Data Selection is a mapping of the “GL Code – Branch – Category – Fiscal Year – Period”. In the example for the first row of GL Data to create a Data Selection to return the installation sales we build the data using this command.
In this example:
The GL Code is returned from the cell “B10”, which contains the installation revenue GL Mask. “400*”
2014 SedonaOffice Users Conference Financial Reporting Using Excel Marco Island, Florida Presented By: Jim Lee
Page 21 of 34
The Branch returns the “All Branches” variable from the Variables tab. “*” The Category returns the “All Categories” variable from the Variables tab. “*” The Fiscal Year returns the Current Fiscal Year variable from the Variables tab. “2013” The Period returns the Current Accounting Period variable from the Variables tab. “12” Between each variable a “-“ is used in the command to separate each element. The end result of the command is: 400*-*-*-2013-12
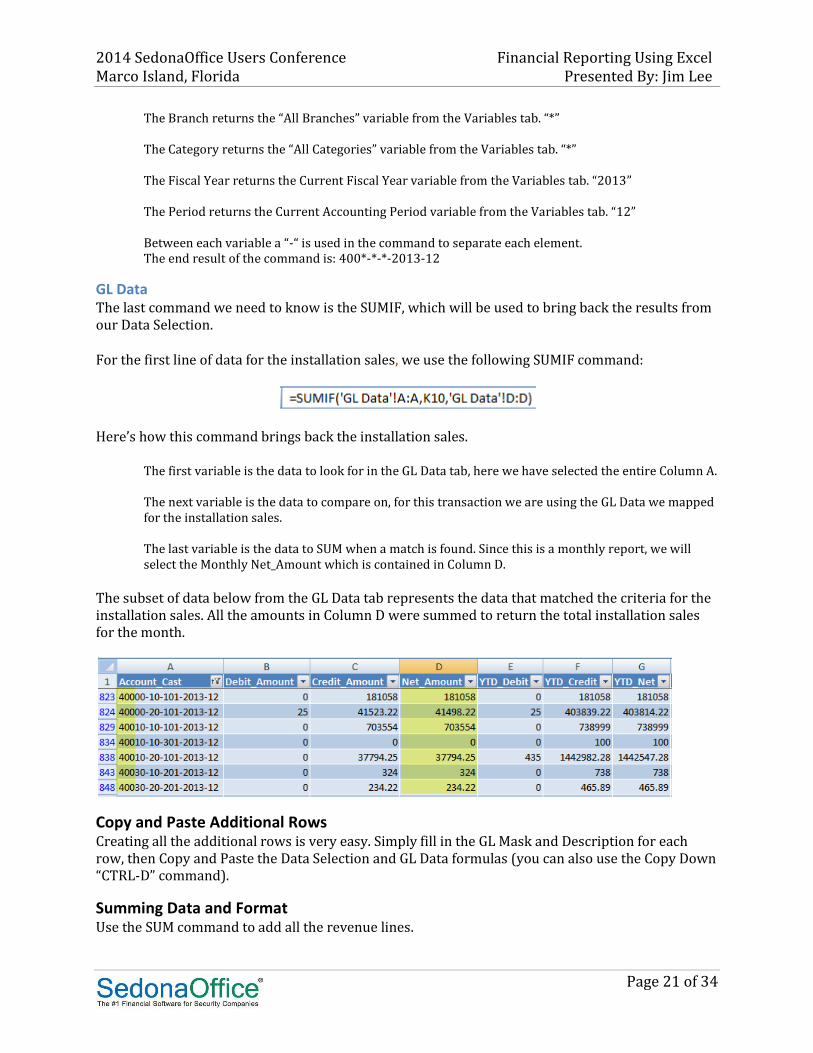
GL Data The last command we need to know is the SUMIF, which will be used to bring back the results from our Data Selection. For the first line of data for the installation sales, we use the following SUMIF command:
Here’s how this command brings back the installation sales.
The first variable is the data to look for in the GL Data tab, here we have selected the entire Column A. The next variable is the data to compare on, for this transaction we are using the GL Data we mapped for the installation sales. The last variable is the data to SUM when a match is found. Since this is a monthly report, we will select the Monthly Net_Amount which is contained in Column D.
The subset of data below from the GL Data tab represents the data that matched the criteria for the installation sales. All the amounts in Column D were summed to return the total installation sales for the month.
Copy and Paste Additional Rows Creating all the additional rows is very easy. Simply fill in the GL Mask and Description for each row, then Copy and Paste the Data Selection and GL Data formulas (you can also use the Copy Down “CTRL-D” command).
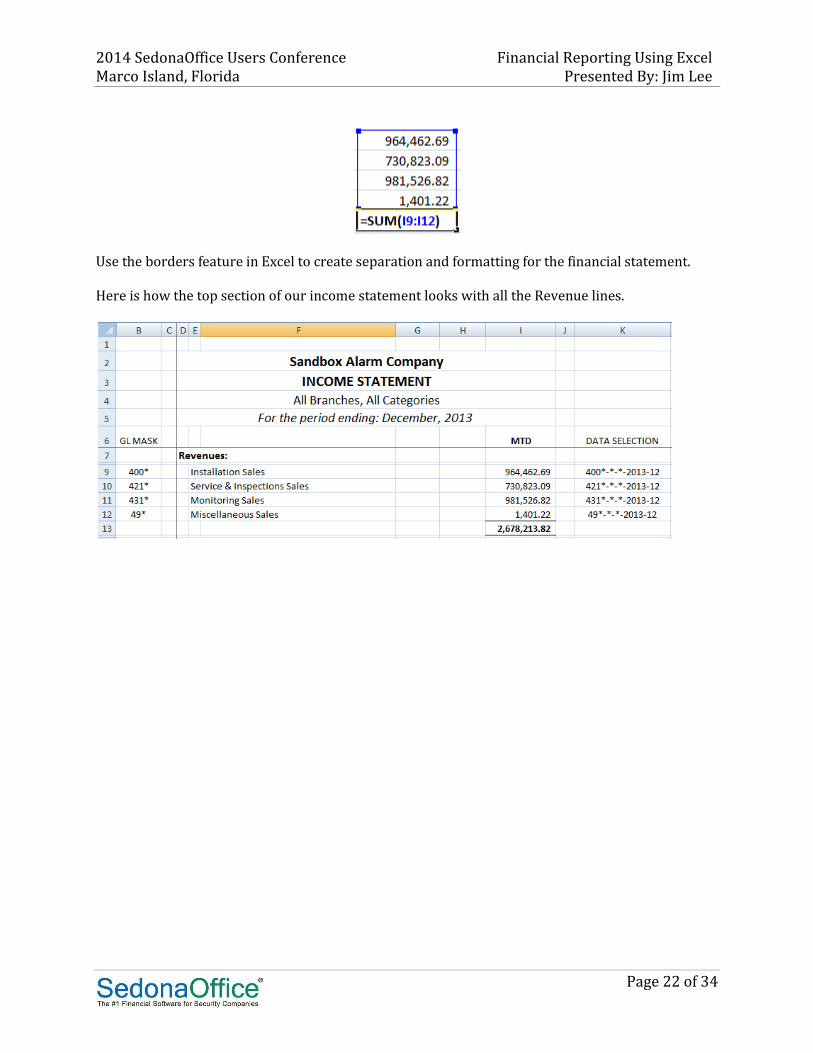
Summing Data and Format Use the SUM command to add all the revenue lines.
2014 SedonaOffice Users Conference Financial Reporting Using Excel Marco Island, Florida Presented By: Jim Lee
Page 22 of 34
Use the borders feature in Excel to create separation and formatting for the financial statement. Here is how the top section of our income statement looks with all the Revenue lines.

2014 SedonaOffice Users Conference Financial Reporting Using Excel Marco Island, Florida Presented By: Jim Lee
Page 23 of 34
Here’s the completed income statement.

2014 SedonaOffice Users Conference Financial Reporting Using Excel Marco Island, Florida Presented By: Jim Lee
Page 24 of 34
Setting the Print Area Set a Print Area in the Excel spreadsheet to not include the GL Mask and Data Selection and you end up with a very nice looking income statement.

2014 SedonaOffice Users Conference Financial Reporting Using Excel Marco Island, Florida Presented By: Jim Lee
Page 25 of 34
Adding a Year-to-Date column to the Income Statement In this example we have added a new column called YTD:
The SUMIF for YTD All we have to do is modify the SUMIF command to return the data from the YTD_Net column based on using the same Data Selection as used in the monthly financial statement.
2014 SedonaOffice Users Conference Financial Reporting Using Excel Marco Island, Florida Presented By: Jim Lee
Page 26 of 34
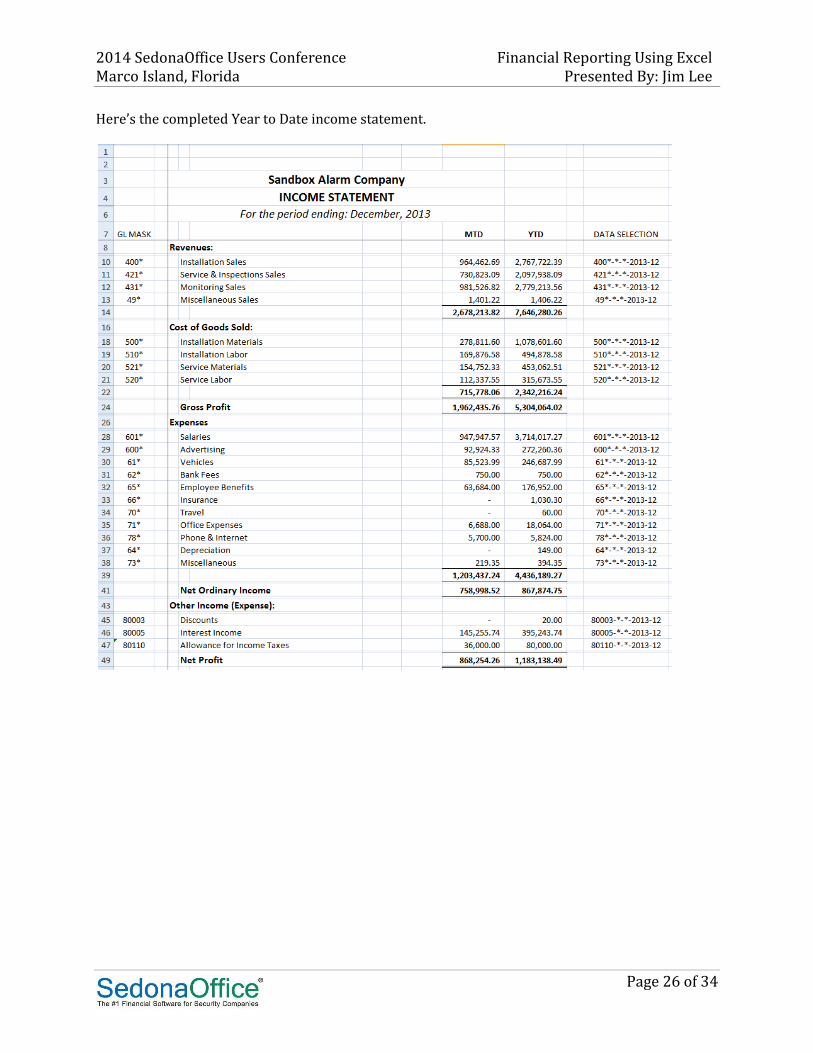
Here’s the completed Year to Date income statement.
2014 SedonaOffice Users Conference Financial Reporting Using Excel Marco Island, Florida Presented By: Jim Lee
Page 27 of 34
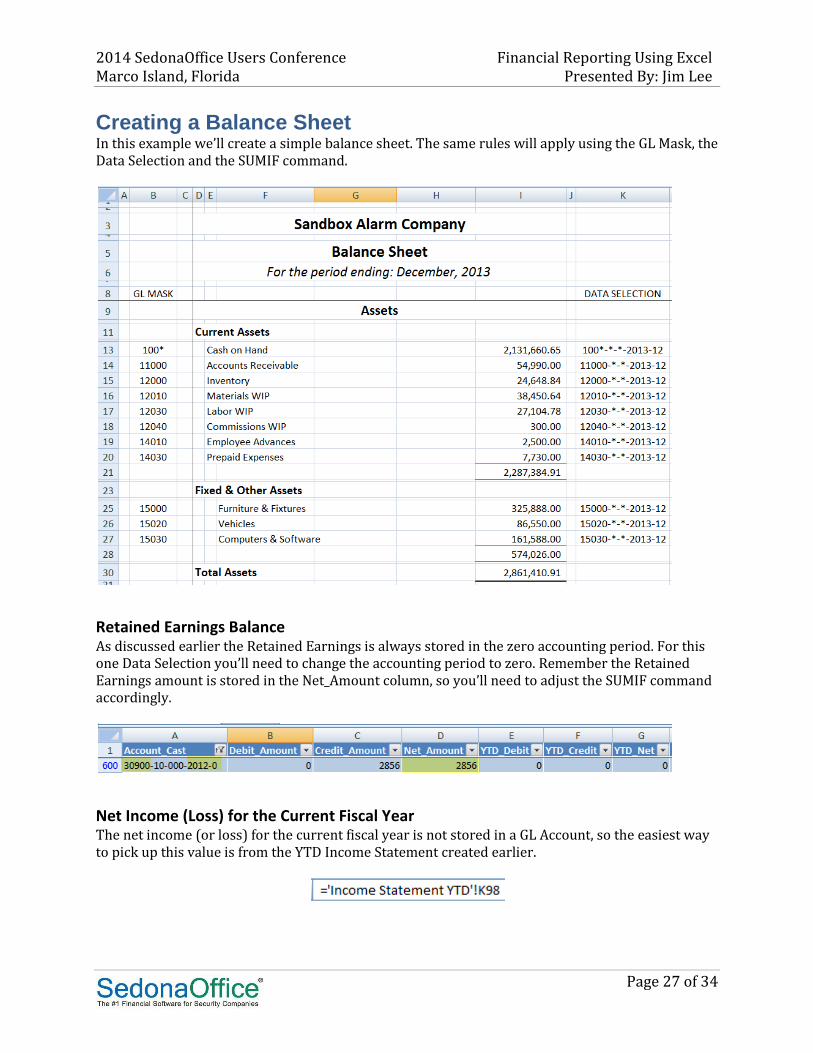
Creating a Balance Sheet In this example we’ll create a simple balance sheet. The same rules will apply using the GL Mask, the Data Selection and the SUMIF command.
Retained Earnings Balance As discussed earlier the Retained Earnings is always stored in the zero accounting period. For this one Data Selection you’ll need to change the accounting period to zero. Remember the Retained Earnings amount is stored in the Net_Amount column, so you’ll need to adjust the SUMIF command accordingly.
Net Income (Loss) for the Current Fiscal Year The net income (or loss) for the current fiscal year is not stored in a GL Account, so the easiest way to pick up this value is from the YTD Income Statement created earlier.

2014 SedonaOffice Users Conference Financial Reporting Using Excel Marco Island, Florida Presented By: Jim Lee
Page 28 of 34
The final Balance Sheet is shown below.

2014 SedonaOffice Users Conference Financial Reporting Using Excel Marco Island, Florida Presented By: Jim Lee
Page 29 of 34

2014 SedonaOffice Users Conference Financial Reporting Using Excel Marco Island, Florida Presented By: Jim Lee
Page 30 of 34
Creating a Budget When you create a budget you want to use the same format as your Income Statement layout. This is necessary as there should be a direct one-to-one relationship for each line of data on the income statement with a line on the budget.
In the Budget shown above there are some hidden columns which contain the rolling YTD totals by period. We’ll need these totals when we create Actual to Budget YTD financials.
2014 SedonaOffice Users Conference Financial Reporting Using Excel Marco Island, Florida Presented By: Jim Lee
Page 31 of 34
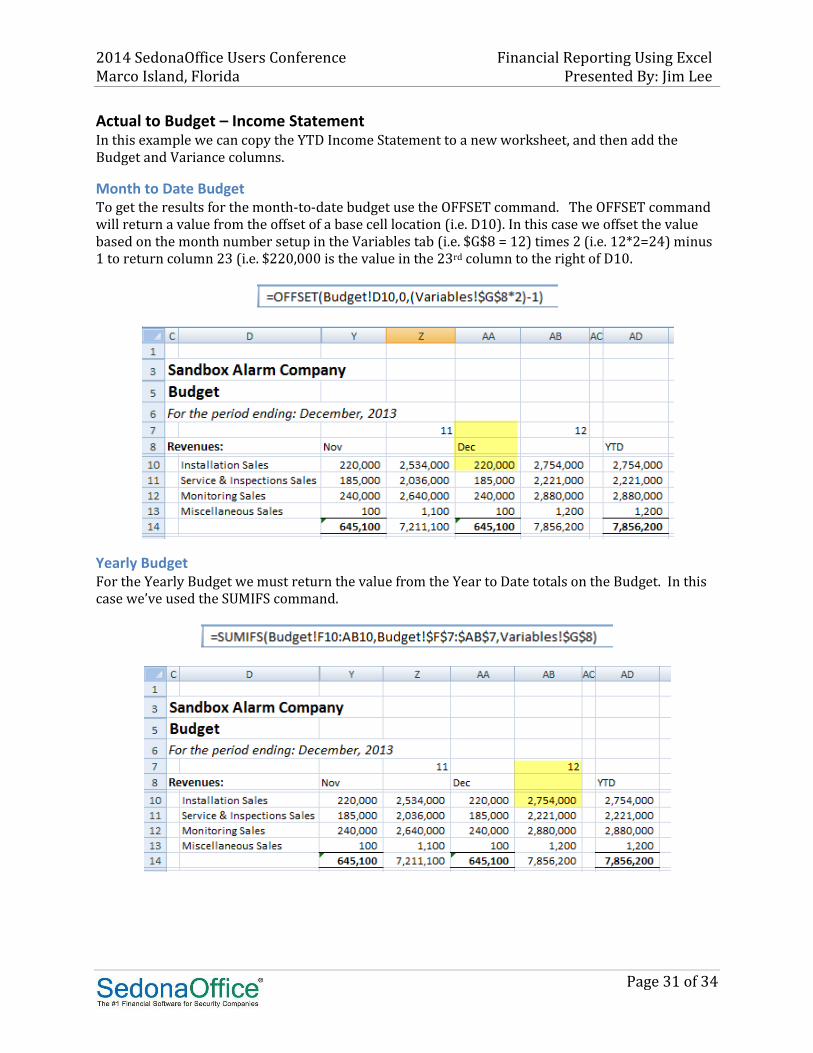
Actual to Budget – Income Statement In this example we can copy the YTD Income Statement to a new worksheet, and then add the Budget and Variance columns.
Month to Date Budget To get the results for the month-to-date budget use the OFFSET command. The OFFSET command will return a value from the offset of a base cell location (i.e. D10). In this case we offset the value based on the month number setup in the Variables tab (i.e. $G$8 = 12) times 2 (i.e. 12*2=24) minus 1 to return column 23 (i.e. $220,000 is the value in the 23rd column to the right of D10.
Yearly Budget For the Yearly Budget we must return the value from the Year to Date totals on the Budget. In this case we’ve used the SUMIFS command.

2014 SedonaOffice Users Conference Financial Reporting Using Excel Marco Island, Florida Presented By: Jim Lee
Page 32 of 34
2014 SedonaOffice Users Conference Financial Reporting Using Excel Marco Island, Florida Presented By: Jim Lee
Page 33 of 34
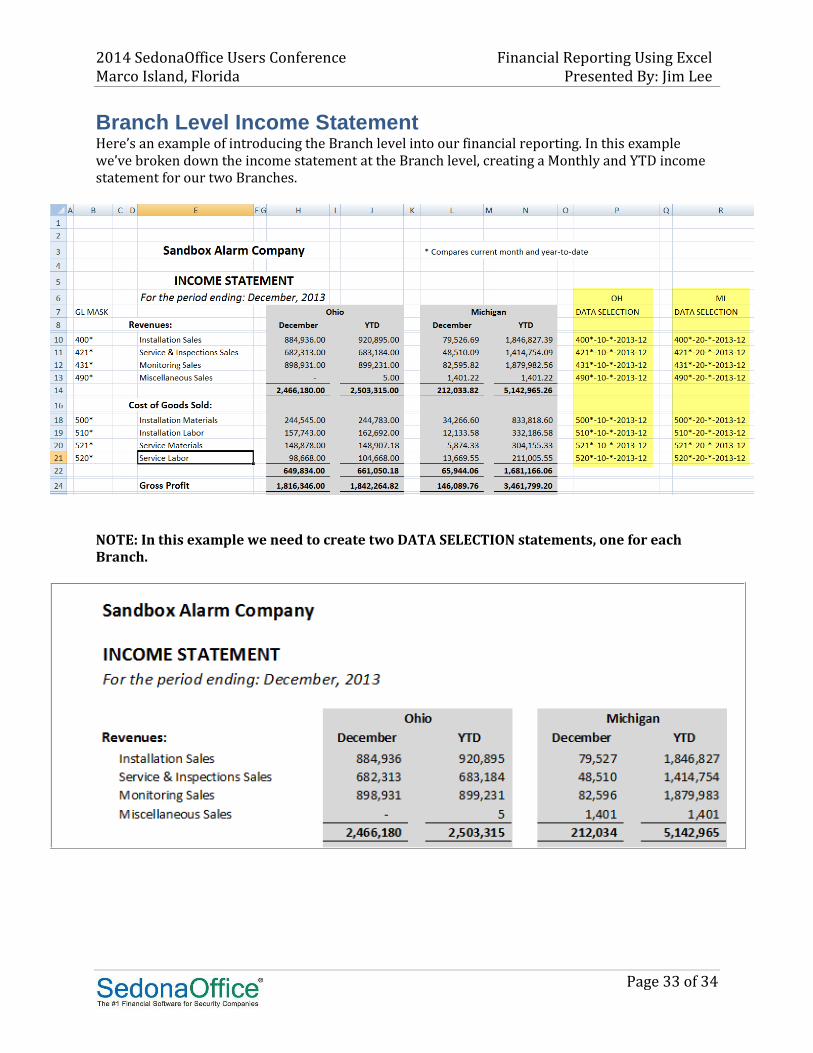
Branch Level Income Statement Here’s an example of introducing the Branch level into our financial reporting. In this example we’ve broken down the income statement at the Branch level, creating a Monthly and YTD income statement for our two Branches.
NOTE: In this example we need to create two DATA SELECTION statements, one for each Branch.

2014 SedonaOffice Users Conference Financial Reporting Using Excel Marco Island, Florida Presented By: Jim Lee
Page 34 of 34
Category Level Income Statement In this example we’ve created an Income Statement by Department (Category). In the Data Selection we added the Category to select the financial data.