financial results and analysis for the year ended march … · financial results and analysis for...
TRANSCRIPT

Financial Results and Analysis for the Year Ended March 31, 2013 on a Fund Accounting Basis
Presentation of Management Information To enhance accountability, budgetary control and stewardship of resources, the university maintains separate funds of assets, liabilities, revenues and expenditures for its many activities. Fund accounting is used by the university for its operating budget allocations and to ensure that restricted grants, donations and other contributions are spent only for the purposes intended. These funds are grouped as General Operating, Ancillary Enterprises, Specific Purposes, Sponsored Research, Capital and Endowment funds and are defined as follows:
• The General Operating Fund reports revenue and expense related to the general operations of the university. • The Ancillary Enterprises Fund reports revenue and expense related to service operations that are expected to function on a self-
supporting basis. These operations comprise the bookstore, food services, student residences, parking services, child care services, donated property rental, hotel and brew-pub operations, and the Vancouver Island Technology Park.
• The Specific Purposes Fund accounts for revenue and expense relating to contract services, special projects and endowment funds. • The Sponsored Research Fund accounts for monies designated for the support of research. • The Capital Fund accounts for monies designated for the acquisition of capital assets and major renovations. Where monies
designated for capital use are received as part of the resources for general operations, ancillary enterprises, specific purposes and sponsored research activities - generally for equipment, furnishings, computer equipment and library holdings - the revenue and expense related to those assets are accounted for in those respective funds.
• The Endowment assets, held as invested principal, comprise the accumulation of endowment contributions and the portion of investment income that is required by the donors and the Board to be added to the fund to offset the eroding effect of inflation.
The university conducts certain activities through related entities. These financial statements consolidate the accounts of four wholly owned subsidiaries of the university:
• UVic Industry Partnerships (formerly University of Victoria Innovation and Development Corporation) which facilitates research partnerships between the private sector and the university.
• University of Victoria Properties Investments Inc. which manages the university’s real estate holdings including the Vancouver Island Technology Park Trust.
• Ocean Networks Canada Society which manages the university’s VENUS and NEPTUNE ocean observatories. • Pacific Climate Impacts Consortium which stimulates collaboration to produce climate information for education, policy and decision
making.

Page 2
The financial statements consolidate the accounts of the University of Victoria Long Term Disability Trust (LTD Trust) which administers an employee benefit plan on behalf of the university’s faculty and administrative professional staff.
The financial statements consolidate the accounts of related not-for-profit organizations whose activities benefit the university:
• University of Victoria Foundation, the Foundation for the University of Victoria, and the U.S. Foundation for the University of Victoria which encourage financial support of the university and administer the university’s endowment funds.
The operations of University of Victoria Properties Investments Inc. are reported in Schedule B as Ancillary Enterprises, Ocean Networks Canada Society and the Pacific Climate Impacts Consortium are reported as Sponsored Research, while the operations of the other five entities are reported as Specific Purposes.
The financial statements proportionately consolidate the accounts of the following joint ventures:
• Tri-Universities Meson Facility (TRIUMF) which operates a research facility for sub-atomic physics located at the University of British Columbia. The financial statements include the university’s 9.09% interest.
• Western Canadian Universities Marine Sciences Society (WCUMSS) which operates a marine research facility at Bamfield on the west coast of Vancouver Island. The financial statements include the university’s 20% interest.
The financial statements include the accounts of the university’s two profit-oriented subsidiaries using the equity method of accounting:
• Heritage Realty Properties Ltd. which manages the property rental and downtown hotel and brew-pub operation donated by the late Michael C. Williams.
• Vancouver Island Technology Park Trust which provides leased space to technology companies on Vancouver Island.
All entities have a fiscal year end of March 31 with the exception of Heritage Realty Properties Ltd., which has a December 31 year end.
Balance Sheet – Statement 1 A key feature of fund accounting is that plant or capital assets are recorded on the balance sheet without amortization, unlike the accounting treatment within the external audited financial statements. Treatment within fund accounting is to record, at original cost, buildings, land and site development until disposal while equipment and furnishings are written off after 8 years.

Page 3
Key balance sheet highlights are as follows:
• Total assets increased by $60.2M while liabilities decreased by $1M. Fund balances increased by $27.4M and equity in plant assets grew by $33.7M.
• Endowment investments are recorded at fair value and have increased by $18.9M to $321.6M. The $18.9M increase is made up as follows:
Donations $3.4M Investment income 28.0M Disbursements (fees and awards) (13.4)M Changes in receivables/payables 0.9M $18.9M
• Capital assets increased by $32.3M with almost all of the increases in buildings by $29.2M and library holdings by $3.9M. The majority of the increase in buildings ($16.8M) was related to the ARIEL project at TRIUMF. Acquisitions of equipment and furnishings exceeded write offs by $2.1M.
• Long term debt decreased by $1.3M representing regularly scheduled debt payments with no additional debt added during the year. Additional debt of $10M was approved to support CARSA/Parkade Project several years ago and will be drawn in 2013/14.
• Funds held for employee future benefits, excluding any unfunded portion, increased by $1.3M to $18.6M and are made up as follows:
Vested sick leave benefits $3.5M Supplemental pension obligations 4.7M Group life insurance 1.4M LTD liability 9.0M $18.6M
• Endowment principal funds, held primarily in the UVic Foundation, increased by $7.9M due to external donations of $2.8M, UVic matching funds of $398K and capitalized investment income of $4.7M.
• Equity in plant assets increased by $33.7M due to capital additions of $61.4M plus debt repayment of $1.4M less $29.1M of equipment, furnishings and library holdings written off.
Statement of Appropriated Expendable Balances – Statement 2 For over 30 years, departments have been asked to save (i.e., to appropriate) from their annual operating budgets sufficient funds to replace computers and other equipment. Interest is paid on equipment reserve balances in order to encourage savings and during the year the interest allocated was 1.5%. Statement 2 summarizes these replacement appropriations. The university also has a carry forward policy whereby

Page 4
departments who do not spend all of their base General Operating Fund allocation in a year have it appropriated at the Faculty level for spending in future years. These two policies permit departments to plan for new projects, restructuring, and equipment needs over a longer timeframe. Should a department incur a deficit in a fiscal year, that deficit becomes a first charge on its operating budget for the following year. During the year, the Budget Office implemented a new system to categorize unspent carry forward balances according to how departments plan to use carry forward balances in the future. Schedule 2 has been revised from prior years to reflect this new reporting structure. Since the university’s provincial operating grant and tuition fees should not subsidize Ancillary operations, each ancillary enterprise must budget to break even, including a provision for periodic renovation replacement and expansion of its facilities. As such, there are appropriated funds from Ancillary operations in order to be able to invest in equipment replacement and capital improvements. Due to restrictions in the ability of the university to borrow externally, appropriated fund balances are used on a temporary basis to fund capital projects that will generate future revenues from which to repay the internal loan (e.g., residences).
Total appropriated expendable funds were as follows:
(in thousands of dollars) 2013 2012 General operating 127,316 120,500 Ancillary enterprises 15,006 15,136 Less loans for Capital (23,552) (23,086) Total 118,770 112,550
General Operating Fund appropriations increased by $6.8M during the year. The following charts show the distribution of these appropriated funds (reserves) within the major categories of: capital, equipment, carry forward1, library prepaid and insurance. It also shows how these reserves have changed over time.
1 This category includes program development and operation support, research support, student assistance and financial aid, employee obligations, training and support, other commitments, contingency and the externally funded Island Medical Program.

Page 5
As noted above, budget holders at year end were asked to categorize their intended use of carry forward funds. For the year ended March 31, 2013 the significant changes included increases in Program Development and Operation Support ($4M), Research Support ($3.8M), Employee Obligations, Training and Support ($3.7M) and Information Technology ($1.1M) and decreases in Equipment reserves ($3.2M) and Contingency ($1.6M). The following chart summarizes the intended use of the carry forward balances of $72.5M:

Page 6
The largest allocation or 22% is for employee obligations including accumulated professional development, leave and other contractual commitments. The next largest category is research support (20%) which is generally made up of commitments to individual faculty for research start-up, travel grants etc. Another category of note is the Island Medical Program. This represents 7% and is not available for reallocation as it is targeted external specific funding. The Ancillary appropriated fund balance of $15M is largely made up of parking reserves of which $9.9M is earmarked for capital (i.e., future parking structures). It is anticipated that a significant portion of this funding will be drawn down over the next couple of years as the new parkade is constructed.
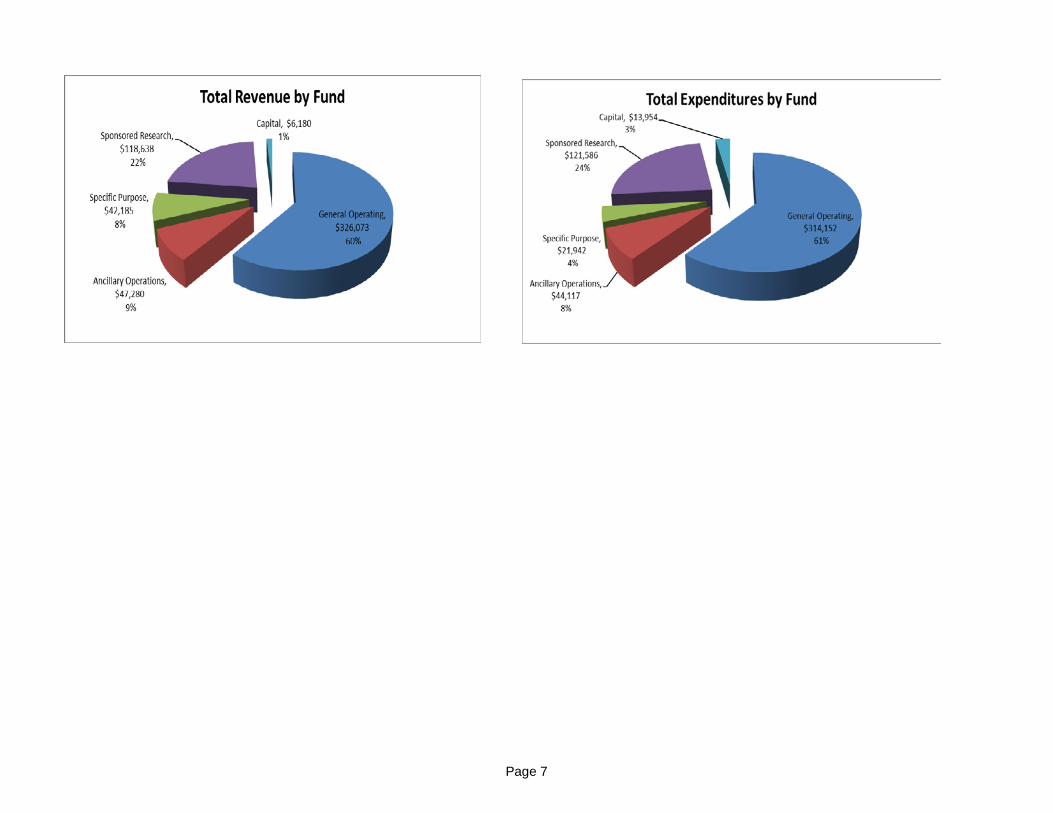
Unappropriated Expendable Funds – Statement 3 Total revenue across all five funds increased by $38M to $540M, representing an increase of 7.6% while total expenditures increased by $9.5M to $516M representing a 1.9% increase. On a total fund basis, total revenues of $540.4M exceeded expenditures of $515.8M by $24.6M. After transferring $5.1M to endowment principal and $6.2M to appropriated reserves, total unappropriated expendable fund balances increased by $13.3M. This increase is largely in the Specific Purpose fund related to the positive investment returns that increased the endowment expendable balances of the UVic Foundation. Each of the fund balances will be discussed subsequently in this report. Total revenue and expenditures are broken down by fund as follows:
Bookstore, 1,119
Food Services,
1,305
Residences, 1,955
Parking Services, 10,097
Heritage Realty, 530
Ancillary Reserves
Page 7

Page 8
General Operating Fund (GOF) – Schedule A The General Operating Fund represents 60% of the university’s activities. Total General Operating revenues and expenditures are made up as follows:
Total revenue in the General Operating Fund increased by $5.6M (1.8%) and total expenditures increased by $9.3M (3.1%). Government grants and tuition accounted for 85% of revenue while compensation costs (i.e. salary and benefits) accounted for 78% of total expenses.
While revenue exceeded expenditures by $11.9M, $5.1M was transferred to the other funds to cover the costs of commitments to a variety of capital and other projects and a net of $6.8M was transferred to appropriated reserves bringing the General Operating fund balance to zero, which is consistent with past practice. The net excess of revenue over of expenditures of $11.9M represents 2.2% of total revenue. The surplus results from circumstances that are difficult to predict (for example, vacancies and investment income) and planned surpluses to ensure that there are sufficient funds to invest in equipment, for example.

Page 9
The university’s provincial operating grant was $175.8M which remained unchanged from the previous year. Other government grants include $6.1M of federal government grants, the majority of which is the federal indirect cost of research grant and $5.8M of other government grants representing funding from the University of BC specifically for the Island Medical Program. Credit tuition increased by $4.2M reflecting the 2% increase in tuition fees (the maximum allowed by the Province of BC) and growth in international student enrolment where fees are higher than the domestic rate of tuition.
Investment income decreased by $1.1M due to lower returns on investments. The return on the university’s working capital was 2.2% compared to last year’s return of 3.2%. The working capital portfolio (recorded in both cash and long term investments) is professionally managed in three pools providing daily liquidity along with enhanced returns from investments with a longer duration. The investments are as shown in the working capital chart.
15,839 16,475 16,867 17,012 16,929
2,593 2,858 3,046 3,187 3,272
15,000
15,500
16,000
16,500
17,000
17,500
18,000
0
5,000
10,000
15,000
20,000
25,000Undergraduate Headcount Graduate Headcount
Short Term Investment
57%
PH&N Short Term Bond & Mortgage
Fund 24%
PH&N Universe
Bond Fund 19%
Working Capital - March 31, 2013 Total - $190.4 million

Page 10
Salaries for academic increased by only $0.7M as an agreement was not reached with the faculty prior to the year end and accordingly the amount of future negotiated salary increases is not included. Support staff salaries increased by $2.2M as a result of 2012/13 salary increases arising from the settlement of collective agreements and progression through the ranks, and severance settlements resulting from restructuring and other budget reductions. Equipment additions, net of write offs, increased by $2.6M reflecting the purchase of $1.5M of information technology infrastructure and $400K of equipment in Facilities Management. Departments were encouraged to purchase equipment prior to the re-introduction of PST if possible in order to take advantage of higher rebates on the HST.
Ancillary Enterprises Fund – Schedule B An ancillary operation is a department that is required to be financially self-sufficient. That is, each operation must generate sufficient revenue to not only cover its annual operating costs, including any compensation changes, but also provide adequate funding to address building maintenance or renovation requirements as well as capital expansion needs. Schedule B (page 5) of the attached fund accounting schedules show the financial results of university ancillary operations both on and off campus. Off-campus Business Enterprises include the operations of the Broad Street commercial/residential rental properties owned by the university and the property rental and hotel operations owned by Heritage Realty Properties Ltd., both accounted for using the equity method of accounting. The hotel operations and rental properties, received as part of the Michael C. Williams’ estate, provide a large and sustainable cash flow to the university. During the year $1M in cash was provided by Heritage Realty to the university. Off-campus Business Enterprises also include the Vancouver Island Technology Park Trust, accounted for using the equity method of accounting, and the operations of the University of Victoria Properties Investments Inc. The University of Victoria Properties Investments Inc. acts as trustee for the Trust and also manages the Marine Technology Centre owned by the university. The Vancouver Island Technology Park provides a range of commercial space for external high-tech companies and some UVic research and teaching activities. The Trust is intended to be self-funding with a return on investment provided to the university. During the year $560K was provided by VITP Trust which allowed for a transfer of $400K to the General Operating Fund. The results of the on campus ancillary operations including the bookstore, housing food and conference services, parking and child care are summarized in the Ancillary Budget – Schedules J through M (starting on page 14) below.
Specific Purposes Fund – Schedule C The Specific Purposes Fund includes the expendable funds of the University of Victoria Foundation, the Foundation for the University of Victoria and the U.S. Foundation for the University of Victoria. It also includes the revenues and expenses of the LTD Trust as well as UVic Industry Partnerships.

Page 11
Overall, revenue exceeded expenditures by $20.2M and $9.3M of this was transferred, the majority of which went to endowment principal to protect against the eroding effects of inflation, and Sponsored Research to provide funding to certain research centers who receive their funding from endowments. The Specific Purpose fund balance increased by $10.9M to $31.8M which includes $18.3M related to the expendable fund of the UVic Foundation. Other highlights include:
• Provincial government grants increased by $1.8M including a $1.2M grant from the Vancouver Island Health Authority for health education.
• Investment income increased by $18.3M, the majority relating to the UVic Foundation.
Most endowment funds benefiting the university and its students are held by the University of Victoria Foundation. The Foundation’s investments experienced a fourth straight year of positive returns with investment income of $28M representing a 9% return for the year ended March 31. With the receipt of $3.2M of endowment contributions less disbursements of $13.4M, the total market value of the UVic Foundation endowment fund increased from $301.6M to $319.3M, comprised of $301.1M of principal and $18.3M of expendable funds.
The Foundation’s investments are managed by professional investment counsel with separate managers for Canadian equity and Canadian fixed income mandates, global equity mandates split evenly between two managers, a real estate manager and an infrastructure manager. The
0
2
4
6
8
10
12
0
100
200
300
400
500
600
700
03/04 04/05 05/06 06/07 07/08 08/09 09/10 10/11 11/12 12/13
University of Victoria Foundation Endowments (in millions)
Total Endowment ( Principal + Expendable) Annual Distribution

Page 12
Foundation’s investment policy provides for a target asset mix of 25% fixed income, 25% Canadian equities, 30% global equities, 10% real estate and 10% infrastructure. External investment consultants assist the Foundation’s Board in monitoring performance and considering an appropriate asset mix. The Foundation’s endowment management policy follows a “total-return” approach with awards based on 4.0% of the December 31 inflation adjusted balance of the funds principal with an additional 0.5% available for funds in excess of 108% of inflation adjusted principal. In most years, an amount is capitalized to the principal of each endowment to protect against the eroding effects of inflation and during the year $4.5 million was added to principal.
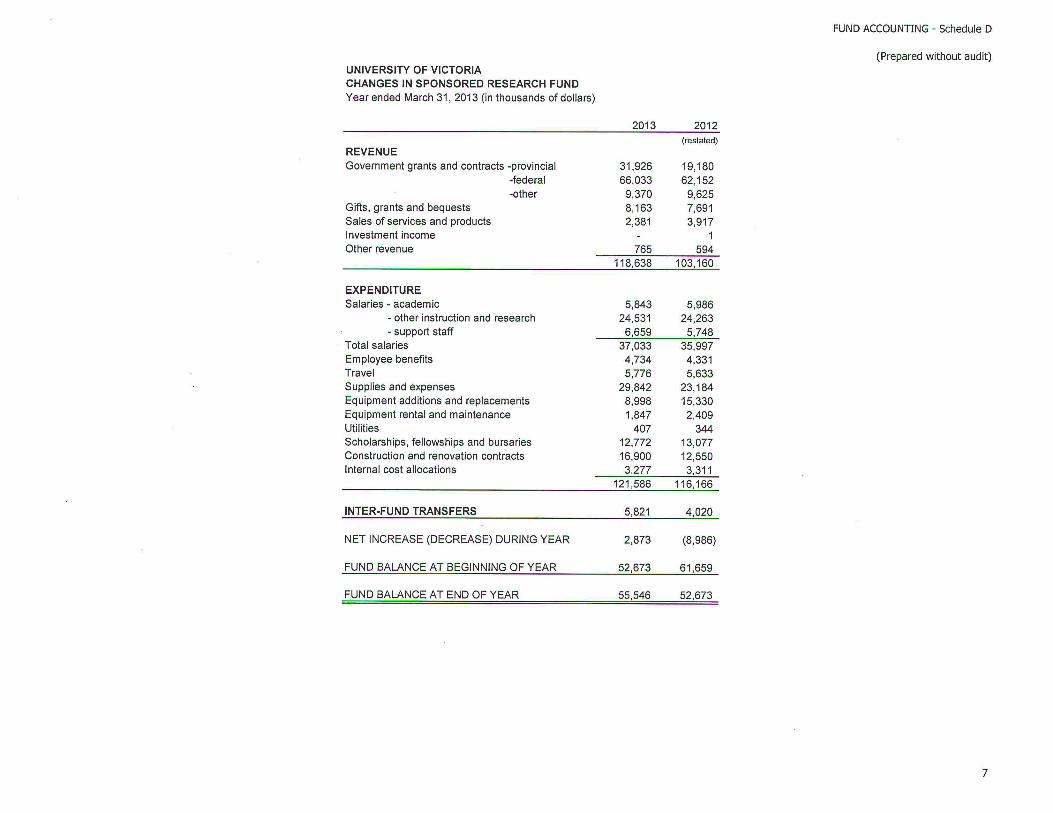
Sponsored Research Fund – Schedule D The Sponsored Research fund includes the revenues and expenses of the related entities including Oceans Networks Canada, Pacific Climate Impacts Consortium, TRIUMF and WCUMSS. Sponsored Research revenues for the year were exceeded by expenditures by $2.9M and a net amount of $5.8M was transferred from other funds thereby increasing the fund balance by $2.9M to $55.5M. This balance represents external grant funding that has been received but not yet spent. Revenues increased by $15.5M (15%) to $118.6M while expenditures increased by $5.4M (4.7%). Research revenues of $118.6M were the highest in the university’s history reflecting the high level of success of the university’s faculty in attracting research grants and contracts. The university ranks third amongst Canadian comprehensive research intensive universities in total research funding, second in NSERC/CIHR grants and third in SSHRC grants. Over the past ten years, sponsored research revenue has grown by a remarkable 248% from $47.8M in 2003/04 to $118.6M in 2012/13.

Page 13
Highlights in the Sponsored Research Fund include:
• Provincial grants increased by $12.7M including $8M for Neptune, $2M for Canassist and $2M for health research • Federal Grants increased by $3.9M largely from CFI • Supplies increased by $6.7M due to Neptune expenses in the current year • Equipment decreased by $6.3M due to Neptune expenses in the previous year • Construction contracts increased by $4.4M due to construction of the ARIEL project at TRIUMF
Operating Budget Schedules E through I Each year the budget office prepares operating fund budget schedules in order to provide management and the Board of Governors with information to assess the financial performance of the operations of the institution for the fiscal year. These schedules differ from the fund accounting statements (Statements 1 to 3 and Schedule A through D) in that they compare actual results, both revenue and expense, for the fiscal year against the budget plan whereas the fund accounting statements provide a comparison of actual results with those of the previous year. These budget schedules provide useful information to determine whether changes to budget or changes in activity should be made for the current or future fiscal years.
$0
$10
$20
$30
$40
$50
$60
$70
$80
$90
$100
$110
$120
$130
2003-2004 2004-2005 2005-2006 2006-2007 2007-2008 2008-2009 2009-2010 2010-2011 2011-2012 2012-2013
Millions External Research Funding
NSERC SSHRC CIHR CFI CRC BCKDF Contracts and Other

Page 14
Another difference between the budget schedules and the fund accounting statements is that they are prepared on a function basis, as compared to an object basis (i.e., type of expense), which better reflects university budgetary responsibility, accountability and control. The detailed budget versus actual schedules for the year ended March 31, 2013 include schedules E through I and can be found at pages 8 to 13. These schedules compare actual operating results for fiscal 2012-13 with the total budget for the year. The total budget column includes not only the base budget for each functional area or revenue item but also any non-recurring/one time entries for that year. These entries include one-time items such as a drawdown of carry forward or equipment reserves, budget reallocations between different functional areas or an allocation from a central budget (e.g., enrolment management funds) to a department. The following points should be kept in mind when reviewing these schedules:
• unfavourable variances from the budget (i.e., either revenues or cost recoveries are less than budget; or expenditures are greater than budget) are shown with brackets;
• benefits are budgeted and accounted for centrally and therefore costs within each function do not include benefits whereas the external PSAS statement have benefits allocated to functions;
• the revenue amounts per schedule E will not align with the revenue on Statement 3 or Schedule A of the fund accounting statements as statement E shows department revenue separately. Department revenue will include revenue from sources such as provincial and federal grants, student fees etc.; and
• variations from budget are sometimes offset by variations in related revenues or expenditures. For example, an apparent shortfall in revenues may be offset by reduced expenditures or alternatively, an expenditure in excess of budget may be compensated for by increased revenues or cost recoveries (see schedule I for a summary).
Operating Budget – Schedule E Revenue and Expenditure Overview Total budgeted revenue in 2012/13 was $315M comprised of the following sources:

Page 15
The majority of this funding is allocated to support academic purposes as follows:

Page 16
Year End Results As noted above, for the fiscal year ended March 31, 2013 there was an excess of operating revenue over expenditures of $11.9M. This excess is a result of a number of items as follows:
• Positive results as compared to budget including: o increased or unanticipated revenue; o favourable expenditures variances.
• Planned reserves for future major capital purposes; • Planned sources of non-recurring funding; • Planned reserves for equipment replacement purposes; and • Costs related to capital and entities that are funded by operating but are presented as interfund transfers (below the line) whereas they
are budgeted as expenditures ($5.1M for 2012/13 as noted above).
From a budget point of view there was a positive result of $20.8M. This positive position is the result of $11.2M in additional revenue compared to budget and a $9.6M positive variance on expenditures. From a budget responsibility point of view this positive variance is derived almost equally between central versus department budgets as follows:
Central revenue (tuition, investment income,
internal financing and other) $ 4.3M
Central expenditures and recoveries (benefits, overhead and
centrally allocated budgets) $ 5.8M
Positive variance from central accounts $10.1M
Positive variance from departmental accounts $10.7M
Total $20.8M
Central Revenue Accounts The primary sources of general operating revenue are tuition, government grant and investment income. In 2012/13 the additional revenue, as compared to budget, of $4.3M or 1.5% of the revenue budget resulted from:

Page 17
1. Tuition revenue ..................................................................................... $ 1.8M
This result is close to the $2.0M in additional revenue projected in the quarterly reports to the Board. This difference represents about 1.8% of the tuition budget or ~ 350 domestic standard fee paying students.
2. Investment income ($2.9M - $1.1M) ....................................................... $1.8M The investment income budget is developed on a conservative basis to protect against market and cash balance fluctuations. When investment income exceeds budget, this provides an annual source of non-recurring funds. This approach provides the university with flexibility to address annual non-recurring priorities as well as a source to offset other potentially negative central budgets (e.g., tuition shortfalls in prior years). As per the university policy to ensure multi-year financial planning for equipment replacement, $0.3M of the above investment income was allocated to department equipment reserves and $.2M to ancillary reserves. The schedule shows a budget variance of $2.9M for investment income. This amount however is offset by negative variance of $1.1M from internal loans which is shown under administrative and general in schedule H (page 11) as it is an internal allocation. 3. Other income ......................................................................................... $0.7M
This variance is an accumulation of small amounts from various accounts
Impact on Future Budgets from Revenue Variances
For 2013/14 the tuition revenue budget has been increased by $2.1M to reflect increased enrolment particularly at the international level. When developing the 2014/15 budget in the fall, enrolment levels will be reviewed to determine whether further adjustments should be made. The university previously had an enrolment contingency budget of $1.1M. This budget is not currently required and has been eliminated as part of the budget balancing exercise. Enrolment levels will need to continue to be monitored given this contingency is no longer available.
The investment income budget is intentionally conservative to protect against market and cash fluctuations and to provide for a source of non-recurring funds. While this is still considered a prudent approach the budget was increased by $750,000 in 2013/14 to reflect increased income from internal loans. A further increase at this time would not be appropriate as cash reserves in 2013/14 and 2014/15 will be significantly depleted with the construction of the Centre for Athletics, Recreation and Special Abilities (CARSA). The current estimate is a draw on cash of $20M and $35M in 2013/14 and 2014/15 respectively, although some of the impact on investment income will be offset by interest charged on internal loans that will be repaid from future incremental revenue related to the facility. Cash and short term investments have grown in the last few years as the university appropriated funds for the construction. This reduction in cash will impact overall investment income levels by ~$400,000 in 2013/14 and potentially $1.1M in 2014/15. The allocation between internal and external sources however needs to be reviewed in 2013/14.

Page 18
Other central revenue budgets will not be adjusted as the variances are considered insignificant. Central Expenditures and Recoveries Central budget accounts include compensation (benefits, salary, turnover etc.), scholar’s fund, overhead recoveries as well as contingency funds. In 2012/13 the positive central variance of $5.8M resulted from:
1. Benefits……………………………………………………………………. ....... $1.5M The benefit accounts continued to have a positive result this fiscal year. This result is largely due to on-going vacant positions (~$1.4M) and budgeting for annual increases even though actual increases are only a portion of the year (benefits on salary increase, increase in Employment Insurance, etc.). 2. Overhead recoveries ................................................................................. $0.1M This variance is the result of additional overhead research income. Overhead recoveries fluctuate from year to year and are difficult to estimate given they are derived from contract research grants. 3. Centrally Allocated Budgets ....................................................................... $4.2M As noted above, centrally allocated budgets include budgets to fund compensation increases. During 2012/13 the university was bargaining with all its unions and associations. Agreements were reached with all groups except the Faculty Association. As a result, part of the above $4.2M is the amount the university budgeted in 2012/13 for faculty and librarian contractual increases that were not expended as agreement was not reached. The remainder includes funds to top-up vacant positions once filled and a contingency amount to cover unforeseen events.
Impact on Future Budgets from Expenditure Variances
The favorable variance in the benefits budget is largely a result of vacant positions. In developing the 2013/14 budget, an estimate was made of the number of positions that would be eliminated as a result of budget reductions and both the benefits budget and the compensation budget have been adjusted accordingly. Given these adjustments no further changes to this budget are recommended at this time. The benefits budget will continue to have a favourable balance as long as there continues to be vacant positions.
The overhead variance is not considered significant but will be reviewed for 2014/15 based on information from research on projected contract revenue.

Page 19
Centrally allocated budgets are either required to fund salary increases once there is a settlement with the Faculty Association or are considered prudent to provide funds for unforeseen events or strategic one time allocations. The total variance, with the unpaid compensation, represents 1.3% of actual expenditures for the year. Departmental Accounts As noted above, departments had a year-end positive budget variance of $10.7M. Departments are expected, for the most part, to have favourable year end balances as they are required to put aside funds to address future equipment replacement and capital needs. In 2012/13 departments planned to allocate $3.5M to reserves for this purpose with actual transfers totaling $4M for equipment and $1.1M for capital.
The largest source of positive variance is department revenue which was $5.8M larger than budgeted. Departmental revenue is comprised of external funding (i.e., gifts, grants, sales, non-credit tuition, application and athletic fees, etc.), and as such is not consistent year to year, making it difficult for departments to predict or rely on for on-going expenditures. Given this fact, most departments budget this revenue conservatively. Some examples of revenue received in 2012/13 include donations (software donation of $1.1M gift in kind to Engineering); executive education fees in Business; recoveries for marine science vessel usage; external cost recoveries (i.e., Vancouver Island Cancer Centre); one-time government program grants; field school fees; Fine Arts shows (i.e., women’s choir, theatre); and athletic club fees .For some departments the positive revenue result is offset by increased expenditures (Schedule I). The remaining variance is from a combination of vacant positions or partial year hires, favourable supply account variances or drawdowns from reserves or carry forward in excess of actual costs.
At the individual faculty and department level, all were on or under budget when available carry forward is taken into account. Some units within a faculty or department however were over budget by small amounts. These deficits will be a first charge against the unit’s budget in 2013/14 or have been offset by carryover or alternatively have been covered at the faculty level.
Operating Budget – Schedule F This schedule provides a breakdown of departmental revenue by functional area. Some highlights include:
• The department with the largest budgeted departmental revenue is continuing studies at $13.2M. Continuing studies is a partially self-funding area and as such tuition for their programs is allocated to them directly.
• Student services departmental revenue is mainly comprised of student athletic and recreation fees, application fees and external funding for Health Services.

Page 20
Operating Budget – Schedules G through I Schedules G and H summarizes total budget, actual results and a comparison to the prior year of expenditure budgets by function. These schedules provide information on relative sizes of faculties and departments with the largest ones being the tri-faculties - Science at $22.3M, Social Sciences at $20.2M and Humanities at $18.9M. The other academic budget of $21M is comprised of many smaller functions such as Academic Advising, Learning and Teaching Centre, faculty professional development, faculty research - internal grants and travel, Research services and centres, overhead research, and academic related information technology. While there was an across the board budget reduction of 1.5% in 2012/13 most areas saw expenditures increase year over year. This is largely a result of compensation increases. Increases in nonacademic areas are slightly higher as they are mainly comprised of PEA and CUPE staff who received progress through ranges and cost of living increases. As well given budget reduction requirements many administrative areas had to lay off staff which resulted in one time severance costs. An agreement has not yet been reached with faculty and therefore increases only reflect progression through the ranks.
Schedule I as noted previously compares additional departmental revenue against expenditures to demonstrate that additional revenue is often offset by additional expenditures. (e.g., Engineering large variance in department revenue of $1.3M is offset by expenditure variance of $1.0M).
Ancillary Budget – Schedules J through M Schedule B (page 5) of the attached fund accounting schedules show the financial results of university ancillary operations both on and off campus. The results of the off campus businesses were noted above. This section will focus on the results of the on campus ancillary operations as well as provide information on key performance indicators (KPI). While these operations are often viewed as on campus “businesses,” it is important to know that while they are required to be financially self-sufficient, they also contribute to student life on campus and are therefore service areas. The result of this approach is that each area may make program decisions that are not financially driven but program driven. For example, parking services subsidizes employee and student bus passes in an effort to reduce traffic to campus, residence services runs student life programs and food services extends hours to support academic purposes. Given the above it is difficult to compare these operations to what appears to be similar off campus businesses. Bookstore – Schedule J Schedule J (page 14) attached shows the financial results of the bookstore operations, which include the computer store, compared to budget as well as the results of the prior year. Both revenue and expenses for fiscal 2013 are less than the prior year as well as below budget. This is mainly a result of a decline in book and computers sales and has led to a restructuring of the bookstore to ensure future profitability. Reduced revenue was anticipated early in the year and therefore expenses were adjusted to ensure the overall financial plan remained on track. While traditional course materials are expected to continue to decline as the shift to digital occurs, the renovations completed in 2012 will support and

Page 21
showcase higher margin merchandise. To cover the costs of the expansion, reserve funding of $1.7M was drawn down in 2012/13. This compares to $2.5M in the previous year. The following KPIs provide useful information against which to assess the operations of the Bookstore:
The above charts show that both gross margin as a percentage of sales as well as turnover are trending positively over the last few years. The turnover rate of 7.8 times a year is strong compared to peer results which range from 2.8 to 8.4 and average 5.4. The decrease in gross margin in 2010/11 was a result of consolidating the computer store into the bookstore as the computer store gross margin is typically 10 to 11%. As compared to other similar sized institutional bookstores, our labour costs tend to be higher given contractual agreements. The gross margin percentage however is consistent with our peers as outlined in the following charts:

Page 22
A goal moving forward is to improve the labour cost percentage. The average of the peer group is 14.1%. The above comparison data is from the National Association of College Stores – Large Stores Group and has been shared on a confidential basis, therefore the names have not been included. Housing, Food and Conference Services – Schedule K In 2012/13 the budget submitted to the Board was a consolidated budget for Housing, Food and Conference Services, as at the time it was developed the departments were managed as a unit. Since then the unit has been reorganized into Residence Services and University Food Services (UFS). For consistency with the approved plan the information provided in schedule K (page 15) is for the consolidated unit. In future years these areas will be presented separately. A financial review of University Food Services was undertaken during the year which resulted in a correction of revenue. This one time correction resulted in a decline in revenue of $770K in the current year compared to prior years as well as a shortfall in revenue compared to budget. Even with the decline in revenue, overall the combined units had a small positive variance (revenue over expenses) of $50,000 due in part to an overall reduction in expenses. At year end the consolidated budget for Housing Food and Conference Services made a contribution of $1.0M to the capital reserve.

Page 23
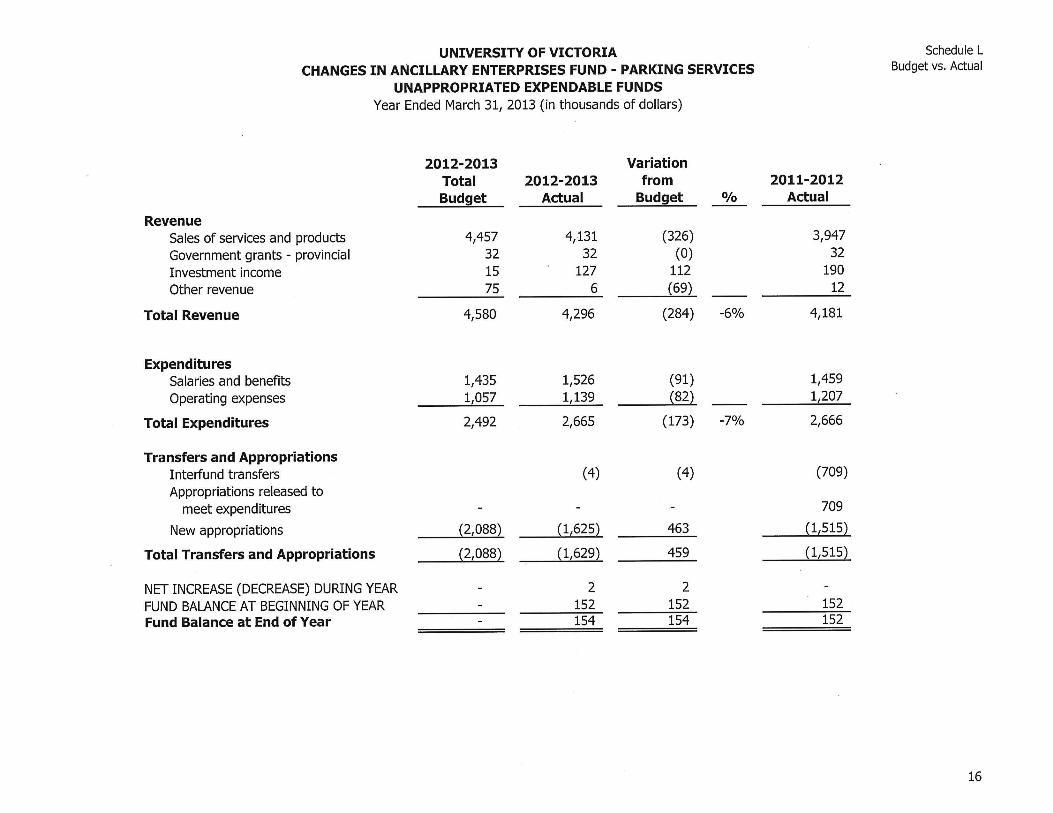
As a result of the financial review, both Residence Services and UFS are changing their financial policies and practices. As part of this review they will also be developing key performance indicators that will be monitored and reported to the Board. These indicators will look at both internal trends as well as how our results compare to other institutions. Parking Services – Schedule L The parking services budget includes revenue and expenses associated with the management of parking on campus as well as the university’s travel options programs which includes among other things the student and staff bus pass programs. Schedule L (page 16) attached shows that while revenue increased 2.7% year over year it was slightly short of budget, due mainly to a decrease in permit sales. Expenses were flat year over year. From a budget perspective, compensation costs were higher than budget as a result of retroactive payments related to job evaluation and retirement costs. Operating expenses were also over budget as a result of higher equipment maintenance and vehicle search costs than budget which both fluctuate annually. At year end, $1.6M was allocated to the capital reserve. This funding will be used to construct the new parkade associated with the CARSA project. The following charts outline some of the KPIs that parking services monitor:
While normally a goal for parking operations would be to grow permit sales, the university is committed to minimizing vehicle traffic to campus. These charts demonstrate the success the university has had in encouraging faculty, staff and students to utilize alternative modes of transportation as they show a steady decline in permits over time, whereas bus passes have increased or remained constant.

Page 24
Employee and student parking rates are either less than or comparable to peers institutions as follows:
Another source of revenue for parking services is fines. While this is a source of revenue, the objective of issuing citations (fines) is to ensure the safety (e.g., parking in fire lanes) and access (parking without paying) of patrons. While the department issues over 19,000 fines in a year, very few are appealed as follows:
Page 25
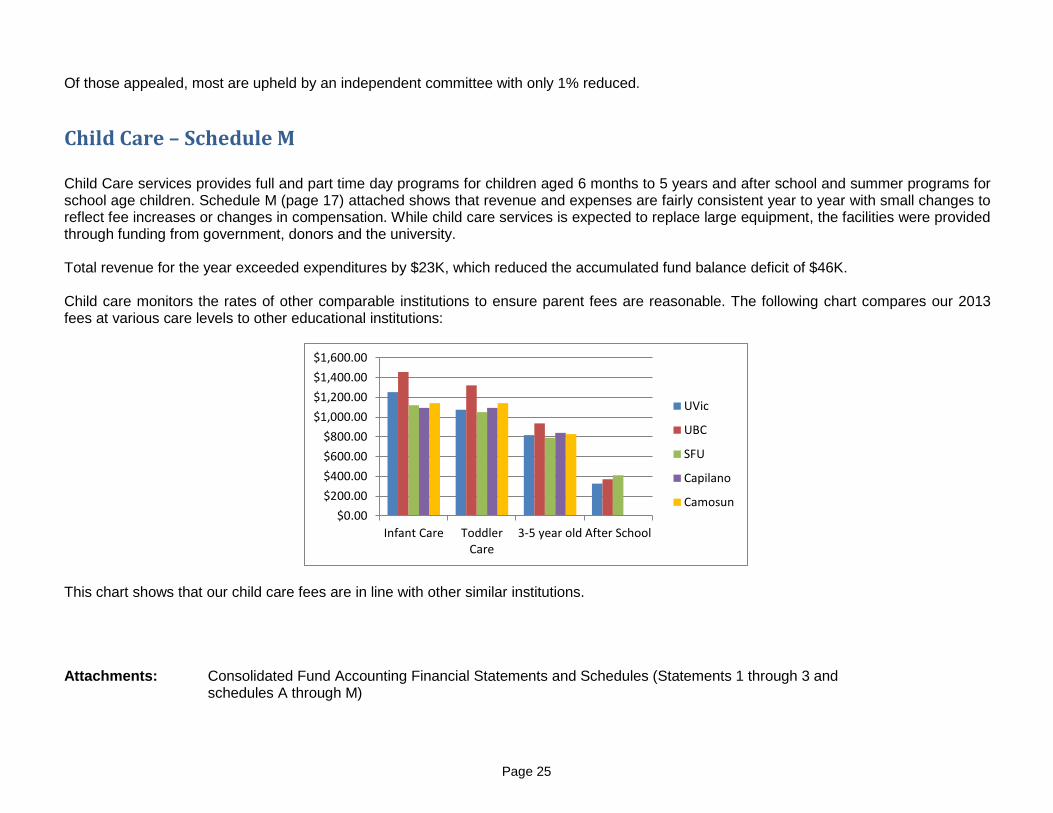
Of those appealed, most are upheld by an independent committee with only 1% reduced. Child Care – Schedule M Child Care services provides full and part time day programs for children aged 6 months to 5 years and after school and summer programs for school age children. Schedule M (page 17) attached shows that revenue and expenses are fairly consistent year to year with small changes to reflect fee increases or changes in compensation. While child care services is expected to replace large equipment, the facilities were provided through funding from government, donors and the university. Total revenue for the year exceeded expenditures by $23K, which reduced the accumulated fund balance deficit of $46K. Child care monitors the rates of other comparable institutions to ensure parent fees are reasonable. The following chart compares our 2013 fees at various care levels to other educational institutions:
This chart shows that our child care fees are in line with other similar institutions. Attachments: Consolidated Fund Accounting Financial Statements and Schedules (Statements 1 through 3 and
schedules A through M)
$0.00$200.00$400.00$600.00$800.00
$1,000.00$1,200.00$1,400.00$1,600.00
Infant Care ToddlerCare
3-5 year old After School
UVic
UBC
SFU
Capilano
Camosun