financial results consolidated financial statements · pdf fileaddition to auditing the...
TRANSCRIPT

TD BANK GROUP ANNUAL REPORT 2015 F INANCIAL RESULTS112
The Bank’s Chief Auditor, who has full and free access to the Audit Committee, conducts an extensive program of audits. This program supports the system of internal control and is carried out by a profes-sional staff of auditors.
The Office of the Superintendent of Financial Institutions Canada, makes such examination and enquiry into the affairs of the Bank as deemed necessary to ensure that the provisions of the Bank Act, having reference to the safety of the depositors, are being duly observed and that the Bank is in sound financial condition.
Ernst & Young LLP, the independent auditors appointed by the shareholders of the Bank, have audited the effectiveness of the Bank’s internal control over financial reporting as at October 31, 2015, in addition to auditing the Bank’s Consolidated Financial Statements as of the same date. Their reports, which expressed an unqualified opinion, can be found on the following pages of the Consolidated Financial Statements. Ernst & Young LLP have full and free access to, and meet periodically with, the Audit Committee to discuss their audit and matters arising there from, such as, comments they may have on the fairness of financial reporting and the adequacy of internal controls.
Bharat B. Masrani Colleen M. JohnstonGroup President and Chief Financial OfficerChief Executive Officer Toronto, Canada December 2, 2015
FINANCIAL RESULTS
Consolidated Financial Statements
MANAGEMENT’S RESPONSIBILITY FOR FINANCIAL INFORMATIONThe management of The Toronto-Dominion Bank and its subsidiaries (the “Bank”) is responsible for the integrity, consistency, objectivity and reliability of the Consolidated Financial Statements of the Bank and related financial information as presented. International Financial Reporting Standards as issued by the International Accounting Standards Board, as well as the requirements of the Bank Act (Canada) and related regulations have been applied and management has exercised its judgment and made best estimates where appropriate.
The Bank’s accounting system and related internal controls are designed, and supporting procedures maintained, to provide reason-able assurance that financial records are complete and accurate and that assets are safeguarded against loss from unauthorized use or disposition. These supporting procedures include the careful selection and training of qualified staff, the establishment of organizational structures providing a well-defined division of responsibilities and accountability for performance, and the communication of policies and guidelines of business conduct throughout the Bank.
Management has assessed the effectiveness of the Bank’s internal control over financial reporting as at October 31, 2015, using the framework found in Internal Control – Integrated Framework issued by the Committee of Sponsoring Organizations of the Treadway Commission 2013 Framework. Based upon this assessment, manage-ment has concluded that as at October 31, 2015, the Bank’s internal control over financial reporting is effective.
The Bank’s Board of Directors, acting through the Audit Committee which is composed entirely of independent directors, oversees manage-ment’s responsibilities for financial reporting. The Audit Committee reviews the Consolidated Financial Statements and recommends them to the Board for approval. Other responsibilities of the Audit Committee include monitoring the Bank’s system of internal control over the finan-cial reporting process and making recommendations to the Board and shareholders regarding the appointment of the external auditor.

TD BANK GROUP ANNUAL REPORT 2015 F INANCIAL RESULTS 113
that are appropriate in the circumstances. An audit also includes exam-ining, on a test basis, evidence supporting the amounts and disclosures in the consolidated financial statements, evaluating the appropriateness of accounting policies used and the reasonableness of accounting estimates made by management, as well as evaluating the overall presentation of the consolidated financial statements.
We believe that the audit evidence we have obtained in our audits is sufficient and appropriate to provide a basis for our audit opinion.
OpinionIn our opinion, the consolidated financial statements present fairly, in all material respects, the financial position of The Toronto-Dominion Bank as at October 31, 2015 and 2014, and its financial performance and its cash flows for each of the years in the three-year period ended October 31, 2015, in accordance with International Financial Reporting Standards as issued by the International Accounting Standards Board.
Other matterWe have also audited, in accordance with the standards of the Public Company Accounting Oversight Board (United States), The Toronto-Dominion Bank’s internal control over financial reporting as of October 31, 2015, based on the criteria established in Internal Control – Integrated Framework issued by the Committee of Sponsoring Organizations of the Treadway Commission (2013 Framework) and our report dated December 2, 2015, expressed an unqualified opinion on The Toronto-Dominion Bank’s internal control over financial reporting.
Ernst & Young LLPChartered Professional AccountantsLicensed Public Accountants Toronto, Canada December 2, 2015
INDEPENDENT AUDITORS’ REPORT OF REGISTERED PUBLIC ACCOUNTING FIRM TO SHAREHOLDERS
Report on Financial StatementsWe have audited the accompanying consolidated financial statements of The Toronto-Dominion Bank, which comprise the Consolidated Balance Sheet as at October 31, 2015 and 2014, and the Consolidated Statements of Income, Comprehensive Income, Changes in Equity, and Cash Flows for each of the years in the three-year period ended October 31, 2015, and a summary of significant accounting policies and other explanatory information.
Management’s responsibility for the consolidated financial statementsManagement is responsible for the preparation and fair presentation of these consolidated financial statements in accordance with International Financial Reporting Standards as issued by the International Accounting Standards Board, and for such internal control as management determines is necessary to enable the preparation of consolidated financial statements that are free from material misstatement, whether due to fraud or error.
Auditors’ responsibilityOur responsibility is to express an opinion on these consolidated financial statements based on our audits. We conducted our audits in accordance with Canadian generally accepted auditing standards and the standards of the Public Company Accounting Oversight Board (United States). Those standards require that we comply with ethical requirements and plan and perform the audit to obtain reasonable assurance about whether the consolidated financial statements are free from material misstatement.
An audit involves performing procedures to obtain audit evidence about the amounts and disclosures in the consolidated financial statements. The procedures selected depend on the auditors’ judgment, including the assess ment of the risks of material misstatement of the consolidated financial statements, whether due to fraud or error. In making those risk assessments, the auditors consider internal control relevant to the entity’s preparation and fair presentation of the consolidated financial statements in order to design audit procedures
TD BANK GROUP ANNUAL REPORT 2015 F INANCIAL RESULTS114
INDEPENDENT AUDITORS’ REPORT OF REGISTERED PUBLIC ACCOUNTING FIRM TO SHAREHOLDERS
Report on Internal Control under Standards of the Public Company Accounting Oversight Board (United States)We have audited The Toronto-Dominion Bank’s internal control over financial reporting as of October 31, 2015, based on criteria established in Internal Control – Integrated Framework issued by the Committee of Sponsoring Organizations of the Treadway Commission (2013 Framework) (the COSO criteria). The Toronto-Dominion Bank’s management is responsible for maintaining effective internal control over financial reporting, and for its assessment of the effectiveness of internal control over financial reporting included in the accom-panying Management’s Report on Internal Control over Financial Reporting contained in the accompanying Management’s Discussion and Analysis. Our responsibility is to express an opinion on The Toronto-Dominion Bank’s internal control over financial reporting based on our audit.
We conducted our audit in accordance with the standards of the Public Company Accounting Oversight Board (United States). Those standards require that we plan and perform the audit to obtain reason-able assurance about whether effective internal control over financial reporting was maintained in all material respects. Our audit included obtaining an understanding of internal control over financial reporting, assessing the risk that a material weakness exists, testing and evaluat-ing the design and operating effectiveness of internal control based on the assessed risk, and performing such other procedures as we considered necessary in the circumstances. We believe that our audit provides a reasonable basis for our opinion.
A company’s internal control over financial reporting is a process designed to provide reasonable assurance regarding the reliability of financial reporting and the preparation of financial statements for external purposes in accordance with International Financial Report-ing Standards as issued by the International Accounting Standards Board (IFRS). A company’s internal control over financial reporting includes those policies and procedures that (1) pertain to the main-tenance of records that, in reasonable detail, accurately and fairly reflect the transactions and dispositions of the assets of the company;
(2) provide reasonable assurance that transactions are recorded as necessary to permit preparation of financial statements in accordance with IFRS, and that receipts and expenditures of the company are being made only in accordance with authorizations of management and directors of the company; and (3) provide reasonable assurance regarding prevention or timely detection of unauthorized acquisition, use, or disposition of the company’s assets that could have a material effect on the financial statements.
Because of its inherent limitations, internal control over financial reporting may not prevent or detect misstatements. Also, projections of any evaluation of effectiveness to future periods are subject to the risk that controls may become inadequate because of changes in conditions, or that the degree of compliance with the policies or procedures may deteriorate.
In our opinion, The Toronto-Dominion Bank maintained, in all material respects, effective internal control over financial reporting as of October 31, 2015, based on the COSO criteria.
We also have audited, in accordance with Canadian generally accepted auditing standards and the standards of the Public Company Accounting Oversight Board (United States), the Consolidated Balance Sheet of The Toronto-Dominion Bank as at October 31, 2015 and 2014, and the Consolidated Statements of Income, Comprehensive Income, Changes in Equity, and Cash Flows for each of the years in the three-year period ended October 31, 2015, of The Toronto-Dominion Bank and our report dated December 2, 2015, expressed an unqualified opinion thereon.
Ernst & Young LLPChartered Professional AccountantsLicensed Public Accountants Toronto, Canada December 2, 2015
TD BANK GROUP ANNUAL REPORT 2015 F INANCIAL RESULTS 115
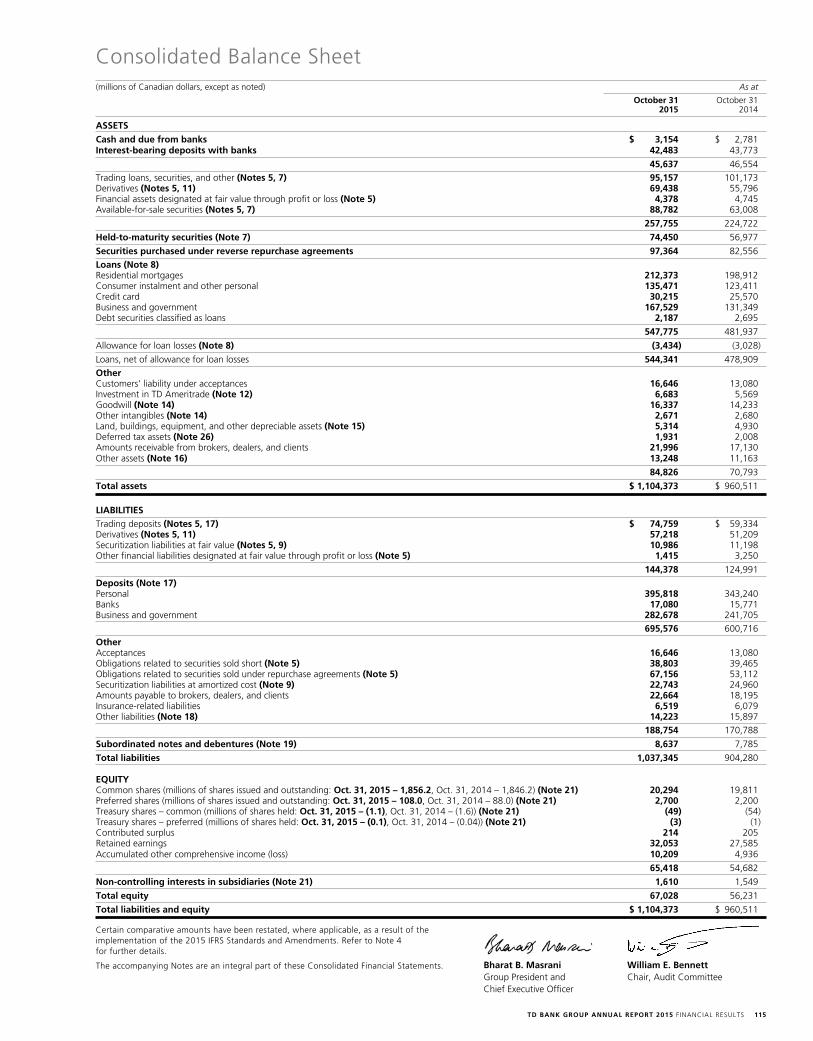
Consolidated Balance Sheet(millions of Canadian dollars, except as noted) As at
October 31 October 31 2015 2014
ASSETS
Cash and due from banks $ 3,154 $ 2,781Interest-bearing deposits with banks 42,483 43,773
45,637 46,554
Trading loans, securities, and other (Notes 5, 7) 95,157 101,173 Derivatives (Notes 5, 11) 69,438 55,796 Financial assets designated at fair value through profit or loss (Note 5) 4,378 4,745 Available-for-sale securities (Notes 5, 7) 88,782 63,008
257,755 224,722
Held-to-maturity securities (Note 7) 74,450 56,977
Securities purchased under reverse repurchase agreements 97,364 82,556
Loans (Note 8) Residential mortgages 212,373 198,912 Consumer instalment and other personal 135,471 123,411 Credit card 30,215 25,570 Business and government 167,529 131,349 Debt securities classified as loans 2,187 2,695
547,775 481,937
Allowance for loan losses (Note 8) (3,434) (3,028)
Loans, net of allowance for loan losses 544,341 478,909 Other Customers’ liability under acceptances 16,646 13,080 Investment in TD Ameritrade (Note 12) 6,683 5,569 Goodwill (Note 14) 16,337 14,233 Other intangibles (Note 14) 2,671 2,680 Land, buildings, equipment, and other depreciable assets (Note 15) 5,314 4,930 Deferred tax assets (Note 26) 1,931 2,008 Amounts receivable from brokers, dealers, and clients 21,996 17,130 Other assets (Note 16) 13,248 11,163
84,826 70,793
Total assets $ 1,104,373 $ 960,511
LIABILITIES
Trading deposits (Notes 5, 17) $ 74,759 $ 59,334 Derivatives (Notes 5, 11) 57,218 51,209 Securitization liabilities at fair value (Notes 5, 9) 10,986 11,198 Other financial liabilities designated at fair value through profit or loss (Note 5) 1,415 3,250
144,378 124,991
Deposits (Note 17) Personal 395,818 343,240 Banks 17,080 15,771 Business and government 282,678 241,705
695,576 600,716
Other Acceptances 16,646 13,080 Obligations related to securities sold short (Note 5) 38,803 39,465 Obligations related to securities sold under repurchase agreements (Note 5) 67,156 53,112 Securitization liabilities at amortized cost (Note 9) 22,743 24,960 Amounts payable to brokers, dealers, and clients 22,664 18,195 Insurance-related liabilities 6,519 6,079 Other liabilities (Note 18) 14,223 15,897
188,754 170,788
Subordinated notes and debentures (Note 19) 8,637 7,785
Total liabilities 1,037,345 904,280
EQUITY Common shares (millions of shares issued and outstanding: Oct. 31, 2015 – 1,856.2, Oct. 31, 2014 – 1,846.2) (Note 21) 20,294 19,811 Preferred shares (millions of shares issued and outstanding: Oct. 31, 2015 – 108.0, Oct. 31, 2014 – 88.0) (Note 21) 2,700 2,200 Treasury shares – common (millions of shares held: Oct. 31, 2015 – (1.1), Oct. 31, 2014 – (1.6)) (Note 21) (49) (54)Treasury shares – preferred (millions of shares held: Oct. 31, 2015 – (0.1), Oct. 31, 2014 – (0.04)) (Note 21) (3) (1)Contributed surplus 214 205 Retained earnings 32,053 27,585 Accumulated other comprehensive income (loss) 10,209 4,936
65,418 54,682
Non-controlling interests in subsidiaries (Note 21) 1,610 1,549
Total equity 67,028 56,231
Total liabilities and equity $ 1,104,373 $ 960,511
Certain comparative amounts have been restated, where applicable, as a result of the implementation of the 2015 IFRS Standards and Amendments. Refer to Note 4 for further details.
The accompanying Notes are an integral part of these Consolidated Financial Statements. Bharat B. Masrani William E. BennettGroup President and Chair, Audit CommitteeChief Executive Officer
TD BANK GROUP ANNUAL REPORT 2015 F INANCIAL RESULTS116
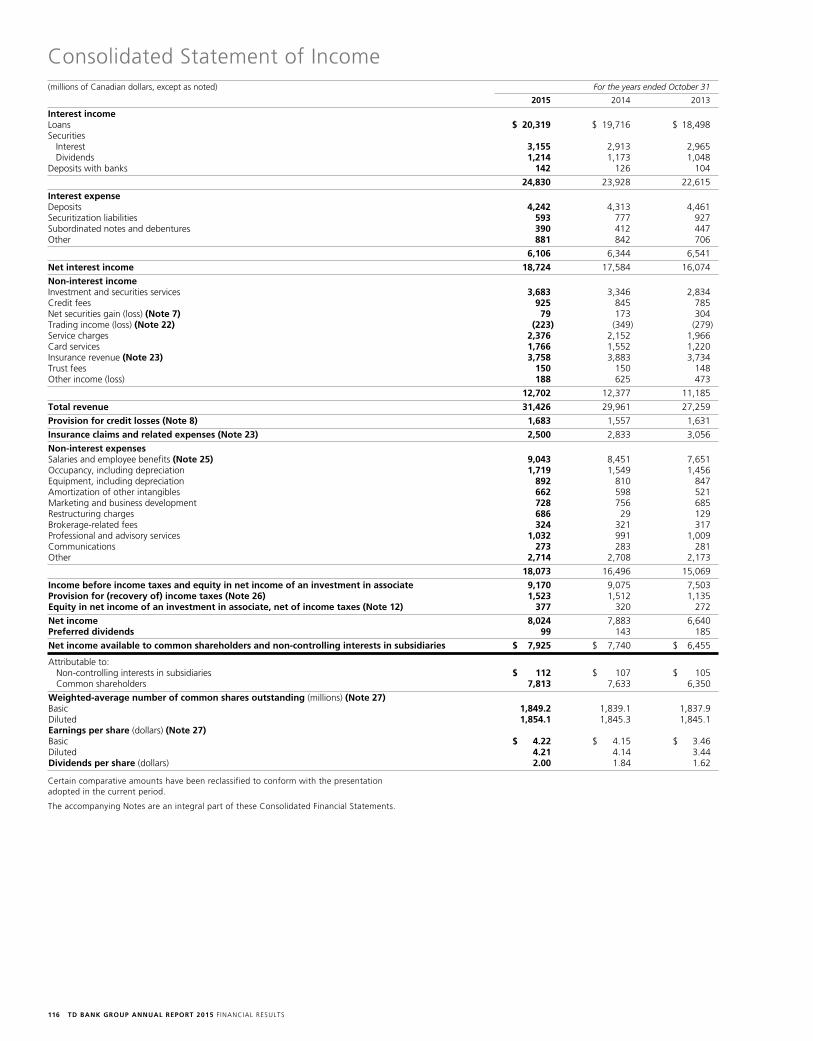
Consolidated Statement of Income(millions of Canadian dollars, except as noted) For the years ended October 31
2015 2014 2013
Interest income Loans $ 20,319 $ 19,716 $ 18,498 Securities Interest 3,155 2,913 2,965 Dividends 1,214 1,173 1,048 Deposits with banks 142 126 104
24,830 23,928 22,615
Interest expense Deposits 4,242 4,313 4,461 Securitization liabilities 593 777 927 Subordinated notes and debentures 390 412 447 Other 881 842 706
6,106 6,344 6,541
Net interest income 18,724 17,584 16,074
Non-interest income Investment and securities services 3,683 3,346 2,834 Credit fees 925 845 785 Net securities gain (loss) (Note 7) 79 173 304 Trading income (loss) (Note 22) (223) (349) (279)Service charges 2,376 2,152 1,966 Card services 1,766 1,552 1,220 Insurance revenue (Note 23) 3,758 3,883 3,734 Trust fees 150 150 148 Other income (loss) 188 625 473
12,702 12,377 11,185
Total revenue 31,426 29,961 27,259
Provision for credit losses (Note 8) 1,683 1,557 1,631
Insurance claims and related expenses (Note 23) 2,500 2,833 3,056
Non-interest expenses Salaries and employee benefits (Note 25) 9,043 8,451 7,651 Occupancy, including depreciation 1,719 1,549 1,456 Equipment, including depreciation 892 810 847 Amortization of other intangibles 662 598 521 Marketing and business development 728 756 685 Restructuring charges 686 29 129 Brokerage-related fees 324 321 317 Professional and advisory services 1,032 991 1,009 Communications 273 283 281 Other 2,714 2,708 2,173
18,073 16,496 15,069
Income before income taxes and equity in net income of an investment in associate 9,170 9,075 7,503 Provision for (recovery of) income taxes (Note 26) 1,523 1,512 1,135 Equity in net income of an investment in associate, net of income taxes (Note 12) 377 320 272
Net income 8,024 7,883 6,640 Preferred dividends 99 143 185
Net income available to common shareholders and non-controlling interests in subsidiaries $ 7,925 $ 7,740 $ 6,455
Attributable to: Non-controlling interests in subsidiaries $ 112 $ 107 $ 105 Common shareholders 7,813 7,633 6,350
Weighted-average number of common shares outstanding (millions) (Note 27) Basic 1,849.2 1,839.1 1,837.9 Diluted 1,854.1 1,845.3 1,845.1 Earnings per share (dollars) (Note 27) Basic $ 4.22 $ 4.15 $ 3.46 Diluted 4.21 4.14 3.44 Dividends per share (dollars) 2.00 1.84 1.62
Certain comparative amounts have been reclassified to conform with the presentation adopted in the current period.
The accompanying Notes are an integral part of these Consolidated Financial Statements.

TD BANK GROUP ANNUAL REPORT 2015 F INANCIAL RESULTS 117
Consolidated Statement of Comprehensive Income(millions of Canadian dollars) For the years ended October 31
2015 2014 2013
Net income $ 8,024 $ 7,883 $ 6,640
Other comprehensive income (loss) (OCI), net of income taxes Items that will be subsequently reclassified to net income Change in unrealized gains (losses) on available-for-sale securities1 (464) 69 (472)Reclassification to earnings of net losses (gains) in respect of available-for-sale securities2 (93) (163) (271)Net change in unrealized foreign currency translation gains (losses) on investments in foreign operations 8,090 3,697 1,885 Reclassification to earnings of net losses (gains) on investments in foreign operations3 – (13) 4 Net foreign currency translation gains (losses) from hedging activities4 (2,764) (1,390) (737)Reclassification to earnings of net losses (gains) on hedges of investments in foreign operations5 – 13 (4)Change in net gains (losses) on derivatives designated as cash flow hedges6 4,805 2,439 (86)Reclassification to earnings of net losses (gains) on cash flow hedges7 (4,301) (2,875) (805)Items that will not be subsequently reclassified to net income Actuarial gains (losses) on employee benefit plans8 400 (458) 339
5,673 1,319 (147)
Comprehensive income (loss) for the year $ 13,697 $ 9,202 $ 6,493
Attributable to: Preferred shareholders $ 99 $ 143 $ 185 Common shareholders 13,486 8,952 6,203 Non-controlling interests in subsidiaries 112 107 105
1 Net of income tax recovery in 2015 of $210 million (2014 – income tax provision of $67 million; 2013 – income tax recovery of $285 million).
2 Net of income tax provision in 2015 of $78 million (2014 – income tax provision of $81 million; 2013 – income tax provision of $136 million).
3 Net of income tax provision in 2015 of nil (2014 – income tax provision of nil; 2013 – income tax provision of nil).
4 Net of income tax recovery in 2015 of $985 million (2014 – income tax recovery of $488 million; 2013 – income tax recovery of $264 million).
5 Net of income tax provision in 2015 of nil (2014 – income tax recovery of $4 million; 2013 – income tax provision of $1 million).
6 Net of income tax provision in 2015 of $2,926 million (2014 – income tax provision of $1,394 million; 2013 – income tax provision of $140 million).
7 Net of income tax provision in 2015 of $2,744 million (2014 – income tax provision of $1,617 million; 2013 – income tax provision of $587 million).
8 Net of income tax provision in 2015 of $147 million (2014 – income tax recovery of $210 million; 2013 – income tax provision of $172 million).
Certain comparative amounts have been reclassified to conform with the presentation adopted in the current year.
The accompanying Notes are an integral part of these Consolidated Financial Statements.
TD BANK GROUP ANNUAL REPORT 2015 F INANCIAL RESULTS118
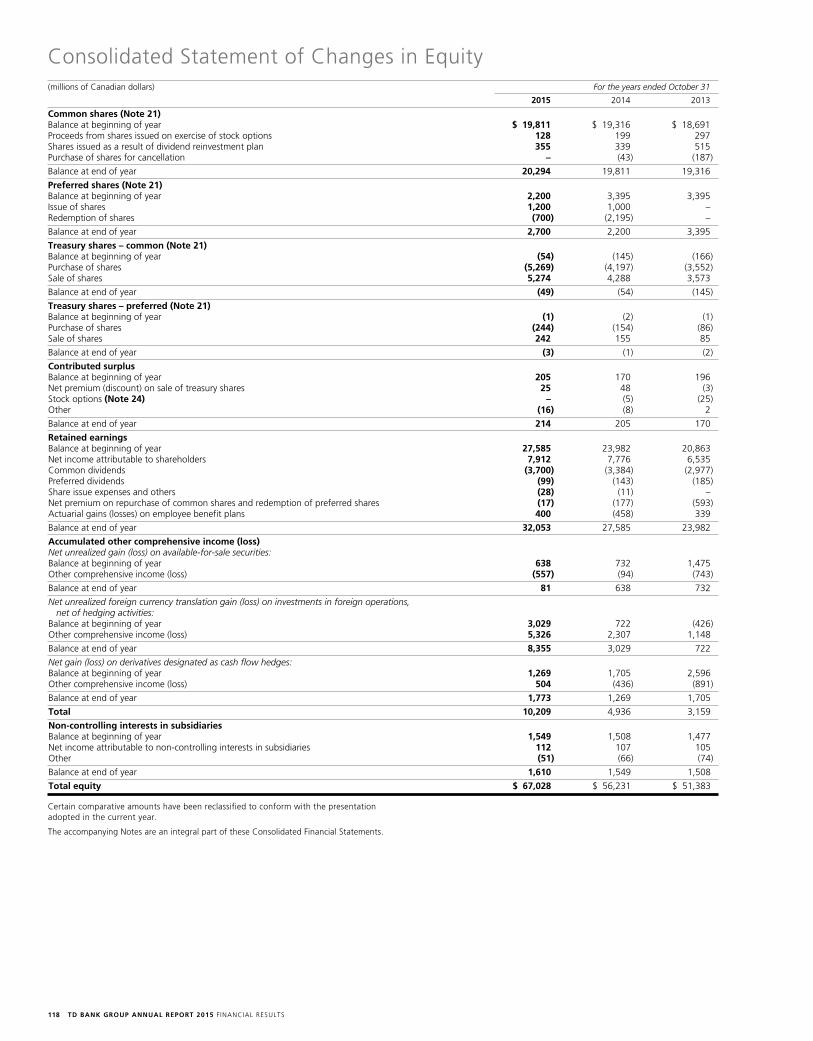
Consolidated Statement of Changes in Equity(millions of Canadian dollars) For the years ended October 31
2015 2014 2013
Common shares (Note 21)Balance at beginning of year $ 19,811 $ 19,316 $ 18,691 Proceeds from shares issued on exercise of stock options 128 199 297 Shares issued as a result of dividend reinvestment plan 355 339 515 Purchase of shares for cancellation – (43) (187)
Balance at end of year 20,294 19,811 19,316
Preferred shares (Note 21) Balance at beginning of year 2,200 3,395 3,395 Issue of shares 1,200 1,000 – Redemption of shares (700) (2,195) –
Balance at end of year 2,700 2,200 3,395
Treasury shares – common (Note 21) Balance at beginning of year (54) (145) (166)Purchase of shares (5,269) (4,197) (3,552)Sale of shares 5,274 4,288 3,573
Balance at end of year (49) (54) (145)
Treasury shares – preferred (Note 21) Balance at beginning of year (1) (2) (1)Purchase of shares (244) (154) (86)Sale of shares 242 155 85
Balance at end of year (3) (1) (2)
Contributed surplus Balance at beginning of year 205 170 196 Net premium (discount) on sale of treasury shares 25 48 (3)Stock options (Note 24) – (5) (25)Other (16) (8) 2
Balance at end of year 214 205 170
Retained earnings Balance at beginning of year 27,585 23,982 20,863 Net income attributable to shareholders 7,912 7,776 6,535 Common dividends (3,700) (3,384) (2,977)Preferred dividends (99) (143) (185)Share issue expenses and others (28) (11) – Net premium on repurchase of common shares and redemption of preferred shares (17) (177) (593)Actuarial gains (losses) on employee benefit plans 400 (458) 339
Balance at end of year 32,053 27,585 23,982
Accumulated other comprehensive income (loss) Net unrealized gain (loss) on available-for-sale securities: Balance at beginning of year 638 732 1,475 Other comprehensive income (loss) (557) (94) (743)
Balance at end of year 81 638 732
Net unrealized foreign currency translation gain (loss) on investments in foreign operations, net of hedging activities:
Balance at beginning of year 3,029 722 (426)Other comprehensive income (loss) 5,326 2,307 1,148
Balance at end of year 8,355 3,029 722
Net gain (loss) on derivatives designated as cash flow hedges: Balance at beginning of year 1,269 1,705 2,596 Other comprehensive income (loss) 504 (436) (891)
Balance at end of year 1,773 1,269 1,705
Total 10,209 4,936 3,159
Non-controlling interests in subsidiaries Balance at beginning of year 1,549 1,508 1,477 Net income attributable to non-controlling interests in subsidiaries 112 107 105 Other (51) (66) (74)
Balance at end of year 1,610 1,549 1,508
Total equity $ 67,028 $ 56,231 $ 51,383
Certain comparative amounts have been reclassified to conform with the presentation adopted in the current year.
The accompanying Notes are an integral part of these Consolidated Financial Statements.
TD BANK GROUP ANNUAL REPORT 2015 F INANCIAL RESULTS 119
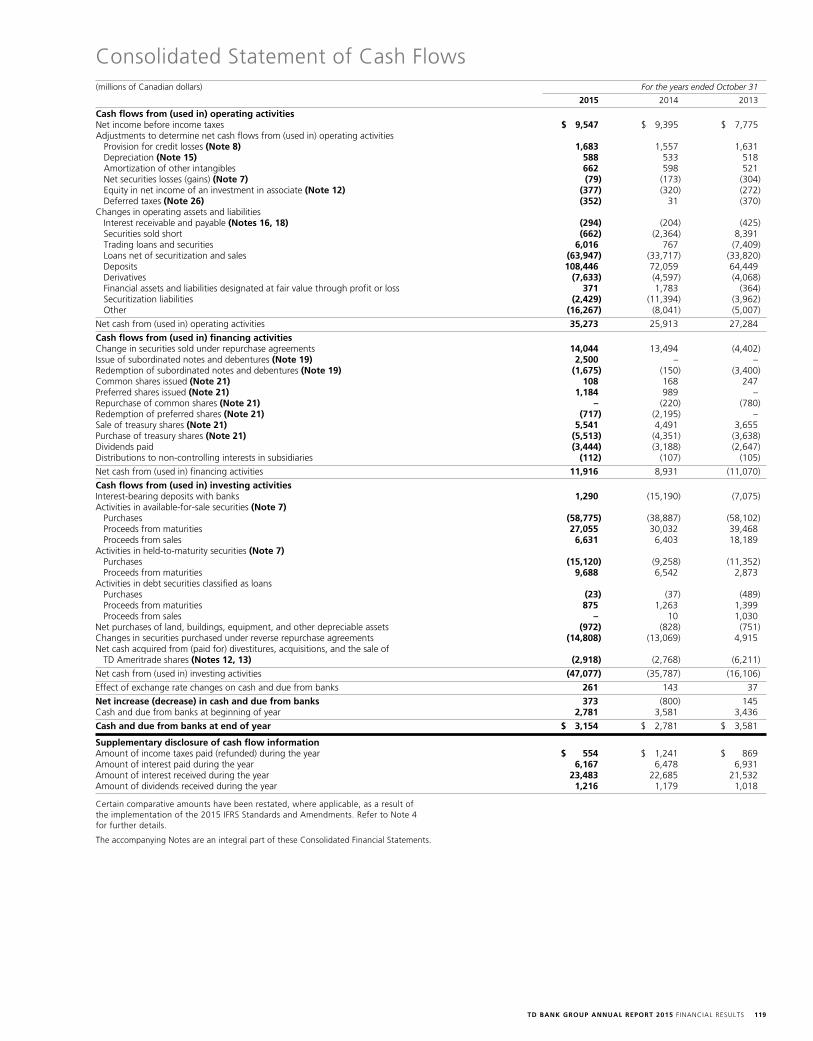
Consolidated Statement of Cash Flows(millions of Canadian dollars) For the years ended October 31
2015 2014 2013
Cash flows from (used in) operating activities Net income before income taxes $ 9,547 $ 9,395 $ 7,775 Adjustments to determine net cash flows from (used in) operating activities Provision for credit losses (Note 8) 1,683 1,557 1,631 Depreciation (Note 15) 588 533 518 Amortization of other intangibles 662 598 521 Net securities losses (gains) (Note 7) (79) (173) (304) Equity in net income of an investment in associate (Note 12) (377) (320) (272) Deferred taxes (Note 26) (352) 31 (370)Changes in operating assets and liabilities Interest receivable and payable (Notes 16, 18) (294) (204) (425) Securities sold short (662) (2,364) 8,391 Trading loans and securities 6,016 767 (7,409) Loans net of securitization and sales (63,947) (33,717) (33,820) Deposits 108,446 72,059 64,449 Derivatives (7,633) (4,597) (4,068) Financial assets and liabilities designated at fair value through profit or loss 371 1,783 (364) Securitization liabilities (2,429) (11,394) (3,962) Other (16,267) (8,041) (5,007)
Net cash from (used in) operating activities 35,273 25,913 27,284
Cash flows from (used in) financing activities Change in securities sold under repurchase agreements 14,044 13,494 (4,402)Issue of subordinated notes and debentures (Note 19) 2,500 – – Redemption of subordinated notes and debentures (Note 19) (1,675) (150) (3,400)Common shares issued (Note 21) 108 168 247 Preferred shares issued (Note 21) 1,184 989 – Repurchase of common shares (Note 21) – (220) (780)Redemption of preferred shares (Note 21) (717) (2,195) – Sale of treasury shares (Note 21) 5,541 4,491 3,655 Purchase of treasury shares (Note 21) (5,513) (4,351) (3,638)Dividends paid (3,444) (3,188) (2,647)Distributions to non-controlling interests in subsidiaries (112) (107) (105)
Net cash from (used in) financing activities 11,916 8,931 (11,070)
Cash flows from (used in) investing activities Interest-bearing deposits with banks 1,290 (15,190) (7,075)Activities in available-for-sale securities (Note 7) Purchases (58,775) (38,887) (58,102) Proceeds from maturities 27,055 30,032 39,468 Proceeds from sales 6,631 6,403 18,189 Activities in held-to-maturity securities (Note 7) Purchases (15,120) (9,258) (11,352) Proceeds from maturities 9,688 6,542 2,873 Activities in debt securities classified as loans Purchases (23) (37) (489) Proceeds from maturities 875 1,263 1,399 Proceeds from sales – 10 1,030 Net purchases of land, buildings, equipment, and other depreciable assets (972) (828) (751)Changes in securities purchased under reverse repurchase agreements (14,808) (13,069) 4,915 Net cash acquired from (paid for) divestitures, acquisitions, and the sale of
TD Ameritrade shares (Notes 12, 13) (2,918) (2,768) (6,211)
Net cash from (used in) investing activities (47,077) (35,787) (16,106)
Effect of exchange rate changes on cash and due from banks 261 143 37
Net increase (decrease) in cash and due from banks 373 (800) 145 Cash and due from banks at beginning of year 2,781 3,581 3,436
Cash and due from banks at end of year $ 3,154 $ 2,781 $ 3,581
Supplementary disclosure of cash flow information Amount of income taxes paid (refunded) during the year $ 554 $ 1,241 $ 869 Amount of interest paid during the year 6,167 6,478 6,931 Amount of interest received during the year 23,483 22,685 21,532 Amount of dividends received during the year 1,216 1,179 1,018
Certain comparative amounts have been restated, where applicable, as a result of the implementation of the 2015 IFRS Standards and Amendments. Refer to Note 4 for further details.
The accompanying Notes are an integral part of these Consolidated Financial Statements.

TD BANK GROUP ANNUAL REPORT 2015 F INANCIAL RESULTS120
Notes to Consolidated Financial Statements
NOTE TOPIC PAGE 1 Nature of Operations 121 2 Summary of Significant Accounting Policies 121 3 Significant Accounting Judgments, Estimates and Assumptions 129 4 Current and Future Changes in Accounting Policies 132 5 Fair Value Measurements 132 6 Offsetting Financial Assets and Financial Liabilities 144 7 Securities 145 8 Loans, Impaired Loans, and Allowance for Credit Losses 149 9 Transfers of Financial Assets 15210 Structured Entities 153 11 Derivatives 15712 Investment in Associates and Joint Ventures 16413 Significant Acquisitions and Disposals 16514 Goodwill and Other Intangibles 16615 Land, Buildings, Equipment, and Other Depreciable Assets 16816 Other Assets 16817 Deposits 16918 Other Liabilities 17019 Subordinated Notes and Debentures 17020 Capital Trust Securities 17121 Equity 17122 Trading-Related Income 17323 Insurance 17424 Share-Based Compensation 17725 Employee Benefits 17826 Income Taxes 18327 Earnings Per Share 18528 Provisions, Contingent Liabilities, Commitments, Guarantees, Pledged Assets, and Collateral 18529 Related Party Transactions 18930 Segmented Information 19031 Interest Rate Risk 19232 Credit Risk 19433 Regulatory Capital 19834 Risk Management 19935 Information on Subsidiaries 19936 Subsequent Event 200
To facilitate a better understanding of the Bank’s Consolidated Financial Statements, significant accounting policies, and related disclosures, a listing of all the notes is provided below.
TD BANK GROUP ANNUAL REPORT 2015 F INANCIAL RESULTS 121
SUMMARY OF SIGNIFICANT ACCOUNTING POLICIESN O T E 2
These Consolidated Financial Statements were prepared using the accounting policies as described in Note 2, as well as the new and amended standards under IFRS (2015 IFRS Standards and Amendments) adopted retrospectively by the Bank as discussed in Note 4. Certain other comparative amounts have also been restated/reclassified to conform with the presentation adopted in the current period.
The preparation of financial statements requires that management make estimates, assumptions, and judgments regarding the reported amount of assets, liabilities, revenue and expenses, and disclosure of contingent assets and liabilities, as further described in Note 3. Accordingly, actual results may differ from estimated amounts as future confirming events occur.
The accompanying Consolidated Financial Statements of the Bank were approved and authorized for issue by the Bank’s Board of Directors, in accordance with a recommendation of the Audit Committee, on December 2, 2015.
Certain disclosures are included in the shaded sections of the “Managing Risk” section of the accompanying 2015 Management’s Discussion and Analysis (MD&A), as permitted by IFRS, and form an integral part of the Consolidated Financial Statements. The Consoli-dated Financial Statements were prepared under a historical cost basis, except for certain items carried at fair value as discussed in Note 2.
CORPORATE INFORMATION The Toronto-Dominion Bank is a bank chartered under the Bank Act. The shareholders of a bank are not, as shareholders, liable for any liability, act, or default of the bank except as otherwise provided under the Bank Act. The Toronto-Dominion Bank and its subsidiaries are collectively known as TD Bank Group (“TD” or the “Bank”). The Bank was formed through the amalgamation on February 1, 1955, of The Bank of Toronto (chartered in 1855) and The Dominion Bank (chartered in 1869). The Bank is incorporated and domiciled in Canada with its registered and principal business offices located at 66 Wellington Street West, Toronto, Ontario. TD serves customers in three business segments operating in a number of locations in key financial centres around the globe: Canadian Retail, U.S. Retail, and Wholesale Banking.
BASIS OF PREPARATIONThe accompanying Consolidated Financial Statements and accounting principles followed by the Bank have been prepared in accordance with International Financial Reporting Standards (IFRS), as issued by the International Accounting Standards Board (IASB), including the accounting requirements of the Office of the Superintendent of Finan-cial Institutions Canada (OSFI). The Consolidated Financial Statements are presented in Canadian dollars, unless otherwise indicated.
their governing board, trustee, or management over the operations of the entity. Typically, structured entities may not be controlled directly through holding more than half of the voting power of the entity as the ownership of voting rights may not be aligned with the variable returns absorbed from the entity. As a result, structured entities are consolidated when the substance of the relationship between the Bank and the structured entity indicates that the entity is controlled by the Bank. When assessing whether the Bank has to consolidate a structured entity, the Bank evaluates three primary criteria in order to conclude whether, in substance:• The Bank has the power to direct the activities of the structured
entity that have the most significant impact on the entity’s risks and/or returns;
• The Bank is exposed to significant variable returns arising from the entity; and
• The Bank has the ability to use its power to affect the risks and/or returns to which it is exposed.
Consolidation conclusions are reassessed at the end of each financial reporting period. The Bank’s policy is to consider the impact on consolidation of all significant changes in circumstances, focusing on the following:• Substantive changes in ownership, such as the purchase or disposal
of more than an insignificant additional interest in an entity;• Changes in contractual or governance arrangements of an entity;• Additional activities undertaken, such as providing a liquidity
facility beyond the original terms or entering into a transaction not originally contemplated; or
• Changes in the financing structure of an entity.
Investments in Associates and Joint VenturesEntities over which the Bank has significant influence are associates and entities over which the Bank has joint control are joint ventures. Significant influence is the power to participate in the financial and operating policy decisions of an investee, but is not control or joint control over these entities. Associates and joint ventures are accounted for using the equity method of accounting. Investments in associates and joint ventures are carried on the Consolidated Balance Sheet initially at cost and increased or decreased to recognize the Bank’s share of the profit or loss of the associate or joint venture, capital transactions, including the receipt of any dividends, and write-downs
BASIS OF CONSOLIDATIONThe Consolidated Financial Statements include the assets, liabilities, results of operations, and cash flows of the Bank and its subsidiaries including certain structured entities which it controls. The Bank controls an entity when (1) it has the power to direct the activities of the entity which have the most significant impact on the entity’s risks and/or returns; (2) it is exposed to significant risks and/or returns arising from the entity; and (3) it is able to use its power to affect the risks and/or returns to which it is exposed.
The Bank’s Consolidated Financial Statements have been prepared using uniform accounting policies for like transactions and events in similar circumstances. All intercompany transactions, balances, and unrealized gains and losses on transactions are eliminated on consolidation.
SubsidiariesSubsidiaries are corporations or other legal entities controlled by the Bank, generally through directly holding more than half of the voting power of the entity. Control of subsidiaries is determined based on the power exercisable through ownership of voting rights and is generally aligned with the risks and/or returns (collectively referred to as “vari-able returns”) absorbed from subsidiaries through those voting rights. As a result, the Bank controls and consolidates subsidiaries when it holds the majority of the voting rights of the subsidiary, unless there is evidence that another investor has control over the subsidiary. The existence and effect of potential voting rights that are currently exer-cisable or convertible are considered in assessing whether the Bank controls an entity. Subsidiaries are consolidated from the date the Bank obtains control and continue to be consolidated until the date when control ceases to exist.
The Bank may consolidate certain subsidiaries where it owns 50% or less of the voting rights. Most of those subsidiaries are structured enti-ties as described in the following section.
Structured Entities Structured entities, including special purpose entities (SPEs), are entities that are created to accomplish a narrow and well-defined objective. Structured entities may take the form of a corporation, trust, partner-ship, or unincorporated entity. They are often created with legal arrangements that impose limits on the decision making powers of
NATURE OF OPERATIONSN O T E 1
TD BANK GROUP ANNUAL REPORT 2015 F INANCIAL RESULTS122
certain financing-type commodities transactions that are recorded on the Consolidated Balance Sheet as securities purchased under reverse repurchase agreements and obligations related to securities sold under repurchase agreements, respectively.
Trading portfolio assets and liabilities are recognized on a trade date basis and are accounted for at fair value, with changes in fair value as well as any gains or losses realized on disposal recognized in trading income. Physical commodities are measured at fair value less costs to sell. Transaction costs are expensed as incurred. Dividends are recog-nized on the ex-dividend date and interest is recognized on an accrual basis using the effective interest rate method (EIRM). Both dividends and interest are included in interest income or interest expense.
Designated at Fair Value through Profit or LossCertain financial assets and liabilities that do not meet the definition of trading may be designated at fair value through profit or loss. To be designated at fair value through profit or loss, financial assets or liabilities must meet one of the following criteria: (1) the designa-tion eliminates or significantly reduces a measurement or recognition inconsistency; (2) a group of financial assets or liabilities, or both, is managed and its performance is evaluated on a fair value basis in accordance with a documented risk management or investment strategy; or (3) the instrument contains one or more embedded deriva-tives unless a) the embedded derivative does not significantly modify the cash flows that otherwise would be required by the contract, or b) it is clear with little or no analysis that separation of the embedded derivative from the financial instrument is prohibited. In addition, the fair value through profit or loss designation is available only for those financial instruments for which a reliable estimate of fair value can be obtained. Once financial assets and liabilities are designated at fair value through profit or loss, the designation is irrevocable.
Assets and liabilities designated at fair value through profit or loss are carried at fair value on the Consolidated Balance Sheet, with changes in fair value as well as any gains or losses realized on disposal recognized in other income. Interest is recognized on an accrual basis using the EIRM and is included in interest income or interest expense.
Available-for-Sale Securities Financial assets not classified as trading, designated at fair value through profit or loss, held-to-maturity or loans, are classified as available-for-sale and include equity securities and debt securities.
Available-for-sale securities are recognized on a trade date basis and are carried at fair value on the Consolidated Balance Sheet with changes in fair value recognized in other comprehensive income.
Gains and losses realized on disposal of financial assets classified as available-for-sale are calculated on a weighted-average cost basis and are recognized in net securities gains (losses) in non-interest income. Dividends are recognized on the ex-dividend date and interest income is recognized on an accrual basis using the EIRM. Both dividends and interest are included in Interest income on the Consolidated Statement of Income.
Impairment losses are recognized if there is objective evidence of impairment as a result of one or more events that have occurred (a ‘loss event’) and the loss event(s) results in a decrease in the esti-mated future cash flows of the instrument. A significant or prolonged decline in fair value below cost is considered objective evidence of impairment for available-for-sale equity securities. A deterioration in credit quality is considered objective evidence of impairment for available-for-sale debt securities. Qualitative factors are also considered when assessing impairment for available-for-sale securities. When impairment is identified, the cumulative net loss previously recognized in Other comprehensive income, less any impairment loss previously recognized on the Consolidated Statement of Income, is removed from Other comprehensive income and recognized in Net securities gains (losses) in Non-interest income on the Consolidated Statement of Income.
If the fair value of a previously impaired equity security subsequently increases, the impairment loss is not reversed through the Consolidated Statement of Income. Subsequent increases in fair value are recog-nized in other comprehensive income. If the fair value of a previously impaired debt security subsequently increases and the increase can be
to reflect any impairment in the value of such entities. These increases or decreases, together with any gains and losses realized on disposi-tion, are reported on the Consolidated Statement of Income.
At each balance sheet date, the Bank assesses whether there is any objective evidence that the investment in an associate or joint venture is impaired. The Bank calculates the amount of impairment as the difference between the higher of fair value or value-in-use and its carrying value.
Non-controlling Interests When the Bank does not own all of the equity of a consolidated entity, the minority shareholders’ interest is presented on the Consolidated Balance Sheet as Non-controlling interests in subsidiaries as a component of total equity, separate from the equity of the Bank’s shareholders. The income attributable to the minority interest holders, net of tax, is presented as a separate line item on the Consolidated Statement of Income.
CASH AND DUE FROM BANKSCash and due from banks consist of cash and amounts due from banks which are issued by investment grade financial institutions. These amounts are due on demand or have an original maturity of three months or less.
REVENUE RECOGNITIONRevenue is recognized to the extent that it is probable that the economic benefits will flow to the Bank and the revenue can be reliably measured. Revenue associated with the rendering of services is recognized by reference to the stage of completion of the transaction at the end of the reporting period.
Interest from interest-bearing assets and liabilities is recognized as interest income using the effective interest rate (EIR). EIR is the rate that discounts expected future cash flows for the expected life of the financial instrument to its carrying value. The calculation takes into account the contractual interest rate, along with any fees or incremen-tal costs that are directly attributable to the instrument and all other premiums or discounts.
Investment and securities services income include asset management fees, administration and commission fees, and investment banking fees. Asset management fees and administration and commission fees include income from investment management and related services, custody and institutional trust services, and brokerage services, which are recognized as income over the period in which the related service is rendered. Investment management fees are primarily calculated based on average daily or point in time assets under management (AUM) or by assets under administration (AUA) by investment mandate. Administration fees earned may either be a fixed amount per client account, or calculated based on a percentage of daily, monthly, or annual AUM for institutional accounts. Investment banking fees, including advisory fees, are recognized as income when earned, and underwriting fees are recognized as income when the Bank has rendered all services to the issuer and is entitled to collect the fee.
Credit fees include commissions, liquidity fees, restructuring fees, and loan syndication fees and are recognized as earned.
Card services income, including interchange income from credit and debit cards and annual fees, is recognized as earned, except for annual fees, which are recognized over a twelve-month period. Service charges, trust, and other fee income is recognized as earned.
Revenue recognition policies related to financial instruments and insurance are described in the following accounting policies.
FINANCIAL INSTRUMENTS OTHER THAN DERIVATIVESTrading Assets and Trading LiabilitiesFinancial instruments are included within the trading portfolio if they have been originated, acquired, or incurred principally for the purpose of selling or repurchasing in the near term, or they form part of a portfolio of identified financial instruments that are managed together and for which there is evidence of a recent actual pattern of short-term profit-taking.
Included within the trading portfolio are trading securities, trading loans, trading deposits, securitization liabilities at fair value, obligations related to securities sold short, and physical commodities, as well as
TD BANK GROUP ANNUAL REPORT 2015 F INANCIAL RESULTS 123
consolidation, forbearance and other modifications intended to mini-mize the economic loss and to avoid foreclosure or repossession of collateral. The Bank has policies in place to determine the appropriate remediation strategy based on the individual borrower. Once modified, additional impairment is recorded where the Bank identifies a decrease in the modified loan’s estimated realizable value as a result of the modification. Modified loans are assessed for impairment, consistent with the Bank’s existing policies for impairment.
Allowance for Credit Losses, Excluding Acquired Credit-Impaired Loans The allowance for credit losses represents management’s best estimate of impairment incurred in the lending portfolios, including any off-balance sheet exposures, at the balance sheet date. The allowance for loan losses, which includes credit-related allowances for residential mortgages, consumer instalment and other personal, credit card, business and government loans, and debt securities classified as loans, is deducted from Loans on the Consolidated Balance Sheet. The allow-ance for credit losses for off-balance sheet instruments, which relates to certain guarantees, letters of credit, and undrawn lines of credit, is recognized in Other liabilities on the Consolidated Balance Sheet. Allowances for lending portfolios reported on the balance sheet and off-balance sheet exposures are calculated using the same meth-odology. The allowance is increased by the provision for credit losses and decreased by write-offs net of recoveries and disposals. The Bank maintains both counterparty-specific and collectively assessed allow-ances. Each quarter, allowances are reassessed and adjusted based on any changes in management’s estimate of the future cash flows estimated to be recovered. Credit losses on impaired loans continue to be recognized by means of an allowance for credit losses until a loan is written off.
A loan is written off against the related allowance for credit losses when there is no realistic prospect of recovery. Non-retail loans are generally written off when all reasonable collection efforts have been exhausted, such as when a loan is sold, when all security has been realized, or when all security has been resolved with the receiver or bankruptcy court. Non-real estate secured retail loans are generally written off when contractual payments are 180 days past due, or when a loan is sold. Real-estate secured retail loans are generally written off when the security is realized.
Counterparty-Specific AllowanceIndividually significant loans, such as the Bank’s medium-sized business and government loans and debt securities classified as loans, are assessed for impairment at the counterparty-specific level. The impairment assessment is based on the counterparty’s credit ratings, overall financial condition, and where applicable, the realizable value of the collateral. Collateral is reviewed at least annually and when conditions arise indicating an earlier review is necessary. An allowance, if applicable, is measured as the difference between the carrying amount of the loan and the estimated recoverable amount. The estimated recov-erable amount is the present value of the estimated future cash flows, discounted using the loan’s original EIR.
Collectively Assessed Allowance for Individually Insignificant Impaired LoansIndividually insignificant impaired loans, such as the Bank’s personal and small business loans and credit cards, are collectively assessed for impairment. Allowances are calculated using a formula that incorporates recent loss experience, historical default rates which are delinquency levels in interest or principal payments that indicate impairment, other applicable currently observable data, and the type of collateral pledged.
Collectively Assessed Allowance for Incurred but Not Identified Credit LossesIf there is no objective evidence of impairment for an individual loan, whether significant or not, the loan is included in a group of assets with similar credit risk characteristics and collectively assessed for impairment for losses incurred but not identified. This allowance is referred to as the allowance for incurred but not identified credit losses. The level of the allowance for each group depends upon an assessment of business and economic conditions, historical loss experience, loan portfolio composition, and other relevant indicators. Historical loss experience is adjusted based on current observable
objectively related to an event occurring after the impairment was recognized on the Consolidated Statement of Income, then the impair-ment loss is reversed through the Consolidated Statement of Income. An increase in fair value in excess of impairment recognized previously on the Consolidated Statement of Income is recognized in other comprehensive income.
Held-to-Maturity SecuritiesDebt securities with fixed or determinable payments and fixed maturity dates, that do not meet the definition of loans and receivables, and that the Bank intends and has the ability to hold to maturity are classified as held-to-maturity and are carried at amortized cost, net of impairment losses. Securities classified as held-to-maturity are assessed for objective evidence of impairment at the counterparty-specific level. If there is no objective evidence of impairment at the counterparty-specific level then the security is grouped with other held-to-maturity securities with similar credit risk characteristics and collectively assessed for impairment, which considers losses incurred but not identified. Interest income is recognized using the EIRM and is included in Interest income on the Consolidated Statement of Income.
Loans and Allowance for Loan LossesLoansLoans are non-derivative financial assets with fixed or determinable payments that the Bank does not intend to sell immediately or in the near term and that are not quoted in an active market. Loans are carried at amortized cost on the Consolidated Balance Sheet, net of an allowance for loan losses, write-offs and unearned income, which includes prepaid interest, loan origination fees and costs, commitment fees, loan syndication fees, and unamortized discounts or premiums.
Interest income is recognized using the EIRM. Loan origination fees and costs are considered to be adjustments to the loan yield and are recognized in interest income over the term of the loan.
Commitment fees are recognized in credit fees over the commit-ment period when it is unlikely that the commitment will be called upon; otherwise, they are recognized in interest income over the term of the resulting loan. Loan syndication fees are recognized in credit fees upon completion of the financing placement unless the yield on any loan retained by the Bank is less than that of other comparable lenders involved in the financing syndicate. In such cases, an appropri-ate portion of the fee is recognized as a yield adjustment to interest income over the term of the loan.
Loan Impairment, Excluding Acquired Credit-Impaired LoansA loan, including a debt security classified as a loan, is considered impaired when there is objective evidence that there has been a deterioration of credit quality subsequent to the initial recognition of the loan (a ‘loss event’) to the extent the Bank no longer has reasonable assurance as to the timely collection of the full amount of principal and interest. Indicators of impairment could include, but are not limited to, one or more of the following:• Significant financial difficulty of the issuer or obligor;• A breach of contract, such as a default or delinquency in interest
or principal payments;• Increased probability that the borrower will enter bankruptcy
or other financial reorganization; or• The disappearance of an active market for that financial asset.
A loan will be reclassified back to performing status when it has been determined that there is reasonable assurance of full and timely repayment of interest and principal in accordance with the original or revised contractual conditions of the loan and all criteria for the impaired classification have been remedied. For gross impaired debt securities classified as loans, subsequent to any recorded impairment, interest income continues to be recognized using the EIRM which was used to discount the future cash flows for the purpose of measuring the credit loss.
Renegotiated LoansIn cases where a borrower experiences financial difficulties the Bank may grant certain concessionary modifications to the terms and condi-tions of a loan. Modifications may include payment deferrals, extension of amortization periods, rate reductions, principal forgiveness, debt
TD BANK GROUP ANNUAL REPORT 2015 F INANCIAL RESULTS124
Indemnification assets are subsequently adjusted for any changes in estimates related to the overall collectability of the underlying loan portfolio. Any additional impairment of the underlying loan portfolio generally results in an increase of the indemnification asset through the provision for credit losses. Alternatively, decreases in the expecta-tion of losses of the underlying loan portfolio generally results in a decrease of the indemnification asset through net interest income (or through the provision for credit losses if impairment was previously taken). The indemnification asset is drawn down as payments are received from the FDIC pertaining to the loss share agreements.
FDIC covered loans are recorded in Loans on the Consolidated Balance Sheet. The indemnification assets are recorded in Other assets on the Consolidated Balance Sheet.
At the end of each loss share period, the Bank may be required to make a payment to the FDIC if actual losses incurred are less than the intrinsic loss estimate as defined in the loss share agreements. The payment is determined as 20% of the excess between the intrinsic loss estimate and actual covered losses determined in accordance with the loss sharing agreement, net of specified servicing costs. The fair value of the estimated payment is included in part of the indemnification asset at the date of acquisition. Subsequent changes to the estimated payment are considered in determining the adjustment to the indemni-fication asset as described above.
Customers’ Liability under AcceptancesAcceptances represent a form of negotiable short-term debt issued by customers, which the Bank guarantees for a fee. Revenue is recognized on an accrual basis. The potential obligation of the Bank is reported as a liability under Acceptances on the Consolidated Balance Sheet. The Bank’s recourse against the customer in the event of a call on any of these commitments is reported as an asset of the same amount.
Financial Liabilities Carried at Amortized CostDepositsDeposits, other than deposits included in a trading portfolio, are accounted for at amortized cost. Accrued interest on deposits, calculated using the EIRM, is included in Other liabilities on the Consolidated Balance Sheet.
Subordinated Notes and DebenturesSubordinated notes and debentures are initially recognized at fair value and subsequently accounted for at amortized cost. Interest expense, including capitalized transaction costs, is recognized on an accrual basis using the EIRM.
GuaranteesThe Bank issues guarantee contracts that require payments to be made to guaranteed parties based on: (1) changes in the underlying economic characteristics relating to an asset or liability of the guaranteed party; (2) failure of another party to perform under an obligating agreement; or (3) failure of another third party to pay its indebtedness when due. Financial standby letters of credit are financial guarantees that repre-sent irrevocable assurances that the Bank will make payments in the event that a customer cannot meet its obligations to third parties and they carry the same credit risk, recourse, and collateral security require-ments as loans extended to customers. Performance standby letters of credit are considered non-financial guarantees as payment does not depend on the occurrence of a credit event and is generally related to a non-financial trigger event. Guarantees, including financial and performance standby letters of credit, are initially measured and recorded at their fair value. The fair value of a guarantee liability at initial recognition is normally equal to the present value of the guaran-tee fees received over the life of contract. The Bank’s release from risk is recognized over the term of the guarantee using a systematic and rational amortization method.
If a guarantee meets the definition of a derivative, it is carried at fair value on the Consolidated Balance Sheet and reported as a derivative asset or derivative liability at fair value. Guarantees that are considered derivatives are a type of credit derivative which are over-the-counter (OTC) contracts designed to transfer the credit risk in an underlying financial instrument from one counterparty to another.
data to reflect the effects of current conditions. The allowance for incurred but not identified credit losses is calculated using credit risk models that consider probability of default (loss frequency), loss given credit default (loss severity), and exposure at default. For purposes of measuring the collectively assessed allowance for incurred but not identified credit losses, default is defined as delinquency levels in interest or principal payments that would indicate impairment.
Acquired LoansAcquired loans are initially measured at fair value which considers incurred and expected future credit losses estimated at the acquisition date and also reflects adjustments based on the acquired loan’s interest rate in comparison to the current market rates. As a result, no allowance for credit losses is recorded on the date of acquisition. When loans are acquired with evidence of incurred credit loss where it is probable at the purchase date that the Bank will be unable to collect all contractu-ally required principal and interest payments, they are generally consid-ered to be acquired credit-impaired (ACI) loans.
Acquired performing loans are subsequently accounted for at amor-tized cost based on their contractual cash flows and any acquisition related discount or premium is considered to be an adjustment to the loan yield and is recognized in interest income using the EIRM over the term of the loan, or the expected life of the loan for acquired loans with revolving terms. Credit related discounts relating to incurred losses for acquired loans are not accreted. Acquired loans are subject to impairment assessments under the Bank’s credit loss framework similar to the Bank’s originated loan portfolio.
Acquired Credit-Impaired LoansACI loans are identified as impaired at acquisition based on specific risk characteristics of the loans, including past due status, performance history and recent borrower credit scores.
ACI loans are accounted for based on the present value of expected cash flows as opposed to their contractual cash flows. The Bank determines the fair value of these loans at the acquisition date by discounting expected cash flows at a discount rate that reflects factors a market participant would use when determining fair value including management assumptions relating to default rates, loss severities, the amount and timing of prepayments, and other factors that are reflective of current market conditions. With respect to certain individ-ually significant ACI loans, accounting is applied individually at the loan level. The remaining ACI loans are aggregated provided that they are acquired in the same fiscal quarter and have common risk characteristics. Aggregated loans are accounted for as a single asset with aggregated cash flows and a single composite interest rate.
Subsequent to acquisition, the Bank regularly reassesses and updates its cash flow estimates for changes to assumptions relating to default rates, loss severities, the amount and timing of prepayments, and other factors that are reflective of current market conditions. Probable decreases in expected cash flows trigger the recognition of additional impairment, which is measured based on the present value of the revised expected cash flows discounted at the loan’s EIR as compared to the carrying value of the loan. Impairment is recorded through the provision for credit losses.
Probable and significant increases in expected cash flows would first reverse any previously taken impairment with any remaining increase recognized in income immediately as interest income. In addition, for fixed-rate ACI loans the timing of expected cash flows may increase or decrease which may result in adjustments through interest income to the carrying value in order to maintain the inception yield of the ACI loan.
If the timing and/or amounts of expected cash flows on ACI loans were determined not to be reasonably estimable, no interest is recognized.
Federal Deposit Insurance Corporation Covered LoansLoans subject to loss share agreements with the Federal Deposit Insurance Corporation (FDIC) are considered FDIC covered loans. The amounts expected to be reimbursed by the FDIC are considered separately as indemnification assets and are initially measured at fair value. If losses on the portfolio are greater than amounts expected at the acquisition date, an impairment loss is taken by establishing an allowance for credit losses, which is determined on a gross basis, exclusive of any adjustments to the indemnification assets.
TD BANK GROUP ANNUAL REPORT 2015 F INANCIAL RESULTS 125
to the Bank throughout the term of the hedging relationship. If a hedging relationship becomes ineffective, it no longer qualifies for hedge accounting and any subsequent change in the fair value of the hedging instrument is recognized in Non-interest income on the Consolidated Statement of Income.
Changes in fair value relating to the derivative component excluded from the assessment of hedge effectiveness, is recognized immediately in Non-interest income on the Consolidated Statement of Income.
When derivatives are designated as hedges, the Bank classifies them either as: (1) hedges of the changes in fair value of recognized assets or liabilities or firm commitments (fair value hedges); (2) hedges of the variability in highly probable future cash flows attributable to a recognized asset or liability, or a forecasted transaction (cash flow hedges); or (3) hedges of net investments in a foreign operation (net investment hedges).
Fair Value HedgesThe Bank’s fair value hedges principally consist of interest rate swaps that are used to protect against changes in the fair value of fixed- rate long-term financial instruments due to movements in market interest rates.
Changes in the fair value of derivatives that are designated and qualify as fair value hedging instruments are recognized in Non-inter-est income on the Consolidated Statement of Income, along with changes in the fair value of the assets, liabilities, or group thereof that are attributable to the hedged risk. Any change in fair value relating to the ineffective portion of the hedging relationship is recognized immediately in non-interest income.
The cumulative adjustment to the carrying amount of the hedged item (the basis adjustment) is amortized to the Consolidated Statement of Income in net interest income based on a recalculated EIR over the remaining expected life of the hedged item, with amortization beginning no later than when the hedged item ceases to be adjusted for changes in its fair value attributable to the hedged risk. Where the hedged item has been derecognized, the basis adjustment is immediately released to Net interest income on the Consolidated Statement of Income.
Cash Flow HedgesThe Bank is exposed to variability in future cash flows that are denominated in foreign currencies, as well as the variability in future cash flows on non-trading assets and liabilities that bear interest at variable rates, or are expected to be reinvested in the future. The amounts and timing of future cash flows are projected for each hedged exposure on the basis of their contractual terms and other relevant factors, including estimates of prepayments and defaults.
The effective portion of the change in the fair value of the derivative that is designated and qualifies as a cash flow hedge is recognized in other comprehensive income. The change in fair value of the derivative relating to the ineffective portion is recognized immediately in non-interest income.
Amounts accumulated in other comprehensive income are reclassi-fied to Net interest income or Non-interest income, as applicable, on the Consolidated Statement of Income in the period in which the hedged item affects income, and are reported in the same income statement line as the hedged item.
When a hedging instrument expires or is sold, or when a hedge no longer meets the criteria for hedge accounting, any cumulative gain or loss existing in other comprehensive income at that time remains in other comprehensive income until the forecasted transaction impacts the Consolidated Statement of Income. When a forecasted transaction is no longer expected to occur, the cumulative gain or loss that was reported in other comprehensive income is immediately reclassified to Net interest income or Non-interest income, as applicable, on the Consolidated Statement of Income.
Net Investment HedgesHedges of net investments in foreign operations are accounted for similar to cash flow hedges. The change in fair value on the hedging instrument relating to the effective portion is recognized in other comprehensive income. The change in fair value of the hedging instru-ment relating to the ineffective portion is recognized immediately on
SHARE CAPITALThe Bank classifies financial instruments that it issues as either financial liabilities, equity instruments, or compound instruments.
Issued instruments that are mandatorily redeemable or convertible into a variable number of the Bank’s common shares at the holder’s option are classified as liabilities on the Consolidated Balance Sheet. Dividend or interest payments on these instruments are recognized in interest expense in the Consolidated Statement of Income.
Issued instruments are classified as equity when there is no contrac-tual obligation to transfer cash or other financial assets. Further, issued instruments that are not mandatorily redeemable or that are not convertible into a variable number of the Bank’s common shares at the holder’s option, are classified as equity and presented in share capital. Incremental costs directly attributable to the issue of equity instruments are included in equity as a deduction from the proceeds, net of tax. Dividend payments on these instruments are recognized as a reduction in equity.
Compound instruments are comprised of both liability and equity components in accordance with the substance of the contractual arrangement. At inception, the fair value of the liability component is initially measured with any residual amount assigned to the equity component. Transaction costs are allocated proportionately to the liability and equity components.
Common or preferred shares held by the Bank are classified as treasury shares in equity, and the cost of these shares is recorded as a reduction in equity. Upon the sale of treasury shares, the difference between the sale proceeds and the cost of the shares is recorded in or against contributed surplus.
DERIVATIVES Derivatives are instruments that derive their value from changes in underlying interest rates, foreign exchange rates, credit spreads, commodity prices, equities, or other financial or non-financial measures. Such instruments include interest rate, foreign exchange, equity, commodity, and credit derivative contracts. The Bank uses these instruments for trading and non-trading purposes. Derivatives are carried at their fair value on the Consolidated Balance Sheet.
Derivatives Held for Trading PurposesThe Bank enters into trading derivative contracts to meet the needs of its customers, to enter into trading positions primarily to provide liquidity and market-making related activities, and in certain cases, to manage risks related to its trading portfolio. The realized and unrealized gains or losses on trading derivatives are recognized immediately in trading income (losses).
Derivatives Held for Non-trading PurposesNon-trading derivatives are primarily used to manage interest rate, foreign exchange, and other market risks of the Bank’s traditional banking activities. When derivatives are held for non-trading purposes and when the transactions meet the hedge accounting requirements of IAS 39, Financial Instruments: Recognition and Measurement (IAS 39), they are classified by the Bank as non-trading derivatives and receive hedge accounting treatment, as appropriate. Certain derivative instruments that are held for economic hedging purposes, and do not meet the hedge accounting requirements of IAS 39, are also classified as non-trading derivatives with the change in fair value of these derivatives recognized in non-interest income.
Hedging RelationshipsHedge AccountingAt the inception of a hedging relationship, the Bank documents the relationship between the hedging instrument and the hedged item, its risk management objective, and its strategy for undertaking the hedge. The Bank also requires a documented assessment, both at hedge inception and on an ongoing basis, of whether or not the derivatives that are used in hedging relationships are highly effective in offsetting the changes attributable to the hedged risks in the fair values or cash flows of the hedged items. In order to be considered effective, the hedging instrument and the hedged item must be highly and inversely correlated such that the changes in the fair value of the hedging instrument will substantially offset the effects of the hedged exposure

TD BANK GROUP ANNUAL REPORT 2015 F INANCIAL RESULTS126
transactions involving the same or similar instrument, without modifi-cation or repackaging, or is based on a valuation technique which maximizes the use of observable market inputs.
The Bank recognizes various types of valuation adjustments to account for factors that market participants would use in determining fair value which are not included in valuation techniques due to system limitations or measurement uncertainty. Valuation adjustments reflect the Bank’s assessment of factors that market participants would use in pricing the asset or liability. These include, but are not limited to, the unobservability of inputs used in the pricing model, or assumptions about risk, such as creditworthiness of each counterparty and risk premiums that market participants would require given the inherent risk in the pricing model.
If there is a difference between the initial transaction price and the value based on a valuation technique which includes observable market inputs, the difference is referred to as inception profit or loss. Inception profit or loss is recognized in income upon initial recognition of the instrument. When an instrument is measured using a valuation technique that utilizes significant non-observable inputs, it is initially valued at the transaction price, which is considered the best estimate of fair value. Subsequent to initial recognition, any difference between the transaction price and the value determined by the valuation tech-nique at initial recognition is recognized in income as non-observable inputs become observable.
If the fair value of a financial asset measured at fair value becomes negative, it is recognized as a financial liability until either its fair value becomes positive, at which time it is recognized as a financial asset, or until it is extinguished.
DERECOGNITION OF FINANCIAL INSTRUMENTSFinancial AssetsThe Bank derecognizes a financial asset when the contractual rights to that asset have expired. Derecognition may also be appropriate where the contractual right to receive future cash flows from the asset have been transferred, or where the Bank retains the rights to future cash flows from the asset, but assumes an obligation to pay those cash flows to a third party subject to certain criteria.
When the Bank transfers a financial asset, it is necessary to assess the extent to which the Bank has retained the risks and rewards of ownership of the transferred asset. If substantially all the risks and rewards of ownership of the financial asset have been retained, the Bank continues to recognize the financial asset and also recognizes a financial liability for the consideration received. Certain transaction costs incurred are also capitalized and amortized using EIRM. If substantially all the risks and rewards of ownership of the financial asset have been transferred, the Bank will derecognize the financial asset and recognize separately as assets or liabilities any rights and obligations created or retained in the transfer. The Bank determines whether substantially all the risk and rewards have been transferred by quantitatively comparing the variability in cash flows before and after the transfer. If the variability in cash flows does not change signif-icantly as a result of the transfer, the Bank has retained substantially all of the risks and rewards of ownership.
If the Bank neither transfers nor retains substantially all the risks and rewards of ownership of the financial asset, the Bank derecognizes the financial asset where it has relinquished control of the financial asset. The Bank is considered to have relinquished control of the financial asset where the transferee has the practical ability to sell the transferred financial asset. Where the Bank has retained control of the financial asset, it continues to recognize the financial asset to the extent of its continuing involvement in the financial asset. Under these circumstances, the Bank usually retains the rights to future cash flows relating to the asset through a residual interest and is exposed to some degree of risk associated with the financial asset.
The derecognition criteria are also applied to the transfer of part of an asset, rather than the asset as a whole, or to a group of similar financial assets in their entirety, when applicable. If transferring a part of an asset, it must be a specifically identified cash flow, a fully proportionate share of the asset, or a fully proportionate share of a specifically identified cash flow.
the Consolidated Statement of Income. Gains and losses accumulated in other comprehensive income are reclassified to the Consolidated Statement of Income upon the disposal or partial disposal of the investment in the foreign operation. The Bank designates derivatives and non-derivatives (such as foreign currency deposit liabilities) as hedging instruments in net investment hedges.
Embedded DerivativesDerivatives may be embedded in other financial instruments (the host instrument). Embedded derivatives are treated as separate derivatives when their economic characteristics and risks are not closely related to those of the host instrument, a separate instrument with the same terms as the embedded derivative would meet the definition of a derivative, and the combined contract is not held for trading or desig-nated at fair value through profit or loss. These embedded derivatives, which are bifurcated from the host contract, are recognized on the Consolidated Balance Sheet as Derivatives and measured at fair value with subsequent changes recognized in Non-interest income on the Consolidated Statement of Income.
TRANSLATION OF FOREIGN CURRENCIESThe Bank’s Consolidated Financial Statements are presented in Canadian dollars, which is the presentation currency of the Bank. Items included in the financial statements of each of the Bank’s entities are measured using their functional currency, which is the currency of the primary economic environment in which they operate.
Monetary assets and liabilities denominated in a currency that differs from an entity’s functional currency are translated into the functional currency of the entity at exchange rates prevailing at the balance sheet date. Non-monetary assets and liabilities are translated at historical exchange rates. Income and expenses are translated into an entity’s functional currency at average exchange rates prevailing throughout the year. Translation gains and losses are included in non-interest income except for available-for-sale equity securities where unrealized translation gains and losses are recorded in other comprehensive income until the asset is sold or becomes impaired.
Foreign-currency denominated subsidiaries are those with a functional currency other than Canadian dollars. For the purpose of translation into the Bank’s functional currency, all assets and liabilities are translated at exchange rates in effect at the balance sheet date and all income and expenses are translated at average exchange rates for the period. Unrealized translation gains and losses relating to these operations, net of gains or losses arising from net investment hedges of these positions and applicable income taxes, are included in other comprehensive income. Translation gains and losses accumulated in other comprehensive income are recognized on the Consolidated Statement of Income upon the disposal or partial disposal of the investment in the foreign operation. The investment balance of foreign entities accounted for by the equity method, including TD Ameritrade, is translated into Canadian dollars using the closing rate at the end of the period with exchange gains or losses recognized in other comprehensive income.
OFFSETTING OF FINANCIAL INSTRUMENTSFinancial assets and liabilities are offset, with the net amount presented on the Consolidated Balance Sheet, only if the Bank currently has a legally enforceable right to set off the recognized amounts, and intends either to settle on a net basis or to realize the asset and settle the liability simultaneously. In all other situations, assets and liabilities are presented on a gross basis.
DETERMINATION OF FAIR VALUEThe fair value of a financial instrument on initial recognition is normally the transaction price, such as the fair value of the consideration given or received. The best evidence of fair value is quoted prices in active markets. When financial assets and liabilities have offsetting market risks or credit risks, the Bank applies the portfolio exception, as described in Note 5, and uses mid-market prices as a basis for estab-lishing fair values for the offsetting risk positions and applies the most representative price within the bid-ask spread to the net open position, as appropriate. When there is no active market for the instrument, the fair value may be based on other observable current market
TD BANK GROUP ANNUAL REPORT 2015 F INANCIAL RESULTS 127
prices at which the securities were originally acquired or sold, plus accrued interest. Subsequently, the agreements are measured at amortized cost on the Consolidated Balance Sheet, plus accrued interest. Interest earned on reverse repurchase agreements and interest incurred on repurchase agreements is determined using the EIRM and is included in Interest income and Interest expense, respectively, on the Consolidated Statement of Income.
In security lending transactions, the Bank lends securities to a counter-party and receives collateral in the form of cash or securities. If cash collateral is received, the Bank records the cash along with an obliga-tion to return the cash as an obligation related to Securities sold under repurchase agreements on the Consolidated Balance Sheet. Where securities are received as collateral, the Bank does not record the collateral on the Consolidated Balance Sheet.
In securities borrowing transactions, the Bank borrows securities from a counterparty and pledges either cash or securities as collateral. If cash is pledged as collateral, the Bank records the transaction as securities purchased under reverse repurchase agreements on the Consolidated Balance Sheet. Securities pledged as collateral remain on the Bank’s Consolidated Balance Sheet.
Where securities are pledged or received as collateral, security borrowing fees and security lending income are recorded in Non-interest expenses and Non-interest income, respectively, on the Consolidated Statement of Income over the term of the transaction. Where cash is pledged or received as collateral, interest received or incurred is deter-mined using the EIRM and is included in Interest income and Interest expense, respectively, on the Consolidated Statement of Income.
Commodities purchased or sold with an agreement to sell or repur-chase the commodities at a later date at a fixed price, are also included in securities purchased under reverse repurchase agreements and obligations related to securities sold under repurchase agreements, respectively, if the derecognition criteria under IFRS are not met. These instruments are measured at fair value.
GOODWILLGoodwill represents the excess purchase price paid over the net fair value of identifiable assets and liabilities acquired in a business combination. Goodwill is carried at its initial cost less accumulated impairment losses.
Goodwill is allocated to a cash generating unit (CGU) or a group of CGUs that is expected to benefit from the synergies of the business combination, regardless of whether any assets acquired and liabilities assumed are assigned to the CGU or group of CGUs. A CGU is the smallest identifiable group of assets that generate cash flows largely independent of the cash inflows from other assets or groups of assets. Each CGU or group of CGUs, to which the goodwill is allocated, represents the lowest level within the Bank at which the goodwill is monitored for internal management purposes and is not larger than an operating segment.
Goodwill is assessed for impairment at least annually and when an event or change in circumstances indicates that the carrying amount may be impaired. When impairment indicators are present, the recoverable amount of the CGU or group of CGUs, which is the higher of its estimated fair value less costs to sell and its value-in-use, is determined. If the carrying amount of the CGU or group of CGUs is higher than its recoverable amount, an impairment loss exists. The impairment loss is recognized on the Consolidated Statement of Income and is applied to the goodwill balance. An impairment loss cannot be reversed in future periods.
INTANGIBLE ASSETSIntangible assets represent identifiable non-monetary assets and are acquired either separately or through a business combination, or inter-nally generated software. The Bank’s intangible assets consist primarily of core deposit intangibles, credit card related intangibles, and soft-ware intangibles. Intangible assets are initially recognized at fair value and are amortized over their estimated useful lives (3 to 20 years) proportionate to their expected economic benefits, except for software which is amortized over its estimated useful life (3 to 7 years) on a straight-line basis.
Securitization Securitization is the process by which financial assets are transformed into securities. The Bank securitizes financial assets by transferring those financial assets to a third party and as part of the securitization, certain financial assets may be retained and may consist of an interest-only strip and, in some cases, a cash reserve account (collectively referred to as “retained interests”). If the transfer qualifies for derecognition, a gain or loss is recognized immediately in other income after the effects of hedges on the assets sold, if applicable. The amount of the gain or loss is calculated as the difference between the carrying amount of the asset transferred and the sum of any cash proceeds received, including any financial asset received or financial liability assumed, and any cumulative gain or loss allocated to the transferred asset that had been recognized in other comprehensive income. To determine the value of the retained interest initially recorded, the previous carrying value of the transferred asset is allocated between the amount derec-ognized from the balance sheet and the retained interest recorded, in proportion to their relative fair values on the date of transfer. Subse-quent to initial recognition, as market prices are generally not available for retained interests, fair value is determined by estimating the present value of future expected cash flows using management’s best estimates of key assumptions that market participants would use in determining fair value. Refer to Note 3 for assumptions used by management in determining the fair value of retained interests. Retained interest is classified as trading securities with subsequent changes in fair value recorded in trading income.
Where the Bank retains the servicing rights, the benefits of servicing are assessed against market expectations. When the benefits of servicing are more than adequate, a servicing asset is recognized. Similarly, when the benefits of servicing are less than adequate, a servicing liability is recognized. Servicing assets and servicing liabilities are initially recog-nized at fair value and subsequently carried at amortized cost.
Financial LiabilitiesThe Bank derecognizes a financial liability when the obligation under the liability is discharged, cancelled, or expires. If an existing financial liability is replaced by another financial liability from the same lender on substantially different terms or where the terms of the existing liability are substantially modified, the original liability is derecognized and a new liability is recognized with the difference in the respective carrying amounts recognized on the Consolidated Statement of Income.
Securities Purchased Under Reverse Repurchase Agreements, Securities Sold Under Repurchase Agreements, and Securities Borrowing and LendingSecurities purchased under reverse repurchase agreements involve the purchase of securities by the Bank under agreements to resell the securities at a future date. These agreements are treated as collateral-ized lending transactions whereby the Bank takes possession of the purchased securities, but does not acquire the risks and rewards of ownership. The Bank monitors the market value of the purchased securities relative to the amounts due under the reverse repurchase agreements, and when necessary, requires transfer of additional collateral. In the event of counterparty default, the agreements provide the Bank with the right to liquidate the collateral held and offset the proceeds against the amount owing from the counterparty.
Obligations related to securities sold under repurchase agreements involve the sale of securities by the Bank to counterparties under agreements to repurchase the securities at a future date. These agree-ments do not result in the risks and rewards of ownership being relinquished and are treated as collateralized borrowing transactions. The Bank monitors the market value of the securities sold relative to the amounts due under the repurchase agreements, and when neces-sary, transfers additional collateral and may require counterparties to return collateral pledged. Certain transactions that do not meet derecognition criteria under IFRS are also included in obligations related to securities sold under repurchase agreements. Refer to Note 9 for further details.
Securities purchased under reverse repurchase agreements and obligations related to securities sold under repurchase agreements are initially recorded on the Consolidated Balance Sheet at the respective
TD BANK GROUP ANNUAL REPORT 2015 F INANCIAL RESULTS128
SHARE-BASED COMPENSATIONThe Bank grants share options to certain employees as compensation for services provided to the Bank. The Bank uses a binomial tree-based valuation option pricing model to estimate fair value for all share option compensation awards. The cost of the share options is based on the fair value estimated at the grant date and is recognized as compensation expense and contributed surplus over the service period required for employees to become fully entitled to the awards. This period is generally equal to the vesting period in addition to a period prior to the grant date. For the Bank’s share options, this period is generally equal to five years. When options are exercised, the amount initially recognized in the contributed surplus balance is reduced, with a corresponding increase in common shares.
The Bank has various other share-based compensation plans where certain employees are awarded share units equivalent to the Bank’s common shares as compensation for services provided to the Bank. The obligation related to share units is included in other liabilities. Compensation expense is recognized based on the fair value of the share units at the grant date adjusted for changes in fair value between the grant date and the vesting date, net of the effects of hedges, over the service period required for employees to become fully entitled to the awards. This period is generally equal to the vesting period, in addition to a period prior to the grant date. For the Bank’s share units, this period is generally equal to four years.
EMPLOYEE BENEFITSDefined Benefit PlansActuarial valuations are prepared at least every three years to deter-mine the present value of the projected benefit obligation related to the Bank’s principal pension and non-pension post-retirement benefit plans. In periods between actuarial valuations, an extrapolation is performed based on the most recent valuation completed. All actuarial gains and losses are recognized immediately in other comprehensive income, with cumulative gains and losses reclassified to retained earnings. Pension and non-pension post-retirement benefit expenses are determined based upon separate actuarial valuations using the projected benefit method pro-rated on service and management’s best estimates of discount rate, compensation increases, health care cost trend rate, and mortality rates, which are reviewed annually with the Bank’s actuaries. The discount rate used to value liabilities is based on long-term corporate AA bond yields as of the measurement date. The expense recognized includes the cost of benefits for employee service provided in the current year, net interest expense or income on the net defined benefit liability or asset, past service costs related to plan amendments, curtailments or settlements, and administrative costs. Plan amendment costs are recognized in the period of a plan amend-ment, irrespective of its vested status. Curtailments and settlements are recognized by the Bank when the curtailment or settlement occurs. A curtailment occurs when there is a significant reduction in the number of employees covered by the plan. A settlement occurs when the Bank enters into a transaction that eliminates all further legal or constructive obligation for part or all of the benefits provided under a defined benefit plan.
The fair value of plan assets and the present value of the projected benefit obligation are measured as at October 31. The net defined benefit asset or liability represents the difference between the cumula-tive actuarial gains and losses, expenses, and recognized contributions and is reported in other assets or other liabilities.
Net defined benefit assets recognized by the Bank are subject to a ceiling which limits the asset recognized on the Consolidated Balance Sheet to the amount that is recoverable through refunds of contribu-tions or future contribution holidays. In addition, where a regulatory funding deficit exists related to a defined benefit plan, the Bank is required to record a liability equal to the present value of all future cash payments required to eliminate that deficit.
Defined Contribution PlansFor defined contribution plans, annual pension expense is equal to the Bank’s contributions to those plans.
The Bank assesses its intangible assets for impairment on a quarterly basis. When impairment indicators are present, the recoverable amount of the asset, which is the higher of its estimated fair value less costs to sell and its value-in-use, is determined. If the carrying amount of the asset is higher than its recoverable amount, the asset is written down to its recoverable amount. An impairment loss is recognized on the Consolidated Statement of Income in the period in which the impair-ment is identified. Impairment losses recognized previously are assessed and reversed if the circumstances leading to the impairment are no longer present. Reversal of any impairment loss will not exceed the carrying amount of the intangible asset that would have been determined had no impairment loss been recognized for the asset in prior periods.
LAND, BUILDINGS, EQUIPMENT, AND OTHER DEPRECIABLE ASSETSLand is recognized at cost. Buildings, computer equipment, furniture and fixtures, other equipment, and leasehold improvements are recognized at cost less accumulated depreciation and provisions for impairment, if any. Gains and losses on disposal are included in Non-interest income on the Consolidated Statement of Income.
Assets leased under a finance lease are capitalized as assets and depreciated on a straight-line basis over the lesser of the lease term and the estimated useful life of the asset.
The Bank records the obligation associated with the retirement of a long-lived asset at fair value in the period in which it is incurred and can be reasonably estimated, and records a corresponding increase to the carrying amount of the asset. The asset is depreciated on a straight-line basis over its remaining useful life while the liability is accreted to reflect the passage of time until the eventual settlement of the obligation.
Depreciation is recognized on a straight-line basis over the useful lives of the assets estimated by asset category, as follows:
Asset Useful Life
Buildings 15 to 40 yearsComputer equipment 3 to 8 yearsFurniture and fixtures 3 to 15 yearsOther equipment 5 to 15 yearsLeasehold improvements Lesser of the remaining lease term and
the remaining useful life of the asset
The Bank assesses its depreciable assets for impairment on a quarterly basis. When impairment indicators are present, the recoverable amount of the asset, which is the higher of its estimated fair value less costs to sell and its value-in-use, is determined. If the carrying value of the asset is higher than its recoverable amount, the asset is written down to its recoverable amount. An impairment loss is recognized on the Consolidated Statement of Income in the period in which the impair-ment is identified. Impairment losses previously recognized are assessed and reversed if the circumstances leading to their impairment are no longer present. Reversal of any impairment loss will not exceed the carrying amount of the depreciable asset that would have been determined had no impairment loss been recognized for the asset in prior periods.
NON-CURRENT ASSETS HELD FOR SALEIndividual non-current assets (and disposal groups) are classified as held for sale if they are available for immediate sale in their present condition subject only to terms that are usual and customary for sales of such assets (or disposal groups), and their sale must be highly probable to occur within one year. For a sale to be highly probable, management must be committed to a sales plan and initiate an active program to market the sale of the non-current assets (disposal groups). Non-current assets (and disposal groups) classified as held for sale are measured at the lower of their carrying amount and fair value less costs to sell on the Consolidated Balance Sheet. Subsequent to its initial classification as held for sale, a non-current asset (and disposal group) is no longer depreciated or amortized, and any subsequent write-downs in fair value less costs to sell or such increases not in excess of cumulative write-downs, are recognized in Other income on the Consolidated Statement of Income.
TD BANK GROUP ANNUAL REPORT 2015 F INANCIAL RESULTS 129
SIGNIFICANT ACCOUNTING JUDGMENTS, ESTIMATES, AND ASSUMPTIONSN O T E 3
Held-to-Maturity SecuritiesImpairment losses are recognized on held-to-maturity securities if there is objective evidence of impairment as a result of one or more events that have occurred after initial recognition and the loss event(s) results in a decrease in the estimated cash flows of the instrument. The Bank reviews these securities at least quarterly for impairment at the coun-terparty-specific level. If there is no objective evidence of impairment at the counterparty-specific level then the security is grouped with other held-to-maturity securities with similar credit risk characteristics and collectively assessed for impairment, which considers losses incurred but not identified. A deterioration of credit quality is considered objective evidence of impairment. Other factors considered in the impairment assessment include the financial position and key financial indicators of the issuer, significant past and continued losses of the issuer, as well as breaches of contract, including default or delinquency in interest payments and loan covenant violations.
LoansA loan (including a debt security classified as a loan) is considered impaired when there is objective evidence that there has been a deterioration of credit quality subsequent to the initial recognition of the loan to the extent the Bank no longer has reasonable assurance as to the timely collection of the full amount of principal and interest. The Bank assesses loans for objective evidence of impairment individu-ally for loans that are individually significant, and collectively for loans that are not individually significant. The allowance for credit losses represents management’s best estimate of impairment incurred in the
The estimates used in the Bank’s accounting policies are essential to understanding its results of operations and financial condition. Some of the Bank’s policies require subjective, complex judgments and estimates as they relate to matters that are inherently uncertain. Changes in these judgments or estimates could have a significant impact on the Bank’s Consolidated Financial Statements. The Bank has established procedures to ensure that accounting policies are applied consistently and that the processes for changing methodolo-gies for determining estimates are well controlled and occur in an appropriate and systematic manner.
IMPAIRMENT OF FINANCIAL ASSETSAvailable-for-Sale SecuritiesImpairment losses are recognized on available-for-sale securities if there is objective evidence of impairment as a result of one or more events that have occurred after initial recognition and the loss event(s) results in a decrease in the estimated cash flows of the instrument. The Bank individually reviews these securities at least quarterly for the presence of these conditions. For available-for-sale equity securities, a significant or prolonged decline in fair value below cost is considered objective evidence of impairment. For available-for-sale debt securities, a deterioration of credit quality is considered objective evidence of impairment. Other factors considered in the impairment assessment include financial position and key financial indicators of the issuer of the instrument, significant past and continued losses of the issuer, as well as breaches of contract, including default or delinquency in interest payments and loan covenant violations.
Provisions are measured based on management’s best estimate of the consideration required to settle the obligation at the end of the reporting period, taking into account the risks and uncertainties surrounding the obligation. If the effect of the time value of money is material, provisions are measured at the present value of the expendi-ture expected to be required to settle the obligation, using a discount rate that reflects the current market assessment of the time value of money and the risks specific to the obligation. The increase in provi-sions due to the passage of time is recognized as interest expense.
INCOME TAXESIncome tax is comprised of current and deferred tax. Income tax is recognized on the Consolidated Statement of Income, except to the extent that it relates to items recognized in other comprehensive income or directly in equity, in which case the related taxes are also recognized in other comprehensive income or directly in equity, respectively.
Deferred tax is recognized on temporary differences between the carrying amounts of assets and liabilities on the Consolidated Balance Sheet and the amounts attributed to such assets and liabilities for tax purposes. Deferred tax assets and liabilities are determined based on the tax rates that are expected to apply when the assets or liabilities are reported for tax purposes. Deferred tax assets are recognized only when it is probable that sufficient taxable profit will be available in future periods against which deductible temporary differences may be utilized. Deferred tax liabilities are not recognized on temporary differ-ences arising on investments in subsidiaries, branches and associates, and interests in joint ventures if the Bank controls the timing of the reversal of the temporary difference and it is probable that the tempo-rary difference will not reverse in the foreseeable future.
The Bank records a provision for uncertain tax positions if it is prob-able that the Bank will have to make a payment to tax authorities upon their examination of a tax position. This provision is measured at the Bank’s best estimate of the amount expected to be paid. Provisions are reversed to income in the period in which management determines they are no longer required or as determined by statute.
INSURANCEPremiums for short-duration insurance contracts, net of reinsurance, primarily property and casualty, are deferred as unearned premiums and reported in non-interest income on a pro rata basis over the terms of the policies, except for contracts where the period of risk differs significantly from the contract period. Unearned premiums are reported in other liabilities, gross of premiums attributable to reinsurers. The reinsurers’ share is recognized as an asset in other assets. Premiums from life and health insurance policies are recognized as income when earned.
For property and casualty insurance, insurance claims and policy benefit liabilities represent current claims and estimates for future insur-ance policy claims related to insurable events occurring at or before the balance sheet date. These are determined by the appointed actuary in accordance with accepted actuarial practices and are reported as other liabilities. Expected claims and policy benefit liabilities are determined on a case-by-case basis and consider such variables as past loss experience, current claims trends and changes in the prevailing social, economic and legal environment. These liabilities are continually reviewed and, as experience develops and new information becomes known, the liabilities are adjusted as necessary. In addition to reported claims information, the liabilities recognized by the Bank include a provision to account for the future development of insurance claims, including insurance claims incurred but not reported by policyholders (IBNR). IBNR liabilities are evaluated based on historical development trends and actuarial methodologies for groups of claims with similar attributes. For life and health insurance, actuarial liabilities represent the present values of future policy cash flows as determined using standard actuarial valuation practices. Changes in actuarial liabilities are reported in insurance claims and related expenses.
PROVISIONS Provisions are recognized when the Bank has a present obligation (legal or constructive) as a result of a past event, the amount of which can be reliably estimated, and it is probable that an outflow of resources will be required to settle the obligation.

TD BANK GROUP ANNUAL REPORT 2015 F INANCIAL RESULTS130
of the risks and rewards of ownership of the financial asset, a decision must be made as to whether the Bank has retained control of the financial asset. Upon derecognition, the Bank will record a gain or loss on sale of those assets which is calculated as the difference between the carrying amount of the asset transferred and the sum of any cash proceeds received, including any financial asset received or financial liability assumed, and any cumulative gain or loss allocated to the transferred asset that had been recognized in other comprehensive income. In determining the fair value of any financial asset received, the Bank estimates future cash flows by relying on estimates of the amount of interest that will be collected on the securitized assets, the yield to be paid to investors, the portion of the securitized assets that will be prepaid before their scheduled maturity, expected credit losses, the cost of servicing the assets and the rate at which to discount these expected future cash flows. Actual cash flows may differ significantly from those estimated by the Bank. Retained interests are classified as trading securities and are initially recognized at relative fair value on the Bank’s Consolidated Balance Sheet. Subsequently, the fair value of retained interests recognized by the Bank is determined by estimating the present value of future expected cash flows using management’s best estimates of key assumptions including credit losses, prepayment rates, forward yield curves and discount rates, that are commensurate with the risks involved. Differences between the actual cash flows and the Bank’s estimate of future cash flows are recognized in income. These assumptions are subject to periodic review and may change due to significant changes in the economic environment.
GOODWILL AND OTHER INTANGIBLESThe fair value of the Bank’s cash generating unit (CGU) is determined from internally developed valuation models that consider various factors and assumptions such as forecasted earnings, growth rates, price-earnings multiples, discount rates, and terminal multiples. Management is required to use judgment in estimating the fair value of CGUs, and the use of different assumptions and estimates in the fair value calculations could influence the determination of the existence of impairment and the valuation of goodwill. Management believes that the assumptions and estimates used are reasonable and support-able. Where possible, fair values generated internally are compared to relevant market information. The carrying amounts of the Bank’s CGUs are determined by management using risk based capital models to adjust net assets and liabilities by CGU. These models consider various factors including market risk, credit risk, and operational risk, including investment capital (comprised of goodwill and other intangibles). Any unallocated capital not directly attributable to the CGUs is held within the Corporate segment. The Bank’s capital oversight committees provide oversight to the Bank’s capital allocation methodologies.
EMPLOYEE BENEFITSThe projected benefit obligation and expense related to the Bank’s pension and non-pension post-retirement benefit plans are determined using multiple assumptions that may significantly influence the value of these amounts. Actuarial assumptions including discount rates, compensation increases, health care cost trend rates, and mortality rates are management’s best estimates and are reviewed annually with the Bank’s actuaries. The Bank develops each assumption using relevant historical experience of the Bank in conjunction with market-related data and considers if the market-related data indicates there is any prolonged or significant impact on the assumptions. The discount rate used to measure plan obligations is based on long-term high quality corporate bond yields as at October 31. The other assumptions are also long-term estimates. All assumptions are subject to a degree of uncertainty. Differences between actual experiences and the assump-tions, as well as changes in the assumptions resulting from changes in future expectations, result in actuarial gains and losses which are recognized in other comprehensive income during the year and also impact expenses in future periods.
lending portfolios, including any off-balance sheet exposures, at the balance sheet date. Management exercises judgment as to the timing of designating a loan as impaired, the amount of the allowance required, and the amount that will be recovered once the borrower defaults. Changes in the amount that management expects to recover would have a direct impact on the provision for credit losses and may result in a change in the allowance for credit losses.
If there is no objective evidence of impairment for an individual loan, whether significant or not, the loan is included in a group of assets with similar credit risk characteristics and collectively assessed for impairment for losses incurred but not identified. In calculating the probable range of allowance for incurred but not identified credit losses, the Bank employs internally developed models that utilize parameters for probability of default, loss given default and exposure at default. Management’s judgment is used to determine the point within the range that is the best estimate of losses, based on an assessment of business and economic conditions, historical loss experi-ence, loan portfolio composition, and other relevant indicators that are not fully incorporated into the model calculation. Changes in these assumptions would have a direct impact on the provision for credit losses and may result in a change in the incurred but not identified allowance for credit losses.
FAIR VALUE MEASUREMENTThe fair value of financial instruments traded in active markets at the balance sheet date is based on their quoted market prices. For all other financial instruments not traded in an active market, fair value may be based on other observable current market transactions involving the same or similar instrument, without modification or repackaging, or is based on a valuation technique which maximizes the use of observable market inputs. Observable market inputs may include interest rate yield curves, foreign exchange rates, and option volatilities. Valuation techniques include comparisons with similar instruments where observable market prices exist, discounted cash flow analysis, option pricing models, and other valuation techniques commonly used by market participants.
For certain complex or illiquid financial instruments, fair value is determined using valuation techniques in which current market trans-actions or observable market inputs are not available. Determining which valuation technique to apply requires judgment. The valuation techniques themselves also involve some level of estimation and judg-ment. The judgments include liquidity considerations and model inputs such as volatilities, correlations, spreads, discount rates, pre-payment rates, and prices of underlying instruments. Any imprecision in these estimates can affect the resulting fair value.
The inherent nature of private equity investing is that the Bank’s valuation may change over time due to developments in the business underlying the investment. Such fluctuations may be significant depending on the nature of the factors going into the valuation methodology and the extent of change in those factors.
Judgment is also used in recording fair value adjustments to model valuations to account for measurement uncertainty when valuing complex and less actively traded financial instruments. If the market for a complex financial instrument develops, the pricing for this instrument may become more transparent, resulting in refinement of valuation models.
An analysis of fair values of financial instruments and further details as to how they are measured are provided in Note 5.
DERECOGNITIONCertain assets transferred may qualify for derecognition from the Bank’s Consolidated Balance Sheet. To qualify for derecognition certain key determinations must be made. A decision must be made as to whether the rights to receive cash flows from the financial assets have been retained or transferred and the extent to which the risks and rewards of ownership of the financial asset have been retained or transferred. If the Bank neither transfers nor retains substantially all
TD BANK GROUP ANNUAL REPORT 2015 F INANCIAL RESULTS 131
For life and health insurance, actuarial liabilities consider all future policy cash flows, including premiums, claims, and expenses required to administer the policies. The Bank’s mortality assumptions have been derived from a combination of its own experience and industry experi-ence. Policyholders may allow their policies to lapse by choosing not to continue to pay premiums. The Bank bases its estimates of future lapse rates on previous experience when available, or industry experience. Estimates of future policy administration expenses are based on the Bank’s previous and expected future experience.
To recognize the uncertainty in establishing these best estimates, to allow for possible deterioration in experience and to provide greater comfort that the actuarial liabilities are sufficient to pay future benefits, actuaries are required to include margins in some assumptions. A range of allowable margins is prescribed by the Canadian Institute of Actuaries relating to claims development, reinsurance recoveries and investment income variables. The impact of the margins is referred to as the provi-sion for adverse deviation. Expected claims and policy benefit liabilities are discounted using a discount rate that reflects the current market assessments of the time value of money and the risks specific to the obligation, as required by Canadian accepted actuarial practices, and makes explicit provision for adverse deviation.
CONSOLIDATION OF STRUCTURED ENTITIESManagement judgment is required when assessing whether the Bank should consolidate an entity, particularly complex entities. For instance, it may not be feasible to determine if the Bank controls an entity solely through an assessment of voting rights for certain structured entities. In this case, judgment is required to establish whether the Bank has decision-making power over the key relevant activities of the entity and whether the Bank has the ability to use that power to absorb significant variable returns from the entity. If it is determined that the Bank has both decision-making power and significant variable returns from the entity, judgment is also used to determine whether any such power is exercised by the Bank as principal, on its own behalf, or as agent, on behalf of another counterparty.
Assessing whether the Bank has decision-making power includes understanding the purpose and design of the entity in order to deter-mine its key economic activities. In this context, an entity’s key economic activities are those which predominantly impact the economic performance of the entity. When the Bank has the current ability to direct the entity’s key economic activities, it is considered to have decision-making power over the entity.
The Bank also evaluates its exposure to the variable returns of a structured entity in order to determine if it absorbs a significant proportion of the variable returns the entity is designed to create. As part of this evaluation, the Bank considers the purpose and design of the entity in order to determine whether it absorbs variable returns from the structured entity through its contractual holdings, which may take the form of securities issued by the entity, derivatives with the entity, or other arrangements such as guarantees, liquidity facilities, or lending commitments.
If the Bank has decision-making power over and absorbs significant variable returns from the entity it then determines if it is acting as prin-cipal or agent when exercising its decision-making power. Key factors considered include the scope of its decision-making powers; the rights of other parties involved with the entity, including any rights to remove the Bank as decision-maker or rights to participate in key decisions; whether the rights of other parties are exercisable in practice; and the variable returns absorbed by the Bank and by other parties involved with the entity. When assessing consolidation, a presumption exists that the Bank exercises decision-making power as principal if it is also exposed to significant variable returns, unless an analysis of the factors above indicates otherwise.
The decisions above are made with reference to the specific facts and circumstances relevant for the structured entity and related transaction(s) under consideration.
INCOME TAXES The Bank is subject to taxation in numerous jurisdictions. There are many transactions and calculations in the ordinary course of business for which the ultimate tax determination is uncertain. The Bank main-tains provisions for uncertain tax positions that it believes appropriately reflect the risk of tax positions under discussion, audit, dispute, or appeal with tax authorities, or which are otherwise considered to involve uncertainty. These provisions are made using the Bank’s best estimate of the amount expected to be paid based on an assessment of all relevant factors, which are reviewed at the end of each reporting period. However, it is possible that at some future date, an additional liability could result from audits by the relevant taxing authorities.
Deferred tax assets are recognized only when it is probable that sufficient taxable profit will be available in future periods against which deductible temporary differences may be utilized. The amount of the deferred tax asset recognized and considered realizable could, however, be reduced if projected income is not achieved due to various factors, such as unfavourable business conditions. If projected income is not expected to be achieved, the Bank would decrease its deferred tax assets to the amount that it believes can be realized. The magni-tude of the decrease is significantly influenced by the Bank’s forecast of future profit generation, which determines the extent to which it will be able to utilize the deferred tax assets.
PROVISIONSProvisions arise when there is some uncertainty in the timing or amount of a loss in the future. Provisions are based on the Bank’s best estimate of all expenditures required to settle its present obligations, considering all relevant risks and uncertainties, as well as, when mate-rial, the effect of the time value of money.
Many of the Bank’s provisions relate to various legal actions that the Bank is involved in during the ordinary course of business. Legal provisions require the involvement of both the Bank’s management and legal counsel when assessing the probability of a loss and estimating any monetary impact. Throughout the life of a provision, the Bank’s management or legal counsel may learn of additional information that may impact its assessments about the probability of loss or about the estimates of amounts involved. Changes in these assessments may lead to changes in the amount recorded for provisions. In addition, the actual costs of resolving these claims may be substantially higher or lower than the amounts recognized. The Bank reviews its legal provi-sions on a case-by-case basis after considering, among other factors, the progress of each case, the Bank’s experience, the experience of others in similar cases, and the opinions and views of legal counsel.
Certain of the Bank’s provisions relate to restructuring initiatives initiated by the Bank. Restructuring provisions require management’s best estimate, including forecasts of economic conditions. Throughout the life of a provision, the Bank may become aware of additional infor-mation that may impact the assessment of amounts to be incurred. Changes in these assessments may lead to changes in the amount recorded for provisions.
INSURANCEThe assumptions used in establishing the Bank’s insurance claims and policy benefit liabilities are based on best estimates of possible outcomes.
For property and casualty insurance, the ultimate cost of claims liabilities is estimated using a range of standard actuarial claims projection techniques in accordance with Canadian accepted actuarial practices. The main assumption underlying these techniques is that a company’s past claims development experience can be used to project future claims development and hence ultimate claims costs. As such, these methods extrapolate the development of paid and incurred losses, average costs per claim and claim numbers based on the observed development of earlier years and expected loss ratios. Additional qualitative judgment is used to assess the extent to which past trends may or may not apply in the future, in order to arrive at the estimated ultimate claims cost that present the most likely outcome taking account of all the uncertainties involved.
TD BANK GROUP ANNUAL REPORT 2015 F INANCIAL RESULTS132
CURRENT AND FUTURE CHANGES IN ACCOUNTING POLICIESN O T E 4
have a material impact on the financial position, cash flows, or earnings of the Bank and have been retained in the final version of IFRS 9, Financial Instruments (IFRS 9).
FUTURE CHANGES IN ACCOUNTING POLICIESThe IASB continues to make changes to IFRS to improve the overall quality of financial reporting. The Bank is actively monitoring all of the IASB’s projects that are relevant to the Bank’s financial reporting and accounting policies.
The following standards have been issued, but are not yet effective on the date of issuance of the Bank’s Consolidated Financial Statements. The Bank is currently assessing the impact of the application of these standards on the Consolidated Financial Statements and will adopt these standards when they become effective.
Financial InstrumentsIn July 2014, the IASB issued the final version of IFRS 9, which replaces the guidance in IAS 39. This final version includes requirements on: (1) Classification and measurement of financial assets and liabilities; (2) Impairment of financial assets; and (3) General hedge accounting. Accounting for macro hedging has been decoupled from IFRS 9. The Bank has an accounting policy choice to apply the hedge accounting requirements of IFRS 9 or IAS 39.
IFRS 9 is effective for annual periods beginning on or after January 1, 2018, and is to be applied retrospectively with certain exceptions. IFRS 9 does not require restatement of comparative period financial statements except in limited circumstances related to aspects of hedge accounting. Entities are permitted to restate comparatives as long as hindsight is not applied. In January 2015, OSFI issued the final version of the Advisory titled “Early adoption of IFRS 9 Financial Instruments for Domestic Systemically Important Banks”. All domestic systemically important banks (D-SIBs), including the Bank, are required to early adopt IFRS 9 for the annual period beginning on November 1, 2017. The adoption of IFRS 9 is a significant initiative for the Bank supported by a formal governance framework and a robust implementation plan.
Revenue from Contracts with CustomersIn May 2014, the IASB issued IFRS 15, Revenue from Contracts with Customers, which clarifies the principles for recognizing revenue and cash flows arising from contracts with customers. In July 2015, the IASB confirmed a one-year deferral of the effective date to annual periods beginning on or after January 1, 2018, which will be November 1, 2018 for the Bank, and is to be applied retrospectively. The Bank is currently assessing the impact of adopting this standard.
CURRENT CHANGES IN ACCOUNTING POLICYThe following new and amended standards have been adopted by the Bank.
Presentation – Offsetting Financial Assets and Financial Liabilities In December 2011, the IASB issued amendments to IAS 32, Financial Instruments: Presentation (the “IAS 32 amendments”), which clarified the existing requirements for offsetting financial assets and financial liabilities. These amendments are effective for annual periods begin-ning on or after January 1, 2014, which was November 1, 2014, for the Bank. The transition date for the Bank was November 1, 2013.
As a result of adopting the IAS 32 amendments, certain bilateral transactions related to reverse repurchase and repurchase agreements, and amounts receivable from or payable to brokers, dealers, and clients no longer qualified for offsetting under the new guidance. As at October 31, 2014, the IAS 32 amendments resulted in an increase in derivative assets and liabilities of $0.4 billion (November 1, 2013 – $0.5 billion), an increase in reverse repurchase and repurchase agree-ments of $7.5 billion (November 1, 2013 – $5.2 billion), and an increase in amounts receivable from or payable to brokers, dealers, and clients of $7.8 billion (November 1, 2013 – $5.3 billion).
LeviesIn May 2013, the IFRS Interpretations Committee (IFRIC), with the approval of the IASB, issued IFRIC 21, Levies (IFRIC 21). IFRIC 21 provides guidance on when to recognize a liability to pay a levy imposed by government, which is accounted for in accordance with IAS 37, Provisions, Contingent Liabilities and Contingent Assets. IFRIC 21 is effective for annual periods beginning on or after January 1, 2014, which was November 1, 2014, for the Bank.
IFRIC 21 changed the pattern and timing of recognition of certain levies paid by the Bank, in that it requires the obligation for these levies to be recognized at specific points in time in accordance with their applicable legislation. This change in timing of recognition did not have a material impact on the financial position, cash flows, or earnings of the Bank on an annual basis.
Novation of Derivatives and Continuation of Hedge AccountingIn June 2013, the IASB issued amendments to IAS 39, Financial Instru-ments: Recognition and Measurement (IAS 39), which provides relief from discontinuing hedge accounting when novation of a derivative designated as a hedge accounting instrument meets certain criteria. The IAS 39 amendments are effective for annual periods beginning on or after January 1, 2014, which was November 1, 2014, for the Bank, and have been applied retrospectively. The IAS 39 amendments did not
FAIR VALUE MEASUREMENTSN O T E 5
VALUATION GOVERNANCEValuation processes are guided by policies and procedures that are approved by senior management and subject matter experts. Senior Executive oversight over the valuation process is provided through vari-ous valuation-related committees. Further, the Bank has a number of additional controls in place, including an independent price verification process to ensure the accuracy of fair value measurements reported in the financial statements. The sources used for independent pricing comply with the standards set out in the approved valuation-related policies, which includes consideration of the reliability, relevancy, and timeliness of data.
Certain assets and liabilities, primarily financial instruments, are carried on the balance sheet at their fair value on a recurring basis. These financial instruments include trading loans and securities, assets and liabilities designated at fair value through profit or loss, instruments classified as available-for-sale, derivatives, certain securities purchased under reverse repurchase agreements, certain deposits classified as trading, securitization liabilities at fair value, obligations related to securities sold short, and certain obligations related to securities sold under repurchase agreements. All other financial assets and financial liabilities are carried at amortized cost.
TD BANK GROUP ANNUAL REPORT 2015 F INANCIAL RESULTS 133
LoansThe estimated fair value of loans carried at amortized cost, other than debt securities classified as loans, reflects changes in market price that have occurred since the loans were originated or purchased. For fixed-rate performing loans, estimated fair value is determined by discount-ing the expected future cash flows related to these loans at current market interest rates for loans with similar credit risks. For floating-rate performing loans, changes in interest rates have minimal impact on fair value since loans reprice to market frequently. On that basis, fair value is assumed to approximate carrying value. The fair value of loans is not adjusted for the value of any credit protection the Bank has purchased to mitigate credit risk.
At initial recognition, debt securities classified as loans do not include securities with quoted prices in active markets. When quoted market prices are not readily available, fair value is based on quoted market prices of similar securities, other third-party evidence or by using a valuation technique that maximizes the use of observable market inputs. If quoted prices in active markets subsequently become available, these are used to determine fair value for debt securities classified as loans.
The fair value of loans carried at fair value through profit or loss, which includes trading loans and loans designated at fair value through profit or loss, is determined using observable market prices, where available. Where the Bank is a market maker for loans traded in the secondary market, fair value is determined using executed prices, or prices for comparable trades. For those loans where the Bank is not a market maker, the Bank obtains broker quotes from other reputable dealers, and corroborates this information using valuation techniques or by obtaining consensus or composite prices from pricing services.
CommoditiesThe fair value of physical commodities is based on quoted prices in active markets, where available. The Bank also transacts in commodity derivative contracts which can be traded on an exchange or in OTC markets.
Derivative Financial InstrumentsThe fair value of exchange-traded derivative financial instruments is based on quoted market prices. The fair value of OTC derivative finan-cial instruments is estimated using well established valuation techniques, such as discounted cash flow techniques, the Black-Scholes model, and Monte Carlo simulation. The valuation models incorporate inputs that are observable in the market or can be derived from observable market data.
Prices derived by using models are recognized net of valuation adjustments. The inputs used in the valuation models depend on the type of derivative and the nature of the underlying instrument and are specific to the instrument being valued. Inputs can include, but are not limited to, interest rate yield curves, foreign exchange rates, dividend yield projections, commodity spot and forward prices, recovery rates, volatilities, spot prices, and correlation.
A credit risk valuation adjustment (CRVA) is recognized against the model value of OTC derivatives to account for the uncertainty that either counterparty in a derivative transaction may not be able to fulfill its obligations under the transaction. In determining CRVA, the Bank takes into account master netting agreements and collateral, and considers the creditworthiness of the counterparty and the Bank itself, in assessing potential future amounts owed to, or by the Bank.
In the case of defaulted counterparties, a specific provision is estab-lished to recognize the estimated realizable value, net of collateral held, based on market pricing in effect at the time the default is recognized. In these instances, the estimated realizable value is measured by discounting the expected future cash flows at an appropriate EIR immediately prior to impairment, after adjusting for the value of collateral. The fair value of non-trading derivatives is determined on the same basis as for trading derivatives.
METHODS AND ASSUMPTIONSThe Bank calculates fair values for measurement and disclosure purposes based on the following methods of valuation and assumptions:
Government and Government-Related SecuritiesThe fair value of Canadian government debt securities is based on quoted prices in active markets, where available. Where quoted prices are not available, valuation techniques such as discounted cash flow models may be used, which maximize the use of observable inputs such as government bond yield curves.
The fair value of U.S. federal and state government, as well as agency debt securities, is determined by reference to recent transac-tion prices, broker quotes, or third-party vendor prices. Brokers or third-party vendors may use a pool-specific valuation model to value these securities. Observable market inputs to the model include to-be-announced (TBA) market prices, the applicable indices, and metrics such as the coupon, maturity, and weighted-average maturity of the pool. Market inputs used in the valuation model include, but are not limited to, indexed yield curves and trading spreads.
The fair value of residential mortgage-backed securities is primarily based on broker quotes, third-party vendor prices, or other valuation techniques, such as the use of option-adjusted spread (OAS) models which include inputs such as prepayment rate assumptions related to the underlying collateral. Observable inputs include, but are not limited to, indexed yield curves and bid-ask spreads. Other inputs may include volatility assumptions derived using Monte Carlo simulations and take into account factors such as counterparty credit quality and liquidity.
Other Debt SecuritiesThe fair value of corporate and other debt securities, including debt securities reclassified from trading to available-for-sale, is primarily based on broker quotes, third-party vendor prices, or other valuation techniques, such as discounted cash flow techniques. Market inputs used in the valuation techniques or underlying third-party vendor prices or broker quotes include benchmark and government bond yield curves, credit spreads, and trade execution data.
Asset-backed securities are primarily fair valued using third-party vendor prices. The third-party vendor employs a valuation model which maximizes the use of observable inputs such as benchmark yield curves and bid-ask spreads. The model also takes into account relevant data about the underlying collateral, such as weighted-average terms to maturity and prepayment rate assumptions.
Equity SecuritiesThe fair value of equity securities is based on quoted prices in active markets, where available. Where quoted prices in active markets are not readily available, such as for private equity securities, or where there is a wide bid-offer spread, fair value is determined based on quoted market prices for similar securities or through valuation techniques, including discounted cash flow analysis, and multiples of earnings before taxes, depreciation and amortization, and other relevant valuation techniques.
If there are trading restrictions on the equity security held, a valua-tion adjustment is recognized against available prices to reflect the nature of the restriction. However, restrictions that are not part of the security held and represent a separate contractual arrangement that has been entered into by the Bank and a third party do not impact the fair value of the original instrument.
Retained InterestsRetained interests are classified as trading securities and are initially recognized at relative fair value. Subsequently, the fair value of retained interests recognized by the Bank is determined by estimating the present value of future expected cash flows using management’s best estimates of key assumptions including credit losses, prepayment rates, forward yield curves, and discount rates, that are commensurate with the risks involved. Differences between the actual cash flows and the Bank’s estimate of future cash flows are recognized in income. These assumptions are subject to periodic review and may change due to significant changes in the economic environment.
TD BANK GROUP ANNUAL REPORT 2015 F INANCIAL RESULTS134
Securities Purchased Under Reverse Repurchase Agreements and Obligations Related to Securities Sold under Repurchase AgreementsCommodities purchased or sold with an agreement to sell or repur-chase them at a later date at a fixed price are carried at fair value. The fair value of these agreements is based on valuation techniques such as discounted cash flow models which maximize the use of observable market inputs such as interest rate swap curves and commodity forward prices.
Subordinated Notes and DebenturesThe fair value of subordinated notes and debentures are based on quoted market prices for similar issues or current rates offered to the Bank for debt of equivalent credit quality and remaining maturity.
Other Financial Liabilities Designated at Fair ValueFor deposits designated at fair value through profit or loss, fair value is determined using discounted cash flow valuation techniques which maximize the use of observable market inputs such as benchmark yield curves. The Bank considers the impact of its own creditworthiness in the valuation of these deposits by reference to observable market inputs. The Bank currently issues mortgage loan commitments to its customers which allow them to lock in a fixed mortgage rate prior to their expected funding date. The Bank values loan commitments through the use of an option pricing model and with adjustments calculated using an expected funding ratio to arrive at the most repre-sentative fair value. The expected funding ratio represents the Bank’s best estimate, based on historical analysis, as to the amount of loan commitments that will actually fund. If commitment extensions are exercised by the borrower, the Bank will remeasure the written option at fair value.
Portfolio ExceptionIFRS 13 provides a measurement exception that allows an entity to determine the fair value of a group of financial assets and liabilities with offsetting risks based on the sale or transfer of its net exposure to a particular risk or risks. The Bank manages certain financial assets and financial liabilities, such as derivative assets and derivative liabilities on the basis of net exposure and applies the portfolio exception when determining the fair value of these financial assets and financial liabilities.
Fair Value of Assets and Liabilities not measured at Fair ValueThe fair value of assets and liabilities subsequently not measured at fair value include loans, deposits, certain securitization liabilities, certain securities purchased under reverse repurchase agreements, obligations relating to securities sold under repurchase agreements, and subordi-nated notes and debentures. For these instruments, fair values are calculated for disclosure purposes only, and the valuation techniques are disclosed above. In addition, the Bank has determined that the carrying value approximates the fair value for the following assets and liabilities as they are usually liquid floating rate financial instruments and are generally short term in nature: cash and due from banks, interest-bearing deposits with banks, customers’ liability under accep-tances, and acceptances.
The fair value of a derivative is partly a function of collateralization. The Bank uses the relevant overnight index swap curve to discount the cash flows for collateralized derivatives as most collateral is posted in cash and can be funded at the overnight rate.
In the fourth quarter of 2014, the Bank implemented funding valua-tion adjustment (FVA) in response to growing evidence that market implied funding costs and benefits are now considered in the pricing and fair valuation of uncollateralized derivatives. Some of the key drivers of FVA include the market implied cost of funding spread over the London Interbank Offered Rate (LIBOR) and the expected average exposure by counterparty. FVA is further adjusted to account for the extent to which the funding cost is incorporated into observed traded levels and to calibrate to the expected term of the trade.
The FVA applies to both assets and liabilities, but largely relates to uncollateralized derivative assets given the impact of the Bank’s own credit risk, which is a significant component of the funding costs, is already incorporated in the valuation of uncollateralized derivative liabilities through the application of debit valuation adjustments. The Bank will continue to monitor industry practice, and may refine the methodology and the products to which FVA applies to as market practices evolve.
DepositsThe estimated fair value of term deposits is determined by discounting the contractual cash flows using interest rates currently offered for deposits with similar terms.
For deposits with no defined maturities, the Bank considers fair value to equal carrying value, which is equivalent to the amount payable on the balance sheet date.
For trading deposits, fair value is determined using discounted cash flow valuation techniques which maximize the use of observable market inputs such as benchmark yield curves and foreign exchange rates. The Bank considers the impact of its own creditworthiness in the valuation of these deposits by reference to observable market inputs.
Securitization LiabilitiesThe fair value of securitization liabilities is based on quoted market prices or quoted market prices for similar financial instruments, where available. Where quoted prices are not available, fair value is determined using valuation techniques, which maximize the use of observable inputs, such as Canada Mortgage Bond (CMB) curves.
Obligations Related to Securities Sold ShortThe fair value of these obligations is based on the fair value of the underlying securities, which can include equity or debt securities. As these obligations are fully collateralized, the method used to determine fair value would be the same as that of the relevant underlying equity or debt securities.
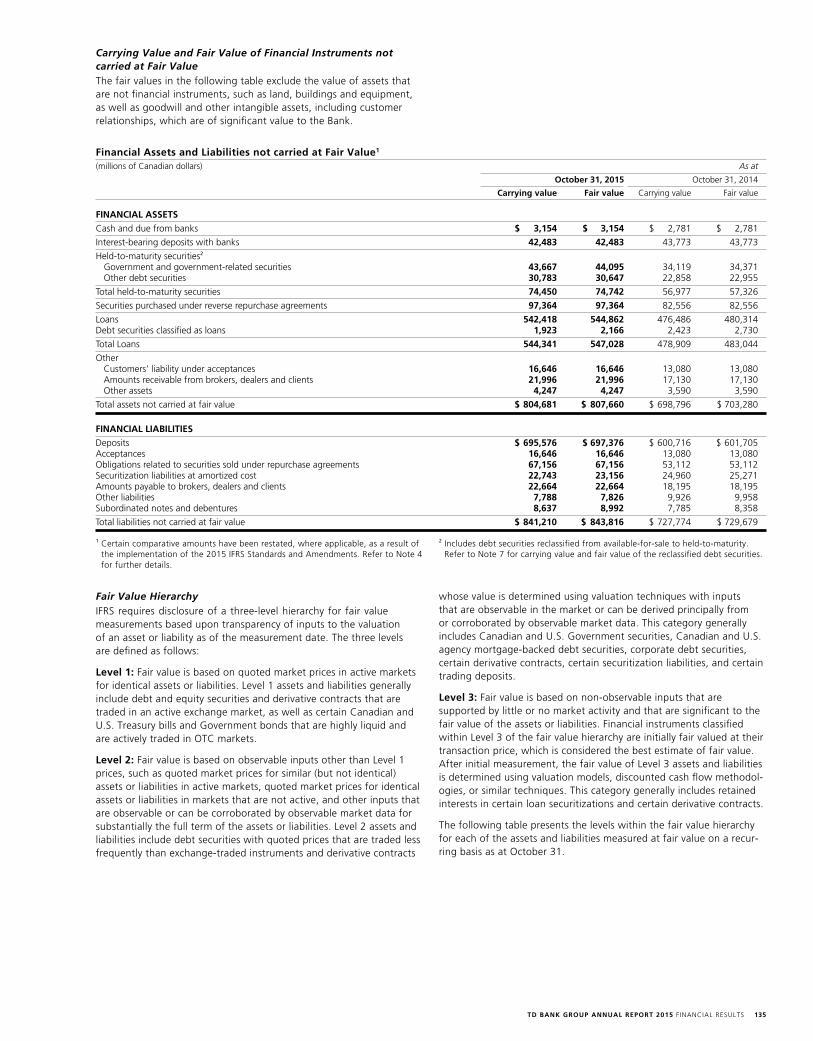
TD BANK GROUP ANNUAL REPORT 2015 F INANCIAL RESULTS 135
Financial Assets and Liabilities not carried at Fair Value1 (millions of Canadian dollars) As at
October 31, 2015 October 31, 2014
Carrying value Fair value Carrying value Fair value
FINANCIAL ASSETS
Cash and due from banks $ 3,154 $ 3,154 $ 2,781 $ 2,781
Interest-bearing deposits with banks 42,483 42,483 43,773 43,773
Held-to-maturity securities2 Government and government-related securities 43,667 44,095 34,119 34,371 Other debt securities 30,783 30,647 22,858 22,955
Total held-to-maturity securities 74,450 74,742 56,977 57,326
Securities purchased under reverse repurchase agreements 97,364 97,364 82,556 82,556
Loans 542,418 544,862 476,486 480,314 Debt securities classified as loans 1,923 2,166 2,423 2,730
Total Loans 544,341 547,028 478,909 483,044
Other Customers’ liability under acceptances 16,646 16,646 13,080 13,080 Amounts receivable from brokers, dealers and clients 21,996 21,996 17,130 17,130 Other assets 4,247 4,247 3,590 3,590
Total assets not carried at fair value $ 804,681 $ 807,660 $ 698,796 $ 703,280
FINANCIAL LIABILITIES
Deposits $ 695,576 $ 697,376 $ 600,716 $ 601,705 Acceptances 16,646 16,646 13,080 13,080 Obligations related to securities sold under repurchase agreements 67,156 67,156 53,112 53,112 Securitization liabilities at amortized cost 22,743 23,156 24,960 25,271 Amounts payable to brokers, dealers and clients 22,664 22,664 18,195 18,195 Other liabilities 7,788 7,826 9,926 9,958 Subordinated notes and debentures 8,637 8,992 7,785 8,358
Total liabilities not carried at fair value $ 841,210 $ 843,816 $ 727,774 $ 729,679
1 Certain comparative amounts have been restated, where applicable, as a result of the implementation of the 2015 IFRS Standards and Amendments. Refer to Note 4 for further details.
2 Includes debt securities reclassified from available-for-sale to held-to-maturity. Refer to Note 7 for carrying value and fair value of the reclassified debt securities.
Fair Value HierarchyIFRS requires disclosure of a three-level hierarchy for fair value measurements based upon transparency of inputs to the valuation of an asset or liability as of the measurement date. The three levels are defined as follows:
Level 1: Fair value is based on quoted market prices in active markets for identical assets or liabilities. Level 1 assets and liabilities generally include debt and equity securities and derivative contracts that are traded in an active exchange market, as well as certain Canadian and U.S. Treasury bills and Government bonds that are highly liquid and are actively traded in OTC markets.
Level 2: Fair value is based on observable inputs other than Level 1 prices, such as quoted market prices for similar (but not identical) assets or liabilities in active markets, quoted market prices for identical assets or liabilities in markets that are not active, and other inputs that are observable or can be corroborated by observable market data for substantially the full term of the assets or liabilities. Level 2 assets and liabilities include debt securities with quoted prices that are traded less frequently than exchange-traded instruments and derivative contracts
whose value is determined using valuation techniques with inputs that are observable in the market or can be derived principally from or corroborated by observable market data. This category generally includes Canadian and U.S. Government securities, Canadian and U.S. agency mortgage-backed debt securities, corporate debt securities, certain derivative contracts, certain securitization liabilities, and certain trading deposits.
Level 3: Fair value is based on non-observable inputs that are supported by little or no market activity and that are significant to the fair value of the assets or liabilities. Financial instruments classified within Level 3 of the fair value hierarchy are initially fair valued at their transaction price, which is considered the best estimate of fair value. After initial measurement, the fair value of Level 3 assets and liabilities is determined using valuation models, discounted cash flow methodol-ogies, or similar techniques. This category generally includes retained interests in certain loan securitizations and certain derivative contracts.
The following table presents the levels within the fair value hierarchy for each of the assets and liabilities measured at fair value on a recur-ring basis as at October 31.
Carrying Value and Fair Value of Financial Instruments not carried at Fair ValueThe fair values in the following table exclude the value of assets that are not financial instruments, such as land, buildings and equipment, as well as goodwill and other intangible assets, including customer relationships, which are of significant value to the Bank.

TD BANK GROUP ANNUAL REPORT 2015 F INANCIAL RESULTS136
Fair Value Hierarchy for Assets and Liabilities Measured at Fair Value on a Recurring Basis1
(millions of Canadian dollars) As at
October 31, 2015 October 31, 2014
Level 1 Level 2 Level 3 Total2 Level 1 Level 2 Level 3 Total2
FINANCIAL ASSETS AND COMMODITIESTrading loans, securities, and other Government and government-related securitiesCanadian government debt Federal $ 493 $ 11,560 $ – $ 12,053 $ 302 $ 12,229 $ – $ 12,531 Provinces – 6,121 24 6,145 – 5,454 – 5,454 U.S. federal, state, municipal governments,
and agencies debt 1 15,719 – 15,720 – 8,698 – 8,698 Other OECD government guaranteed debt – 4,194 5 4,199 – 3,427 – 3,427 Mortgage-backed securities – 1,019 – 1,019 – 789 – 789 Other debt securities Canadian issuers – 2,558 57 2,615 – 2,805 20 2,825 Other issuers – 7,359 191 7,550 – 6,128 66 6,194 Equity securities Common shares 28,933 447 186 29,566 40,695 5,172 4 45,871 Preferred shares 33 – 5 38 40 – – 40 Trading loans – 10,650 – 10,650 – 10,142 – 10,142 Commodities 5,410 154 – 5,564 5,154 – – 5,154 Retained interests – – 38 38 – – 48 48 34,870 59,781 506 95,157 46,191 54,844 138 101,173
Derivatives Interest rate contracts 2 27,968 – 27,970 2 23,420 – 23,422 Foreign exchange contracts 45 38,692 6 38,743 56 24,852 16 24,924 Credit contracts – 59 4 63 – 18 – 18 Equity contracts – 1,376 560 1,936 – 5,962 1,033 6,995 Commodity contracts 32 691 3 726 94 341 2 437
79 68,786 573 69,438 152 54,593 1,051 55,796
Financial assets designated at fair value through profit or loss
Securities 106 4,272 – 4,378 202 4,538 – 4,740 Loans – – – – – – 5 5
106 4,272 – 4,378 202 4,538 5 4,745
Available-for-sale securities Government and government-related securities Canadian government debt Federal – 14,431 – 14,431 199 8,205 – 8,404 Provinces – 7,185 – 7,185 – 4,494 51 4,545 U.S. federal, state, municipal governments,
and agencies debt – 22,585 – 22,585 – 12,130 – 12,130 Other OECD government guaranteed debt – 11,648 7 11,655 – 3,317 5 3,322 Mortgage-backed securities – 4,060 – 4,060 – 3,306 – 3,306 Other debt securities Asset-backed securities – 16,261 501 16,762 – 18,903 – 18,903 Non-agency collateralized mortgage obligation portfolio – 916 – 916 – 1,722 – 1,722 Corporate and other debt – 8,618 147 8,765 – 8,080 19 8,099 Equity securities Common shares3,4 177 100 1,575 1,852 210 242 1,303 1,755 Preferred shares 20 – 94 114 29 1 141 171 Debt securities reclassified from trading – 169 282 451 – 337 309 646 197 85,973 2,606 88,776 438 60,737 1,828 63,003 Securities purchased under reverse
repurchase agreements – 13,201 – 13,201 – 8,154 – 8,154
FINANCIAL LIABILITIES Trading deposits $ – $ 72,879 $ 1,880 $ 74,759 $ – $ 57,703 $ 1,631 $ 59,334 Derivatives Interest rate contracts 34 22,959 88 23,081 2 20,033 81 20,116 Foreign exchange contracts 25 30,588 5 30,618 43 22,975 14 23,032 Credit contracts – 290 – 290 – 325 – 325 Equity contracts 2 1,316 957 2,275 – 5,660 1,537 7,197 Commodity contracts 49 899 6 954 93 440 6 539
110 56,052 1,056 57,218 138 49,433 1,638 51,209
Securitization liabilities at fair value – 10,986 – 10,986 – 11,198 – 11,198
Other financial liabilities designated at fair value through profit or loss – 1,402 13 1,415 – 3,242 8 3,250
Obligations related to securities sold short 8,783 29,961 59 38,803 14,305 25,126 34 39,465
Obligations related to securities sold under repurchase agreements – 12,376 – 12,376 – 8,242 – 8,242
1 Certain comparative amounts have been restated, where applicable, as a result of the implementation of the 2015 IFRS Standards and Amendments. Refer to Note 4 for further details.
2 Fair value is the same as carrying value.3 As at October 31, 2015, the carrying values of certain available-for-sale equity
securities of $6 million (October 31, 2014 – $5 million) are assumed to approximate fair value in the absence of quoted market prices in an active market.
4 As at October 31, 2015, common shares include the fair value of Federal Reserve Stock and Federal Home Loan Bank stock of $1.3 billion (October 31, 2014 – $1.0 billion) which are redeemable by the issuer at cost for which cost approxi-mates fair value. These securities cannot be traded in the market, hence, these securities have not been subject to sensitivity analysis of Level 3 financial assets and liabilities.

TD BANK GROUP ANNUAL REPORT 2015 F INANCIAL RESULTS 137
The Bank’s policy is to record transfers of assets and liabilities between the different levels of the fair value hierarchy using the fair values as at the end of each reporting period. Assets are transferred between Level 1 and Level 2 depending on if there is sufficient frequency and volume in an active market.
There were no significant transfers between Level 1 and Level 2 during the years ended October 31, 2015, and October 31, 2014.
Movements of Level 3 instrumentsSignificant transfers into and out of Level 3 occur mainly due to the following reasons: • Transfers from Level 3 to Level 2 occur when techniques used for
valuing the instrument incorporate significant observable market inputs or broker-dealer quotes which were previously not observable.
• Transfers from Level 2 to Level 3 occur when an instrument’s fair value, which was previously determined using valuation techniques with significant observable market inputs, is now determined using valuation techniques with significant non-observable inputs.
Due to the unobservable nature of the inputs used to value Level 3 financial instruments there may be uncertainty about the valuation of these instruments. The fair value of Level 3 instruments may be drawn from a range of reasonably possible alternatives. In determining the appropriate levels for these unobservable inputs, parameters are chosen so that they are consistent with prevailing market evidence and management judgment.
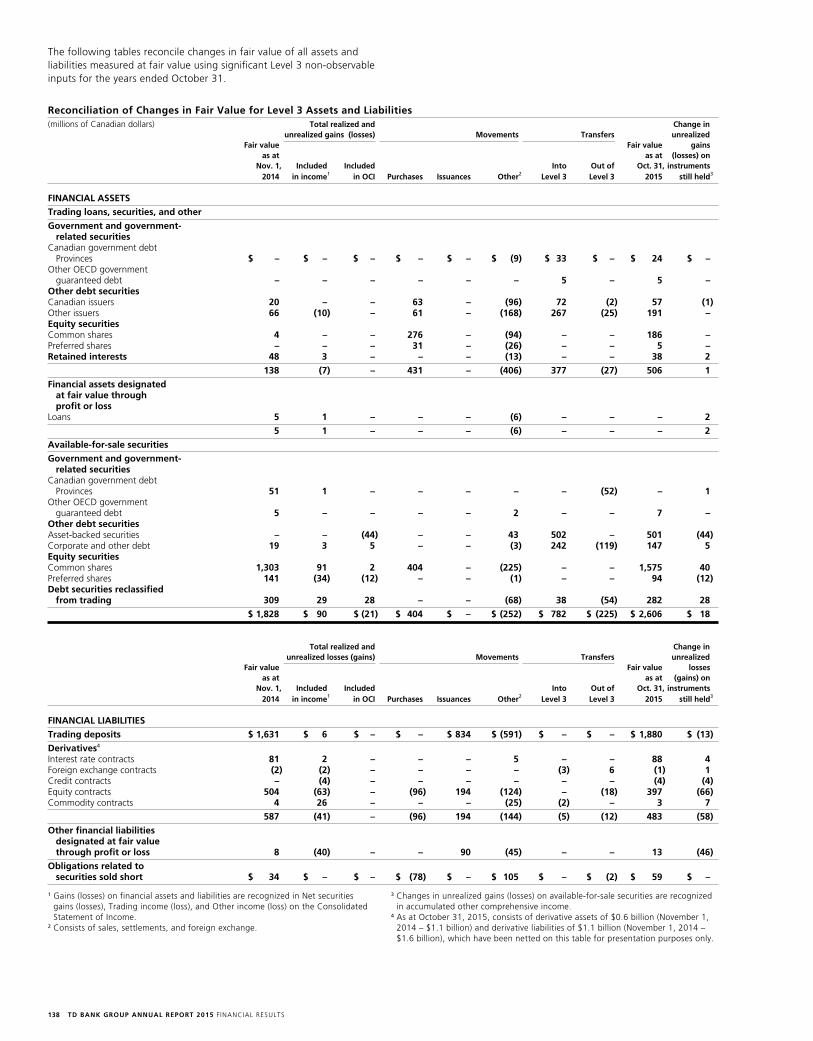
TD BANK GROUP ANNUAL REPORT 2015 F INANCIAL RESULTS138
The following tables reconcile changes in fair value of all assets and liabilities measured at fair value using significant Level 3 non-observable inputs for the years ended October 31.
Reconciliation of Changes in Fair Value for Level 3 Assets and Liabilities(millions of Canadian dollars) Total realized and Change in unrealized gains (losses) unrealized Movements Transfers Fair value Fair value gains as at as at (losses) on Nov. 1, Included Included Into Out of Oct. 31, instruments 2014 in income1 in OCI Purchases Issuances Other2 Level 3 Level 3 2015 still held3
FINANCIAL ASSETS
Trading loans, securities, and other
Government and government- related securities
Canadian government debt Provinces $ – $ – $ – $ – $ – $ (9) $ 33 $ – $ 24 $ –
Other OECD government guaranteed debt – – – – – – 5 – 5 –
Other debt securities Canadian issuers 20 – – 63 – (96) 72 (2) 57 (1) Other issuers 66 (10) – 61 – (168) 267 (25) 191 – Equity securities Common shares 4 – – 276 – (94) – – 186 – Preferred shares – – – 31 – (26) – – 5 – Retained interests 48 3 – – – (13) – – 38 2
138 (7) – 431 – (406) 377 (27) 506 1
Financial assets designated at fair value through profit or loss
Loans 5 1 – – – (6) – – – 2
5 1 – – – (6) – – – 2
Available-for-sale securities
Government and government- related securities
Canadian government debt Provinces 51 1 – – – – – (52) – 1
Other OECD government guaranteed debt 5 – – – – 2 – – 7 –
Other debt securitiesAsset-backed securities – – (44) – – 43 502 – 501 (44) Corporate and other debt 19 3 5 – – (3) 242 (119) 147 5 Equity securities Common shares 1,303 91 2 404 – (225) – – 1,575 40 Preferred shares 141 (34) (12) – – (1) – – 94 (12) Debt securities reclassified
from trading 309 29 28 – – (68) 38 (54) 282 28
$ 1,828 $ 90 $ (21) $ 404 $ – $ (252) $ 782 $ (225) $ 2,606 $ 18
Total realized and Change in unrealized losses (gains) unrealized Movements Transfers Fair value Fair value losses as at as at (gains) on Nov. 1, Included Included Into Out of Oct. 31, instruments 2014 in income1 in OCI Purchases Issuances Other2 Level 3 Level 3 2015 still held3
FINANCIAL LIABILITIES
Trading deposits $ 1,631 $ 6 $ – $ – $ 834 $ (591) $ – $ – $ 1,880 $ (13)
Derivatives4
Interest rate contracts 81 2 – – – 5 – – 88 4 Foreign exchange contracts (2) (2) – – – – (3) 6 (1) 1 Credit contracts – (4) – – – – – – (4) (4) Equity contracts 504 (63) – (96) 194 (124) – (18) 397 (66) Commodity contracts 4 26 – – – (25) (2) – 3 7
587 (41) – (96) 194 (144) (5) (12) 483 (58)
Other financial liabilities designated at fair value through profit or loss 8 (40) – – 90 (45) – – 13 (46)
Obligations related to securities sold short $ 34 $ – $ – $ (78) $ – $ 105 $ – $ (2) $ 59 $ –
1 Gains (losses) on financial assets and liabilities are recognized in Net securities gains (losses), Trading income (loss), and Other income (loss) on the Consolidated Statement of Income.
2 Consists of sales, settlements, and foreign exchange.
3 Changes in unrealized gains (losses) on available-for-sale securities are recognized in accumulated other comprehensive income.
4 As at October 31, 2015, consists of derivative assets of $0.6 billion (November 1, 2014 – $1.1 billion) and derivative liabilities of $1.1 billion (November 1, 2014 – $1.6 billion), which have been netted on this table for presentation purposes only.
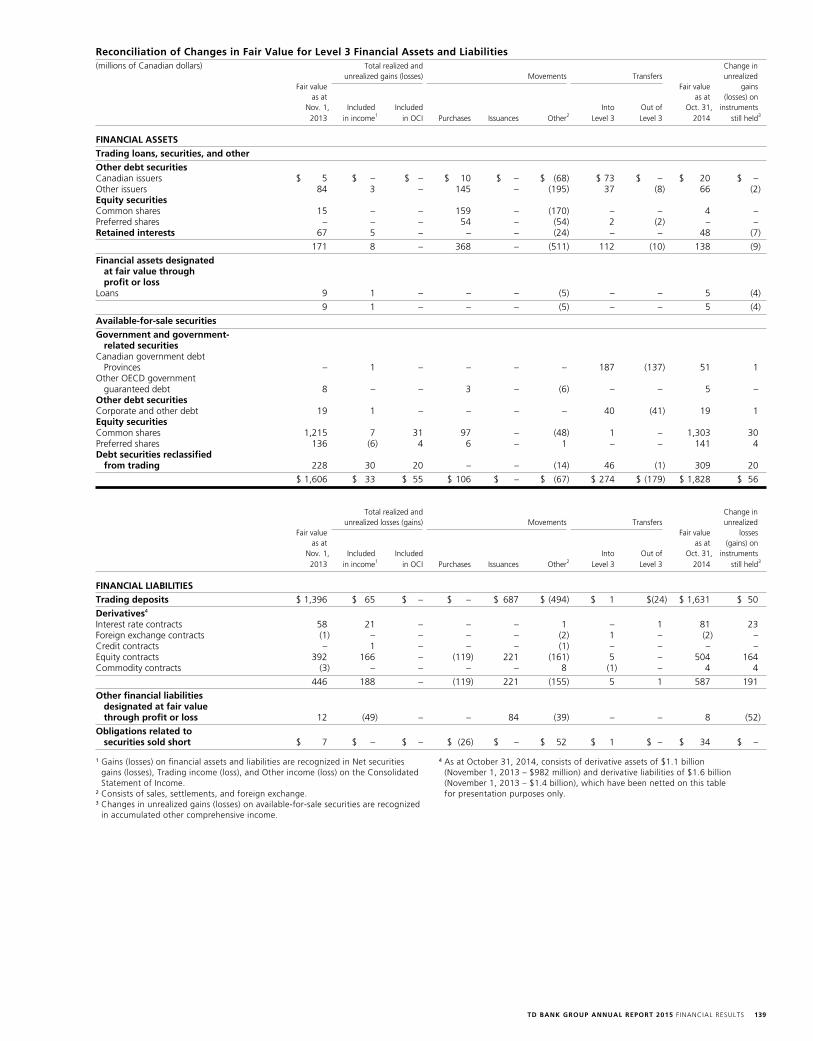
TD BANK GROUP ANNUAL REPORT 2015 F INANCIAL RESULTS 139
Reconciliation of Changes in Fair Value for Level 3 Financial Assets and Liabilities(millions of Canadian dollars) Total realized and Change in unrealized gains (losses) unrealized Movements Transfers Fair value Fair value gains as at as at (losses) on Nov. 1, Included Included Into Out of Oct. 31, instruments 2013 in income1 in OCI Purchases Issuances Other2 Level 3 Level 3 2014 still held3
FINANCIAL ASSETS
Trading loans, securities, and other
Other debt securitiesCanadian issuers $ 5 $ – $ – $ 10 $ – $ (68) $ 73 $ – $ 20 $ – Other issuers 84 3 – 145 – (195) 37 (8) 66 (2) Equity securities Common shares 15 – – 159 – (170) – – 4 – Preferred shares – – – 54 – (54) 2 (2) – – Retained interests 67 5 – – – (24) – – 48 (7)
171 8 – 368 – (511) 112 (10) 138 (9)
Financial assets designated at fair value through profit or loss
Loans 9 1 – – – (5) – – 5 (4)
9 1 – – – (5) – – 5 (4)
Available-for-sale securities
Government and government- related securities
Canadian government debt Provinces – 1 – – – – 187 (137) 51 1
Other OECD government guaranteed debt 8 – – 3 – (6) – – 5 –
Other debt securities Corporate and other debt 19 1 – – – – 40 (41) 19 1 Equity securities Common shares 1,215 7 31 97 – (48) 1 – 1,303 30 Preferred shares 136 (6) 4 6 – 1 – – 141 4 Debt securities reclassified
from trading 228 30 20 – – (14) 46 (1) 309 20
$ 1,606 $ 33 $ 55 $ 106 $ – $ (67) $ 274 $ (179) $ 1,828 $ 56
Total realized and Change in unrealized losses (gains) unrealized Movements Transfers Fair value Fair value losses as at as at (gains) on Nov. 1, Included Included Into Out of Oct. 31, instruments 2013 in income1 in OCI Purchases Issuances Other2 Level 3 Level 3 2014 still held3
FINANCIAL LIABILITIES
Trading deposits $ 1,396 $ 65 $ – $ – $ 687 $ (494) $ 1 $ (24) $ 1,631 $ 50
Derivatives4 Interest rate contracts 58 21 – – – 1 – 1 81 23 Foreign exchange contracts (1) – – – – (2) 1 – (2) – Credit contracts – 1 – – – (1) – – – – Equity contracts 392 166 – (119) 221 (161) 5 – 504 164 Commodity contracts (3) – – – – 8 (1) – 4 4
446 188 – (119) 221 (155) 5 1 587 191
Other financial liabilities designated at fair value through profit or loss 12 (49) – – 84 (39) – – 8 (52)
Obligations related to securities sold short $ 7 $ – $ – $ (26) $ – $ 52 $ 1 $ – $ 34 $ –
1 Gains (losses) on financial assets and liabilities are recognized in Net securities gains (losses), Trading income (loss), and Other income (loss) on the Consolidated Statement of Income.
2 Consists of sales, settlements, and foreign exchange.3 Changes in unrealized gains (losses) on available-for-sale securities are recognized
in accumulated other comprehensive income.
4 As at October 31, 2014, consists of derivative assets of $1.1 billion (November 1, 2013 – $982 million) and derivative liabilities of $1.6 billion (November 1, 2013 – $1.4 billion), which have been netted on this table for presentation purposes only.
TD BANK GROUP ANNUAL REPORT 2015 F INANCIAL RESULTS140
Implied VolatilityImplied volatility is the value of the volatility of the underlying instrument which, when input in an option pricing model, such as Black-Scholes, will return a theoretical value equal to the current market price of the option. Implied volatility is a forward-looking and subjective measure, and differs from historical volatility because the latter is calculated from known past returns of a security.
Funding ratioThe funding ratio is a significant unobservable input required to value mortgage commitments issued by the Bank. The funding ratio represents an estimate of percentage of commitments that are ultimately funded by the Bank. The funding ratio is based on a number of factors such as observed historical funding percentages within the various lending channels and the future economic outlook, considering factors including, but not limited to, competitive pricing and fixed/variable mortgage rate gap. An increase/(decrease) in funding ratio will increase/(decrease) the value of the lending commitment in relationship to prevailing interest rates.
Earnings Multiple, Discount Rate, and Liquidity Discount Earnings multiple, discount rate, and liquidity discount are significant inputs used when valuing certain equity securities and certain retained interests. Earnings multiples are selected based on comparable entities and a higher multiple will result in a higher fair value. Discount rates are applied to cash flow forecasts to reflect time value of money and the risks associated with the cash flows. A higher discount rate will result in a lower fair value. Liquidity discounts may be applied as a result of the difference in liquidity between the comparable entity and the equity securities being valued.
Currency Specific Swap CurveThe fair value of foreign exchange contracts is determined using inputs such as foreign exchange spot rates and swap curves. Generally swap curves are observable, but there may be certain durations or currency specific foreign exchange spot and currency specific swap curves that are not observable.
Dividend YieldDividend yield is a key input for valuing equity contracts and is generally expressed as a percentage of the current price of the stock. Dividend yields can be derived from the repo or forward price of the actual stock being fair valued. Spot dividend yields can also be obtained from pricing sources, if it can be demonstrated that spot yields are a good indication of future dividends.
Inflation Rate Swap CurveThe fair value of inflation rate swap contracts is a swap between the interest rate curve and the inflation Index. The inflation rate swap spread is not observable and is determined using proxy inputs such as inflation index rates and Consumer Price Index (CPI) bond yields. Generally swap curves are observable; however, there may be instances where certain specific swap curves are not observable.
VALUATION OF ASSETS AND LIABILITIES CLASSIFIED AS LEVEL 3Significant unobservable inputs in Level 3 positionsThe following section discusses the significant unobservable inputs for Level 3 positions and assesses the potential effect that a change in each observable input may have on the fair value measurement.
Price EquivalentCertain financial instruments, mainly debt and equity securities, are valued using price equivalents when market prices are not available, with fair value measured by comparison with observable pricing data from instruments with similar characteristics. For debt securities, the price equivalent is expressed in ‘points’, and represents a percentage of the par amount, and prices at the lower end of the range are generally a result of securities that are written down. For equity securi-ties, the price equivalent is based on a percentage of a proxy price. There may be wide ranges depending on the liquidity of the securities. New issuances of debt and equity securities are priced at 100% of the issue price.
Credit SpreadCredit spread is a significant input used in the valuation of many derivatives. It is the primary reflection of the creditworthiness of a counterparty and represents the premium or yield return above the benchmark reference that a bond holder would require in order to allow for the credit quality difference between the entity and the reference benchmark. An increase/(decrease) in credit spread will (decrease)/increase the value of financial instrument. Credit spread may be negative where the counterparty is more credit worthy than the benchmark against which the spread is calculated. A wider credit spread represents decreasing creditworthiness.
Prepayment Rate and Liquidation RateExpected future prepayment and liquidation rates are significant inputs for retained interests and represent the amount of unscheduled principal repayment. The prepayment rate and liquidation rate will be obtained from prepayment forecasts which are based on a number of factors such as historical prepayment rates for similar pool loans and the future economic outlook, considering factors including, but not limited to, future interest rates.
CorrelationThe movements of inputs are not necessarily independent from other inputs. Such relationships, where material to the fair value of a given instrument, are captured via correlation inputs into the pricing models. The Bank includes correlation between the asset class, as well as across asset classes. For example, price correlation is the relationship between prices of equity securities in equity basket derivatives, and quanto correlation is the relationship between instruments which settle in one currency and the underlying securities which are denominated in another currency.

TD BANK GROUP ANNUAL REPORT 2015 F INANCIAL RESULTS 141
techniques used to measure fair value, the significant inputs used in the valuation technique that are considered unobservable, and a range of values for those unobservable inputs. The range of values represents the highest and lowest inputs used in calculating the fair value.
Valuation techniques and inputs used in the fair value measurement of Level 3 assets and liabilitiesThe following tables present the Bank’s assets and liabilities recognized at fair value and classified as Level 3, together with the valuation
Valuation Techniques and Inputs Used in the Fair Value Measurement of Level 3 Assets and Liabilities As at
October 31, 2015 October 31, 2014
Significant Valuation unobservable Lower Upper Lower Upper technique inputs (Level 3) range range range range Unit
Government and government- related securities Market comparable Bond price equivalent 55 136 100 101 points
Other debt securities Market comparable Bond price equivalent – 128 – 132 points
Equity securities1 Market comparable New issue price 100 100 100 100 % Discounted cash flow Discount rate 8 20 1 23 % EBITDA multiple Earnings multiple 4.6 22 5.3 25 times Market comparable Price equivalent 52 117 78 118 %
Retained interests Discounted cash flow Prepayment and liquidation rates – – – 10 %
Discount rates 280 360 326 427 bps2
Other financial assets designated at fair value through profit or loss Market comparable Bond price equivalent n/a3 n/a3 105 105 points
Derivatives Interest rate contracts Swaption model Currency specific volatility 17 292 8 188 % Discounted cash flow Inflation rate swap curve 1 2 1 2 %
Foreign exchange contracts Option model Currency specific volatility 8 12 6 18 %
Credit contracts Discounted cash flow Credit spread 7 55 5 103 bps2 Equity contracts Option model Price correlation 10 90 14 85 % Quanto correlation (38) 17 (40) 17 % Dividend yield – 12 – 11 % Equity volatility 6 94 11 80 %
Commodity contracts Option model Quanto correlation (45) (25) (45) (25) % Swaption correlation 24 36 34 46 % Trading deposits Option model Price correlation (23) 98 – 98 % Quanto correlation (38) 17 (45) 18 % Dividend yield – 14 – 11 % Equity volatility 6 116 10 68 % Swaption model Currency specific volatility 17 292 8 188 %
Other financial liabilities designated at fair value through profit or loss Option model Funding ratio 1 72 3 72 %
Obligations related to securities sold short Market comparable New issue price 100 100 100 100 %
1 As at October 31, 2015, common shares exclude the fair value of Federal Reserve stock and Federal Home Loan Bank stock of $1.3 billion (October 31, 2014 – $1.0 billion) which are redeemable by the issuer at cost which approximates fair value. These securities cannot be traded in the market, hence, these securities have not been subjected to the sensitivity analysis.
2 Basis points.3 Not applicable.
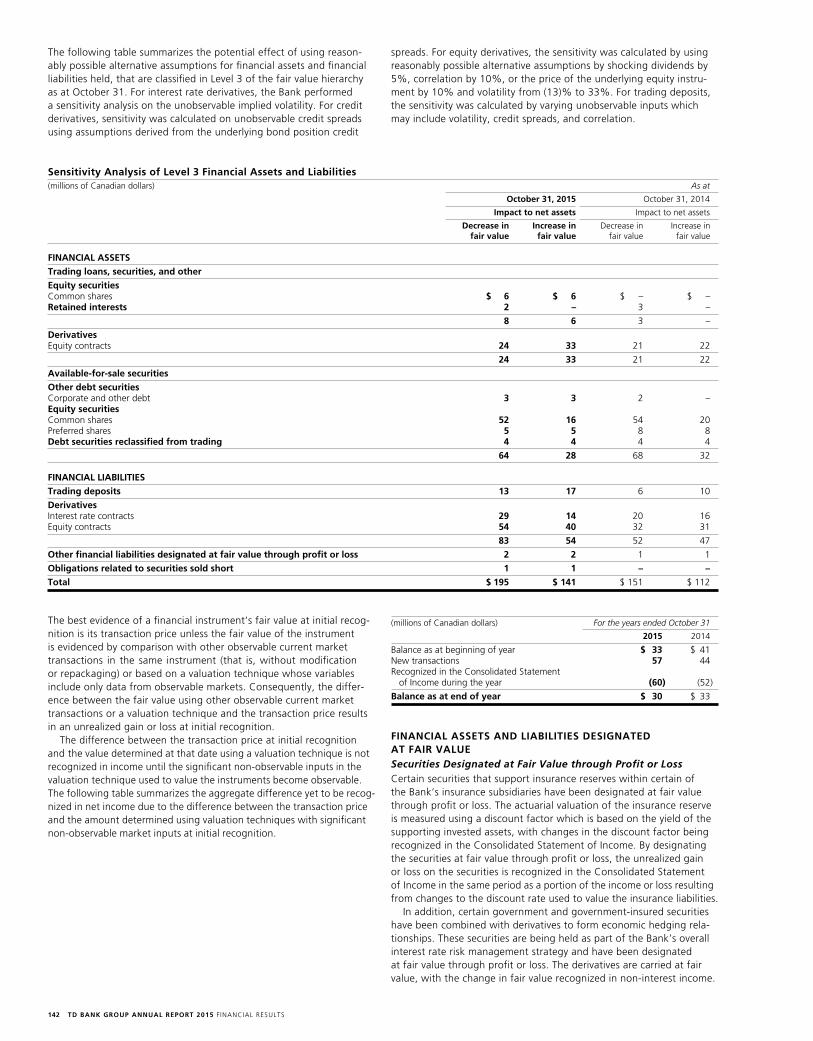
TD BANK GROUP ANNUAL REPORT 2015 F INANCIAL RESULTS142
spreads. For equity derivatives, the sensitivity was calculated by using reasonably possible alternative assumptions by shocking dividends by 5%, correlation by 10%, or the price of the underlying equity instru-ment by 10% and volatility from (13)% to 33%. For trading deposits, the sensitivity was calculated by varying unobservable inputs which may include volatility, credit spreads, and correlation.
The following table summarizes the potential effect of using reason-ably possible alternative assumptions for financial assets and financial liabilities held, that are classified in Level 3 of the fair value hierarchy as at October 31. For interest rate derivatives, the Bank performed a sensitivity analysis on the unobservable implied volatility. For credit derivatives, sensitivity was calculated on unobservable credit spreads using assumptions derived from the underlying bond position credit
Sensitivity Analysis of Level 3 Financial Assets and Liabilities(millions of Canadian dollars) As at
October 31, 2015 October 31, 2014
Impact to net assets Impact to net assets
Decrease in Increase in Decrease in Increase in fair value fair value fair value fair value
FINANCIAL ASSETS
Trading loans, securities, and other
Equity securitiesCommon shares $ 6 $ 6 $ – $ – Retained interests 2 – 3 –
8 6 3 –
DerivativesEquity contracts 24 33 21 22
24 33 21 22
Available-for-sale securities
Other debt securitiesCorporate and other debt 3 3 2 – Equity securitiesCommon shares 52 16 54 20 Preferred shares 5 5 8 8 Debt securities reclassified from trading 4 4 4 4
64 28 68 32
FINANCIAL LIABILITIES
Trading deposits 13 17 6 10
DerivativesInterest rate contracts 29 14 20 16 Equity contracts 54 40 32 31
83 54 52 47
Other financial liabilities designated at fair value through profit or loss 2 2 1 1
Obligations related to securities sold short 1 1 – –
Total $ 195 $ 141 $ 151 $ 112
(millions of Canadian dollars) For the years ended October 31
2015 2014
Balance as at beginning of year $ 33 $ 41New transactions 57 44Recognized in the Consolidated Statement
of Income during the year (60) (52)
Balance as at end of year $ 30 $ 33
FINANCIAL ASSETS AND LIABILITIES DESIGNATED AT FAIR VALUESecurities Designated at Fair Value through Profit or LossCertain securities that support insurance reserves within certain of the Bank’s insurance subsidiaries have been designated at fair value through profit or loss. The actuarial valuation of the insurance reserve is measured using a discount factor which is based on the yield of the supporting invested assets, with changes in the discount factor being recognized in the Consolidated Statement of Income. By designating the securities at fair value through profit or loss, the unrealized gain or loss on the securities is recognized in the Consolidated Statement of Income in the same period as a portion of the income or loss resulting from changes to the discount rate used to value the insurance liabilities.
In addition, certain government and government-insured securities have been combined with derivatives to form economic hedging rela-tionships. These securities are being held as part of the Bank’s overall interest rate risk management strategy and have been designated at fair value through profit or loss. The derivatives are carried at fair value, with the change in fair value recognized in non-interest income.
The best evidence of a financial instrument’s fair value at initial recog-nition is its transaction price unless the fair value of the instrument is evidenced by comparison with other observable current market transactions in the same instrument (that is, without modification or repackaging) or based on a valuation technique whose variables include only data from observable markets. Consequently, the differ-ence between the fair value using other observable current market transactions or a valuation technique and the transaction price results in an unrealized gain or loss at initial recognition.
The difference between the transaction price at initial recognition and the value determined at that date using a valuation technique is not recognized in income until the significant non-observable inputs in the valuation technique used to value the instruments become observable. The following table summarizes the aggregate difference yet to be recog-nized in net income due to the difference between the transaction price and the amount determined using valuation techniques with significant non-observable market inputs at initial recognition.
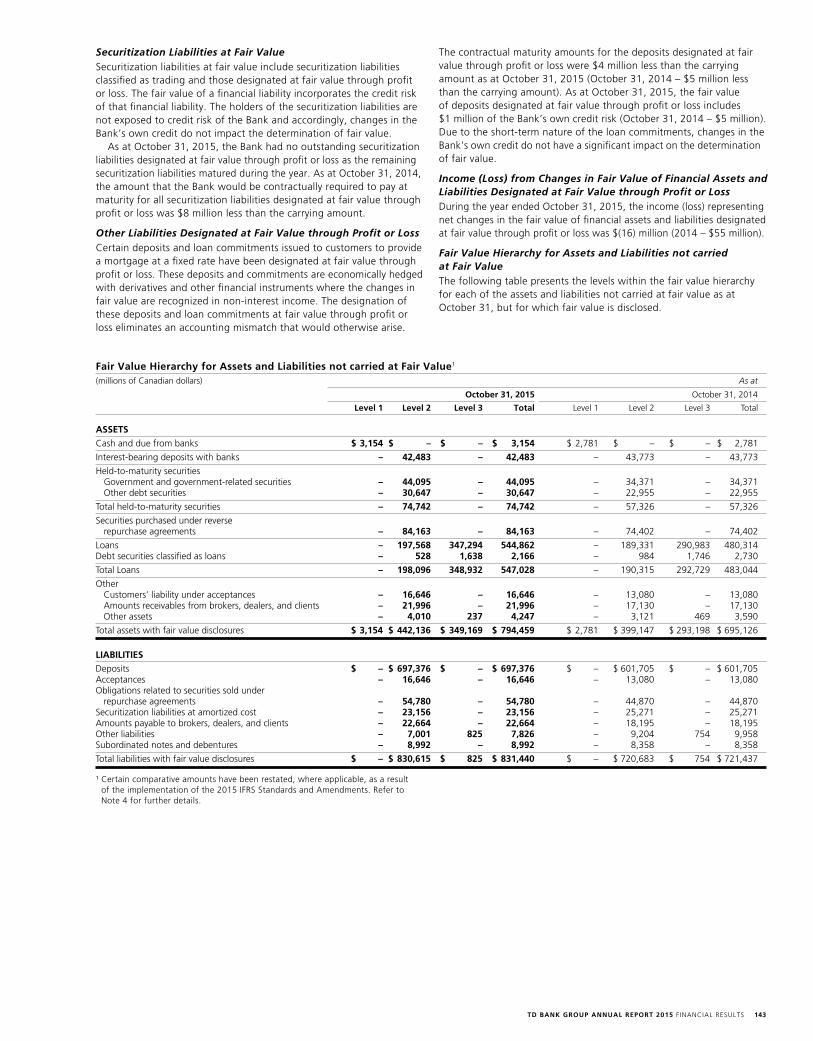
TD BANK GROUP ANNUAL REPORT 2015 F INANCIAL RESULTS 143
The contractual maturity amounts for the deposits designated at fair value through profit or loss were $4 million less than the carrying amount as at October 31, 2015 (October 31, 2014 – $5 million less than the carrying amount). As at October 31, 2015, the fair value of deposits designated at fair value through profit or loss includes $1 million of the Bank’s own credit risk (October 31, 2014 – $5 million). Due to the short-term nature of the loan commitments, changes in the Bank’s own credit do not have a significant impact on the determination of fair value.
Income (Loss) from Changes in Fair Value of Financial Assets and Liabilities Designated at Fair Value through Profit or Loss During the year ended October 31, 2015, the income (loss) representing net changes in the fair value of financial assets and liabilities designated at fair value through profit or loss was $(16) million (2014 – $55 million).
Fair Value Hierarchy for Assets and Liabilities not carried at Fair ValueThe following table presents the levels within the fair value hierarchy for each of the assets and liabilities not carried at fair value as at October 31, but for which fair value is disclosed.
Securitization Liabilities at Fair ValueSecuritization liabilities at fair value include securitization liabilities classified as trading and those designated at fair value through profit or loss. The fair value of a financial liability incorporates the credit risk of that financial liability. The holders of the securitization liabilities are not exposed to credit risk of the Bank and accordingly, changes in the Bank’s own credit do not impact the determination of fair value.
As at October 31, 2015, the Bank had no outstanding securitization liabilities designated at fair value through profit or loss as the remaining securitization liabilities matured during the year. As at October 31, 2014, the amount that the Bank would be contractually required to pay at maturity for all securitization liabilities designated at fair value through profit or loss was $8 million less than the carrying amount.
Other Liabilities Designated at Fair Value through Profit or LossCertain deposits and loan commitments issued to customers to provide a mortgage at a fixed rate have been designated at fair value through profit or loss. These deposits and commitments are economically hedged with derivatives and other financial instruments where the changes in fair value are recognized in non-interest income. The designation of these deposits and loan commitments at fair value through profit or loss eliminates an accounting mismatch that would otherwise arise.
Fair Value Hierarchy for Assets and Liabilities not carried at Fair Value1
(millions of Canadian dollars) As at
October 31, 2015 October 31, 2014
Level 1 Level 2 Level 3 Total Level 1 Level 2 Level 3 Total
ASSETS
Cash and due from banks $ 3,154 $ – $ – $ 3,154 $ 2,781 $ – $ – $ 2,781
Interest-bearing deposits with banks – 42,483 – 42,483 – 43,773 – 43,773
Held-to-maturity securities Government and government-related securities – 44,095 – 44,095 – 34,371 – 34,371
Other debt securities – 30,647 – 30,647 – 22,955 – 22,955
Total held-to-maturity securities – 74,742 – 74,742 – 57,326 – 57,326
Securities purchased under reverse repurchase agreements – 84,163 – 84,163 – 74,402 – 74,402
Loans – 197,568 347,294 544,862 – 189,331 290,983 480,314 Debt securities classified as loans – 528 1,638 2,166 – 984 1,746 2,730
Total Loans – 198,096 348,932 547,028 – 190,315 292,729 483,044
Other Customers’ liability under acceptances – 16,646 – 16,646 – 13,080 – 13,080 Amounts receivables from brokers, dealers, and clients – 21,996 – 21,996 – 17,130 – 17,130 Other assets – 4,010 237 4,247 – 3,121 469 3,590
Total assets with fair value disclosures $ 3,154 $ 442,136 $ 349,169 $ 794,459 $ 2,781 $ 399,147 $ 293,198 $ 695,126
LIABILITIES
Deposits $ – $ 697,376 $ – $ 697,376 $ – $ 601,705 $ – $ 601,705 Acceptances – 16,646 – 16,646 – 13,080 – 13,080 Obligations related to securities sold under
repurchase agreements – 54,780 – 54,780 – 44,870 – 44,870 Securitization liabilities at amortized cost – 23,156 – 23,156 – 25,271 – 25,271 Amounts payable to brokers, dealers, and clients – 22,664 – 22,664 – 18,195 – 18,195 Other liabilities – 7,001 825 7,826 – 9,204 754 9,958 Subordinated notes and debentures – 8,992 – 8,992 – 8,358 – 8,358
Total liabilities with fair value disclosures $ – $ 830,615 $ 825 $ 831,440 $ – $ 720,683 $ 754 $ 721,437
1 Certain comparative amounts have been restated, where applicable, as a result of the implementation of the 2015 IFRS Standards and Amendments. Refer to Note 4 for further details.
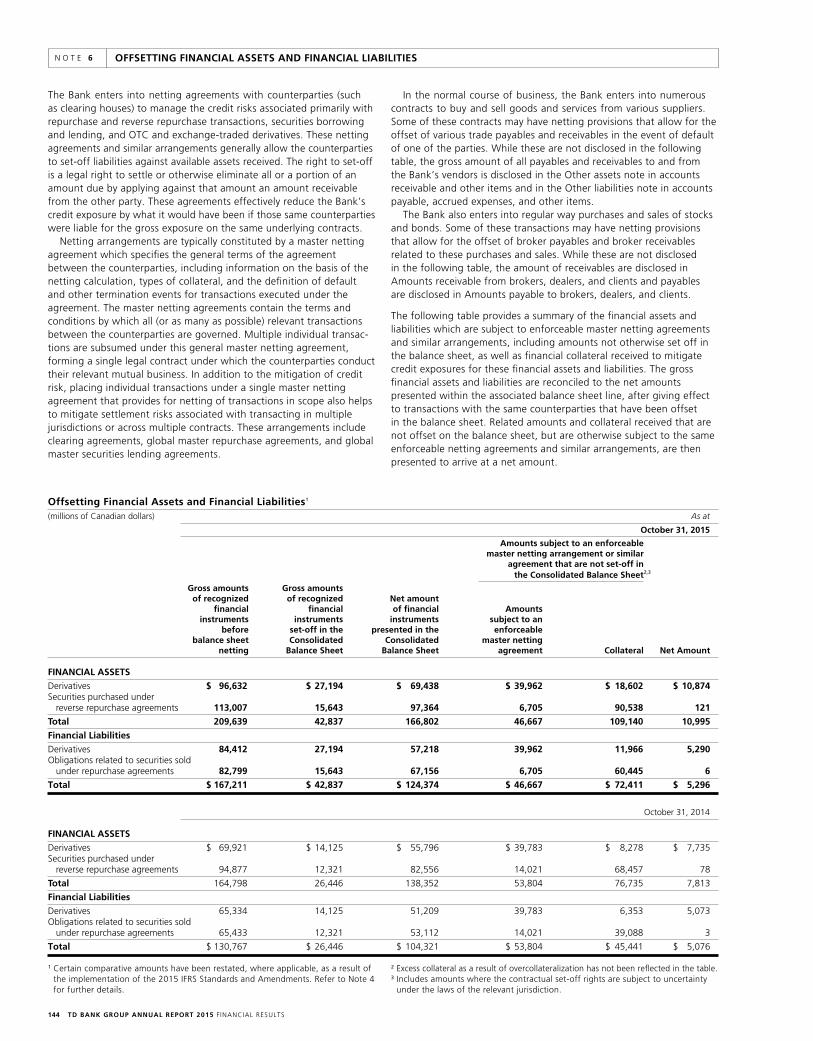
TD BANK GROUP ANNUAL REPORT 2015 F INANCIAL RESULTS144
OFFSETTING FINANCIAL ASSETS AND FINANCIAL LIABILITIESN O T E 6
In the normal course of business, the Bank enters into numerous contracts to buy and sell goods and services from various suppliers. Some of these contracts may have netting provisions that allow for the offset of various trade payables and receivables in the event of default of one of the parties. While these are not disclosed in the following table, the gross amount of all payables and receivables to and from the Bank’s vendors is disclosed in the Other assets note in accounts receivable and other items and in the Other liabilities note in accounts payable, accrued expenses, and other items.
The Bank also enters into regular way purchases and sales of stocks and bonds. Some of these transactions may have netting provisions that allow for the offset of broker payables and broker receivables related to these purchases and sales. While these are not disclosed in the following table, the amount of receivables are disclosed in Amounts receivable from brokers, dealers, and clients and payables are disclosed in Amounts payable to brokers, dealers, and clients.
The following table provides a summary of the financial assets and liabilities which are subject to enforceable master netting agreements and similar arrangements, including amounts not otherwise set off in the balance sheet, as well as financial collateral received to mitigate credit exposures for these financial assets and liabilities. The gross financial assets and liabilities are reconciled to the net amounts presented within the associated balance sheet line, after giving effect to transactions with the same counterparties that have been offset in the balance sheet. Related amounts and collateral received that are not offset on the balance sheet, but are otherwise subject to the same enforceable netting agreements and similar arrangements, are then presented to arrive at a net amount.
The Bank enters into netting agreements with counterparties (such as clearing houses) to manage the credit risks associated primarily with repurchase and reverse repurchase transactions, securities borrowing and lending, and OTC and exchange-traded derivatives. These netting agreements and similar arrangements generally allow the counterparties to set-off liabilities against available assets received. The right to set-off is a legal right to settle or otherwise eliminate all or a portion of an amount due by applying against that amount an amount receivable from the other party. These agreements effectively reduce the Bank’s credit exposure by what it would have been if those same counter parties were liable for the gross exposure on the same underlying contracts.
Netting arrangements are typically constituted by a master netting agreement which specifies the general terms of the agreement between the counterparties, including information on the basis of the netting calculation, types of collateral, and the definition of default and other termination events for transactions executed under the agreement. The master netting agreements contain the terms and conditions by which all (or as many as possible) relevant transactions between the counterparties are governed. Multiple individual transac-tions are subsumed under this general master netting agreement, forming a single legal contract under which the counterparties conduct their relevant mutual business. In addition to the mitigation of credit risk, placing individual transactions under a single master netting agreement that provides for netting of transactions in scope also helps to mitigate settlement risks associated with transacting in multiple jurisdictions or across multiple contracts. These arrangements include clearing agreements, global master repurchase agreements, and global master securities lending agreements.
Offsetting Financial Assets and Financial Liabilities1
(millions of Canadian dollars) As at
October 31, 2015
Amounts subject to an enforceable master netting arrangement or similar agreement that are not set-off in the Consolidated Balance Sheet2,3
Gross amounts Gross amounts of recognized of recognized Net amount financial financial of financial Amounts instruments instruments instruments subject to an before set-off in the presented in the enforceable balance sheet Consolidated Consolidated master netting netting Balance Sheet Balance Sheet agreement Collateral Net Amount
FINANCIAL ASSETS
Derivatives $ 96,632 $ 27,194 $ 69,438 $ 39,962 $ 18,602 $ 10,874 Securities purchased under
reverse repurchase agreements 113,007 15,643 97,364 6,705 90,538 121
Total 209,639 42,837 166,802 46,667 109,140 10,995
Financial Liabilities
Derivatives 84,412 27,194 57,218 39,962 11,966 5,290 Obligations related to securities sold
under repurchase agreements 82,799 15,643 67,156 6,705 60,445 6
Total $ 167,211 $ 42,837 $ 124,374 $ 46,667 $ 72,411 $ 5,296
October 31, 2014
FINANCIAL ASSETS
Derivatives $ 69,921 $ 14,125 $ 55,796 $ 39,783 $ 8,278 $ 7,735 Securities purchased under
reverse repurchase agreements 94,877 12,321 82,556 14,021 68,457 78
Total 164,798 26,446 138,352 53,804 76,735 7,813
Financial Liabilities
Derivatives 65,334 14,125 51,209 39,783 6,353 5,073 Obligations related to securities sold
under repurchase agreements 65,433 12,321 53,112 14,021 39,088 3
Total $ 130,767 $ 26,446 $ 104,321 $ 53,804 $ 45,441 $ 5,076
1 Certain comparative amounts have been restated, where applicable, as a result of the implementation of the 2015 IFRS Standards and Amendments. Refer to Note 4 for further details.
2 Excess collateral as a result of overcollateralization has not been reflected in the table.3 Includes amounts where the contractual set-off rights are subject to uncertainty
under the laws of the relevant jurisdiction.
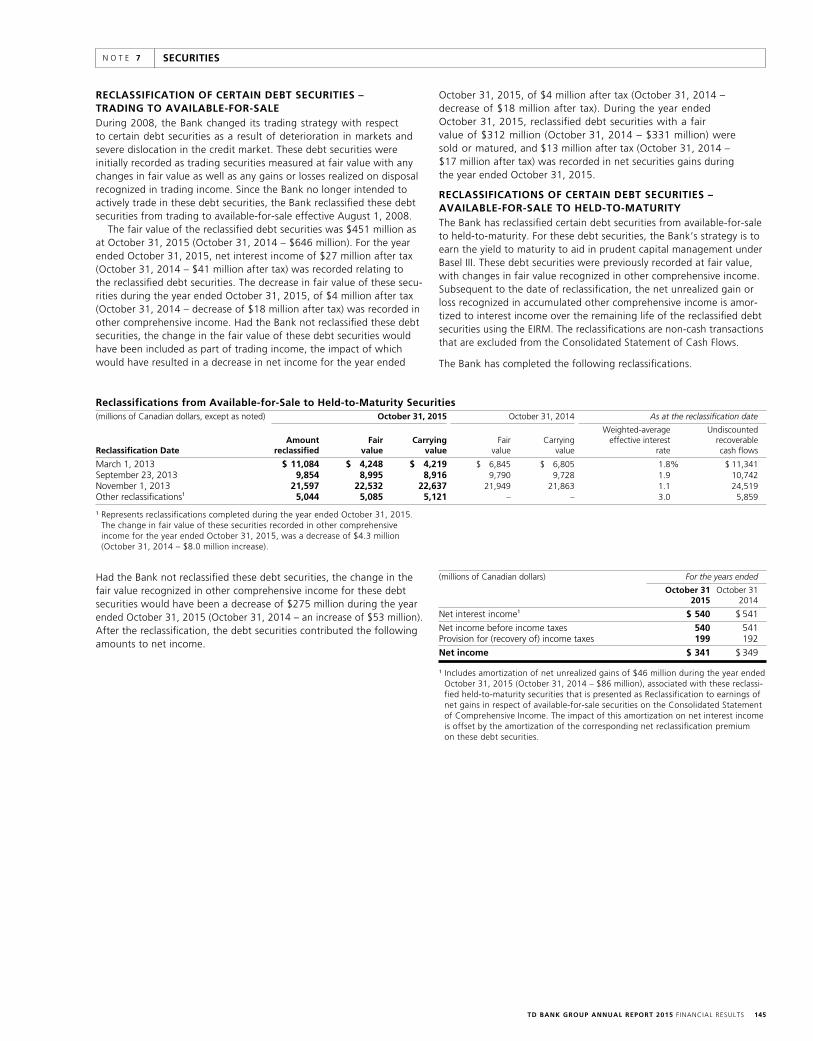
TD BANK GROUP ANNUAL REPORT 2015 F INANCIAL RESULTS 145
SECURITIESN O T E 7
October 31, 2015, of $4 million after tax (October 31, 2014 – decrease of $18 million after tax). During the year ended October 31, 2015, reclassified debt securities with a fair value of $312 million (October 31, 2014 – $331 million) were sold or matured, and $13 million after tax (October 31, 2014 – $17 million after tax) was recorded in net securities gains during the year ended October 31, 2015.
RECLASSIFICATIONS OF CERTAIN DEBT SECURITIES – AVAILABLE-FOR-SALE TO HELD-TO-MATURITYThe Bank has reclassified certain debt securities from available-for-sale to held-to-maturity. For these debt securities, the Bank’s strategy is to earn the yield to maturity to aid in prudent capital management under Basel III. These debt securities were previously recorded at fair value, with changes in fair value recognized in other comprehensive income. Subsequent to the date of reclassification, the net unrealized gain or loss recognized in accumulated other comprehensive income is amor-tized to interest income over the remaining life of the reclassified debt securities using the EIRM. The reclassifications are non-cash transactions that are excluded from the Consolidated Statement of Cash Flows.
The Bank has completed the following reclassifications.
RECLASSIFICATION OF CERTAIN DEBT SECURITIES – TRADING TO AVAILABLE-FOR-SALEDuring 2008, the Bank changed its trading strategy with respect to certain debt securities as a result of deterioration in markets and severe dislocation in the credit market. These debt securities were initially recorded as trading securities measured at fair value with any changes in fair value as well as any gains or losses realized on disposal recognized in trading income. Since the Bank no longer intended to actively trade in these debt securities, the Bank reclassified these debt securities from trading to available-for-sale effective August 1, 2008.
The fair value of the reclassified debt securities was $451 million as at October 31, 2015 (October 31, 2014 – $646 million). For the year ended October 31, 2015, net interest income of $27 million after tax (October 31, 2014 – $41 million after tax) was recorded relating to the reclassified debt securities. The decrease in fair value of these secu-rities during the year ended October 31, 2015, of $4 million after tax (October 31, 2014 – decrease of $18 million after tax) was recorded in other comprehensive income. Had the Bank not reclassified these debt securities, the change in the fair value of these debt securities would have been included as part of trading income, the impact of which would have resulted in a decrease in net income for the year ended
Had the Bank not reclassified these debt securities, the change in the fair value recognized in other comprehensive income for these debt securities would have been a decrease of $275 million during the year ended October 31, 2015 (October 31, 2014 – an increase of $53 million). After the reclassification, the debt securities contributed the following amounts to net income.
(millions of Canadian dollars) For the years ended
October 31 October 31 2015 2014
Net interest income1 $ 540 $ 541
Net income before income taxes 540 541 Provision for (recovery of) income taxes 199 192
Net income $ 341 $ 349
1 Includes amortization of net unrealized gains of $46 million during the year ended October 31, 2015 (October 31, 2014 – $86 million), associated with these reclassi-fied held-to-maturity securities that is presented as Reclassification to earnings of net gains in respect of available-for-sale securities on the Consolidated Statement of Comprehensive Income. The impact of this amortization on net interest income is offset by the amortization of the corresponding net reclassification premium on these debt securities.
Reclassifications from Available-for-Sale to Held-to-Maturity Securities(millions of Canadian dollars, except as noted) October 31, 2015 October 31, 2014 As at the reclassification date
Weighted-average Undiscounted Amount Fair Carrying Fair Carrying effective interest recoverable Reclassification Date reclassified value value value value rate cash flows
March 1, 2013 $ 11,084 $ 4,248 $ 4,219 $ 6,845 $ 6,805 1.8% $ 11,341 September 23, 2013 9,854 8,995 8,916 9,790 9,728 1.9 10,742 November 1, 2013 21,597 22,532 22,637 21,949 21,863 1.1 24,519 Other reclassifications1 5,044 5,085 5,121 – – 3.0 5,859
1 Represents reclassifications completed during the year ended October 31, 2015. The change in fair value of these securities recorded in other comprehensive income for the year ended October 31, 2015, was a decrease of $4.3 million (October 31, 2014 – $8.0 million increase).
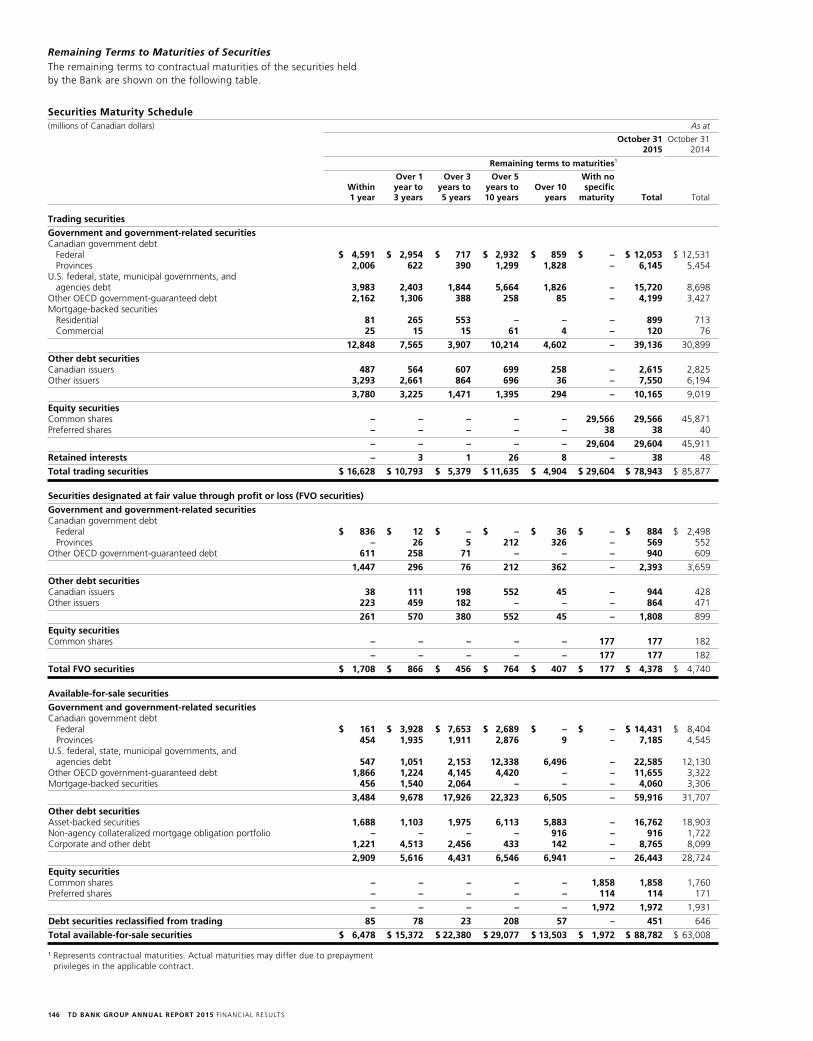
TD BANK GROUP ANNUAL REPORT 2015 F INANCIAL RESULTS146
Remaining Terms to Maturities of SecuritiesThe remaining terms to contractual maturities of the securities held by the Bank are shown on the following table.
Securities Maturity Schedule(millions of Canadian dollars) As at
October 31 October 31 2015 2014
Remaining terms to maturities1
Over 1 Over 3 Over 5 With no Within year to years to years to Over 10 specific 1 year 3 years 5 years 10 years years maturity Total Total
Trading securities
Government and government-related securities Canadian government debt
Federal $ 4,591 $ 2,954 $ 717 $ 2,932 $ 859 $ – $ 12,053 $ 12,531 Provinces 2,006 622 390 1,299 1,828 – 6,145 5,454
U.S. federal, state, municipal governments, and agencies debt 3,983 2,403 1,844 5,664 1,826 – 15,720 8,698
Other OECD government-guaranteed debt 2,162 1,306 388 258 85 – 4,199 3,427 Mortgage-backed securities Residential 81 265 553 – – – 899 713 Commercial 25 15 15 61 4 – 120 76
12,848 7,565 3,907 10,214 4,602 – 39,136 30,899
Other debt securitiesCanadian issuers 487 564 607 699 258 – 2,615 2,825 Other issuers 3,293 2,661 864 696 36 – 7,550 6,194
3,780 3,225 1,471 1,395 294 – 10,165 9,019
Equity securities Common shares – – – – – 29,566 29,566 45,871 Preferred shares – – – – – 38 38 40
– – – – – 29,604 29,604 45,911
Retained interests – 3 1 26 8 – 38 48
Total trading securities $ 16,628 $ 10,793 $ 5,379 $ 11,635 $ 4,904 $ 29,604 $ 78,943 $ 85,877
Securities designated at fair value through profit or loss (FVO securities)
Government and government-related securitiesCanadian government debt
Federal $ 836 $ 12 $ – $ – $ 36 $ – $ 884 $ 2,498 Provinces – 26 5 212 326 – 569 552 Other OECD government-guaranteed debt 611 258 71 – – – 940 609
1,447 296 76 212 362 – 2,393 3,659
Other debt securities Canadian issuers 38 111 198 552 45 – 944 428 Other issuers 223 459 182 – – – 864 471
261 570 380 552 45 – 1,808 899
Equity securities Common shares – – – – – 177 177 182
– – – – – 177 177 182
Total FVO securities $ 1,708 $ 866 $ 456 $ 764 $ 407 $ 177 $ 4,378 $ 4,740
Available-for-sale securities
Government and government-related securitiesCanadian government debt Federal $ 161 $ 3,928 $ 7,653 $ 2,689 $ – $ – $ 14,431 $ 8,404 Provinces 454 1,935 1,911 2,876 9 – 7,185 4,545 U.S. federal, state, municipal governments, and
agencies debt 547 1,051 2,153 12,338 6,496 – 22,585 12,130 Other OECD government-guaranteed debt 1,866 1,224 4,145 4,420 – – 11,655 3,322 Mortgage-backed securities 456 1,540 2,064 – – – 4,060 3,306
3,484 9,678 17,926 22,323 6,505 – 59,916 31,707
Other debt securities Asset-backed securities 1,688 1,103 1,975 6,113 5,883 – 16,762 18,903 Non-agency collateralized mortgage obligation portfolio – – – – 916 – 916 1,722 Corporate and other debt 1,221 4,513 2,456 433 142 – 8,765 8,099
2,909 5,616 4,431 6,546 6,941 – 26,443 28,724
Equity securities Common shares – – – – – 1,858 1,858 1,760 Preferred shares – – – – – 114 114 171
– – – – – 1,972 1,972 1,931
Debt securities reclassified from trading 85 78 23 208 57 – 451 646
Total available-for-sale securities $ 6,478 $ 15,372 $ 22,380 $ 29,077 $ 13,503 $ 1,972 $ 88,782 $ 63,008
1 Represents contractual maturities. Actual maturities may differ due to prepayment privileges in the applicable contract.
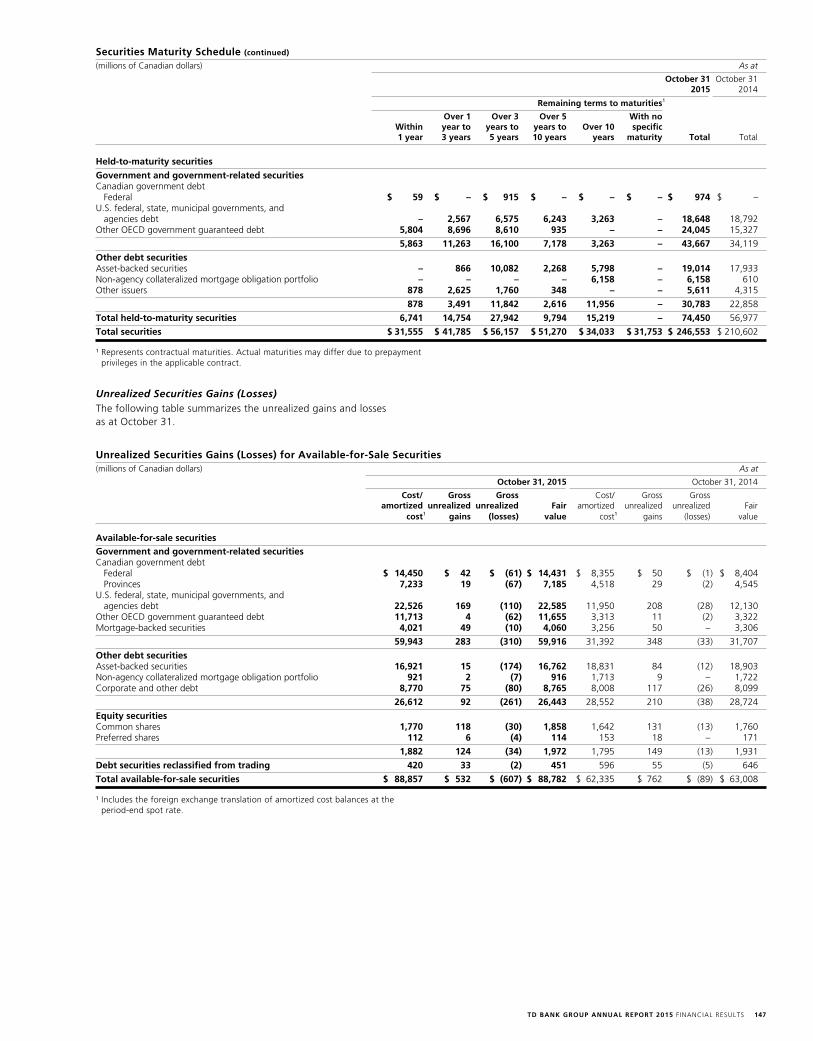
TD BANK GROUP ANNUAL REPORT 2015 F INANCIAL RESULTS 147
Unrealized Securities Gains (Losses)The following table summarizes the unrealized gains and losses as at October 31.
Unrealized Securities Gains (Losses) for Available-for-Sale Securities(millions of Canadian dollars) As at
October 31, 2015 October 31, 2014
Cost/ Gross Gross Cost/ Gross Gross amortized unrealized unrealized Fair amortized unrealized unrealized Fair cost1 gains (losses) value cost1 gains (losses) value
Available-for-sale securitiesGovernment and government-related securitiesCanadian government debt Federal $ 14,450 $ 42 $ (61) $ 14,431 $ 8,355 $ 50 $ (1) $ 8,404 Provinces 7,233 19 (67) 7,185 4,518 29 (2) 4,545 U.S. federal, state, municipal governments, and
agencies debt 22,526 169 (110) 22,585 11,950 208 (28) 12,130 Other OECD government guaranteed debt 11,713 4 (62) 11,655 3,313 11 (2) 3,322 Mortgage-backed securities 4,021 49 (10) 4,060 3,256 50 – 3,306
59,943 283 (310) 59,916 31,392 348 (33) 31,707
Other debt securities Asset-backed securities 16,921 15 (174) 16,762 18,831 84 (12) 18,903 Non-agency collateralized mortgage obligation portfolio 921 2 (7) 916 1,713 9 – 1,722 Corporate and other debt 8,770 75 (80) 8,765 8,008 117 (26) 8,099
26,612 92 (261) 26,443 28,552 210 (38) 28,724
Equity securities Common shares 1,770 118 (30) 1,858 1,642 131 (13) 1,760 Preferred shares 112 6 (4) 114 153 18 – 171
1,882 124 (34) 1,972 1,795 149 (13) 1,931
Debt securities reclassified from trading 420 33 (2) 451 596 55 (5) 646
Total available-for-sale securities $ 88,857 $ 532 $ (607) $ 88,782 $ 62,335 $ 762 $ (89) $ 63,008
1 Includes the foreign exchange translation of amortized cost balances at the period-end spot rate.
Securities Maturity Schedule (continued)
(millions of Canadian dollars) As at
October 31 October 31 2015 2014
Remaining terms to maturities1
Over 1 Over 3 Over 5 With no Within year to years to years to Over 10 specific 1 year 3 years 5 years 10 years years maturity Total Total
Held-to-maturity securities
Government and government-related securitiesCanadian government debt
Federal $ 59 $ – $ 915 $ – $ – $ – $ 974 $ – U.S. federal, state, municipal governments, and
agencies debt – 2,567 6,575 6,243 3,263 – 18,648 18,792 Other OECD government guaranteed debt 5,804 8,696 8,610 935 – – 24,045 15,327
5,863 11,263 16,100 7,178 3,263 – 43,667 34,119
Other debt securities Asset-backed securities – 866 10,082 2,268 5,798 – 19,014 17,933 Non-agency collateralized mortgage obligation portfolio – – – – 6,158 – 6,158 610 Other issuers 878 2,625 1,760 348 – – 5,611 4,315
878 3,491 11,842 2,616 11,956 – 30,783 22,858
Total held-to-maturity securities 6,741 14,754 27,942 9,794 15,219 – 74,450 56,977
Total securities $ 31,555 $ 41,785 $ 56,157 $ 51,270 $ 34,033 $ 31,753 $ 246,553 $ 210,602
1 Represents contractual maturities. Actual maturities may differ due to prepayment privileges in the applicable contract.
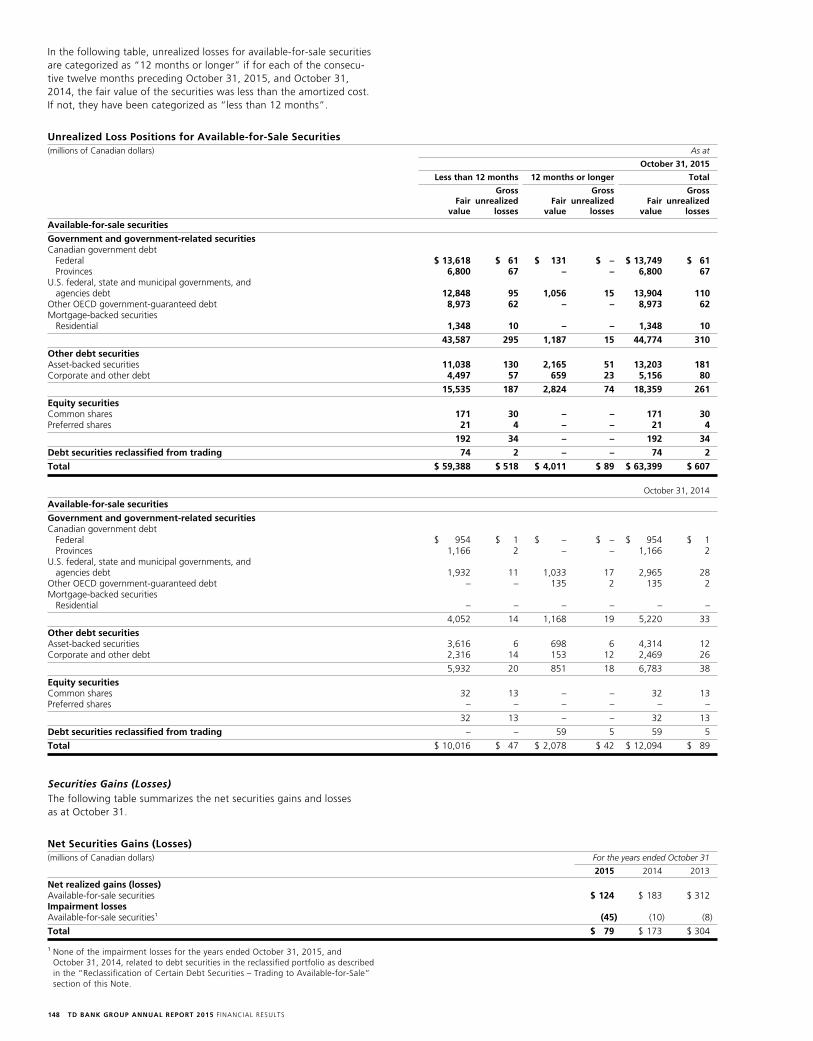
TD BANK GROUP ANNUAL REPORT 2015 F INANCIAL RESULTS148
In the following table, unrealized losses for available-for-sale securities are categorized as “12 months or longer” if for each of the consecu-tive twelve months preceding October 31, 2015, and October 31, 2014, the fair value of the securities was less than the amortized cost. If not, they have been categorized as “less than 12 months”.
Unrealized Loss Positions for Available-for-Sale Securities(millions of Canadian dollars) As at
October 31, 2015
Less than 12 months 12 months or longer Total
Gross Gross Gross Fair unrealized Fair unrealized Fair unrealized value losses value losses value losses
Available-for-sale securities
Government and government-related securitiesCanadian government debt Federal $ 13,618 $ 61 $ 131 $ – $ 13,749 $ 61 Provinces 6,800 67 – – 6,800 67 U.S. federal, state and municipal governments, and
agencies debt 12,848 95 1,056 15 13,904 110 Other OECD government-guaranteed debt 8,973 62 – – 8,973 62 Mortgage-backed securities Residential 1,348 10 – – 1,348 10
43,587 295 1,187 15 44,774 310
Other debt securitiesAsset-backed securities 11,038 130 2,165 51 13,203 181 Corporate and other debt 4,497 57 659 23 5,156 80
15,535 187 2,824 74 18,359 261
Equity securities Common shares 171 30 – – 171 30 Preferred shares 21 4 – – 21 4
192 34 – – 192 34
Debt securities reclassified from trading 74 2 – – 74 2
Total $ 59,388 $ 518 $ 4,011 $ 89 $ 63,399 $ 607
October 31, 2014
Available-for-sale securities
Government and government-related securitiesCanadian government debt Federal $ 954 $ 1 $ – $ – $ 954 $ 1 Provinces 1,166 2 – – 1,166 2 U.S. federal, state and municipal governments, and
agencies debt 1,932 11 1,033 17 2,965 28 Other OECD government-guaranteed debt – – 135 2 135 2 Mortgage-backed securities
Residential – – – – – –
4,052 14 1,168 19 5,220 33
Other debt securities Asset-backed securities 3,616 6 698 6 4,314 12 Corporate and other debt 2,316 14 153 12 2,469 26
5,932 20 851 18 6,783 38
Equity securities Common shares 32 13 – – 32 13 Preferred shares – – – – – –
32 13 – – 32 13
Debt securities reclassified from trading – – 59 5 59 5
Total $ 10,016 $ 47 $ 2,078 $ 42 $ 12,094 $ 89
Securities Gains (Losses)The following table summarizes the net securities gains and losses as at October 31.
Net Securities Gains (Losses)(millions of Canadian dollars) For the years ended October 31
2015 2014 2013
Net realized gains (losses)Available-for-sale securities $ 124 $ 183 $ 312 Impairment lossesAvailable-for-sale securities1 (45) (10) (8)
Total $ 79 $ 173 $ 304
1 None of the impairment losses for the years ended October 31, 2015, and October 31, 2014, related to debt securities in the reclassified portfolio as described in the “Reclassification of Certain Debt Securities – Trading to Available-for-Sale” section of this Note.
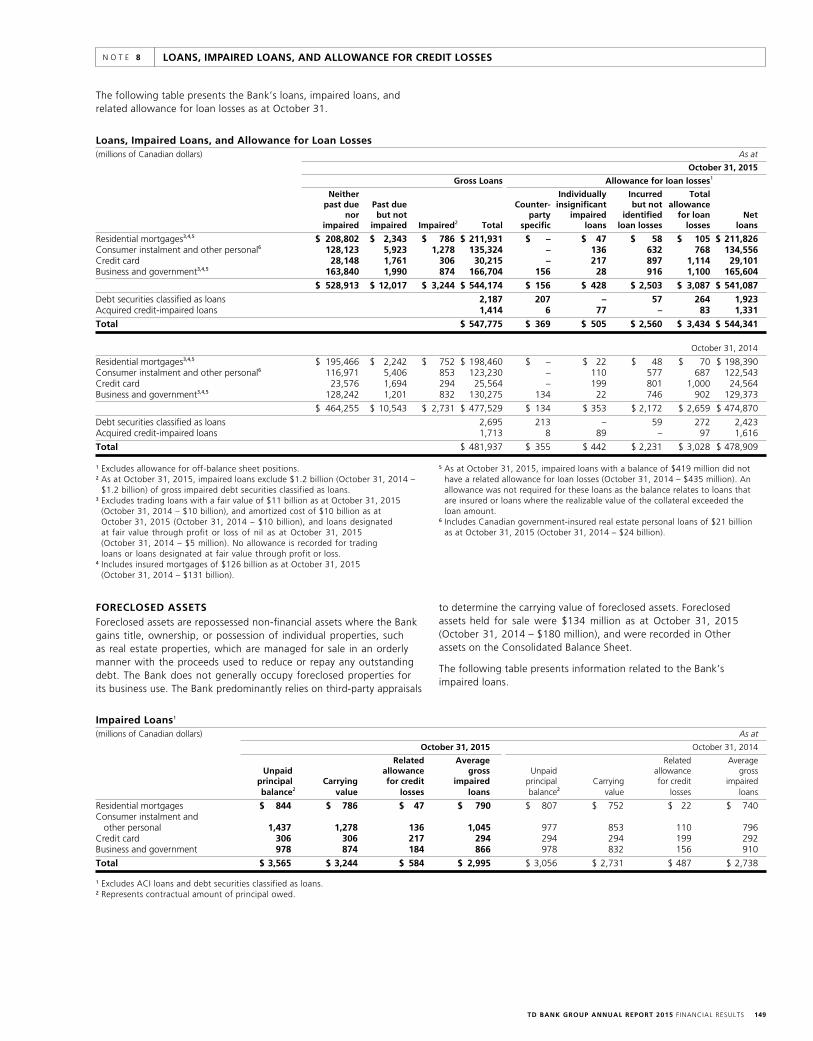
TD BANK GROUP ANNUAL REPORT 2015 F INANCIAL RESULTS 149
LOANS, IMPAIRED LOANS, AND ALLOWANCE FOR CREDIT LOSSESN O T E 8
The following table presents the Bank’s loans, impaired loans, and related allowance for loan losses as at October 31.
Loans, Impaired Loans, and Allowance for Loan Losses(millions of Canadian dollars) As at
October 31, 2015
Gross Loans Allowance for loan losses1
Neither Individually Incurred Total past due Past due Counter- insignificant but not allowance nor but not party impaired identified for loan Net impaired impaired Impaired2 Total specific loans loan losses losses loans
Residential mortgages3,4,5 $ 208,802 $ 2,343 $ 786 $ 211,931 $ – $ 47 $ 58 $ 105 $ 211,826 Consumer instalment and other personal6 128,123 5,923 1,278 135,324 – 136 632 768 134,556 Credit card 28,148 1,761 306 30,215 – 217 897 1,114 29,101 Business and government3,4,5 163,840 1,990 874 166,704 156 28 916 1,100 165,604
$ 528,913 $ 12,017 $ 3,244 $ 544,174 $ 156 $ 428 $ 2,503 $ 3,087 $ 541,087
Debt securities classified as loans 2,187 207 – 57 264 1,923 Acquired credit-impaired loans 1,414 6 77 – 83 1,331
Total $ 547,775 $ 369 $ 505 $ 2,560 $ 3,434 $ 544,341
October 31, 2014
Residential mortgages3,4,5 $ 195,466 $ 2,242 $ 752 $ 198,460 $ – $ 22 $ 48 $ 70 $ 198,390 Consumer instalment and other personal6 116,971 5,406 853 123,230 – 110 577 687 122,543 Credit card 23,576 1,694 294 25,564 – 199 801 1,000 24,564 Business and government3,4,5 128,242 1,201 832 130,275 134 22 746 902 129,373
$ 464,255 $ 10,543 $ 2,731 $ 477,529 $ 134 $ 353 $ 2,172 $ 2,659 $ 474,870
Debt securities classified as loans 2,695 213 – 59 272 2,423 Acquired credit-impaired loans 1,713 8 89 – 97 1,616
Total $ 481,937 $ 355 $ 442 $ 2,231 $ 3,028 $ 478,909
1 Excludes allowance for off-balance sheet positions.2 As at October 31, 2015, impaired loans exclude $1.2 billion (October 31, 2014 –
$1.2 billion) of gross impaired debt securities classified as loans.3 Excludes trading loans with a fair value of $11 billion as at October 31, 2015
(October 31, 2014 – $10 billion), and amortized cost of $10 billion as at October 31, 2015 (October 31, 2014 – $10 billion), and loans designated at fair value through profit or loss of nil as at October 31, 2015 (October 31, 2014 – $5 million). No allowance is recorded for trading loans or loans designated at fair value through profit or loss.
4 Includes insured mortgages of $126 billion as at October 31, 2015 (October 31, 2014 – $131 billion).
5 As at October 31, 2015, impaired loans with a balance of $419 million did not have a related allowance for loan losses (October 31, 2014 – $435 million). An allowance was not required for these loans as the balance relates to loans that are insured or loans where the realizable value of the collateral exceeded the loan amount.
6 Includes Canadian government-insured real estate personal loans of $21 billion as at October 31, 2015 (October 31, 2014 – $24 billion).
FORECLOSED ASSETSForeclosed assets are repossessed non-financial assets where the Bank gains title, ownership, or possession of individual properties, such as real estate properties, which are managed for sale in an orderly manner with the proceeds used to reduce or repay any outstanding debt. The Bank does not generally occupy foreclosed properties for its business use. The Bank predominantly relies on third-party appraisals
to determine the carrying value of foreclosed assets. Foreclosed assets held for sale were $134 million as at October 31, 2015 (October 31, 2014 – $180 million), and were recorded in Other assets on the Consolidated Balance Sheet.
The following table presents information related to the Bank’s impaired loans.
Impaired Loans1 (millions of Canadian dollars) As at
October 31, 2015 October 31, 2014
Related Average Related Average Unpaid allowance gross Unpaid allowance gross principal Carrying for credit impaired principal Carrying for credit impaired balance2 value losses loans balance2 value losses loans
Residential mortgages $ 844 $ 786 $ 47 $ 790 $ 807 $ 752 $ 22 $ 740 Consumer instalment and
other personal 1,437 1,278 136 1,045 977 853 110 796 Credit card 306 306 217 294 294 294 199 292 Business and government 978 874 184 866 978 832 156 910
Total $ 3,565 $ 3,244 $ 584 $ 2,995 $ 3,056 $ 2,731 $ 487 $ 2,738
1 Excludes ACI loans and debt securities classified as loans.2 Represents contractual amount of principal owed.
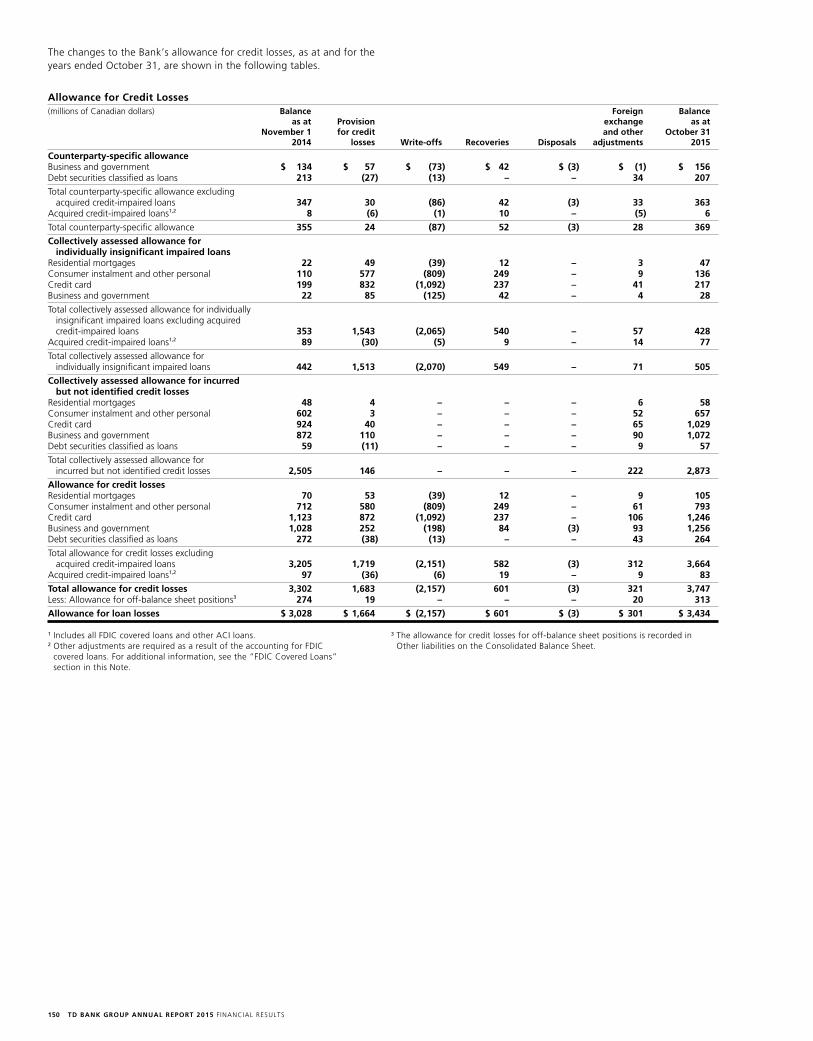
TD BANK GROUP ANNUAL REPORT 2015 F INANCIAL RESULTS150
The changes to the Bank’s allowance for credit losses, as at and for the years ended October 31, are shown in the following tables.
Allowance for Credit Losses(millions of Canadian dollars) Balance Foreign Balance as at Provision exchange as at November 1 for credit and other October 31 2014 losses Write-offs Recoveries Disposals adjustments 2015
Counterparty-specific allowanceBusiness and government $ 134 $ 57 $ (73) $ 42 $ (3) $ (1) $ 156 Debt securities classified as loans 213 (27) (13) – – 34 207
Total counterparty-specific allowance excluding acquired credit-impaired loans 347 30 (86) 42 (3) 33 363
Acquired credit-impaired loans1,2 8 (6) (1) 10 – (5) 6
Total counterparty-specific allowance 355 24 (87) 52 (3) 28 369
Collectively assessed allowance for individually insignificant impaired loans
Residential mortgages 22 49 (39) 12 – 3 47 Consumer instalment and other personal 110 577 (809) 249 – 9 136 Credit card 199 832 (1,092) 237 – 41 217 Business and government 22 85 (125) 42 – 4 28
Total collectively assessed allowance for individually insignificant impaired loans excluding acquired credit-impaired loans 353 1,543 (2,065) 540 – 57 428
Acquired credit-impaired loans1,2 89 (30) (5) 9 – 14 77
Total collectively assessed allowance for individually insignificant impaired loans 442 1,513 (2,070) 549 – 71 505
Collectively assessed allowance for incurred but not identified credit losses
Residential mortgages 48 4 – – – 6 58 Consumer instalment and other personal 602 3 – – – 52 657 Credit card 924 40 – – – 65 1,029 Business and government 872 110 – – – 90 1,072 Debt securities classified as loans 59 (11) – – – 9 57
Total collectively assessed allowance for incurred but not identified credit losses 2,505 146 – – – 222 2,873
Allowance for credit losses Residential mortgages 70 53 (39) 12 – 9 105 Consumer instalment and other personal 712 580 (809) 249 – 61 793 Credit card 1,123 872 (1,092) 237 – 106 1,246 Business and government 1,028 252 (198) 84 (3) 93 1,256 Debt securities classified as loans 272 (38) (13) – – 43 264
Total allowance for credit losses excluding acquired credit-impaired loans 3,205 1,719 (2,151) 582 (3) 312 3,664
Acquired credit-impaired loans1,2 97 (36) (6) 19 – 9 83
Total allowance for credit losses 3,302 1,683 (2,157) 601 (3) 321 3,747 Less: Allowance for off-balance sheet positions3 274 19 – – – 20 313
Allowance for loan losses $ 3,028 $ 1,664 $ (2,157) $ 601 $ (3) $ 301 $ 3,434
1 Includes all FDIC covered loans and other ACI loans.2 Other adjustments are required as a result of the accounting for FDIC
covered loans. For additional information, see the “FDIC Covered Loans” section in this Note.
3 The allowance for credit losses for off-balance sheet positions is recorded in Other liabilities on the Consolidated Balance Sheet.
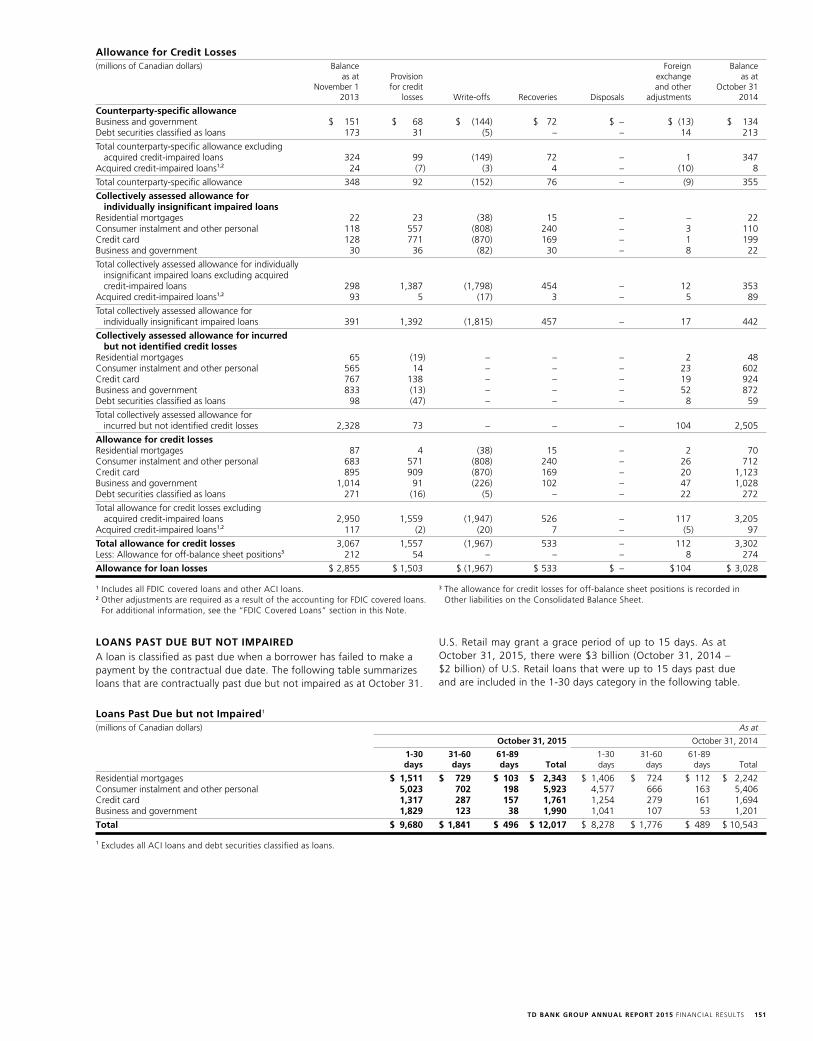
TD BANK GROUP ANNUAL REPORT 2015 F INANCIAL RESULTS 151
Allowance for Credit Losses(millions of Canadian dollars) Balance Foreign Balance as at Provision exchange as at November 1 for credit and other October 31 2013 losses Write-offs Recoveries Disposals adjustments 2014
Counterparty-specific allowanceBusiness and government $ 151 $ 68 $ (144) $ 72 $ – $ (13) $ 134 Debt securities classified as loans 173 31 (5) – – 14 213
Total counterparty-specific allowance excluding acquired credit-impaired loans 324 99 (149) 72 – 1 347
Acquired credit-impaired loans1,2 24 (7) (3) 4 – (10) 8
Total counterparty-specific allowance 348 92 (152) 76 – (9) 355
Collectively assessed allowance for individually insignificant impaired loans
Residential mortgages 22 23 (38) 15 – – 22 Consumer instalment and other personal 118 557 (808) 240 – 3 110 Credit card 128 771 (870) 169 – 1 199 Business and government 30 36 (82) 30 – 8 22
Total collectively assessed allowance for individually insignificant impaired loans excluding acquired credit-impaired loans 298 1,387 (1,798) 454 – 12 353
Acquired credit-impaired loans1,2 93 5 (17) 3 – 5 89
Total collectively assessed allowance for individually insignificant impaired loans 391 1,392 (1,815) 457 – 17 442
Collectively assessed allowance for incurred but not identified credit losses
Residential mortgages 65 (19) – – – 2 48 Consumer instalment and other personal 565 14 – – – 23 602 Credit card 767 138 – – – 19 924 Business and government 833 (13) – – – 52 872 Debt securities classified as loans 98 (47) – – – 8 59
Total collectively assessed allowance for incurred but not identified credit losses 2,328 73 – – – 104 2,505
Allowance for credit losses Residential mortgages 87 4 (38) 15 – 2 70 Consumer instalment and other personal 683 571 (808) 240 – 26 712 Credit card 895 909 (870) 169 – 20 1,123 Business and government 1,014 91 (226) 102 – 47 1,028 Debt securities classified as loans 271 (16) (5) – – 22 272
Total allowance for credit losses excluding acquired credit-impaired loans 2,950 1,559 (1,947) 526 – 117 3,205
Acquired credit-impaired loans1,2 117 (2) (20) 7 – (5) 97
Total allowance for credit losses 3,067 1,557 (1,967) 533 – 112 3,302 Less: Allowance for off-balance sheet positions3 212 54 – – – 8 274
Allowance for loan losses $ 2,855 $ 1,503 $ (1,967) $ 533 $ – $ 104 $ 3,028
1 Includes all FDIC covered loans and other ACI loans.2 Other adjustments are required as a result of the accounting for FDIC covered loans.
For additional information, see the “FDIC Covered Loans” section in this Note.
3 The allowance for credit losses for off-balance sheet positions is recorded in Other liabilities on the Consolidated Balance Sheet.
LOANS PAST DUE BUT NOT IMPAIREDA loan is classified as past due when a borrower has failed to make a payment by the contractual due date. The following table summarizes loans that are contractually past due but not impaired as at October 31.
U.S. Retail may grant a grace period of up to 15 days. As at October 31, 2015, there were $3 billion (October 31, 2014 – $2 billion) of U.S. Retail loans that were up to 15 days past due and are included in the 1-30 days category in the following table.
Loans Past Due but not Impaired1 (millions of Canadian dollars) As at
October 31, 2015 October 31, 2014
1-30 31-60 61-89 1-30 31-60 61-89 days days days Total days days days Total
Residential mortgages $ 1,511 $ 729 $ 103 $ 2,343 $ 1,406 $ 724 $ 112 $ 2,242 Consumer instalment and other personal 5,023 702 198 5,923 4,577 666 163 5,406 Credit card 1,317 287 157 1,761 1,254 279 161 1,694 Business and government 1,829 123 38 1,990 1,041 107 53 1,201
Total $ 9,680 $ 1,841 $ 496 $ 12,017 $ 8,278 $ 1,776 $ 489 $ 10,543
1 Excludes all ACI loans and debt securities classified as loans.
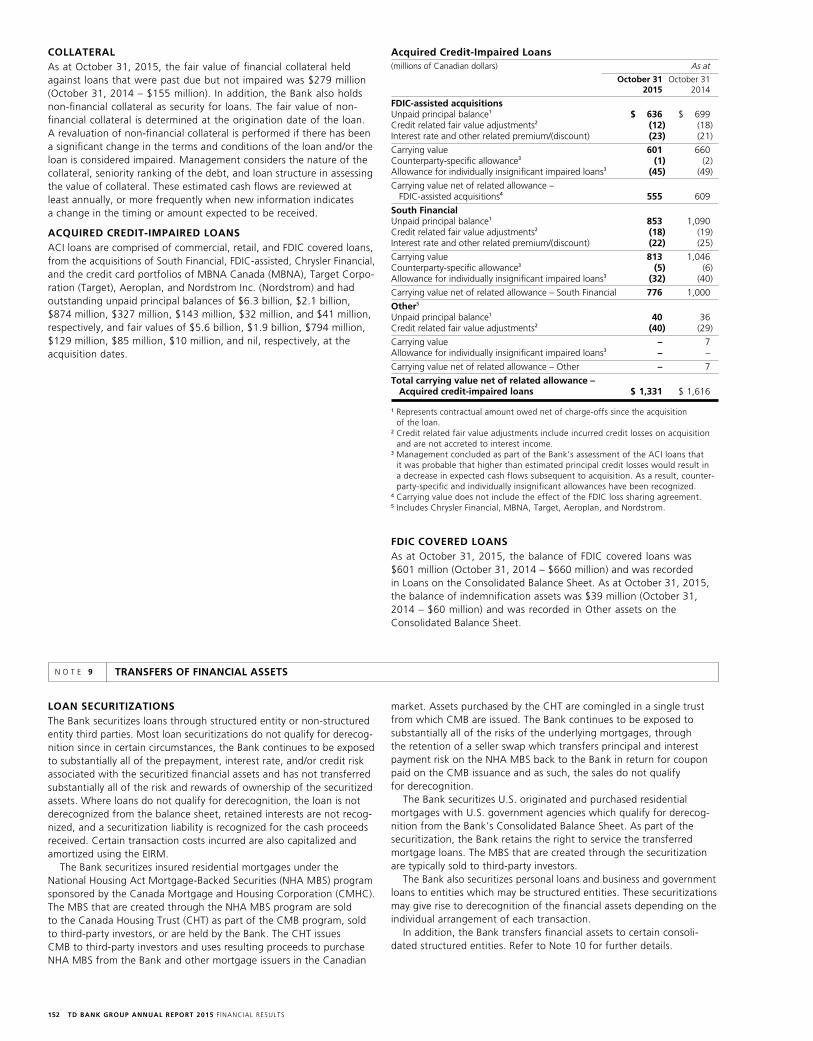
TD BANK GROUP ANNUAL REPORT 2015 F INANCIAL RESULTS152
TRANSFERS OF FINANCIAL ASSETSN O T E 9
market. Assets purchased by the CHT are comingled in a single trust from which CMB are issued. The Bank continues to be exposed to substantially all of the risks of the underlying mortgages, through the retention of a seller swap which transfers principal and interest payment risk on the NHA MBS back to the Bank in return for coupon paid on the CMB issuance and as such, the sales do not qualify for derecognition.
The Bank securitizes U.S. originated and purchased residential mortgages with U.S. government agencies which qualify for derecog-nition from the Bank’s Consolidated Balance Sheet. As part of the securitization, the Bank retains the right to service the transferred mortgage loans. The MBS that are created through the securitization are typically sold to third-party investors.
The Bank also securitizes personal loans and business and government loans to entities which may be structured entities. These securitizations may give rise to derecognition of the financial assets depending on the individual arrangement of each transaction.
In addition, the Bank transfers financial assets to certain consoli-dated structured entities. Refer to Note 10 for further details.
LOAN SECURITIZATIONSThe Bank securitizes loans through structured entity or non-structured entity third parties. Most loan securitizations do not qualify for derecog-nition since in certain circumstances, the Bank continues to be exposed to substantially all of the prepayment, interest rate, and/or credit risk associated with the securitized financial assets and has not transferred substantially all of the risk and rewards of ownership of the securitized assets. Where loans do not qualify for derecognition, the loan is not derecognized from the balance sheet, retained interests are not recog-nized, and a securitization liability is recognized for the cash proceeds received. Certain transaction costs incurred are also capitalized and amortized using the EIRM.
The Bank securitizes insured residential mortgages under the National Housing Act Mortgage-Backed Securities (NHA MBS) program sponsored by the Canada Mortgage and Housing Corporation (CMHC). The MBS that are created through the NHA MBS program are sold to the Canada Housing Trust (CHT) as part of the CMB program, sold to third-party investors, or are held by the Bank. The CHT issues CMB to third-party investors and uses resulting proceeds to purchase NHA MBS from the Bank and other mortgage issuers in the Canadian
COLLATERALAs at October 31, 2015, the fair value of financial collateral held against loans that were past due but not impaired was $279 million (October 31, 2014 – $155 million). In addition, the Bank also holds non-financial collateral as security for loans. The fair value of non-financial collateral is determined at the origination date of the loan. A revaluation of non-financial collateral is performed if there has been a significant change in the terms and conditions of the loan and/or the loan is considered impaired. Management considers the nature of the collateral, seniority ranking of the debt, and loan structure in assessing the value of collateral. These estimated cash flows are reviewed at least annually, or more frequently when new information indicates a change in the timing or amount expected to be received.
ACQUIRED CREDIT-IMPAIRED LOANS ACI loans are comprised of commercial, retail, and FDIC covered loans, from the acquisitions of South Financial, FDIC-assisted, Chrysler Financial, and the credit card portfolios of MBNA Canada (MBNA), Target Corpo-ration (Target), Aeroplan, and Nordstrom Inc. (Nordstrom) and had outstanding unpaid principal balances of $6.3 billion, $2.1 billion, $874 million, $327 million, $143 million, $32 million, and $41 million, respectively, and fair values of $5.6 billion, $1.9 billion, $794 million, $129 million, $85 million, $10 million, and nil, respectively, at the acquisition dates.
Acquired Credit-Impaired Loans(millions of Canadian dollars) As at
October 31 October 31 2015 2014
FDIC-assisted acquisitionsUnpaid principal balance1 $ 636 $ 699 Credit related fair value adjustments2 (12) (18)Interest rate and other related premium/(discount) (23) (21)
Carrying value 601 660 Counterparty-specific allowance3 (1) (2)Allowance for individually insignificant impaired loans3 (45) (49)
Carrying value net of related allowance – FDIC-assisted acquisitions4 555 609
South Financial Unpaid principal balance1 853 1,090 Credit related fair value adjustments2 (18) (19)Interest rate and other related premium/(discount) (22) (25)
Carrying value 813 1,046 Counterparty-specific allowance3 (5) (6)Allowance for individually insignificant impaired loans3 (32) (40)
Carrying value net of related allowance – South Financial 776 1,000
Other5
Unpaid principal balance1 40 36 Credit related fair value adjustments2 (40) (29)
Carrying value – 7 Allowance for individually insignificant impaired loans3 – –
Carrying value net of related allowance – Other – 7
Total carrying value net of related allowance – Acquired credit-impaired loans $ 1,331 $ 1,616
1 Represents contractual amount owed net of charge-offs since the acquisition of the loan.
2 Credit related fair value adjustments include incurred credit losses on acquisition and are not accreted to interest income.
3 Management concluded as part of the Bank’s assessment of the ACI loans that it was probable that higher than estimated principal credit losses would result in a decrease in expected cash flows subsequent to acquisition. As a result, counter-party-specific and individually insignificant allowances have been recognized.
4 Carrying value does not include the effect of the FDIC loss sharing agreement.5 Includes Chrysler Financial, MBNA, Target, Aeroplan, and Nordstrom.
FDIC COVERED LOANSAs at October 31, 2015, the balance of FDIC covered loans was $601 million (October 31, 2014 – $660 million) and was recorded in Loans on the Consolidated Balance Sheet. As at October 31, 2015, the balance of indemnification assets was $39 million (October 31, 2014 – $60 million) and was recorded in Other assets on the Consolidated Balance Sheet.

TD BANK GROUP ANNUAL REPORT 2015 F INANCIAL RESULTS 153
The following table summarizes the securitized asset types that did not qualify for derecognition, along with their associated securitization liabilities as at October 31.
Financial Assets Not Qualifying for Derecognition Treatment as Part of the Bank’s Securitization Programs(millions of Canadian dollars) As at
October 31, 2015 October 31, 2014
Fair Carrying Fair Carrying value amount value amount
Nature of transactionSecuritization of residential mortgage loans $ 30,355 $ 30,211 $ 33,792 $ 33,561 Securitization of business and government loans – – 2 2 Other financial assets transferred related to securitization1 3,173 3,170 2,321 2,321
Total 33,528 33,381 36,115 35,884
Associated liabilities2 $ (34,142) $ (33,729) $ (36,469) $ (36,158)
Other Financial Assets Not Qualifying for DerecognitionThe Bank enters into certain transactions where it transfers previously recognized commodities and financial assets, such as, debt and equity securities, but retains substantially all of the risks and rewards of those assets. These transferred assets are not derecognized and the transfers are accounted for as financing transactions. The most common trans-actions of this nature are repurchase agreements and securities lending agreements, in which the Bank retains substantially all of the associated credit, price, interest rate, and foreign exchange risks and rewards associated with the assets.
The following table summarizes the carrying amount of financial assets and the associated transactions that did not qualify for derecognition, as well as their associated financial liabilities as at October 31.
Other Financial Assets Not Qualifying for Derecognition(millions of Canadian dollars) As at
October 31 October 31 2015 2014
Carrying amount of assetsNature of transaction Repurchase agreements1,2 $ 24,708 $ 19,924 Securities lending agreements 14,239 10,718
Total 38,947 30,642
Carrying amount of associated liabilities2 $ 24,656 $ 19,939
1 Includes $4.9 billion, as at October 31, 2015, of assets related to precious metals repurchase agreements (October 31, 2014 – $3.8 billion).
2 Associated liabilities are all related to repurchase agreements.
TRANSFERS OF FINANCIAL ASSETS QUALIFYING FOR DERECOGNITIONTransferred financial assets that are derecognized in their entirety where the Bank has a continuing involvementContinuing involvement may arise if the Bank retains any contractual rights or obligations subsequent to the transfer of financial assets. Certain business and government loans securitized by the Bank are derecognized from the Bank’s Consolidated Balance Sheet. In instances where the Bank fully derecognizes business and government loans, the Bank may be exposed to the risks of transferred loans through a retained interest. As at October 31, 2015, the fair value of retained interests was $38 million (October 31, 2014 – $44 million). There are no expected credit losses on the retained interests of the securitized business and government loans as the underlying mortgages are all government insured. A gain or loss on sale of the loans is recognized immediately in other income after considering the effect of hedge accounting on the assets sold, if applicable. The amount of the gain or loss recognized depends on the previous carrying values of the loans involved in the transfer, allocated between the assets sold and the retained interests based on their relative fair values at the date of transfer. For the year ended October 31, 2015, the trading income recognized on the retained interest was $3 million (October 31, 2014 – $3 million).
Certain portfolios of U.S. residential mortgages originated by the Bank are sold and derecognized from the Bank’s Consolidated Balance Sheet. In certain instances, the Bank has a continuing involvement to service those loans. As at October 31, 2015, the carrying value of these servicing rights was $20 million (October 31, 2014 – $16 million) and the fair value was $26 million (October 31, 2014 – $22 million). A gain or loss on sale of the loans is recognized immediately in other income. The gain (loss) on sale of the loans for the year ended October 31, 2015, was $12 million (October 31, 2014 – $7 million).
1 Includes asset-backed securities, asset-backed commercial paper, cash, repurchase agreements, and Government of Canada securities used to fulfill funding require-ments of the Bank’s securitization structures after the initial securitization of mortgage loans.
2 Includes securitization liabilities carried at amortized cost of $23 billion as at October 31, 2015 (October 31, 2014 – $25 billion), and securitization liabilities carried at fair value of $11 billion as at October 31, 2015 (October 31, 2014 – $11 billion).
TD BANK GROUP ANNUAL REPORT 2015 F INANCIAL RESULTS154
Multi-seller conduits provide customers with alternate sources of financing through the securitization of their assets. These conduits are similar to single-seller conduits except that assets are received from more than one seller and comingled into a single portfolio of assets. The Bank is typically deemed to have power over the entity’s key economic decisions, namely, the selection of sellers and related assets sold as well as other decisions related to the management of risk in the vehicle. Sellers of assets in multi-seller conduits typically continue to be exposed to the variable returns of their portion of transferred assets, through derivatives or the provision of credit mitigation. The Bank’s exposure to the variable returns of multi seller conduits from its provision of liquidity facilities and any related commitments is mitigated by the sellers’ continued exposure to variable returns from the entity. While the Bank may have power over multi-seller conduits, it is not exposed to significant variable returns and does not consoli-date such entities.
Investment Funds and Other Asset Management EntitiesAs part of its asset management business, the Bank creates investment funds and trusts (including mutual funds), enabling it to provide its clients with a broad range of diversified exposure to different risk profiles, in accordance with the client’s risk appetite. Such entities may be actively managed or may be passively directed, for example, through the tracking of a specified index, depending on the entity’s investment strategy. Financing for these entities is obtained through the issuance of securities to investors, typically in the form of fund units. Based on each entity’s specific strategy and risk profile, the proceeds from this issuance are used by the entity to purchase a port-folio of assets. An entity’s portfolio may contain investments in securities, derivatives, or other assets, including cash. At the inception of a new investment fund or trust, the Bank will typically invest an amount of seed capital in the entity, allowing it to establish a performance history in the market. Over time, the Bank sells its seed capital holdings to third-party investors, as the entity’s AUM increases. As a result, the Bank’s holding of seed capital investment in its own sponsored invest-ment funds and trusts is typically not significant to the Consolidated Financial Statements. Aside from any seed capital investments, the Bank’s interest in these entities is generally limited to fees earned for the provision of asset management services. The Bank does not typically provide guarantees over the performance of these funds.
The Bank also sponsors the TD Mortgage Fund (the “Fund”), which is a mutual fund containing a portfolio of Canadian residential mort-gages sold by the Bank into the Fund. The Bank has a put option with the Fund under which it is required to repurchase defaulted mortgage loans at their carrying amount from the Fund. The Bank’s exposure under this put option is mitigated as the mortgages in the Fund are collateralized and government guaranteed. In addition to the put option, the Bank provides a liquidity facility to the Fund for the benefit of fund unit investors. Under the liquidity facility, the Bank is obligated to repurchase mortgages at their fair value to enable the Fund to honour unit-holder redemptions in the event that the Fund experiences a liquidity event. During the year ended October 31, 2015, the fair value of the mortgages repurchased as a result of a liquidity event was $29 million (2014 – $84 million). Generally, the term of these agreements do not exceed five years. While the Bank has power over the Fund, it does not absorb a significant proportion of variable returns from the Fund, as the variability in the fund relates primarily to the credit risk of the underlying mortgages which are government guaran-teed. As a result, the Bank does not consolidate the Fund.
The Bank is typically considered to have power over the key economic decisions of sponsored asset management entities; however, it does not consolidate an entity unless it is also exposed to significant variable returns of the entity. This determination is made on a case-by-case basis, in accordance with the Bank’s consolidation policy.
The Bank uses structured entities for a variety of purposes including: (1) to facilitate the transfer of specified risks to clients; (2) as financing vehicles for itself or for clients; or (3) to segregate assets on behalf of investors. The Bank is typically restricted from accessing the assets of the structured entity under the relevant arrangements.
The Bank is involved with structured entities that it sponsors, as well as entities sponsored by third-parties. Factors assessed when determining if the Bank is the sponsor of a structured entity include whether the Bank is the predominant user of the entity; whether the entity’s branding or marketing identity is linked with the Bank; and whether the Bank provides an implicit or explicit guarantee of the entity’s performance to investors or other third parties. The Bank is not considered to be the sponsor of a structured entity if it only provides arm’s-length services to the entity, for example, by acting as administrator, distributor, custodian, or loan servicer. Sponsorship of a structured entity may indicate that the Bank had power over the entity at inception; however, this is not sufficient to determine if the Bank consolidates the entity. Regardless of whether or not the Bank sponsors an entity, consolidation is determined on a case-by-case basis.
SPONSORED STRUCTURED ENTITIESThe following section outlines the Bank’s involvement with key spon-sored structured entities.
SecuritizationsThe Bank securitizes its own assets and facilitates the securitization of client assets through structured entities, such as conduits, which issue asset-backed commercial paper (ABCP) or other securitization entities which issue longer-dated term securities. Securitizations are an impor-tant source of liquidity for the Bank, allowing it to diversify its funding sources and to optimize its balance sheet management approach. The Bank has no rights to the assets as they are owned by the securitiza-tion entity.
The Bank sponsors both single-seller and multi-seller securitization conduits. Depending on the specifics of the entity, the variable returns absorbed through ABCP may be significantly mitigated by variable returns retained by the sellers. The Bank provides liquidity facilities to certain single-seller and multi-seller conduits for the benefit of ABCP investors which are structured as loan facilities between the Bank, as the sole liquidity lender, and the Bank-sponsored trusts. If a trust expe-riences difficulty issuing ABCP due to illiquidity in the commercial market, the trust may draw on the loan facility, and use the proceeds to pay maturing ABCP. The liquidity facilities can only be drawn if preconditions are met ensuring that the Bank does not provide credit enhancement through the loan facilities to the conduit. The Bank’s exposure to the variable returns of these conduits from its provision of liquidity facilities and any related commitments is mitigated by the sellers’ continued exposure to variable returns, as described below. The Bank provides administration and securities distribution services to its sponsored securitization conduits, which may result in it holding an investment in the ABCP issued by these entities. In some cases, the Bank may also provide credit enhancements or may transact derivatives with securitization conduits. The Bank earns fees from the conduits which are recognized when earned.
The Bank sells assets to single-seller conduits which it controls and consolidates. Control results from the Bank’s power over the entity’s key economic decisions, predominantly, the mix of assets sold into the conduit and exposure to the variable returns of the transferred assets, usually through a derivative or the provision of credit mitigation in the form of cash reserves, over-collateralization, or guarantees over the performance of the entity’s portfolio of assets.
STRUCTURED ENTITIESN O T E 1 0
TD BANK GROUP ANNUAL REPORT 2015 F INANCIAL RESULTS 155
Financing VehiclesThe Bank may use structured entities to provide a cost-effective means of financing its operations, including raising capital or obtaining fund-ing. These structured entities include: (1) TD Capital Trust III and TD Capital Trust IV (together the “CaTS Entities”); and (2) TD Covered Bond Guarantor Limited Partnership and TD Covered Bond (Legislative) Guarantor Limited Partnership (together the “Covered Bond Entities”).
The CaTS Entities issued innovative capital securities which currently count as Tier 1 Capital of the Bank, but, under Basel III, are considered non-qualifying capital instruments and are subject to the Basel III phase-out rules. The proceeds from these issuances were invested in assets purchased from the Bank which generate income for distribu-tion to investors. The Bank is considered to have decision-making power over the key economic activities of the CaTS Entities; however, it does not consolidate an entity unless it is also exposed to significant variable returns of the entity. The Bank is exposed to the risks and returns from certain CaTS Entities as it holds the residual risks in those entities, typically through retaining all the voting securities of the entity. Where the entity’s portfolio of assets are exposed to risks which are not related to the Bank’s own credit risk, the Bank is considered to be exposed to significant variable returns of the entity and consolidates the entity. However, certain CaTS Entities hold assets which are only exposed to the Bank’s own credit risk. In this case, the Bank does not absorb significant variable returns of the entity as it is ultimately exposed only to its own credit risk, and does not consolidate. Refer to Note 20 for further details.
The Bank issues, or has issued, debt under its covered bond programs where the principal and interest payments of the notes are guaranteed by a covered bond entity, with such guarantee secured by a portfolio of assets held by the entity. Investors in the Bank’s covered bonds may have recourse to the Bank should the assets of the covered bond entity be insufficient to satisfy the covered bond liabilities. The Bank consoli-dates the Covered Bond Entities as it has power over the key economic activities and retains all the variable returns in these entities.
THIRD-PARTY SPONSORED STRUCTURED ENTITIESIn addition to structured entities sponsored by the Bank, the Bank is also involved with structured entities sponsored by third parties. Key involvement with third party sponsored structured entities is described in the following section.
Third-party Sponsored Securitization ProgramsThe Bank participates in the securitization program of government-sponsored structured entities, including the CMHC, a Crown corporation of the Government of Canada, and similar U.S. government-sponsored entities. The CMHC guarantees CMB issued through the CHT.
The Bank is exposed to the variable returns in the CHT, through its retention of seller swaps resulting from its participation in the CHT program. The Bank does not have power over the CHT as its key economic activities are controlled by the Government of Canada. The Bank’s exposure to the CHT is included in the balance of residential mortgage loans as noted in Note 9, and is not disclosed in the table accompanying this Note.
The Bank participates in the securitization programs sponsored by U.S. government agencies. The Bank is not exposed to significant vari-able returns from these agencies and does not have power over the key economic activities of the agencies, which are controlled by the U.S. government.
Investment Holdings and DerivativesThe Bank may hold interests in third-party structured entities, predomi-nantly in the form of direct investments in securities or partnership interests issued by those structured entities, or through derivatives transacted with counterparties which are structured entities. Investments in, and derivatives with, structured entities are recognized on the Bank’s Consolidated Balance Sheet. The Bank does not typically consolidate third-party structured entities where its involvement is limited to investment holdings and/or derivatives as the Bank would not generally have power over the key economic decisions of these entities.
Financing TransactionsIn the normal course of business, the Bank may enter into financing transactions with third-party structured entities including commercial loans, reverse repurchase agreements, prime brokerage margin lending, and similar collateralized lending transactions. While such transactions expose the Bank to the structured entities counterparty credit risk, this exposure is mitigated by the collateral related to these transactions. The Bank typically has neither power nor significant variable returns due to financing transactions with structured entities and would not generally consolidate such entities. Financing transactions with third party-sponsored structured entities are included on the Bank’s Consoli-dated Financial Statements and have not been included in the table accompanying this Note.
Arm’s-length Servicing RelationshipsIn addition to the involvement outlined above, the Bank may also provide services to structured entities on an arm’s-length basis, for example as sub-advisor to an investment fund or asset servicer. Similarly, the Bank’s asset management services provided to institutional investors may include transactions with structured entities. As a consequence of providing these services, the Bank may be exposed to variable returns from these structured entities, for example, through the receipt of fees or short-term exposure to the structured entity’s securities. Any such exposure is typically mitigated by collateral or some other contractual arrangement with the structured entity or its sponsor. The Bank generally has neither power nor significant variable returns from the provision of arm’s-length services to a structured entity and, consequently does not consolidate such entities. Fees and other exposures through servicing relationships are included on the Bank’s Consolidated Financial Statements and have not been included in the table accompanying this Note.
INVOLVEMENT WITH CONSOLIDATED STRUCTURED ENTITIESSecuritizationsThe Bank securitizes consumer instalment, and other personal loans through securitization entities, predominantly single-seller conduits. These conduits are consolidated by the Bank based on the factors described above. Aside from the exposure resulting from its involve-ment as seller and sponsor of consolidated securitization conduits described above, including the liquidity facilities provided, the Bank has no contractual or non-contractual arrangements to provide financial support to consolidated securitization conduits. The Bank’s interests in securitization conduits generally rank senior to interests held by other parties, in accordance with the Bank’s investment and risk policies. As a result, the Bank has no significant obligations to absorb losses before other holders of securitization issuances.
Other Structured Consolidated Structured EntitiesDepending on the specific facts and circumstances of the Bank’s involvement with structured entities, the Bank may consolidate asset management entities, financing vehicles, or third party-sponsored structured entities, based on the factors described above. Aside from its exposure resulting from its involvement as sponsor or investor in the structured entities as previously discussed, the Bank does not typically have other contractual or non-contractual arrangements to provide financial support to these consolidated structured entities.
INVOLVEMENT WITH UNCONSOLIDATED STRUCTURED ENTITIESThe following table presents information related to the Bank’s uncon-solidated structured entities. Unconsolidated structured entities include both TD and third-party sponsored entities. Securitizations include holdings in TD-sponsored multi-seller conduits, as well as third-party sponsored mortgage and asset-backed securitizations, including government-sponsored agency securities such as CMBs, and U.S. government agency issuances. Investment Funds and Trusts include holdings in third party funds and trusts, as well as holdings in TD-sponsored asset management funds and trusts. Amounts in Other are predominantly related to investments in community-based U.S. tax-advantage entities described in Note 12. These holdings do not result in the consolidation of these entities as TD does not have power over these entities.

TD BANK GROUP ANNUAL REPORT 2015 F INANCIAL RESULTS156
Sponsored Unconsolidated Structured Entities in which the Bank has no Significant Investment at the End of the PeriodSponsored unconsolidated structured entities in which the Bank has no significant investment at the end of the period are predominantly investment funds and trusts created for the asset management business. The Bank would not typically hold investments, with the exception of seed capital, in these structured entities. However, the Bank continues to earn fees from asset management services provided to these enti-ties, some of which could be based on the performance of the fund. Fees payable are generally senior in the entity’s priority of payment
and would also be backed by collateral, limiting the Bank’s exposure to loss from these entities. The Bank’s non-interest income received from its involvement with these asset management entities was $1.6 billion (October 31, 2014 − $1.4 billion) for the year ended October 31, 2015. The total AUM in these entities was $178.9 billion (October 31, 2014 − $161.3 billion) at the end of the period. Any assets transferred by the Bank during the period are co-mingled with assets obtained from third parties in the market. Except as previously disclosed, the Bank has no contractual or non-contractual arrange-ments to provide financial support to unconsolidated structured entities.
Carrying Amount and Maximum Exposure to Unconsolidated Structured Entities(millions of Canadian dollars) As at
October 31, 2015 October 31, 2014
Investment Investment funds and funds and Securitizations trusts Other Total Securitizations trusts Other Total
FINANCIAL ASSETS
Trading loans, securities, and other $ 6,148 $ 1,167 $ – $ 7,315 $ 3,450 $ 5,913 $ – $ 9,363
Derivatives1 – 156 – 156 – 335 – 335 Financial assets designated at
fair value through profit or loss 12 64 39 115 35 34 41 110 Available-for-sale securities 42,415 388 122 42,925 41,426 584 120 42,130 Held-to-maturity securities 43,820 – – 43,820 37,335 – – 37,335 Loans 3,081 – – 3,081 2,553 – – 2,553 Other 7 – 2,717 2,724 6 – 2,101 2,107
Total assets 95,483 1,775 2,878 100,136 84,805 6,866 2,262 93,933
FINANCIAL LIABILITIES
Derivatives1 – 195 – 195 – 187 – 187 Obligations related to securities
sold short 3,023 181 – 3,204 1,432 163 – 1,595
Total liabilities 3,023 376 – 3,399 1,432 350 – 1,782
Off-balance sheet exposure2 11,869 353 1,832 14,054 10,584 356 986 11,926
Maximum exposure to loss from involvement with unconsolidated structured entities 104,329 1,752 4,710 110,791 93,957 6,872 3,248 104,077
Size of sponsored unconsolidated structured entities3 $ 10,404 $ 12,541 $ 1,750 $ 24,695 $ 9,756 $ 58,561 $ 1,750 $ 70,067
1 Derivatives primarily subject to vanilla interest rate or foreign exchange risk are not included in these amounts as those derivatives are designed to align the structured entity’s cash flows with risks absorbed by investors and are not predominantly designed to expose the Bank to variable returns created by the entity.
2 For the purposes of this disclosure, off balance-sheet exposure represents the notional value of liquidity facilities, guarantees, or other off-balance sheet commit-ments without considering the effect of collateral or other credit enhancements.
3 The size of sponsored unconsolidated structured entities is provided based on the most appropriate measure of size for the type of entity: (1) The par value of notes issued by securitization conduits and similar liability issuers; (2) the total AUM of investment funds and trusts; and (3) the total fair value of partnership or equity shares in issue for partnerships and similar equity issuers.
TD BANK GROUP ANNUAL REPORT 2015 F INANCIAL RESULTS 157
DERIVATIVESN O T E 1 1
Foreign exchange forwards are OTC contracts in which one counter-party contracts with another to exchange a specified amount of one currency for a specified amount of a second currency, at a future date or range of dates.
Swap contracts comprise foreign exchange swaps and cross-currency interest rate swaps. Foreign exchange swaps are transactions in which a foreign currency is simultaneously purchased in the spot market and sold in the forward market, or vice-versa. Cross-currency interest rate swaps are transactions in which counterparties exchange principal and interest cash flows in different currencies over a period of time. These contracts are used to manage currency and/or interest rate exposures.
Foreign exchange futures contracts are similar to foreign exchange forward contracts but differ in that they are in standard currency amounts with standard settlement dates and are transacted on an exchange.
Credit DerivativesThe Bank uses credit derivatives such as credit default swaps (CDS) and total return swaps in managing risks of the Bank’s corporate loan portfolio and other cash instruments. Credit risk is the risk of loss if a borrower or counterparty in a transaction fails to meet its agreed payment obligations. The Bank uses credit derivatives to mitigate industry concentration and borrower-specific exposure as part of the Bank’s portfolio risk management techniques. The credit, legal, and other risks associated with these transactions are controlled through well established procedures. The Bank’s policy is to enter into these transactions with investment grade financial institutions. Credit risk to these counterparties is managed through the same approval, limit, and monitoring processes that is used for all counterparties to which the Bank has credit exposure.
Credit derivatives are OTC contracts designed to transfer the credit risk in an underlying financial instrument (usually termed as a reference asset) from one counterparty to another. The most common credit derivatives are CDS (referred to as option contracts) and total return swaps (referred to as swap contracts). In option contracts, an option purchaser acquires credit protection on a reference asset or group of assets from an option writer in exchange for a premium. The option purchaser may pay the agreed premium at inception or over a period of time. The credit protection compensates the option purchaser for deterioration in value of the reference asset or group of assets upon the occurrence of certain credit events such as bankruptcy, or changes in specified credit ratings or credit index. Settlement may be cash based or physical, requiring the delivery of the reference asset to the option writer. In swap contracts, one counterparty agrees to pay or receive from the other cash amounts based on changes in the value of a reference asset or group of assets, including any returns such as interest earned on these assets in exchange for amounts that are based on prevailing market funding rates. These cash settlements are made regardless of whether there is a credit event.
Other DerivativesThe Bank also transacts in equity and commodity derivatives in both the exchange and OTC markets.
Equity swaps are OTC contracts in which one counterparty agrees to pay, or receive from the other, cash amounts based on changes in the value of a stock index, a basket of stocks or a single stock. These contracts sometimes include a payment in respect of dividends.
DERIVATIVE PRODUCT TYPES AND RISK EXPOSURESThe majority of the Bank’s derivative contracts are OTC transactions that are privately negotiated between the Bank and the counterparty to the contract. The remainder are exchange-traded contracts transacted through organized and regulated exchanges and consist primarily of options and futures.
Interest Rate DerivativesThe Bank uses interest rate derivatives, such as interest rate futures and forwards, swaps, and options in managing interest rate risks. Interest rate risk is the impact that changes in interest rates could have on the Bank’s margins, earnings, and economic value. Changes in interest rate can impact the market value of fixed rate assets and liabilities. Further, certain assets and liabilities repayment rates vary depending on interest rates.
Forward rate agreements are OTC contracts that effectively fix a future interest rate for a period of time. A typical forward rate agree-ment provides that at a pre-determined future date, a cash settlement will be made between the counterparties based upon the difference between a contracted rate and a market rate to be determined in the future, calculated on a specified notional amount. No exchange of principal amount takes place.
Interest rate swaps are OTC contracts in which two counterparties agree to exchange cash flows over a period of time based on rates applied to a specified notional amount. A typical interest rate swap would require one counterparty to pay a fixed market interest rate in exchange for a variable market interest rate determined from time to time, with both calculated on a specified notional amount. No exchange of principal amount takes place. Certain interest rate swaps are transacted and settled through a clearing house which acts as a central counterparty.
Interest rate options are contracts in which one party (the purchaser of an option) acquires from another party (the writer of an option), in exchange for a premium, the right, but not the obligation, either to buy or sell, on a specified future date or series of future dates or within a specified time, a specified financial instrument at a contracted price. The underlying financial instrument will have a market price which varies in response to changes in interest rates. In managing the Bank’s interest rate exposure, the Bank acts as both a writer and purchaser of these options. Options are transacted both OTC and through exchanges. Interest rate futures are standardized contracts transacted on an exchange. They are based upon an agreement to buy or sell a specified quantity of a financial instrument on a specified future date, at a contracted price. These contracts differ from forward rate agreements in that they are in standard amounts with standard settlement dates and are transacted on an exchange.
Foreign Exchange DerivativesThe Bank uses foreign exchange derivatives, such as futures, forwards, and swaps in managing foreign exchange risks. Foreign exchange risk refers to losses that could result from changes in foreign currency exchange rates. Assets and liabilities that are denominated in foreign currencies have foreign exchange risk. The Bank is exposed to non-trading foreign exchange risk from its investments in foreign operations when the Bank’s foreign currency assets are greater or less than the liabilities in that currency; they create foreign currency open positions.
TD BANK GROUP ANNUAL REPORT 2015 F INANCIAL RESULTS158
Fair Value of Derivatives1
(millions of Canadian dollars) October 31, 2015 October 31, 2014
Average fair value Fair value as at Fair value as at for the year2 balance sheet date balance sheet date
Positive Negative Positive Negative Positive Negative
Derivatives held or issued for trading purposesInterest rate contracts Futures $ – $ 36 $ – $ 32 $ 1 $ – Forward rate agreements 24 33 3 26 31 22 Swaps 23,706 20,485 23,520 19,983 20,127 17,940 Options written – 665 – 495 – 592 Options purchased 729 – 609 – 594 –
Total interest rate contracts 24,459 21,219 24,132 20,536 20,753 18,554
Foreign exchange contracts Futures – – – – – –
Forward contracts 11,892 10,801 8,783 9,724 8,030 6,525 Swaps – – – – – – Cross-currency interest rate swaps 18,245 20,373 19,630 18,224 11,936 14,487 Options written – 630 – 427 – 351 Options purchased 612 – 404 – 346 –
Total foreign exchange contracts 30,749 31,804 28,817 28,375 20,312 21,363
Credit derivatives Credit default swaps – protection purchased 2 79 9 55 1 37
Credit default swaps – protection sold 6 5 11 8 12 2
Total credit derivative contracts 8 84 20 63 13 39
Other contracts Equity contracts 701 1,327 890 1,317 5,311 5,742
Commodity contracts 690 931 726 954 437 539
Total other contracts 1,391 2,258 1,616 2,271 5,748 6,281
Fair value – trading 56,607 55,365 54,585 51,245 46,826 46,237
Derivatives held or issued for non-trading purposes Interest rate contracts
Forward rate agreements – – – – – – Swaps 3,732 2,577 3,806 2,543 2,648 1,559 Options written – 2 – 2 – 3 Options purchased 36 – 32 – 21 –
Total interest rate contracts 3,768 2,579 3,838 2,545 2,669 1,562
Foreign exchange contracts Forward contracts 3,628 468 3,408 455 1,612 398
Swaps – – – – – – Cross-currency interest rate swaps 6,175 2,208 6,518 1,788 3,000 1,271
Total foreign exchange contracts 9,803 2,676 9,926 2,243 4,612 1,669
Credit derivatives Credit default swaps – protection purchased 17 262 43 227 5 286
Total credit derivative contracts 17 262 43 227 5 286
Other contracts Equity contracts 1,502 1,138 1,046 958 1,684 1,455
Total other contracts 1,502 1,138 1,046 958 1,684 1,455
Fair value – non-trading 15,090 6,655 14,853 5,973 8,970 4,972
Total fair value $ 71,697 $ 62,020 $ 69,438 $ 57,218 $ 55,796 $ 51,209
1 Certain comparative amounts have been restated, where applicable, as a result of the implementation of the 2015 IFRS Standards and Amendments. Refer to Note 4 for further details. Certain other comparative amounts have also been restated/reclassified to conform with the presentation adopted in the current period.
2 The average fair value of trading derivatives over a 12-month period had a positive fair value and a negative fair value of $44 billion and $44 billion, respectively, for the year ended October 31, 2014.
Equity options give the purchaser of the option, for a premium, the right, but not the obligation, to buy from or sell to the writer of an option, an underlying stock index, basket of stocks or single stock at a contracted price. Options are transacted both OTC and through exchanges.
Equity index futures are standardized contracts transacted on an exchange. They are based on an agreement to pay or receive a cash amount based on the difference between the contracted price level
of an underlying stock index and its corresponding market price level at a specified future date. There is no actual delivery of stocks that comprise the underlying index. These contracts are in standard amounts with standard settlement dates.
Commodity contracts include commodity forwards, futures, swaps, and options, such as precious metals and energy-related products in both OTC and exchange markets.
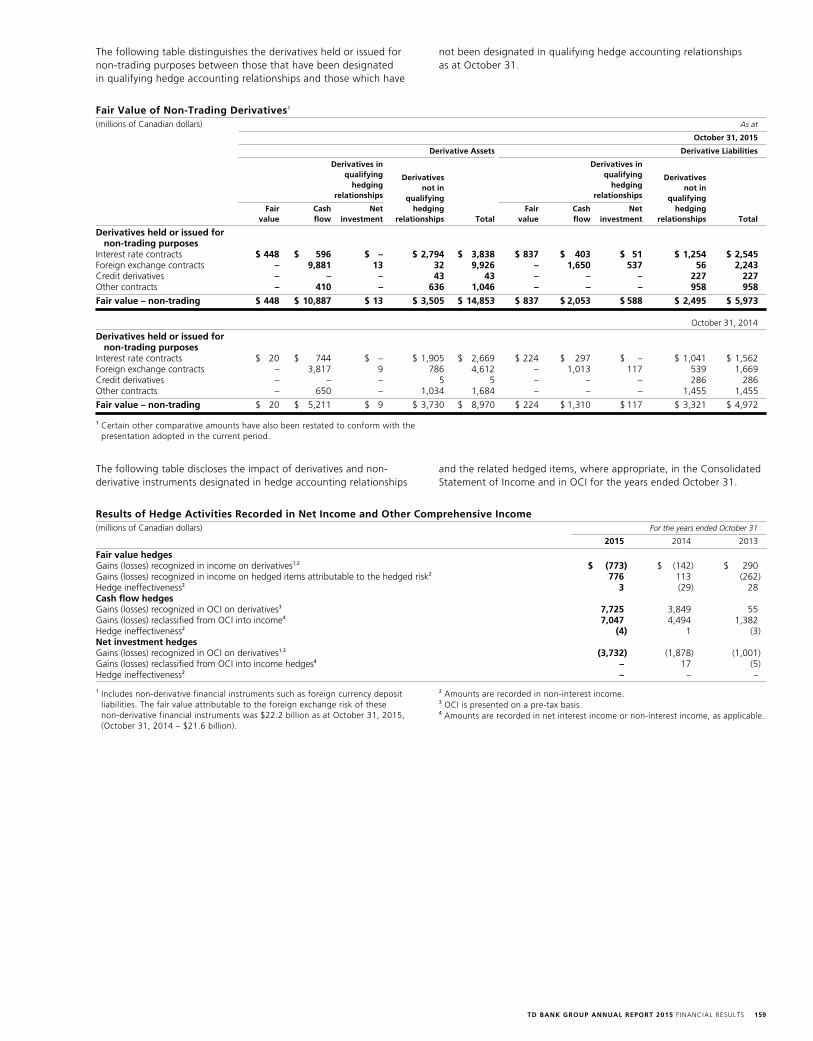
TD BANK GROUP ANNUAL REPORT 2015 F INANCIAL RESULTS 159
The following table distinguishes the derivatives held or issued for non-trading purposes between those that have been designated in qualifying hedge accounting relationships and those which have
not been designated in qualifying hedge accounting relationships as at October 31.
Fair Value of Non-Trading Derivatives1
(millions of Canadian dollars) As at
October 31, 2015
Derivative Assets Derivative Liabilities
Derivatives in Derivatives in qualifying Derivatives qualifying Derivatives hedging not in hedging not in relationships qualifying relationships qualifying Fair Cash Net hedging Fair Cash Net hedging value flow investment relationships Total value flow investment relationships Total
Derivatives held or issued for non-trading purposes
Interest rate contracts $ 448 $ 596 $ – $ 2,794 $ 3,838 $ 837 $ 403 $ 51 $ 1,254 $ 2,545 Foreign exchange contracts – 9,881 13 32 9,926 – 1,650 537 56 2,243 Credit derivatives – – – 43 43 – – – 227 227 Other contracts – 410 – 636 1,046 – – – 958 958
Fair value – non-trading $ 448 $ 10,887 $ 13 $ 3,505 $ 14,853 $ 837 $ 2,053 $ 588 $ 2,495 $ 5,973
October 31, 2014
Derivatives held or issued for non-trading purposes
Interest rate contracts $ 20 $ 744 $ – $ 1,905 $ 2,669 $ 224 $ 297 $ – $ 1,041 $ 1,562 Foreign exchange contracts – 3,817 9 786 4,612 – 1,013 117 539 1,669 Credit derivatives – – – 5 5 – – – 286 286 Other contracts – 650 – 1,034 1,684 – – – 1,455 1,455
Fair value – non-trading $ 20 $ 5,211 $ 9 $ 3,730 $ 8,970 $ 224 $ 1,310 $ 117 $ 3,321 $ 4,972
1 Certain other comparative amounts have also been restated to conform with the presentation adopted in the current period.
The following table discloses the impact of derivatives and non- derivative instruments designated in hedge accounting relationships
and the related hedged items, where appropriate, in the Consolidated Statement of Income and in OCI for the years ended October 31.
Results of Hedge Activities Recorded in Net Income and Other Comprehensive Income(millions of Canadian dollars) For the years ended October 31
2015 2014 2013
Fair value hedges Gains (losses) recognized in income on derivatives1,2 $ (773) $ (142) $ 290 Gains (losses) recognized in income on hedged items attributable to the hedged risk2 776 113 (262)Hedge ineffectiveness2 3 (29) 28 Cash flow hedges Gains (losses) recognized in OCI on derivatives3 7,725 3,849 55 Gains (losses) reclassified from OCI into income4 7,047 4,494 1,382 Hedge ineffectiveness2 (4) 1 (3)Net investment hedges Gains (losses) recognized in OCI on derivatives1,3 (3,732) (1,878) (1,001)Gains (losses) reclassified from OCI into income hedges4 – 17 (5)Hedge ineffectiveness2 – – –
1 Includes non-derivative financial instruments such as foreign currency deposit liabilities. The fair value attributable to the foreign exchange risk of these non-derivative financial instruments was $22.2 billion as at October 31, 2015, (October 31, 2014 – $21.6 billion).
2 Amounts are recorded in non-interest income.3 OCI is presented on a pre-tax basis.4 Amounts are recorded in net interest income or non-interest income, as applicable.

TD BANK GROUP ANNUAL REPORT 2015 F INANCIAL RESULTS160
The following table indicates the periods when hedged cash flows in designated cash flow hedge accounting relationships are expected to occur as at October 31.
Hedged Cash Flows(millions of Canadian dollars) As at
October 31, 2015
Within Over 1 year Over 3 years Over 5 years Over 10 1 year to 3 years to 5 years to 10 years years Total
Cash flow hedgesCash inflows $ 18,125 $ 19,630 $ 12,223 $ 3,061 $ 517 $ 53,556 Cash outflows (10,055) (23,030) (14,754) (8,994) – (56,833)
Net cash flows $ 8,070 $ (3,400) $ (2,531) $ (5,933) $ 517 $ (3,277)
October 31, 2014
Cash flow hedges Cash inflows $ 16,877 $ 23,155 $ 10,107 $ 721 $ 275 $ 51,135 Cash outflows (4,530) (9,745) (8,847) (2,673) – (25,795)
Net cash flows $ 12,347 $ 13,410 $ 1,260 $ (1,952) $ 275 $ 25,340
Income related to interest cash flows is recognized using the EIRM over the life of the underlying instrument. Foreign currency translation gains and losses related to future cash flows on hedged items are recognized as incurred.
During the years ended October 31, 2015, and October 31, 2014, there were no significant instances where forecasted hedged trans-actions failed to occur.
The following table presents gains (losses) on non-trading derivatives that have not been designated in qualifying hedge accounting relationships. These gains (losses) are partially offset by gains (losses) recorded on the Consolidated Statement of Income and on the Consolidated Statement of Other Comprehensive Income on related non-derivative instruments.
Gains (Losses) on Non-Trading Derivatives not Designated in Qualifying Hedge Accounting Relationships1
(millions of Canadian dollars) For the years ended October 31
2015 2014 2013
Interest rate contracts $ (108) $ (66) $ 69Foreign exchange contracts (23) 13 (47)Credit derivatives (35) (100) (187)Equity 2 10 4 Other contracts – – –
Total $ (164) $ (143) $ (161)
1 Amounts are recorded in non-interest income.
NOTIONAL AMOUNTSThe notional amounts are not recorded as assets or liabilities as they represent the face amount of the contract to which a rate or price is applied to determine the amount of cash flows to be exchanged. Notional amounts do not represent the potential gain or loss associ-ated with the market risk nor indicative of the credit risk associated with derivative financial instruments.
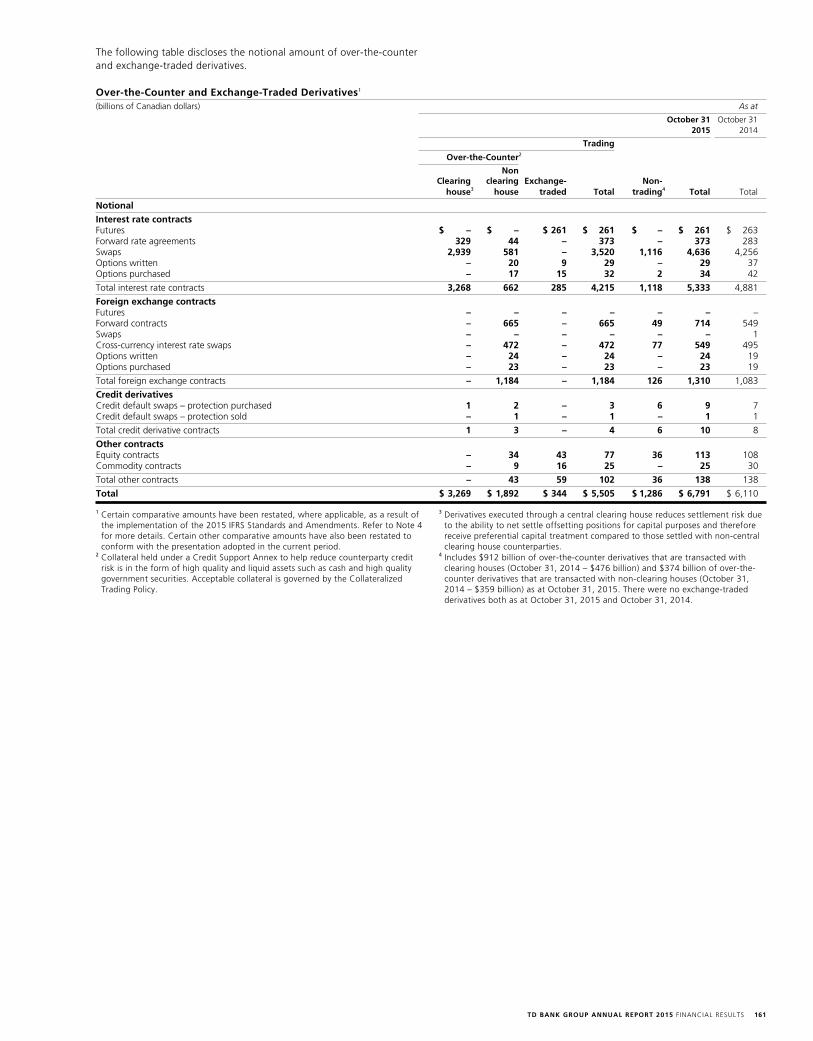
TD BANK GROUP ANNUAL REPORT 2015 F INANCIAL RESULTS 161
The following table discloses the notional amount of over-the-counter and exchange-traded derivatives.
Over-the-Counter and Exchange-Traded Derivatives1
(billions of Canadian dollars) As at
October 31 October 31 2015 2014
Trading
Over-the-Counter2
Non Clearing clearing Exchange- Non- house3 house traded Total trading4 Total Total
Notional
Interest rate contractsFutures $ – $ – $ 261 $ 261 $ – $ 261 $ 263 Forward rate agreements 329 44 – 373 – 373 283 Swaps 2,939 581 – 3,520 1,116 4,636 4,256 Options written – 20 9 29 – 29 37 Options purchased – 17 15 32 2 34 42
Total interest rate contracts 3,268 662 285 4,215 1,118 5,333 4,881
Foreign exchange contractsFutures – – – – – – – Forward contracts – 665 – 665 49 714 549 Swaps – – – – – – 1 Cross-currency interest rate swaps – 472 – 472 77 549 495 Options written – 24 – 24 – 24 19 Options purchased – 23 – 23 – 23 19
Total foreign exchange contracts – 1,184 – 1,184 126 1,310 1,083
Credit derivativesCredit default swaps – protection purchased 1 2 – 3 6 9 7 Credit default swaps – protection sold – 1 – 1 – 1 1
Total credit derivative contracts 1 3 – 4 6 10 8
Other contractsEquity contracts – 34 43 77 36 113 108 Commodity contracts – 9 16 25 – 25 30
Total other contracts – 43 59 102 36 138 138
Total $ 3,269 $ 1,892 $ 344 $ 5,505 $ 1,286 $ 6,791 $ 6,110
1 Certain comparative amounts have been restated, where applicable, as a result of the implementation of the 2015 IFRS Standards and Amendments. Refer to Note 4 for more details. Certain other comparative amounts have also been restated to conform with the presentation adopted in the current period.
2 Collateral held under a Credit Support Annex to help reduce counterparty credit risk is in the form of high quality and liquid assets such as cash and high quality government securities. Acceptable collateral is governed by the Collateralized Trading Policy.
3 Derivatives executed through a central clearing house reduces settlement risk due to the ability to net settle offsetting positions for capital purposes and therefore receive preferential capital treatment compared to those settled with non-central clearing house counterparties.
4 Includes $912 billion of over-the-counter derivatives that are transacted with clearing houses (October 31, 2014 – $476 billion) and $374 billion of over-the-counter derivatives that are transacted with non-clearing houses (October 31, 2014 – $359 billion) as at October 31, 2015. There were no exchange-traded derivatives both as at October 31, 2015 and October 31, 2014.
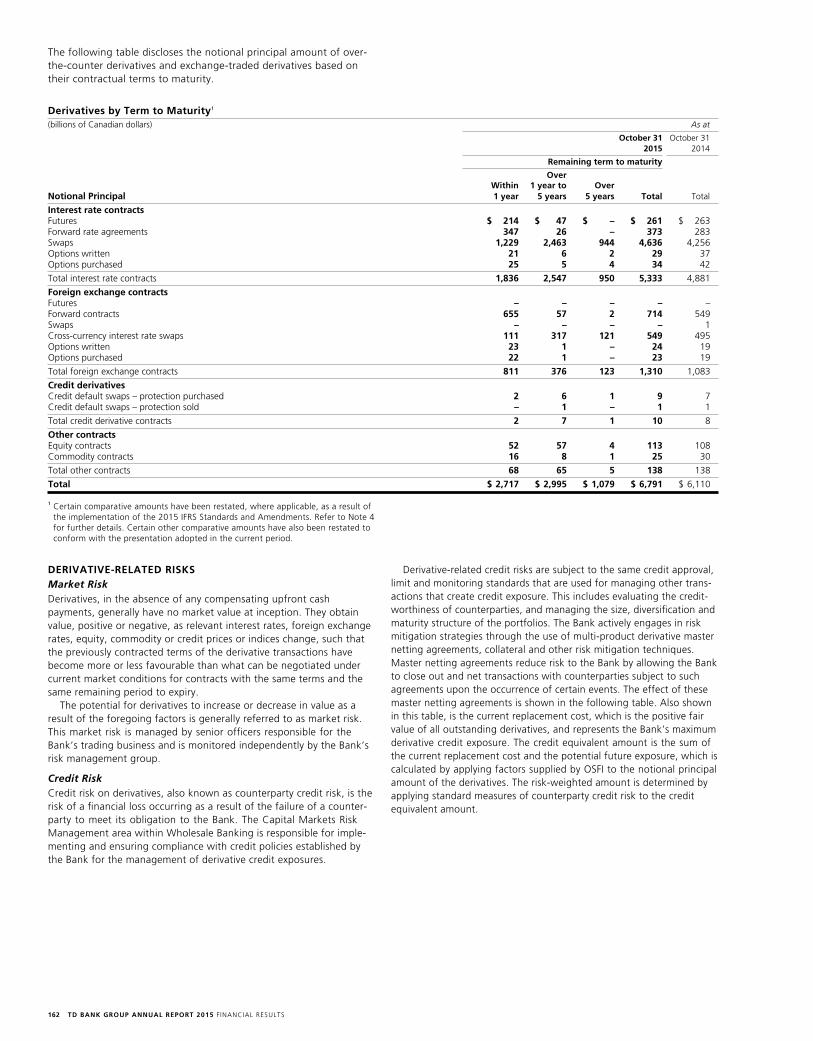
TD BANK GROUP ANNUAL REPORT 2015 F INANCIAL RESULTS162
The following table discloses the notional principal amount of over- the-counter derivatives and exchange-traded derivatives based on their contractual terms to maturity.
Derivatives by Term to Maturity1
(billions of Canadian dollars) As at
October 31 October 31 2015 2014
Remaining term to maturity
Over Within 1 year to Over Notional Principal 1 year 5 years 5 years Total Total
Interest rate contractsFutures $ 214 $ 47 $ – $ 261 $ 263 Forward rate agreements 347 26 – 373 283 Swaps 1,229 2,463 944 4,636 4,256 Options written 21 6 2 29 37 Options purchased 25 5 4 34 42
Total interest rate contracts 1,836 2,547 950 5,333 4,881
Foreign exchange contractsFutures – – – – – Forward contracts 655 57 2 714 549 Swaps – – – – 1 Cross-currency interest rate swaps 111 317 121 549 495 Options written 23 1 – 24 19 Options purchased 22 1 – 23 19
Total foreign exchange contracts 811 376 123 1,310 1,083
Credit derivativesCredit default swaps – protection purchased 2 6 1 9 7 Credit default swaps – protection sold – 1 – 1 1
Total credit derivative contracts 2 7 1 10 8
Other contractsEquity contracts 52 57 4 113 108 Commodity contracts 16 8 1 25 30
Total other contracts 68 65 5 138 138
Total $ 2,717 $ 2,995 $ 1,079 $ 6,791 $ 6,110
1 Certain comparative amounts have been restated, where applicable, as a result of the implementation of the 2015 IFRS Standards and Amendments. Refer to Note 4 for further details. Certain other comparative amounts have also been restated to conform with the presentation adopted in the current period.
DERIVATIVE-RELATED RISKSMarket RiskDerivatives, in the absence of any compensating upfront cash payments, generally have no market value at inception. They obtain value, positive or negative, as relevant interest rates, foreign exchange rates, equity, commodity or credit prices or indices change, such that the previously contracted terms of the derivative transactions have become more or less favourable than what can be negotiated under current market conditions for contracts with the same terms and the same remaining period to expiry.
The potential for derivatives to increase or decrease in value as a result of the foregoing factors is generally referred to as market risk. This market risk is managed by senior officers responsible for the Bank’s trading business and is monitored independently by the Bank’s risk management group.
Credit RiskCredit risk on derivatives, also known as counterparty credit risk, is the risk of a financial loss occurring as a result of the failure of a counter-party to meet its obligation to the Bank. The Capital Markets Risk Management area within Wholesale Banking is responsible for imple-menting and ensuring compliance with credit policies established by the Bank for the management of derivative credit exposures.
Derivative-related credit risks are subject to the same credit approval, limit and monitoring standards that are used for managing other trans-actions that create credit exposure. This includes evaluating the credit-worthiness of counterparties, and managing the size, diversification and maturity structure of the portfolios. The Bank actively engages in risk mitigation strategies through the use of multi-product derivative master netting agreements, collateral and other risk mitigation techniques. Master netting agreements reduce risk to the Bank by allowing the Bank to close out and net transactions with counterparties subject to such agreements upon the occurrence of certain events. The effect of these master netting agreements is shown in the following table. Also shown in this table, is the current replacement cost, which is the positive fair value of all outstanding derivatives, and represents the Bank’s maximum derivative credit exposure. The credit equivalent amount is the sum of the current replacement cost and the potential future exposure, which is calculated by applying factors supplied by OSFI to the notional principal amount of the derivatives. The risk-weighted amount is determined by applying standard measures of counterparty credit risk to the credit equivalent amount.

TD BANK GROUP ANNUAL REPORT 2015 F INANCIAL RESULTS 163
Credit Exposure of Derivatives(millions of Canadian dollars) As at
October 31, 2015 October 31, 2014
Current Credit Risk- Current Credit Risk- replacement equivalent weighted replacement equivalent weighted cost amount amount cost amount amount
Interest rate contractsForward rate agreements $ 26 $ 67 $ 21 $ 22 $ 74 $ 25Swaps 21,908 26,915 13,869 20,919 26,737 14,571Options purchased 638 727 359 614 707 363
Total interest rate contracts 22,572 27,709 14,249 21,555 27,518 14,959
Foreign exchange contractsForward contracts 11,976 20,750 4,866 9,492 16,556 3,778Cross-currency interest rate swaps 26,148 52,070 16,645 14,936 37,891 14,397Options purchased 404 688 166 346 558 145
Total foreign exchange contracts 38,528 73,508 21,677 24,774 55,005 18,320
Other contracts Credit derivatives 17 287 118 13 184 106Equity contracts 1,079 4,185 954 6,156 9,949 1,275Commodity contracts 582 1,431 365 343 1,207 368
Total other contracts 1,678 5,903 1,437 6,512 11,340 1,749
Total derivatives 62,778 107,120 37,363 52,841 93,863 35,028Less: impact of master netting agreements 39,962 58,659 24,957 39,783 58,632 23,988
Total derivatives after netting 22,816 48,461 12,406 13,058 35,231 11,040Less: impact of collateral 11,820 12,173 3,649 5,678 6,002 2,135
Net derivatives 10,996 36,288 8,757 7,380 29,229 8,905Qualifying Central Counterparty (QCCP) Contracts 1,937 14,735 2,070 998 11,700 1,659
Total $ 12,933 $ 51,023 $ 10,827 $ 8,378 $ 40,929 $ 10,564
Current Replacement Cost of Derivatives(millions of Canadian dollars, As atexcept as noted) Canada1 United States1 Other International1 Total
October 31 October 31 October 31 October 31 October 31 October 31 October 31 October 31 By sector 2015 2014 2015 2014 2015 2014 2015 2014
Financial $ 35,352 $ 29,486 $ 4,373 $ 10,418 $ 6,405 $ 4,762 $ 46,130 $ 44,666 Government 9,107 4,286 38 1,308 2,830 16 11,975 5,610 Other 2,111 1,112 837 1,298 1,725 155 4,673 2,565
Current replacement cost $ 46,570 $ 34,884 $ 5,248 $ 13,024 $ 10,960 $ 4,933 $ 62,778 $ 52,841
Less: impact of master netting agreements and collateral 51,782 45,461
Total current replacement cost $ 10,996 $ 7,380
October 31 October 31 October 31 October 31 2015 2014 By location of risk2 2015 2014 % mix % mix
Canada $ 4,268 $ 2,811 38.8% 38.1%
United States 4,379 2,375 39.8 32.2
Other international United Kingdom 256 632 2.3 8.5 Europe – other 1,496 832 13.6 11.3 Other 597 730 5.5 9.9
Total Other international 2,349 2,194 21.4 29.7
Total current replacement cost $ 10,996 $ 7,380 100.0% 100.0%
1 Based on geographic location of unit responsible for recording revenue.2 After impact of master netting agreements and collateral.
Certain of the Bank’s derivative contracts are governed by master derivative agreements having provisions that may permit the Bank’s counterparties to require, upon the occurrence of a certain contingent event: (1) the posting of collateral or other acceptable remedy such as assignment of the affected contracts to an acceptable counterparty; or (2) settlement of outstanding derivative contracts. Most often, these contingent events are in the form of a downgrade of the senior debt ratings of the Bank, either as counterparty or as guarantor of one of the Bank’s subsidiaries. At October 30, 2015, the aggregate net liability position of those contracts would require: (1) the posting of collateral or other acceptable remedy totalling $97 million (October 31, 2014 – $77 million) in the event of a one-notch or two-notch downgrade in the Bank’s senior debt ratings; and (2) funding totalling nil (October 31, 2014 – $1 million) following the termination and settlement of outstanding derivative contracts in the event of a one-notch or two-notch downgrade in the Bank’s senior debt ratings.
Certain of the Bank’s derivative contracts are governed by master derivative agreements having credit support provisions that permit the Bank’s counterparties to call for collateral depending on the net mark-to-market exposure position of all derivative contracts governed by that master derivative agreement. Some of these agreements may permit the Bank’s counterparties to require, upon the downgrade of the senior debt ratings of the Bank, to post additional collateral. As at October 31, 2015, the fair value of all derivative instruments with credit risk related contingent features in a net liability position was $14 billion (October 31, 2014 – $9 billion). The Bank has posted $16 billion (October 31, 2014 – $7 billion) of collateral for this exposure in the normal course of business. As at October 31, 2015, the impact of a one-notch downgrade in the Bank’s senior debt ratings would require the Bank to post an additional $194 million (October 31, 2014 – $293 million) of collateral to that posted in the normal course of business. A two-notch down grade in the Bank’s senior debt ratings would require the Bank to post an additional $228 million (October 31, 2014 – $327 million) of collateral to that posted in the normal course of business.
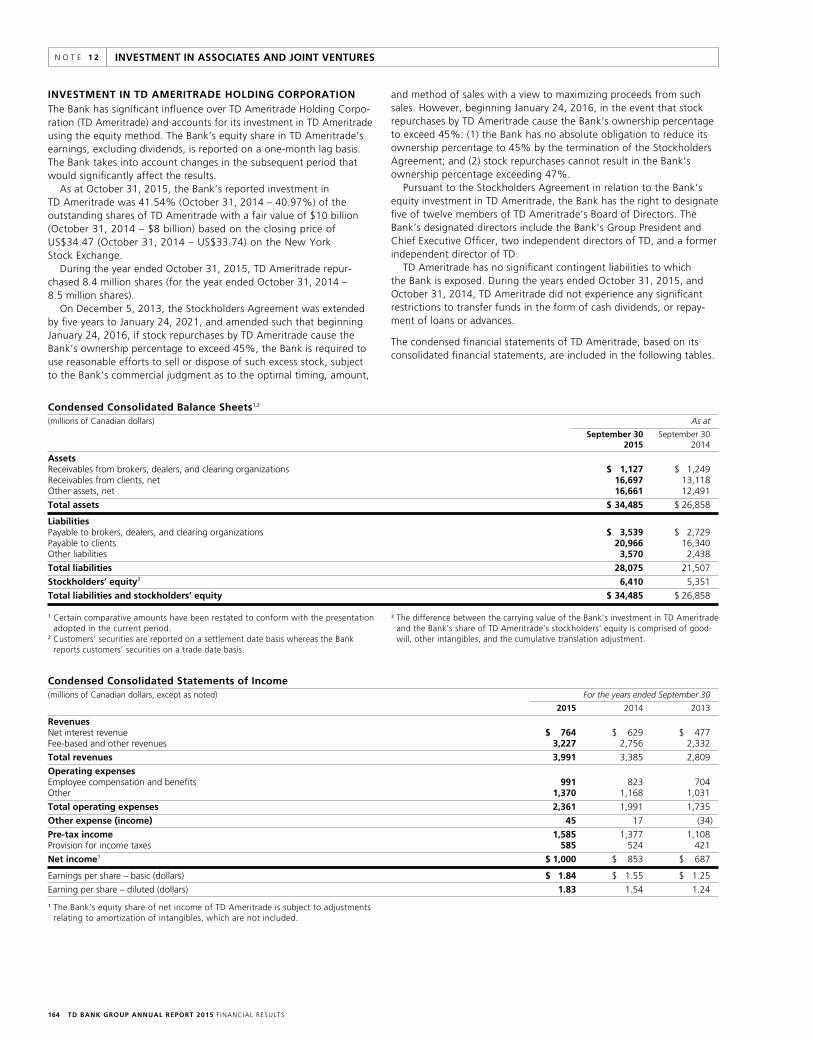
TD BANK GROUP ANNUAL REPORT 2015 F INANCIAL RESULTS164
INVESTMENT IN ASSOCIATES AND JOINT VENTURESN O T E 1 2
and method of sales with a view to maximizing proceeds from such sales. However, beginning January 24, 2016, in the event that stock repurchases by TD Ameritrade cause the Bank’s ownership percentage to exceed 45%: (1) the Bank has no absolute obligation to reduce its ownership percentage to 45% by the termination of the Stockholders Agreement; and (2) stock repurchases cannot result in the Bank’s ownership percentage exceeding 47%.
Pursuant to the Stockholders Agreement in relation to the Bank’s equity investment in TD Ameritrade, the Bank has the right to designate five of twelve members of TD Ameritrade’s Board of Directors. The Bank’s designated directors include the Bank’s Group President and Chief Executive Officer, two independent directors of TD, and a former independent director of TD.
TD Ameritrade has no significant contingent liabilities to which the Bank is exposed. During the years ended October 31, 2015, and October 31, 2014, TD Ameritrade did not experience any significant restrictions to transfer funds in the form of cash dividends, or repay-ment of loans or advances.
The condensed financial statements of TD Ameritrade, based on its consolidated financial statements, are included in the following tables.
INVESTMENT IN TD AMERITRADE HOLDING CORPORATIONThe Bank has significant influence over TD Ameritrade Holding Corpo-ration (TD Ameritrade) and accounts for its investment in TD Ameritrade using the equity method. The Bank’s equity share in TD Ameritrade’s earnings, excluding dividends, is reported on a one-month lag basis. The Bank takes into account changes in the subsequent period that would significantly affect the results.
As at October 31, 2015, the Bank’s reported investment in TD Ameritrade was 41.54% (October 31, 2014 – 40.97%) of the outstanding shares of TD Ameritrade with a fair value of $10 billion (October 31, 2014 – $8 billion) based on the closing price of US$34.47 (October 31, 2014 – US$33.74) on the New York Stock Exchange.
During the year ended October 31, 2015, TD Ameritrade repur-chased 8.4 million shares (for the year ended October 31, 2014 – 8.5 million shares).
On December 5, 2013, the Stockholders Agreement was extended by five years to January 24, 2021, and amended such that beginning January 24, 2016, if stock repurchases by TD Ameritrade cause the Bank’s ownership percentage to exceed 45%, the Bank is required to use reasonable efforts to sell or dispose of such excess stock, subject to the Bank’s commercial judgment as to the optimal timing, amount,
Condensed Consolidated Balance Sheets1,2
(millions of Canadian dollars) As at
September 30 September 30 2015 2014
AssetsReceivables from brokers, dealers, and clearing organizations $ 1,127 $ 1,249 Receivables from clients, net 16,697 13,118 Other assets, net 16,661 12,491
Total assets $ 34,485 $ 26,858
LiabilitiesPayable to brokers, dealers, and clearing organizations $ 3,539 $ 2,729 Payable to clients 20,966 16,340 Other liabilities 3,570 2,438
Total liabilities 28,075 21,507
Stockholders’ equity3 6,410 5,351
Total liabilities and stockholders’ equity $ 34,485 $ 26,858
1 Certain comparative amounts have been restated to conform with the presentation adopted in the current period.
2 Customers’ securities are reported on a settlement date basis whereas the Bank reports customers’ securities on a trade date basis.
3 The difference between the carrying value of the Bank’s investment in TD Ameritrade and the Bank’s share of TD Ameritrade’s stockholders’ equity is comprised of good-will, other intangibles, and the cumulative translation adjustment.
Condensed Consolidated Statements of Income(millions of Canadian dollars, except as noted) For the years ended September 30
2015 2014 2013
RevenuesNet interest revenue $ 764 $ 629 $ 477 Fee-based and other revenues 3,227 2,756 2,332
Total revenues 3,991 3,385 2,809
Operating expenses Employee compensation and benefits 991 823 704 Other 1,370 1,168 1,031
Total operating expenses 2,361 1,991 1,735
Other expense (income) 45 17 (34)
Pre-tax income 1,585 1,377 1,108 Provision for income taxes 585 524 421
Net income1 $ 1,000 $ 853 $ 687
Earnings per share – basic (dollars) $ 1.84 $ 1.55 $ 1.25
Earning per share – diluted (dollars) 1.83 1.54 1.24
1 The Bank’s equity share of net income of TD Ameritrade is subject to adjustments relating to amortization of intangibles, which are not included.

TD BANK GROUP ANNUAL REPORT 2015 F INANCIAL RESULTS 165
SIGNIFICANT ACQUISITIONS AND DISPOSALSN O T E 1 3
Acquisition of Epoch Investment Partners, Inc.On March 27, 2013, the Bank acquired 100% of the outstanding equity of Epoch Holding Corporation including its wholly-owned subsidiary Epoch Investment Partners, Inc. (Epoch), a New York-based asset management firm. Epoch was acquired for cash consideration of $674 million. Epoch Holding Corporation shareholders received US$28 in cash per share.
The acquisition was accounted for as a business combination under the purchase method. The results of the acquisition from the acquisition date have been consolidated with the Bank’s results and are reported in the U.S. Retail segment. As at March 27, 2013, the acquisition contributed $34 million of tangible assets, and $9 million of liabilities. The excess of consideration over the fair value of the acquired net assets of $649 million has been allocated to customer relationship intangibles of $149 million and goodwill of $500 million. Goodwill is not deductible for tax purposes.
For the year ended October 31, 2013, the acquisition contributed $96 million to revenue and $2 million to net income.
Acquisition of Target Corporation’s U.S. Credit Card PortfolioOn March 13, 2013, the Bank, through its subsidiary, TD Bank USA, N.A., acquired substantially all of Target Corporation’s existing U.S. Visa and private label credit card portfolio, with a gross outstanding balance of $5.8 billion. TD Bank USA, N.A. also entered into a seven-year program agreement under which it became the exclusive issuer of Target-branded Visa and private label consumer credit cards to Target Corporation’s U.S. customers.
Under the terms of the program agreement, the Bank and Target Corporation share in the profits generated by the portfolios. Target Corporation is responsible for all elements of operations and customer service, and bears most of the operating costs to service the assets. The Bank controls risk management policies and regulatory compli-ance, and bears all costs relating to funding the receivables for existing Target Visa accounts and all existing and newly issued Target private label accounts in the U.S. The Bank accounted for the purchase as an asset acquisition. The results of the acquisition from the acquisition date have been recorded in the U.S. Retail segment.
At the date of acquisition the Bank recorded the credit card receiv-ables acquired at their fair value of $5.7 billion and intangible assets totalling $98 million. The gross amount of revenue and credit losses have been recorded on the Consolidated Statement of Income since that date. Target Corporation shares in a fixed percentage of the reve-nue and credit losses incurred. Target Corporation’s share of revenue and credit losses is recorded in Non-interest expenses on the Consoli-dated Statement of Income and related receivables from, or payables to Target Corporation are recorded in Other assets or Other liabilities, respectively, on the Consolidated Balance Sheet.
Acquisition of Nordstrom Inc.’s U.S. Credit Card PortfolioOn October 1, 2015, the Bank, through its subsidiary, TD Bank USA, National Association (TD Bank USA, N.A.), acquired substantially all of Nordstrom Inc.’s (Nordstrom) existing U.S. Visa and private label consumer credit card portfolio, with a gross outstanding balance of $2.9 billion (US$2.2 billion). In addition, the Bank and Nordstrom entered into a long-term agreement under which the Bank became the exclusive U.S. issuer of Nordstrom-branded Visa and private label consumer credit cards to Nordstrom customers.
At the date of acquisition the Bank recorded the credit card receiv-ables at their fair value of $2.9 billion. The transaction was treated as an asset acquisition and the pre-tax difference of $73 million on the date of acquisition of the transaction price over the fair value of assets acquired has been recorded in Non-interest income. The gross amounts of revenue and credit losses have been recorded on the Consolidated Statement of Income in the U.S. Retail segment since that date. Nordstrom shares in a fixed percentage of the revenue and credit losses incurred. Nordstrom’s share of revenue and credit losses is recorded in Non-interest expenses on the Consolidated Statement of Income and related receivables from, or payables to Nordstrom are recorded in Other assets or Other liabilities, respectively, on the Consolidated Balance Sheet.
Acquisition of certain CIBC Aeroplan Credit Card Accounts On December 27, 2013, the Bank, Aimia Inc. (Aimia), and the Canadian Imperial Bank of Commerce (CIBC) closed a transaction under which the Bank acquired approximately 50% of CIBC’s existing Aeroplan credit card portfolio, which primarily included accounts held by customers who did not have an existing retail banking relationship with CIBC. The Bank accounted for the purchase as an asset acquisition. The results of the acquisition have been recorded in the Canadian Retail segment.
The Bank acquired approximately 540,000 cardholder accounts with an outstanding balance of $3.3 billion at a price of par plus $50 million less certain adjustments for total cash consideration of $3.3 billion. At the date of acquisition, the fair value of credit card receivables acquired was $3.2 billion and the fair value of an intangible asset for the purchased credit card relationships was $146 million.
In connection with the purchase agreement, the Bank agreed to pay CIBC a further $127 million under a commercial subsidy agree-ment. This payment was recognized as a non-interest expense in 2014.
Disposal of TD Waterhouse Institutional ServicesOn November 12, 2013, TD Waterhouse Canada Inc., a subsidiary of the Bank, completed the sale of the Bank’s institutional services busi-ness, known as TD Waterhouse Institutional Services, to a subsidiary of National Bank of Canada. The transaction price was $250 million in cash, subject to certain price adjustment mechanisms. A pre-tax gain of $231 million was recorded in the Corporate segment in other income in the first quarter of 2014. An additional pre-tax gain of $13 million was recorded in the Corporate segment subsequently, upon the settlement of price adjustment mechanisms.
INVESTMENT IN IMMATERIAL ASSOCIATES OR JOINT VENTURESExcept for TD Ameritrade as disclosed above, no associate or joint venture was individually material to the Bank as of October 31, 2015, or October 31, 2014. The carrying amount of the Bank’s investment in individually immaterial associates and joint ventures during the period was $2.8 billion (October 31, 2014 – $2.2 billion).
Individually immaterial associates and joint ventures consisted predominantly of investments in private funds or partnerships that make equity investments, provide debt financing or support commu-nity-based tax-advantaged investments. The investments in these entities generate a return primarily through the realization of U.S. federal and state income tax credits, including Low Income Housing Tax Credits, New Markets Tax Credits and Historic Tax Credits.
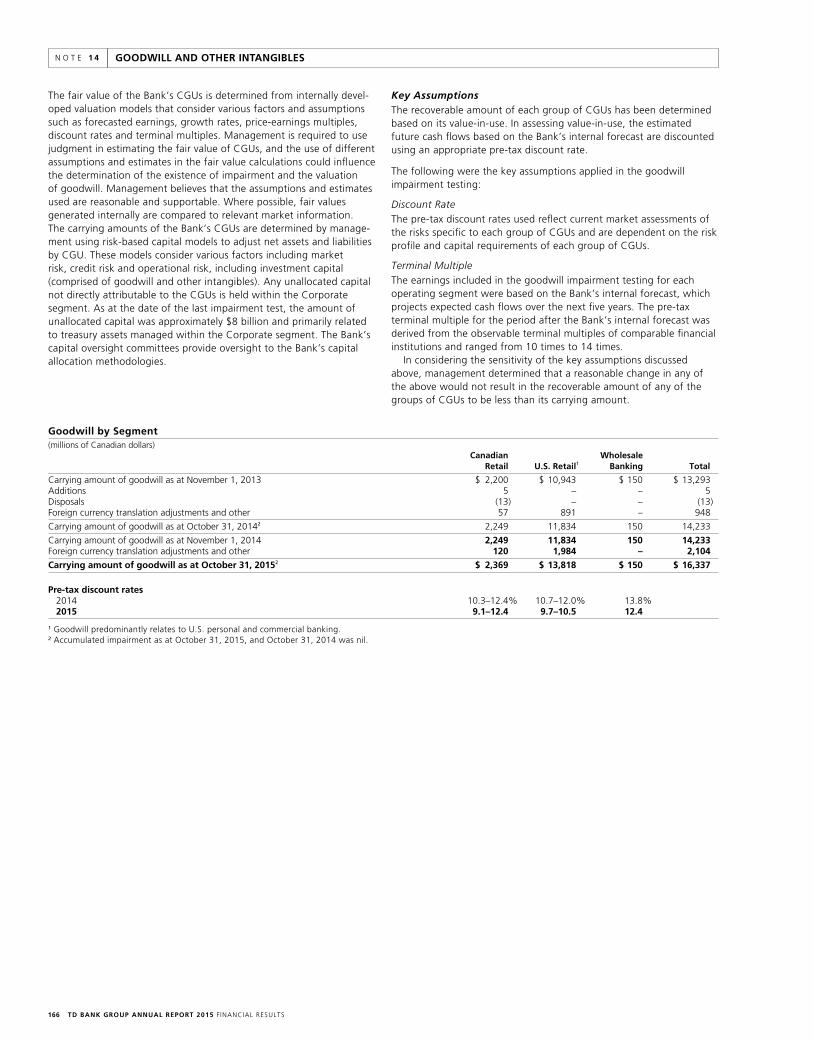
TD BANK GROUP ANNUAL REPORT 2015 F INANCIAL RESULTS166
GOODWILL AND OTHER INTANGIBLESN O T E 1 4
The fair value of the Bank’s CGUs is determined from internally devel-oped valuation models that consider various factors and assumptions such as forecasted earnings, growth rates, price-earnings multiples, discount rates and terminal multiples. Management is required to use judgment in estimating the fair value of CGUs, and the use of different assumptions and estimates in the fair value calculations could influence the determination of the existence of impairment and the valuation of goodwill. Management believes that the assumptions and estimates used are reasonable and supportable. Where possible, fair values generated internally are compared to relevant market information. The carrying amounts of the Bank’s CGUs are determined by manage-ment using risk-based capital models to adjust net assets and liabilities by CGU. These models consider various factors including market risk, credit risk and operational risk, including investment capital (comprised of goodwill and other intangibles). Any unallocated capital not directly attributable to the CGUs is held within the Corporate segment. As at the date of the last impairment test, the amount of unallocated capital was approximately $8 billion and primarily related to treasury assets managed within the Corporate segment. The Bank’s capital oversight committees provide oversight to the Bank’s capital allocation methodologies.
Key AssumptionsThe recoverable amount of each group of CGUs has been determined based on its value-in-use. In assessing value-in-use, the estimated future cash flows based on the Bank’s internal forecast are discounted using an appropriate pre-tax discount rate.
The following were the key assumptions applied in the goodwill impairment testing:
Discount RateThe pre-tax discount rates used reflect current market assessments of the risks specific to each group of CGUs and are dependent on the risk profile and capital requirements of each group of CGUs.
Terminal MultipleThe earnings included in the goodwill impairment testing for each operating segment were based on the Bank’s internal forecast, which projects expected cash flows over the next five years. The pre-tax terminal multiple for the period after the Bank’s internal forecast was derived from the observable terminal multiples of comparable financial institutions and ranged from 10 times to 14 times.
In considering the sensitivity of the key assumptions discussed above, management determined that a reasonable change in any of the above would not result in the recoverable amount of any of the groups of CGUs to be less than its carrying amount.
Goodwill by Segment(millions of Canadian dollars) Canadian Wholesale Retail U.S. Retail1 Banking Total
Carrying amount of goodwill as at November 1, 2013 $ 2,200 $ 10,943 $ 150 $ 13,293 Additions 5 – – 5 Disposals (13) – – (13)Foreign currency translation adjustments and other 57 891 – 948
Carrying amount of goodwill as at October 31, 20142 2,249 11,834 150 14,233
Carrying amount of goodwill as at November 1, 2014 2,249 11,834 150 14,233 Foreign currency translation adjustments and other 120 1,984 – 2,104
Carrying amount of goodwill as at October 31, 20152 $ 2,369 $ 13,818 $ 150 $ 16,337
Pre-tax discount rates 2014 10.3–12.4% 10.7–12.0% 13.8%
2015 9.1–12.4 9.7–10.5 12.4
1 Goodwill predominantly relates to U.S. personal and commercial banking.2 Accumulated impairment as at October 31, 2015, and October 31, 2014 was nil.
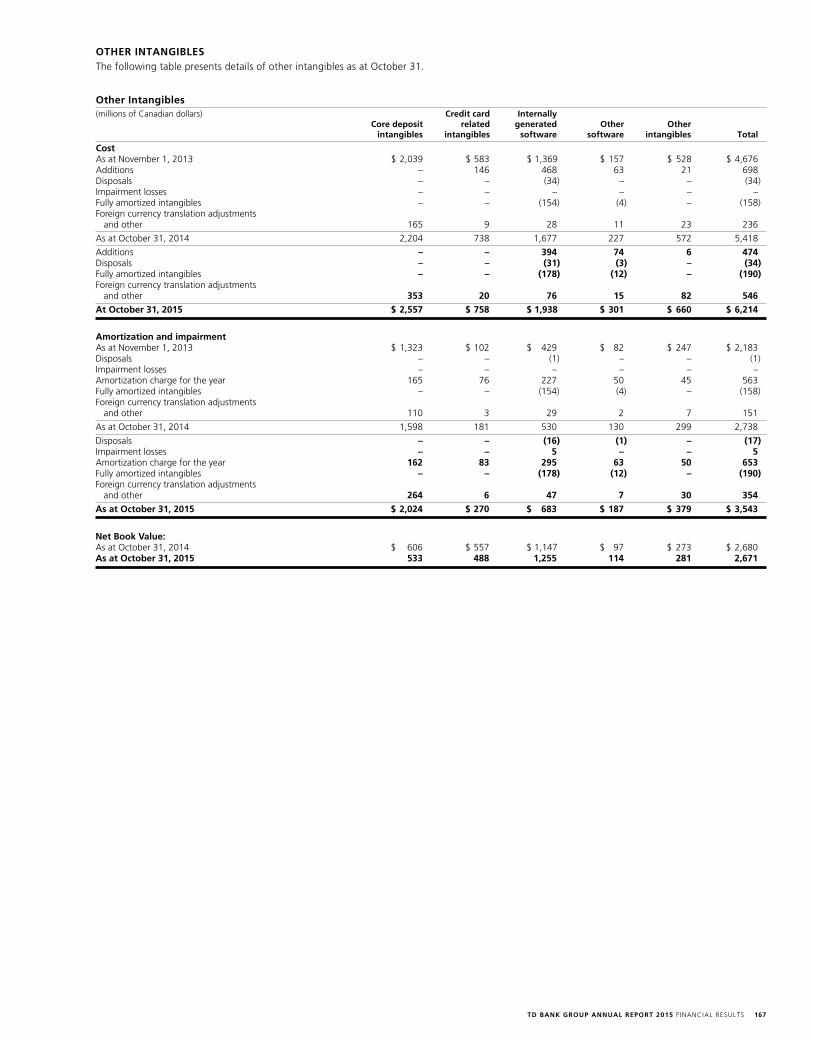
TD BANK GROUP ANNUAL REPORT 2015 F INANCIAL RESULTS 167
OTHER INTANGIBLESThe following table presents details of other intangibles as at October 31.
Other Intangibles(millions of Canadian dollars) Credit card Internally Core deposit related generated Other Other intangibles intangibles software software intangibles Total
CostAs at November 1, 2013 $ 2,039 $ 583 $ 1,369 $ 157 $ 528 $ 4,676 Additions – 146 468 63 21 698 Disposals – – (34) – – (34)Impairment losses – – – – – – Fully amortized intangibles – – (154) (4) – (158)Foreign currency translation adjustments
and other 165 9 28 11 23 236
As at October 31, 2014 2,204 738 1,677 227 572 5,418
Additions – – 394 74 6 474 Disposals – – (31) (3) – (34)Fully amortized intangibles – – (178) (12) – (190)Foreign currency translation adjustments
and other 353 20 76 15 82 546
At October 31, 2015 $ 2,557 $ 758 $ 1,938 $ 301 $ 660 $ 6,214
Amortization and impairment As at November 1, 2013 $ 1,323 $ 102 $ 429 $ 82 $ 247 $ 2,183 Disposals – – (1) – – (1)Impairment losses – – – – – – Amortization charge for the year 165 76 227 50 45 563 Fully amortized intangibles – – (154) (4) – (158)Foreign currency translation adjustments
and other 110 3 29 2 7 151
As at October 31, 2014 1,598 181 530 130 299 2,738
Disposals – – (16) (1) – (17)Impairment losses – – 5 – – 5 Amortization charge for the year 162 83 295 63 50 653 Fully amortized intangibles – – (178) (12) – (190)Foreign currency translation adjustments
and other 264 6 47 7 30 354
As at October 31, 2015 $ 2,024 $ 270 $ 683 $ 187 $ 379 $ 3,543
Net Book Value: As at October 31, 2014 $ 606 $ 557 $ 1,147 $ 97 $ 273 $ 2,680 As at October 31, 2015 533 488 1,255 114 281 2,671
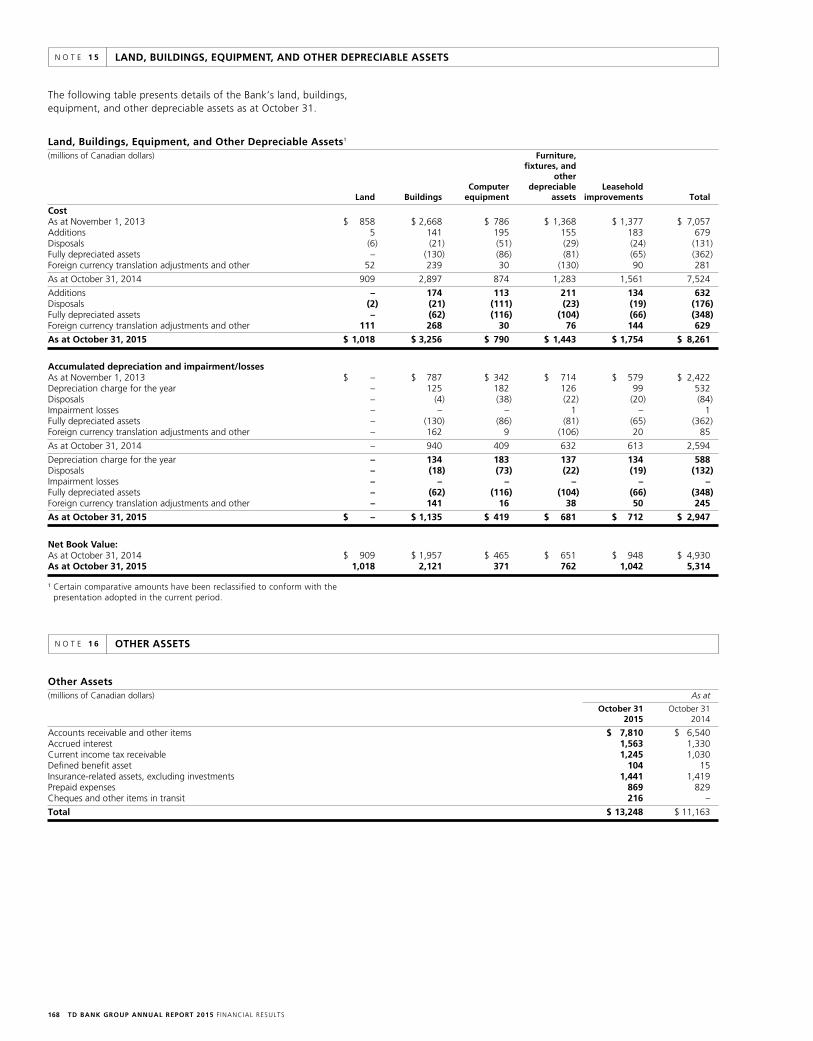
TD BANK GROUP ANNUAL REPORT 2015 F INANCIAL RESULTS168
The following table presents details of the Bank’s land, buildings, equipment, and other depreciable assets as at October 31.
Land, Buildings, Equipment, and Other Depreciable Assets1
(millions of Canadian dollars) Furniture, fixtures, and other Computer depreciable Leasehold Land Buildings equipment assets improvements Total
CostAs at November 1, 2013 $ 858 $ 2,668 $ 786 $ 1,368 $ 1,377 $ 7,057 Additions 5 141 195 155 183 679 Disposals (6) (21) (51) (29) (24) (131)Fully depreciated assets – (130) (86) (81) (65) (362)Foreign currency translation adjustments and other 52 239 30 (130) 90 281
As at October 31, 2014 909 2,897 874 1,283 1,561 7,524
Additions – 174 113 211 134 632 Disposals (2) (21) (111) (23) (19) (176)Fully depreciated assets – (62) (116) (104) (66) (348)Foreign currency translation adjustments and other 111 268 30 76 144 629
As at October 31, 2015 $ 1,018 $ 3,256 $ 790 $ 1,443 $ 1,754 $ 8,261
Accumulated depreciation and impairment/losses As at November 1, 2013 $ – $ 787 $ 342 $ 714 $ 579 $ 2,422 Depreciation charge for the year – 125 182 126 99 532 Disposals – (4) (38) (22) (20) (84)Impairment losses – – – 1 – 1 Fully depreciated assets – (130) (86) (81) (65) (362)Foreign currency translation adjustments and other – 162 9 (106) 20 85
As at October 31, 2014 – 940 409 632 613 2,594
Depreciation charge for the year – 134 183 137 134 588 Disposals – (18) (73) (22) (19) (132)Impairment losses – – – – – – Fully depreciated assets – (62) (116) (104) (66) (348)Foreign currency translation adjustments and other – 141 16 38 50 245
As at October 31, 2015 $ – $ 1,135 $ 419 $ 681 $ 712 $ 2,947
Net Book Value: As at October 31, 2014 $ 909 $ 1,957 $ 465 $ 651 $ 948 $ 4,930 As at October 31, 2015 1,018 2,121 371 762 1,042 5,314
1 Certain comparative amounts have been reclassified to conform with the presentation adopted in the current period.
LAND, BUILDINGS, EQUIPMENT, AND OTHER DEPRECIABLE ASSETSN O T E 1 5
OTHER ASSETSN O T E 1 6
Other Assets(millions of Canadian dollars) As at
October 31 October 31 2015 2014
Accounts receivable and other items $ 7,810 $ 6,540 Accrued interest 1,563 1,330 Current income tax receivable 1,245 1,030 Defined benefit asset 104 15 Insurance-related assets, excluding investments 1,441 1,419 Prepaid expenses 869 829 Cheques and other items in transit 216 –
Total $ 13,248 $ 11,163
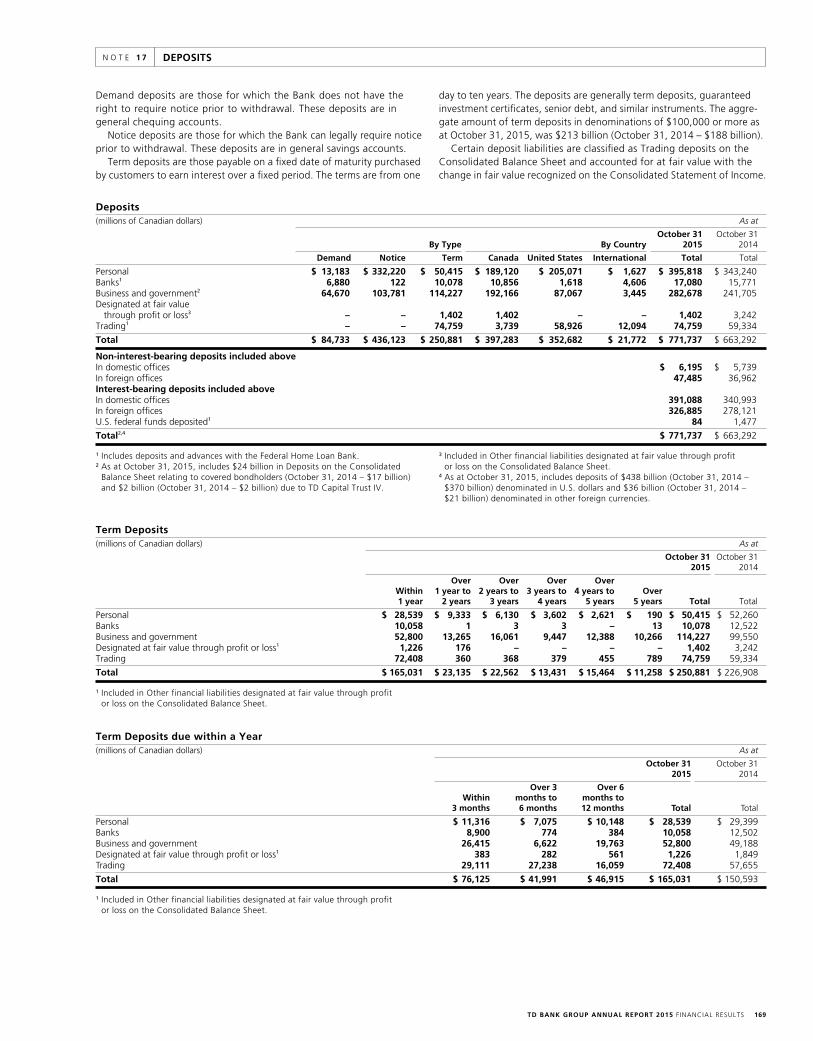
TD BANK GROUP ANNUAL REPORT 2015 F INANCIAL RESULTS 169
DEPOSITSN O T E 1 7
Demand deposits are those for which the Bank does not have the right to require notice prior to withdrawal. These deposits are in general chequing accounts.
Notice deposits are those for which the Bank can legally require notice prior to withdrawal. These deposits are in general savings accounts.
Term deposits are those payable on a fixed date of maturity purchased by customers to earn interest over a fixed period. The terms are from one
day to ten years. The deposits are generally term deposits, guaranteed investment certificates, senior debt, and similar instruments. The aggre-gate amount of term deposits in denominations of $100,000 or more as at October 31, 2015, was $213 billion (October 31, 2014 – $188 billion).
Certain deposit liabilities are classified as Trading deposits on the Consolidated Balance Sheet and accounted for at fair value with the change in fair value recognized on the Consolidated Statement of Income.
Deposits(millions of Canadian dollars) As at
October 31 October 31 By Type By Country 2015 2014
Demand Notice Term Canada United States International Total Total
Personal $ 13,183 $ 332,220 $ 50,415 $ 189,120 $ 205,071 $ 1,627 $ 395,818 $ 343,240 Banks1 6,880 122 10,078 10,856 1,618 4,606 17,080 15,771 Business and government2 64,670 103,781 114,227 192,166 87,067 3,445 282,678 241,705 Designated at fair value
through profit or loss3 – – 1,402 1,402 – – 1,402 3,242 Trading1 – – 74,759 3,739 58,926 12,094 74,759 59,334
Total $ 84,733 $ 436,123 $ 250,881 $ 397,283 $ 352,682 $ 21,772 $ 771,737 $ 663,292
Non-interest-bearing deposits included aboveIn domestic offices $ 6,195 $ 5,739 In foreign offices 47,485 36,962 Interest-bearing deposits included above In domestic offices 391,088 340,993 In foreign offices 326,885 278,121 U.S. federal funds deposited1 84 1,477
Total2,4 $ 771,737 $ 663,292
1 Includes deposits and advances with the Federal Home Loan Bank.2 As at October 31, 2015, includes $24 billion in Deposits on the Consolidated
Balance Sheet relating to covered bondholders (October 31, 2014 – $17 billion) and $2 billion (October 31, 2014 – $2 billion) due to TD Capital Trust IV.
3 Included in Other financial liabilities designated at fair value through profit or loss on the Consolidated Balance Sheet.
4 As at October 31, 2015, includes deposits of $438 billion (October 31, 2014 – $370 billion) denominated in U.S. dollars and $36 billion (October 31, 2014 – $21 billion) denominated in other foreign currencies.
Term Deposits(millions of Canadian dollars) As at
October 31 October 31 2015 2014
Over Over Over Over Within 1 year to 2 years to 3 years to 4 years to Over 1 year 2 years 3 years 4 years 5 years 5 years Total Total
Personal $ 28,539 $ 9,333 $ 6,130 $ 3,602 $ 2,621 $ 190 $ 50,415 $ 52,260 Banks 10,058 1 3 3 – 13 10,078 12,522 Business and government 52,800 13,265 16,061 9,447 12,388 10,266 114,227 99,550 Designated at fair value through profit or loss1 1,226 176 – – – – 1,402 3,242 Trading 72,408 360 368 379 455 789 74,759 59,334
Total $ 165,031 $ 23,135 $ 22,562 $ 13,431 $ 15,464 $ 11,258 $ 250,881 $ 226,908
1 Included in Other financial liabilities designated at fair value through profit or loss on the Consolidated Balance Sheet.
Term Deposits due within a Year(millions of Canadian dollars) As at
October 31 October 31 2015 2014
Over 3 Over 6 Within months to months to 3 months 6 months 12 months Total Total
Personal $ 11,316 $ 7,075 $ 10,148 $ 28,539 $ 29,399 Banks 8,900 774 384 10,058 12,502 Business and government 26,415 6,622 19,763 52,800 49,188 Designated at fair value through profit or loss1 383 282 561 1,226 1,849 Trading 29,111 27,238 16,059 72,408 57,655
Total $ 76,125 $ 41,991 $ 46,915 $ 165,031 $ 150,593
1 Included in Other financial liabilities designated at fair value through profit or loss on the Consolidated Balance Sheet.

TD BANK GROUP ANNUAL REPORT 2015 F INANCIAL RESULTS170
SUBORDINATED NOTES AND DEBENTURES N O T E 1 9
Subordinated notes and debentures are direct unsecured obligations of the Bank or its subsidiaries and are subordinated in right of payment to the claims of depositors and certain other creditors. Redemptions,
cancellations, exchanges, and modifications of subordinated deben-tures qualifying as regulatory capital are subject to the consent and approval of OSFI.
Subordinated Notes and Debentures(millions of Canadian dollars, except as noted) As at
Earliest par Interest Reset redemption October 31 October 31 Maturity date rate (%) spread (%) date 2015 2014
April 2, 20201 5.482 2.002 April 2, 2015 $ – $ 869 November 2, 20203 3.372 1.252 November 2, 2015 998 997 September 20, 20224 4.642 1.002 September 20, 2017 267 268 July 9, 2023 5.832 2.552 July 9, 2018 650 650 May 26, 2025 9.15 n/a5 – 199 199 June 24, 20256 2.692 1.212 June 24, 2020 1,489 – September 30, 20256 2.982 1.832 September 30, 2020 1,000 – October 30, 21048 4.977 1.777 October 30, 2015 – 796 December 14, 2105 4.787 1.747 December 14, 2016 2,235 2,211 December 18, 2106 5.767 1.997 December 18, 2017 1,799 1,795
Total $ 8,637 $ 7,785
1 On April 2, 2015 (“Redemption Date”), the Bank redeemed all of its outstanding $875 million 5.48% subordinated debentures due April 2, 2020, at a redemption price of 100% of the principal amount. Interest on the debentures ceased to accrue on and after the Redemption Date.
2 Interest rate is for the period to but excluding the earliest par redemption date, and thereafter, it will be reset at a rate of 3-month Bankers’ Acceptance rate plus the reset spread noted.
3 On September 15, 2015, the Bank announced its intention to redeem all of its outstanding $1 billion 3.367% subordinated debentures due November 2, 2020 on November 2, 2015, at a redemption price of 100% of the principal amount.
4 Obligation of a subsidiary.5 Not applicable.
6 Non-viability contingent capital (NVCC). The subordinated notes and debentures qualify as regulatory capital under OSFI’s CAR guideline. If a NVCC conversion were to occur in accordance with the NVCC Provisions, the maximum number of common shares that could be issued based on the formula for conversion set out in the respective prospectus supplements, assuming there are no declared and unpaid interest on the respective subordinated notes, as applicable, would be $450 million for the 2.692% subordinated debentures due June 24, 2025, and $300 million for the 2.982% subordinated debentures due September 30, 2025.
7 Interest rate is for the period to but excluding the earliest par redemption date, and thereafter, it will be reset every 5 years at a rate of 5-year Government of Canada yield plus the reset spread noted.
8 On October 30, 2015 (the “Redemption Date”), the Bank redeemed all of its outstanding $800 million 4.97% subordinated debentures due October 30, 2104, at a redemption price of 100% of the principal amount. Interest on the debentures ceased to accrue on and after the Redemption Date.
OTHER LIABILITIESN O T E 1 8
Other Liabilities(millions of Canadian dollars) As at
October 31 October 31 2015 2014
Accounts payable, accrued expenses, and other items $ 3,901 $ 3,666 Accrued interest 882 943 Accrued salaries and employee benefits 2,601 2,653 Cheques and other items in transit – 237 Current income tax payable 69 34 Deferred tax liabilities 323 287 Defined benefit liability 1,947 2,393 Liabilities related to structured entities 3,400 5,053 Provisions 1,100 631
Total $ 14,223 $ 15,897
REPAYMENT SCHEDULEThe aggregate remaining maturities of the Bank’s subordinated notes and debentures are as follows:
Maturities(millions of Canadian dollars) As at
October 31 October 31 2015 2014
Within 1 year $ 998 $ – Over 1 year to 3 years – – Over 3 years to 4 years – – Over 4 years to 5 years – – Over 5 years 7,639 7,785
Total $ 8,637 $ 7,785
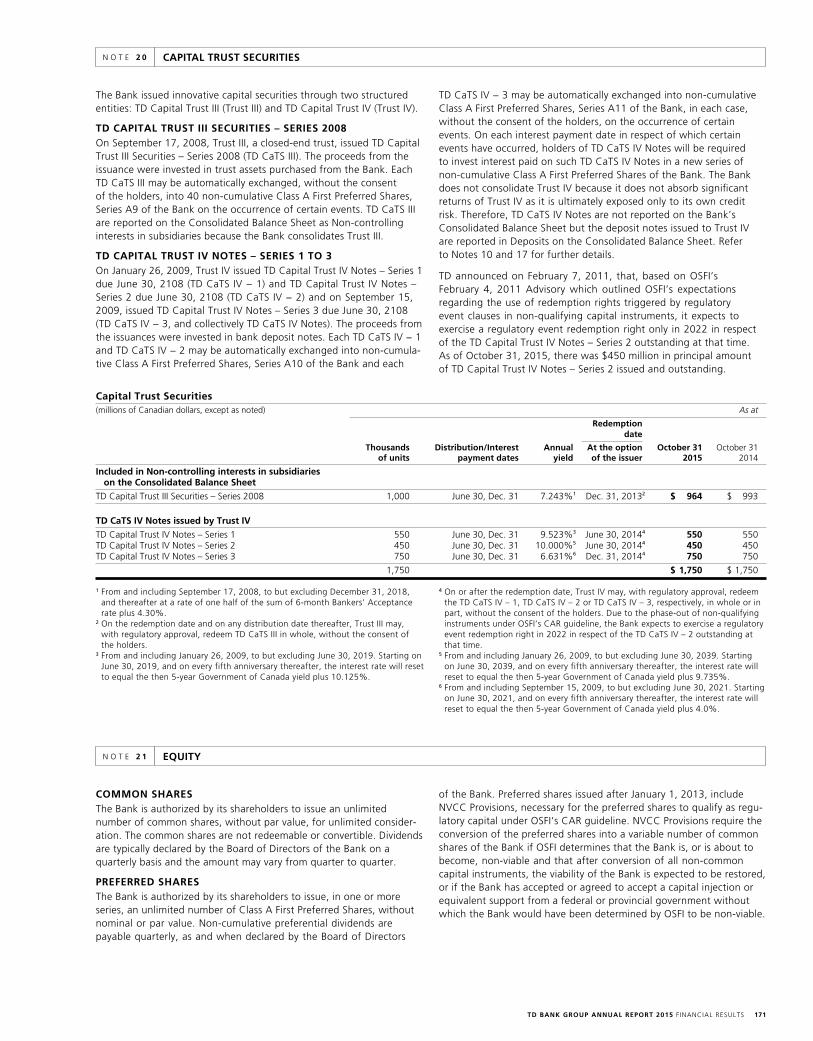
TD BANK GROUP ANNUAL REPORT 2015 F INANCIAL RESULTS 171
CAPITAL TRUST SECURITIESN O T E 2 0
The Bank issued innovative capital securities through two structured entities: TD Capital Trust III (Trust III) and TD Capital Trust IV (Trust IV).
TD CAPITAL TRUST III SECURITIES – SERIES 2008 On September 17, 2008, Trust III, a closed-end trust, issued TD Capital Trust III Securities – Series 2008 (TD CaTS III). The proceeds from the issuance were invested in trust assets purchased from the Bank. Each TD CaTS III may be automatically exchanged, without the consent of the holders, into 40 non-cumulative Class A First Preferred Shares, Series A9 of the Bank on the occurrence of certain events. TD CaTS III are reported on the Consolidated Balance Sheet as Non-controlling interests in subsidiaries because the Bank consolidates Trust III.
TD CAPITAL TRUST IV NOTES – SERIES 1 TO 3 On January 26, 2009, Trust IV issued TD Capital Trust IV Notes – Series 1 due June 30, 2108 (TD CaTS IV − 1) and TD Capital Trust IV Notes – Series 2 due June 30, 2108 (TD CaTS IV − 2) and on September 15, 2009, issued TD Capital Trust IV Notes – Series 3 due June 30, 2108 (TD CaTS IV − 3, and collectively TD CaTS IV Notes). The proceeds from the issuances were invested in bank deposit notes. Each TD CaTS IV − 1 and TD CaTS IV − 2 may be automatically exchanged into non-cumula-tive Class A First Preferred Shares, Series A10 of the Bank and each
TD CaTS IV − 3 may be automatically exchanged into non-cumulative Class A First Preferred Shares, Series A11 of the Bank, in each case, without the consent of the holders, on the occurrence of certain events. On each interest payment date in respect of which certain events have occurred, holders of TD CaTS IV Notes will be required to invest interest paid on such TD CaTS IV Notes in a new series of non-cumulative Class A First Preferred Shares of the Bank. The Bank does not consolidate Trust IV because it does not absorb significant returns of Trust IV as it is ultimately exposed only to its own credit risk. Therefore, TD CaTS IV Notes are not reported on the Bank’s Consolidated Balance Sheet but the deposit notes issued to Trust IV are reported in Deposits on the Consolidated Balance Sheet. Refer to Notes 10 and 17 for further details.
TD announced on February 7, 2011, that, based on OSFI’s February 4, 2011 Advisory which outlined OSFI’s expectations regarding the use of redemption rights triggered by regulatory event clauses in non-qualifying capital instruments, it expects to exercise a regulatory event redemption right only in 2022 in respect of the TD Capital Trust IV Notes – Series 2 outstanding at that time. As of October 31, 2015, there was $450 million in principal amount of TD Capital Trust IV Notes – Series 2 issued and outstanding.
Capital Trust Securities(millions of Canadian dollars, except as noted) As at
Redemption date
Thousands Distribution/Interest Annual At the option October 31 October 31 of units payment dates yield of the issuer 2015 2014
Included in Non-controlling interests in subsidiaries on the Consolidated Balance Sheet
TD Capital Trust III Securities – Series 2008 1,000 June 30, Dec. 31 7.243%1 Dec. 31, 20132 $ 964 $ 993
TD CaTS IV Notes issued by Trust IV
TD Capital Trust IV Notes – Series 1 550 June 30, Dec. 31 9.523%3 June 30, 20144 550 550 TD Capital Trust IV Notes – Series 2 450 June 30, Dec. 31 10.000%5 June 30, 20144 450 450 TD Capital Trust IV Notes – Series 3 750 June 30, Dec. 31 6.631%6 Dec. 31, 20144 750 750
1,750 $ 1,750 $ 1,750
1 From and including September 17, 2008, to but excluding December 31, 2018, and thereafter at a rate of one half of the sum of 6-month Bankers’ Acceptance rate plus 4.30%.
2 On the redemption date and on any distribution date thereafter, Trust III may, with regulatory approval, redeem TD CaTS III in whole, without the consent of the holders.
3 From and including January 26, 2009, to but excluding June 30, 2019. Starting on June 30, 2019, and on every fifth anniversary thereafter, the interest rate will reset to equal the then 5-year Government of Canada yield plus 10.125%.
4 On or after the redemption date, Trust IV may, with regulatory approval, redeem the TD CaTS IV – 1, TD CaTS IV – 2 or TD CaTS IV – 3, respectively, in whole or in part, without the consent of the holders. Due to the phase-out of non-qualifying instruments under OSFI’s CAR guideline, the Bank expects to exercise a regulatory event redemption right in 2022 in respect of the TD CaTS IV – 2 outstanding at that time.
5 From and including January 26, 2009, to but excluding June 30, 2039. Starting on June 30, 2039, and on every fifth anniversary thereafter, the interest rate will reset to equal the then 5-year Government of Canada yield plus 9.735%.
6 From and including September 15, 2009, to but excluding June 30, 2021. Starting on June 30, 2021, and on every fifth anniversary thereafter, the interest rate will reset to equal the then 5-year Government of Canada yield plus 4.0%.
EQUITYN O T E 2 1
COMMON SHARESThe Bank is authorized by its shareholders to issue an unlimited number of common shares, without par value, for unlimited consider-ation. The common shares are not redeemable or convertible. Dividends are typically declared by the Board of Directors of the Bank on a quarterly basis and the amount may vary from quarter to quarter.
PREFERRED SHARESThe Bank is authorized by its shareholders to issue, in one or more series, an unlimited number of Class A First Preferred Shares, without nominal or par value. Non-cumulative preferential dividends are payable quarterly, as and when declared by the Board of Directors
of the Bank. Preferred shares issued after January 1, 2013, include NVCC Provisions, necessary for the preferred shares to qualify as regu-latory capital under OSFI’s CAR guideline. NVCC Provisions require the conversion of the preferred shares into a variable number of common shares of the Bank if OSFI determines that the Bank is, or is about to become, non-viable and that after conversion of all non-common capital instruments, the viability of the Bank is expected to be restored, or if the Bank has accepted or agreed to accept a capital injection or equivalent support from a federal or provincial government without which the Bank would have been determined by OSFI to be non-viable.
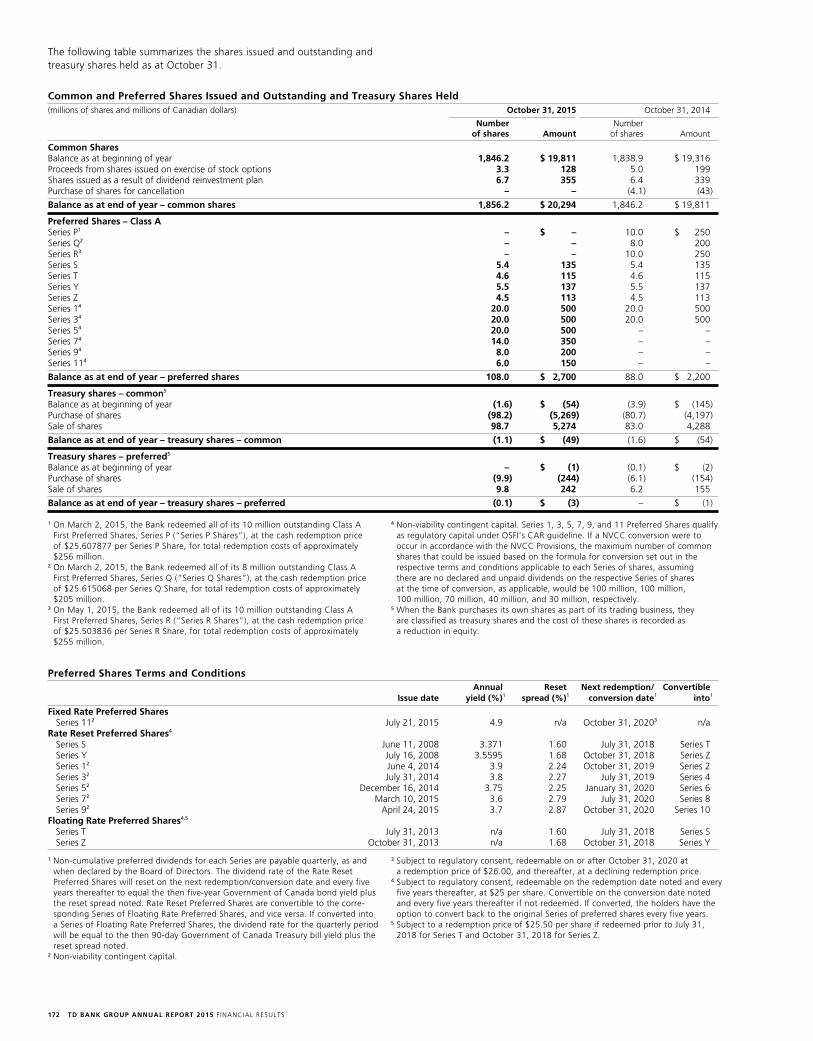
TD BANK GROUP ANNUAL REPORT 2015 F INANCIAL RESULTS172
The following table summarizes the shares issued and outstanding and treasury shares held as at October 31.
Common and Preferred Shares Issued and Outstanding and Treasury Shares Held(millions of shares and millions of Canadian dollars) October 31, 2015 October 31, 2014
Number Number of shares Amount of shares Amount
Common SharesBalance as at beginning of year 1,846.2 $ 19,811 1,838.9 $ 19,316 Proceeds from shares issued on exercise of stock options 3.3 128 5.0 199 Shares issued as a result of dividend reinvestment plan 6.7 355 6.4 339 Purchase of shares for cancellation – – (4.1) (43)
Balance as at end of year – common shares 1,856.2 $ 20,294 1,846.2 $ 19,811
Preferred Shares – Class ASeries P1 – $ – 10.0 $ 250 Series Q2 – – 8.0 200 Series R3 – – 10.0 250 Series S 5.4 135 5.4 135 Series T 4.6 115 4.6 115 Series Y 5.5 137 5.5 137 Series Z 4.5 113 4.5 113 Series 14 20.0 500 20.0 500 Series 34 20.0 500 20.0 500 Series 54 20.0 500 – – Series 74 14.0 350 – – Series 94 8.0 200 – – Series 114 6.0 150 – –
Balance as at end of year – preferred shares 108.0 $ 2,700 88.0 $ 2,200
Treasury shares – common5 Balance as at beginning of year (1.6) $ (54) (3.9) $ (145)Purchase of shares (98.2) (5,269) (80.7) (4,197)Sale of shares 98.7 5,274 83.0 4,288
Balance as at end of year – treasury shares – common (1.1) $ (49) (1.6) $ (54)
Treasury shares – preferred5
Balance as at beginning of year – $ (1) (0.1) $ (2)Purchase of shares (9.9) (244) (6.1) (154)Sale of shares 9.8 242 6.2 155
Balance as at end of year – treasury shares – preferred (0.1) $ (3) – $ (1)
1 On March 2, 2015, the Bank redeemed all of its 10 million outstanding Class A First Preferred Shares, Series P (“Series P Shares”), at the cash redemption price of $25.607877 per Series P Share, for total redemption costs of approximately $256 million.
2 On March 2, 2015, the Bank redeemed all of its 8 million outstanding Class A First Preferred Shares, Series Q (“Series Q Shares”), at the cash redemption price of $25.615068 per Series Q Share, for total redemption costs of approximately $205 million.
3 On May 1, 2015, the Bank redeemed all of its 10 million outstanding Class A First Preferred Shares, Series R (“Series R Shares”), at the cash redemption price of $25.503836 per Series R Share, for total redemption costs of approximately $255 million.
4 Non-viability contingent capital. Series 1, 3, 5, 7, 9, and 11 Preferred Shares qualify as regulatory capital under OSFI’s CAR guideline. If a NVCC conversion were to occur in accordance with the NVCC Provisions, the maximum number of common shares that could be issued based on the formula for conversion set out in the respective terms and conditions applicable to each Series of shares, assuming there are no declared and unpaid dividends on the respective Series of shares at the time of conversion, as applicable, would be 100 million, 100 million, 100 million, 70 million, 40 million, and 30 million, respectively.
5 When the Bank purchases its own shares as part of its trading business, they are classified as treasury shares and the cost of these shares is recorded as a reduction in equity.
Preferred Shares Terms and Conditions Annual Reset Next redemption/ Convertible Issue date yield (%)1 spread (%)1 conversion date1 into1
Fixed Rate Preferred Shares Series 112 July 21, 2015 4.9 n/a October 31, 20203 n/a Rate Reset Preferred Shares4 Series S June 11, 2008 3.371 1.60 July 31, 2018 Series T Series Y July 16, 2008 3.5595 1.68 October 31, 2018 Series Z Series 12 June 4, 2014 3.9 2.24 October 31, 2019 Series 2 Series 32 July 31, 2014 3.8 2.27 July 31, 2019 Series 4 Series 52 December 16, 2014 3.75 2.25 January 31, 2020 Series 6 Series 72 March 10, 2015 3.6 2.79 July 31, 2020 Series 8 Series 92 April 24, 2015 3.7 2.87 October 31, 2020 Series 10 Floating Rate Preferred Shares4,5 Series T July 31, 2013 n/a 1.60 July 31, 2018 Series S Series Z October 31, 2013 n/a 1.68 October 31, 2018 Series Y
1 Non-cumulative preferred dividends for each Series are payable quarterly, as and when declared by the Board of Directors. The dividend rate of the Rate Reset Preferred Shares will reset on the next redemption/conversion date and every five years thereafter to equal the then five-year Government of Canada bond yield plus the reset spread noted. Rate Reset Preferred Shares are convertible to the corre-sponding Series of Floating Rate Preferred Shares, and vice versa. If converted into a Series of Floating Rate Preferred Shares, the dividend rate for the quarterly period will be equal to the then 90-day Government of Canada Treasury bill yield plus the reset spread noted.
2 Non-viability contingent capital.
3 Subject to regulatory consent, redeemable on or after October 31, 2020 at a redemption price of $26.00, and thereafter, at a declining redemption price.
4 Subject to regulatory consent, redeemable on the redemption date noted and every five years thereafter, at $25 per share. Convertible on the conversion date noted and every five years thereafter if not redeemed. If converted, the holders have the option to convert back to the original Series of preferred shares every five years.
5 Subject to a redemption price of $25.50 per share if redeemed prior to July 31, 2018 for Series T and October 31, 2018 for Series Z.
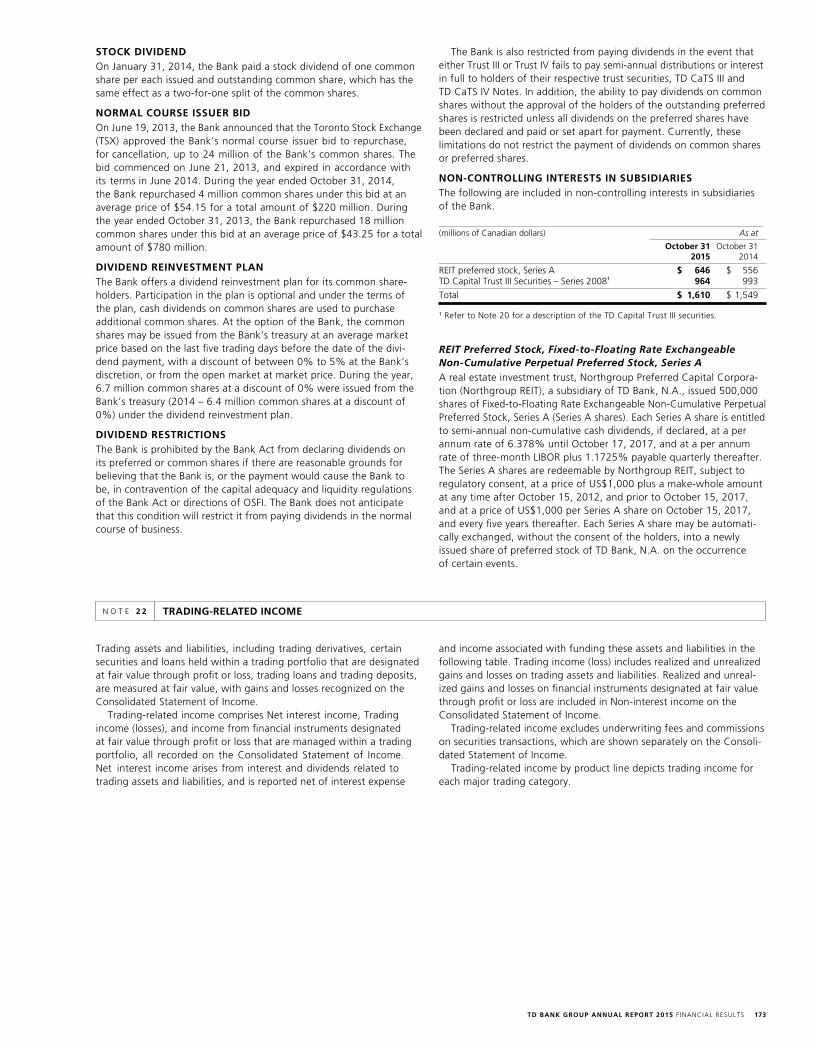
TD BANK GROUP ANNUAL REPORT 2015 F INANCIAL RESULTS 173
STOCK DIVIDENDOn January 31, 2014, the Bank paid a stock dividend of one common share per each issued and outstanding common share, which has the same effect as a two-for-one split of the common shares.
NORMAL COURSE ISSUER BIDOn June 19, 2013, the Bank announced that the Toronto Stock Exchange (TSX) approved the Bank’s normal course issuer bid to repurchase, for cancellation, up to 24 million of the Bank’s common shares. The bid commenced on June 21, 2013, and expired in accordance with its terms in June 2014. During the year ended October 31, 2014, the Bank repurchased 4 million common shares under this bid at an average price of $54.15 for a total amount of $220 million. During the year ended October 31, 2013, the Bank repurchased 18 million common shares under this bid at an average price of $43.25 for a total amount of $780 million.
DIVIDEND REINVESTMENT PLANThe Bank offers a dividend reinvestment plan for its common share-holders. Participation in the plan is optional and under the terms of the plan, cash dividends on common shares are used to purchase additional common shares. At the option of the Bank, the common shares may be issued from the Bank’s treasury at an average market price based on the last five trading days before the date of the divi-dend payment, with a discount of between 0% to 5% at the Bank’s discretion, or from the open market at market price. During the year, 6.7 million common shares at a discount of 0% were issued from the Bank’s treasury (2014 – 6.4 million common shares at a discount of 0%) under the dividend reinvestment plan.
DIVIDEND RESTRICTIONSThe Bank is prohibited by the Bank Act from declaring dividends on its preferred or common shares if there are reasonable grounds for believing that the Bank is, or the payment would cause the Bank to be, in contravention of the capital adequacy and liquidity regulations of the Bank Act or directions of OSFI. The Bank does not anticipate that this condition will restrict it from paying dividends in the normal course of business.
The Bank is also restricted from paying dividends in the event that either Trust III or Trust IV fails to pay semi-annual distributions or interest in full to holders of their respective trust securities, TD CaTS III and TD CaTS IV Notes. In addition, the ability to pay dividends on common shares without the approval of the holders of the outstanding preferred shares is restricted unless all dividends on the preferred shares have been declared and paid or set apart for payment. Currently, these limitations do not restrict the payment of dividends on common shares or preferred shares.
NON-CONTROLLING INTERESTS IN SUBSIDIARIES The following are included in non-controlling interests in subsidiaries of the Bank.
(millions of Canadian dollars) As at
October 31 October 31 2015 2014
REIT preferred stock, Series A $ 646 $ 556 TD Capital Trust III Securities – Series 20081 964 993
Total $ 1,610 $ 1,549
1 Refer to Note 20 for a description of the TD Capital Trust III securities.
REIT Preferred Stock, Fixed-to-Floating Rate Exchangeable Non-Cumulative Perpetual Preferred Stock, Series A A real estate investment trust, Northgroup Preferred Capital Corpora-tion (Northgroup REIT), a subsidiary of TD Bank, N.A., issued 500,000 shares of Fixed-to-Floating Rate Exchangeable Non-Cumulative Perpetual Preferred Stock, Series A (Series A shares). Each Series A share is entitled to semi-annual non-cumulative cash dividends, if declared, at a per annum rate of 6.378% until October 17, 2017, and at a per annum rate of three-month LIBOR plus 1.1725% payable quarterly thereafter. The Series A shares are redeemable by Northgroup REIT, subject to regulatory consent, at a price of US$1,000 plus a make-whole amount at any time after October 15, 2012, and prior to October 15, 2017, and at a price of US$1,000 per Series A share on October 15, 2017, and every five years thereafter. Each Series A share may be automati-cally exchanged, without the consent of the holders, into a newly issued share of preferred stock of TD Bank, N.A. on the occurrence of certain events.
TRADING-RELATED INCOMEN O T E 2 2
Trading assets and liabilities, including trading derivatives, certain securities and loans held within a trading portfolio that are designated at fair value through profit or loss, trading loans and trading deposits, are measured at fair value, with gains and losses recognized on the Consolidated Statement of Income.
Trading-related income comprises Net interest income, Trading income (losses), and income from financial instruments designated at fair value through profit or loss that are managed within a trading portfolio, all recorded on the Consolidated Statement of Income. Net interest income arises from interest and dividends related to trading assets and liabilities, and is reported net of interest expense
and income associated with funding these assets and liabilities in the following table. Trading income (loss) includes realized and unrealized gains and losses on trading assets and liabilities. Realized and unreal-ized gains and losses on financial instruments designated at fair value through profit or loss are included in Non-interest income on the Consolidated Statement of Income.
Trading-related income excludes underwriting fees and commissions on securities transactions, which are shown separately on the Consoli-dated Statement of Income.
Trading-related income by product line depicts trading income for each major trading category.

TD BANK GROUP ANNUAL REPORT 2015 F INANCIAL RESULTS174
Trading-Related Income(millions of Canadian dollars) For the years ended October 31
2015 2014 2013
Net interest income (loss) $ 1,380 $ 1,337 $ 1,231 Trading income (loss) (223) (349) (279)Financial instruments designated at fair value through profit or loss1 (5) (9) (6)
Total 1,152 979 946
By productInterest rate and credit portfolios 636 601 557 Foreign exchange portfolios 467 385 368 Equity and other portfolios 54 2 27 Financial instruments designated at fair value through profit or loss1 (5) (9) (6)
Total $ 1,152 $ 979 $ 946
1 Excludes amounts related to securities designated at fair value through profit or loss that are not managed within a trading portfolio, but which have been combined with derivatives to form economic hedging relationships.
INSURANCEN O T E 2 3
INSURANCE RISK The Bank is engaged in insurance businesses relating to property and casualty insurance, life and health insurance, and reinsurance through various subsidiaries; it is through these businesses that the Bank is exposed to insurance risk.
Insurance risk is the risk of financial loss due to actual experience emerging differently from expectations in insurance product pricing or reserving. Unfavourable experience could emerge due to adverse fluc-tuations in timing, actual size and/or frequency of claims (for example, driven by non-life premium risk, non-life reserving risk, catastrophic risk, mortality risk, morbidity risk, and longevity risk), policyholder behaviour, or associated expenses.
Insurance contracts provide financial protection by transferring insured risks to the issuer in exchange for premiums.
Senior management within the insurance business units has primary responsibility for managing insurance risk with oversight by the Chief Risk Officer for Insurance who reports into Risk Management. The Audit Committee of the Board acts as the Audit and Conduct Review Committee for the Canadian Insurance company subsidiaries. The insurance company subsidiaries also have their own Boards of Directors who provide additional risk management oversight.
The Bank’s risk governance practises ensure strong independent oversight and control of risk within the insurance business. The Risk Committee for the Insurance business provides critical oversight of the risk management activities within the business and monitors compliance with insurance risk policies. The Bank’s Insurance Risk Management Framework and Insurance Risk Policy collectively outline the internal risk and control structure to manage insurance risk and include risk appetite, policies, processes as well as limits and governance. These documents are maintained by Risk Management and support alignment with the Bank’s risk appetite for insurance risk.
The Bank establishes reserves to cover estimated future payments (including loss adjustment expenses) on all claims arising from insur-ance contracts underwritten. The reserves cannot be established with complete certainty, and represent management’s best estimate for future claim payments. As such, the Bank regularly monitors liability estimates against claims experience and adjusts reserves as appropriate if experience emerges differently than anticipated. Claim liabilities are governed by the Bank’s general insurance reserving policy.
Sound product design is an essential element of managing risk. The Bank’s exposure to insurance risk is generally short term in nature as the principal underwriting risk relates to automobile and home insurance for individuals.
Insurance market cycles as well as changes in automobile insurance legislation, the judicial environment, trends in court awards, climate patterns and the economic environment may impact the performance of the Insurance business. Consistent pricing policies and underwriting standards are maintained.
There is also exposure to geographic concentration risk associated with personal property coverage. Exposure to insurance risk concentra-tion is managed through established underwriting guidelines, limits, and authorization levels that govern the acceptance of risk. Concentration of insurance risk is also mitigated through the purchase of reinsurance. The insurance business’ reinsurance programs are governed by catas-trophe and reinsurance risk management policies.
Strategies are in place to manage the risk to the Bank’s reinsurance business. Underwriting risk on business assumed is managed through a policy that limits exposure to certain types of business and countries. The vast majority of reinsurance treaties are annually renewable, which minimizes long-term risk. Pandemic exposure is reviewed and estimated annually.
OTHER RELATED RISKSThe Bank’s mitigation of insurance risk through the purchase of reinsurance gives rise to counterparty credit risk exposure. This coun-terparty credit risk is managed through catastrophe and reinsurance risk management policies. To properly manage interest rate risk and liquidity risk, the Bank maintains a system to match a portion of its investments to the net provision for unpaid claims. Therefore, most of the change in the value of the assets held for matching purposes will be offset by a corresponding change in the net provision for unpaid claims’ discounted values. Interest rate risk and liquidity risk are managed through investment policies.
INSURANCE REVENUE AND EXPENSES Insurance revenue is presented on the Consolidated Statement of Income under Insurance revenue and claims-related expenses are presented under Insurance claims and related expenses, including the impacts of claims and reinsurance on the Consolidated Statement of Income.
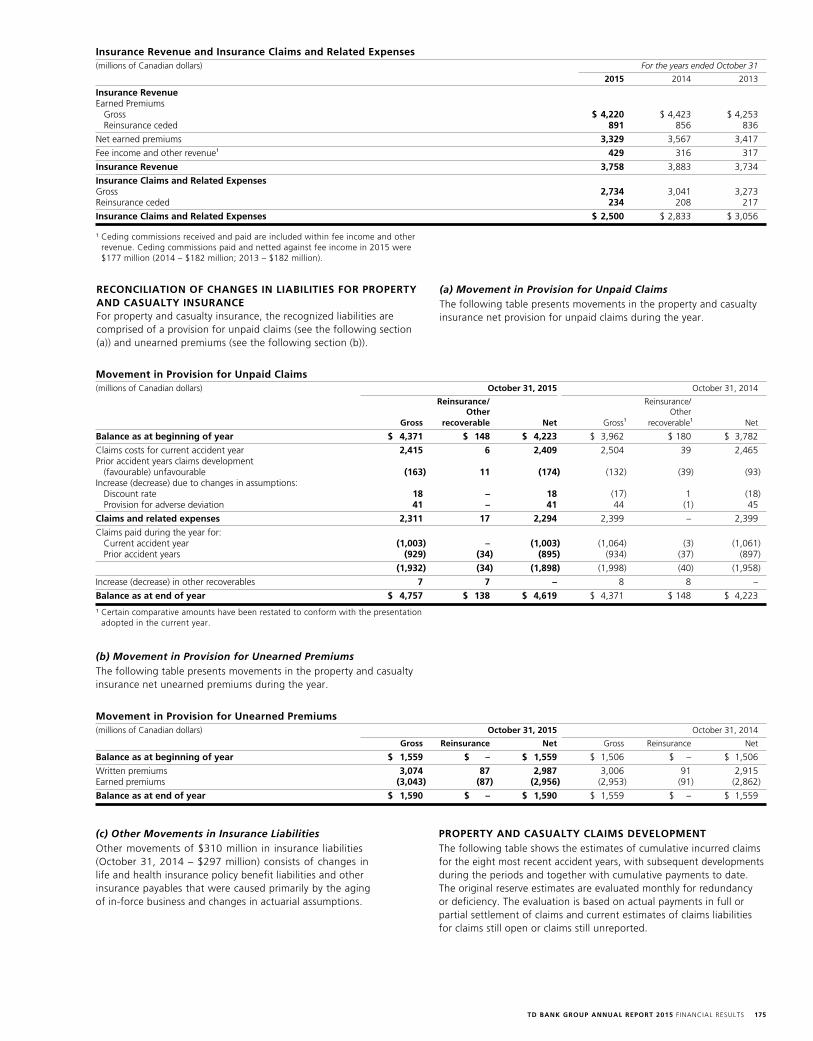
TD BANK GROUP ANNUAL REPORT 2015 F INANCIAL RESULTS 175
Insurance Revenue and Insurance Claims and Related Expenses(millions of Canadian dollars) For the years ended October 31
2015 2014 2013
Insurance Revenue Earned Premiums Gross $ 4,220 $ 4,423 $ 4,253 Reinsurance ceded 891 856 836
Net earned premiums 3,329 3,567 3,417
Fee income and other revenue1 429 316 317
Insurance Revenue 3,758 3,883 3,734
Insurance Claims and Related ExpensesGross 2,734 3,041 3,273 Reinsurance ceded 234 208 217
Insurance Claims and Related Expenses $ 2,500 $ 2,833 $ 3,056
1 Ceding commissions received and paid are included within fee income and other revenue. Ceding commissions paid and netted against fee income in 2015 were $177 million (2014 – $182 million; 2013 – $182 million).
RECONCILIATION OF CHANGES IN LIABILITIES FOR PROPERTY AND CASUALTY INSURANCEFor property and casualty insurance, the recognized liabilities are comprised of a provision for unpaid claims (see the following section (a)) and unearned premiums (see the following section (b)).
(a) Movement in Provision for Unpaid ClaimsThe following table presents movements in the property and casualty insurance net provision for unpaid claims during the year.
Movement in Provision for Unpaid Claims(millions of Canadian dollars) October 31, 2015 October 31, 2014
Reinsurance/ Reinsurance/ Other Other Gross recoverable Net Gross1 recoverable1 Net
Balance as at beginning of year $ 4,371 $ 148 $ 4,223 $ 3,962 $ 180 $ 3,782
Claims costs for current accident year 2,415 6 2,409 2,504 39 2,465 Prior accident years claims development
(favourable) unfavourable (163) 11 (174) (132) (39) (93) Increase (decrease) due to changes in assumptions: Discount rate 18 – 18 (17) 1 (18) Provision for adverse deviation 41 – 41 44 (1) 45
Claims and related expenses 2,311 17 2,294 2,399 – 2,399
Claims paid during the year for: Current accident year (1,003) – (1,003) (1,064) (3) (1,061)
Prior accident years (929) (34) (895) (934) (37) (897)
(1,932) (34) (1,898) (1,998) (40) (1,958)
Increase (decrease) in other recoverables 7 7 – 8 8 –
Balance as at end of year $ 4,757 $ 138 $ 4,619 $ 4,371 $ 148 $ 4,223
1 Certain comparative amounts have been restated to conform with the presentation adopted in the current year.
(b) Movement in Provision for Unearned PremiumsThe following table presents movements in the property and casualty insurance net unearned premiums during the year.
Movement in Provision for Unearned Premiums(millions of Canadian dollars) October 31, 2015 October 31, 2014
Gross Reinsurance Net Gross Reinsurance Net
Balance as at beginning of year $ 1,559 $ – $ 1,559 $ 1,506 $ – $ 1,506
Written premiums 3,074 87 2,987 3,006 91 2,915 Earned premiums (3,043) (87) (2,956) (2,953) (91) (2,862)
Balance as at end of year $ 1,590 $ – $ 1,590 $ 1,559 $ – $ 1,559
(c) Other Movements in Insurance LiabilitiesOther movements of $310 million in insurance liabilities (October 31, 2014 – $297 million) consists of changes in life and health insurance policy benefit liabilities and other insurance payables that were caused primarily by the aging of in-force business and changes in actuarial assumptions.
PROPERTY AND CASUALTY CLAIMS DEVELOPMENTThe following table shows the estimates of cumulative incurred claims for the eight most recent accident years, with subsequent developments during the periods and together with cumulative payments to date. The original reserve estimates are evaluated monthly for redundancy or deficiency. The evaluation is based on actual payments in full or partial settlement of claims and current estimates of claims liabilities for claims still open or claims still unreported.
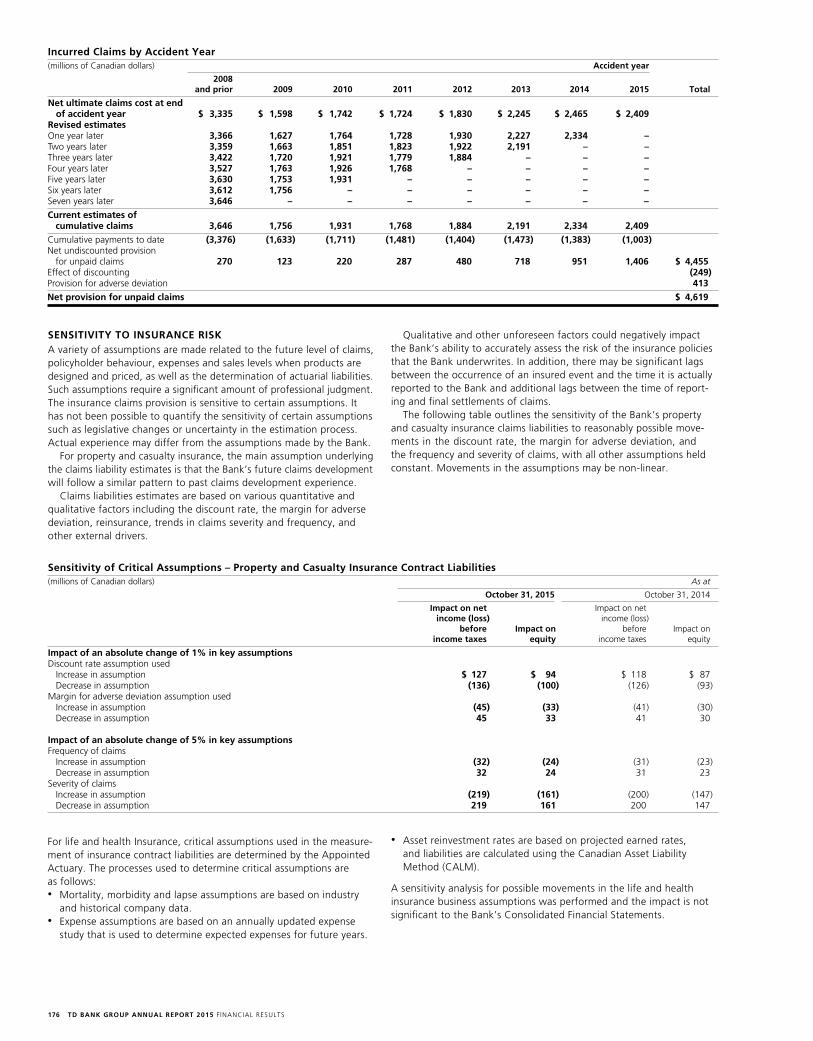
TD BANK GROUP ANNUAL REPORT 2015 F INANCIAL RESULTS176
Incurred Claims by Accident Year(millions of Canadian dollars) Accident year
2008 and prior 2009 2010 2011 2012 2013 2014 2015 Total
Net ultimate claims cost at end of accident year $ 3,335 $ 1,598 $ 1,742 $ 1,724 $ 1,830 $ 2,245 $ 2,465 $ 2,409
Revised estimatesOne year later 3,366 1,627 1,764 1,728 1,930 2,227 2,334 – Two years later 3,359 1,663 1,851 1,823 1,922 2,191 – – Three years later 3,422 1,720 1,921 1,779 1,884 – – – Four years later 3,527 1,763 1,926 1,768 – – – – Five years later 3,630 1,753 1,931 – – – – – Six years later 3,612 1,756 – – – – – – Seven years later 3,646 – – – – – – –
Current estimates of cumulative claims 3,646 1,756 1,931 1,768 1,884 2,191 2,334 2,409
Cumulative payments to date (3,376) (1,633) (1,711) (1,481) (1,404) (1,473) (1,383) (1,003) Net undiscounted provision
for unpaid claims 270 123 220 287 480 718 951 1,406 $ 4,455 Effect of discounting (249)Provision for adverse deviation 413
Net provision for unpaid claims $ 4,619
SENSITIVITY TO INSURANCE RISK A variety of assumptions are made related to the future level of claims, policyholder behaviour, expenses and sales levels when products are designed and priced, as well as the determination of actuarial liabilities. Such assumptions require a significant amount of professional judgment. The insurance claims provision is sensitive to certain assumptions. It has not been possible to quantify the sensitivity of certain assumptions such as legislative changes or uncertainty in the estimation process. Actual experience may differ from the assumptions made by the Bank.
For property and casualty insurance, the main assumption underlying the claims liability estimates is that the Bank’s future claims development will follow a similar pattern to past claims development experience.
Claims liabilities estimates are based on various quantitative and qualitative factors including the discount rate, the margin for adverse deviation, reinsurance, trends in claims severity and frequency, and other external drivers.
Qualitative and other unforeseen factors could negatively impact the Bank’s ability to accurately assess the risk of the insurance policies that the Bank underwrites. In addition, there may be significant lags between the occurrence of an insured event and the time it is actually reported to the Bank and additional lags between the time of report-ing and final settlements of claims.
The following table outlines the sensitivity of the Bank’s property and casualty insurance claims liabilities to reasonably possible move-ments in the discount rate, the margin for adverse deviation, and the frequency and severity of claims, with all other assumptions held constant. Movements in the assumptions may be non-linear.
Sensitivity of Critical Assumptions – Property and Casualty Insurance Contract Liabilities(millions of Canadian dollars) As at
October 31, 2015 October 31, 2014
Impact on net Impact on net income (loss) income (loss) before Impact on before Impact on income taxes equity income taxes equity
Impact of an absolute change of 1% in key assumptionsDiscount rate assumption used Increase in assumption $ 127 $ 94 $ 118 $ 87 Decrease in assumption (136) (100) (126) (93)Margin for adverse deviation assumption used Increase in assumption (45) (33) (41) (30) Decrease in assumption 45 33 41 30
Impact of an absolute change of 5% in key assumptionsFrequency of claims Increase in assumption (32) (24) (31) (23) Decrease in assumption 32 24 31 23 Severity of claims Increase in assumption (219) (161) (200) (147) Decrease in assumption 219 161 200 147
For life and health Insurance, critical assumptions used in the measure-ment of insurance contract liabilities are determined by the Appointed Actuary. The processes used to determine critical assumptions are as follows:• Mortality, morbidity and lapse assumptions are based on industry
and historical company data. • Expense assumptions are based on an annually updated expense
study that is used to determine expected expenses for future years.
• Asset reinvestment rates are based on projected earned rates, and liabilities are calculated using the Canadian Asset Liability Method (CALM).
A sensitivity analysis for possible movements in the life and health insurance business assumptions was performed and the impact is not significant to the Bank’s Consolidated Financial Statements.
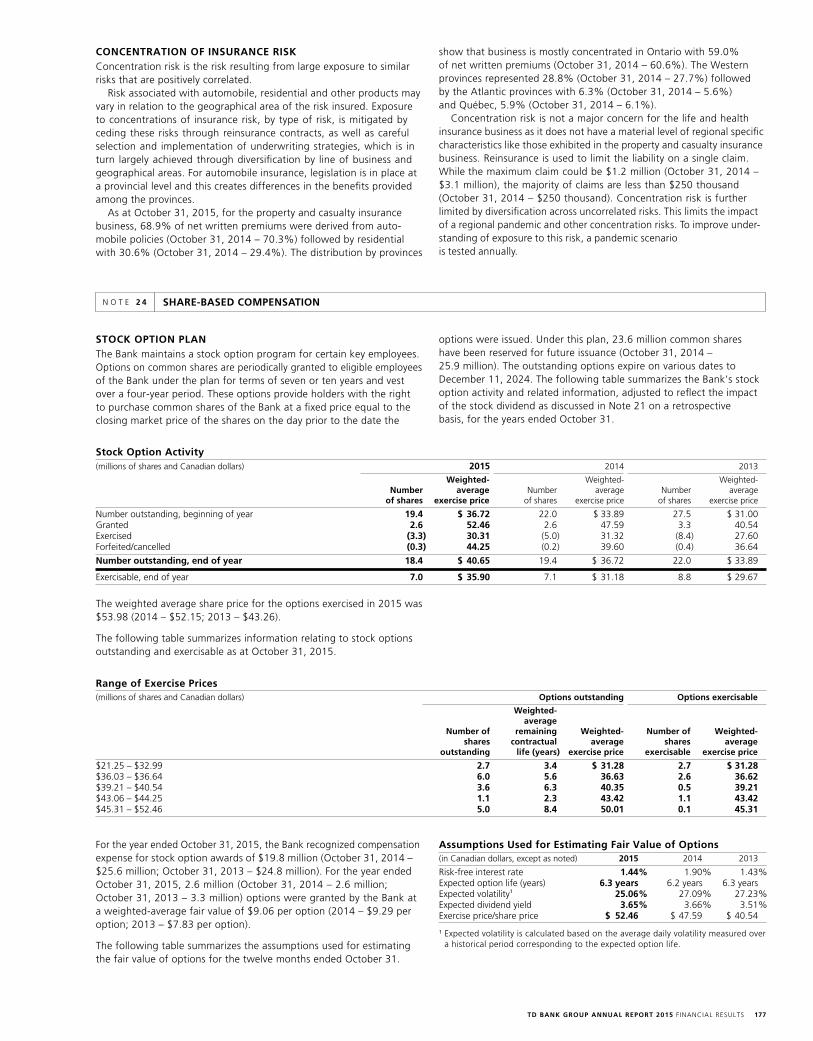
TD BANK GROUP ANNUAL REPORT 2015 F INANCIAL RESULTS 177
SHARE-BASED COMPENSATIONN O T E 2 4
STOCK OPTION PLANThe Bank maintains a stock option program for certain key employees. Options on common shares are periodically granted to eligible employees of the Bank under the plan for terms of seven or ten years and vest over a four-year period. These options provide holders with the right to purchase common shares of the Bank at a fixed price equal to the closing market price of the shares on the day prior to the date the
options were issued. Under this plan, 23.6 million common shares have been reserved for future issuance (October 31, 2014 – 25.9 million). The outstanding options expire on various dates to December 11, 2024. The following table summarizes the Bank’s stock option activity and related information, adjusted to reflect the impact of the stock dividend as discussed in Note 21 on a retrospective basis, for the years ended October 31.
Stock Option Activity(millions of shares and Canadian dollars) 2015 2014 2013
Weighted- Weighted- Weighted- Number average Number average Number average of shares exercise price of shares exercise price of shares exercise price
Number outstanding, beginning of year 19.4 $ 36.72 22.0 $ 33.89 27.5 $ 31.00 Granted 2.6 52.46 2.6 47.59 3.3 40.54 Exercised (3.3) 30.31 (5.0) 31.32 (8.4) 27.60 Forfeited/cancelled (0.3) 44.25 (0.2) 39.60 (0.4) 36.64
Number outstanding, end of year 18.4 $ 40.65 19.4 $ 36.72 22.0 $ 33.89
Exercisable, end of year 7.0 $ 35.90 7.1 $ 31.18 8.8 $ 29.67
The weighted average share price for the options exercised in 2015 was $53.98 (2014 – $52.15; 2013 – $43.26).
The following table summarizes information relating to stock options outstanding and exercisable as at October 31, 2015.
Range of Exercise Prices(millions of shares and Canadian dollars) Options outstanding Options exercisable
Weighted- average Number of remaining Weighted- Number of Weighted- shares contractual average shares average outstanding life (years) exercise price exercisable exercise price
$21.25 – $32.99 2.7 3.4 $ 31.28 2.7 $ 31.28 $36.03 – $36.64 6.0 5.6 36.63 2.6 36.62 $39.21 – $40.54 3.6 6.3 40.35 0.5 39.21 $43.06 – $44.25 1.1 2.3 43.42 1.1 43.42 $45.31 – $52.46 5.0 8.4 50.01 0.1 45.31
CONCENTRATION OF INSURANCE RISKConcentration risk is the risk resulting from large exposure to similar risks that are positively correlated.
Risk associated with automobile, residential and other products may vary in relation to the geographical area of the risk insured. Exposure to concentrations of insurance risk, by type of risk, is mitigated by ceding these risks through reinsurance contracts, as well as careful selection and implementation of underwriting strategies, which is in turn largely achieved through diversification by line of business and geographical areas. For automobile insurance, legislation is in place at a provincial level and this creates differences in the benefits provided among the provinces.
As at October 31, 2015, for the property and casualty insurance business, 68.9% of net written premiums were derived from auto-mobile policies (October 31, 2014 – 70.3%) followed by residential with 30.6% (October 31, 2014 – 29.4%). The distribution by provinces
show that business is mostly concentrated in Ontario with 59.0% of net written premiums (October 31, 2014 – 60.6%). The Western provinces represented 28.8% (October 31, 2014 – 27.7%) followed by the Atlantic provinces with 6.3% (October 31, 2014 – 5.6%) and Québec, 5.9% (October 31, 2014 – 6.1%).
Concentration risk is not a major concern for the life and health insurance business as it does not have a material level of regional specific characteristics like those exhibited in the property and casualty insurance business. Reinsurance is used to limit the liability on a single claim. While the maximum claim could be $1.2 million (October 31, 2014 – $3.1 million), the majority of claims are less than $250 thousand (October 31, 2014 – $250 thousand). Concentration risk is further limited by diversification across uncorrelated risks. This limits the impact of a regional pandemic and other concentration risks. To improve under-standing of exposure to this risk, a pandemic scenario is tested annually.
For the year ended October 31, 2015, the Bank recognized compensation expense for stock option awards of $19.8 million (October 31, 2014 – $25.6 million; October 31, 2013 – $24.8 million). For the year ended October 31, 2015, 2.6 million (October 31, 2014 – 2.6 million; October 31, 2013 – 3.3 million) options were granted by the Bank at a weighted-average fair value of $9.06 per option (2014 – $9.29 per option; 2013 – $7.83 per option).
The following table summarizes the assumptions used for estimating the fair value of options for the twelve months ended October 31.
Assumptions Used for Estimating Fair Value of Options(in Canadian dollars, except as noted) 2015 2014 2013
Risk-free interest rate 1.44% 1.90% 1.43%Expected option life (years) 6.3 years 6.2 years 6.3 years Expected volatility1 25.06% 27.09% 27.23%Expected dividend yield 3.65% 3.66% 3.51%Exercise price/share price $ 52.46 $ 47.59 $ 40.54
1 Expected volatility is calculated based on the average daily volatility measured over a historical period corresponding to the expected option life.

TD BANK GROUP ANNUAL REPORT 2015 F INANCIAL RESULTS178
OTHER SHARE-BASED COMPENSATION PLANS The Bank operates restricted share unit and performance share unit plans which are offered to certain employees of the Bank. Under these plans, participants are awarded share units equivalent to the Bank’s common shares that generally vest over three years. During the vesting period, dividend equivalents accrue to the participants in the form of additional share units. At the maturity date, the participant receives cash representing the value of the share units. The final number of performance share units will vary from 80% to 120% of the number of units outstanding at maturity (consisting of initial units awarded plus additional units in lieu of dividends) based on the Bank’s total share-holder return relative to the average of a peer group of large financial institutions. The number of such share units outstanding under these plans as at October 31, 2015, was 26 million (2014 – 26 million).
The Bank also offers deferred share unit plans to eligible employees and non-employee directors. Under these plans, a portion of the participant’s annual incentive award and/or maturing share units may be deferred as share units equivalent to the Bank’s common shares. The deferred share units are not redeemable by the participant until termination of employment or directorship. Once these conditions are met, the deferred share units must be redeemed for cash no later than the end of the next calendar year. Dividend equivalents accrue to the participants in the form of additional units. As at October 31, 2015, 6.5 million deferred share units were outstanding (October 31, 2014 – 7.6 million).
Compensation expense for these plans is recorded in the year the incentive award is earned by the plan participant. Changes in the value of these plans are recorded, net of the effects of related hedges, on the Consolidated Statement of Income. For the year ended October 31,
2015, the Bank recognized compensation expense, net of the effects of hedges, for these plans of $441 million (2014 – $415 million; 2013 – $336 million). The compensation expense recognized before the effects of hedges was $471 million (2014 – $718 million; 2013 – $621 million). The carrying amount of the liability relating to these plans, based on the closing share price, was $1.6 billion at October 31, 2015 (October 31, 2014 – $1.8 billion), and is reported in Other liabilities on the Consoli-dated Balance Sheet.
EMPLOYEE OWNERSHIP PLANThe Bank also operates a share purchase plan available to Canadian employees. Employees can contribute any amount of their eligible earnings (net of source deductions), subject to an annual cap of 10% of salary effective January 1, 2014, to the Employee Ownership Plan. The Bank matches 100% of the first $250 of employee contributions each year and the remainder of employee contributions at 50% to an overall maximum of 3.5% of the employee’s eligible earnings or $2,250, whichever comes first. The Bank’s contributions vest once an employee has completed two years of continuous service with the Bank. For the year ended October 31, 2015, the Bank’s contributions totalled $67 million (2014 – $65 million; 2013 – $63 million) and were expensed as salaries and employee benefits. As at October 31, 2015, an aggregate of 20 million common shares were held under the Employee Ownership Plan (October 31, 2014 – 20 million). The shares in the Employee Ownership Plan are purchased in the open market and are considered outstanding for computing the Bank’s basic and diluted earnings per share. Dividends earned on the Bank’s common shares held by the Employee Ownership Plan are used to purchase additional common shares for the Employee Ownership Plan in the open market.
DEFINED BENEFIT PENSION AND OTHER POST-EMPLOYMENT BENEFIT (OPEB) PLANSThe Bank’s principal pension plans, consisting of The Pension Fund Society of The Toronto-Dominion Bank (the “Society”) and the TD Pension Plan (Canada) (TDPP), are defined benefit plans for Canadian Bank employees. The Society was closed to new members on January 30, 2009, and the TDPP commenced on March 1, 2009. Benefits under the principal pension plans are determined based upon the period of plan participation and the average salary of the member in the best consecutive five years in the last ten years of combined plan membership.
Funding for the Bank’s principal pension plans is provided by contributions from the Bank and members of the plans, as applicable. In accordance with legislation, the Bank contributes amounts, as determined on an actuarial basis to the plans and has the ultimate responsibility for ensuring that the liabilities of the plan are adequately funded over time. The Bank’s contributions to the principal pension plans during 2015 were $357 million (2014 – $302 million). The 2015 contributions were made in accordance with the actuarial valuation reports for funding purposes as at October 31, 2014, for both of the principal pension plans. The 2014 contributions were made in accor-dance with the actuarial valuation reports for funding purposes as at October 31, 2013, and October 31, 2011, for the Society and the TDPP, respectively. The next valuation date for funding purposes is as at October 31, 2015, for both of the principal pension plans.
The Bank also provides certain post-retirement benefits, which are generally non-funded. Post-retirement benefit plans, where offered, generally include health care and dental benefits. Employees must meet certain age and service requirements to be eligible for post-retirement benefits and are generally required to pay a portion of the cost of the benefits.
INVESTMENT STRATEGY AND ASSET ALLOCATIONThe primary objective of the Society and the TDPP is to achieve an annualized real rate of return of 1.50% and 1.75%, respectively, over rolling ten-year periods. The investments of the Society and the TDPP are managed with the primary objective of providing reasonable and stable rates of return, consistent with available market opportunities, prudent portfolio management, and levels of risk commensurate with the return expectations and asset mix policy as set out by the risk budget of 8% and 15% surplus volatility, respectively. The investment policies for the principal pension plans exclude Pension Enhancement Account (PEA) assets which are invested at the member’s discretion in certain mutual funds.
Public debt instruments of both the Society and the TDPP must meet or exceed a credit rating of BBB- at the time of purchase and during the holding period. There are no limitations on the maximum amount allocated to each credit rating above BBB+ for the total public debt portfolio.
With respect to the Society’s public debt portfolio, up to 15% of the total fund can be invested in a bond mandate subject to the following constraints: debt instruments rated BBB+ to BBB- must not exceed 25%; asset-backed securities must have a minimum credit rating of AAA and not exceed 25% of the mandate; debt instruments of non-government entities must not exceed 80%; debt instruments of non-Canadian government entities must not exceed 20%; debt instru-ments of a single non-government or non-Canadian government entity must not exceed 10%; and debt instruments issued by the Govern-ment of Canada, provinces of Canada, or municipalities must not exceed 100%, 75%, or 10%, respectively. Also with respect to the Society’s public debt portfolio, up to 14% of the total fund can be invested in a bond mandate subject to the following constraints: debt instruments rated BBB+ to BBB- must not exceed 25%; asset-backed securities must have a minimum credit rating of AAA and not exceed 25% of the mandate; and there is a limitation of 10% for any one issuer. The remainder of the public debt portfolio is not permitted to invest in debt instruments of non-government entities.
EMPLOYEE BENEFITSN O T E 2 5

TD BANK GROUP ANNUAL REPORT 2015 F INANCIAL RESULTS 179
The TDPP is not permitted to invest in debt instruments of non-government entities.
The equity portfolios of both the Society and the TDPP are broadly diversified primarily across medium to large capitalization quality companies and income trusts with no individual holding exceeding 10% of the equity portfolio or 10% of the outstanding securities of any one company at any time. Foreign equities are permitted to be included to further diversify the portfolio. A maximum of 10% of a total fund may be invested in emerging market equities.
For both the Society and the TDPP, derivatives can be utilized provided they are not used to create financial leverage, but rather for risk management purposes. The Society is also permitted to invest in other alternative investments, such as private equities.
The asset allocations by asset category for the principal pension plans (excluding PEA assets) are as follows:
Plan Asset Allocation (millions of Canadian dollars, Society1 TDPP1
except as noted)
Acceptable % of Fair value Acceptable % of Fair value
As at October 31, 2015 range total Quoted Unquoted range total Quoted Unquoted
Debt 58-76% 64% $ – $ 2,852 44-56% 50% $ – $ 369 Equity 24-42 30 1,015 346 44-56 50 – 374 Alternative investments1 0-10 6 37 227 n/a n/a n/a n/aOther2 n/a n/a – 74 n/a n/a – 33
Total 100% $ 1,052 $ 3,499 100% $ – $ 776
As at October 31, 2014
Debt 58-72% 60% $ – $ 2,489 44-56% 50% $ – $ 277 Equity 24-34.5 32 1,228 84 44-56 50 – 280 Cash equivalents 0-4 2 – 93 n/a n/a n/a n/a Alternative investments1 0-12.5 6 40 188 n/a n/a n/a n/a Other2 n/a n/a – 101 n/a n/a – 25
Total 100% $ 1,268 $ 2,955 100% $ – $ 582
As at October 31, 2013
Debt 58-72% 58% $ – $ 2,094 44-56% 49% $ – $ 199 Equity 24-34.5 34 1,086 138 44-56 51 – 208 Cash equivalents 0-4 2 – 79 n/a n/a n/a n/a Alternative investments1 0-12.5 6 37 162 n/a n/a n/a n/a Other2 n/a n/a – 157 n/a n/a – 17
Total 100% $ 1,123 $ 2,630 100% $ – $ 424
RISK MANAGEMENT PRACTICESThe principal pension plans’ investments include financial instruments which are exposed to various risks. These risks include market risk (including foreign currency, interest rate, inflation, and price risks), credit risk, longevity risk and liquidity risk. Key material risks faced by all plans are a decline in interest rates or credit spreads, which could increase the defined benefit obligation by more than the change in the value of plan assets, or from longevity risk (that is, lower mortality rates).
Asset-liability matching strategies are focused on obtaining an appropriate balance between earning an adequate return and having changes in liability values being hedged by changes in asset values.
The principal pension plans manage these financial risks in accordance with the Pension Benefits Standards Act, 1985, applicable regulations, and the principal pension plans’ Statement of Investment Policies and Procedures. The following are some specific risk management practices employed by the principal pension plans:• Monitoring credit exposure of counterparties• Monitoring adherence to asset allocation guidelines• Monitoring asset class performance against benchmarks
The Bank’s principal pension plans are overseen by a single retirement governance structure established by the Human Resources Committee of the Bank’s Board of Directors. The governance structure utilizes retirement governance committees who have responsibility to oversee
plan operations and investments, acting in a fiduciary capacity. Where required, approvals will also be sought from the applicable local body to comply with local regulatory requirements. Strategic, material plan changes require the approval of the Bank’s Board of Directors.
OTHER PENSION AND RETIREMENT PLANSCT Pension PlanAs a result of the acquisition of CT Financial Services Inc. (CT), the Bank sponsors a pension plan consisting of a defined benefit portion and a defined contribution portion. The defined benefit portion was closed to new members after May 31, 1987, and newly eligible employees joined the defined contribution portion of the plan. The Bank received regulatory approval to wind-up the defined contribution portion of the plan effective April 1, 2011. The wind-up was completed on May 31, 2012. Funding for the defined benefit portion is provided by contributions from the Bank and members of the plan.
TD Bank, N.A. Retirement PlansTD Bank, N.A. and its subsidiaries maintain a defined contribution 401(k) plan covering all employees. The contributions to the plan for the year ended October 31, 2015 were $103 million (October 31, 2014 – $92 million; October 31, 2013 – $81 million), which included core and matching contributions. Annual expense is equal to the Bank’s contributions to the plan.
1 The Society’s alternative investments primarily include private equity funds, of which a fair value of nil as at October 31, 2015 (October 31, 2014 – nil; October 31, 2013 – $1 million) is invested in the Bank and its affiliates. The principal pension plans also invest in investment vehicles which may hold shares or debt issued by the Bank.
2 Consists mainly of PEA assets, interest and dividends receivable, and amounts due to and due from brokers for securities traded but not yet settled.
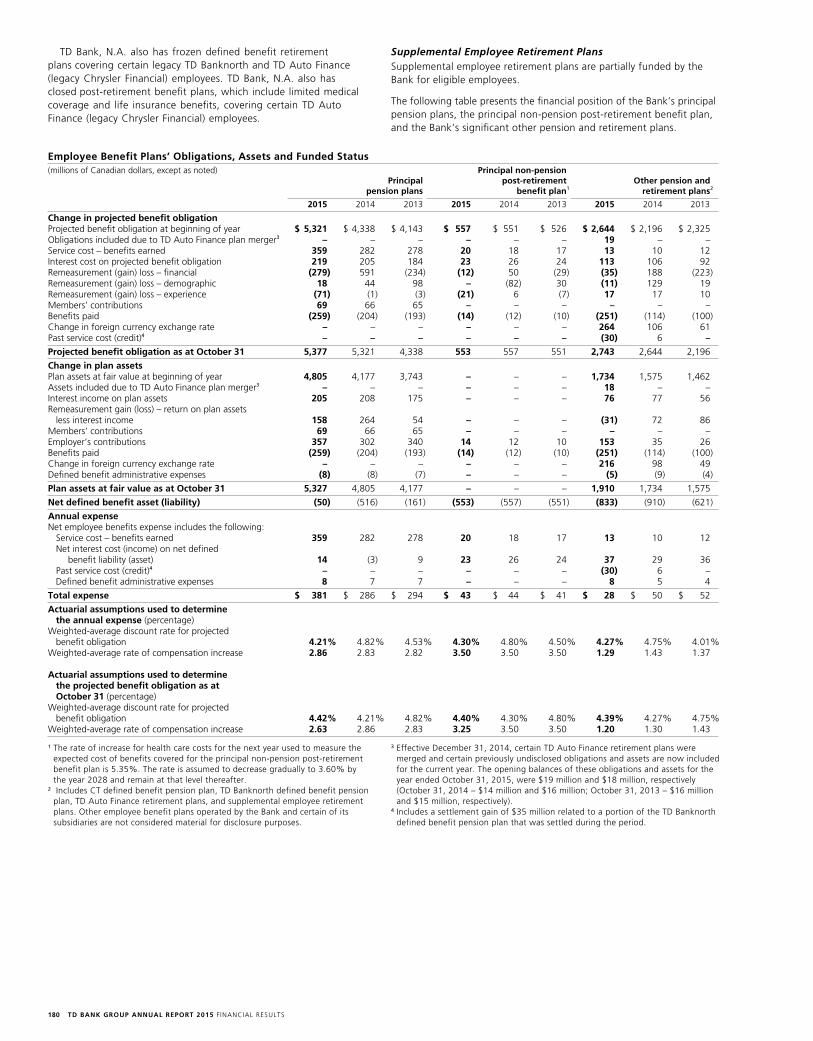
TD BANK GROUP ANNUAL REPORT 2015 F INANCIAL RESULTS180
TD Bank, N.A. also has frozen defined benefit retirement plans covering certain legacy TD Banknorth and TD Auto Finance (legacy Chrysler Financial) employees. TD Bank, N.A. also has closed post-retirement benefit plans, which include limited medical coverage and life insurance benefits, covering certain TD Auto Finance (legacy Chrysler Financial) employees.
Supplemental Employee Retirement PlansSupplemental employee retirement plans are partially funded by the Bank for eligible employees.
The following table presents the financial position of the Bank’s principal pension plans, the principal non-pension post-retirement benefit plan, and the Bank’s significant other pension and retirement plans.
Employee Benefit Plans’ Obligations, Assets and Funded Status(millions of Canadian dollars, except as noted) Principal non-pension Principal post-retirement Other pension and pension plans benefit plan1 retirement plans2
2015 2014 2013 2015 2014 2013 2015 2014 2013
Change in projected benefit obligationProjected benefit obligation at beginning of year $ 5,321 $ 4,338 $ 4,143 $ 557 $ 551 $ 526 $ 2,644 $ 2,196 $ 2,325 Obligations included due to TD Auto Finance plan merger3 – – – – – – 19 – – Service cost – benefits earned 359 282 278 20 18 17 13 10 12 Interest cost on projected benefit obligation 219 205 184 23 26 24 113 106 92 Remeasurement (gain) loss – financial (279) 591 (234) (12) 50 (29) (35) 188 (223) Remeasurement (gain) loss – demographic 18 44 98 – (82) 30 (11) 129 19 Remeasurement (gain) loss – experience (71) (1) (3) (21) 6 (7) 17 17 10 Members’ contributions 69 66 65 – – – – – – Benefits paid (259) (204) (193) (14) (12) (10) (251) (114) (100) Change in foreign currency exchange rate – – – – – – 264 106 61 Past service cost (credit)4 – – – – – – (30) 6 –
Projected benefit obligation as at October 31 5,377 5,321 4,338 553 557 551 2,743 2,644 2,196
Change in plan assetsPlan assets at fair value at beginning of year 4,805 4,177 3,743 – – – 1,734 1,575 1,462 Assets included due to TD Auto Finance plan merger3 – – – – – – 18 – – Interest income on plan assets 205 208 175 – – – 76 77 56 Remeasurement gain (loss) – return on plan assets
less interest income 158 264 54 – – – (31) 72 86 Members’ contributions 69 66 65 – – – – – – Employer’s contributions 357 302 340 14 12 10 153 35 26 Benefits paid (259) (204) (193) (14) (12) (10) (251) (114) (100) Change in foreign currency exchange rate – – – – – – 216 98 49 Defined benefit administrative expenses (8) (8) (7) – – – (5) (9) (4)
Plan assets at fair value as at October 31 5,327 4,805 4,177 – – – 1,910 1,734 1,575
Net defined benefit asset (liability) (50) (516) (161) (553) (557) (551) (833) (910) (621)
Annual expenseNet employee benefits expense includes the following: Service cost – benefits earned 359 282 278 20 18 17 13 10 12 Net interest cost (income) on net defined
benefit liability (asset) 14 (3) 9 23 26 24 37 29 36 Past service cost (credit)4 – – – – – – (30) 6 – Defined benefit administrative expenses 8 7 7 – – – 8 5 4
Total expense $ 381 $ 286 $ 294 $ 43 $ 44 $ 41 $ 28 $ 50 $ 52
Actuarial assumptions used to determine the annual expense (percentage)
Weighted-average discount rate for projected benefit obligation 4.21% 4.82% 4.53% 4.30% 4.80% 4.50% 4.27% 4.75% 4.01%
Weighted-average rate of compensation increase 2.86 2.83 2.82 3.50 3.50 3.50 1.29 1.43 1.37
Actuarial assumptions used to determine the projected benefit obligation as at October 31 (percentage)
Weighted-average discount rate for projected benefit obligation 4.42% 4.21% 4.82% 4.40% 4.30% 4.80% 4.39% 4.27% 4.75%
Weighted-average rate of compensation increase 2.63 2.86 2.83 3.25 3.50 3.50 1.20 1.30 1.43
1 The rate of increase for health care costs for the next year used to measure the expected cost of benefits covered for the principal non-pension post-retirement benefit plan is 5.35%. The rate is assumed to decrease gradually to 3.60% by the year 2028 and remain at that level thereafter.
2 Includes CT defined benefit pension plan, TD Banknorth defined benefit pension plan, TD Auto Finance retirement plans, and supplemental employee retirement plans. Other employee benefit plans operated by the Bank and certain of its subsidiaries are not considered material for disclosure purposes.
3 Effective December 31, 2014, certain TD Auto Finance retirement plans were merged and certain previously undisclosed obligations and assets are now included for the current year. The opening balances of these obligations and assets for the year ended October 31, 2015, were $19 million and $18 million, respectively (October 31, 2014 – $14 million and $16 million; October 31, 2013 – $16 million and $15 million, respectively).
4 Includes a settlement gain of $35 million related to a portion of the TD Banknorth defined benefit pension plan that was settled during the period.
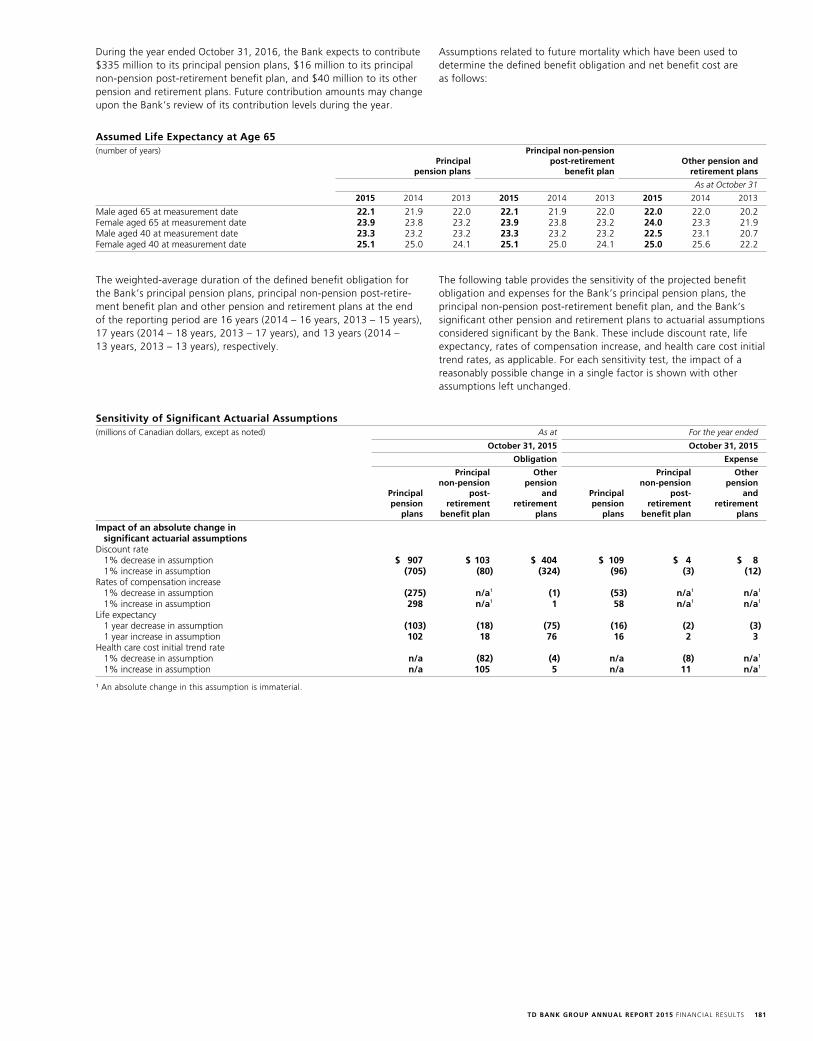
TD BANK GROUP ANNUAL REPORT 2015 F INANCIAL RESULTS 181
The weighted-average duration of the defined benefit obligation for the Bank’s principal pension plans, principal non-pension post-retire-ment benefit plan and other pension and retirement plans at the end of the reporting period are 16 years (2014 – 16 years, 2013 – 15 years), 17 years (2014 – 18 years, 2013 – 17 years), and 13 years (2014 – 13 years, 2013 – 13 years), respectively.
The following table provides the sensitivity of the projected benefit obligation and expenses for the Bank’s principal pension plans, the principal non-pension post-retirement benefit plan, and the Bank’s significant other pension and retirement plans to actuarial assumptions considered significant by the Bank. These include discount rate, life expectancy, rates of compensation increase, and health care cost initial trend rates, as applicable. For each sensitivity test, the impact of a reasonably possible change in a single factor is shown with other assumptions left unchanged.
Sensitivity of Significant Actuarial Assumptions(millions of Canadian dollars, except as noted) As at For the year ended
October 31, 2015 October 31, 2015
Obligation Expense
Principal Other Principal Other non-pension pension non-pension pension Principal post- and Principal post- and pension retirement retirement pension retirement retirement plans benefit plan plans plans benefit plan plans
Impact of an absolute change in significant actuarial assumptions
Discount rate 1% decrease in assumption $ 907 $ 103 $ 404 $ 109 $ 4 $ 8 1% increase in assumption (705) (80) (324) (96) (3) (12) Rates of compensation increase 1% decrease in assumption (275) n/a1 (1) (53) n/a1 n/a1 1% increase in assumption 298 n/a1 1 58 n/a1 n/a1 Life expectancy 1 year decrease in assumption (103) (18) (75) (16) (2) (3) 1 year increase in assumption 102 18 76 16 2 3Health care cost initial trend rate 1% decrease in assumption n/a (82) (4) n/a (8) n/a1 1% increase in assumption n/a 105 5 n/a 11 n/a1
1 An absolute change in this assumption is immaterial.
Assumed Life Expectancy at Age 65(number of years) Principal non-pension Principal post-retirement Other pension and pension plans benefit plan retirement plans
As at October 31
2015 2014 2013 2015 2014 2013 2015 2014 2013
Male aged 65 at measurement date 22.1 21.9 22.0 22.1 21.9 22.0 22.0 22.0 20.2 Female aged 65 at measurement date 23.9 23.8 23.2 23.9 23.8 23.2 24.0 23.3 21.9 Male aged 40 at measurement date 23.3 23.2 23.2 23.3 23.2 23.2 22.5 23.1 20.7 Female aged 40 at measurement date 25.1 25.0 24.1 25.1 25.0 24.1 25.0 25.6 22.2
During the year ended October 31, 2016, the Bank expects to contribute $335 million to its principal pension plans, $16 million to its principal non-pension post-retirement benefit plan, and $40 million to its other pension and retirement plans. Future contribution amounts may change upon the Bank’s review of its contribution levels during the year.
Assumptions related to future mortality which have been used to determine the defined benefit obligation and net benefit cost are as follows:
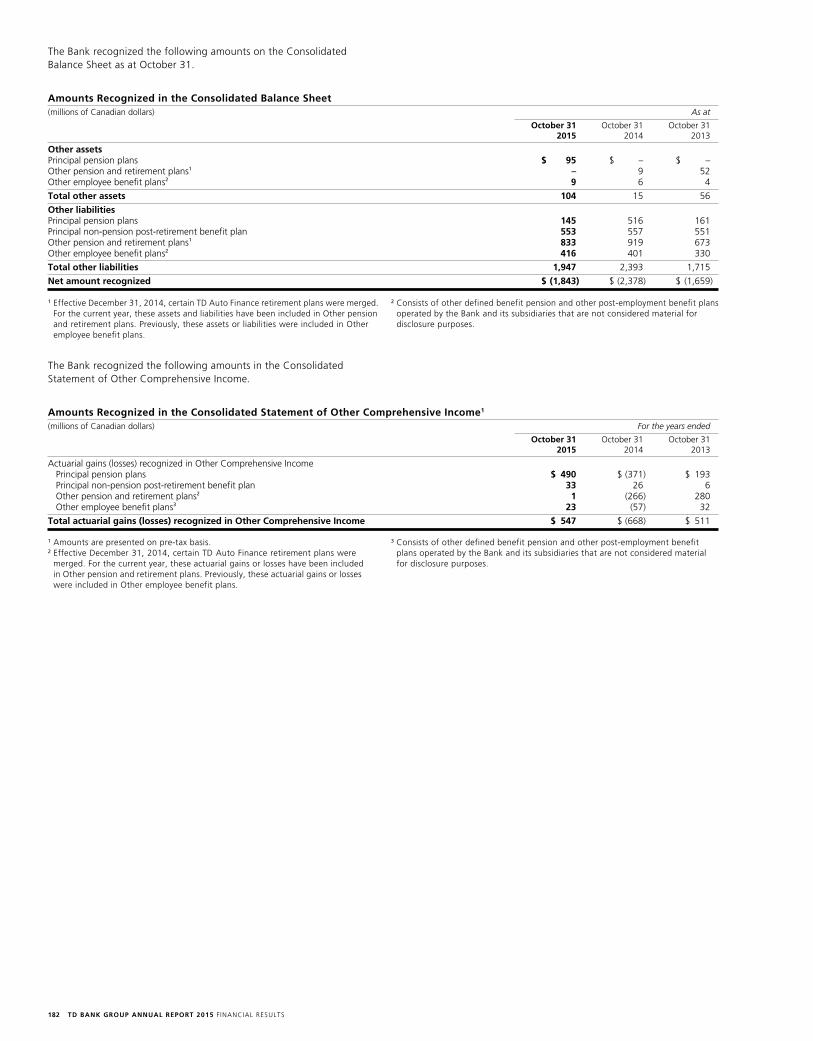
TD BANK GROUP ANNUAL REPORT 2015 F INANCIAL RESULTS182
The Bank recognized the following amounts on the Consolidated Balance Sheet as at October 31.
Amounts Recognized in the Consolidated Balance Sheet(millions of Canadian dollars) As at
October 31 October 31 October 31 2015 2014 2013
Other assetsPrincipal pension plans $ 95 $ – $ – Other pension and retirement plans1 – 9 52 Other employee benefit plans2 9 6 4
Total other assets 104 15 56
Other liabilitiesPrincipal pension plans 145 516 161 Principal non-pension post-retirement benefit plan 553 557 551 Other pension and retirement plans1 833 919 673 Other employee benefit plans2 416 401 330
Total other liabilities 1,947 2,393 1,715
Net amount recognized $ (1,843) $ (2,378) $ (1,659)
1 Effective December 31, 2014, certain TD Auto Finance retirement plans were merged. For the current year, these assets and liabilities have been included in Other pension and retirement plans. Previously, these assets or liabilities were included in Other employee benefit plans.
2 Consists of other defined benefit pension and other post-employment benefit plans operated by the Bank and its subsidiaries that are not considered material for disclosure purposes.
The Bank recognized the following amounts in the Consolidated Statement of Other Comprehensive Income.
Amounts Recognized in the Consolidated Statement of Other Comprehensive Income1
(millions of Canadian dollars) For the years ended
October 31 October 31 October 31 2015 2014 2013
Actuarial gains (losses) recognized in Other Comprehensive Income Principal pension plans $ 490 $ (371) $ 193 Principal non-pension post-retirement benefit plan 33 26 6 Other pension and retirement plans2 1 (266) 280 Other employee benefit plans3 23 (57) 32
Total actuarial gains (losses) recognized in Other Comprehensive Income $ 547 $ (668) $ 511
1 Amounts are presented on pre-tax basis.2 Effective December 31, 2014, certain TD Auto Finance retirement plans were
merged. For the current year, these actuarial gains or losses have been included in Other pension and retirement plans. Previously, these actuarial gains or losses were included in Other employee benefit plans.
3 Consists of other defined benefit pension and other post-employment benefit plans operated by the Bank and its subsidiaries that are not considered material for disclosure purposes.
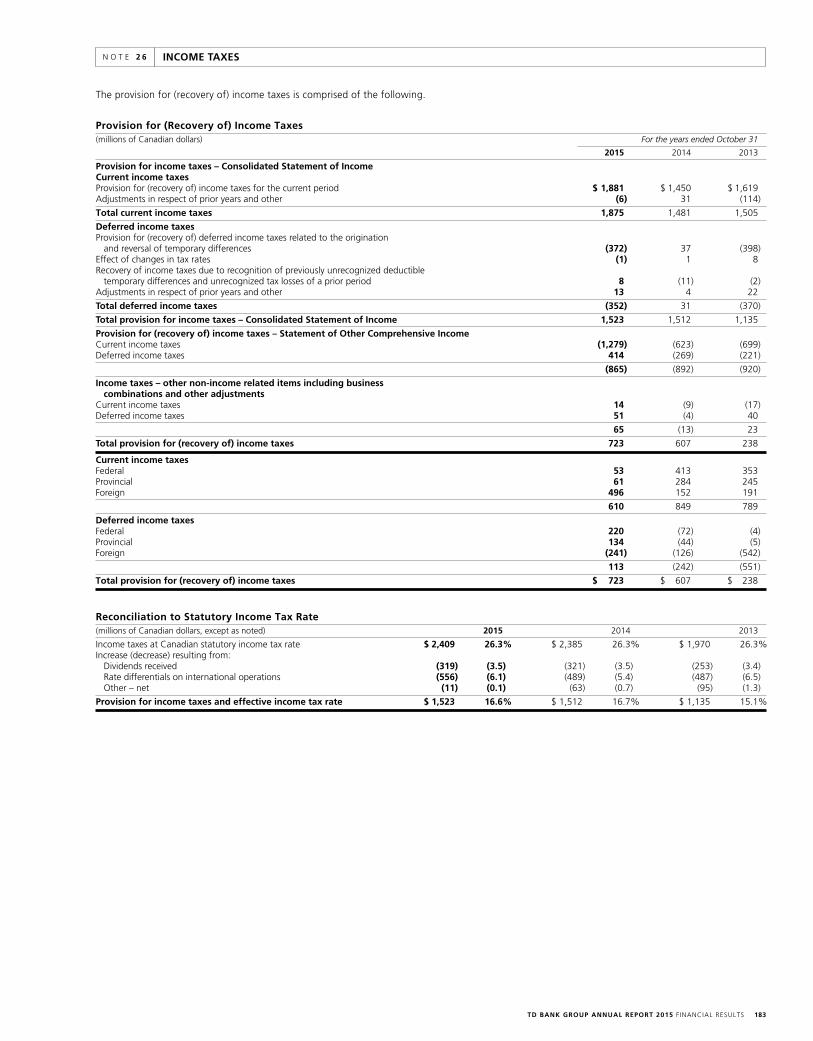
TD BANK GROUP ANNUAL REPORT 2015 F INANCIAL RESULTS 183
INCOME TAXESN O T E 2 6
The provision for (recovery of) income taxes is comprised of the following.
Provision for (Recovery of) Income Taxes(millions of Canadian dollars) For the years ended October 31
2015 2014 2013
Provision for income taxes – Consolidated Statement of IncomeCurrent income taxesProvision for (recovery of) income taxes for the current period $ 1,881 $ 1,450 $ 1,619 Adjustments in respect of prior years and other (6) 31 (114)
Total current income taxes 1,875 1,481 1,505
Deferred income taxes Provision for (recovery of) deferred income taxes related to the origination
and reversal of temporary differences (372) 37 (398)Effect of changes in tax rates (1) 1 8Recovery of income taxes due to recognition of previously unrecognized deductible
temporary differences and unrecognized tax losses of a prior period 8 (11) (2) Adjustments in respect of prior years and other 13 4 22
Total deferred income taxes (352) 31 (370)
Total provision for income taxes – Consolidated Statement of Income 1,523 1,512 1,135
Provision for (recovery of) income taxes – Statement of Other Comprehensive IncomeCurrent income taxes (1,279) (623) (699) Deferred income taxes 414 (269) (221)
(865) (892) (920)
Income taxes – other non-income related items including business combinations and other adjustments
Current income taxes 14 (9) (17) Deferred income taxes 51 (4) 40
65 (13) 23
Total provision for (recovery of) income taxes 723 607 238
Current income taxesFederal 53 413 353 Provincial 61 284 245 Foreign 496 152 191
610 849 789
Deferred income taxes Federal 220 (72) (4) Provincial 134 (44) (5) Foreign (241) (126) (542)
113 (242) (551)
Total provision for (recovery of) income taxes $ 723 $ 607 $ 238
Reconciliation to Statutory Income Tax Rate (millions of Canadian dollars, except as noted) 2015 2014 2013
Income taxes at Canadian statutory income tax rate $ 2,409 26.3% $ 2,385 26.3% $ 1,970 26.3%Increase (decrease) resulting from: Dividends received (319) (3.5) (321) (3.5) (253) (3.4) Rate differentials on international operations (556) (6.1) (489) (5.4) (487) (6.5) Other – net (11) (0.1) (63) (0.7) (95) (1.3)
Provision for income taxes and effective income tax rate $ 1,523 16.6% $ 1,512 16.7% $ 1,135 15.1%
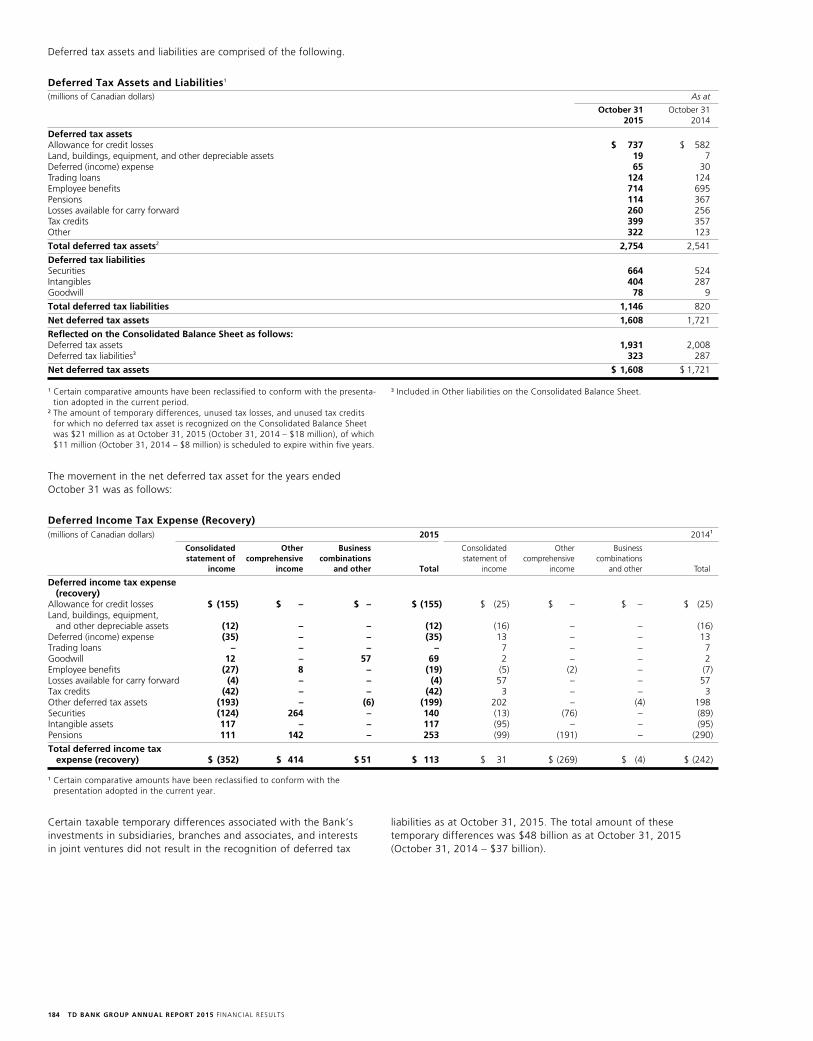
TD BANK GROUP ANNUAL REPORT 2015 F INANCIAL RESULTS184
Deferred tax assets and liabilities are comprised of the following.
Deferred Tax Assets and Liabilities1
(millions of Canadian dollars) As at
October 31 October 31 2015 2014
Deferred tax assetsAllowance for credit losses $ 737 $ 582 Land, buildings, equipment, and other depreciable assets 19 7 Deferred (income) expense 65 30 Trading loans 124 124 Employee benefits 714 695 Pensions 114 367 Losses available for carry forward 260 256 Tax credits 399 357 Other 322 123
Total deferred tax assets2 2,754 2,541
Deferred tax liabilitiesSecurities 664 524 Intangibles 404 287 Goodwill 78 9
Total deferred tax liabilities 1,146 820
Net deferred tax assets 1,608 1,721
Reflected on the Consolidated Balance Sheet as follows:Deferred tax assets 1,931 2,008 Deferred tax liabilities3 323 287
Net deferred tax assets $ 1,608 $ 1,721
The movement in the net deferred tax asset for the years ended October 31 was as follows:
Deferred Income Tax Expense (Recovery)(millions of Canadian dollars) 2015 20141
Consolidated Other Business Consolidated Other Business statement of comprehensive combinations statement of comprehensive combinations income income and other Total income income and other Total
Deferred income tax expense (recovery)Allowance for credit losses $ (155) $ – $ – $ (155) $ (25) $ – $ – $ (25) Land, buildings, equipment,
and other depreciable assets (12) – – (12) (16) – – (16) Deferred (income) expense (35) – – (35) 13 – – 13 Trading loans – – – – 7 – – 7 Goodwill 12 – 57 69 2 – – 2 Employee benefits (27) 8 – (19) (5) (2) – (7) Losses available for carry forward (4) – – (4) 57 – – 57 Tax credits (42) – – (42) 3 – – 3 Other deferred tax assets (193) – (6) (199) 202 – (4) 198 Securities (124) 264 – 140 (13) (76) – (89) Intangible assets 117 – – 117 (95) – – (95) Pensions 111 142 – 253 (99) (191) – (290)
Total deferred income tax expense (recovery) $ (352) $ 414 $ 51 $ 113 $ 31 $ (269) $ (4) $ (242)
1 Certain comparative amounts have been reclassified to conform with the presentation adopted in the current year.
1 Certain comparative amounts have been reclassified to conform with the presenta-tion adopted in the current period.
2 The amount of temporary differences, unused tax losses, and unused tax credits for which no deferred tax asset is recognized on the Consolidated Balance Sheet was $21 million as at October 31, 2015 (October 31, 2014 – $18 million), of which $11 million (October 31, 2014 – $8 million) is scheduled to expire within five years.
Certain taxable temporary differences associated with the Bank’s investments in subsidiaries, branches and associates, and interests in joint ventures did not result in the recognition of deferred tax
3 Included in Other liabilities on the Consolidated Balance Sheet.
liabilities as at October 31, 2015. The total amount of these temporary differences was $48 billion as at October 31, 2015 (October 31, 2014 – $37 billion).
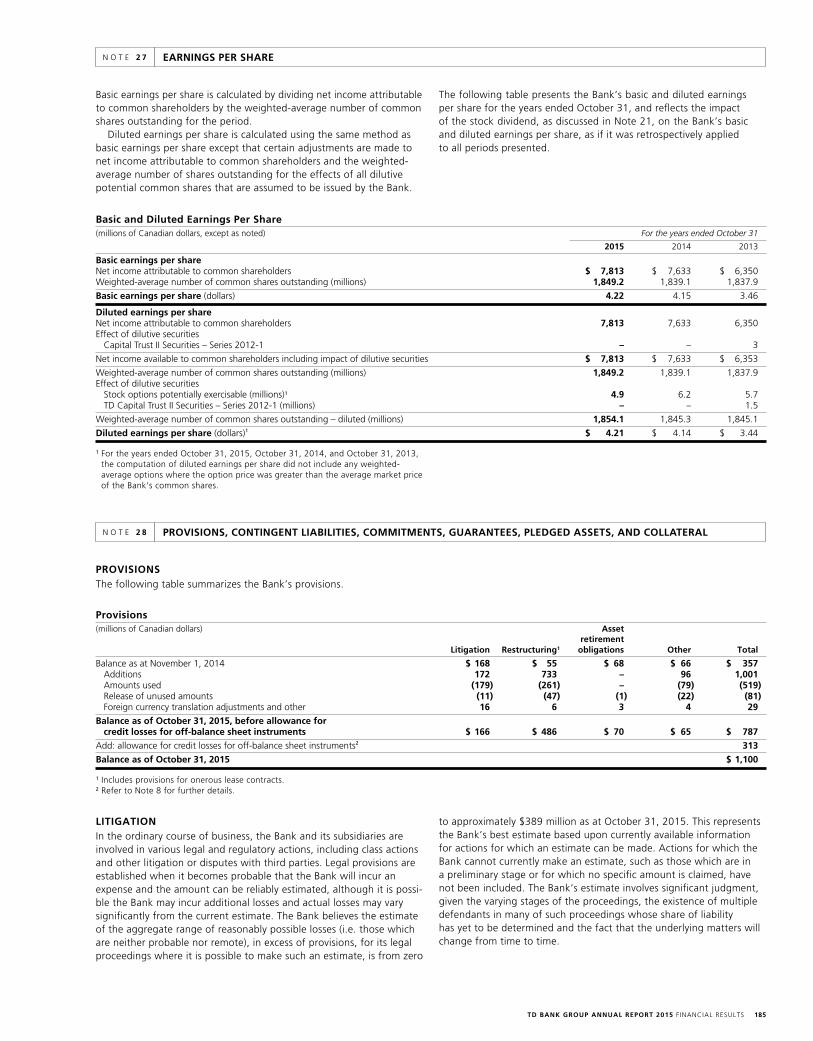
TD BANK GROUP ANNUAL REPORT 2015 F INANCIAL RESULTS 185
EARNINGS PER SHAREN O T E 2 7
Basic earnings per share is calculated by dividing net income attributable to common shareholders by the weighted-average number of common shares outstanding for the period.
Diluted earnings per share is calculated using the same method as basic earnings per share except that certain adjustments are made to net income attributable to common shareholders and the weighted-average number of shares outstanding for the effects of all dilutive potential common shares that are assumed to be issued by the Bank.
The following table presents the Bank’s basic and diluted earnings per share for the years ended October 31, and reflects the impact of the stock dividend, as discussed in Note 21, on the Bank’s basic and diluted earnings per share, as if it was retrospectively applied to all periods presented.
Basic and Diluted Earnings Per Share(millions of Canadian dollars, except as noted) For the years ended October 31
2015 2014 2013
Basic earnings per shareNet income attributable to common shareholders $ 7,813 $ 7,633 $ 6,350 Weighted-average number of common shares outstanding (millions) 1,849.2 1,839.1 1,837.9
Basic earnings per share (dollars) 4.22 4.15 3.46
Diluted earnings per share Net income attributable to common shareholders 7,813 7,633 6,350 Effect of dilutive securities
Capital Trust II Securities – Series 2012-1 – – 3
Net income available to common shareholders including impact of dilutive securities $ 7,813 $ 7,633 $ 6,353
Weighted-average number of common shares outstanding (millions) 1,849.2 1,839.1 1,837.9 Effect of dilutive securities
Stock options potentially exercisable (millions)1 4.9 6.2 5.7 TD Capital Trust II Securities – Series 2012-1 (millions) – – 1.5
Weighted-average number of common shares outstanding – diluted (millions) 1,854.1 1,845.3 1,845.1
Diluted earnings per share (dollars)1 $ 4.21 $ 4.14 $ 3.44
1 For the years ended October 31, 2015, October 31, 2014, and October 31, 2013, the computation of diluted earnings per share did not include any weighted- average options where the option price was greater than the average market price of the Bank’s common shares.
PROVISIONS, CONTINGENT LIABILITIES, COMMITMENTS, GUARANTEES, PLEDGED ASSETS, AND COLLATERALN O T E 2 8
PROVISIONSThe following table summarizes the Bank’s provisions.
Provisions(millions of Canadian dollars) Asset retirement Litigation Restructuring1 obligations Other Total
Balance as at November 1, 2014 $ 168 $ 55 $ 68 $ 66 $ 357 Additions 172 733 – 96 1,001 Amounts used (179) (261) – (79) (519) Release of unused amounts (11) (47) (1) (22) (81) Foreign currency translation adjustments and other 16 6 3 4 29
Balance as of October 31, 2015, before allowance for credit losses for off-balance sheet instruments $ 166 $ 486 $ 70 $ 65 $ 787
Add: allowance for credit losses for off-balance sheet instruments2 313
Balance as of October 31, 2015 $ 1,100
1 Includes provisions for onerous lease contracts.2 Refer to Note 8 for further details.
LITIGATIONIn the ordinary course of business, the Bank and its subsidiaries are involved in various legal and regulatory actions, including class actions and other litigation or disputes with third parties. Legal provisions are established when it becomes probable that the Bank will incur an expense and the amount can be reliably estimated, although it is possi-ble the Bank may incur additional losses and actual losses may vary significantly from the current estimate. The Bank believes the estimate of the aggregate range of reasonably possible losses (i.e. those which are neither probable nor remote), in excess of provisions, for its legal proceedings where it is possible to make such an estimate, is from zero
to approximately $389 million as at October 31, 2015. This represents the Bank’s best estimate based upon currently available information for actions for which an estimate can be made. Actions for which the Bank cannot currently make an estimate, such as those which are in a preliminary stage or for which no specific amount is claimed, have not been included. The Bank’s estimate involves significant judgment, given the varying stages of the proceedings, the existence of multiple defendants in many of such proceedings whose share of liability has yet to be determined and the fact that the underlying matters will change from time to time.
TD BANK GROUP ANNUAL REPORT 2015 F INANCIAL RESULTS186
In management’s opinion, based on its current knowledge and after consultation with counsel, the ultimate disposition of these actions, individually or in the aggregate, will not have a material adverse effect on the consolidated financial condition or the consolidated cash flows of the Bank. However, there are a number of uncertainties involved in such proceedings, some of which are beyond the Bank’s control, including, for example, the risk that the requisite external approvals of a particular settlement may not be granted. As such, there is a possibility that the ultimate resolution of those legal or regulatory actions may be material to the Bank’s consolidated results of opera-tions for any particular reporting period.
The following is a description of the Bank’s material legal or regulatory actions.
Rothstein LitigationTD Bank, N.A. was named as a defendant in multiple lawsuits in state and federal court in Florida related to an alleged US$1.2 billion Ponzi scheme perpetrated by, among others, Scott Rothstein, a partner of the Fort Lauderdale, Florida based law firm, Rothstein, Rosenfeldt and Adler (“RRA”).
On July 11, 2013, the United States Bankruptcy Court for the Southern District of Florida confirmed a liquidation plan for the RRA bankruptcy estate that includes a litigation bar order in favor of TD Bank, N.A. (the “Bar Order”). Two civil matters, Coquina Invest-ments v. TD Bank, N.A. et al. and Razorback Funding, LLC, et al. v. TD Bank, N.A., et al., were exempted from the Bar Order, but both matters are now concluded.
TD Bank, N.A. and/or the Bank are or may be the subject of other litigation or regulatory proceedings related to the Rothstein fraud, although further civil litigation may be enjoined by the Bar Order. The outcome of any such proceedings is difficult to predict and could result in judgments, settlements, injunctions or other results adverse to TD Bank, N.A. or the Bank.
Overdraft LitigationTD Bank, N.A. was originally named as a defendant in six putative nationwide class actions challenging the manner in which it calculates and collects overdraft fees: Dwyer v. TD Bank, N.A. (D. Mass.); Hughes v. TD Bank, N.A. (D. N.J.); Mascaro v. TD Bank, N.A. (D. D.C.); Mazzadra, et al. v. TD Bank, N.A. (S.D. Fla.); Kimenker v. TD Bank, N.A. (D. N.J.); and Mosser v. TD Bank, N.A. (D. Pa.). These actions were transferred to the United States District Court for the Southern District of Florida and have now been dismissed or settled. Settlement payments were made to class members in June 2013, and a second distribution to eligible class members of residual settlement funds was made in October 2014. The Court retains jurisdiction over class members and distributions.
TD Bank, N.A. was subsequently named as a defendant in eleven putative nationwide class actions challenging the overdraft practices of TD Bank, N.A. from August 16, 2010 to the present: King, et al. v. TD Bank, N.A f/k/a Carolina First Bank (D.S.C.); Padilla, et al. v. TD Bank, N.A. (E.D. Pa.); Hurel v. TD Bank, N.A. and The Toronto-Dominion Bank (D.N.J.); Koshgarian v. TD Bank, N.A. and The Toronto-Dominion Bank (S.D.N.Y.); Goodall v. The Toronto-Dominion Bank and TD Bank, N.A. (M.D. FL.); Klein et al. v. TD Bank, N.A. (D.N.J.); Ucciferri v. TD Bank, N.A. (D.N.J.); and Austin v. TD Bank, N.A. (D. Conn.); Robinson v. TD Bank, N.A. (S.D. Fla.) (“Robinson Case No. 60469”); Robinson v. TD Bank, N.A. (S.D. Fla.) (“Robinson Case No. 60476”); and Mingrone v. TD Bank, N.A. (E.D.N.Y.). The King action further challenges the overdraft practices of Carolina First Bank prior to its merger into TD Bank, N.A. in September 2010. The Toronto-Dominion Bank was also named as a defendant in the Hurel, Koshgarian, and Goodall actions, but was subsequently dismissed without prejudice in Hurel. All of the actions have been
consolidated for pretrial proceedings as MDL 2613 in the United States District Court for the District of South Carolina. The plaintiffs filed a consolidated amended class action complaint on June 19, 2015, which governs all of the consolidated cases other than Mingrone and Robinson Case No. 15-60476. On July 21, 2015, the Mingrone class action complaint was dismissed without prejudice. The Toronto-Dominion Bank was not named as a defendant in the consolidated amended class action complaint. TD Bank, N.A. has moved to dismiss the consolidated amended class action complaint in part.
Gevaerts LitigationTD Bank, N.A. was named as a defendant in Gevaerts, et al. v. TD Bank, et al., a purported class action lawsuit in the United States District Court for the Southern District of Florida related to an alleged $223 million fraud scheme orchestrated by Ms. Deborah Peck, a former customer of TD Bank, N.A., among others.
On November 5, 2015, the court approved a settlement between TD Bank, N.A. and the plaintiffs. The claims against TD Bank, N.A. will be dismissed with prejudice under the terms of the settlement.
Interchange Fee Class ActionsBetween 2011 and 2013, seven proposed class actions were commenced in British Columbia, Alberta, Saskatchewan, Ontario and Québec: Coburn and Watson’s Metropolitan Home v. Bank of America Corporation, et al.; 1023916 Alberta Ltd. v. Bank of America Corpora-tion, et al.; Macaronies Hair Club v. BOFA Canada Bank, et al.; The Crown & Hand Pub Ltd. v. Bank of America Corporation, et al.; Hello Baby Equipment Inc. v. BOFA Canada Bank, et al.; Bancroft-Snell, et al. v. Visa Canada Corporation, et al.; and 9085-4886 Quebec Inc. v. Visa Canada Corporation, et al. The defendants in each action are Visa Canada Corporation (Visa) and MasterCard International Incorpo-rated (MasterCard) (collectively, the “Networks”), along with TD and several other financial institutions. The plaintiff class members are Canadian merchants who accept payment for products and services by Visa and/or MasterCard. While there is some variance, in most of the actions it is alleged that, from March 2001 to the present, the Networks conspired with their issuing banks and acquirers to fix exces-sive fees and that certain rules (Honour All Cards, No Discrimination and No Surcharge) have the effect of increasing the merchant fees. The actions include claims of civil conspiracy, breach of the Competi-tion Act, interference with economic relations and unjust enrichment. Unspecified general and punitive damages are sought on behalf of the merchant class members. In the lead case proceeding in British Columbia, the decision to partially certify the action as a class proceeding was released on March 27, 2014. The certification decision was appealed by both plaintiff class representatives and defendants. The appeal hearing took place in December 2014 and the decision was released on August 19, 2015. Both the plaintiffs and defendants succeeded in part on their respective appeals.
Stanford LitigationThe Toronto-Dominion Bank was named as a defendant in Rotstain v. Trustmark National Bank, et al., a putative class action lawsuit in the United States District Court for the Northern District of Texas related to a US$7.2 billion Ponzi scheme perpetrated by R. Allen Stanford, the owner of Stanford International Bank, Limited (“SIBL”), an offshore bank based in Antigua. Plaintiffs purport to represent a class of investors in SIBL-issued certificates of deposit. The Bank provided certain correspondent banking services to SIBL. Plaintiffs allege that the Bank and four other banks aided and abetted or conspired with Mr. Stanford to commit fraud and that the bank defendants received fraudulent transfers from SIBL by collecting fees for providing certain services.
TD BANK GROUP ANNUAL REPORT 2015 F INANCIAL RESULTS 187
The Official Stanford Investors Committee, a court-approved committee representing investors, received permission to intervene in the lawsuit and has brought similar claims against all the bank defendants.
The court denied in part and granted in part The Toronto-Dominion Bank’s motion to dismiss the lawsuit on April 21, 2015. The court also entered a class certification scheduling order, requiring the parties to conduct discovery and submit briefing regarding class certification. The class certification motion was fully submitted on October 26, 2015. Plaintiffs filed an amended complaint asserting certain additional state law claims against the Bank on June 23, 2015. The Bank’s motion to dismiss the newly amended complaint in its entirety was fully submitted on August 18, 2015.
The Toronto-Dominion Bank is also a defendant in two cases filed in the Ontario Superior Court of Justice: (1) Wide & Dickson v. The Toronto-Dominion Bank, an action filed by the Joint Liquidators of SIBL appointed by the Eastern Caribbean Supreme Court, and (2) Dynasty Furniture Manufacturing Ltd., et al. v. The Toronto-Dominion Bank, an action filed by five investors in certificates of deposits sold by Stanford. The suits assert that the Bank acted negligently and provided knowing assistance to SIBL’s fraud. The court denied the Bank’s motion for summary judgement in the Joint Liquidators case to dismiss the action based on the applicable statute of limitations on November 9, 2015 and designated the limitations issues to be addressed as part of a future trial on the merits. The parties intend to schedule a status conference to set a timetable for proceeding with the Joint Liquidators’ case and dealing with the Dynasty case.
RESTRUCTURING In fiscal 2015 the Bank recorded restructuring charges of $686 million ($471 million after tax) on a net basis. During 2015 the Bank commenced its restructuring review and in the second quarter of 2015 recorded $337 million ($228 million after tax) of restructuring charges and recorded an additional restructuring charge of $349 million ($243 million after tax) on a net basis in the fourth quarter of 2015. The restructuring charges incurred in fiscal 2015 were intended to reduce costs and manage expenses in a sustainable manner and to achieve greater operational efficiencies. These measures included process redesign and business restructuring, retail branch and real estate optimization, and organizational review and primarily related to asset impairments, exiting of lease agreements, employee severance and other personnel-related costs.
COMMITMENTSCredit-related ArrangementsIn the normal course of business, the Bank enters into various commitments and contingent liability contracts. The primary purpose of these contracts is to make funds available for the financing needs of customers. The Bank’s policy for requiring collateral security with respect to these contracts and the types of collateral security held is generally the same as for loans made by the Bank.
Financial and performance standby letters of credit represent irrevo-cable assurances that the Bank will make payments in the event that a customer cannot meet its obligations to third parties and they carry the same credit risk, recourse and collateral security requirements as loans extended to customers. Refer to the Guarantees section in this Note for further details.
Documentary and commercial letters of credit are instruments issued on behalf of a customer authorizing a third party to draw drafts on the Bank up to a certain amount subject to specific terms and conditions. The Bank is at risk for any drafts drawn that are not ultimately settled by the customer, and the amounts are collateralized by the assets to which they relate.
Commitments to extend credit represent unutilized portions of authorizations to extend credit in the form of loans and customers’ liability under acceptances. A discussion on the types of liquidity facilities the Bank provides to its securitization conduits is included in Note 10.
The values of credit instruments reported as follows represent the maximum amount of additional credit that the Bank could be obligated to extend should contracts be fully utilized.
Credit Instruments(millions of Canadian dollars) As at
October 31 October 31 2015 2014
Financial and performance standby letters of credit $ 21,046 $ 18,395
Documentary and commercial letters of credit 330 207 Commitments to extend credit1
Original term to maturity of one year or less 40,477 32,456 Original term to maturity of more than one year 90,803 67,913
Total $ 152,656 $ 118,971
1 Commitments to extend credit exclude personal lines of credit and credit card lines, which are unconditionally cancellable at the Bank’s discretion at any time.
In addition, as at October 31, 2015, the Bank is committed to fund $133 million (October 31, 2014 – $76 million) of private equity investments.
Long-term Commitments or LeasesThe Bank has obligations under long-term non-cancellable leases for premises and equipment. Future minimum operating lease commit-ments for premises and for equipment, where the annual rental is in excess of $100 thousand, is estimated at $917 million for 2016; $874 million for 2017; $801 million for 2018, $718 million for 2019, and $4,756 million for 2020 and thereafter.
Future minimum finance lease commitments where the annual payment is in excess of $100 thousand, is estimated at $31 million for 2016; $24 million for 2017; $12 million for 2018, $10 million for 2019, and $29 million for 2020 and thereafter.
The premises and equipment net rental expense, included under Non-interest expenses in the Consolidated Statement of Income, was $1.1 billion for the year ended October 31, 2015 (October 31, 2014 – $0.9 billion; October 31, 2013 – $1.0 billion).
Pledged Assets and CollateralIn the ordinary course of business, securities and other assets are pledged against liabilities or contingent liabilities, including repurchase agreements, securitization liabilities, covered bonds, obligations related to securities sold short, and securities borrowing transactions. Assets are also deposited for the purposes of participation in clearing and payment systems and depositories or to have access to the facilities of central banks in foreign jurisdictions, or as security for contract settlements with derivative exchanges or other derivative counterparties.
TD BANK GROUP ANNUAL REPORT 2015 F INANCIAL RESULTS188
Details of assets pledged against liabilities and collateral assets held or re-pledged are shown in the following table:
(millions of Canadian dollars) As at
October 31 October 31 2015 2014
Sources of pledged assets and collateral Bank assets Interest-bearing deposits with banks $ 4,997 $ 4,594 Loans 66,602 63,293 Securities 71,228 65,318
142,827 133,205
Third-party assets1 Collateral received and available for sale or re-pledging 150,120 131,600 Less: Collateral not re-pledged (51,012) (47,101)
99,108 84,499
241,935 217,704
Uses of pledged assets and collateral2
Derivatives 3,005 2,871 Obligations related to securities sold under
repurchase agreements 70,011 56,857 Securities borrowing and lending 32,511 23,987 Obligations related to securities sold short 36,303 40,899 Securitization 33,169 39,581 Covered bond 22,071 16,355 Clearing systems, payment systems, and depositories 4,137 3,925 Foreign governments and central banks 8,462 6,273 Other 32,266 26,956
Total $ 241,935 $ 217,704
1 Includes collateral received from reverse repurchase agreements, securities borrowing, margin loans, and other client activity.
2 Includes $34.1 billion of on-balance sheet assets that the Bank has pledged and that the counterparty can subsequently repledge as at October 31, 2015 (October 31, 2014 – $26.8 billion).
Assets Sold with RecourseIn connection with its securitization activities, the Bank typically makes customary representations and warranties about the underlying assets which may result in an obligation to repurchase the assets. These representations and warranties attest that the Bank, as the seller, has executed the sale of assets in good faith, and in compliance with relevant laws and contractual requirements. In the event that they do not meet these criteria, the loans may be required to be repurchased by the Bank.
GUARANTEES The following types of transactions represent the principal guarantees that the Bank has entered into.
Assets Sold with Contingent Repurchase ObligationsThe Bank sells mortgage loans, which it continues to service, to the TD Mortgage Fund (the “Fund”), a mutual fund managed by the Bank. As part of its responsibilities, the Bank has an obligation to repurchase mortgage loans when they default or if the Fund experi-ences a liquidity event such that it does not have sufficient cash to honor unit holder redemptions. During the year ended October 31, 2015, the fair value of mortgages repurchased as a result of the liquidity event was $29 million (October 31, 2014 – $84 million). For further details on the Bank’s involvement with the Fund, refer to Note 10.
Credit EnhancementsThe Bank guarantees payments to counterparties in the event that third party credit enhancements supporting asset pools are insufficient.
Written OptionsWritten options are agreements under which the Bank grants the buyer the future right, but not the obligation, to sell or buy at or by a specified date, a specific amount of a financial instrument at a price agreed when the option is arranged and which can be physically or cash settled.
Written options can be used by the counterparty to hedge foreign exchange, equity, credit, commodity, and interest rate risks. The Bank does not track, for accounting purposes, whether its clients enter into these derivative contracts for trading or hedging purposes and has not determined if the guaranteed party has the asset or liability related to the underlying. Accordingly, the Bank cannot ascertain which contracts are guarantees under the definition contained in the accounting guide-line for disclosure of guarantees. The Bank employs a risk framework to define risk tolerances and establishes limits designed to ensure that losses do not exceed acceptable pre-defined limits. Due to the nature of these contracts, the Bank cannot make a reasonable estimate of the potential maximum amount payable to the counterparties.
The total notional principal amount of the written options as at October 31, 2015, was $101 billion (October 31, 2014 – $95 billion).
Indemnification AgreementsIn the normal course of operations, the Bank provides indemnification agreements to various counterparties in transactions such as service agreements, leasing transactions, and agreements relating to acquisi-tions and dispositions. Under these agreements, the Bank is required to compensate counterparties for costs incurred as a result of various contingencies such as changes in laws and regulations and litigation claims. The nature of certain indemnification agreements prevent the Bank from making a reasonable estimate of the maximum potential amount that the Bank would be required to pay such counterparties.
The Bank also indemnifies directors, officers and other persons, to the extent permitted by law, against certain claims that may be made against them as a result of their services to the Bank or, at the Bank’s request, to another entity.
The following table summarizes as at October 31, the maximum poten-tial amount of future payments that could be made under guarantees without consideration of possible recoveries under recourse provisions or from collateral held or pledged.
Maximum Potential Amount of Future Payments(millions of Canadian dollars) As at
October 31 October 31 2015 2014
Financial and performance standby letters of credit $ 21,046 $ 18,395 Assets sold with contingent repurchase obligations 207 267
Total $ 21,253 $ 18,662
TD BANK GROUP ANNUAL REPORT 2015 F INANCIAL RESULTS 189
RELATED PARTY TRANSACTIONSN O T E 2 9
Parties are considered to be related if one party has the ability to directly or indirectly control the other party or exercise significant influence over the other party in making financial or operational deci-sions. The Bank’s related parties include key management personnel, their close family members and their related entities, subsidiaries, associates, joint ventures, and post-employment benefit plans for the Bank’s employees.
TRANSACTIONS WITH KEY MANAGEMENT PERSONNEL, THEIR CLOSE FAMILY MEMBERS AND THEIR RELATED ENTITIESKey management personnel are those persons having authority and responsibility for planning, directing, and controlling the activities of the Bank, directly or indirectly. The Bank considers certain of its officers and directors to be key management personnel. The Bank makes loans to its key management personnel, their close family members, and their related entities on market terms and conditions with the exception of banking products and services for key manage-ment personnel, which are subject to approved policy guidelines that govern all employees.
As at October 31, 2015, $340 million of loans were made to key management personnel, their close family members and their related entities (October 31, 2014 – $266 million).
COMPENSATIONThe remuneration of key management personnel was as follows:
Compensation(millions of Canadian dollars) For the years ended October 31
2015 2014 2013
Short-term employee benefits $ 22 $ 27 $ 25 Post-employment benefits 3 1 2 Share-based payments 31 37 32
Total $ 56 $ 65 $ 59
In addition, the Bank offers deferred share and other plans to non-employee directors, executives, and certain other key employees. Refer to Note 24 for further details.
In the ordinary course of business, the Bank also provides various banking services to associated and other related corporations on terms similar to those offered to non-related parties.
TRANSACTIONS WITH SUBSIDIARIES, TD AMERITRADE AND SYMCOR INC.Transactions between the Bank and its subsidiaries meet the definition of related party transactions. If these transactions are eliminated on consolidation, they are not disclosed as related party transactions.
Transactions between the Bank, TD Ameritrade and Symcor Inc. (Symcor) also qualify as related party transactions. There were no significant transactions between the Bank, TD Ameritrade and Symcor during the year ended October 31, 2015, other than as described in the following sections.
Other Transactions with TD Ameritrade and Symcor(1) TRANSACTIONS WITH TD AMERITRADE HOLDING CORPORATIONThe Bank is party to an insured deposit account (IDA) agreement with TD Ameritrade, pursuant to which the Bank makes available to clients of TD Ameritrade, IDAs as designated sweep vehicles. TD Ameritrade provides marketing and support services with respect to the IDA. The Bank paid fees of $1.1 billion during the year ended October 31, 2015 (October 31, 2014 – $0.9 billion; October 31, 2013 – $0.8 billion) to TD Ameritrade for the deposit accounts. The fee paid by the Bank is based on the average insured deposit balance of $95 billion for the year ended October 31, 2015 (October 31, 2014 – $80 billion; October 31, 2013 – $70 billion) with a portion of the fee tied to the actual yield earned by the Bank on the investments, less the actual interest paid to clients of TD Ameritrade, and the balance tied to an agreed rate of return. The Bank earns a servicing fee of 25 basis points (bps) on the aggregate average daily balance in the sweep accounts (subject to adjustment based on a specified formula).
As at October 31, 2015, amounts receivable from TD Ameritrade were $79 million (October 31, 2014 – $103 million). As at October 31, 2015, amounts payable to TD Ameritrade were $140 million (October 31, 2014 – $104 million).
(2) TRANSACTIONS WITH SYMCORThe Bank has one-third ownership in Symcor, a Canadian provider of business process outsourcing services offering a diverse portfolio of integrated solutions in item processing, statement processing and production, and cash management services. The Bank accounts for Symcor’s results using the equity method of accounting. During the year ended October 31, 2015, the Bank paid $124 million (October 31, 2014 – $122 million; October 31, 2013 – $128 million) for these services. As at October 31, 2015, the amount payable to Symcor was $10 million (October 31, 2014 – $10 million).
The Bank and two other shareholder banks have also provided a $100 million unsecured loan facility to Symcor which was undrawn as at October 31, 2015, and October 31, 2014.
TD BANK GROUP ANNUAL REPORT 2015 F INANCIAL RESULTS190
SEGMENTED INFORMATIONN O T E 3 0
Effective November 1, 2013, the Bank revised its reportable segments, and for management reporting purposes, reports its results under three key business segments: Canadian Retail, which includes the results of the Canadian personal and commercial banking businesses, Canadian credit cards, TD Auto Finance Canada and Canadian wealth and insurance businesses; U.S. Retail, which includes the results of the U.S. personal and commercial banking businesses, U.S. credit cards, TD Auto Finance U.S., U.S. wealth business and the Bank’s investment in TD Ameritrade; and Wholesale Banking. The Bank’s other activities are grouped into the Corporate segment. Certain goodwill pertaining to the former Wealth and Insurance segment was allocated on a rela-tive fair value basis to the Canadian Retail and U.S. Retail segments when the segments were realigned. The segmented results for periods prior to the segment realignment have been restated accordingly.
Canadian Retail is comprised of Canadian personal and commercial banking, which provides financial products and services to personal, small business, and commercial customers, TD Auto Finance Canada, the Canadian credit card business, the Canadian wealth business, which provides investment products and services to institutional and retail investors, and the insurance business. U.S. Retail is comprised of the personal and commercial banking operations in the U.S. operating under the brand TD Bank, America’s Most Convenient Bank®, primarily in the Northeast and Mid-Atlantic regions and Florida, and the U.S. wealth business, including Epoch and the Bank’s equity investment in TD Ameritrade. Wholesale banking provides a wide range of capital markets, investment banking, and corporate banking products and services, including underwriting and distribution of new debt and equity issues, providing advice on strategic acquisitions and divestitures, and meeting the daily trading, funding, and investment needs of our clients. The Bank’s other activities are grouped into the Corporate segment. The Corporate segment includes the effects of certain asset securitization programs, treasury management, the collectively assessed allowance for incurred but not identified credit losses in Canadian Retail and Wholesale Banking, elimination of taxable equiva-lent adjustments and other management reclassifications, corporate level tax items, and residual unallocated revenue and expenses.
The results of each business segment reflect revenue, expenses and assets generated by the businesses in that segment. Due to the complexity of the Bank, its management reporting model uses various estimates, assumptions, allocations and risk-based methodologies for funds transfer pricing, inter-segment revenue, income tax rates, capi-tal, indirect expenses and cost transfers to measure business segment
results. Transfer pricing of funds is generally applied at market rates. Inter-segment revenue is negotiated between each business segment and approximates the fair value of the services provided. Income tax provision or recovery is generally applied to each segment based on a statutory tax rate and may be adjusted for items and activities unique to each segment. Amortization of intangibles acquired as a result of business combinations is included in the Corporate segment. Accord-ingly, net income for business segments is presented before amortiza-tion of these intangibles.
Net interest income within Wholesale Banking is calculated on a taxable equivalent basis (TEB), which means that the value of non-taxable or tax-exempt income, including dividends, is adjusted to its equivalent before-tax value. Using TEB allows the Bank to measure income from all securities and loans consistently and makes for a more meaningful comparison of net interest income with similar institutions. The TEB adjustment reflected in Wholesale Banking is reversed in the Corporate segment.
The Bank purchases CDS to hedge the credit risk in Wholesale Bank-ing’s corporate lending portfolio. These CDS do not qualify for hedge accounting treatment and are measured at fair value with changes in fair value recognized in current period’s earnings. The related loans are accounted for at amortized cost. Management believes that this asym-metry in the accounting treatment between CDS and loans would result in periodic profit and loss volatility which is not indicative of the economics of the corporate loan portfolio or the underlying business performance in Wholesale Banking. As a result, these CDS are accounted for on an accrual basis in Wholesale Banking and the gains and losses on these CDS, in excess of the accrued cost, are reported in the Corporate segment.
The Bank reclassified certain debt securities from trading to the available-for-sale category effective August 1, 2008. As part of the Bank’s trading strategy, these debt securities are economically hedged, primarily with CDS and interest rate swap contracts. These derivatives are not eligible for reclassification and are recorded on a fair value basis with changes in fair value recorded in the period’s earnings. Management believes that this asymmetry in the accounting treatment between derivatives and the reclassified debt securities results in vola-tility in earnings from period to period that is not indicative of the economics of the underlying business performance in Wholesale Bank-ing. As a result, the derivatives are accounted for on an accrual basis in Wholesale Banking and the gains and losses related to the derivatives, in excess of the accrued costs, are reported in the Corporate segment.
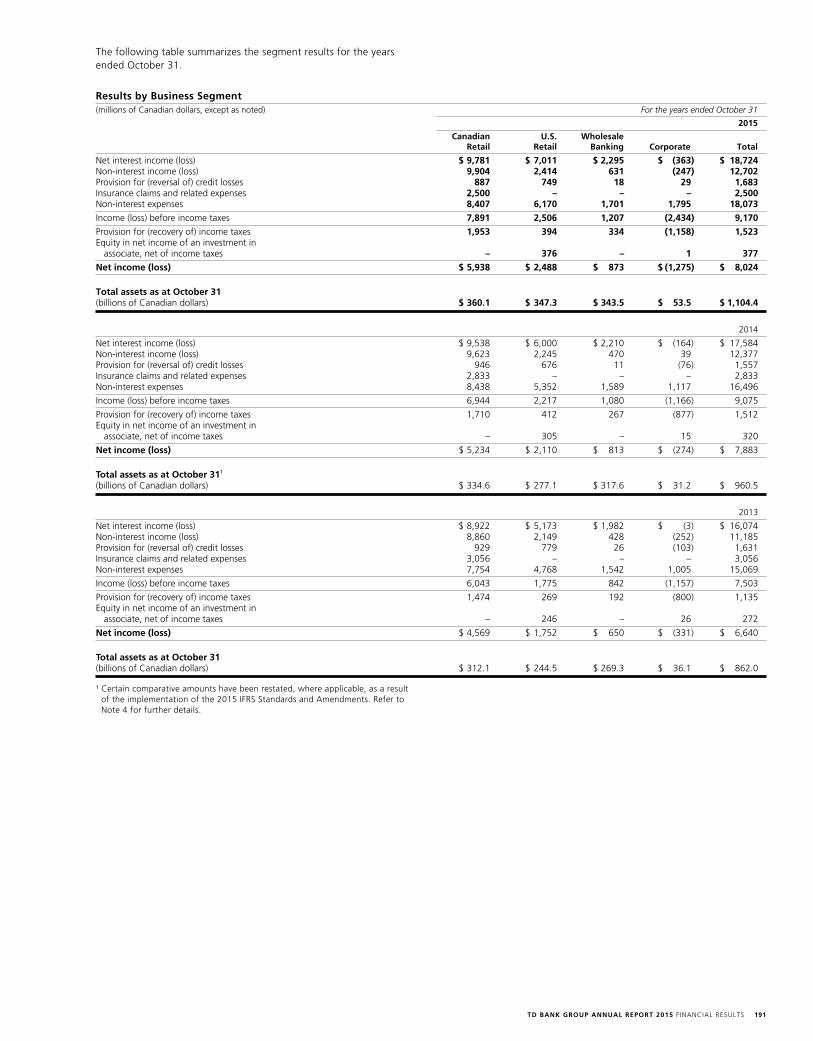
TD BANK GROUP ANNUAL REPORT 2015 F INANCIAL RESULTS 191
The following table summarizes the segment results for the years ended October 31.
Results by Business Segment(millions of Canadian dollars, except as noted) For the years ended October 31
2015
Canadian U.S. Wholesale Retail Retail Banking Corporate Total
Net interest income (loss) $ 9,781 $ 7,011 $ 2,295 $ (363) $ 18,724 Non-interest income (loss) 9,904 2,414 631 (247) 12,702 Provision for (reversal of) credit losses 887 749 18 29 1,683 Insurance claims and related expenses 2,500 – – – 2,500 Non-interest expenses 8,407 6,170 1,701 1,795 18,073
Income (loss) before income taxes 7,891 2,506 1,207 (2,434) 9,170
Provision for (recovery of) income taxes 1,953 394 334 (1,158) 1,523 Equity in net income of an investment in
associate, net of income taxes – 376 – 1 377
Net income (loss) $ 5,938 $ 2,488 $ 873 $ (1,275) $ 8,024
Total assets as at October 31 (billions of Canadian dollars) $ 360.1 $ 347.3 $ 343.5 $ 53.5 $ 1,104.4
2014
Net interest income (loss) $ 9,538 $ 6,000 $ 2,210 $ (164) $ 17,584 Non-interest income (loss) 9,623 2,245 470 39 12,377 Provision for (reversal of) credit losses 946 676 11 (76) 1,557 Insurance claims and related expenses 2,833 – – – 2,833 Non-interest expenses 8,438 5,352 1,589 1,117 16,496
Income (loss) before income taxes 6,944 2,217 1,080 (1,166) 9,075
Provision for (recovery of) income taxes 1,710 412 267 (877) 1,512 Equity in net income of an investment in
associate, net of income taxes – 305 – 15 320
Net income (loss) $ 5,234 $ 2,110 $ 813 $ (274) $ 7,883
Total assets as at October 311 (billions of Canadian dollars) $ 334.6 $ 277.1 $ 317.6 $ 31.2 $ 960.5
2013
Net interest income (loss) $ 8,922 $ 5,173 $ 1,982 $ (3) $ 16,074 Non-interest income (loss) 8,860 2,149 428 (252) 11,185 Provision for (reversal of) credit losses 929 779 26 (103) 1,631 Insurance claims and related expenses 3,056 – – – 3,056 Non-interest expenses 7,754 4,768 1,542 1,005 15,069
Income (loss) before income taxes 6,043 1,775 842 (1,157) 7,503
Provision for (recovery of) income taxes 1,474 269 192 (800) 1,135 Equity in net income of an investment in
associate, net of income taxes – 246 – 26 272
Net income (loss) $ 4,569 $ 1,752 $ 650 $ (331) $ 6,640
Total assets as at October 31 (billions of Canadian dollars) $ 312.1 $ 244.5 $ 269.3 $ 36.1 $ 862.0
1 Certain comparative amounts have been restated, where applicable, as a result of the implementation of the 2015 IFRS Standards and Amendments. Refer to Note 4 for further details.
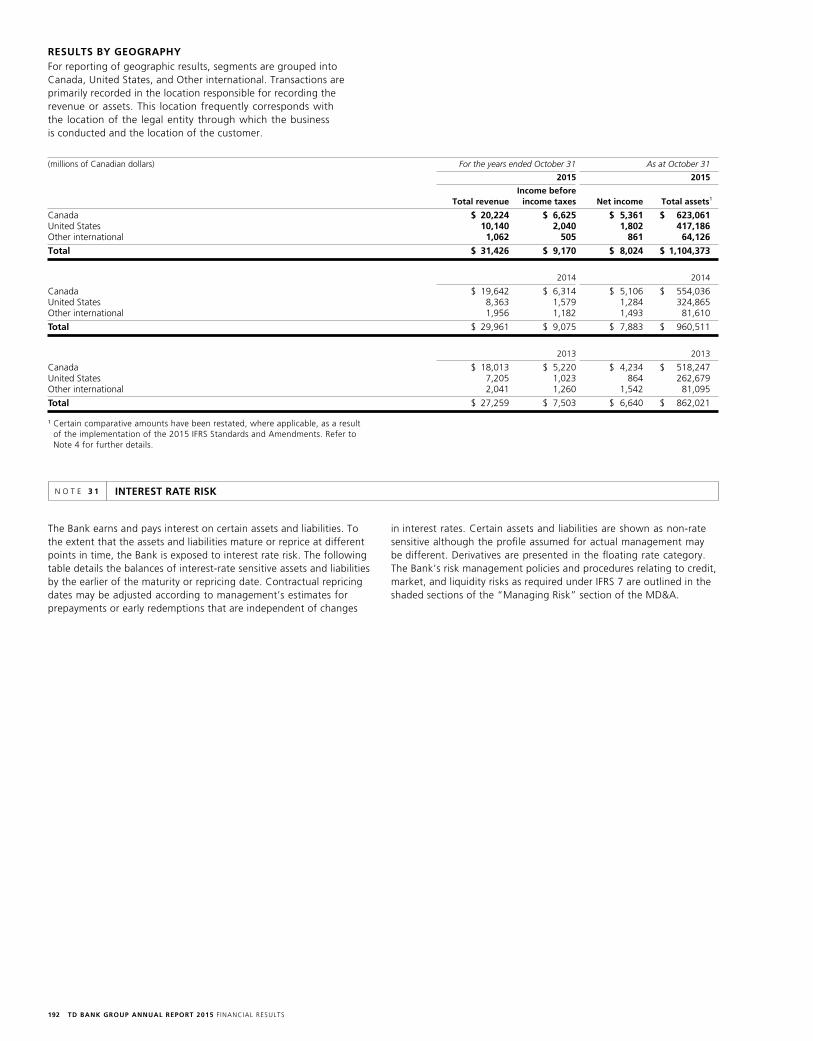
TD BANK GROUP ANNUAL REPORT 2015 F INANCIAL RESULTS192
(millions of Canadian dollars) For the years ended October 31 As at October 31
2015 2015
Income before Total revenue income taxes Net income Total assets1
Canada $ 20,224 $ 6,625 $ 5,361 $ 623,061United States 10,140 2,040 1,802 417,186 Other international 1,062 505 861 64,126
Total $ 31,426 $ 9,170 $ 8,024 $ 1,104,373
2014 2014
Canada $ 19,642 $ 6,314 $ 5,106 $ 554,036 United States 8,363 1,579 1,284 324,865 Other international 1,956 1,182 1,493 81,610
Total $ 29,961 $ 9,075 $ 7,883 $ 960,511
2013 2013
Canada $ 18,013 $ 5,220 $ 4,234 $ 518,247 United States 7,205 1,023 864 262,679 Other international 2,041 1,260 1,542 81,095
Total $ 27,259 $ 7,503 $ 6,640 $ 862,021
1 Certain comparative amounts have been restated, where applicable, as a result of the implementation of the 2015 IFRS Standards and Amendments. Refer to Note 4 for further details.
RESULTS BY GEOGRAPHY For reporting of geographic results, segments are grouped into Canada, United States, and Other international. Transactions are primarily recorded in the location responsible for recording the revenue or assets. This location frequently corresponds with the location of the legal entity through which the business is conducted and the location of the customer.
INTEREST RATE RISKN O T E 3 1
The Bank earns and pays interest on certain assets and liabilities. To the extent that the assets and liabilities mature or reprice at different points in time, the Bank is exposed to interest rate risk. The following table details the balances of interest-rate sensitive assets and liabilities by the earlier of the maturity or repricing date. Contractual repricing dates may be adjusted according to management’s estimates for prepayments or early redemptions that are independent of changes
in interest rates. Certain assets and liabilities are shown as non-rate sensitive although the profile assumed for actual management may be different. Derivatives are presented in the floating rate category. The Bank’s risk management policies and procedures relating to credit, market, and liquidity risks as required under IFRS 7 are outlined in the shaded sections of the “Managing Risk” section of the MD&A.

TD BANK GROUP ANNUAL REPORT 2015 F INANCIAL RESULTS 193
Interest Rate Risk1
(billions of Canadian dollars, except as noted) As at
October 31, 2015
Total Over 1 Non- Floating Within 3 3 months within year to Over interest rate months to 1 year 1 year 5 years 5 years sensitive Total
AssetsCash resources and other $ 16.5 $ 28.1 $ 0.7 $ 45.3 $ – $ – $ 0.3 $ 45.6 Trading loans, securities, and other 0.8 5.6 8.7 15.1 24.3 16.6 39.2 95.2 Financial assets designated at fair value through profit or loss 1.0 0.2 0.7 1.9 1.2 1.2 0.1 4.4 Available-for-sale 1.4 6.4 3.5 11.3 45.7 31.3 0.5 88.8 Held-to-maturity – 1.2 7.1 8.3 53.0 13.2 – 74.5 Securities purchased under reverse repurchase agreements 5.5 63.5 15.2 84.2 – – 13.2 97.4 Loans 21.9 227.5 63.3 312.7 184.0 33.7 13.9 544.3 Other 86.0 – – 86.0 – – 68.2 154.2
Total assets 133.1 332.5 99.2 564.8 308.2 96.0 135.4 1,104.4
Liabilities and equity Trading deposits – 29.0 43.2 72.2 0.5 0.5 1.6 74.8 Other financial liabilities designated at fair value through profit or loss 0.6 0.2 0.6 1.4 – – – 1.4 Other deposits 237.8 76.0 44.3 358.1 104.8 32.5 200.2 695.6 Securitization liabilities at fair value – 0.5 0.3 0.8 7.0 3.2 – 11.0 Obligations related to securities sold short 38.8 – – 38.8 – – – 38.8 Obligations related to securities sold under repurchase agreements 0.6 53.9 0.3 54.8 – – 12.4 67.2 Securitization liabilities at amortized cost – 8.8 2.9 11.7 8.5 2.5 – 22.7 Subordinated notes and debentures – 1.0 – 1.0 7.4 0.2 – 8.6 Other 73.9 – – 73.9 – – 43.4 117.3 Equity – – – – 2.0 0.7 64.3 67.0
Total liabilities and equity 351.7 169.4 91.6 612.7 130.2 39.6 321.9 1,104.4
Net position $ (218.6) $ 163.1 $ 7.6 $ (47.9) $ 178.0 $ 56.4 $ (186.5) $ –
October 31, 2014
Total assets $ 123.9 $ 278.4 $ 113.4 $ 515.7 $ 249.3 $ 70.2 $ 125.3 $ 960.5
Total liabilities and equity 311.3 142.4 66.0 519.7 121.1 34.2 285.5 960.5
Net position $ (187.4) $ 136.0 $ 47.4 $ (4.0) $ 128.2 $ 36.0 $ (160.2) $ –
1 Certain comparative amounts have been restated, where applicable, as a result of the implementation of the 2015 IFRS Standards and Amendments. Refer to Note 4 for further details.
Interest Rate Risk by Category(billions of Canadian dollars) As at
October 31, 2015
Total Over 1 Non- Floating Within 3 months within year to Over interest rate 3 months to 1 year 1 year 5 years 5 years sensitive Total
Canadian currency $ (172.3) $ 118.9 $ 34.6 $ (18.8) $ 113.0 $ 11.3 $ (110.6) $ (5.1)Foreign currency (46.3) 44.2 (27.0) (29.1) 65.0 45.1 (75.9) 5.1
Net position $ (218.6) $ 163.1 $ 7.6 $ (47.9) $ 178.0 $ 56.4 $ (186.5) $ –
October 31, 2014
Canadian currency $ (186.1) $ 109.7 $ 25.5 $ (50.9) $ 103.2 $ 9.9 $ (49.5) $ 12.7 Foreign currency (1.3) 26.3 21.9 46.9 25.0 26.1 (110.7) (12.7)
Net position $ (187.4) $ 136.0 $ 47.4 $ (4.0) $ 128.2 $ 36.0 $ (160.2) $ –
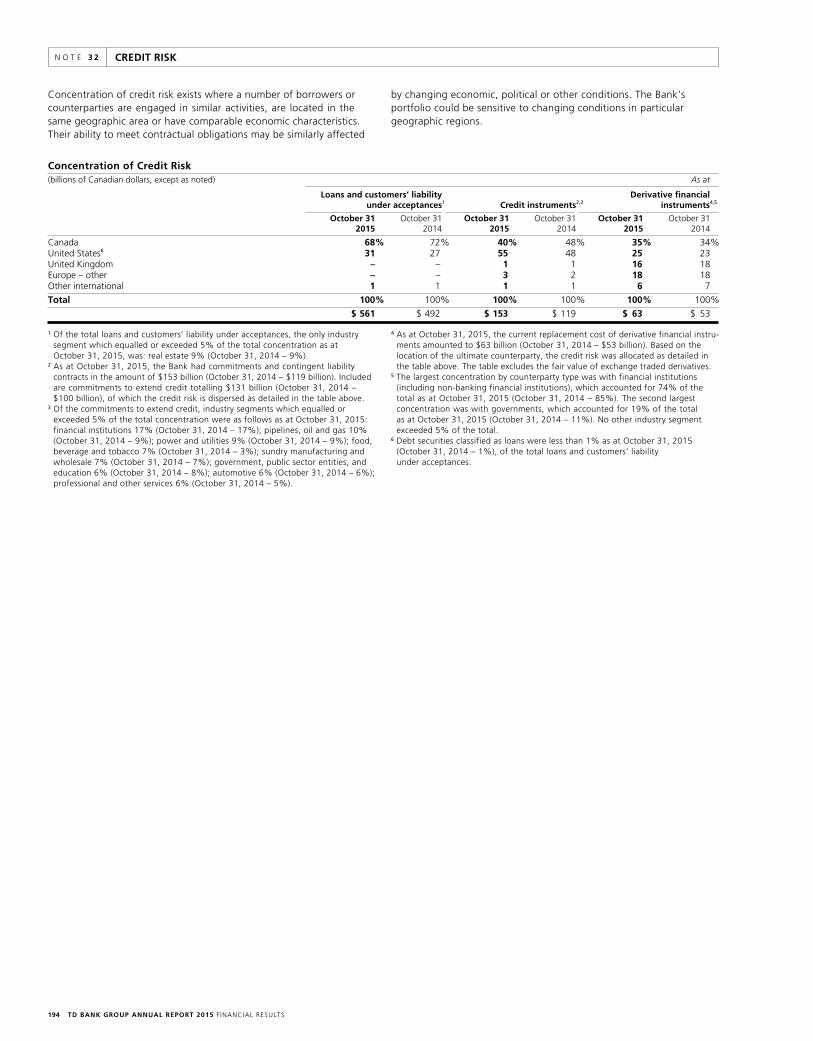
TD BANK GROUP ANNUAL REPORT 2015 F INANCIAL RESULTS194
Concentration of Credit Risk (billions of Canadian dollars, except as noted) As at
Loans and customers’ liability Derivative financial under acceptances1 Credit instruments2,3 instruments4,5
October 31 October 31 October 31 October 31 October 31 October 31 2015 2014 2015 2014 2015 2014
Canada 68% 72% 40% 48% 35% 34%United States6 31 27 55 48 25 23 United Kingdom – – 1 1 16 18 Europe – other – – 3 2 18 18 Other international 1 1 1 1 6 7
Total 100% 100% 100% 100% 100% 100%
$ 561 $ 492 $ 153 $ 119 $ 63 $ 53
CREDIT RISKN O T E 3 2
Concentration of credit risk exists where a number of borrowers or counterparties are engaged in similar activities, are located in the same geographic area or have comparable economic characteristics. Their ability to meet contractual obligations may be similarly affected
by changing economic, political or other conditions. The Bank’s portfolio could be sensitive to changing conditions in particular geographic regions.
1 Of the total loans and customers’ liability under acceptances, the only industry segment which equalled or exceeded 5% of the total concentration as at October 31, 2015, was: real estate 9% (October 31, 2014 – 9%).
2 As at October 31, 2015, the Bank had commitments and contingent liability contracts in the amount of $153 billion (October 31, 2014 – $119 billion). Included are commitments to extend credit totalling $131 billion (October 31, 2014 – $100 billion), of which the credit risk is dispersed as detailed in the table above.
3 Of the commitments to extend credit, industry segments which equalled or exceeded 5% of the total concentration were as follows as at October 31, 2015: financial institutions 17% (October 31, 2014 – 17%); pipelines, oil and gas 10% (October 31, 2014 – 9%); power and utilities 9% (October 31, 2014 – 9%); food, beverage and tobacco 7% (October 31, 2014 – 3%); sundry manufacturing and wholesale 7% (October 31, 2014 – 7%); government, public sector entities, and education 6% (October 31, 2014 – 8%); automotive 6% (October 31, 2014 – 6%); professional and other services 6% (October 31, 2014 – 5%).
4 As at October 31, 2015, the current replacement cost of derivative financial instru-ments amounted to $63 billion (October 31, 2014 – $53 billion). Based on the location of the ultimate counterparty, the credit risk was allocated as detailed in the table above. The table excludes the fair value of exchange traded derivatives.
5 The largest concentration by counterparty type was with financial institutions (including non-banking financial institutions), which accounted for 74% of the total as at October 31, 2015 (October 31, 2014 – 85%). The second largest concentration was with governments, which accounted for 19% of the total as at October 31, 2015 (October 31, 2014 – 11%). No other industry segment exceeded 5% of the total.
6 Debt securities classified as loans were less than 1% as at October 31, 2015 (October 31, 2014 – 1%), of the total loans and customers’ liability under acceptances.
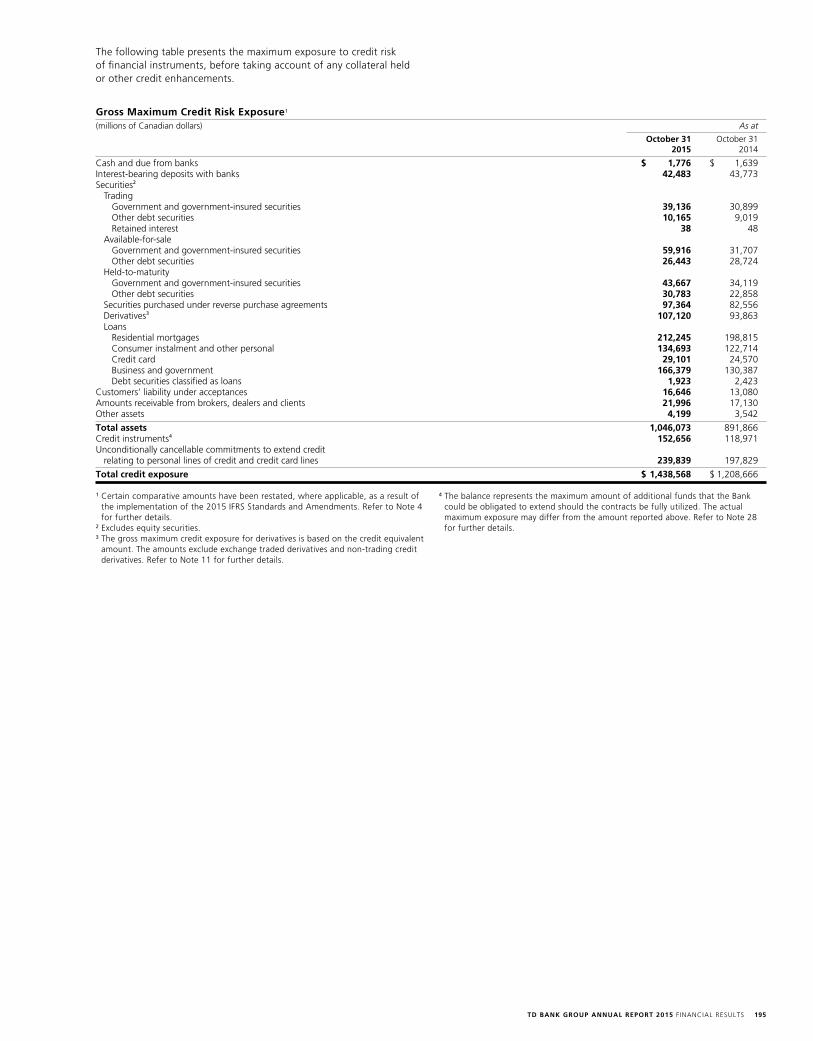
TD BANK GROUP ANNUAL REPORT 2015 F INANCIAL RESULTS 195
The following table presents the maximum exposure to credit risk of financial instruments, before taking account of any collateral held or other credit enhancements.
Gross Maximum Credit Risk Exposure1
(millions of Canadian dollars) As at
October 31 October 31 2015 2014
Cash and due from banks $ 1,776 $ 1,639 Interest-bearing deposits with banks 42,483 43,773 Securities2
Trading Government and government-insured securities 39,136 30,899 Other debt securities 10,165 9,019 Retained interest 38 48 Available-for-sale
Government and government-insured securities 59,916 31,707 Other debt securities 26,443 28,724 Held-to-maturity Government and government-insured securities 43,667 34,119 Other debt securities 30,783 22,858 Securities purchased under reverse purchase agreements 97,364 82,556 Derivatives3 107,120 93,863 Loans Residential mortgages 212,245 198,815 Consumer instalment and other personal 134,693 122,714 Credit card 29,101 24,570 Business and government 166,379 130,387 Debt securities classified as loans 1,923 2,423 Customers’ liability under acceptances 16,646 13,080 Amounts receivable from brokers, dealers and clients 21,996 17,130 Other assets 4,199 3,542
Total assets 1,046,073 891,866 Credit instruments4 152,656 118,971 Unconditionally cancellable commitments to extend credit
relating to personal lines of credit and credit card lines 239,839 197,829
Total credit exposure $ 1,438,568 $ 1,208,666
1 Certain comparative amounts have been restated, where applicable, as a result of the implementation of the 2015 IFRS Standards and Amendments. Refer to Note 4 for further details.
2 Excludes equity securities.3 The gross maximum credit exposure for derivatives is based on the credit equivalent
amount. The amounts exclude exchange traded derivatives and non-trading credit derivatives. Refer to Note 11 for further details.
4 The balance represents the maximum amount of additional funds that the Bank could be obligated to extend should the contracts be fully utilized. The actual maximum exposure may differ from the amount reported above. Refer to Note 28 for further details.
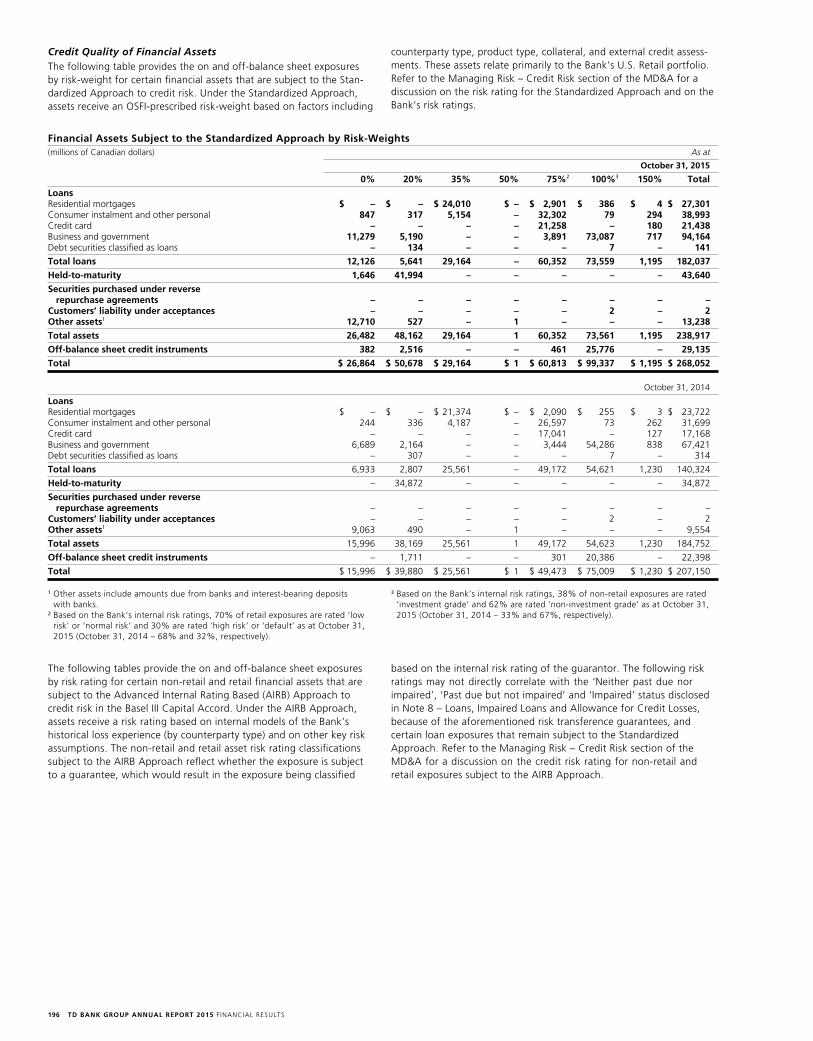
TD BANK GROUP ANNUAL REPORT 2015 F INANCIAL RESULTS196
Financial Assets Subject to the Standardized Approach by Risk-Weights(millions of Canadian dollars) As at
October 31, 2015
0% 20% 35% 50% 75%2 100%3 150% Total
LoansResidential mortgages $ – $ – $ 24,010 $ – $ 2,901 $ 386 $ 4 $ 27,301 Consumer instalment and other personal 847 317 5,154 – 32,302 79 294 38,993 Credit card – – – – 21,258 – 180 21,438 Business and government 11,279 5,190 – – 3,891 73,087 717 94,164 Debt securities classified as loans – 134 – – – 7 – 141
Total loans 12,126 5,641 29,164 – 60,352 73,559 1,195 182,037
Held-to-maturity 1,646 41,994 – – – – – 43,640
Securities purchased under reverse repurchase agreements – – – – – – – –
Customers’ liability under acceptances – – – – – 2 – 2 Other assets1 12,710 527 – 1 – – – 13,238
Total assets 26,482 48,162 29,164 1 60,352 73,561 1,195 238,917
Off-balance sheet credit instruments 382 2,516 – – 461 25,776 – 29,135
Total $ 26,864 $ 50,678 $ 29,164 $ 1 $ 60,813 $ 99,337 $ 1,195 $ 268,052
October 31, 2014
Loans Residential mortgages $ – $ – $ 21,374 $ – $ 2,090 $ 255 $ 3 $ 23,722 Consumer instalment and other personal 244 336 4,187 – 26,597 73 262 31,699 Credit card – – – – 17,041 – 127 17,168 Business and government 6,689 2,164 – – 3,444 54,286 838 67,421 Debt securities classified as loans – 307 – – – 7 – 314
Total loans 6,933 2,807 25,561 – 49,172 54,621 1,230 140,324
Held-to-maturity – 34,872 – – – – – 34,872
Securities purchased under reverse repurchase agreements – – – – – – – –
Customers’ liability under acceptances – – – – – 2 – 2 Other assets1 9,063 490 – 1 – – – 9,554
Total assets 15,996 38,169 25,561 1 49,172 54,623 1,230 184,752
Off-balance sheet credit instruments – 1,711 – – 301 20,386 – 22,398
Total $ 15,996 $ 39,880 $ 25,561 $ 1 $ 49,473 $ 75,009 $ 1,230 $ 207,150
Credit Quality of Financial AssetsThe following table provides the on and off-balance sheet exposures by risk-weight for certain financial assets that are subject to the Stan-dardized Approach to credit risk. Under the Standardized Approach, assets receive an OSFI-prescribed risk-weight based on factors including
counterparty type, product type, collateral, and external credit assess-ments. These assets relate primarily to the Bank’s U.S. Retail portfolio. Refer to the Managing Risk – Credit Risk section of the MD&A for a discussion on the risk rating for the Standardized Approach and on the Bank’s risk ratings.
1 Other assets include amounts due from banks and interest-bearing deposits with banks.
2 Based on the Bank’s internal risk ratings, 70% of retail exposures are rated ‘low risk’ or ‘normal risk’ and 30% are rated ‘high risk’ or ‘default’ as at October 31, 2015 (October 31, 2014 – 68% and 32%, respectively).
3 Based on the Bank’s internal risk ratings, 38% of non-retail exposures are rated ‘investment grade’ and 62% are rated ‘non-investment grade’ as at October 31, 2015 (October 31, 2014 – 33% and 67%, respectively).
The following tables provide the on and off-balance sheet exposures by risk rating for certain non-retail and retail financial assets that are subject to the Advanced Internal Rating Based (AIRB) Approach to credit risk in the Basel III Capital Accord. Under the AIRB Approach, assets receive a risk rating based on internal models of the Bank’s historical loss experience (by counterparty type) and on other key risk assumptions. The non-retail and retail asset risk rating classifications subject to the AIRB Approach reflect whether the exposure is subject to a guarantee, which would result in the exposure being classified
based on the internal risk rating of the guarantor. The following risk ratings may not directly correlate with the ‘Neither past due nor impaired’, ‘Past due but not impaired’ and ‘Impaired’ status disclosed in Note 8 – Loans, Impaired Loans and Allowance for Credit Losses, because of the aforementioned risk transference guarantees, and certain loan exposures that remain subject to the Standardized Approach. Refer to the Managing Risk – Credit Risk section of the MD&A for a discussion on the credit risk rating for non-retail and retail exposures subject to the AIRB Approach.
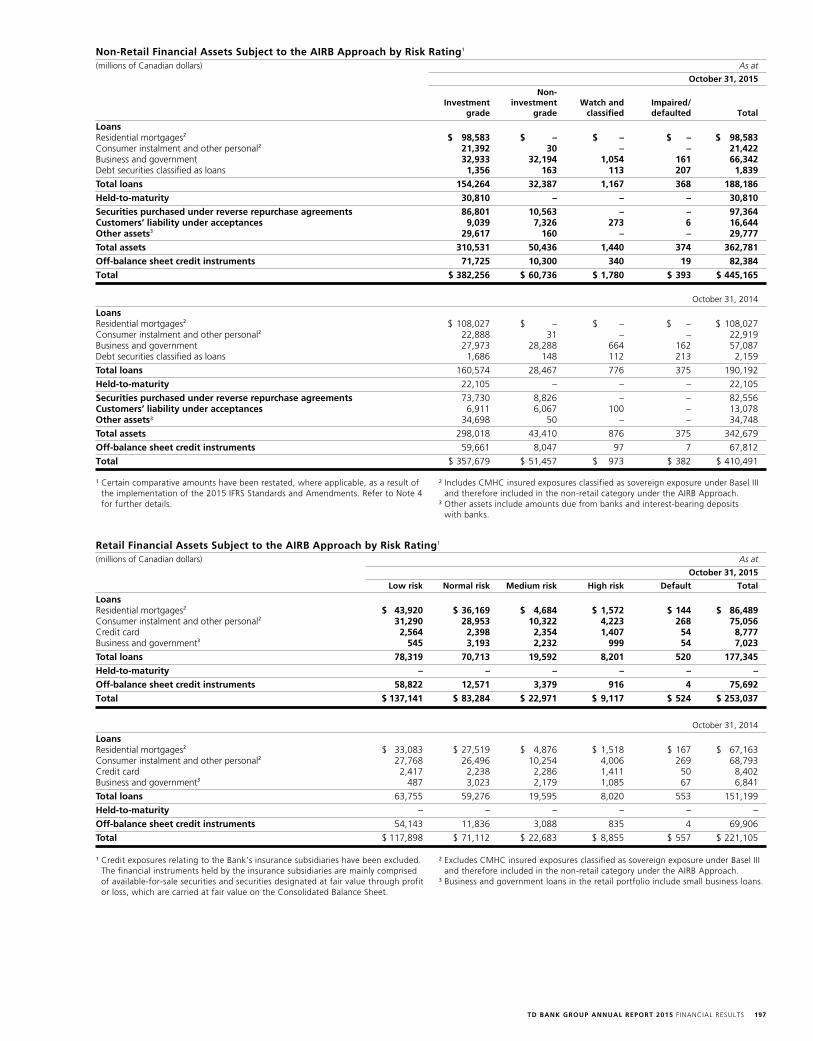
TD BANK GROUP ANNUAL REPORT 2015 F INANCIAL RESULTS 197
Non-Retail Financial Assets Subject to the AIRB Approach by Risk Rating1
(millions of Canadian dollars) As at
October 31, 2015
Non- Investment investment Watch and Impaired/ grade grade classified defaulted Total
LoansResidential mortgages2 $ 98,583 $ – $ – $ – $ 98,583 Consumer instalment and other personal2 21,392 30 – – 21,422 Business and government 32,933 32,194 1,054 161 66,342 Debt securities classified as loans 1,356 163 113 207 1,839
Total loans 154,264 32,387 1,167 368 188,186
Held-to-maturity 30,810 – – – 30,810
Securities purchased under reverse repurchase agreements 86,801 10,563 – – 97,364 Customers’ liability under acceptances 9,039 7,326 273 6 16,644 Other assets3 29,617 160 – – 29,777
Total assets 310,531 50,436 1,440 374 362,781
Off-balance sheet credit instruments 71,725 10,300 340 19 82,384
Total $ 382,256 $ 60,736 $ 1,780 $ 393 $ 445,165
October 31, 2014
Loans Residential mortgages2 $ 108,027 $ – $ – $ – $ 108,027 Consumer instalment and other personal2 22,888 31 – – 22,919 Business and government 27,973 28,288 664 162 57,087 Debt securities classified as loans 1,686 148 112 213 2,159
Total loans 160,574 28,467 776 375 190,192
Held-to-maturity 22,105 – – – 22,105
Securities purchased under reverse repurchase agreements 73,730 8,826 – – 82,556 Customers’ liability under acceptances 6,911 6,067 100 – 13,078 Other assets3 34,698 50 – – 34,748
Total assets 298,018 43,410 876 375 342,679
Off-balance sheet credit instruments 59,661 8,047 97 7 67,812
Total $ 357,679 $ 51,457 $ 973 $ 382 $ 410,491
1 Certain comparative amounts have been restated, where applicable, as a result of the implementation of the 2015 IFRS Standards and Amendments. Refer to Note 4 for further details.
2 Includes CMHC insured exposures classified as sovereign exposure under Basel III and therefore included in the non-retail category under the AIRB Approach.
3 Other assets include amounts due from banks and interest-bearing deposits with banks.
Retail Financial Assets Subject to the AIRB Approach by Risk Rating1
(millions of Canadian dollars) As at
October 31, 2015
Low risk Normal risk Medium risk High risk Default Total
LoansResidential mortgages2 $ 43,920 $ 36,169 $ 4,684 $ 1,572 $ 144 $ 86,489 Consumer instalment and other personal2 31,290 28,953 10,322 4,223 268 75,056 Credit card 2,564 2,398 2,354 1,407 54 8,777 Business and government3 545 3,193 2,232 999 54 7,023
Total loans 78,319 70,713 19,592 8,201 520 177,345
Held-to-maturity – – – – – –
Off-balance sheet credit instruments 58,822 12,571 3,379 916 4 75,692
Total $ 137,141 $ 83,284 $ 22,971 $ 9,117 $ 524 $ 253,037
October 31, 2014
Loans Residential mortgages2 $ 33,083 $ 27,519 $ 4,876 $ 1,518 $ 167 $ 67,163 Consumer instalment and other personal2 27,768 26,496 10,254 4,006 269 68,793 Credit card 2,417 2,238 2,286 1,411 50 8,402 Business and government3 487 3,023 2,179 1,085 67 6,841
Total loans 63,755 59,276 19,595 8,020 553 151,199
Held-to-maturity – – – – – –
Off-balance sheet credit instruments 54,143 11,836 3,088 835 4 69,906
Total $ 117,898 $ 71,112 $ 22,683 $ 8,855 $ 557 $ 221,105
1 Credit exposures relating to the Bank’s insurance subsidiaries have been excluded. The financial instruments held by the insurance subsidiaries are mainly comprised of available-for-sale securities and securities designated at fair value through profit or loss, which are carried at fair value on the Consolidated Balance Sheet.
2 Excludes CMHC insured exposures classified as sovereign exposure under Basel III and therefore included in the non-retail category under the AIRB Approach.
3 Business and government loans in the retail portfolio include small business loans.
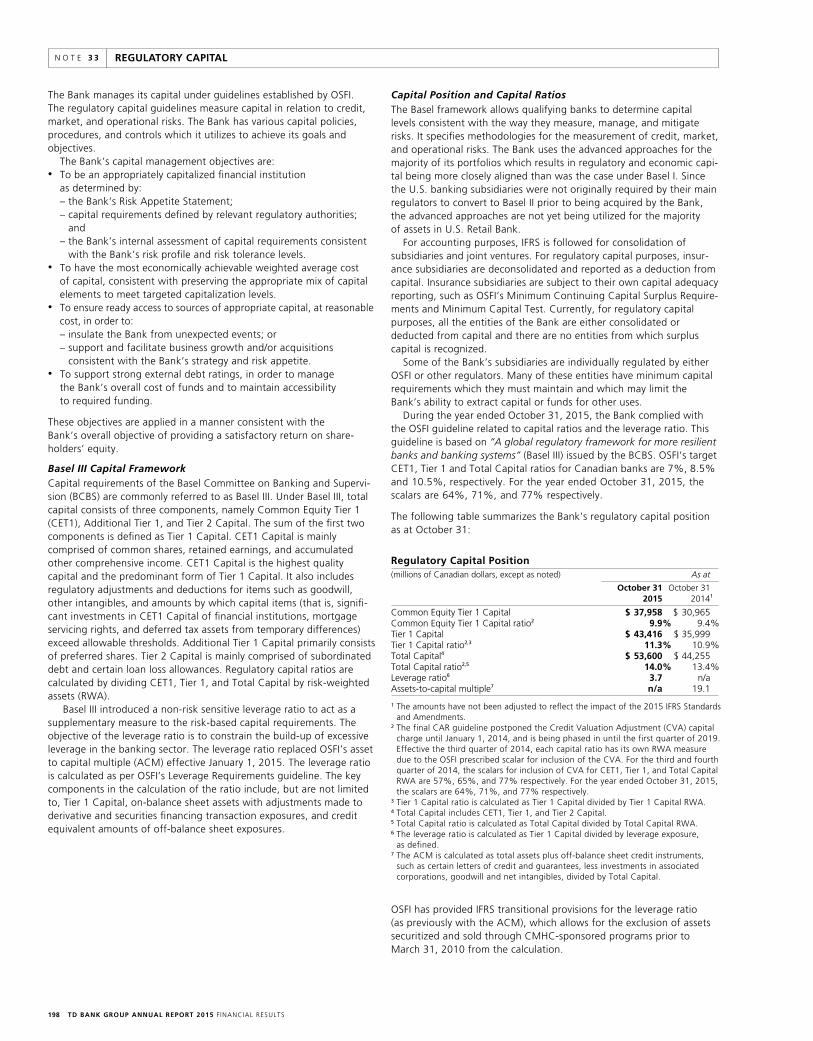
TD BANK GROUP ANNUAL REPORT 2015 F INANCIAL RESULTS198
REGULATORY CAPITALN O T E 3 3
The Bank manages its capital under guidelines established by OSFI. The regulatory capital guidelines measure capital in relation to credit, market, and operational risks. The Bank has various capital policies, procedures, and controls which it utilizes to achieve its goals and objectives.
The Bank’s capital management objectives are:• To be an appropriately capitalized financial institution
as determined by: – the Bank’s Risk Appetite Statement; – capital requirements defined by relevant regulatory authorities;
and – the Bank’s internal assessment of capital requirements consistent
with the Bank’s risk profile and risk tolerance levels.• To have the most economically achievable weighted average cost
of capital, consistent with preserving the appropriate mix of capital elements to meet targeted capitalization levels.
• To ensure ready access to sources of appropriate capital, at reasonable cost, in order to:
– insulate the Bank from unexpected events; or – support and facilitate business growth and/or acquisitions
consistent with the Bank’s strategy and risk appetite. • To support strong external debt ratings, in order to manage
the Bank’s overall cost of funds and to maintain accessibility to required funding.
These objectives are applied in a manner consistent with the Bank’s overall objective of providing a satisfactory return on share-holders’ equity.
Basel III Capital FrameworkCapital requirements of the Basel Committee on Banking and Supervi-sion (BCBS) are commonly referred to as Basel III. Under Basel III, total capital consists of three components, namely Common Equity Tier 1 (CET1), Additional Tier 1, and Tier 2 Capital. The sum of the first two components is defined as Tier 1 Capital. CET1 Capital is mainly comprised of common shares, retained earnings, and accumulated other comprehensive income. CET1 Capital is the highest quality capital and the predominant form of Tier 1 Capital. It also includes regulatory adjustments and deductions for items such as goodwill, other intangibles, and amounts by which capital items (that is, signifi-cant investments in CET1 Capital of financial institutions, mortgage servicing rights, and deferred tax assets from temporary differences) exceed allowable thresholds. Additional Tier 1 Capital primarily consists of preferred shares. Tier 2 Capital is mainly comprised of subordinated debt and certain loan loss allowances. Regulatory capital ratios are calculated by dividing CET1, Tier 1, and Total Capital by risk-weighted assets (RWA).
Basel III introduced a non-risk sensitive leverage ratio to act as a supplementary measure to the risk-based capital requirements. The objective of the leverage ratio is to constrain the build-up of excessive leverage in the banking sector. The leverage ratio replaced OSFI’s asset to capital multiple (ACM) effective January 1, 2015. The leverage ratio is calculated as per OSFI’s Leverage Requirements guideline. The key components in the calculation of the ratio include, but are not limited to, Tier 1 Capital, on-balance sheet assets with adjustments made to derivative and securities financing transaction exposures, and credit equivalent amounts of off-balance sheet exposures.
Capital Position and Capital RatiosThe Basel framework allows qualifying banks to determine capital levels consistent with the way they measure, manage, and mitigate risks. It specifies methodologies for the measurement of credit, market, and operational risks. The Bank uses the advanced approaches for the majority of its portfolios which results in regulatory and economic capi-tal being more closely aligned than was the case under Basel I. Since the U.S. banking subsidiaries were not originally required by their main regulators to convert to Basel II prior to being acquired by the Bank, the advanced approaches are not yet being utilized for the majority of assets in U.S. Retail Bank.
For accounting purposes, IFRS is followed for consolidation of subsidiaries and joint ventures. For regulatory capital purposes, insur-ance subsidiaries are deconsolidated and reported as a deduction from capital. Insurance subsidiaries are subject to their own capital adequacy reporting, such as OSFI’s Minimum Continuing Capital Surplus Require-ments and Minimum Capital Test. Currently, for regulatory capital purposes, all the entities of the Bank are either consolidated or deducted from capital and there are no entities from which surplus capital is recognized.
Some of the Bank’s subsidiaries are individually regulated by either OSFI or other regulators. Many of these entities have minimum capital requirements which they must maintain and which may limit the Bank’s ability to extract capital or funds for other uses.
During the year ended October 31, 2015, the Bank complied with the OSFI guideline related to capital ratios and the leverage ratio. This guideline is based on “A global regulatory framework for more resilient banks and banking systems” (Basel III) issued by the BCBS. OSFI’s target CET1, Tier 1 and Total Capital ratios for Canadian banks are 7%, 8.5% and 10.5%, respectively. For the year ended October 31, 2015, the scalars are 64%, 71%, and 77% respectively.
The following table summarizes the Bank’s regulatory capital position as at October 31:
Regulatory Capital Position(millions of Canadian dollars, except as noted) As at
October 31 October 31 2015 20141
Common Equity Tier 1 Capital $ 37,958 $ 30,965 Common Equity Tier 1 Capital ratio2 9.9% 9.4%Tier 1 Capital $ 43,416 $ 35,999 Tier 1 Capital ratio2,3 11.3% 10.9%Total Capital4 $ 53,600 $ 44,255Total Capital ratio2,5 14.0% 13.4%Leverage ratio6 3.7 n/a Assets-to-capital multiple7 n/a 19.1
1 The amounts have not been adjusted to reflect the impact of the 2015 IFRS Standards and Amendments.
2 The final CAR guideline postponed the Credit Valuation Adjustment (CVA) capital charge until January 1, 2014, and is being phased in until the first quarter of 2019. Effective the third quarter of 2014, each capital ratio has its own RWA measure due to the OSFI prescribed scalar for inclusion of the CVA. For the third and fourth quarter of 2014, the scalars for inclusion of CVA for CET1, Tier 1, and Total Capital RWA are 57%, 65%, and 77% respectively. For the year ended October 31, 2015, the scalars are 64%, 71%, and 77% respectively.
3 Tier 1 Capital ratio is calculated as Tier 1 Capital divided by Tier 1 Capital RWA.4 Total Capital includes CET1, Tier 1, and Tier 2 Capital.5 Total Capital ratio is calculated as Total Capital divided by Total Capital RWA.6 The leverage ratio is calculated as Tier 1 Capital divided by leverage exposure,
as defined.7 The ACM is calculated as total assets plus off-balance sheet credit instruments,
such as certain letters of credit and guarantees, less investments in associated corporations, goodwill and net intangibles, divided by Total Capital.
OSFI has provided IFRS transitional provisions for the leverage ratio (as previously with the ACM), which allows for the exclusion of assets securitized and sold through CMHC-sponsored programs prior to March 31, 2010 from the calculation.
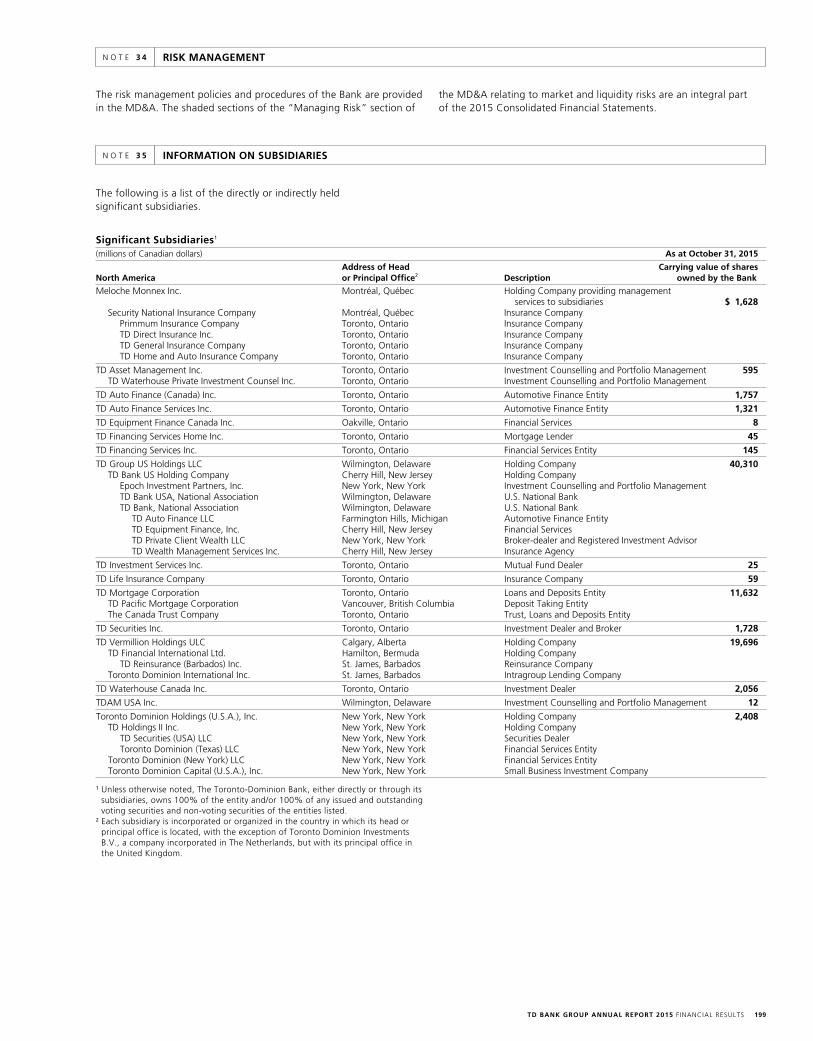
TD BANK GROUP ANNUAL REPORT 2015 F INANCIAL RESULTS 199
RISK MANAGEMENTN O T E 3 4
The risk management policies and procedures of the Bank are provided in the MD&A. The shaded sections of the “Managing Risk” section of
the MD&A relating to market and liquidity risks are an integral part of the 2015 Consolidated Financial Statements.
INFORMATION ON SUBSIDIARIESN O T E 3 5
The following is a list of the directly or indirectly held significant subsidiaries.
Significant Subsidiaries1
(millions of Canadian dollars) As at October 31, 2015
Address of Head Carrying value of sharesNorth America or Principal Office2 Description owned by the Bank
Meloche Monnex Inc. Montréal, Québec Holding Company providing management services to subsidiaries $ 1,628 Security National Insurance Company Montréal, Québec Insurance Company Primmum Insurance Company Toronto, Ontario Insurance Company TD Direct Insurance Inc. Toronto, Ontario Insurance Company TD General Insurance Company Toronto, Ontario Insurance Company TD Home and Auto Insurance Company Toronto, Ontario Insurance Company
TD Asset Management Inc. Toronto, Ontario Investment Counselling and Portfolio Management 595 TD Waterhouse Private Investment Counsel Inc. Toronto, Ontario Investment Counselling and Portfolio Management
TD Auto Finance (Canada) Inc. Toronto, Ontario Automotive Finance Entity 1,757
TD Auto Finance Services Inc. Toronto, Ontario Automotive Finance Entity 1,321
TD Equipment Finance Canada Inc. Oakville, Ontario Financial Services 8
TD Financing Services Home Inc. Toronto, Ontario Mortgage Lender 45
TD Financing Services Inc. Toronto, Ontario Financial Services Entity 145
TD Group US Holdings LLC Wilmington, Delaware Holding Company 40,310 TD Bank US Holding Company Cherry Hill, New Jersey Holding Company Epoch Investment Partners, Inc. New York, New York Investment Counselling and Portfolio Management TD Bank USA, National Association Wilmington, Delaware U.S. National Bank TD Bank, National Association Wilmington, Delaware U.S. National Bank TD Auto Finance LLC Farmington Hills, Michigan Automotive Finance Entity TD Equipment Finance, Inc. Cherry Hill, New Jersey Financial Services TD Private Client Wealth LLC New York, New York Broker-dealer and Registered Investment Advisor TD Wealth Management Services Inc. Cherry Hill, New Jersey Insurance Agency
TD Investment Services Inc. Toronto, Ontario Mutual Fund Dealer 25
TD Life Insurance Company Toronto, Ontario Insurance Company 59
TD Mortgage Corporation Toronto, Ontario Loans and Deposits Entity 11,632 TD Pacific Mortgage Corporation Vancouver, British Columbia Deposit Taking Entity The Canada Trust Company Toronto, Ontario Trust, Loans and Deposits Entity
TD Securities Inc. Toronto, Ontario Investment Dealer and Broker 1,728
TD Vermillion Holdings ULC Calgary, Alberta Holding Company 19,696 TD Financial International Ltd. Hamilton, Bermuda Holding Company TD Reinsurance (Barbados) Inc. St. James, Barbados Reinsurance Company Toronto Dominion International Inc. St. James, Barbados Intragroup Lending Company
TD Waterhouse Canada Inc. Toronto, Ontario Investment Dealer 2,056
TDAM USA Inc. Wilmington, Delaware Investment Counselling and Portfolio Management 12
Toronto Dominion Holdings (U.S.A.), Inc. New York, New York Holding Company 2,408 TD Holdings II Inc. New York, New York Holding Company TD Securities (USA) LLC New York, New York Securities Dealer Toronto Dominion (Texas) LLC New York, New York Financial Services Entity Toronto Dominion (New York) LLC New York, New York Financial Services Entity Toronto Dominion Capital (U.S.A.), Inc. New York, New York Small Business Investment Company
1 Unless otherwise noted, The Toronto-Dominion Bank, either directly or through its subsidiaries, owns 100% of the entity and/or 100% of any issued and outstanding voting securities and non-voting securities of the entities listed.
2 Each subsidiary is incorporated or organized in the country in which its head or principal office is located, with the exception of Toronto Dominion Investments B.V., a company incorporated in The Netherlands, but with its principal office in the United Kingdom.

TD BANK GROUP ANNUAL REPORT 2015 F INANCIAL RESULTS200
1 Unless otherwise noted, The Toronto-Dominion Bank, either directly or through its subsidiaries, owns 100% of the entity and/or 100% of any issued and outstanding voting securities and non-voting securities of the entities listed.
2 Each subsidiary is incorporated or organized in the country in which its head or principal office is located, with the exception of Toronto Dominion Investments B.V., a company incorporated in The Netherlands, but with its principal office in the United Kingdom.
3 As at October 31, 2015, the Bank’s reported indirect investment in TD Ameritrade Holding Corporation was 41.54% (October 31, 2014 – 40.97%) of the outstanding shares of TD Ameritrade Holding Corporation. TD Luxembourg International Holdings and its ownership of TD Ameritrade Holding Corporation is included given the significance of the Bank’s investment in TD Ameritrade Holding Corporation.
SUBSIDIARIES WITH RESTRICTIONS TO TRANSFER FUNDSCertain of the Bank’s subsidiaries have regulatory requirements to fulfill, in accordance with applicable law, in order to transfer funds, including paying dividends to, repaying loans to, or redeeming subor-dinated debentures issued to, the Bank. These customary requirements include, but are not limited to:• Local regulatory capital and/or surplus adequacy requirements;• Basel requirements under Pillar I and Pillar II;• Local regulatory approval requirements; and• Local corporate and/or securities laws.
As at October 31, 2015, the net assets of subsidiaries subject to regu-latory or capital adequacy requirements was $66.2 billion (October 31, 2014 – $48.5 billion), before intercompany eliminations.
In addition to regulatory requirements outlined above, the Bank may be subject to significant restrictions on its ability to use the assets or settle the liabilities of members of its group. Key contractual restric-tions may arise from the provision of collateral to third parties in the normal course of business, for example through secured financing transactions; assets securitized which are not subsequently available for transfer by the Bank; and assets transferred into other consolidated and unconsolidated structured entities. The impact of these restrictions has been disclosed in Note 9 and Note 28.
Aside from non-controlling interests disclosed in Note 21, there were no significant restrictions on the ability of the Bank to access or use the assets or settle the liabilities of subsidiaries within the group as a result of protective rights of non-controlling interests.
SUBSEQUENT EVENTN O T E 3 6
Normal Course Issuer BidAs approved by the Board on December 2, 2015, the Bank announced its intention to initiate a normal course issuer bid for up to 9.5 million of its common shares, commencing as early as December, 2015, subject
to the approval of OSFI and the Toronto Stock Exchange (TSX). The timing and amount of any purchases under the program are subject to regulatory approvals and to management discretion based on factors such as market conditions and capital adequacy.
Significant Subsidiaries (continued)1
(millions of Canadian dollars) As at October 31, 2015
Address of Head Carrying value of sharesInternational or Principal Office2 Description owned by the Bank
TD Bank International S.A. Luxembourg, Luxembourg International Direct Brokerage $ 49
TD Bank N.V. Amsterdam, The Netherlands Dutch Bank 678
TD Ireland Dublin, Ireland Holding Company 1,051 TD Global Finance Dublin, Ireland Securities Dealer
TD Luxembourg International Holdings Luxembourg, Luxembourg Holding Company 6,683 TD Ameritrade Holding Corporation3 Omaha, Nebraska Securities Dealer
TD Wealth Holdings (UK) Limited Leeds, England Holding Company 219 TD Direct Investing (Europe) Limited Leeds, England Direct Broker
Thirdco II Limited Leeds, England Investment Holding Company 133 TD Asset Administration UK Limited Leeds, England Foreign Securities Dealer
Toronto Dominion Australia Limited Sydney, Australia Securities Dealer 215
Toronto Dominion Investments B.V. London, England Holding Company 1,242 TD Bank Europe Limited London, England UK Bank Toronto Dominion Holdings (U.K.) Limited London, England Holding Company TD Securities Limited London, England Securities Dealer
Toronto Dominion (South East Asia) Limited Singapore, Singapore Merchant Bank 1,170