financial results - kubota.com · kubota corp. 61.6 6.1 54.8 5.9 6.7 12.3 dividend (declared) 15yen...
TRANSCRIPT
1( Financial results for the year ended Mar. 31, 2012 )
Financial Resultsfor the year ended March 31, 2012
Shigeru KimuraShigeru KimuraManaging Executive Officer,
General Manager of Planning & Control Headquarters
KUBOTA Corporation
May 16, 2012
2( Financial results for the year ended Mar. 31, 2012 )
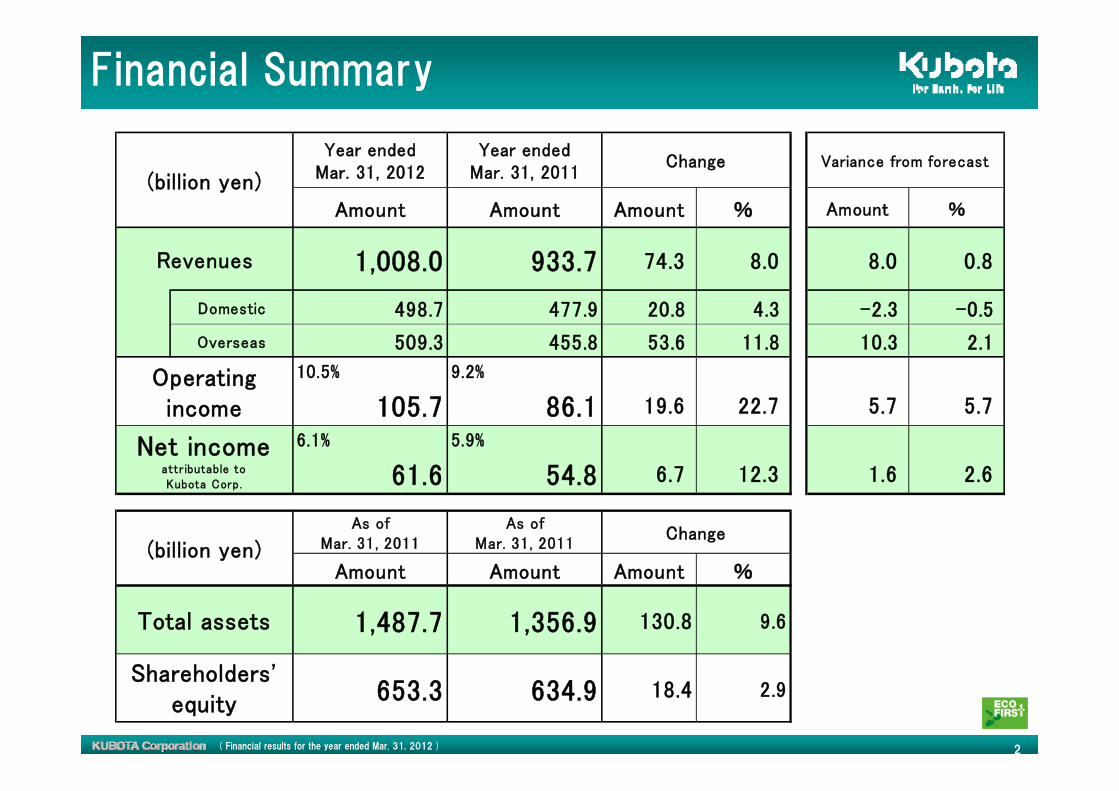
Financial Summary
Year endedMar. 31, 2012
Year endedMar. 31, 2011
Amount Amount Amount % Amount %
1,008.0 933.7 74.3 8.0 8.0 0.8
Domestic 498.7 477.9 20.8 4.3 -2.3 -0.5
Overseas 509.3 455.8 53.6 11.8 10.3 2.1
10.5% 9.2%
105.7 86.1 19.6 22.7 5.7 5.7
6.1% 5.9%
61.6 54.8 6.7 12.3 1.6 2.6
As ofMar. 31, 2011
As ofMar. 31, 2011
Amount Amount Amount %
1,487.7 1,356.9 130.8 9.6
653.3 634.9 18.4 2.9
Variance from forecast
(billion yen)
Operatingincome
Revenues
Net incomeattributable toKubota Corp.
Change
Total assets
Shareholders'equity
(billion yen)Change

3( Financial results for the year ended Mar. 31, 2012 )
Revenues by reporting segment
Amount %
713.9 651.5 62.4 9.6Domestic 235.4 226.4 9.1 4.0
Overseas 478.5 425.1 53.4 12.6
198.5 192.8 5.7 3.0Domestic 184.6 178.7 5.9 3.3
Overseas 13.9 14.1 -0.2 -1.4
64.8 60.4 4.3 7.2Domestic 48.1 44.3 3.8 8.6
Overseas 16.7 16.2 0.5 3.4
30.8 29.0 1.8 6.3Domestic 30.6 28.6 2.0 7.0
Overseas 0.2 0.4 -0.2 -42.9
1,008.0 933.7 74.3 8.0
498.7 477.9 20.8 4.3
509.3 455.8 53.6 11.8
(billion yen)Year ended
Mar. 31, 2012Year ended
Mar. 31, 2011
Change
Total revenues
Domestic revenues
Overseas revenues
Farm & Industrial Machinery (Machinery)
Water & Environment Systems (Water)
Social Infrastructure (Infrastructure)
Other

4( Financial results for the year ended Mar. 31, 2012 )
Revenues by reporting segment
Machinery: +62.4 billion yen (Domestic: +9.1, Overseas: +53.4)
Water: +5.7 billion yen (Domestic: +5.9, Overseas: -0.2)
Infrastructure: +4.3 billion yen (Domestic: +3.8, Overseas: +0.5)
Other: +1.8 billion yen (Domestic: +2.0, Overseas: -0.2)
◇Domestic: Sales of pipe-related products increased slightly.Sales of environment-related products increased.
◇Domestic: Sales of construction machinery increased substantially.Sales of engines also increased. Sales of agricultural machinery increased slightly.
◇Domestic: Sales of industrial castings and vending machines decreased. Sales of spiral welded steel pipes and air-conditioning equipments increased.
◇Overseas: Sales of ductile iron pipes decreased substantially. Sales of environment-related products increased.
◇Domestic: Sales of construction decreased. Sales of services increased.
◇Overseas: Sales of construction machinery, engines and harvesters increased substantially. Sales of tractors and rice transplanters also increased. By region, North America and Europe: double-digit growth, Asia: growth
◇Overseas: Sales of industrial castings increased.

5( Financial results for the year ended Mar. 31, 2012 )
Operating income
Factors affecting operating incomeFactors affecting operating income
Amount % Amount % Amount %
Operating Income 105.7 10.5 86.1 9.2 19.6 22.7
(billion yen)
Year endedMar. 31, 2012
Year endedMar. 31, 2011
Change
22..Material costsMaterial costs
1.1.Appreciation of the yenAppreciation of the yen
55..Revenue increase, costRevenue increase, cost reductionreduction and other factorsand other factors
-17.0 billion yen-11.5 billion yenEuro (116→111)Other currencies
-2.0 billion yen-3.5 billion yen
-0.5 billion yen
+6.0 billion yen
+30.0 billion yen
MachineryWater
+1.0 billion yen-1.5 billion yen
3.3.Losses from the Losses from the eearthquakearthquake & floods& floods((nonnon--recurringrecurring itemitemss))
+1.1 billion yen
U.S. dollar (88→80)
44..Gain on sales of unused land and loss on revaluation of landGain on sales of unused land and loss on revaluation of land((nonnon--recurringrecurring item)item)
Earthquake: +1.8 billion yen[ 0.7 - (-2.5) ]
Floods: -0.7 billion yen[Loss -3.8 + Insurance 3.1]
This year Prior year
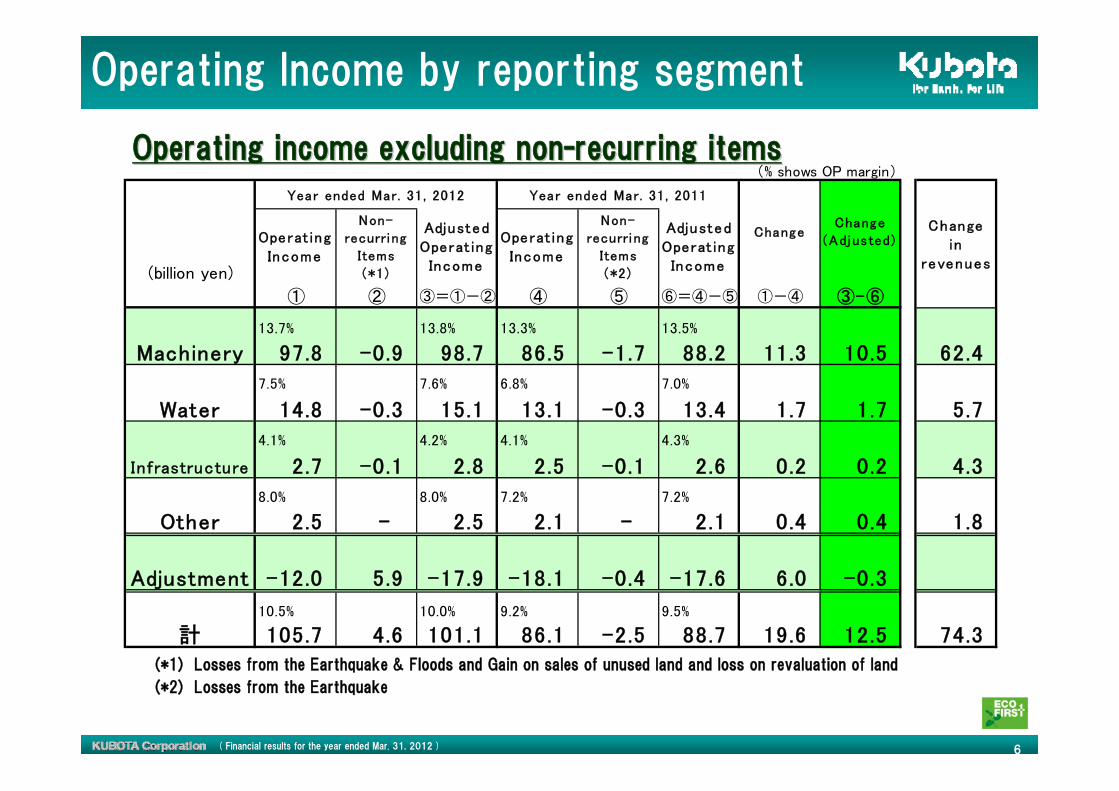
6( Financial results for the year ended Mar. 31, 2012 )
Operating Income by reporting segment
(*2) Losses from the Earthquake
(% shows OP margin)
Operat ingIncome
Non-
recurring
Items
(*1)
AdjustedOperat ing
Income
Operat ingIncome
Non-
recurri ng
Items
(*2)
AdjustedOperat ing
Income
① ② ③=①-② ④ ⑤ ⑥=④-⑤ ①-④ ③-⑥
13.7% 13.8% 13.3% 13.5%
97.8 -0.9 98.7 86.5 -1.7 88.2 11.3 10.5 62.4
7.5% 7.6% 6.8% 7.0%
14.8 -0.3 15.1 13.1 -0.3 13.4 1.7 1.7 5.7
4.1% 4.2% 4.1% 4.3%
2.7 -0.1 2.8 2.5 -0.1 2.6 0.2 0.2 4.3
8.0% 8.0% 7.2% 7.2%
2.5 - 2.5 2.1 - 2.1 0.4 0.4 1.8
-12.0 5.9 -17.9 -18.1 -0.4 -17.6 6.0 -0.3
10.5% 10.0% 9.2% 9.5%
105.7 4.6 101.1 86.1 -2.5 88.7 19.6 12.5 74.3
Change
Year ended Mar. 31, 2012 Year ended Mar. 31, 2011
Other
Machinery
Infrastructure
Water
Changein
revenues
Change
(Adjusted)
Adjustment
計
(billion yen)
Operating income excluding nonOperating income excluding non--recurring itemsrecurring items
(*1) Losses from the Earthquake & Floods and Gain on sales of unused land and loss on revaluation of land

7( Financial results for the year ended Mar. 31, 2012 )
Other income(expenses)
1.9 1.8 0.1
0.1 4.8 -4.7
-2.6 -1.8 -0.8
- 2.8 -2.8
-7.6 -1.6 -6.0
Valuation loss on derivative 4.4 -0.3 4.7
Other-net -0.9 -0.5 -0.4
3.5 -0.8 4.3 Other
Interests and dividends
Gain on sales of securities
Valuation loss on other investments
Foreing exchange gain (loss)-net
Gain on nonmonetary exchange ofsecurities
Year endedMar. 31, 2012
Year endedMar. 31, 2011
Change
Amount Amount Amount
Other income (expenses) -4.7 5.2 -9.9
(billion yen)
(Details)
8( Financial results for the year ended Mar. 31, 2012 )
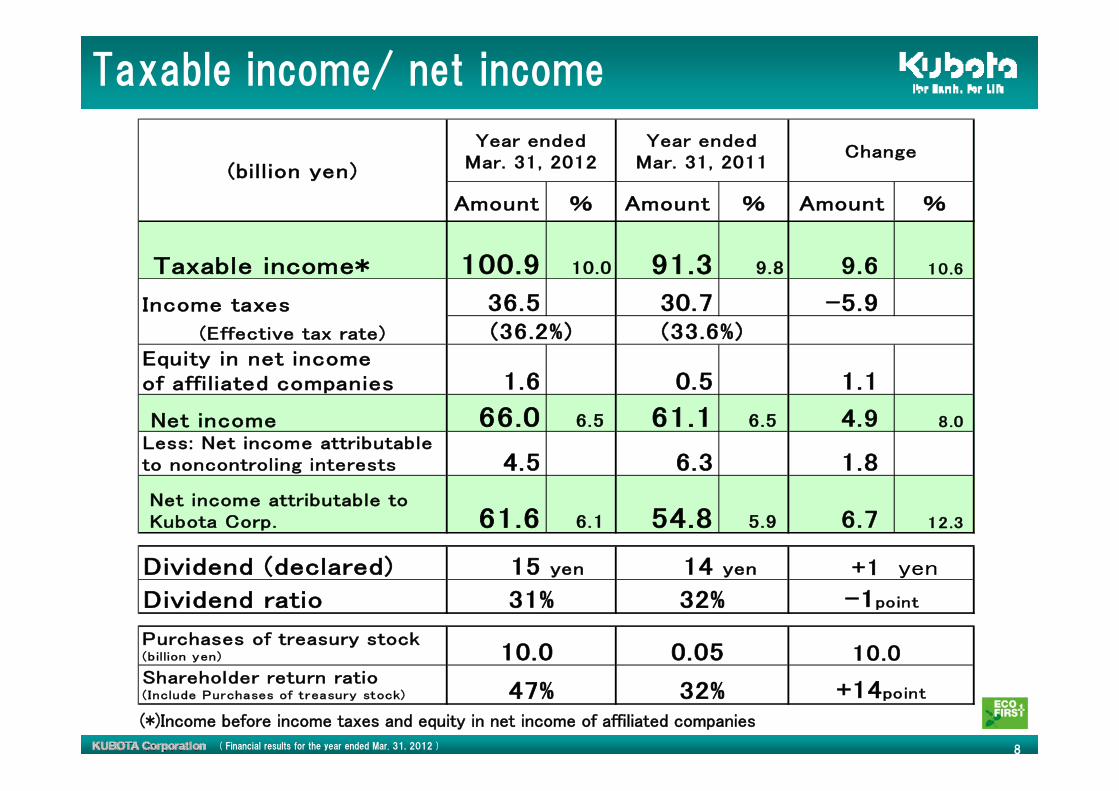
Taxable income/ net income
Amount % Amount % Amount %
Taxable income* 100.9 10.0 91.3 9.8 9.6 10.6
Income taxes 36.5 30.7 -5.9(Effective tax rate)
Equity in net incomeof affiliated companies 1.6 0.5 1.1
Net income 66.0 6.5 61.1 6.5 4.9 8.0
Less: Net income attributableto noncontroling interests 4.5 6.3 1.8
Net income attributable to Kubota Corp. 61.6 6.1 54.8 5.9 6.7 12.3
Dividend (declared) 15 yen 14 yen +1 yen
Dividend ratio
Purchases of treasury stock(billion yen)
Shareholder return ratio(Include Purchases of treasury stock)
10.0
47% 32% +14point
10.0 0.05
(billion yen)
Year endedMar. 31, 2012
Year endedMar. 31, 2011
Change
31% 32% -1point
(36.2%) (33.6%)
(*)Income before income taxes and equity in net income of affiliated companies

9( Financial results for the year ended Mar. 31, 2012 )
As ofMar. 31,
2012
As ofMar. 31,
2011Change Kverneland
Current assets 866.0 777.2 88.8 28.1
Cash and Cash equivalents 100.6 105.3 -4.7
Notes and account receivables 390.8 353.6 37.2
Short-term finance receivables-net 108.2 100.4 7.7
Inventories 202.1 174.2 27.9
Other current assets 64.5 43.6 20.8
323.9 316.9 7.1 0.6
Long-term finance receivables-net 204.3 199.8 4.4
Other 119.7 117.1 2.6
Property, plant, and equipment 225.1 217.4 7.7 8.2
Other assets 72.6 45.4 27.2 18.5
1,487.7 1,356.9 130.8 55.4
312.4 300.3 12.2<Reference>Forex rate at balance sheet date (yen)
U.S. Dollar 78 81 -3Euro 101 108 -7
Total finance receivables-net
(billion yen)
Total assets
Investments and long-term finance rece ivables
Balance sheets(Assets)

10( Financial results for the year ended Mar. 31, 2012 )
(billion yen)As of
Mar.31,2012
As ofMar.31,
2011Change Kverneland
Current liabilities 536.0 435.1 100.9 22.9
Short-term borrowings 69.6 76.6 -7.0
Notes and accounts payable 216.0 164.8 51.2
Current portion of long-term debt 107.2 85.6 21.7
Other 143.2 108.1 35.0Long-term liabilities 244.5 240.4 4.1 9.4 Long-term debt 184.4 191.8 -7.4
Accrued retirement and pension costs 41.9 35.3 6.6
Other long-term liabilities 18.2 13.3 4.9Total liabilities 780.5 675.5 105.0 32.3
Total interest-bearing debt 361.2 354.0 7.3 8.9
Balance sheets(Liabilities)

11( Financial results for the year ended Mar. 31, 2012 )
Balance sheets(Equity)
As ofMar.31,2011
As ofMar.31,2011
Change Kverneland
Kubota Corp. shareholders' equity 653.3 634.9 18.4 0.0
Common stock 84.1 84.1 -
Capital surplus 88.8 89.1 -0.3
Legal reserve 19.5 19.5 -
Retained earnings 560.7 516.9 43.9
Accumulated other comprehensive loss -80.5 -65.4 -15.2
-76.5 -65.7 -10.8
19.1 15.9 3.2
-22.9 -14.8 -8.1
-0.3 -0.8 0.5
Treasury stock -19.3 -9.3 -10.0
Noncontrolling interests 53.9 46.5 7.5 5.0707.2 681.4 25.9 5.0
Number of shares (million shares) 15.8 0.1 15.7 Amount (billion yen) 10.0 0.1 10.0
(billion yen)
Foreign currency translation adjustments
Unrealized losses on securities
Pention liabilitiy adjustments
Purchases oftreasury stock
Total equity
Unrealized losses on derivetives

12( Financial results for the year ended Mar. 31, 2012 )
Cash flow statements
Year endedMar . 31 , 2012
Year endedMar . 31 , 2011 Change
Net cash provided by operating activities 79.9 81.9 -2.0
Net cash used in investing activities -69.9 -43.6 -26.3
Purchases of fixed assets -27.0 -27.4 0.4
Other -43.0 -16.2 -26.7
Net cash used in financing activities -13.3 -41.7 28.5
-1.4 -2.7 1.3
Net increase (decrease) in cash and cash equ ivalents -4.7 -6.1 1.4
Free cash flow 52.9 54.5 -1.6
(billion yen)
effect of exchange rate changes on cash and cash equiva lents

13( Financial results for the year ended Mar. 31, 2012 )
Market Environment
14( Financial results for the year ended Mar. 31, 2012 )
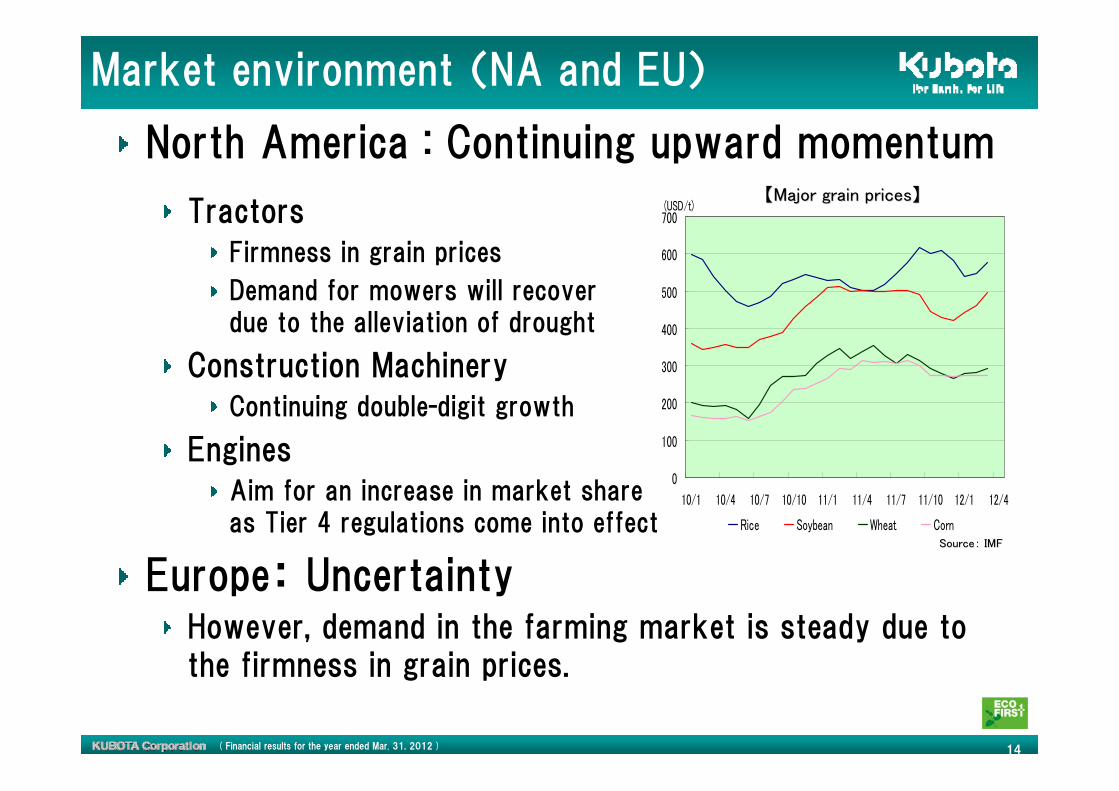
Market environment (NA and EU)
North America : Continuing upward momentum
TractorsFirmness in grain prices
Demand for mowers will recover due to the alleviation of drought
Construction MachineryContinuing double-digit growth
EnginesAim for an increase in market share as Tier 4 regulations come into effect
Europe: UncertaintyHowever, demand in the farming market is steady due to the firmness in grain prices.
0
100
200
300
400
500
600
700
10/1 10/4 10/7 10/10 11/1 11/4 11/7 11/10 12/1 12/4
(USD/t)
Rice Soybean Wheat Corn
【【Major grain pricesMajor grain prices】】
SourceSource:: IMFIMF

15( Financial results for the year ended Mar. 31, 2012 )
Market environment (Asia outside Japan)
Thailand:Active demand, Expect rapid recovery
Increase in farm income due to firm crop pricesContinuing rice mortgage scheme (virtually acts as governmental procurement)
High rice export price
Government support for farmers adversely affected by flood damage
Subsidy, low interest financing, tax preferences and other
China:Growth in farm equipment marketIncreased subsidies for farm machinery(17.5 billion RMB→20.0 billion RMB)
- Budget allocation focused on machinery related to agricultural work. Mechanization ratio is still low.
There is hope that the construction machinery market will recover from the second half of the year.
400
450
500
550
600
650
'10/1 '11/1 '12/1 '12/4/11
(USD/t) 【Thai rice export price】
Source: USDA,, Thai Rice Exporters Association

16( Financial results for the year ended Mar. 31, 2012 )
Market environment (Japan)
JapanFarm machinery and public works related products: Flat Construction Machinery: Growth
Farm machineryGradual decline in the number of farmers
Underlying support for farm income through increased rice prices and individual (household) income support system for agriculture
Construction machineryContinuing demand for earthquake disaster reconstruction
Public works related productsAreas of distress: Demand for
reconstruction
Other: Flat or decreaseConstruction of earthquake-resistant pipes
in area of distress
10,000
11,000
12,000
13,000
14,000
Jan. Feb. Mar Apr May Jun Jul Aug Sep Oct Nov Dec Jan Feb
(Yen)
2011 2012
【【Producer price of Japanese rice YenProducer price of Japanese rice Yen/60/60KgKg】】
Source: MAFF

17( Financial results for the year ended Mar. 31, 2012 )
Forecast
18( Financial results for the year ended Mar. 31, 2012 )
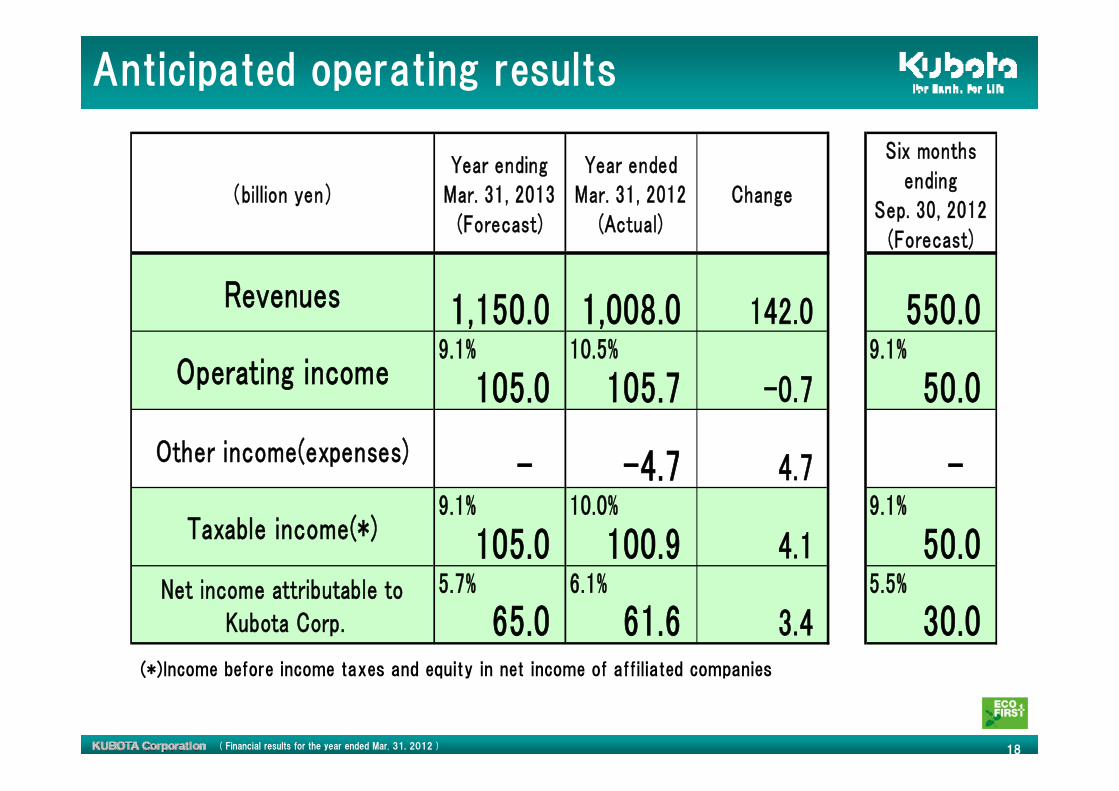
Anticipated operating results
(billion yen)Year ending
Mar. 31, 2013(Forecast)
Year endedMar. 31, 2012
(Actual)Change
Six monthsending
Sep. 30, 2012(Forecast)
Revenues 1,150.0 1,008.0 142.0 550.0 9.1% 10.5% 9.1%
105.0 105.7 -0.7 50.0
Other income(expenses) - -4.7 4.7 - 9.1% 10.0% 9.1%
105.0 100.9 4.1 50.0 5.7% 6.1% 5.5%
65.0 61.6 3.4 30.0 Net income attributable to
Kubota Corp.
Operating income
Taxable income(*)
(*)Income before income taxes and equity in net income of affiliated companies
19( Financial results for the year ended Mar. 31, 2012 )
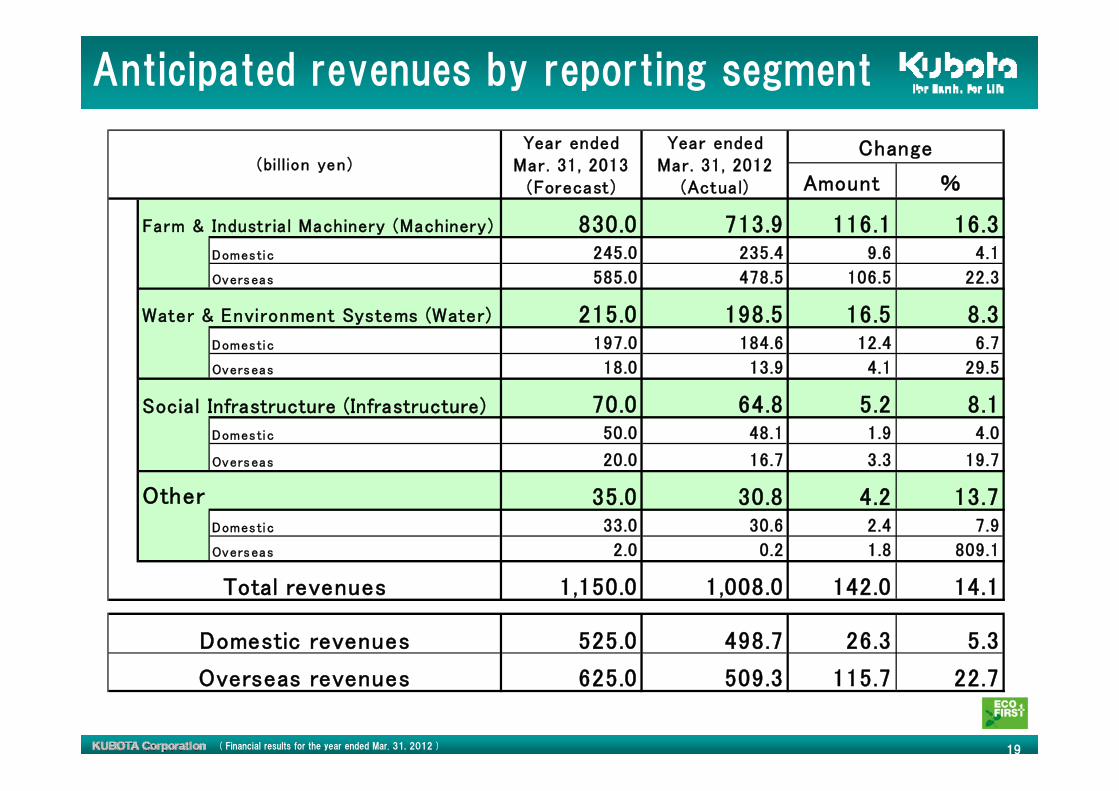
Anticipated revenues by reporting segment
Amount %
830.0 713.9 116.1 16.3Domestic 245.0 235.4 9.6 4.1
Overseas 585.0 478.5 106.5 22.3
215.0 198.5 16.5 8.3Domestic 197.0 184.6 12.4 6.7
Overseas 18.0 13.9 4.1 29.5
70.0 64.8 5.2 8.1Domestic 50.0 48.1 1.9 4.0
Overseas 20.0 16.7 3.3 19.7
35.0 30.8 4.2 13.7Domestic 33.0 30.6 2.4 7.9
Overseas 2.0 0.2 1.8 809.1
1,150.0 1,008.0 142.0 14.1
525.0 498.7 26.3 5.3
625.0 509.3 115.7 22.7
(billion yen)Year ended
Mar. 31, 2013(Forecast)
Year endedMar. 31, 2012
(Actual)
Change
Total revenues
Domestic revenues
Overseas revenues
Farm & Industrial Machinery (Machinery)
Water & Environment Systems (Water)
Social Infrastructure (Infrastructure)
Other

20( Financial results for the year ended Mar. 31, 2012 )
Summary of operating income forecast
Factors affecting operating income (YoY change -0.7 billion yen)
22..Material costsMaterial costs
11..Appreciation of Appreciation of the the yenyen
55..Losses from the Losses from the eearthquakearthquake & floods (Prior year) (*)& floods (Prior year) (*)
44..Pension cost (*)Pension cost (*)
-3.5 billion yen-1.5 billion yenEuro (111→105)Other currencies -2.0 billion yen
+1.5 billion yen
-4.3 billion yen
+1.4 billion yen
Machinery
33..Amortization of valuation difference between the amount paid Amortization of valuation difference between the amount paid and fair market value of Net Assets ofand fair market value of Net Assets of KvernelandKverneland ASA (*)ASA (*)
-3.8 billion yen
(*) Non-recurring item
77..Revenue increaseRevenue increase, cost reduction, cost reduction and otherand other factorsfactors
-6.0 billion yen
+14.0 billion yen
Amount % Amount % Amount %
Operating Income 105.0 9.1 105.7 10.5 -0.7 -0.6
(billion yen)
Year endedMar. 31, 2012
Year endedMar. 31, 2011
Change
66..Gain on sales of unused land and loss on revaluation of land (PrGain on sales of unused land and loss on revaluation of land (Prior year) (*)ior year) (*)

21( Financial results for the year ended Mar. 31, 2012 )
Non-recurring items
Amortization of valuation difference between the amount paid and fair market value of net assets of Kverneland ASA
Substantial amount of valuation difference was recorded in reevaluation of net assets of Kvernakand ASA at fair market value under M&A
Increase in pension cost (one-time amortization of actuarial loss)
Increase in benefit obligations and actuarial loss due to the reduction in the discount ratio(2.5%→2.0%)
(billion yen)
Book value Difference Fair maket value
154 million shares 22.9 8.3 10.4 18.9 4.0
GoodwillEquity at the time of acquisition
Number of sharesPayment forthe Stock
2.0%discount ratio
2.5%discount ratio
Benefit obligations 150.6 142.5 Actuarial loss 34.1 26.0
Amortization of actuarial loss(for the year ending Mar. 2013)
5.0 0.7
For the year ended Mar. 2012(billion yen)
3.8 billion yen will be amortized for the year ending Mar. 20133.8 billion yen will be amortized for the year ending Mar. 2013
One time amortization of the amount One time amortization of the amount exceeding 20% of pension obligations exceeding 20% of pension obligations ((3434.1.1--150.6150.6××2020%%==4.0 billion yen) 4.0 billion yen)
for next year.for next year.
0.7 billion yen for the year ended Mar. 20120.7 billion yen for the year ended Mar. 2012
Increased amount of amortization is Increased amount of amortization is
4.3 billion yen4.3 billion yen

22( Financial results for the year ended Mar. 31, 2012 )
Anticipated operating income by reporting segment
Operat ingIncome
Non-
recurri ng
Items
(*1)
AdjustedOperat ing
Income
Operat ingIncome
Non-
recu rr in g
I tems (2 )
AdjustedOperat ing
Income
① ② ③=①-② ④ ⑤ ⑥=④-⑤ ①-④ ③-⑥
12.4% 13.2% 13.7% 13.8%
103.0 -6.2 109.2 97.8 -0.9 98.7 5.2 10.5 116.1
7.9% 8.4% 7.5% 7.6%
17.0 -1.1 18.1 14.8 -0.3 15.1 2.2 3.0 16.5
5.7% 6.3% 4.1% 4.2%
4.0 -0.4 4.4 2.7 -0.1 2.8 1.3 1.6 5.2
7.1% 7.1% 8.0% 8.0%
2.5 - 2.5 2.5 - 2.5 0.1 0.0 4.2
-21.5 -0.4 -21.1 -12.0 5.9 -17.9 -9.5 -3.2
9.1% 9.8% 10.5% 10.0%
105.0 -8.1 113.1 105.7 4.6 101.1 -0.7 12.0 142.0
Change
Year end ing Mar. 31 , 2013 (F orecas t ) Year e nded Mar . 31 , 2 012 (Ac tual)
Other
Machinery
Infrastructure
Water
Changein
revenues
Change
(Adjus ted)
Adjustment
計
(billion yen)
Anticipated operating income excluding Anticipated operating income excluding nonnon--recurringrecurring itemsitems
(*1) Amortization of variance of the estimate of Kverneland ASA and Pension cost
(*2) Losses from the Earthquake & Floods and Gain on sales of idle assets

23( Financial results for the year ended Mar. 31, 2012 )
Year endingMar . 31 , 2013
(Forecast )
Year endedMar. 31, 2012
Year endedMar. 31, 2011
53.0 31.1 24.0
35.0 23.9 26.5
30.0 27.9 25.0R&D expenses
Depreciations and amortization
(billion yen)
Capital expenditures
<Reference>CAPEX, Depreciations, R&D expenses
【CAPEX, Depreciations R&D expenses】
【Anticipated foreign exchange rate】
Year endingMar . 31 , 2013
(Forecast )
Year endedMar. 31, 2012
Year endedMar. 31, 2011
\/US$ 1st Half (Jan.-Jun.) 80 82 91
2nd Half (Jul.-Dec.) 80 78 84
Full year average 80 80 88
\/Euro 1st Half (Jan.-Jun.) 105 115 121
2nd Half (Jul.-Dec.) 105 107 111
Full year average 105 111 116

24( Financial results for the year ended Mar. 31, 2012 )
Safe Harbor
Cautionary Statements with Respect to Forward-Looking Statements
This document may contain forward-looking statements that are based on management’s expectations, estimates, projections and assumptions. These
statements are not guarantees of future performance and involve certain risks and uncertainties, which are difficult to predict. Therefore, actual future results may differ materially from what is forecast in forward-looking statements due to a variety of factors, including, without limitation: general economic conditions in the Company's markets, particularly government agricultural policies, levels of capital expenditures both in public and private sectors, foreign currency exchange rates, the occurrence of natural disasters, continued competitive pricing pressures in the marketplace, as well as the Company's ability to continue to gain acceptance of its products.

25( Financial results for the year ended Mar. 31, 2012 )
おわりに(「社会の底力」スライド)