financial results for 1st half, fy3/2011 & management ... · pdf filezimproving...
TRANSCRIPT

November 22nd, 2010
Financial Results for 1st Half, FY3/2011& Management Policies and Strategies
Provisional translation of the original Japanese version

1
Agenda1. Management Policy in FY3/2011 22. Business Performance of 1H, FY3/2011
and Progress of Strategic Initiatives2-1. Business Performance of 1H, FY3/2011
and Progress of Strategic Initiatives 42-2. Summary of 1H, FY3/2011 52-3. Enhancement of Targeted Growth Business Areas2-3-1. Overseas Business Especially in Asia
(1) Strategy 6(2) Settlement and Investment Banking Business 7(3) Expansion of Channels / Strategic Alliances 8
2-3-2. Nikko Cordial Securities(1) 1H, FY3/2011 Results 9(2) Progress of the Medium-Term Management Plan 10
2-3-3. Solution Providing for Corporations / Investment Banking, Trust Business 11
2-3-4. Financial Consulting for Individuals 123. Earnings Forecasts for FY3/2011 and
Results of Each Line Item3-1. Earnings Forecasts for FY3/2011 143-2. Gross Banking Profit 15
3-3. Loan Balance 163-4. Loan to Deposit Spread 173-5. Loan Spread / Loan to Deposit Spread
in Comparison with Peers (Domestic Loans) 183-6. Performance by by Business Unit 193-7. Gains (Losses) on Bonds / Bond Portfolio 203-8. Expenses 213-9. Total Credit Cost 22(Ref.) Exposures to PIIGS, Middle East and Russia 234. Group Companies / Group Strategy4-1. Contribution of Subsidiaries / Affiliates to
Consolidated Profit 254-2. Consumer Finance Business 264-3. Credit Card Business 275. Capital / Liquidity5-1. Capital 29(Ref.) Summary of New Framework for Capital
Requirements 305-2. Control on Downside Risks 315-3. Equity Holdings 325-4. Liquidity 33In Closing 34(Ref.) SMFG’s Group Structure 35

2
1. Management Policy in FY3/2011
Improving risk-return profile by rebalancing our asset portfolio towards assets with high growth potential from assets with low yields while meeting customers’ financing needs / Controlling credit costs and expensesSteadily accumulating earnings based on our management planMinimizing risks to our capital posed by volatility in our equity holdingsPromoting initiatives toward NYSE listing
Fortify bottom-line profit through reexamining profitability of existing business lines
Pursue profitability by focusing on targeted growth business areas
Further increase productivity by improving business processes
Further enhance customer responsivenessby leveraging advisory functions
Securing a resilient capital baseReinforcing business portfolioto achieve sustainable growth
Management policyin FY3/11
“Forward looking”- Transforming our business model to grow steadily under a new regulatory
and competitive environmentEmphasizing return on risks and costs, in order to improve asset quality and thoroughly control expenses and credit costs
[SMFG’s targeted growth business areas]
Solution providing for corporations / Investment banking, trust business
Financial consulting for individuals
Payment & settlement services, consumer finance
Retail / Wholesale securities business
Overseas business especially in Asia

2. Business Performance of 1H, FY3/2011 and Progress of Strategic Initiatives

4
Data book P.1, 2, 15Reference: Financial Results P.2 Supplementary Info. P.1, 2, 7
Securing a resilient capital base
Both SMFG’s consolidated Net income and SMBC’s non-consolidated Net income in 1H, FY3/2011 were the highest half-year Net income since the merger in April 2001. We have made steady progress in fortifying overseas business and Nikko, while achieved listing on NYSE.
Favorable performance
Reinforcing business portfolioto achieve sustainable growth
Overseas business especially in Asia
Wholesale / Retail Securities Business (Nikko Cordial Securities)
Listed on NYSE (Nov. 2010)
Enhanced framework to support customers in a globally integrated mannerOpened 3 channels and received approval to open 3 channelsIntegrated investment banking functions in Asia
Enhanced SMBC’s overseas channelcentered on China and organization
Agreed capital/business alliancewith Kotak Mahindra Bank (India)
Started securities business in the U.K.through SMBC’s subsidiary (Oct. 2010)
Named as a primary dealerof JGB (Apr. 2010)
Enhanced collaboration with SMBC
Private banking:Commenced joint business with SMBC and Barclays (Jun. 2010)Started bank agency services (Oct. 2010)
Strengthened equity-related business
Commenced operations of new equity trading system (Aug. 2010)Established Equity Research Division (Aug. 2010)
Banking profit* SMBC non-consolidated
Substantiallyincreased
Substantiallyincreased JPY 493.3 bnYOY change
+JPY 115.7 bn
Overhead ratio SMBC non-consolidated
DecreasedDecreased 41.2%YOY change(6.3)%
Total credit cost SMBC non-consolidated
Substantiallydecreased
Substantiallydecreased JPY (43.3) bnYOY change
+JPY 113.6 bn
Tier I ratio (preliminary) SMFG consolidated
IncreasedIncreased 12.32%Compared with
Mar. 2010+1.17%
Net income SMFG consolidated
JPY 417.5 bnYOY change+JPY 294.0 bn
Agreed business alliancewith Banco de Bogota (Colombia)
Made Cedyna a consolidated subsidiary (May 2010)
Highesthalf-year Net income
Highesthalf-year Net income
* Before provision for general reserve for possible loan losses
2-1. Business Performance of 1H, FY3/2011 and Progress of Strategic Initiatives

5
2-2. Summary of 1H, FY3/2011
(JPY bn)
1H, FY3/11
YOY change
Change from
May 10forecast
Gross banking profit 838.6 + 119.3
(3.6)
(6.3)%
+ 115.7
+ 113.6
Ordinary profit 393.0 + 245.9 + 173.0
+ 238.6
Ordinary profit 540.6 + 318.4 + 210.6
+ 294.0
+ 118.6
Expenses (345.3) + 4.7
<OHR> 41.2% (7.4)%
Banking profit*1 493.3 + 123.3
Total credit cost*2 (43.3) + 66.7
Net income 351.2 + 201.2
Net income 417.5 + 257.5
SMFG’s consolidated Net income substantially increased to JPY 417.5 billion, an increase of JPY 294.0 billion year over year and JPY 257.5 billion compared with May 2010 forecast. This increase was due mainly to Gains on bonds resulting from our ALM operations, control of Total credit cost and contributions of consolidated subsidiaries such as Nikko
Data book P.1, 2Reference: Financial Results P.2 Supplementary Info. P.1, 2
SMFG’s consolidated Net income: May 10 forecast: 160.0 1H, FY3/11: 417.5
Expenses Total credit cost*2 Others
SMBC Difference*3
Increasedprofit of group
companies, etc.Gross
banking profit
+ 118.6
+ 11.2
+ 56.3+ 66.7
+ 4.7
(JPY bn)
Mai
n fa
ctor
s of
YO
Y ch
ange
Expenses Total credit cost*2
[YOY change +294.0]
SMBC Difference*3
Increasedprofit of group
companies, etc.
Gross banking profit Others
(JPY bn)
+ 119.3
+ 9.3
+ 55.4
(3.6)
+ 113.6
SMB
C<n
on-c
onso
lidat
ed>
SMFG
<con
solid
ated
>
Mai
n fa
ctor
s of
cha
nge
from
May
10
fore
cast
*1 Before provision for general reserve for possible loan losses *2 Including portion recorded in Extraordinary gains (losses)*3 Difference between SMFG’s consolidated Net income and SMBC’s non-consolidated Net income
[Change from May 10 forecast +257.5]
SMFG’s consolidated Net income: 1H, FY3/10: 123.5 1H, FY3/11: 417.5

6
2-3. Enhancement of Targeted Growth Business Areas2-3-1. Overseas Business Especially in Asia (1) Strategy
In the medium term, we aim to increase the proportion of Banking profit generated by International Banking Unit within Marketing units to 30%. To this end, we are increasing our loan balance especially in Asia and Americas, capturing financial needs from both Japanese and non-Japanese companies
Data book P.1, 3Reference: Supplementary Info. P.15
Trend of Banking profitin International Banking Unit*1
Trend of Banking profitin International Banking Unit*1
0.5%
0.7%
0.9%
1.1%
Sep. 07 Mar. 08 Sep. 08 Mar. 09 Sep. 09 Mar. 10 Sep. 10
Spread of overseas loans(average on contracted loans outstanding)*2
Spread of overseas loans(average on contracted loans outstanding)*2
(USD bn)
Trend of overseas loans (balance)*2, 3Trend of overseas loans (balance)*2, 3
30 30 31 36
34 29 2527
37 37 3433
Mar. 09 Sep. 09 Mar. 10 Sep. 10
Asia Americas Europe(USD bn)
101 96
*1 Sum of SMBC and its overseas subsidiaries (exchanged to USD at respective term-end JPY/USD rate). Managerial accounting basis*2 Sum of SMBC, SMBC Europe and SMBC (China). Managerial accounting basis*3 JPY based loan balance at each channel is exchanged to USD at respective term-end JPY/USD rate
90
Japanesecompanies
Non-Japanesecompanies
Breakdown of overseas loans by Japanese/ non-Japanese companies (Sep. 10) *2
Breakdown of overseas loans by Japanese/ non-Japanese companies (Sep. 10) *2
96
0.53
1.28
0.90
0.620.71
1.43
0.760.80
7%
17%
20%
21% 22%
0.0
0.5
1.0
1.5
FY3/05 3/06 3/07 3/08 3/09 3/10 3/110%
10%
20%
30%
International Banking Unit (left scale)Of which, in 1H (left scale)Proportion to Marketing units (right scale)Of which, in 1H (right scale)

7
2-3-1. Overseas Business Especially in Asia(2) Settlement and Investment Banking Business
*1 Source: “ASIAMONEY”: “Cash Management Poll 2010” (Aug. 2010) *2 CMS stands for “Cash Management Services”*3 Source: Ministry of Economy, Trade and Industry “Quarterly Survey of Overseas Subsidiaries.”
Asia: Composed of China (including Hong Kong), Indonesia, Thailand, Philippines, Malaysia, Singapore, Taiwan, South Korea, India, Vietnam, Sri Lanka,Pakistan, Bangladesh, Myanmar and Laos
*4 Results of Jan.-Sep. 2010. Source: Thomson Reuters *5 Joint study of ADB and ADBI, “Infrastructure of a seamless Asia”
We aim to expand our trade finance and settlement services by capturing the dynamic changes in flow of goods and capital while increasing our loan balance by taking opportunities of growing financing needs from our customers and infrastructure investments
Asia’s infrastructureinvestment needs (2010-20)*5
Railways
Telecom
Energy(Electricity)
Roads
Airports/Ports
Water andSanitation
approx. USD 8 tn
0
50
100
150
200
250Asia North America Europe Other
Sales of overseas subsidiariesof Japanese companies*3
FY3/02 3/04 3/06 3/08 3/10
(USD bn)
3/11
Financial products with competitive edge:settlement services
1st
JPY CMS*2 as voted by Financial Institutions
4th
Large Corporates
4th 3rd
#1 among Japanese banksfor the five consecutive years
CMS*2 as voted by Corporates
Medium Corporates
Small Corporates
Cash management providers’ ranking (in Asia Pacific)*1Project finance(Mandated arranger ranking, Asia Pacific)
Loan syndication(Mandated arranger ranking, Asia)
14th
10th
Financial products with competitive edge:investment banking business*4
Data book P.21, 23Reference:
#1 for the fiveconsecutive years

8*1 Boldfaced and underlined banks represents ones with SMBC’s investment*2 Bar charts represent loan balance (aggregation by country/region based on domicile of borrowers
(not by channels)). Figures of China includes those of SMBC (China). Loan balances as of Mar. 31, 10is exchanged to JPY from each country’s local currency at the exchange rate of Sep. 30, 10.
We are enhancing our capability to provide products and services by expanding our channel network while leveraging business alliances with leading banks in each market
2-3-1. Overseas Business Especially in Asia(3) Expansion of Channels / Strategic Alliances
Data book P.24Reference: Supplementary Info. P.15
0
300
600
Mar. 10 Sep. 10
Loan balance of each country/region (JPY bn)*2
Loan balance of each country/region (JPY bn)*2
Korea
China
Thailand
Singapore
Indonesia
Taiwan
0
100
200
Mar. 10 Sep. 10
0
100
200
Mar. 10 Sep. 10
0
300
600
Mar. 10 Sep. 10
0
300
600
Mar. 10 Sep. 10
0
300
600
Mar. 10 Sep. 10
0
300
600
Mar. 10 Sep. 10
MalaysiaReceived approval to establish a wholly-owned subsidiary in Malaysia (Jun. 2010)
Functions such as planning and managing SMBC (China)’s business development for Japanese corporations were shifted from International Banking Unit to Corporate Banking Unit & Middle Market Banking Unit (Apr. 2010)Established 2 channels, received approval to open 2 channels
16 channels in Mainland China
Hong Kong
Established Financial Products Marketing Dept. (May 2010)
India
0
100
200
Mar. 10 Sep. 10
Strategic partners*1Strategic partners*1
China
Bank of ChinaIndustrial and Commercial Bank of ChinaAgricultural Bank of China
Korea Kookmin Bank
Taiwan First Commercial Bank
Hong Kong Bank of East Asia
Philippine Metrobank
Vietnam Vietnam Eximbank
Malaysia RHB Bank
Indonesia Bank Central Asia
India Standard Chartered BankKotak Mahindra Bank
Capital/business alliance (Jun. 2010)Cooperate in businesses such as asset management, securities and investment banking, and commercial banking for non-Japanese companies

9
Nikko achieved the top-class Ordinary profit among leading securities companies in Japan under unstable business environment. This was led by collaborative business with SMBC, in retail business, providing products such as investment trusts and foreign currency denominated bonds, which best suit to individual customers’ needs, and in wholesale business, enhancing businesses such as bond underwriting and trading,
2-3-2. Nikko Cordial Securities (1) 1H, FY3/2011 Results
2Hresults*1
YOY change*3
+ 20.2
(18.2)
+ 1.4
(15.4)
FY3/10 results*2
1H, FY3/11 results
Targets in
FY3/13
104.6
(81.6)
22.6
16.1
300.0
-
100.0
-
100.5
(76.9)
24.1
(JPY bn)
26.7
184.9
(140.4)
45.3
58.3
Net operating revenueSG&A expenses
Ordinary profit
Net income
Financial results (non-consolidated)Financial results (non-consolidated)
*4
*5
Data book P.7Reference:
# of collaborative transactions with SMBC# of collaborative transactions with SMBC
0
200
400
600
800
1,000
Oct.-Dec. 09 Jan.-Mar. 10 Apr.-Jun. 10 Jul.-Sep. 10
Investment banking businessAsset management in bonds
(# of transactions)
104.6
160.0
123.3 127.3
0
50
100
150
200
Nikko Nomura Daiwa Mizuho MitsubishiUFJ
22.7
10.8
28.1
(10)
0
10
20
30
Nikko Nomura Daiwa Mizuho MitsubishiUFJ
Comparison with peers (1H, FY3/11)*6Comparison with peers (1H, FY3/11)*6
Net
ope
ratin
g re
venu
eO
rdin
ary
prof
it
500
535.4(JPY bn)
(JPY bn)
(9.0)
*1 Figures after becoming a SMBC’s wholly-owned subsidiary *2 Sum of figures before and after succession through the corporate demerger*3 Comparison with 1H, FY3/10 results of former Nikko Cordial Securities before the corporate demerger *4 JPY 200 billion for retail business and JPY 100 billion for wholesale business*5 Deferred tax assets for temporary differences, which were allowed to be recognized by corporate demerger, contributed to decrease in income tax-deferred*6 Based on each company’s disclosure. The figures shown in the graph are: consolidated figures (US GAAP, comparison with Net revenue and Income before
income taxes) of Nomura Holdings for Nomura, consolidated figures of Daiwa Securities Group for Daiwa, consolidated figures of Mizuho Securities for Mizuho,and consolidated figures of Mitsubishi UFJ Securities Holdings for Mitsubishi UFJ
(2.3)

10
2-3-2. Nikko Cordial Securities(2) Progress of Medium-Term Management Plan
In retail business, Nikko started joint private banking operation with SMBC and Barclays, and SMBC’s agency services. In addition, SMBC Friend’s collaborative business with SMBC will be integrated into Nikko in January 2011. In wholesale business, Nikko is establishing equity-related business and overseas operations.In April 2011, Nikko will change its name to “SMBC Nikko Securities Inc.”
Data book P.7, 23Reference:
Main measures ofthe medium-term management plan Progress
Enhance business targeting wealthyindividualsCooperate with SMBCCooperate with wholesale arm
Enhancing efforts for primary deals
Started securities intermediary business for individuals (Apr. 2010)Commenced joint private banking operation (Jun. 2010)Started SMBC’s agency services (Oct. 2010)Integrate SMBC Friend’s collaborative business with SMBCinto Nikko Cordial Securities (Jan. 2011)
Reinforce front-line organizationStrengthen sales & trading, overseas platform, and collaboration with SMBC (referral service of underwriting, M&A and investment management, etc.)League table (targets in FY3/13)
Underwriting of industrial bonds: 1stUnderwriting of equities: Within 3rd
League table (1H, FY3/11)
Bond trading: Named as a primary dealer of JGB (Apr. 2010)Equity trading: Commenced operations of new equity trading system for institutional investors (Aug. 2010)Started securities business in the U.K. through SMBC’s subsidiary (Oct. 2010) Start securities business through subsidiaries in NY and HK (within FY3/11)
Active employment/ personnel developmentIncrease # of employees as of Mar. 31, 13 by approx. 1,000 compared with Dec. 31, 09
Increase in system investmentMaintain low-cost operations based on IT, etc.
Recruited employees and established Equity Research Division (Aug. 2010, # of ranked analysts*3: 14)Active employment
Dec. 09 Mar. 10 Sep. 10# of employees 6,479 6,533 6,903
Rank Market share Proceeds2nd 17.1% JPY 877.6 bn9th 4.1% JPY 88.5 bn
Bonds underwriting*1
Equities underwriting*2
Sep. 09 Mar. 10 Sep. 10Client assets (JPY tn) 25.9 28.1 28.8
*1 Source: Thomson Reuters (Japanese corporate debt) *2 Source: Thomson Reuters (Japan equity & equity-related, volume) *3 As of Oct. 31, 10
Ret
ail b
usin
ess
Pers
onne
l an
d m
iddl
e/
back
offi
ces
Who
lesa
le b
usin
ess

11
40 46 44
2622 20
35 36 3844
2025
17
291312
5
3
48
18
FY3/07 3/08 3/09 3/10 3/11
Securities intermediaryReal estate financeStructured financeSecuritization of monetary claimsLoan syndication
Profit related toinvestment banking business*1
(JPY bn) (SMBC non-consolidated)
2-3-3. Solution Providing for Corporations/ Investment Banking, Trust Business
Data book P.5, 23Reference:
2023
109
2217
1715
22
1H results
We aim to increase our top-line profit by sophisticating solution providing capabilities, through facilitating collaboration among domestic/overseas channels and with Nikko
Reinforcement in Asia
SMBC (China) Financial Products Marketing Dept.
Functions such as planning and managing SMBC (China)’s business development for Japanese companies were shifted from the planning department for overseas corporations*4 to theplanningdepartment for domestic corporations*5 (Apr. 2010)
Newly established by integrating certain functions of Investment Banking Unit in the region (May 2010)
Global ranking (Jan.-Sep. 2010)*2
Project finance
Global ranking (Jan.-Sep. 2010)*3
Loan syndication
11th
8th
# of cooperative transactions (1H, FY3/11 results):YOY change Doubled
*1 Profits of securities intermediary business: fees and commissions from the transactions with both individual and corporate clients. Profits of other businesses: managerial accounting basis including fees, commissions and interest income
*2 Source: Thomson Reuters (Project finance mandated arranger)*3 Source: Thomson Reuters (Syndicated loan bookrunner)*4 Planning Dept., International Banking Unit*5 Planning Dept., Corporate Banking Unit & Middle Market Banking Unit

12
Aiming to become #1 provider of comprehensive services for individuals, we will proactively capture financial needs of our customers centered on high net worth segment through leveraging collaborations with Nikko and
2-3-4. Financial Consulting for Individuals
Middle Market Banking Unit, while improving business processes through promoting cross-selling
Data book P.5, 19, 20Reference: Supplementary Info. P.16
Leverage group-wide capability including Nikko Cordial Securities and Corporate Business OfficesCommenced joint private banking business with SMBC and Barclays (Jun. 2010)Further expand products lineupImprove consultants’ skills
Segment withhigh net worth
Private Banking segment(approx. 10 thousand clients)
Asset managementsegment
(approx. 150 thousand clients)
Promote cross-selling, widen access to customers
Enhance & utilize remote channelsStrengthen approaches to housing loan borrowersFurther expand products lineup
Major initiativesMajor initiatives
5448
26
25
22
17
18
39
FY3/07 3/08 3/09 3/10 3/11
Pension-type insuranceInvestment trust
(JPY bn)
Profit related to investment trustand pension-type insurance
Outstandingbalance(JPY tn)
5.6 5.6 4.9 5.95.5 6.0
(SMBC non-consolidated)
2417
6
10
1H results
Mass segment(approx. 16 mn clients)
Asset building segment(approx. 9 mn clients)
Increase assetsunder management
Full year
1H
* Amount of investment trusts under SMBC account + accumulated sales of pension-type insurances as of fiscal year end

3. Earnings Forecasts for FY3/2011and Results of Each Line Item

14
3-1. Earnings Forecasts for FY3/2011
Ordinary profit 558.8 540.6 870.0<690.0>
+311.2
417.5 +268.4Net income 271.6 540.0<340.0>
(JPY bn)
1H, FY3/11 results (b) – (a)
Gross banking profit 1,455.3 838.6 1,550.0
<1,470.0>+94.7
<OHR> 47.1% 41.2% 45.8%<48.3%>
(1.3)%
Expenses (685.8) (345.3) (710.0) <(710.0)>
(24.2)
Banking profit*1 769.5 493.3 840.0<760.0> +70.5
Total credit cost*2 (254.7) (43.3) (130.0)<(220.0)>
+124.7
Ordinary profit 462.7 393.0 620.0<480.0> +157.3
Net income 318.0 351.2 460.0<330.0>
FY3/10results
(a)
Forecastfor FY3/11
in Nov.<May 10 forecast>
(b)
+142.0
Assumption for FY3/11 forecast
(JPY/EUR)
(JPY/USD)
110130
around zero
9,369
85
0.00 -0.25%
0.38%
Nov. 10 forecast
around zero
11,090
90
0.00 -0.25%
0.44%
May 10 forecast
Nikkei StockAverage (JPY)*3
Nominal GDPgrowth rate
Exchange rate
FF target rate
3M TIBOR
Common share dividends
Reference: Financial Results P.1, 3 Supplementary Info P.20
Despite severe business environment where “uncertainty, unclarity and unstableness” persist, we aim to increase SMFG’s consolidated Net income by JPY 270 billion year over year to JPY 540 billion in FY3/2011, through strengthening targeted growth business areas, controlling credit costs and increasing group companies’ profit, adding to the favorable performance of Treasury Unit in 1H, FY3/2011
Unchanged from May 10 forecastJPY 100 per share for FY3/11Of which, JPY 50 per share to be paid as interim dividend
*3 Forecast in May 2010: Spot price on Mar. 31, 10Forecast in Nov. 2010: Spot price on Sep. 30, 10
Ref
.
SMB
C<n
on-c
onso
lidat
ed>
SMFG
<con
solid
ated
>
*1 Before provision for general reserve for possible loan losses*2 Including portion recorded in Extraordinary gains (losses)

15
3-2. Gross Banking ProfitData book P.1Reference: Supplementary Info P.1
In 1H, FY3/2011, Gross banking profit increased by JPY 119.3 billion year over year, due mainly to substantial increase in Gains on bonds resulting from our ALM operations that quickly responded to the decline in market interest rates in both domestic and overseas markets as well as increase in sales of investment trusts and fees related to loans in overseas. We aim to continuously increase profit by enhancing overseas business especially in Asia and non-interest income in domestic market
*1 FY3/01 and before: aggregated figures of former Sakura Bank and Sumitomo Bank*2 Other income = Net trading income + Net other operating income – Gains (losses) on bonds
(SMBC non-consolidated)
Gross banking profit*1 Major factors of YOY change
(JPY bn)
(Excluding gains (losses) on bonds) 687.4 +7.0
Fees related to loans of international operations 21.6 +4.1
Income from (expenses on) derivatives 3.1 +17.0
1H, FY3/11 YOY change
Gross banking profit 838.6 + 119.3
Net interest income 488.2 (29.6)Net interest income in domestic operations 432.9 (26.5)Net interest income in international operations 55.3 (3.1)
Fees on sales for investment trusts 23.8 +7.1
Net fees and commissions +Trust fees 140.7 +9.5
Net trading income +Net other operating income 209.7 +139.4
Gains (losses) on bonds 151.2 +112.3288 59
141
83 488
1,046
37
151
17%
9%
20%
(200)
200
600
1,000
1,400
1,800
3/00 3/01 3/02 3/03 3/04 3/05 3/06 3/07 3/08 3/09 3/10 3/11
Gains (losses) on bondsNet interest incomeOther incomeNet fees and commissions + Trust fees
(JPY bn)
*2
FY
(Net fees and commissions +
Trust fees) / Gross banking profit
1,455
Extraordinary factor related to dividend income from subsidiaries 1,550
FY3/11 plan
of which:
of which:

16
3-3. Loan BalanceData book P.3, 11Reference: Supplementary Info. P.13
56.6 57.4
Domestic loans, as of Sep. 30, 2010, excluding loans to the government, decreased by JPY 1.0 trillion compared with Mar. 31, 2010 due mainly to limited demand from corporations, while overseas loans increased by JPY 0.4 trillion after adjustment of yen appreciation. We aim to continuously allocate more assets in overseas market centered on Asia and Americas in order to increase profit from overseas business
*1 Mar. 01 and before: aggregated figures of former Sakura bank andSumitomo Bank
Sep. 30, 10 Change fromMar. 31, 10
ConsumerBanking Unit 15.4 0.0
Middle Market Banking Unit 17.5 (0.8)
CorporateBanking Unit 11.8 (0.2)
Trends of loan balance*1
(JPY tn, term-end balance)
<(1.0)><excluding loans to the government>
+0.8Total(0.1)Risk-monitored loans■
(0.2)Overseas loans(excluding risk-monitored loans)■
+1.1Domestic loans(excluding risk-monitored loans)■
Change from Mar. 31, 10 (JPY tn)
Term-end balance by domestic business unit(managerial accounting basis)
(JPY tn,term-end balance)
(SMBC non-consolidated)
*2
Overseas loans, classified by region*4
(managerial accounting basis)
*4 Based on location of our channels.Including SMBC Europe and SMBC (China)
After adjustment
of yen appreciation
+ 0.1
(0.4)
0.0
(0.3)
Changefrom
Mar. 31, 10
+ 0.43.0Asia
+ 0.22.3Americas
(0.1)2.7Europe
+ 0.48.0Overseas total
Sep. 30, 10(JPY tn,term-end balance)
*3
*2 After add-back adjustment of portion of housing loans securitized in 1H, FY3/11 (approx. JPY 50 bn)
*3 Excluding loans to the public sector
48.6 49.750.3
30
40
Mar.00
Mar.01
Mar.02
Mar.03
Mar.04
Mar.05
Mar.06
Mar.07
Mar.08
Mar.09
Mar.10
Sep.10
6.7
1.0
6.98.8
1.1
1.1
50
60
70
80
17
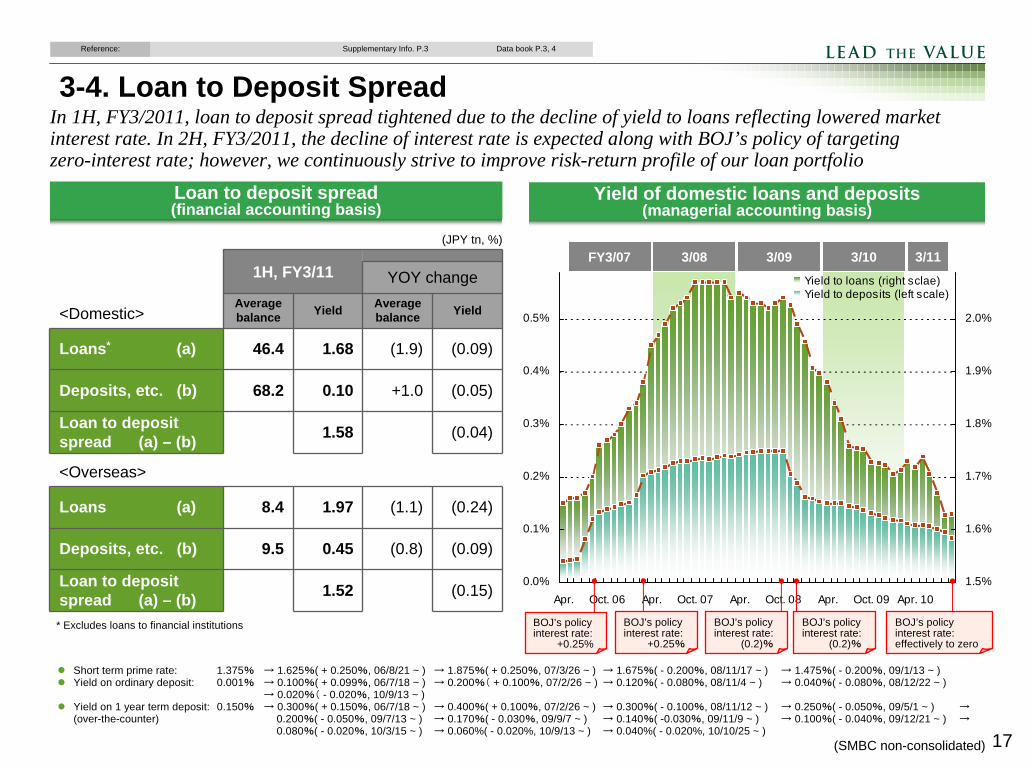
3-4. Loan to Deposit SpreadIn 1H, FY3/2011, loan to deposit spread tightened due to the decline of yield to loans reflecting lowered market interest rate. In 2H, FY3/2011, the decline of interest rate is expected along with BOJ’s policy of targeting zero-interest rate; however, we continuously strive to improve risk-return profile of our loan portfolio
Loan to deposit spread(financial accounting basis)
(JPY tn, %)
(SMBC non-consolidated)
1H, FY3/11 YOY change
<Domestic>Average balance Yield Average
balance Yield
Loans* (a) 46.4 1.68 (1.9) (0.09)
Deposits, etc. (b) 68.2 0.10 +1.0 (0.05)
Loan to deposit spread (a) – (b) 1.58 (0.04)
<Overseas>
Loans (a) 8.4 1.97 (1.1) (0.24)
Deposits, etc. (b) 9.5 0.45 (0.8) (0.09)
Loan to deposit spread (a) – (b) 1.52 (0.15)
Short term prime rate: 1.375% → 1.625%( + 0.250%, 06/8/21 ~ ) → 1.875%( + 0.250%, 07/3/26 ~ ) → 1.675%( - 0.200%, 08/11/17 ~ ) → 1.475%( - 0.200%, 09/1/13 ~ )Yield on ordinary deposit: 0.001% → 0.100%( + 0.099%, 06/7/18 ~ ) → 0.200%( + 0.100%, 07/2/26 ~ ) → 0.120%( - 0.080%, 08/11/4 ~ ) → 0.040%( - 0.080%, 08/12/22 ~ )
→ 0.020%( - 0.020%, 10/9/13 ~ )Yield on 1 year term deposit: 0.150% → 0.300%( + 0.150%, 06/7/18 ~ ) → 0.400%( + 0.100%, 07/2/26 ~ ) → 0.300%( - 0.100%, 08/11/12 ~ ) → 0.250%( - 0.050%, 09/5/1 ~ ) →(over-the-counter) 0.200%( - 0.050%, 09/7/13 ~ ) → 0.170%( - 0.030%, 09/9/7 ~ ) → 0.140%( -0.030%, 09/11/9 ~ ) → 0.100%( - 0.040%, 09/12/21 ~ ) →
0.080%( - 0.020%, 10/3/15 ~ ) → 0.060%( - 0.020%, 10/9/13 ~ ) → 0.040%( - 0.020%, 10/10/25 ~ )
Data book P.3, 4Reference: Supplementary Info. P.3
Yield of domestic loans and deposits(managerial accounting basis)
FY3/07 3/08 3/09 3/10
0.0%
0.1%
0.2%
0.3%
0.4%
0.5%
Apr. Oct. 06 Apr. Oct. 07 Apr. Oct. 08 Apr. Oct. 09 Apr. 101.5%
1.6%
1.7%
1.8%
1.9%
2.0%
Yield to loans (right sclae)Yield to deposits (left scale)
BOJ’s policy interest rate:
+0.25%
BOJ’s policy interest rate:
+0.25%
BOJ’s policy interest rate:
(0.2)%
BOJ’s policy interest rate:
(0.2)%
3/11
BOJ’s policyinterest rate: effectively to zero
* Excludes loans to financial institutions
18
(non-consolidated)
Loan spread of domestic loans(managerial accounting basis)
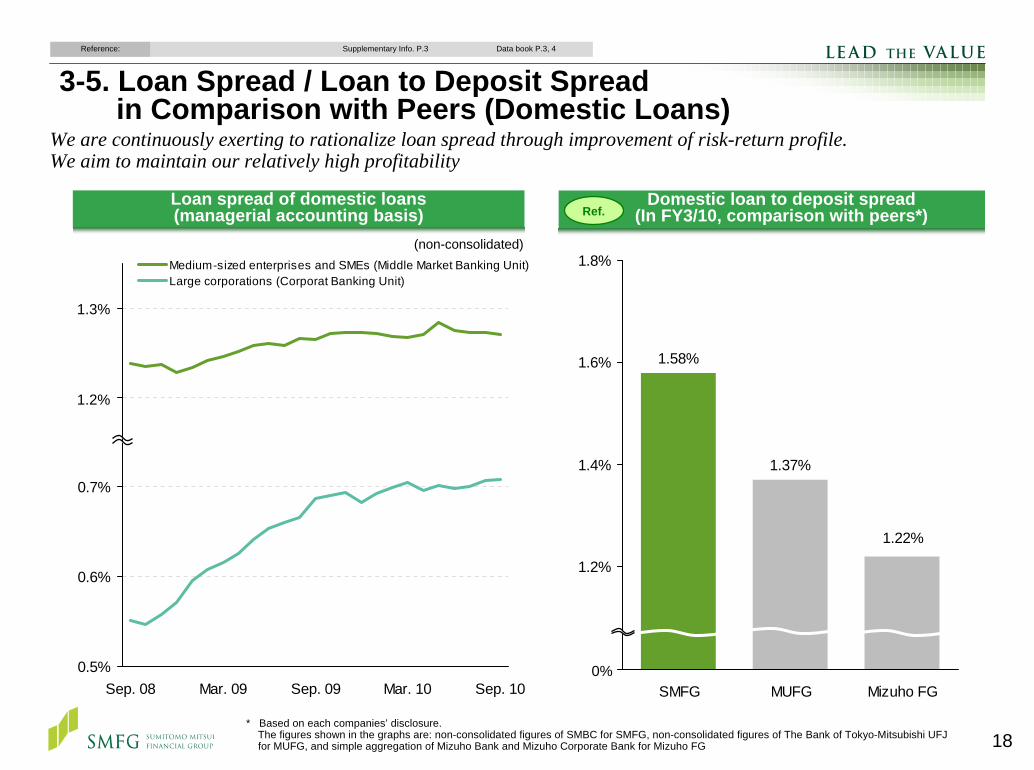
3-5. Loan Spread / Loan to Deposit Spreadin Comparison with Peers (Domestic Loans)
We are continuously exerting to rationalize loan spread through improvement of risk-return profile.We aim to maintain our relatively high profitability
Data book P.3, 4Reference: Supplementary Info. P.3
0.5%
0.6%
0.7%
0.8%
0.9%
Sep. 08 Mar. 09 Sep. 09 Mar. 10 Sep. 10
Medium-sized enterprises and SMEs (Middle Market Banking Unit)Large corporations (Corporat Banking Unit)
1.3%
1.2%
Domestic loan to deposit spread(In FY3/10, comparison with peers*)
1.58%
1.22%
1.37%
1.0%
1.2%
1.4%
1.6%
1.8%
SMFG MUFG Mizuho FG0%
Ref.
* Based on each companies’ disclosure.The figures shown in the graphs are: non-consolidated figures of SMBC for SMFG, non-consolidated figures of The Bank of Tokyo-Mitsubishi UFJfor MUFG, and simple aggregation of Mizuho Bank and Mizuho Corporate Bank for Mizuho FG

19
3-6. Performance by Business UnitData book P.1Reference: Financial Results P.12
In 1H, FY3/2011, in addition to the substantial increase in profit of Treasury Unit, profit of Marketing units increased even under the severe business environment with limited loan demand in domestic market, by increase in sales of investment trusts and fees related to loans in International Banking Unit.Going forward, we aim to increase non-interest income in domestic market and profit of International Banking Unit
Average balance Average spread1H,
FY3/11YOY
change1H,
FY3/11YOY
changeDomestic loans 49.0 (2.1) 1.07 + 0.03
Consumer Banking Unit 15.4 + 0.3 1.43 (0.05)
Middle Market Banking Unit 17.8 (1.7) 1.18 (0.02)Corporate Banking Unit 11.8 (0.3) 0.71 + 0.06
(JPY tn, %)
+ 13.3171.5Non-interest income
(6.9)427.2Interest income+ 7.1(3.7)
23.85.8
Investment trustsPension-type insurance
+ 8.636.0Income relating to Financial consulting for individuals
(3.2)+ 4.1+ 1.5
19.621.516.6
Loan syndicationStructured finance*3
Real estate finance*3
+ 3.269.1Income relating to IB*4 business*3
(0.6)(1.1)+2.8+ 8.4
7.347.022.735.2
Sales of derivativesMoney remittance, Electronic bankingForeign exchangeIBU’s Non-interest income
598.7
254.392.253.6
Marketing units + 6.4
(5.0)(3.1)+ 2.9
Income on domestic loansIncome on domestic yen depositsIBU’s Interest related income
493.3(345.3)838.6(48.5)(36.7)(11.8)
242.8(8.9)
251.7299.0(299.7)598.7
59.7(29.1)88.881.3(17.7)99.0
111.2(109.5)220.7
46.8(143.4)190.2
1H, FY3/11
+ 119.3719.3Gross banking profit
+ 28.2(53.0)Gross banking profit
+ 84.7167.0Gross banking profit
+ 6.4605.3Gross banking profit
+ 11.384.2Gross banking profit
(2.7)97.2Gross banking profit
+ 3.2192.5Gross banking profit
(5.4)231.4Gross banking profit
YOY change*1
Expenses
Expenses
Expenses
+ 2.7307.8Banking profit
(0.7)(8.2)Treasury Unit+ 84.0158.8Banking profit
+ 0.8(36.0)Headquarters+ 29.0(89.0)Banking profit
(3.6)(341.7)Total+ 115.7377.6Banking profit
(3.7)
+ 8.1(3.2)
(3.3)(0.6)
(5.9)(0.5)
+ 3.8+ 0.6
1H, FY3/10
56.9Banking profit
80.6Banking profit
122.2Banking profit
48.1Banking profit
(16.6)ExpensesCorporate Banking Unit
(27.3)ExpensesInternational Banking Unit
(297.5)ExpensesMarketing units
(109.2)ExpensesMiddle Market Banking Unit
(144.4)ExpensesConsumer Banking Unit
Gross banking profit by products*2
Average loan balance and spread by business unit*2Adjustment of interest rates and exchange rates, etc.: (13.0)
<Nominal change>
YOY change(6.6)
(JPY bn)
(SMBC non-consolidated)*1 After adjustment of interest rates and exchange rates, etc. (included in Headquarters)*2 Managerial accounting basis *3 Including interest income *4 IB stands for “investment banking”
(JPY bn)<YOY change*1>of which:
of which:
of which:
of which:

20
3-7. Gains (Losses) on Bonds / Bond Portfolio
(SMBC non-consolidated)
Yen-denominated bond portfolioYen-denominated bond portfolio
2.3 1.7 1.8 1.7
(129.5) (56.5) (1.2) 55.6
1.1
116.1
1.4
118.2
In general, lowering interest rate improves unrealized gains (losses) on bonds, which are to be realized when the bonds are sold. In 1H, FY3/2011, we realized approx. JPY 151 billion of Gains on bonds by quickly responding to the decline in interest rates in both domestic and overseas markets while controlling amount of risks. The balance of yen-denominated bonds as of Sep. 30, 2010 increased by approx. JPY 4 trillion compared with Mar. 31, 2010 to JPY 23.4 trillion; however, the majority of the increase is derived from bonds with maturity less than 1 year, with average duration of the portfolio being controlled at 1.4 years. We will continue to focus on appropriately operating bond portfolio with controlled amount of risks
Gains (losses) on bonds
Trends on market interest rates(domestic and overseas market)
(JPY bn)1H, FY3/10 1H, FY3/11
YOY change
Gains (losses)on bonds 38.9 151.2 +112.3
0
1
2
3
4
3M TIBOR10Y JGB Yields10Y US Treasury Yields
(%)
3/113/10FY3/09
0
5
10
15
20
Mar. 08 Sep. 08 Mar. 09 Sep. 09 Mar. 10 Sep. 10
More than 10 yearsMore than 5 years to 10 yearsMore than 1 year to 5 years1 year or less 17.8
12.6
Balance (JPY tn)
11.6
19.2
15-year floating-rate JGBs: approx. JPY 1.8 tn
19.4
23.4
Data book P.4, 13, 25Reference: Supplementary Info. P.1, 3, 5
(Total balance of bonds with maturities among Other securities and bonds classified as Held-to-maturity)
Average Duration (Years) *
15-year floating-rate JGBs have been carried at their reasonably estimated amounts from Sep. 30, 08
* Excluding bonds classified as held to maturity, bonds for which hedge-accounting is applied, and private placement bonds. Duration of 15-year floating rate JGBs is calculated zero
Unrealized gains / losses
(JPY bn)

21
53.7%
36.2%
47.0%
47.5%
41.2%
0
200
400
600
800
3/99 3/00 3/01 3/02 3/03 3/04 3/05 3/06 3/07 3/08 3/09 3/10 3/110%
20%
40%
60%
80%Personnel expensesNon-personnel expensesOverhead ratio (1H)Overhead ratio (Full year)
(JPY bn)
779.0
Trends of Expenses*1
Expenses in 1H, FY3/2011 was lower than May 2010 forecast as a result of cost reduction by thorough review,though slightly increased year over year, due mainly to the amortization of past investments in branches and systems and allocation into targeted growth business areas. We will continue stringent control on expenses
685.8
3-8. ExpensesData book P.2Reference: Supplementary Info. P.1, 3
1H, FY3/11 Compared with May 10 forecast
(345.3) + 4.7
710.0
(SMBC non-consolidated)
41.2%
48.3%47.9%
35%
40%
45%
50%
55%
SMFG MUFG Mizuho FG
Overhead ratio(in 1H, FY3/11, comparison with peers*2)
0%FY
1H results
*1 FY3/01 and before: aggregated figures of former Sakura Bank and Sumitomo Bank*2 Based on each companies disclosure. The figures shown in the graphs are: non-consolidated figures of SMBC for SMFG, non-consolidated figures of
The Bank of Tokyo-Mitsubishi UFJ for MUFG, and simple aggregation of Mizuho Bank and Mizuho Corporate Bank for Mizuho FG

22
3-9. Total Credit Cost
Total credit cost
249 768
(JPY bn)
Totalcredit cost
(SMFGconsolidated)
(SMBC non-consolidated)
Of which, Group
companies
SMBC’s non-consolidated Total credit cost in 1H, FY3/2011 substantially decreased compared with 1H, FY3/2010 and May 2010 forecast, due mainly to our individualized efforts to assist corporate clients to improve their businesses and financial conditions, as well as yen appreciation and reversal of provision for reserve by loan repayment. We forecast full-year Total credit cost to be JPY 130 billion, decreased by JPY 90 billion compared with May 2010 forecast. We view potential risks associated with restructured loans resulting from SME Financial Facilitation Act would be limited
101 218
473
218
Data book P.6, 12Reference: Financial Results P.2 Supplementary Info. P.1, 2, 8, 11
268
111
106
63
(JPY bn)
148
255
550
4315723
82
4020
0
200
400
600
800
1,000
FY3/08 3/09 3/10 3/11
Total credit costOf which, 1HTotal credit cost/Total claims
bp
Precautionary reserve:
approx. JPY 110 bn
bp
bp
bp
FY3/11Nov. 10 forecast
Compared with May 10 forecast
(130) + 90
Claims to borrowers
requiring caution*
Total claims
Balance of non-performing loansRef.
1.24%
1.78%1.63%1.74%
0
1
2
3
4
Mar. 08 Mar. 09 Mar. 10 Sep. 10
Substandard loansDoubtful assetsBankrupt / quasi-bankrupt assetsNPL ratio
1.19
(JPY tn)
(JPY tn) (SMBC non-consolidated)
1.10
2.6 3.7 3.7
Mar. 09 Mar. 10 Sep. 10Coverage ratio 86.11% 90.56% 88.82%
3.4
0.801.04
65 67 63 64
* Excluding claims to Substandard borrowers
*除く要管理先債権
Impact from revising for
classification of Restructured loans 30 20
170 160Decrease in
NPLs
Decrease in provisions
(JPY bn)
15
90
Cumulativesince 4Q,FY3/10
20
150
approx.approx.
approx.
approx.
approx.
approx.
approx.approx.

23
(Ref.) Exposure to PIIGS, Middle East and Russia*Our exposure to Portugal, Italy, Ireland, Greece and Spain is approx. USD 5 billion in total, and associated risks is limited. We hold no government bonds issued by these countries
Portugalapprox. USD 0.1 bn
Majority is to banks
Spainapprox. USD 2.4 bn
To large corporations andJapanese companies,
project finance
Greeceapprox. USD 0.2 bn
Majority is collateralized
Russiaapprox. USD 3.5 bn
To government-affiliatedentities and local large
corporations
UAEapprox. USD 3.4 bn(of which to Dubai:approx. USD 1.1 bn)Majority is to Dubai
government-affiliated entities, local banks and
Japanese companies
(SMFG consolidated)
Italyapprox. USD 1.9 bn
To large corporationsand projects finance related
Irelandapprox. USD 0.7 bn
To large corporationsand project finance
* As of Sep. 30, 10
Data book P.17Reference: Supplementary Info. P.15
Government bonds issued by PIIGS:No outstanding

4. Group Companies / Group Strategy

25
4-1. Contribution of Subsidiaries/Affiliates to Consolidated Profit
1H, FY3/11 results(JPY bn)
DifferenceYOY change
Consolidated/non-consolidatednet business profit
600.6 493.3 107.3 +84.5
Ordinary profit 250.0 +153.9
478.2
172.3
0.1
218.8
53.5
33.5
(310.3)
(62.5)
(4.3)
1.6
147.6
66.3
+131.5
+6.9
+0.1
+90.0
+20.4
+14.1
(119.0)
+49.1
(32.2)
+21.6
+72.5
+55.4
80.0 +126.4
(1)
Gains (losses) on stocks (22.6) (18.3)
Ordinary profit 540.6 393.0
Net income 417.5 351.2 (2)
Forecast for FY3/11 Net income
SMFGconsolidated
SMBCnon-consolidated
838.6
488.2
1.0
139.7
135.2
74.5
(345.3)
(43.3)
-
Trust fees 1.1
Total credit cost*1 (105.8)
Equity in earnings (losses) of affiliates 1.6
Net fees and commissions 358.5
Gross banking profit 1,316.8
Net interest income 660.5
Net trading income 188.7Net other operating income 108.0
General and administrative expenses (G&A expenses)
(655.6)
Data book P.2, 7, 8, 9Reference: Supplementary Info. P.1, 2
In 1H, FY3/2011, SMFG’s consolidated Net income was JPY 66.3 billion higher than SMBC’s non-consolidated Net income, due mainly to contribution of Nikko and recovery of subsidiaries such as domestic/overseas subsidiary banks.We forecast contribution from subsidiaries/affiliates other than SMBC will be JPY 250 billion in Ordinary profit and JPY 80 billion in Net income for FY3/2011
*1 Including extraordinary gains (losses)
Major factors in difference(FY3/11, in round numbers)
Impact of new consolidation
(9)Total credit cost
+24+23Ordinary profit
May 2010Oct. 2009(Ref.) Start of consolidation
+23-Equity in earnings (losses) of affiliates
(34)(83)G&A expenses
+44
Cedyna
+109
Nikko Cordial Securities
(consolidated)
Gross banking profit
YOY change(JPY bn)
Cedyna
Sumitomo Mitsui Card
SMBC Guarantee
Sumitomo Mitsui Finance and Leasing
Nikko Cordial Securities
SMBC Europe
Kansai Urban Banking Corporation
(JPY bn)
(2)
(1)
+15
+1717
+77+39
+23
+15
4
(3)(14)
1H, FY3/11
+10
YOY change
*2 Figures after adjustment of shares held by SMFG group
Other major factors
*2

26
4-2. Consumer Finance Business
Overview of consumer finance business in SMFG (image)
We will continue to strengthen consumer finance business as a part of our retail business lineup, as we view that consumer finance business will bear stable profitability in the medium to long run, with relatively thick spread. For the time being, we will closely monitor trends on refund claims and impacts from the full implementation of Moneylending Law and the bankruptcy of Takefuji
Speedily executing the plan announced in Jan. 2010Streamlining marketing framework:Eliminated staffed branches in Oct. 2010 (originally scheduled by Mar. 31, 11)Using human resources more productively:Employees as of Sep. 30, 10 decreased by approx. 2,300 compared with Mar. 31, 09 (originally planed to decrease by approx. 1,500 by Mar. 31, 11)Reorganizing non-finance-related businessesReorganizing group companies: merged with SANYO SHINPAN in Oct. 2010, merge with At-Loan in Apr. 2011Aiming for the largest possible market share in unsecured loan and guarantee businesses
Progress of Promise’sBusiness Structural Reform Plan
Started referral service from SMBC (Oct. 2010) Installed ACMs*1 and ATMs in Promise’s branches
*2 Promise: Not including the balance from Mar. 08 to Sep. 10 due to the halt of origination (restarted in Oct. 2010). At-Loan: Including loans provided before collaboration. Halted origination in May 31, 10
0
2
4
6
8
0% 20% (interest rate)
Data book P.9, 21Reference:
Collaboration with Promise(balance of loans)
Started in Apr. 05
0
100
200
300
400
Mar. 06 Mar. 07 Mar. 08 Mar. 09 Mar. 10 Sep. 10
Promise + At-LoanSMBC
(JPY bn)
*2
*3 Source: “Statistics on Japanese Consumer Credit (2010)” by Japan Consumer Industry Association
Consumer loans provided bymonoline consumer companies*3
(JPY tn)
(Year)
0
2
4
6
8
10
94 98 02 06
(Clients’ borrowing limit, JPY mn)
*1 ACM stands for “Automatic Contract Machine”

27
4-3. Credit Card Business
100%
Organizational structureto promote credit card business
Organizational structureto promote credit card business
66% 69%*1
Intermediate holding company:SMFG Card & Credit (FGCC)
SMFG
We consolidated Cedyna in May 2010 and are further enhancing the group-wide collaboration. We will continuously pursue the maximization of top-line synergies and realization of economies of scale
Purpose of making Cedynaa consolidated subsidiary
Purpose of making Cedynaa consolidated subsidiary
Data book P.8Reference:
Collaborate in education marketCollaborate in other markets where Cedyna focuses(home renovation market, etc.)Collaborate by mutually offering referrals to each other’s business partners and jointly offering products and services, etc.
Integrate next-generation IT systems / processing businessMission-critical system (systems for accounting processes such as sales and billing): ・Commenced project initiation for the next-generation system
・Integrated host system of former OMC Card in 1H, FY3/11Peripheral system (systems for membership screening and delinquency management, etc.) :・Integrate one system after another since FY3/11
-Integrated systems for connection with outside networks in 1H, FY3/11
Subscription of third-party allotment
(JPY 50 bn) /Making Cedyna
a consolidated subsidiary(scheduled on May 31, 10)
Sumitomo Mitsui Card
(SMCC)
(# of cardholders:20.6 mn*2)
CentralFinance
OMCCard QUOQ
Merged in Apr. 09
(# of cardholders: 24.9 mn*2)
Further clarify the positioning as a core business entity in credit card businessAccelerate and ensure management restructuring
Investments in new businesses(incl. overseas financial business expansion)Investments in systems developmentsCost restructuring etc.
Enhance capital base
Further accelerate and make a stable promotion ofour credit card business strategy
(Sumitomo MitsuiCard)
(Sumitomo MitsuiCard)
[Top-line synergies]
[Economies of scale]
*1 Total voting shares held by SMFG group (as of Sep. 30, 10) *2 As of Sep. 30, 10
5. Capital / Liquidity

29
Credit risk-adjusted assets decreased due mainly to change of PD and yen appreciation despite of the increase by consolidation of Cedyna
5-1. Capital
Mar. 31, 10(a)
Sep.30, 10<preliminary>
(b)(b) - (a)
Tier I 6,032.3 6,362.2 +329.9
(1)
Increase in equity capital resulting from a securitization exposure (37.5) (38.9) (1.4)
Amount equivalent to 50% of expected losses in excess of qualifying reserves (36.2) (20.1) +16.1
Tier I ratio 11.15% 12.32% +1.17%Core Tier I ratio*2 7.7% 8.8% 1.1%
(2)
(3)
Capital stock & Capital surplus 3,316.8 3,316.8 -<Preferred Stock> [210.0] [210.0] -
Retained earnings 1,371.3 1,715.8 +344.5Preferred securities issuedby overseas SPCs 1,633.3 1,595.6 (37.7)
Foreign currency translationadjustment (101.7) (100.2) +1.5
Tier II 2,563.9 2,360.8 (203.1)Unrealized gains on other securities after 55% discount 254.0 165.1 (88.9)
General reserve for loan losses 69.4 89.2 +19.8Perpetual subordinated debt 427.6 275.0 (152.6)Dated subordinated debt 1,775.8 1,794.5 +18.7
Deduction (467.9) (451.1) +16.8Total capital 8,128.2 8,271.9 +143.6Risk-adjusted assets 54,084.5 51,612.8 (2,471.6)Capital ratio*1 15.02% 16.02% +1.00%
Net deferred tax assets 702.1 691.5 (10.6)
*1 Figures are based on Basel II standard (Credit risk: AIRB, Operational risk: AMA)*2 While “Core Tier I” is not defined in international agreements, we estimated “Core Tier I capital = Tier I capital – Preferred shares – Preferred securities”*3 SMBC consolidated basis
(1)Net income + 417.5 bnDividends (73.6) bn
(JPY bn)
+3.5%9.6%6.1%(Reference) Outlier ratio*3
(2,471.7)51,612.854,084.5Total
Change from Mar. 31, 10
+298.63,416.63,118.0Operational risk equivalent
+201.8650.2448.4Market risk equivalent
(2,972.0)47,546.150,518.1Credit risk-adjusted assets
Sep. 30, 10<preliminary>Mar. 31, 10
Tier I
Net deferred tax assets / Tier l capital (SMFG consolidated):10.9% (as of Sep. 10, decreased by 0.7% compared with Mar. 10)
Tier II
(2)Redemption of perpetual subordinated debt etc. (152.6) bn
Risk-adjusted assets
(JPY bn)
(3)
Data book P.15, 16Reference: Supplementary Info. P.7
SMFG’s consolidated Tier I ratio as of Sep. 30, 2010 was 12.32%, a 1.17% increase compared with March 31, 2010 due mainly to steady accumulation of earnings and the decrease of risk-adjusted assets as a result of improvement in asset quality. We believe that we could secure sufficient capital base to meet tighter capital requirement under discussion, through steady accumulation of retained earnings, without additional common equity offerings
(SMFG consolidated)
of which:
of which:

30
Transitional arrangements for implementing the new standardsTransitional arrangements for implementing the new standards
Transition period After full implementation
(Ref.) Summary of New Framework for Capital Requirements*1
3.5% 4.0% 4.5% 4.5% 4.5% 4.5% 4.5% 4.5% 4.5% 4.5%
0.625%1.875%
1.0%1.5%
1.5%1.5%
1.5%1.5%
1.5% 1.5% 1.5% 1.5%
3.5%2.5% 2.0%
2.0%2.0%
2.0%2.0% 2.0% 2.0% 2.0%
2.5% 2.5%2.5%2.5%1.25%
0%
2%
4%
6%
8%
10%
12%
Jan. 2011 Jan. 12 Jan. 13 Jan. 14 Jan. 15 Jan. 16 Jan. 17 Jan. 18 Jan. 19 Jan. 20 Jan. 21 Jan. 22
Minimum common equity capital ratio Capital conservation buffer Other Tier I Tier II
Basel II
8.625% 9.25%9.875%
10.5%
8.0%8.0%8.0% 8.0%8.0%
10.5% 10.5%
- - - 20% 40% 60% 100%
10%90% 60%70%80%100%
80% 100% 100% 100% 100%
100% 50% 40% 30% 20% -
10.5%
Phase-in of deductions from common equity Tier I*2
Grandfathering of capital instruments that no longer qualify as no-core Tier I capital or Tier II capital
*1 Based on the announcement of the Group of Central Bank Governors and Heads of Supervision, the governing body of the Basel Committee, in Sep. 2010*2 Including amounts exceeding the limit for deferred tax assets, mortgage servicing rights and investment in the common shares of unconsolidated
financial institutions

31
(JPY bn) (Group consolidated) (Group consolidated)
Securitized products, etc.(comparison with peers*1)Securitized products, etc.(comparison with peers*1)
Percentage of market risk equivalentin risk-adjusted assets*2
Percentage of market risk equivalentin risk-adjusted assets*2
5-2. Control on Downside Risks
*1 SMFG:As of Sep. 30, 10. After provision and write-offsMUFG:As of Sep. 30, 10. After impairment and before deducting net unrealized losses. Including “securities being held to maturity” and “other”Mizuho FG:As of Mar. 31, 10. After reserve for investment loss. Including banking accounts of subordinated banks and trading accounts of Mizuho Securities
*2 Market risk equivalent X 12.5/Total risk-adjusted assets.Based on company disclosures (as of Sep. 30, 10 for SMFG, MUFG, Mizuho FG, Citi and DB : as of Dec. 31, 09 for BNP : as of Jun. 30, 10 for others)
We have smaller exposure to securitized products, etc. as a result of early and substantial reduction of exposure related to subprime loan in 1H, FY3/2008. Also, we estimate that the incremental impact in risk-adjusted assets due to the implementation of Basel III will be several percents since our counterparty risk is extremely limited
2,619
27
1,459
0.02%
1.68%
0.71%
0
1,000
2,000
3,000
SMFG MUFG Mizuho FG0.0%
0.5%
1.0%
1.5%
2.0%
Securitized productsSecuritized products/Total assets
Data book P.14, 15Reference: Supplementary Info. P.22
1.3%2.2% 2.5%
3.8%
4.9% 5.2%
7.6%
9.7% 9.8%
15.8%15.8%
0%
5%
10%
15%
SMFGMUFG
Mizuho
FG BNPHSBC Citi DB
BAC
JPM
RBSBarc
lays

32
Percentage of equity holdings on SMBC non-consolidated basis to consolidated Tier I capital is approx. 31%as of Sep. 30, 2010. Reviewing profitability in relation to equity holdings and effect of holdings more stringently, we will minimize the impact of volatility in equity market to our capital by reduction of the percentage to the level of around 25% in the medium term mainly through sale and hedge
Balance of equity holdings*1Balance of equity holdings*1
Data book P.13, 14Reference: Supplementary Info. P.4, 31
5-3. Equity Holdings
1.9
5.9
1.81.9
145%
94%
46%
32% 31%
0
1
2
3
4
5
6
Apr.01
Mar.02
Mar.03
Mar.04
Mar.05
Mar.06
Mar.07
Mar.08
Mar.09
Mar.10
Sep.10
Equity holdings (acquisition cost on SMBC non-consolidated)Percentage of equity holdings to SMFG consolidated Tier I
(JPY tn)
The brake-even by Nikkei Stock Average:
Around JPY 8,500
Changes in environment
Tightening of capital regulations
Introduction of IFRS
Additional reduction in % of unhedged
equity holdings within Tier I capital to
the level of around 25%
Need to minimize the impact of stock price fluctuation risk to our capital
Reduce unhedged equity holdings by JPY 300 bn through sale and hedge, etc. in 3 years
Sold amountin 1H, FY3/11:
approx. JPY 4 bn
*2
*1 Balance of domestic stocks classified as other securities with fair value*2 Until Mar. 02, percentage to SMBC consolidated Tier I

33
5-4. Liquidity
*1 Consolidated basis. Based on each company’s disclosure. As of Jun.10 for HSBC,BNP and Barclays, as of Sep.10 for others*2 Managerial accounting basis. Sum of SMBC(non-consolidated), SMBC Europe and SMBC (China)
Foreign-currency funding : FY3/11 ResultsForeign-currency funding : FY3/11 Results
Issued USD denominated senior bonds in Jul. 2010 (USD 1bn for 3Y and 5Y bonds, respectively)Issued EUR denominated subordinated bonds in Nov. 2010 (EUR 750 million for 10Y bonds)
We have competitive advantage in liquidity position represented by relatively low loan to deposit ratio compared with global peers, and we aim to keep prudent liquidity management to secure solid investment and funding structure, taking into account liquidity regulation under discussion. Especially, we will further expand and diversify our funding base of foreign currency in line with the expansion of our overseas business
Overseas deposits*2Overseas deposits*2
(Ref.)Domestic deposits (JPY tn)
62.7 64.5 66.2 67.6 68.3
Data book P.10Reference: Financial Results P.4, 5
73 7277 78
96
113 115
124
59
0
20
40
60
80
100
120
140
SMFG MUFG MizuhoFG
Citi HSBC BAC RBS BNP Barclays
(%)
Comparison with major domestic and foreign banks*1
Loan to deposit ratioLoan to deposit ratio
13 19 24 29 2812
14
13
1621
16
34278
7
0
20
40
60
80
Mar. 07 Mar. 08 Mar. 09 Mar. 10 Sep. 100%
50%
100%
150%
200%
250%
EuropeAmericasAsiaOverseas Loan to deposit ratio(USD bn)
3241
53
7283

34
Tier I capital
Risk-adjusted assets /Investment for growth
Consolidatednet income
Improve risk-return, cost-return
Total assets
Maintain over around 10% of consolidated Tier I ratio
Dividend payout ratio:more than 20%
Leverage ratio*1
Common Equity*1, 2
Liquidity standard*1
Overhead ratio:less than 50%
Target around 10% of consolidated ROE in the medium term
Aiming for sustainable growth of corporate value through well-balanced growth cycle of profitability, capital base, risk-adjusted assets and investment for growth
*1 To be defined by Basel Committee on Banking Supervision*2 The highest form of loss absorbing capital, consisted mainly of common shares and retained earnings
In Closing- Management Approach for Sustainable Growth -
Allocate / invest risk-adjusted assets to growth business areas
Increase returns to shareholders and enhance capital base
through accumulation of retained earnings

35*1 As of Sep. 30, 10*2 Total voting shares held by SMFG group.
JPY 131 tn
12.32%
Sumitomo Mitsui Financial GroupSumitomo Mitsui Financial Group
JPY 109 tn
JPY 70 tn
JPY 57 tn
approx. 26 mn
40%Sumitomo Mitsui Finance Sumitomo Mitsui Finance and Leasingand Leasing
Japan Research InstituteJapan Research Institute
Nikko Cordial SecuritiesNikko Cordial Securities
SMBC Friend SecuritiesSMBC Friend Securities
SMFG Card & CreditSMFG Card & Credit
Sumitomo Mitsui Sumitomo Mitsui CardCard
CedynaCedyna
PromisePromise
66%
69%
34%
22%
51%
100%
60%
100%
100%
100%
100%(Credit card)
(Securities)
(Leasing)
(System engineering andmanagement consulting, etc)
approx. 124,000
Sumitomo Mitsui Banking CorporationSumitomo Mitsui Banking Corporation
(Consumer finance)
*2
(Ref.) SMFG’s Group Structure*1
ORIX CreditORIX Credit
Sumitomo Sumitomo CorporationCorporation
NTT DOCOMONTT DOCOMO
Consolidated total assets
Consolidated Tier I ratio
Total assets
Deposits
Loans
Number of customer deposit accounts (individual customers)
Number of corporate borrowers

36
This material contains “forward-looking statements” (as defined in the U.S. Private Securities Litigation Reform Act of 1995), regarding the intent, belief or current expectations of us and our managements with respect to our future financial condition and results of operations. In many cases but not all, these statements contain words such as “anticipate”, “estimate”, “expect”, “intend”, “may”, “plan”, “probability”, “risk”, “project”, “should”, “seek”, “target” and similar expressions. Such forward-looking statements are not guarantees of future performance and involve risks and uncertainties, and actual results may differ from those expressed in or implied by such forward-looking statements contained or deemed to be contained herein. The risks and uncertainties which may affect future performance include the fragility of any economic recovery, both globally and in Japan; our ability to successfully implement its business and capital strategy; the success of our business alliances including those in the consumer finance industry; exposure to new risks as we expand the scope of our business; significant credit-related costs; declines in the value of our securities portfolio. Given these and other risks and uncertainties, you should not place undue reliance on forward-looking statements, which speak only as of the date of this material. We undertake no obligation to update or revise any forward-looking statements.
Please refer to our most recent disclosure documents such as our annual report or the registration statement on Form 20-F filed with the U.S. Securities and Exchange Commission, as well as our earnings press release for a more detailed description of the risks and uncertainties that may affect our financial conditions, our operating results, and investors’ decisions.