financial results of october 28th, 2011 asseco south
TRANSCRIPT

Financial results of Asseco South Eastern Group
for Q1-3 2011
October 28th, 2011
for Q1-3 2011

CONTENTSCONTENTS
1. STRATEGY AND BUSINESS UPDATE
2. FINANCIAL UPDATE
3. MERGERS AND ACQUISITIONSQ
4. OUTLOOK AND SUMMARY
5. APPENDIX - DETAILED FINANCIAL DATA
2

OPERATING RESULTS FLAT, BOTTOM LINE BETTEROPERATING RESULTS FLAT, BOTTOM LINE BETTER
mEURQ1-32011
Q1-32010 change
Revenue Total 78,1 75,1 +4% organic growth -10%
Proprietary Sft & Serv 35,8 28,0 +28% organic growth +13%
EBIT 8,9 8,7 +3%
NPAT 9,0 7,8 +16%
organic growth 0%
9,0 7,8 +16%
3
details

RESULTS BETTER THAN LAST YEARRESULTS BETTER THAN LAST YEAR
Financial Statement
` Q3 2011LTM
2010FY change
Revenue Total 115,5 112,5 +2,7% organic growth -7%
Proprietary Sft & Serv 47,8 40,0 +19,6% organic growth +9%
EBIT 13,0 12,8 +2,0%
NPAT 12 1 10 9 +11 4%
organic growth 0%
NPAT 12,1 10,9 +11,4%
4

BUSINESS UPDATEBUSINESS UPDATE
ASEBA Live – Proxima Centauri, Privredna Banka Zagreb Cro
Contact center solutions – Hestia, ZUS Pol
ASEBA SxS – Hrvatska postanska Banka dd. Cro
ASEBA Core Banking – Volksbank Banja Luka,Sarajevo B&H, Razvojna Banka – Ser, Komercjalna Kos
ASEBA AML – Univerzal Banka Ser, IK Banka Zenica B&H
ASEBA iBank solution – Credit Agricole Banka Ser
NACE 2 – Ministry of Transport and Industry Kos
ASEBA Mobile Token Autoritatea RomASEBA Mobile Token – Autoritatea Rom
ASEBA Tezauri Basel II & OpRisk solution – NLB Bank – Ser, RBV Ser
5
CONTENTSCONTENTS
1. STRATEGY AND BUSINESS UPDATE
2. FINANCIAL UPDATE
3. MERGERS AND ACQUISITIONSQ
4. OUTLOOK AND SUMMARY
5. APPENDIX - DETAILED FINANCIAL DATA
6

FINANCIAL UPDATE LTM ‘11 VS FY ‘10
mEUR Q3 '11 LTM FS '10 ∆ % Q3 '11 Q3 '10 ∆ %
FINANCIAL UPDATE LTM 11 VS FY 10
Revenue 115,5 112,5 3% 27,8 27,0 3%
Licence 7,3 7,9 -8% 1,4 1,8 -22%
Maintenance 26,4 21,4 23% 7,1 5,5 29%
Services 14,8 11,3 30% 3,6 2,8 32%, , , ,
TP + Eq. + Infr. 67,1 71,9 -7% 15,7 16,9 -7%
M1 58,3 52,7 11% 14,8 13,2 12%
Licence 7,2 7,9 -9% 1,4 1,8 -23%
M i t 26 2 21 4 23% 7 0 5 5 29%Maintenance 26,2 21,4 23% 7,0 5,5 29%
Services 14,6 11,3 29% 3,6 2,8 31%
TP + Eq. + Infr. 10,3 12,1 -15% 2,8 3,2 -13%
OC + Oper. Activities Balance
45,3 39,9 13% 11,2 9,9 13%
EBIT 13,0 12,8 2% 3,6 3,3 9%
%EBIT 11% 11% -0,07 pp 13% 12% 0,68 pp
Financial and other 1 1* 0 2 0 1 0 5*operations
1,1* 0,2 0,1 0,5*
Income tax -2,0 -2,0 -0,5 -0,6
Net Profit of Asseco SEE 12,1 10,9 11% 3,2 3,3 -4%
7
* more details in appendix

LIKE FOR LIKE (LTM)
70 070.0
M1 1% OC 2%
60.0
70.0
AcquisitionsA i iti
60.0
M1 -1% OC -2%
AcquisitionsA i iti40.0
50.0
LicenceLicence
Acquisitions
40.0
50.0
-10%
Acquisitions
30.0
40.0
MaintenanceMaintenance30.0 +12%
Organic Operations
Organic Operations
10.0
20.0
ServicesServices
10.0
20.0
+16%
0.0Q3 LTM2010 FY
TP + Eq. + Infr.
TP + Eq. + Infr.
0.0Q3 LTM2010 FY
-38%
8
* Licence + Maintenance + Services = Own Sftw. & Serv.; TP + Eq. + Infr. = Third Party Solutions & Services, Equipment
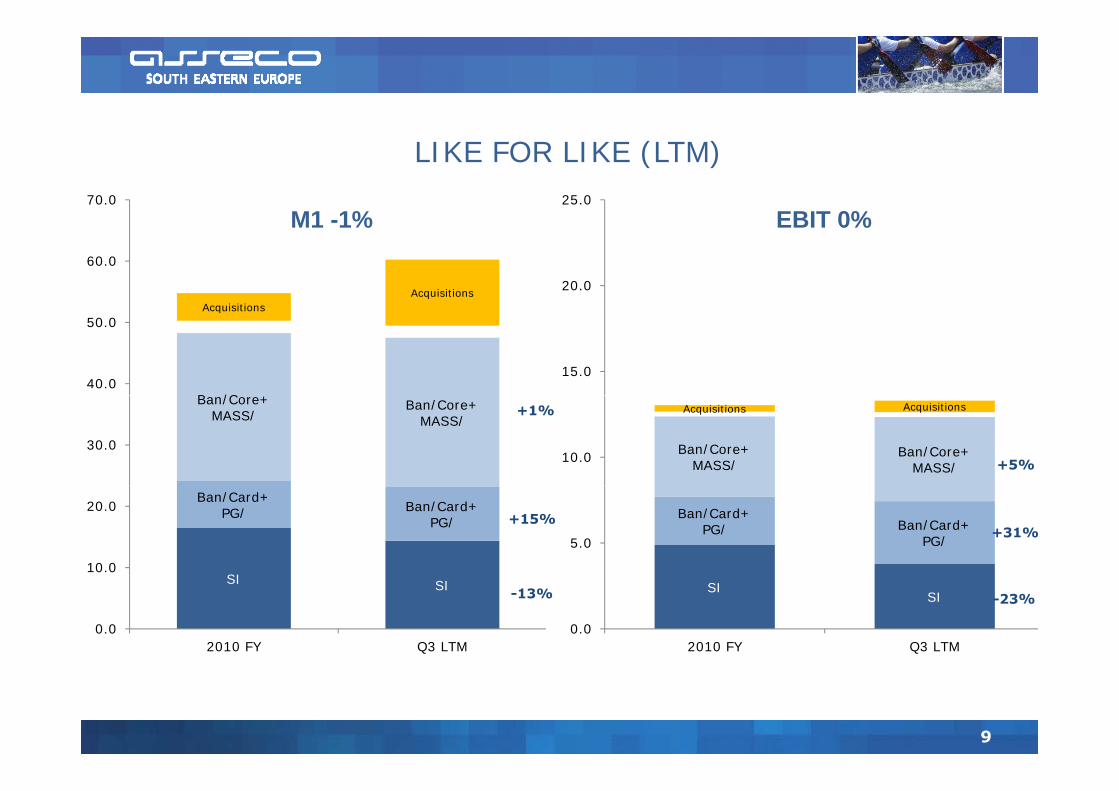
LIKE FOR LIKE (LTM)70.0 25.0
M1 1% EBIT 0%
AcquisitionsAcquisitions
60.0
20.0
M1 -1% EBIT 0%
B /C
Acquisitions
40.0
50.0
15.0
Ban/Core+MASS/
Ban/Core+MASS/
30.0
+1%
Ban/Core+MASS/
Ban/Core+MASS/
AcquisitionsAcquisitions
10.0 +5%
SI
Ban/Card+PG/
Ban/Card+PG/
10.0
20.0+15% Ban/Card+
PG/
Ban/Card+PG/
5.0+31%
SISI
0.0Q3 LTM2010 FY
-13% SISI
0.0Q3 LTM2010 FY
-23%
9

ASSECO SEE GROUP KPI
ASEE GROUP Ban/Core+MASS/
Ban/Card+PG/ Integration
Operational Profitability (EBIT/Revenue) (Q1-3 2011) 11% 18% 17% 5%
Operational Profitability (EBIT/Revenue) (Q1-3 2010) 12% 18% 18% 7%
Maintenance Coverage (Q1-3 2011) 60% 58% 97% 35%
Maintenance Coverage (Q1-3 2010) 52% 53% 107% 36%
10

FINANCIAL UPDATE
FINANCIAL LIQUIDITY
FINANCIAL UPDATE
mPLN (mEUR) Asseco SEE Asseco SEE
Group Short and long term debt 0 -1Cash and cash equivalents 10 84Cash and cash equivalents 10 84
Cash – debt 10(2.5mE) 83(20mE)
Receivables 11 132Liabilities (in cash) -4 -94I t 0 15
1.3 – ASEE Bulgaria
1.2 – provisions of CIT of IPO cost
Inventory 0 15
Operational Balance 17(4mE) 137(34mE)
N h li biliti 0 0
0.5 – Accrued expenses [bonuses]
0.7 – forward settlement
0.3 – Other
Non cash liabilities 0 0
NetDebt to EBIDTA no debt no debt
Quick Ratio 5,18 2,30
11

CONTENTSCONTENTS
1. STRATEGY AND BUSINESS UPDATE
2. FINANCIAL UPDATE
3. MERGERS AND ACQUISITIONSQ
4. OUTLOOK AND SUMMARY
5. APPENDIX - DETAILED FINANCIAL DATA
12

MERGERS AND ACQUISITIONS UP-DATEMERGERS AND ACQUISITIONS UP DATE
Acquisitions Description
ASEE in Turkey Integration of ”Live” with Voice
Stenghtening banking software portfolio
InAct – Anti Froud software development
50% Simt Cardinfo The acquisition completed October 11, 2011
Altius Bulgaria The acquisition completed (PP 319kEUR) October 24,2011
13

Next (9) potential acq. goalsNext (9) potential acq. goals
Discussions with 5 Companies: Croatia (1), Turkey (3),
Simt Cardinfo
Acquired during last 12 months
Active in: Banking & Finance, Public sectors, Health Care
active in: Slovenia, CARD
Altiusactive in: Bulgaria
Markets review
active in: Bulgaria, CARD
Letters sent/First meetings with Companies:
42 Turkey18 B l i18 Bulgaria14 Croatia13 Romania
8 Serbia5 Slovenia

CONTENTSCONTENTS
1. STRATEGY AND BUSINESS UPDATE
2. FINANCIAL UPDATE
3. MERGERS AND ACQUISITIONSQ
4. OUTLOOK AND SUMMARY
5. APPENDIX - DETAILED FINANCIAL DATA
15

IMPROVEMENTS OF BL IN M1 (FY)IMPROVEMENTS OF BL IN M1 (FY)
M1 BL* 2010 2011K
60 0
"Old" 44,1 48,3 9%
"New" 4,0 6,3
TOTAL 48,1 54,5 13%
Acquisitions
Acquisitions
40.0
50.0
60.0
Old OperationsOld Operations20.0
30.0
0.0
10.0
20112010
Rev BL* 2010 2011
"Old" 89,1 83,4 -6%
"New" 6,8 12,3
16
* Backlog as at August 10th for 2011 and as at October 10th for 2010
New 6,8 ,3
TOTAL 95,9 95,8 0%

IMPROVEMENTS OF BL IN M1 (Q4)IMPROVEMENTS OF BL IN M1 (Q4)
M1 BL* 2010 2011Kolumna1
16.0
"Old" 9,2 11,2 23%
"New" 2,4 2,6
TOTAL 11,6 13,8 20%
Acquisitions
Acquisitions10 0
12.0
14.0
16.0
Old OperationsOld Operations
q
4 0
6.0
8.0
10.0
p
0.0
2.0
4.0
20112010
Rev BL* Q4 '10 Q4 '11
"Old" 15,6 16,6 7%
"New" 4,1 4,9
17
* Backlog as at August 10th for 2011 and as at October 10th for 2010
New , ,
TOTAL 19,6 21,5 10%

CONTENTSCONTENTS
1. STRATEGY AND BUSINESS UPDATE
2. FINANCIAL UPDATE
3. MERGERS AND ACQUISITIONSQ
4. OUTLOOK AND SUMMARY
5. APPENDIX - DETAILED FINANCIAL DATA
18

BASIC DEFINITIONSBASIC DEFINITIONSM1 [Margin 1] = Revenues – Cost of Goods SoldBL [Backlog] (Value of contracts already signed)Operating Profitability = EBIT/RevenuesMaintenance coverage = Maintenance Revenues/Own CostOwn S&S [own software and services]Proprietary Sft & Serv [own software and services]LTM [last twelve months]FY [full year]Old Operations – without acquisitionsNew Operations – new acquired companies in 2010 ITD, EST, BDS and 50% Cardinfo BDSOrganic Growth – it means operational growth/loss [by acquisitions only change between current and ProForma results is treated as oragnic growth]EBIT Margin = EBIT/RevenuesEBIT Margin EBIT/RevenuesQuick Ratio = (Receiveables + Cash and Cash Equivalents)/Current liabilities
Exchange Rates [EUR/PLN]:2011 Q1-3 - 3,96732010 Q1 3 4 00422010 Q1-3 - 4,0042
mEUR – million EUR (in whole presentation, amounts are in mE unless is stated differently)mPLN – million PLN
19

ASSECO SEE GROUP Q1-3 ‘11 RESULTS COMPANIES AND REGIONAL REVENUE AND EBIT CONTRIBUTION Q1 3 ‘11*
kEUR RevenueQ1-3 '11
RevenueQ1-3 '10 Change % Diff EBIT
Q1-3 '11EBIT
Q1-3 '10 Change % Diff NPATQ1-3 '11
NPATQ1-3 '10 Change
Alb 345 282 63 22% 8 -5 13 -260% 10 -13 23
COMPANIES AND REGIONAL REVENUE AND EBIT CONTRIBUTION – Q1-3 ‘11*
Alb 345 282 63 22% 8 -5 13 -260% 10 -13 23
B&H 2 603 2 197 406 18% 492 495 -3 -1% 455 444 11
Bul 543 236 307 130% 127 54 73 135% 118 44 74
Cro 10 514 5 183 5 331 103% 1 229 666 563 85% 1 003 499 504
Kos 2 484 2 850 -366 -13% 189 95 94 99% 173 78 95
Mac 9 323 14 779 -5 456 -37% 1 140 2 093 -953 -46% 1 072 1 639 -567
Mon 1 287 909 378 42% 275 214 61 29% 255 191 64
Pol 1 215 814 401 49% 181 94 87 93% 1 134 445 689
Rom 23 113 25 635 -2 522 -10% 2 030 2 205 -175 -8% 1 858 2 075 -217
Ser 19 323 19 763 440 2% 2 312 2 483 171 7% 1 989 2 104 115Ser 19 323 19 763 -440 -2% 2 312 2 483 -171 -7% 1 989 2 104 -115
Slo 930 847 83 10% 52 26 26 100% 41 18 23
Tur 6 406 1 583 4 823 305% 900 255 645 253% 885 231 654
Asseco SEE Group 78 086 75 078 3 008 4% 8 935 8 675 260 3% 8 993 7 755 1 238
EBITRevenue
Cro1 229
Mac
Rom2,030
Ser2,312
EBITQ1-3 '11
Alb 0% (0%)
B&H 3% (3%)
Bul 1% (0%)Ser 25% (27%)
Slo 1% (1%) Tur 8% (2%)
RevenueQ1-3 '11
Alb8
B&H492 Bul
127
1,229
Kos189
1,140
Mon275
Pol181
Slo52
Tur900Cro 13% (7%)
Kos 3% (4%)
Mac 12%Rom 30%
20
* All data in EUR thousands; ** in brackets 2010 splitback
Mac 12%(20%)
Mon 2% (1%)Pol 2% (1%)
(34%)

ASSECO SEE GROUP Q1-3 ‘11 RESULTSCOMPANIES AND REGIONAL REVENUE AND EBIT CONTRIBUTION Q1 3 ‘11*COMPANIES AND REGIONAL REVENUE AND EBIT CONTRIBUTION – Q1-3 ‘11*
kEUR RevenueQ1-3 '11
RevenueQ1-3 '10 Change EBIT
Q1-3 '11EBIT
Q1-3 '10 Change Ban/Core+
MASS/
Revenue per BUs HY '11
Banking 37 550 30 804 6 746 6 720 5 536 1 183
Ban/Core+MASS/ 20 067 20 243 -176 3 818 3 611 207
Ban/Card+PG/ 17 483 10 562 6 921 2 902 1 925 976
MASS/ 26% (27%)
Integration 52% (59%)
Ban/Card+PG/ 17 483 10 562 6 921 2 902 1 925 976
Integration 40 536 44 273 -3 737 2 215 3 139 -924
Asseco SEE Group 78 086 75 078 3 008 8 935 8 675 260
Ban/Card+PG/ 22% (14%)
Integration 25% (36%)
EBIT contribution HY '11
6 000
7,000
8,000kEUR
EBIT contribution HY '11Integration
Ban/Core+MASS/
43% (42%)
25% (36%)
2,902
3,000
4,000
5,000
6,000
Ban/Card+PG/
Ban/Core+MASS/
Ban/Card+PG/ 32%
3,818
2,215
0
1,000
2,000
Banking Integration
21
* All data in EUR thousands; ** in brackets 2010 split
(22%)g g

ASSECO SEE GROUP Q1-3 ‘11 RESULTS (FINANCIAL STATEMENT) CONSOLIDATED Q1 3 ‘11 SALES STRUCTURE (REVENUE)CONSOLIDATED Q1-3 ‘11 SALES STRUCTURE (REVENUE)
Market Segments*Products*
Own Software and Services35 829 / 46% / 28%
Public administration
9 349 / 12% / 25%
Third party software
/ /
TOTAL78 026
TOTAL78 026
p yand services
15 212 / 19%/ -26%
Industry19 811 / 25% / -15%
Equipment and Infrastructure27 044 / 35%/ -12% Finance
48 925 / 63% / +11%
22
* All data in EUR thousands / % in total Q1-3 2011 sales / % change to Q1-3 2010 sales

ASSECO SEE GROUP Q1-3 ‘11 RESULTSCONSOLIDATED Q1 3 ‘11 EMPLOYEE STRUCTURE
SerbiaEmployment by BU* Employment by Country*
CONSOLIDATED Q1-3 ‘11 EMPLOYEE STRUCTURE
Serbia450 / 37%
Romania190 / 16%
Croatia
Ban/Core+MASS/528 / 44%
Croatia163 / 14%
Macedonia130 / 11%
Ban/Card+PG/296/ 25%
Turkey84 / 7%
Kosovo78 / 6%
TOTAL1 205
TOTAL1 205
B&H44 / 4%
Poland*24 / 2%
B l i
Integration381 / 32%
Bulgaria17 / 1%
Slovenia11 / 1%
Albania8 / 1%8 / 1%
Montenegro7 / 1%
23
* Polish part of Turkish business** ASEE Holdco divided between countries based on employment key

EBIT HIGHER THAN LAST YEAR Q3EBIT HIGHER THAN LAST YEAR Q3
` Q3 '11A Q3 '10 '11vs'10 Growth
Revenue Total 27,8 27,0 +3,1% organic growth* -4%
Proprietary Sft & Serv 12,1 10,0 +20,5% organic growth* +13%
EBIT 3,6 3,3 +8,9%
NPAT 3 2 3 3 -3 8%
organic growth* +14%
NPAT 3,2 3,3 3,8%
24
* Growth calculated excluding new acquired companies ITD, EST , BDS and 50% Cardinfo BDS

WHERE DO WE WANT TO BE – CURRENT STATUSStrategic goals
G i d fi
WHERE DO WE WANT TO BE CURRENT STATUS
mEUR Q1-3 '11 Q1-3 '10 GrowthRev 78,1 75,1 4%EBIT 8 9 8 7 3%- Grow in revenues and profits
- Increase own competencies and thus ASEE value added – share of own solutions and services
EBIT 8,9 8,7 3%
solutions and services
Increase security of our business level of reocccuring revenues
mEUR Q1-3 '11 Q1-3 '10 GrowthOwn S&S 35,8 28,0 28%Share[Rev] 46% 37% 8,6pp
- Increase security of our business – level of reocccuring revenues
mEUR Q1-3 '11 Q1-3 '10 GrowthMaintenance 20 2 15 3 32%
-Be present on all ASEE markets – geographic expansion (Albania
Maintenance 20,2 15,3 32%Coverage 60% 56% 4,0pp
Be present on all ASEE markets geographic expansion (Albania, Bulgaria, Moldavia, Slovenia, Poland)
Q1-3 '11
25
mEUR Q1-3 '11Q1 3 11
org Q1-3 '10M1 1,54 0,83 0,82

FINANCIAL UPDATE Q1-3 ‘11 VS ’10FINANCIAL UPDATE Q1 3 11 VS 10
Q1‐3.2010 Q1‐3.2011 Q3.2010 Q3.2011
FS EBIT 8,68 8,94 3,31 3,60
FS NPAT 7,76 8,99 3,30 3,17
Total of one‐off's ‐0,38 ‐1,03 ‐0,38
l f l b l f h frevaluation of liability for purchase of EST ‐0,38 ‐0,85 ‐0,38
revaluation of liability for purchase of BDS ‐0,18
One Off Adjusted NPAT 7 37 7 96 2 92 3 17One‐Off Adjusted NPAT 7,37 7,96 2,92 3,17
118% 112% 113% 114%
26