financial results presentation for the first quarter fy2019
TRANSCRIPT
Copyright (C) Seven & i Holdings Co., Ltd. All Rights Reserved.
July 5, 2018
Seven & i Holdings Co., Ltd.
1
Financial Results Presentation for the First Quarter FY2019
Copyright (C) Seven & i Holdings Co., Ltd. All Rights Reserved.
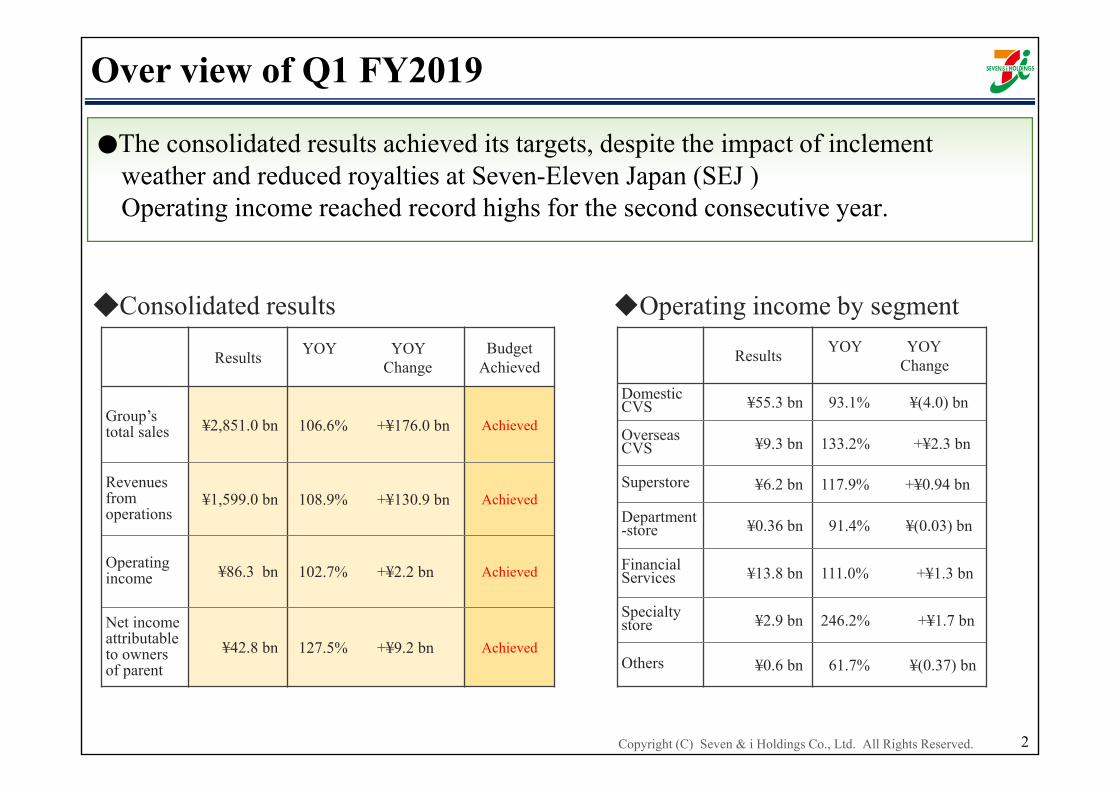
Over view of Q1 FY2019
2
Results YOY YOY Change
BudgetAchieved
Group’s total sales ¥2,851.0 bn 106.6% +¥176.0 bn Achieved
Revenuesfrom operations
¥1,599.0 bn 108.9% +¥130.9 bn Achieved
Operatingincome ¥86.3 bn 102.7% +¥2.2 bn Achieved
Net income attributableto ownersof parent
¥42.8 bn 127.5% +¥9.2 bn Achieved
◆Consolidated results ◆Operating income by segment
Results YOY YOY Change
DomesticCVS ¥55.3 bn 93.1% ¥(4.0) bn
OverseasCVS ¥9.3 bn 133.2% +¥2.3 bn
Superstore ¥6.2 bn 117.9% +¥0.94 bn
Department-store ¥0.36 bn 91.4% ¥(0.03) bn
FinancialServices ¥13.8 bn 111.0% +¥1.3 bn
Specialtystore ¥2.9 bn 246.2% +¥1.7 bn
Others ¥0.6 bn 61.7% ¥(0.37) bn
●The consolidated results achieved its targets, despite the impact of inclement weather and reduced royalties at Seven-Eleven Japan (SEJ )Operating income reached record highs for the second consecutive year.
Copyright (C) Seven & i Holdings Co., Ltd. All Rights Reserved.
Seven-Eleven JapanSEJ
3
Copyright (C) Seven & i Holdings Co., Ltd. All Rights Reserved. 4
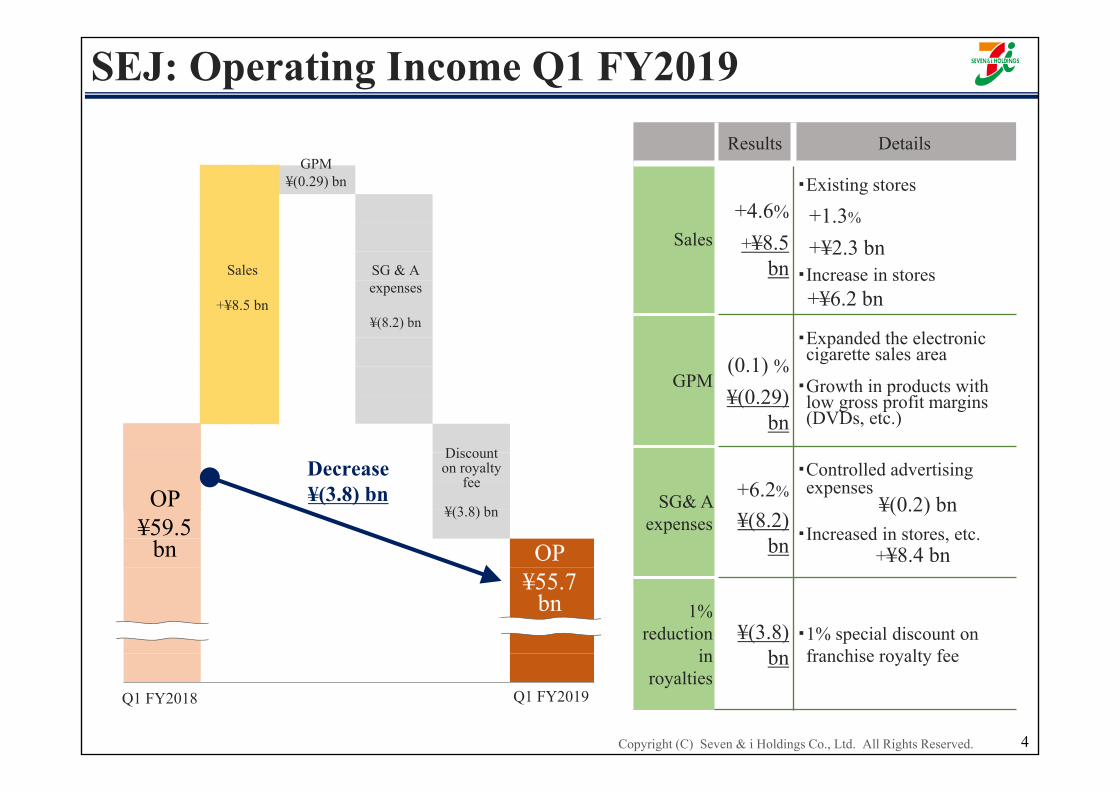
SEJ: Operating Income Q1 FY2019
Q1 FY2018
OP ¥59.5
bn
GPM¥(0.29) bn
Q1 FY2019
SG & A expenses
¥(8.2) bn
Discount on royalty
fee
¥(3.8) bn
Sales
+¥8.5 bn
Results Details
Sales+4.6%
+¥8.5 bn
・Existing stores
+1.3%
+¥2.3 bn・Increase in stores+¥6.2 bn
GPM(0.1) %¥(0.29)
bn
・Expanded the electronic cigarette sales area
・Growth in products withlow gross profit margins(DVDs, etc.)
SG& A expenses
+6.2%
¥(8.2) bn
・Controlled advertisingexpenses
¥(0.2) bn・Increased in stores, etc.
+¥8.4 bn
1% reduction
in royalties
¥(3.8) bn
・1% special discount on franchise royalty fee
OP¥55.7
bn
Decrease¥(3.8) bn
Copyright (C) Seven & i Holdings Co., Ltd. All Rights Reserved.
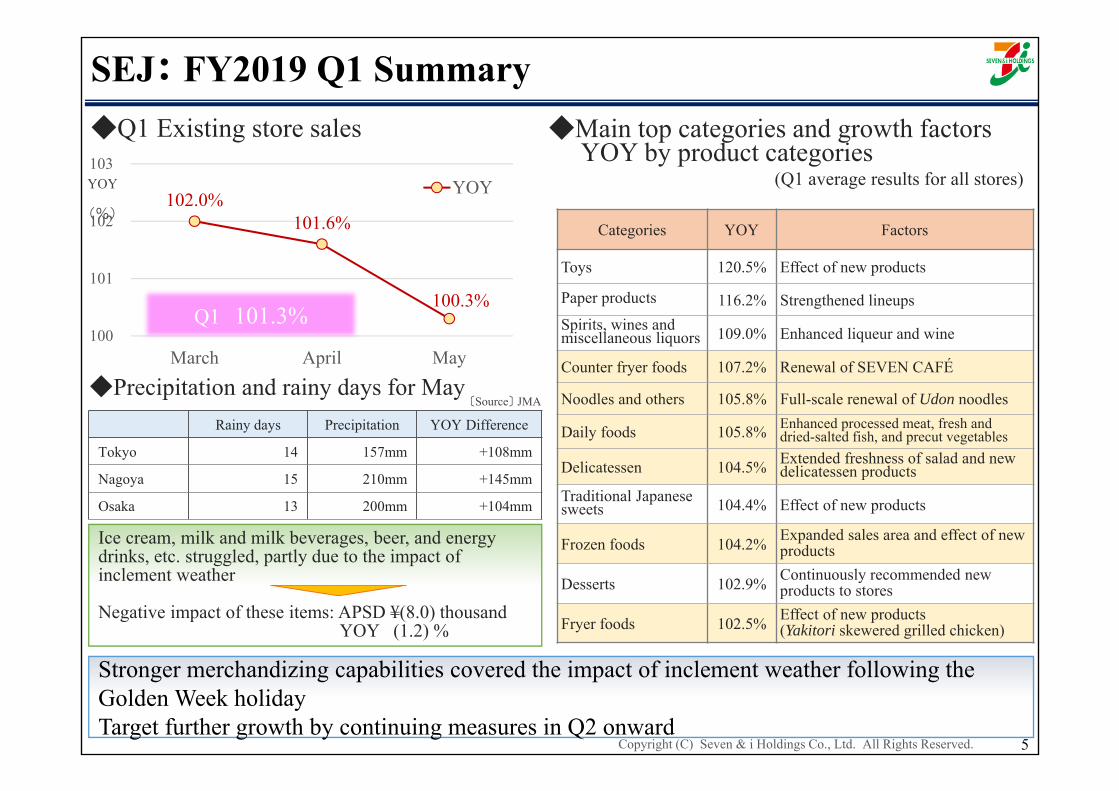
Stronger merchandizing capabilities covered the impact of inclement weather following the Golden Week holidayTarget further growth by continuing measures in Q2 onward
Rainy days Precipitation YOY Difference
Tokyo 14 157mm +108mm
Nagoya 15 210mm +145mm
Osaka 13 200mm +104mm
SEJ: FY2019 Q1 Summary
5
Categories YOY Factors
Toys 120.5% Effect of new products
Paper products 116.2% Strengthened lineupsSpirits, wines and miscellaneous liquors 109.0% Enhanced liqueur and wine
Counter fryer foods 107.2% Renewal of SEVEN CAFÉ
Noodles and others 105.8% Full-scale renewal of Udon noodles
Daily foods 105.8% Enhanced processed meat, fresh and dried-salted fish, and precut vegetables
Delicatessen 104.5% Extended freshness of salad and new delicatessen products
Traditional Japanese sweets 104.4% Effect of new products
Frozen foods 104.2% Expanded sales area and effect of new products
Desserts 102.9% Continuously recommended new products to stores
Fryer foods 102.5% Effect of new products(Yakitori skewered grilled chicken)
◆Q1 Existing store sales
102.0%101.6%
100.3%
100
101
102
103
March April May
YOY
◆Main top categories and growth factors YOY by product categories
(Q1 average results for all stores)YOY
(%)
Q1 101.3%
◆Precipitation and rainy days for May〔Source〕 JMA
Ice cream, milk and milk beverages, beer, and energy drinks, etc. struggled, partly due to the impact of inclement weather
Negative impact of these items: APSD ¥(8.0) thousandYOY (1.2) %
Copyright (C) Seven & i Holdings Co., Ltd. All Rights Reserved.
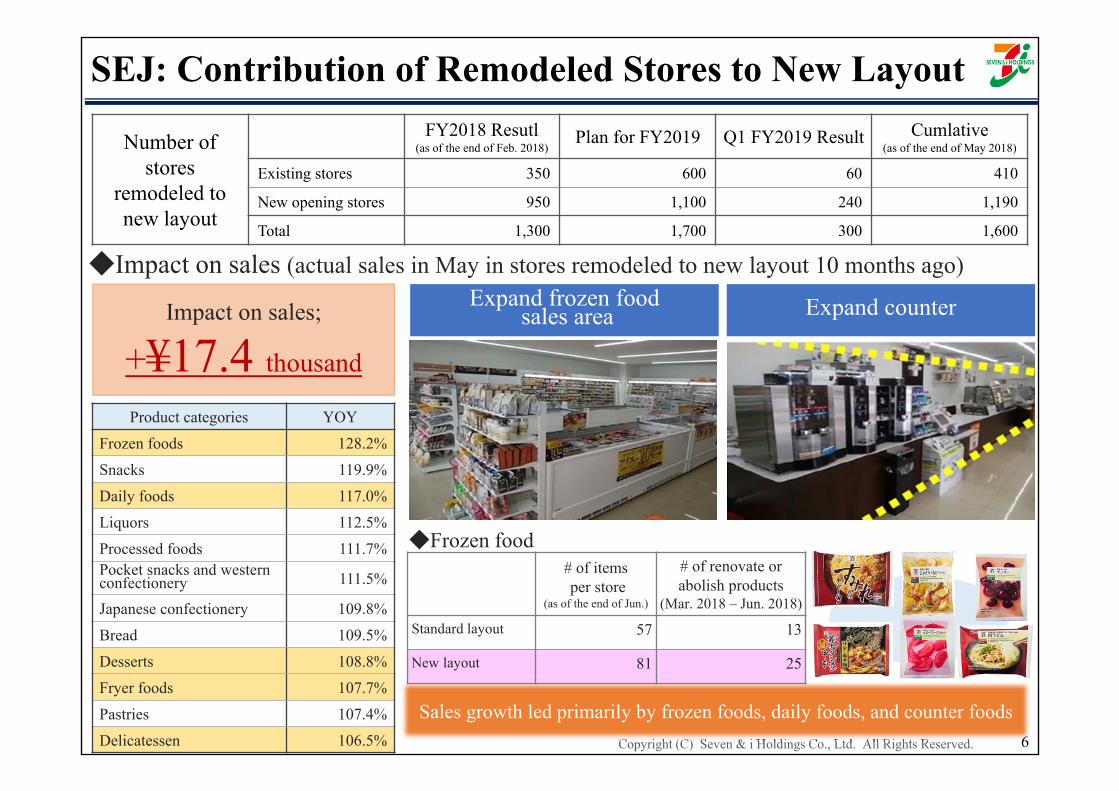
Impact on sales;
+¥17.4 thousand
SEJ: Contribution of Remodeled Stores to New Layout
◆Impact on sales (actual sales in May in stores remodeled to new layout 10 months ago)
Product categories YOY
Frozen foods 128.2%
Snacks 119.9%
Daily foods 117.0%
Liquors 112.5%
Processed foods 111.7%Pocket snacks and western confectionery 111.5%
Japanese confectionery 109.8%
Bread 109.5%
Desserts 108.8%
Fryer foods 107.7%
Pastries 107.4%
Delicatessen 106.5%
Expand frozen foodsales area Expand counter
Sales growth led primarily by frozen foods, daily foods, and counter foods
Number of stores
remodeled to new layout
FY2018 Resutl(as of the end of Feb. 2018)
Plan for FY2019 Q1 FY2019 Result Cumlative(as of the end of May 2018)
Existing stores 350 600 60 410
New opening stores 950 1,100 240 1,190
Total 1,300 1,700 300 1,600
◆Frozen food
6
# of itemsper store
(as of the end of Jun.)
# of renovate or abolish products
(Mar. 2018 – Jun. 2018)
Standard layout 57 13
New layout 81 25
Copyright (C) Seven & i Holdings Co., Ltd. All Rights Reserved.
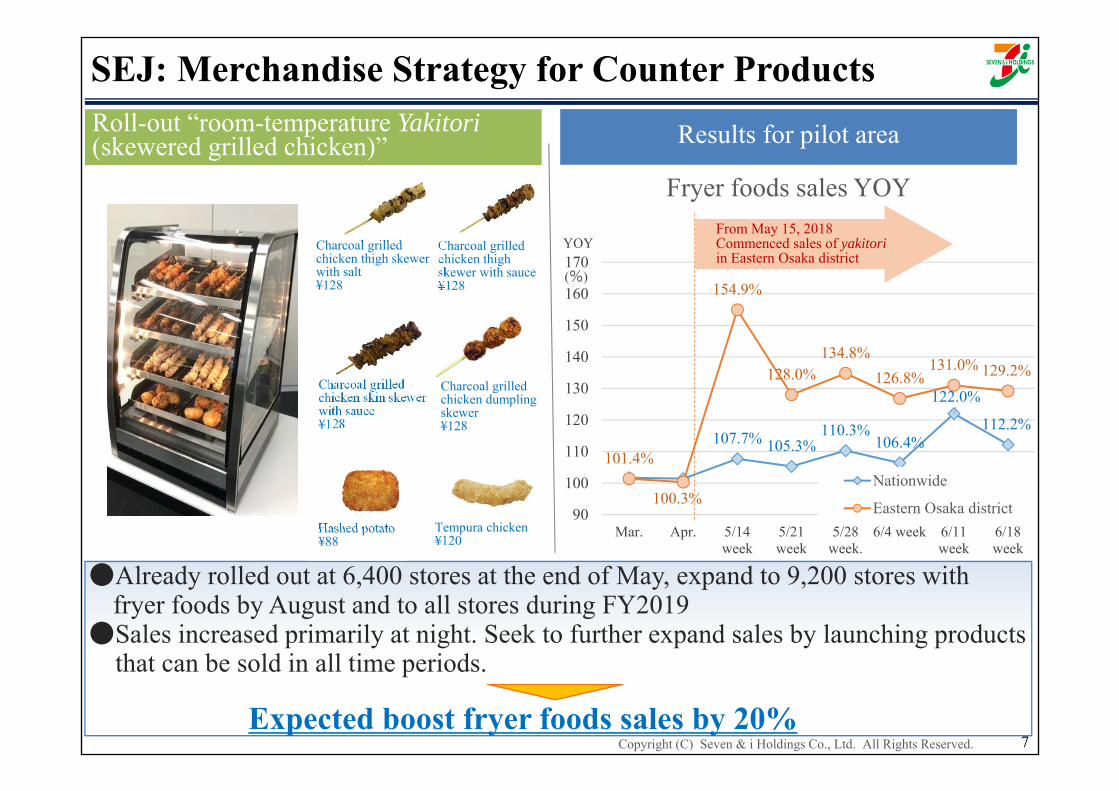
107.7% 105.3%110.3%
106.4%
122.0%
112.2%
101.4%
100.3%
154.9%
128.0%134.8%
126.8%131.0% 129.2%
90
100
110
120
130
140
150
160
170
Mar. Apr. 5/14week
5/21week
5/28week.
6/4 week 6/11week
6/18week
フライヤー前年⽐推移
Nationwide
Eastern Osaka district
7
●Already rolled out at 6,400 stores at the end of May, expand to 9,200 stores with fryer foods by August and to all stores during FY2019
●Sales increased primarily at night. Seek to further expand sales by launching products that can be sold in all time periods.
Expected boost fryer foods sales by 20%
Charcoal grilled chicken thigh skewer with sauce¥128
Charcoal grilled chicken thigh skewer with salt¥128
Hashed potato¥88
Roll-out “room-temperature Yakitori(skewered grilled chicken)”
Charcoal grilled chicken skin skewer with sauce¥128
Charcoal grilled chicken dumpling skewer¥128
Tempura chicken¥120
Fryer foods sales YOY
Results for pilot area
SEJ: Merchandise Strategy for Counter Products
From May 15, 2018Commenced sales of yakitori in Eastern Osaka district
YOY
(%)
Copyright (C) Seven & i Holdings Co., Ltd. All Rights Reserved.
SEJ: Franchised Stores Revenues and Market Share Following the 1% Discount on Royalty Fees
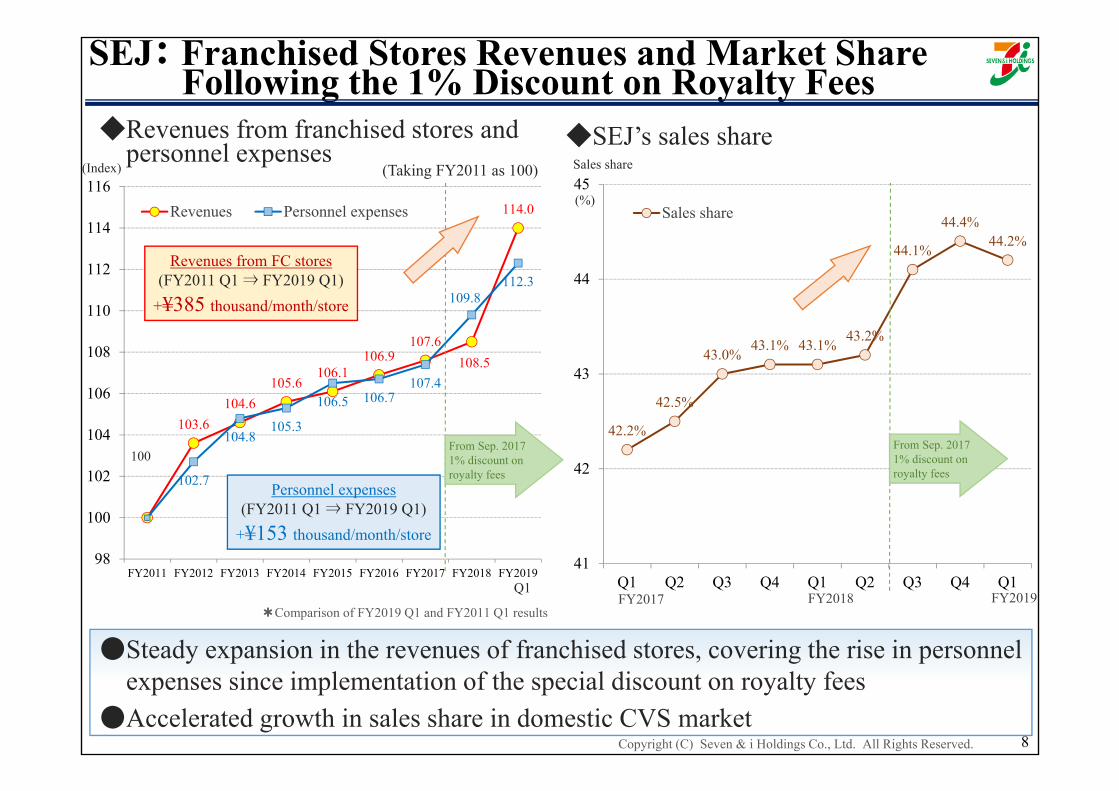
◆Revenues from franchised stores and personnel expenses
(Taking FY2011 as 100)
8
42.2%
42.5%
43.0% 43.1% 43.1% 43.2%
44.1%
44.4%44.2%
41
42
43
44
45
Q1 Q2 Q3 Q4 Q1 Q2 Q3 Q4 Q1
Sales share
◆SEJ’s sales share
FY2017 FY2018 FY2019Q1
(%)
Sales share
103.6 104.6
105.6 106.1
106.9 107.6
108.5
114.0
102.7
104.8105.3
106.5 106.7107.4
109.8112.3
98
100
102
104
106
108
110
112
114
116
FY2011 FY2012 FY2013 FY2014 FY2015 FY2016 FY2017 FY2018 FY2019
Revenues Personnel expenses
From Sep. 20171% discount on royalty fees
*Comparison of FY2019 Q1 and FY2011 Q1 results
Revenues from FC stores(FY2011 Q1 ⇒ FY2019 Q1)
+¥385 thousand/month/store
Personnel expenses(FY2011 Q1 ⇒ FY2019 Q1)
+¥153 thousand/month/store
100
(Index)
●Steady expansion in the revenues of franchised stores, covering the rise in personnel expenses since implementation of the special discount on royalty fees
●Accelerated growth in sales share in domestic CVS market
From Sep. 20171% discount on royalty fees
Copyright (C) Seven & i Holdings Co., Ltd. All Rights Reserved.
7-Eleven, Inc.SEI
9
Copyright (C) Seven & i Holdings Co., Ltd. All Rights Reserved.
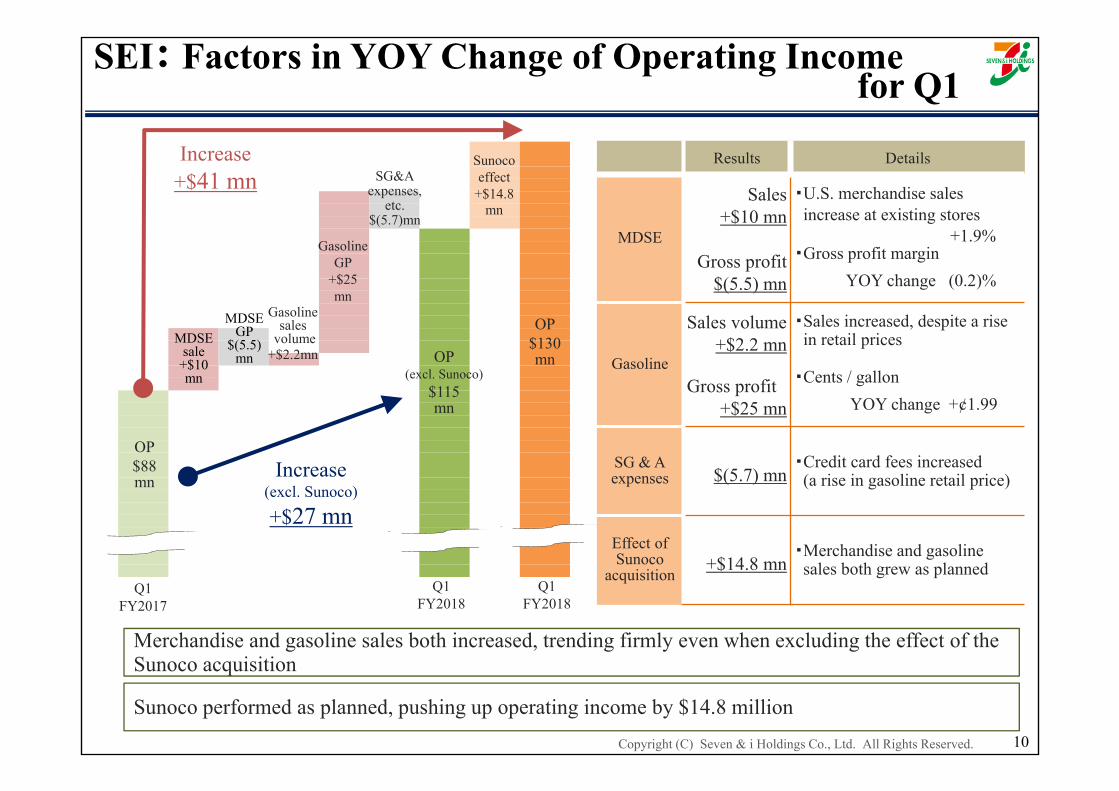
SEI: Factors in YOY Change of Operating Income for Q1
10
Increase(excl. Sunoco)
+$27 mn
Sunocoeffect
+$14.8mn
Q1FY2017
Q1FY2018
Q1FY2018
Increase+$41 mn
Merchandise and gasoline sales both increased, trending firmly even when excluding the effect of the Sunoco acquisition
Sunoco performed as planned, pushing up operating income by $14.8 million
Results Details
MDSE
Sales+$10 mn
Gross profit$(5.5) mn
・U.S. merchandise sales increase at existing stores
+1.9%・Gross profit margin
YOY change (0.2)%
Gasoline
Sales volume+$2.2 mn
Gross profit+$25 mn
・Sales increased, despite a rise in retail prices
・Cents / gallonYOY change +¢1.99
SG & Aexpenses $(5.7) mn
・Credit card fees increased(a rise in gasoline retail price)
Effect of Sunoco
acquisition +$14.8 mn・Merchandise and gasoline sales both grew as planned
OP$88mn
OP(excl. Sunoco)
$115mn
OP$130mn
SG&Aexpenses,
etc.$(5.7)mn
GasolineGP
+$25mn
Gasolinesales
volume+$2.2mn
MDSEGP
$(5.5)mn
MDSEsale
+$10mn
Copyright (C) Seven & i Holdings Co., Ltd. All Rights Reserved.
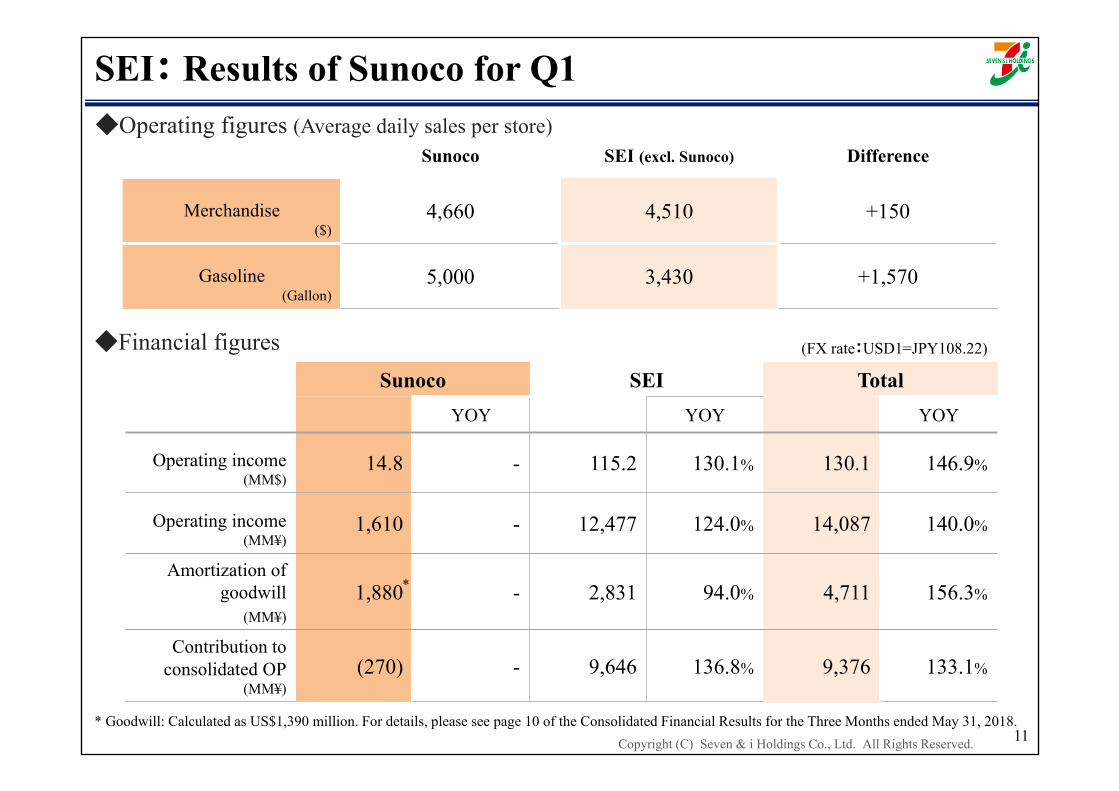
SEI: Results of Sunoco for Q1
Sunoco SEI (excl. Sunoco) Difference
Merchandise($)
4,660 4,510 +150
Gasoline(Gallon)
5,000 3,430 +1,570
◆Operating figures (Average daily sales per store)
◆Financial figures
11
(FX rate:USD1=JPY108.22)
Sunoco SEI TotalYOY YOY YOY
Operating income(MM$)
14.8 - 115.2 130.1% 130.1 146.9%
Operating income(MM¥)
1,610 - 12,477 124.0% 14,087 140.0%
Amortization of goodwill
(MM¥)1,880 - 2,831 94.0% 4,711 156.3%
Contribution to consolidated OP
(MM¥)(270) - 9,646 136.8% 9,376 133.1%
* Goodwill: Calculated as US$1,390 million. For details, please see page 10 of the Consolidated Financial Results for the Three Months ended May 31, 2018.
*
Copyright (C) Seven & i Holdings Co., Ltd. All Rights Reserved.
Ito-YokadoIY
12
Copyright (C) Seven & i Holdings Co., Ltd. All Rights Reserved. 13
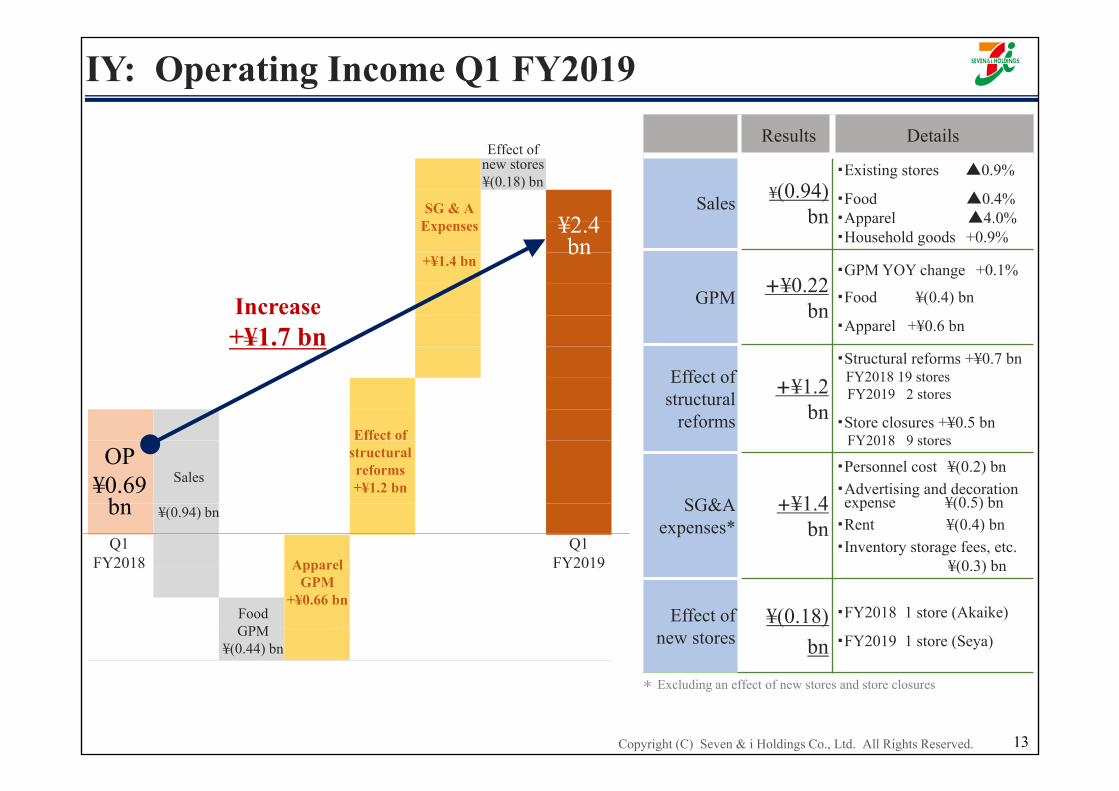
Results Details
Sales ¥(0.94)bn
・Existing stores ▲0.9%
・Food ▲0.4%・Apparel ▲4.0%・Household goods +0.9%
GPM +¥0.22bn
・GPM YOY change +0.1%
・Food ¥(0.4) bn
・Apparel +¥0.6 bn
Effect of structural
reforms
+¥1.2bn
・Structural reforms +¥0.7 bnFY2018 19 storesFY2019 2 stores
・Store closures +¥0.5 bnFY2018 9 stores
SG&Aexpenses*
+¥1.4 bn
・Personnel cost ¥(0.2) bn・Advertising and decoration expense ¥(0.5) bn・Rent ¥(0.4) bn・Inventory storage fees, etc.
¥(0.3) bn
Effect of new stores
¥(0.18) bn
・FY2018 1 store (Akaike)
・FY2019 1 store (Seya)
IY: Operating Income Q1 FY2019
Increase+¥1.7 bn +27
億円
* Excluding an effect of new stores and store closures
OP ¥0.69
bnQ1
FY2018 Q1
FY2019
Sales
¥(0.94) bn
¥2.4bn
FoodGPM
¥(0.44) bn
ApparelGPM
+¥0.66 bn
Effect of structuralreforms+¥1.2 bn
SG & A Expenses
+¥1.4 bn
Effect of new stores¥(0.18) bn
Copyright (C) Seven & i Holdings Co., Ltd. All Rights Reserved.
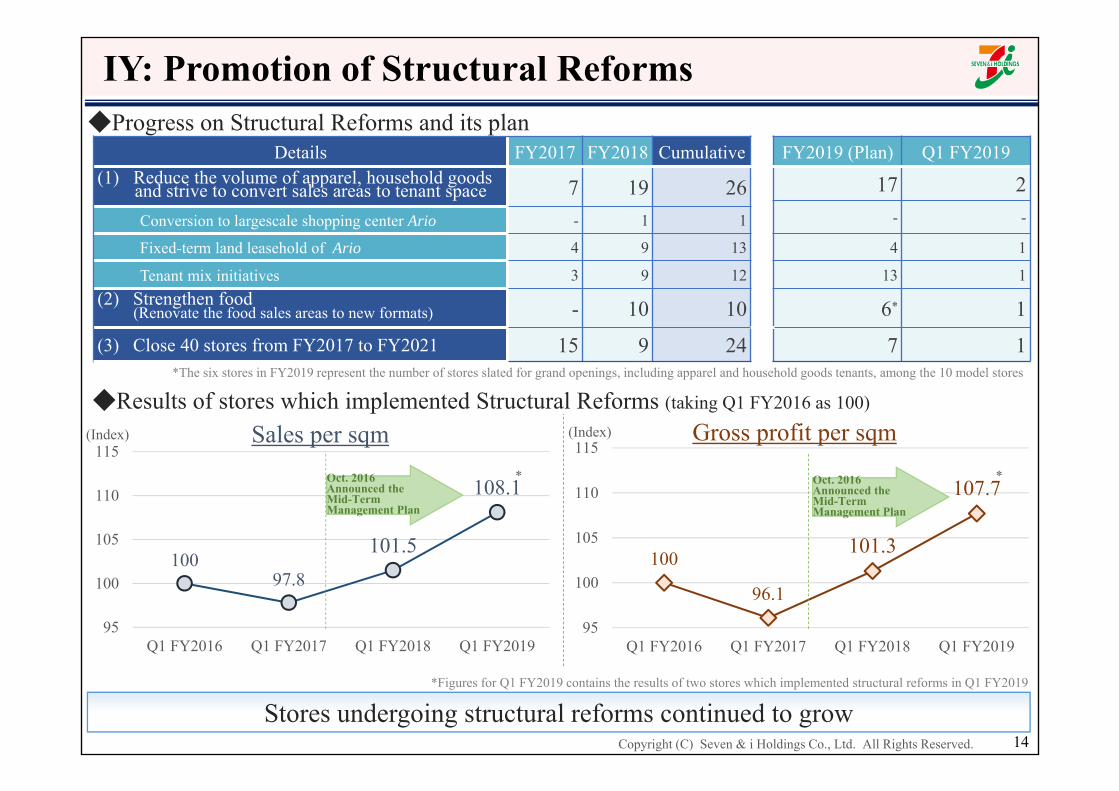
Stores undergoing structural reforms continued to grow14
100
96.1
101.3
107.7
95
100
105
110
115
Q1 FY2016 Q1 FY2017 Q1 FY2018 Q1 FY2019
Gross profit per sqm
10097.8
101.5
108.1
95
100
105
110
115
Q1 FY2016 Q1 FY2017 Q1 FY2018 Q1 FY2019
Sales per sqm
IY: Promotion of Structural Reforms
Details FY2017 FY2018 Cumulative FY2019 (Plan) Q1 FY2019(1) Reduce the volume of apparel, household goods
and strive to convert sales areas to tenant space 7 19 26 17 2- -Conversion to largescale shopping center Ario - 1 1
Fixed-term land leasehold of Ario 4 9 13 4 1
Tenant mix initiatives 3 9 12 13 1(2) Strengthen food
(Renovate the food sales areas to new formats) - 10 10 6* 1
(3) Close 40 stores from FY2017 to FY2021 15 9 24 7 1
◆Results of stores which implemented Structural Reforms (taking Q1 FY2016 as 100)
(Index)
*The six stores in FY2019 represent the number of stores slated for grand openings, including apparel and household goods tenants, among the 10 model stores
* *
*Figures for Q1 FY2019 contains the results of two stores which implemented structural reforms in Q1 FY2019
Oct. 2016Announced the Mid-Term Management Plan
◆Progress on Structural Reforms and its plan
(Index)
Oct. 2016Announced the Mid-Term Management Plan
Copyright (C) Seven & i Holdings Co., Ltd. All Rights Reserved. 15
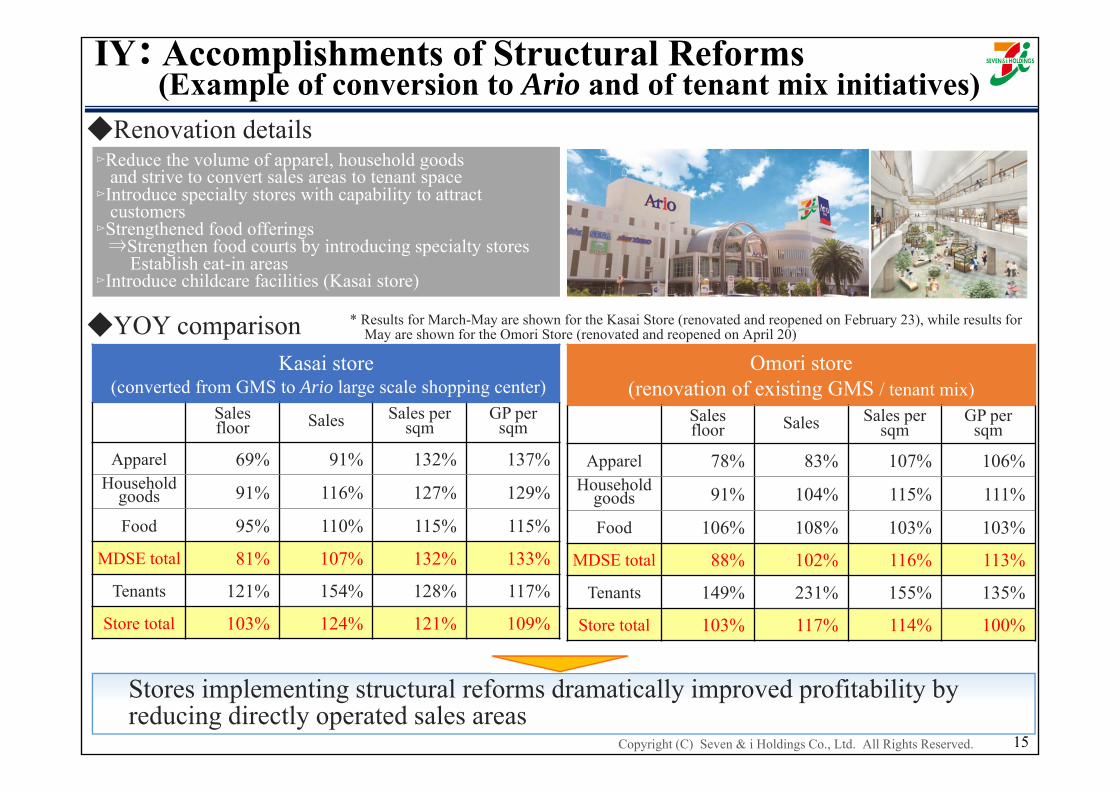
IY: Accomplishments of Structural Reforms(Example of conversion to Ario and of tenant mix initiatives)
Kasai store(converted from GMS to Ario large scale shopping center)
Sales floor Sales Sales per
sqmGP per
sqm
Apparel 69% 91% 132% 137%Household
goods 91% 116% 127% 129%
Food 95% 110% 115% 115%
MDSE total 81% 107% 132% 133%
Tenants 121% 154% 128% 117%
Store total 103% 124% 121% 109%
◆Renovation details▻Reduce the volume of apparel, household goods
and strive to convert sales areas to tenant space▻Introduce specialty stores with capability to attract
customers▻Strengthened food offerings⇒Strengthen food courts by introducing specialty stores
Establish eat-in areas ▻Introduce childcare facilities (Kasai store)
◆YOY comparison
Stores implementing structural reforms dramatically improved profitability by reducing directly operated sales areas
Omori store(renovation of existing GMS / tenant mix)
Sales floor Sales Sales per
sqmGP per
sqm
Apparel 78% 83% 107% 106%Household
goods 91% 104% 115% 111%
Food 106% 108% 103% 103%
MDSE total 88% 102% 116% 113%
Tenants 149% 231% 155% 135%
Store total 103% 117% 114% 100%
* Results for March-May are shown for the Kasai Store (renovated and reopened on February 23), while results forMay are shown for the Omori Store (renovated and reopened on April 20)
Copyright (C) Seven & i Holdings Co., Ltd. All Rights Reserved. 16
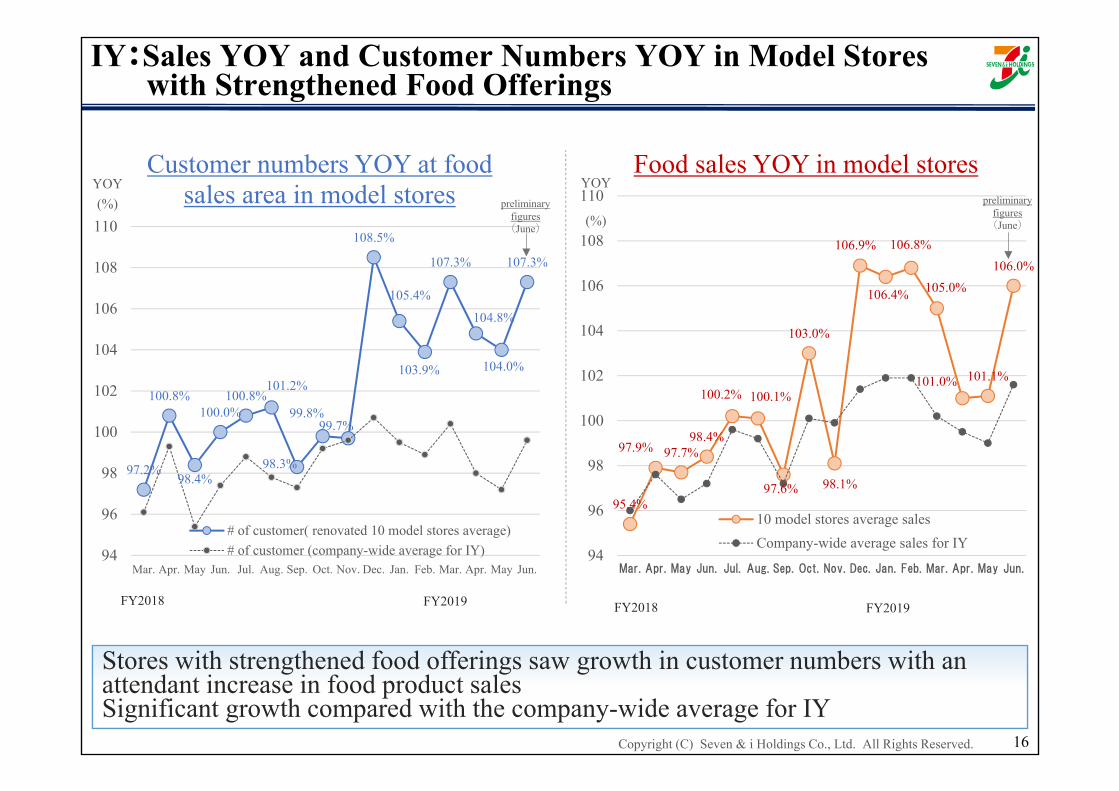
Stores with strengthened food offerings saw growth in customer numbers with an attendant increase in food product salesSignificant growth compared with the company-wide average for IY
97.2%
100.8%
98.4%
100.0%100.8%
101.2%
98.3%
99.8%99.7%
108.5%
105.4%
103.9%
107.3%
104.8%
104.0%
107.3%
94
96
98
100
102
104
106
108
110
Mar. Apr. May Jun. Jul. Aug. Sep. Oct. Nov. Dec. Jan. Feb. Mar. Apr. May Jun.
Customer numbers YOY at food sales area in model stores
# of customer( renovated 10 model stores average)# of customer (company-wide average for IY)
YOY(%)
95.4%
97.9% 97.7%98.4%
100.2% 100.1%
97.6%
103.0%
98.1%
106.9%
106.4%
106.8%
105.0%
101.0% 101.1%
106.0%
94
96
98
100
102
104
106
108
110
Mar. Apr. May Jun. Jul. Aug. Sep. Oct. Nov. Dec. Jan. Feb. Mar. Apr. May Jun.
Food sales YOY in model stores
10 model stores average salesCompany-wide average sales for IY
YOY
(%)
FY2018 FY2019 FY2018 FY2019
IY:Sales YOY and Customer Numbers YOY in Model Storeswith Strengthened Food Offerings
preliminary figures(June)
preliminary figures(June)
Copyright (C) Seven & i Holdings Co., Ltd. All Rights Reserved.
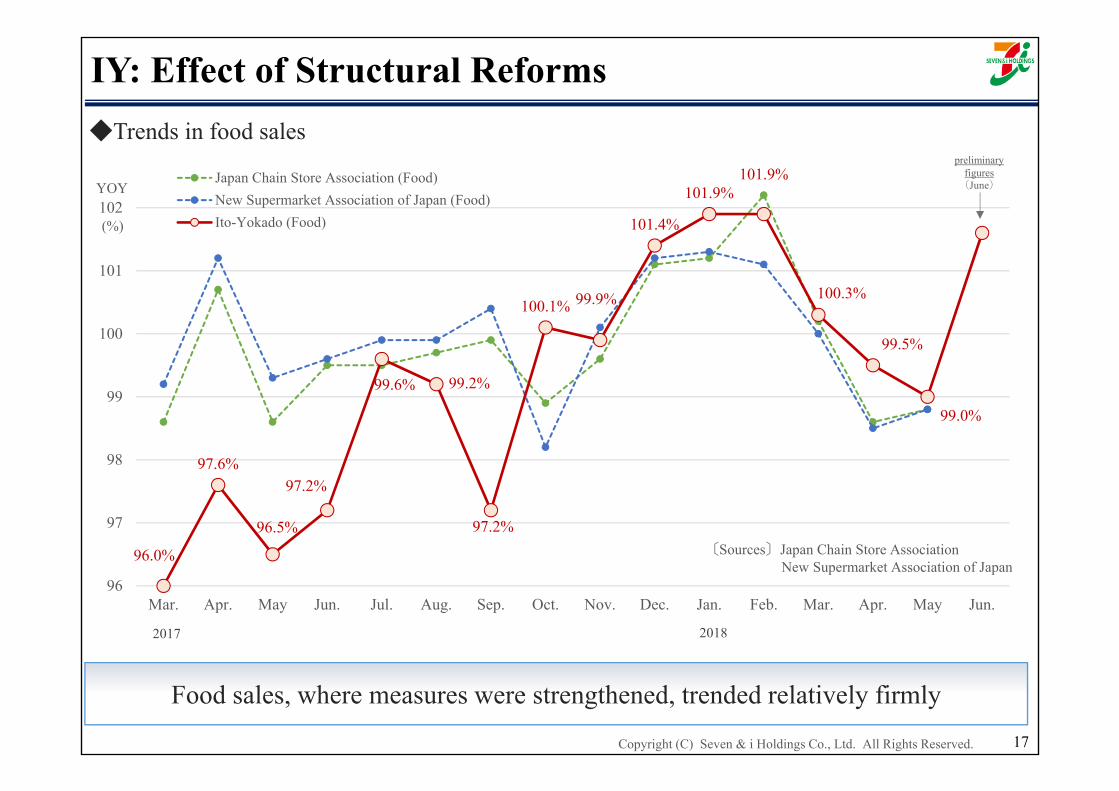
96.0%
97.6%
96.5%
97.2%
99.6% 99.2%
97.2%
100.1% 99.9%
101.4%
101.9%101.9%
100.3%
99.5%
99.0%
96
97
98
99
100
101
102
Mar. Apr. May Jun. Jul. Aug. Sep. Oct. Nov. Dec. Jan. Feb. Mar. Apr. May Jun.
Japan Chain Store Association (Food)New Supermarket Association of Japan (Food)Ito-Yokado (Food)
17
IY: Effect of Structural Reforms◆Trends in food sales
YOY
(%)
2017 2018
〔Sources〕Japan Chain Store AssociationNew Supermarket Association of Japan
Food sales, where measures were strengthened, trended relatively firmly
preliminary figures(June)
Copyright (C) Seven & i Holdings Co., Ltd. All Rights Reserved.
Sogo & SeibuSS
18
Copyright (C) Seven & i Holdings Co., Ltd. All Rights Reserved.
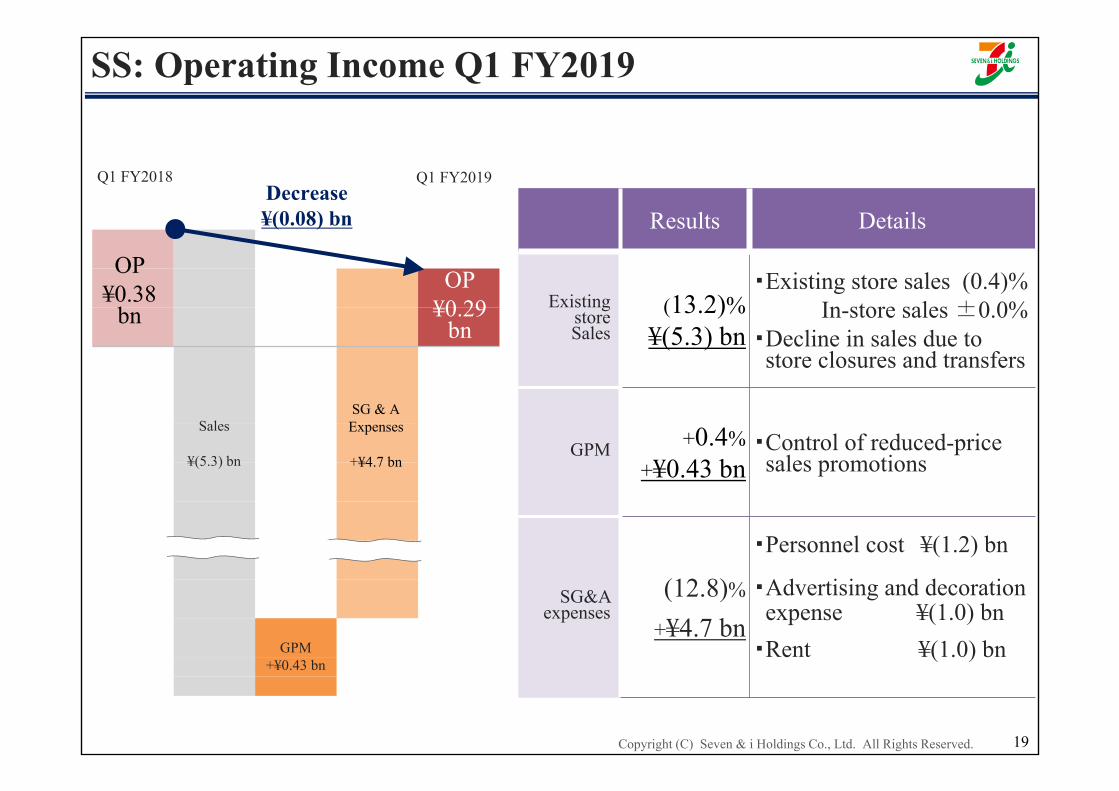
SS: Operating Income Q1 FY2019
Results Details
Existingstore Sales
(13.2)%¥(5.3) bn
・Existing store sales (0.4)%In-store sales ±0.0%
・Decline in sales due to store closures and transfers
GPM +0.4%+¥0.43 bn
・Control of reduced-price sales promotions
SG&A expenses
(12.8)%
+¥4.7 bn
・Personnel cost ¥(1.2) bn
・Advertising and decoration expense ¥(1.0) bn・Rent ¥(1.0) bn
19
Q1 FY2018 Q1 FY2019Decrease¥(0.08) bn
OP ¥0.38
bnOP
¥0.29bn
Sales
¥(5.3) bn
GPM+¥0.43 bn
SG & A Expenses
+¥4.7 bn
Copyright (C) Seven & i Holdings Co., Ltd. All Rights Reserved. 20
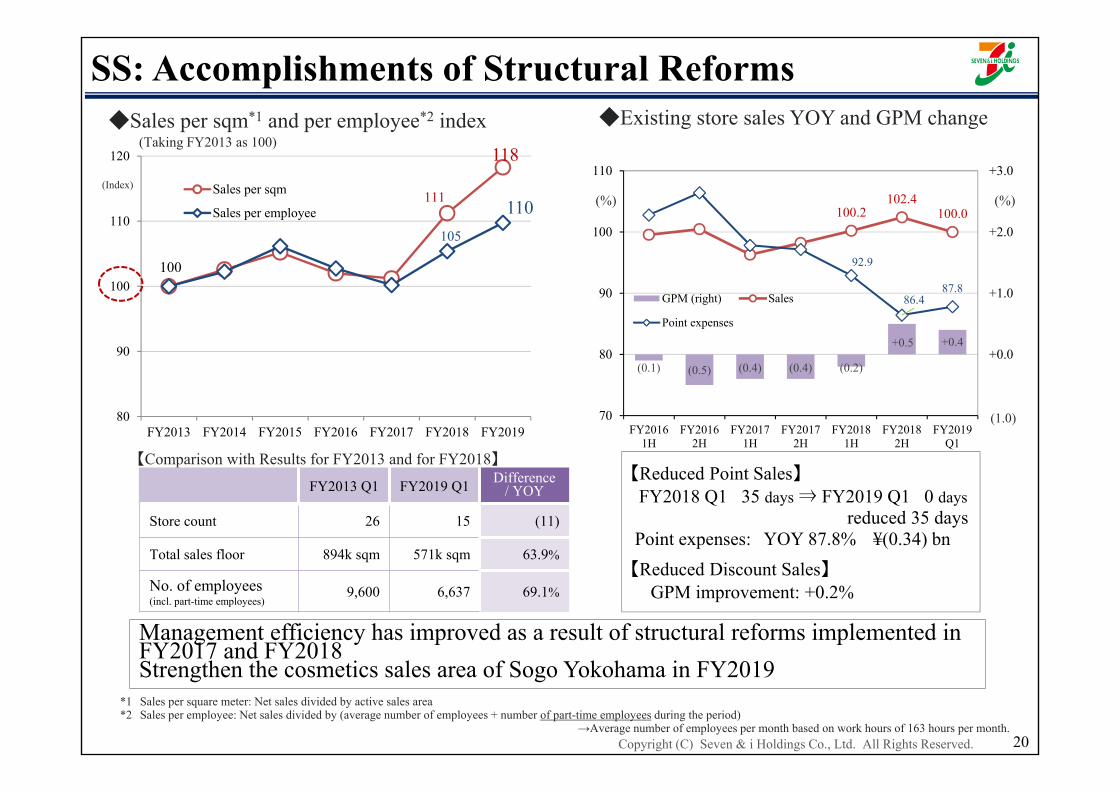
111
118
100
105
110
80
90
100
110
120
FY2013 FY2014 FY2015 FY2016 FY2017 FY2018 FY2019
Sales per sqm
Sales per employee
SS: Accomplishments of Structural Reforms
(Index)
(0.1) (0.5) (0.4) (0.4) (0.2)
+0.5 +0.4
100.2102.4
100.0
92.9
86.487.8
▲ 1.0
+0.0
+1.0
+2.0
+3.0
70
80
90
100
110
FY20161H
FY20162H
FY20171H
FY20172H
FY20181H
FY20182H
FY2019Q1
GPM (right) Sales
Point expenses
(%)
Management efficiency has improved as a result of structural reforms implemented in FY2017 and FY2018 Strengthen the cosmetics sales area of Sogo Yokohama in FY2019
(%)
(1.0)
*1 Sales per square meter: Net sales divided by active sales area *2 Sales per employee: Net sales divided by (average number of employees + number of part-time employees during the period)
→Average number of employees per month based on work hours of 163 hours per month.
◆Sales per sqm*1 and per employee*2 index(Taking FY2013 as 100)
◆Existing store sales YOY and GPM change
【Comparison with Results for FY2013 and for FY2018】【Reduced Point Sales】FY2018 Q1 35 days ⇒ FY2019 Q1 0 days
reduced 35 daysPoint expenses: YOY 87.8% ¥(0.34) bn【Reduced Discount Sales】
GPM improvement: +0.2%
FY2013 Q1 FY2019 Q1 Difference / YOY
Store count 26 15 (11)
Total sales floor 894k sqm 571k sqm 63.9%
No. of employees (incl. part-time employees)
9,600 6,637 69.1%
Copyright (C) Seven & i Holdings Co., Ltd. All Rights Reserved.
Seven & i GroupCRM / Digital Strategy
21
Copyright (C) Seven & i Holdings Co., Ltd. All Rights Reserved.
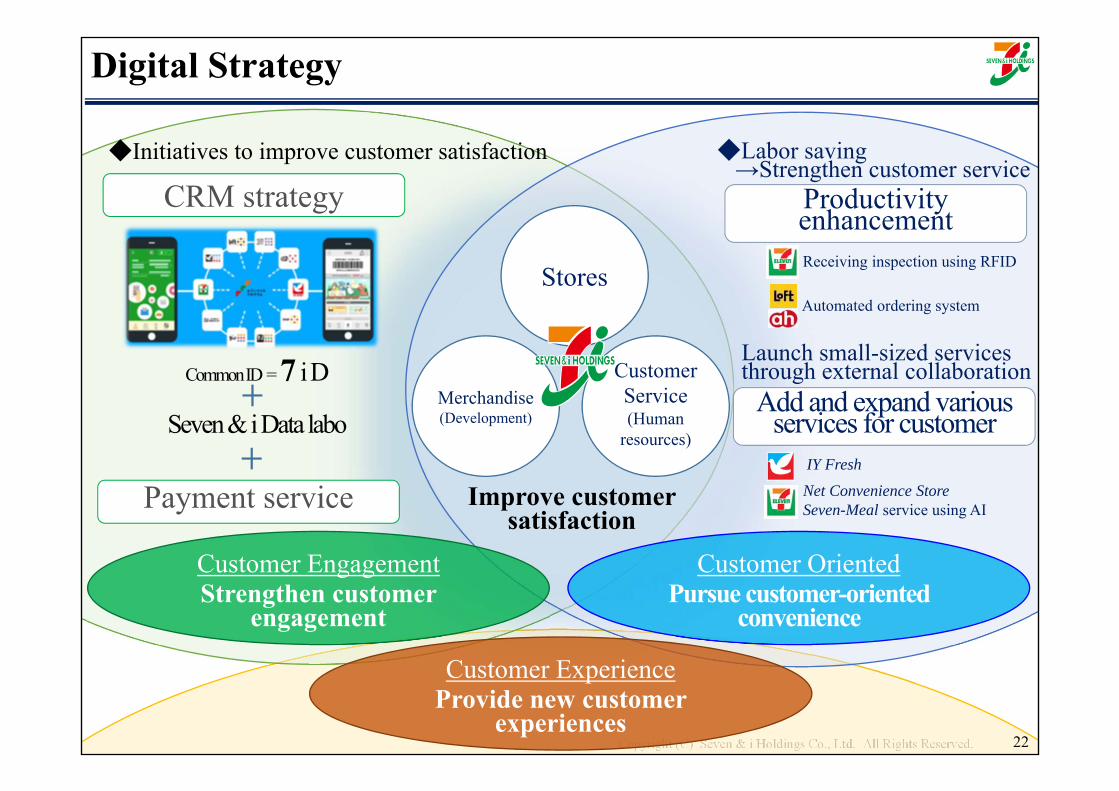
Digital Strategy
Receiving inspection using RFID
Automated ordering system
◆Labor saving→Strengthen customer service
Launch small-sized servicesthrough external collaboration
Net Convenience StoreSeven-Meal service using AI
IY Fresh
◆Initiatives to improve customer satisfaction
Merchandise(Development)
CustomerService(Human
resources)
Stores
Common ID = 7 iD
Customer OrientedPursue customer-oriented
convenience
Customer EngagementStrengthen customer
engagement
Add and expand various services for customer
Productivity enhancement
Payment service
CRM strategy
22
Improve customer satisfaction
Customer ExperienceProvide new customer
experiences
Seven & iData labo
Copyright (C) Seven & i Holdings Co., Ltd. All Rights Reserved. 23
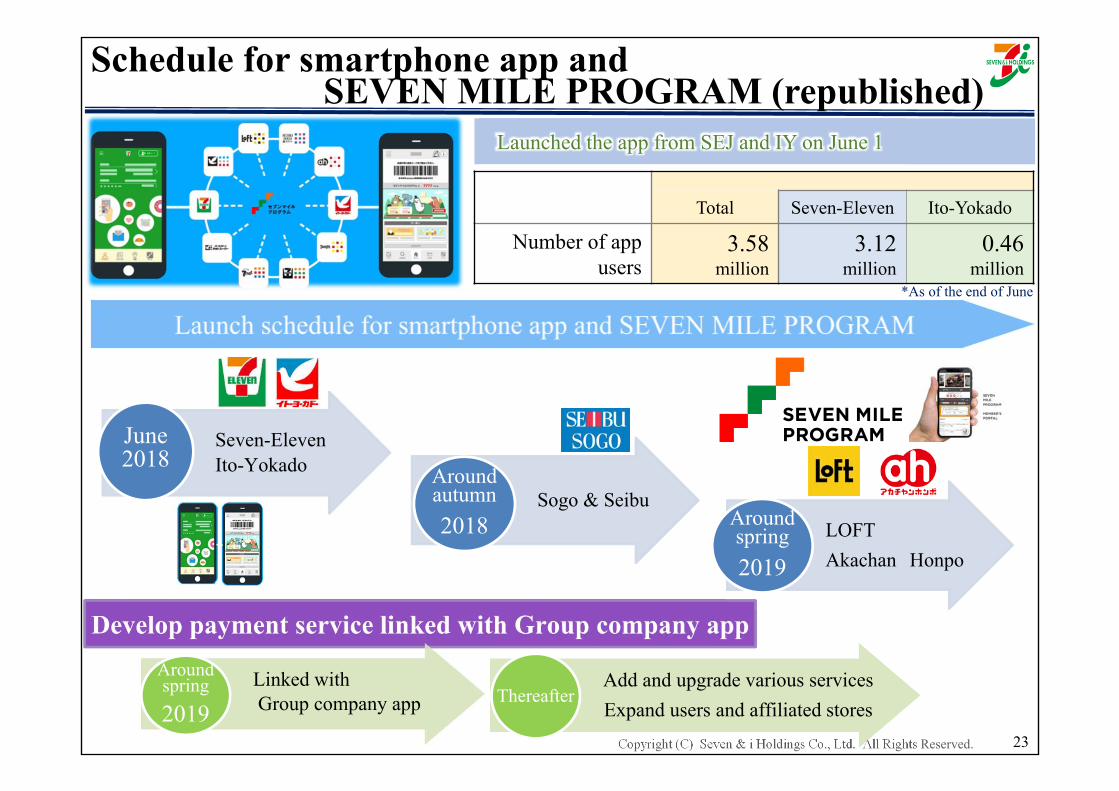
Schedule for smartphone app andSEVEN MILE PROGRAM (republished)
Launched the app from SEJ and IY on June 1
Total Seven-Eleven Ito-Yokado
Number of app users
3.58million
3.12million
0.46million
Linked withGroup company app
Around spring2019
Add and upgrade various servicesExpand users and affiliated stores
Thereafter
• Seven-Eleven• Ito-Yokado
June2018
Sogo & SeibuAroundautumn2018 LOFT
Akachan Honpo
Around spring2019
*As of the end of June
Copyright (C) Seven & i Holdings Co., Ltd. All Rights Reserved. 24
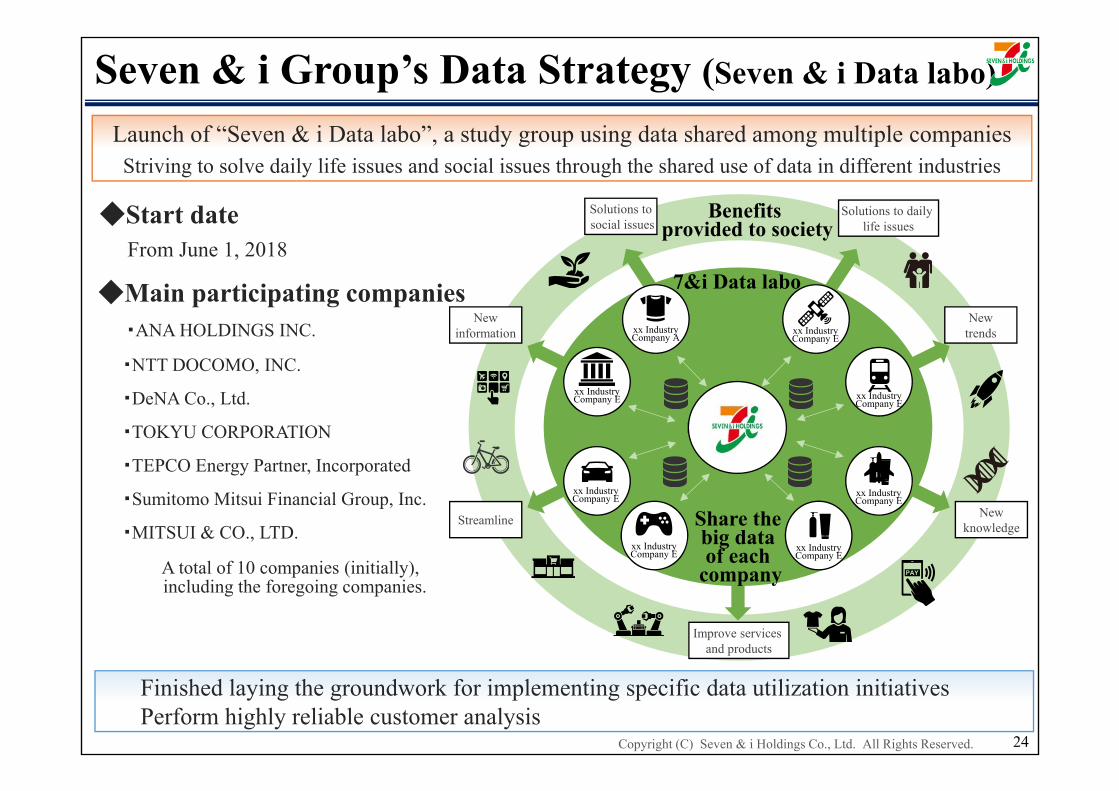
Seven & i Group’s Data Strategy (Seven & i Data labo)
Finished laying the groundwork for implementing specific data utilization initiativesPerform highly reliable customer analysis
7&i Data labo
Benefitsprovided to society
Solutions tosocial issues
Newinformation
Streamline
Improve services and products
Newknowledge
Newtrends
Solutions to daily life issues
xx IndustryCompany A
Launch of “Seven & i Data labo”, a study group using data shared among multiple companies Striving to solve daily life issues and social issues through the shared use of data in different industries
◆Start dateFrom June 1, 2018
◆Main participating companies・ANA HOLDINGS INC.
・NTT DOCOMO, INC.
・DeNA Co., Ltd.
・TOKYU CORPORATION
・TEPCO Energy Partner, Incorporated
・Sumitomo Mitsui Financial Group, Inc.
・MITSUI & CO., LTD.
A total of 10 companies (initially), including the foregoing companies.
xx IndustryCompany E
xx IndustryCompany E
xx IndustryCompany E
xx IndustryCompany E
xx IndustryCompany E
xx IndustryCompany E
xx IndustryCompany E
Share thebig data of each
company
Copyright (C) Seven & i Holdings Co., Ltd. All Rights Reserved.
Business Alliances
25
Copyright (C) Seven & i Holdings Co., Ltd. All Rights Reserved. 26
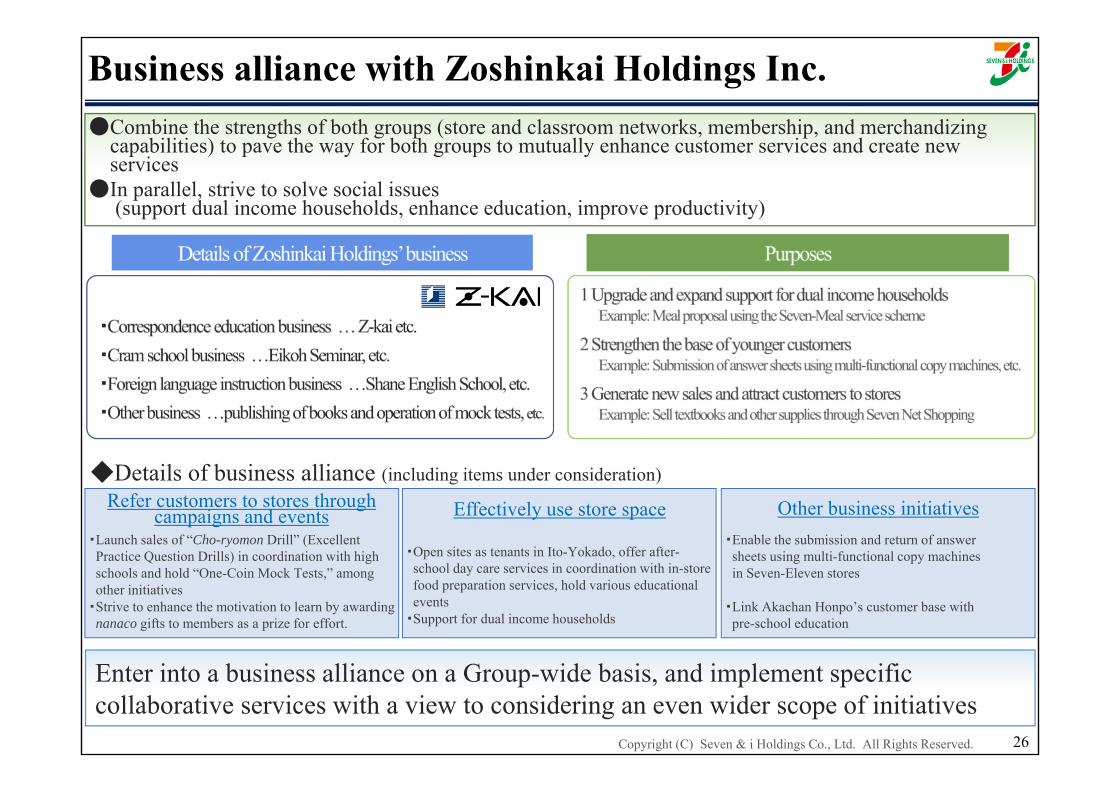
●Combine the strengths of both groups (store and classroom networks, membership, and merchandizing capabilities) to pave the way for both groups to mutually enhance customer services and create new services
●In parallel, strive to solve social issues(support dual income households, enhance education, improve productivity)
・Launch sales of “Cho-ryomon Drill” (Excellent Practice Question Drills) in coordination with high schools and hold “One-Coin Mock Tests,” among other initiatives
・Strive to enhance the motivation to learn by awarding nanaco gifts to members as a prize for effort.
・Open sites as tenants in Ito-Yokado, offer after-school day care services in coordination with in-store food preparation services, hold various educational events
・Support for dual income households
・Enable the submission and return of answer sheets using multi-functional copy machines in Seven-Eleven stores
・Link Akachan Honpo’s customer base with pre-school education
◆Details of business alliance (including items under consideration)Refer customers to stores through
campaigns and events Effectively use store space Other business initiatives
Enter into a business alliance on a Group-wide basis, and implement specific collaborative services with a view to considering an even wider scope of initiatives
Business alliance with Zoshinkai Holdings Inc.
Copyright (C) Seven & i Holdings Co., Ltd. All Rights Reserved. 27
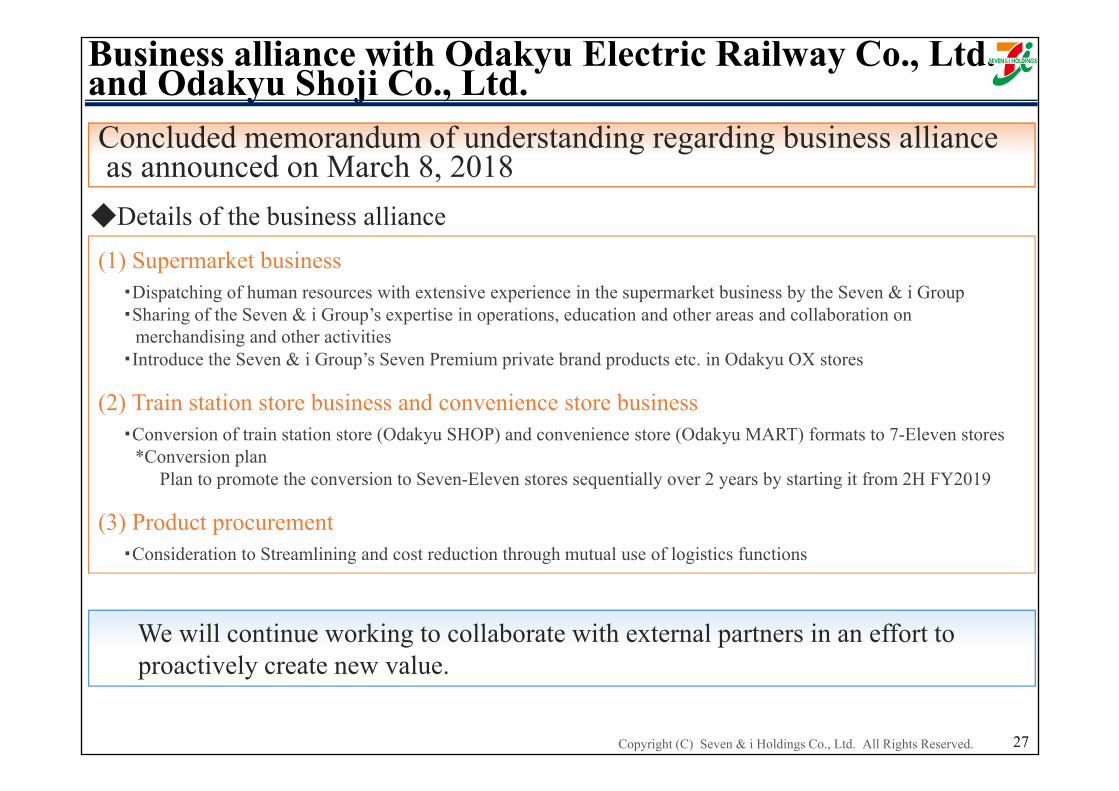
Business alliance with Odakyu Electric Railway Co., Ltd. and Odakyu Shoji Co., Ltd.Concluded memorandum of understanding regarding business allianceas announced on March 8, 2018
(1) Supermarket business・Dispatching of human resources with extensive experience in the supermarket business by the Seven & i Group・Sharing of the Seven & i Group’s expertise in operations, education and other areas and collaboration on
merchandising and other activities・Introduce the Seven & i Group’s Seven Premium private brand products etc. in Odakyu OX stores
(2) Train station store business and convenience store business・Conversion of train station store (Odakyu SHOP) and convenience store (Odakyu MART) formats to 7-Eleven stores
*Conversion planPlan to promote the conversion to Seven-Eleven stores sequentially over 2 years by starting it from 2H FY2019
(3) Product procurement・Consideration to Streamlining and cost reduction through mutual use of logistics functions
We will continue working to collaborate with external partners in an effort to proactively create new value.
◆Details of the business alliance
Appendix
Copyright (C) Seven & i Holdings Co., Ltd. All Rights Reserved.
Copyright (C) Seven & i Holdings Co., Ltd. All Rights Reserved.
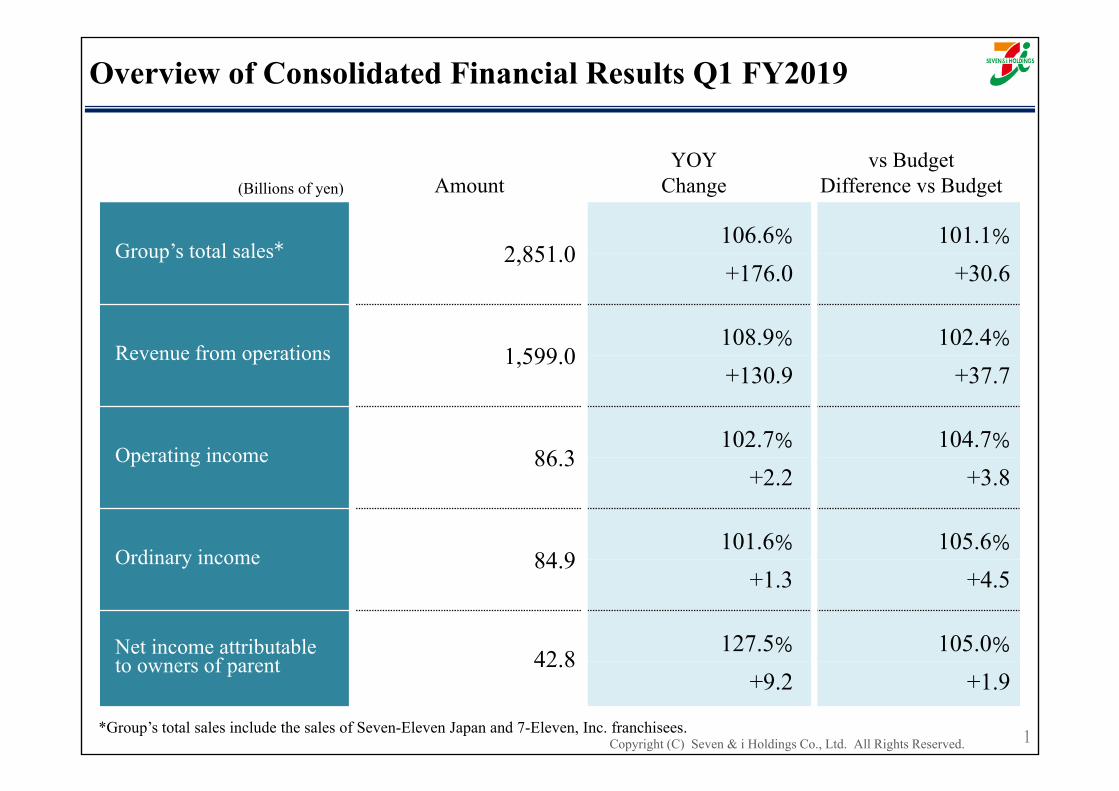
Overview of Consolidated Financial Results Q1 FY2019
(Billions of yen) AmountYOY
Changevs Budget
Difference vs Budget
Group’s total sales 2,851.0106.6% 101.1%+176.0 +30.6
Revenue from operations 1,599.0108.9% 102.4%+130.9 +37.7
Operating income 86.3102.7% 104.7%
+2.2 +3.8
Ordinary income 84.9101.6% 105.6%
+1.3 +4.5
Net income attributable to owners of parent 42.8
127.5% 105.0%+9.2 +1.9
*
1*Group’s total sales include the sales of Seven-Eleven Japan and 7-Eleven, Inc. franchisees.
Copyright (C) Seven & i Holdings Co., Ltd. All Rights Reserved.
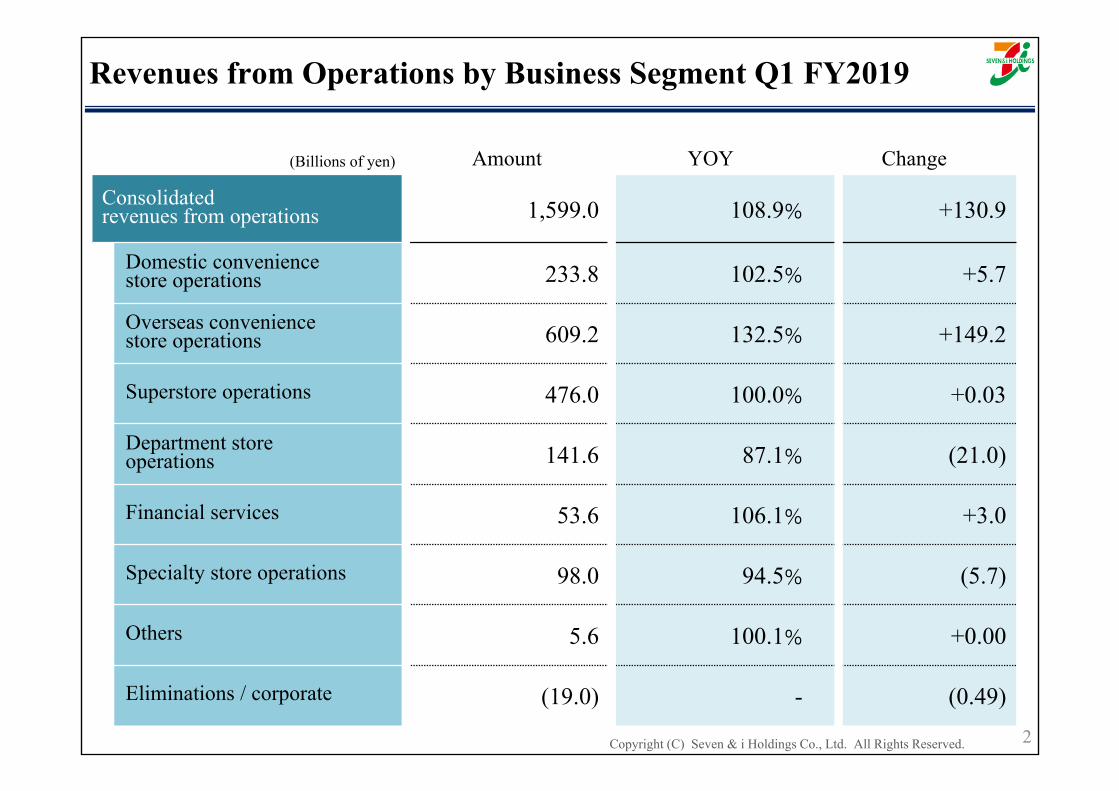
Revenues from Operations by Business Segment Q1 FY2019
(Billions of yen) Amount YOY Change
Consolidatedrevenues from operations 1,599.0 108.9% +130.9
Domestic convenience store operations 233.8 102.5% +5.7
Overseas convenience store operations 609.2 132.5% +149.2
Superstore operations 476.0 100.0% +0.03
Department store operations 141.6 87.1% (21.0)
Financial services 53.6 106.1% +3.0
Specialty store operations 98.0 94.5% (5.7)
Others 5.6 100.1% +0.00
Eliminations / corporate (19.0) - (0.49)2
Copyright (C) Seven & i Holdings Co., Ltd. All Rights Reserved.
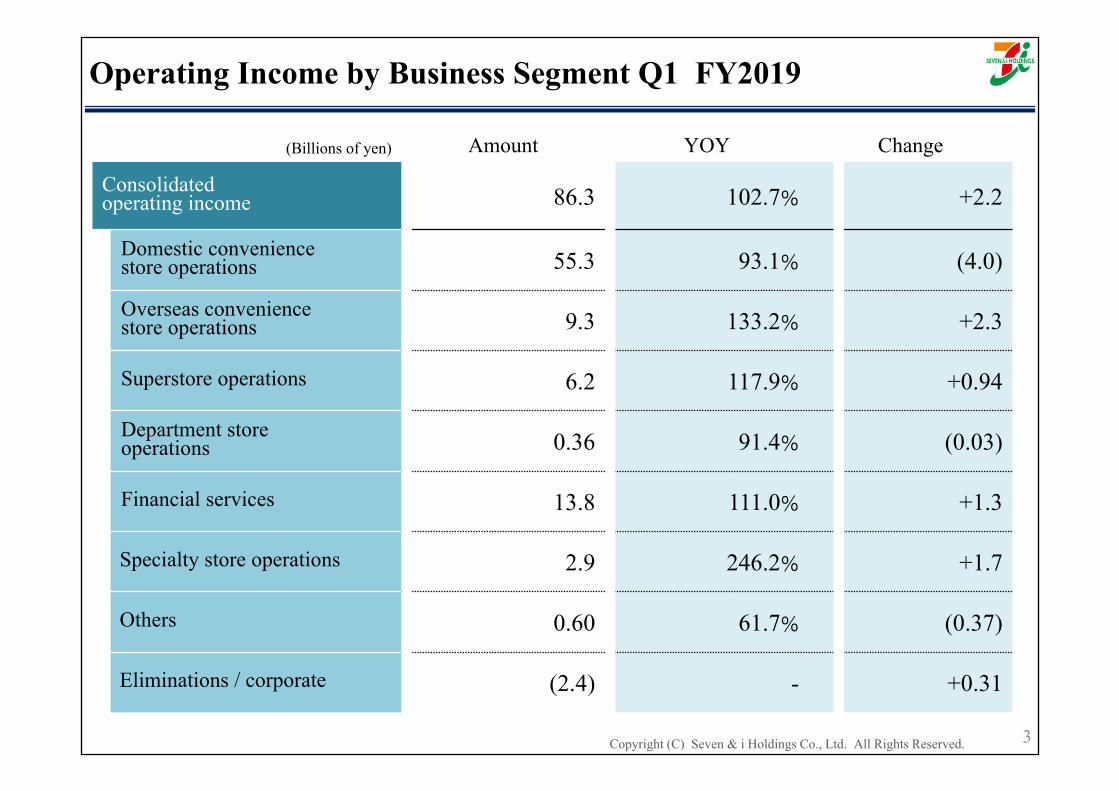
Operating Income by Business Segment Q1 FY2019
(Billions of yen) Amount YOY Change
Consolidatedoperating income 86.3 102.7% +2.2
Domestic convenience store operations 55.3 93.1% (4.0)
Overseas convenience store operations 9.3 133.2% +2.3
Superstore operations 6.2 117.9% +0.94
Department store operations 0.36 91.4% (0.03)
Financial services 13.8 111.0% +1.3
Specialty store operations 2.9 246.2% +1.7
Others 0.60 61.7% (0.37)
Eliminations / corporate (2.4) - +0.31
3
Copyright (C) Seven & i Holdings Co., Ltd. All Rights Reserved.
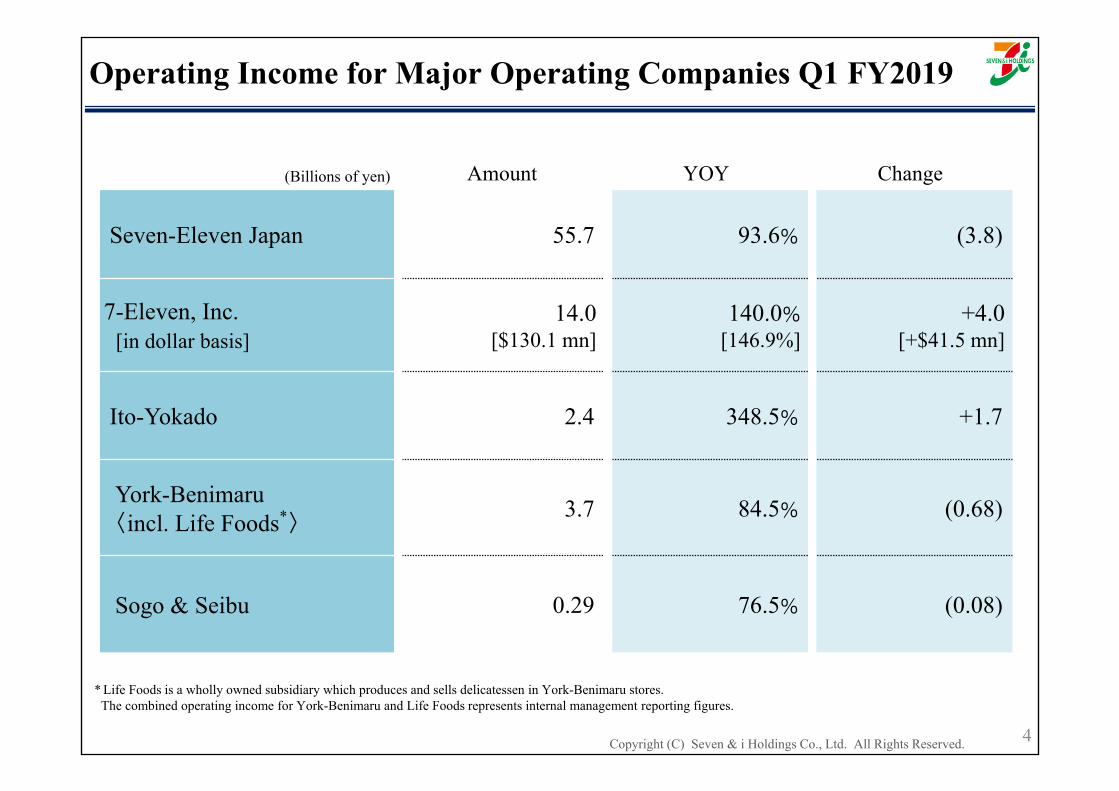
Operating Income for Major Operating Companies Q1 FY2019
(Billions of yen) Amount YOY Change
Seven-Eleven Japan 55.7 93.6% (3.8)
7-Eleven, Inc. [in dollar basis]
14.0[$130.1 mn]
140.0%[146.9%]
+4.0[+$41.5 mn]
Ito-Yokado 2.4 348.5% +1.7
York-Benimaru〈incl. Life Foods*〉
3.7 84.5% (0.68)
Sogo & Seibu 0.29 76.5% (0.08)
4
* Life Foods is a wholly owned subsidiary which produces and sells delicatessen in York-Benimaru stores.The combined operating income for York-Benimaru and Life Foods represents internal management reporting figures.
This document contains certain statements based on the Company’s current plans, estimates,strategies, and beliefs; all statements that are not historical fact are forward-lookingstatements. These statements represent the judgments and hypotheses of the Company’smanagement based on currently available information. It is possible that the Company’sfuture performance will differ from the contents of these forward-looking statements.Accordingly, there is no assurance that the forward-looking statements in this document willprove to be accurate.