financial results presentation for the fiscal year ended
TRANSCRIPT

Copyright (C) Seven & i Holdings Co., Ltd. All Rights Reserved.
April 7, 2017
Seven & i Holdings Co., Ltd.
1
Financial Results Presentation for the Fiscal Year Ended February 28, 2017
Copyright (C) Seven & i Holdings Co., Ltd. All Rights Reserved. 2
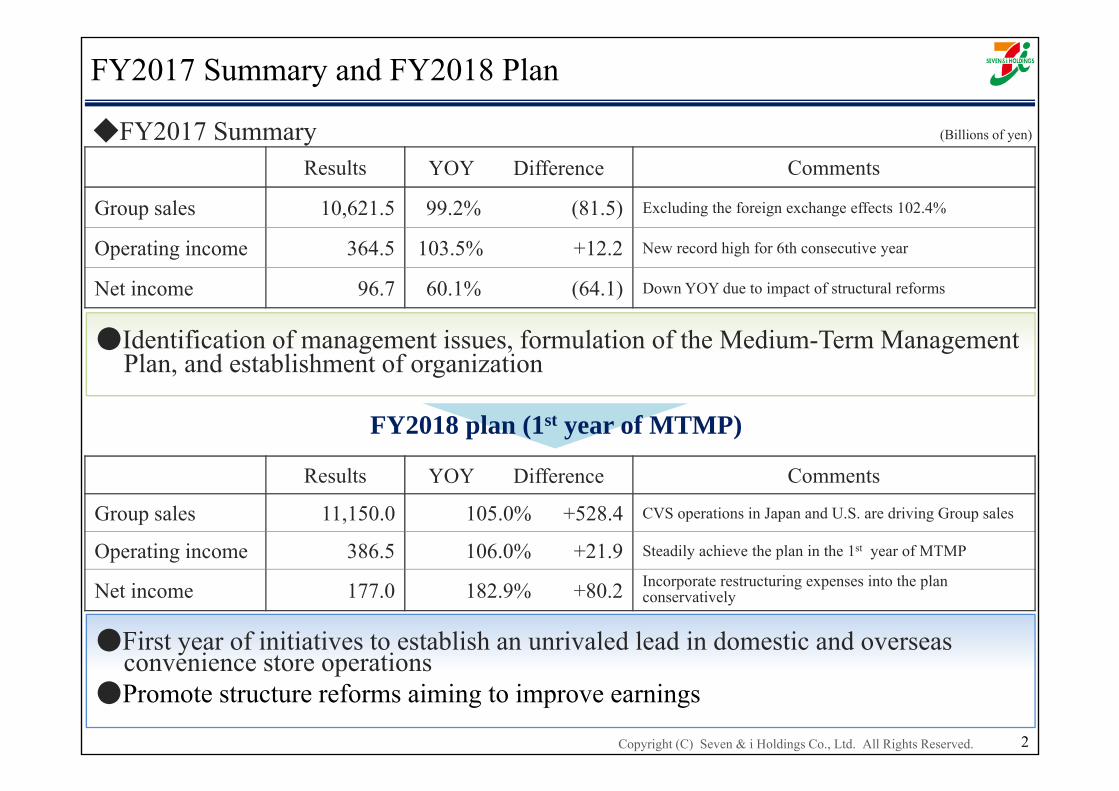
FY2017 Summary and FY2018 Plan
FY2018 plan (1st year of MTMP)
●Identification of management issues, formulation of the Medium-Term Management Plan, and establishment of organization
Results YOY Difference Comments
Group sales 10,621.5 99.2% (81.5) Excluding the foreign exchange effects 102.4%
Operating income 364.5 103.5% +12.2 New record high for 6th consecutive year
Net income 96.7 60.1% (64.1) Down YOY due to impact of structural reforms
◆FY2017 Summary
●First year of initiatives to establish an unrivaled lead in domestic and overseas convenience store operations
●Promote structure reforms aiming to improve earnings
Results YOY Difference Comments
Group sales 11,150.0 105.0% +528.4 CVS operations in Japan and U.S. are driving Group sales
Operating income 386.5 106.0% +21.9 Steadily achieve the plan in the 1st year of MTMP
Net income 177.0 182.9% +80.2 Incorporate restructuring expenses into the plan conservatively
(Billions of yen)

Copyright (C) Seven & i Holdings Co., Ltd. All Rights Reserved.
Review ofMedium-Term Management Plan
(announced on October 7, 2016)
3

Overview; Medium-Term Management Plan
■Numerical target in FY2020; Consolidated operating income 450.0 bn yen・ROE10%
ⅠConcentrate a management resources with a core focus on growth in CVS operations in both Japan and North America
ⅡPromote “selection and concentration” of each geographic area and business category
(1) Memorandum of Understanding on Capital and Business Alliance with H2OSuccession of the department stores in Kansai regionConcentration of management resources on major stores in Tokyo metropolitan area
(2) IY: Start an examination measures focused on Tokyo metropolitan area and food business
ⅢAdopting a perspective of property development in revival of GMS and department store
ⅣReviewing the Omni-Channel Strategy:Prioritize customer lifetime value from the standpoint of the customer’s strategy
ⅤFormulate our strategy, and revise our segments from the perspective of our management approach by next spring
4

Copyright (C) Seven & i Holdings Co., Ltd. All Rights Reserved.
Seven-Eleven JapanSEJ
5

Copyright (C) Seven & i Holdings Co., Ltd. All Rights Reserved.
34.0%
34.1%34.8%
35.4%
36.4%
37.5%
38.8%
40.0%
41.0%41.7% 42.7%
33
35
37
39
41
43
▲ 1,600
0
1,600
3,200
4,800
6,400
FY2007 FY2008 FY2009 FY2010 FY2011 FY2012 FY2013 FY2014 FY2015 FY2016 FY2017 FY2018 FY2019
SEJ's sales incerase (left)Other CVS's sales increase (left)SEJ's sales share(right)
(Billionsof yen) (%)
Source: Japan Franchise Association monthly convenience store survey
◆Trend in sales share of SEJ and change in convenience store sales (Japan Franchise Association)
Sales Share and Change by Fiscal Year
Aim
ing for a share of 50%
Amid accelerating reorganization with the sector, SEJ aims to achieve further growth by continuing to adapt to changes
2009 Launch of "Close-by, convenient" strategy
2012 Expanded chilled product sales area
2013 Launch of SEVEN CAFÉ
2014 Alliance with JR West Group
2009 Acquisition of am/pm Japan
2014 Alliance with Poplar
2015 Acquisition of Cocostore Corp.
2016 Merger with Circle K Sunkus
2017 Alliance with Save On
Blue line: Lawson
Green line: Family Mart
◇Trends of major convenience store companies 2016 Alliance with Three F
2009 Defective product burden 15%
Accelerate reorganization by expanding SEJ’s share
640
480
320
160
6
(160)

Copyright (C) Seven & i Holdings Co., Ltd. All Rights Reserved.
9.2% 9.3%9.8%
10.2%10.8%
12.1%12.8%
13.3%
8
9
10
11
12
13
14
15
16
0.0
2.0
4.0
6.0
8.0
10.0
12.0
FY2009 FY2010 FY2011 FY2012 FY2013 FY2014 FY2015 FY2016
Market size of take-home mealSEJ's market share
Response to Market Opportunities (Expansion in demand for take-home meals)
7
(Trillions of yen)
The take-home meals market is expanding in line with changing social structure, including an aging society, shrinking households, and increase in working women⇒SEJ will respond to changing needs and increase its market share by proactively strengthening its fast
food offerings
(%)
8.2 8.1 8.1 8.4 8.7 8.9 9.39.6
SEJ’s market share
Scale of the take-home
meals market
We will continue to aim for further growth by strengthening merchandising capabilities and revising store layouts
Source: Take-home meals market – Japan Ready-Made meal Association (White Paper on Ready-made Meals )

Copyright (C) Seven & i Holdings Co., Ltd. All Rights Reserved.
Sales amount (daily)
Sales volume (daily)
Frozen foods (excl. ice cubes)
473 % 562 %
Counter products 257 % 232 %
Cigarettes 136 % 94 %
Daily products 116 % 122 %
Alcoholic beverages 77 % 81 %
Household goods 72 % 84 %
Magazines (including comics and books)
43 % 37 %
8
The customer segment is expanding, the customer segment and their way of usingthe stores both changed dramatically, bringing significant changes in sales for each category
2009 Launch of "Close-by, convenient" strategy
Amid a changing social structure, we launched the “Close-by, convenient” strategy in response to an increase in demand for eating out
◆Change in sales by category (comparison of average sales and average sales volumesfor FY2007 and FY2016)
Growth Strategy for Existing stores
◇Change in people using the stores (customer segment)
FY2008 FY2017
Customer index 100 109
Purchasing customer
segment
Ratio of female customers 42.3% 47.4%
[+5.1%]
Ratio of customers aged 50 or above
25.8% 40.0%[+14.2%]
Source: Customer index (POS analysis), customer segment (nanaco data)
*Taking FY2008 as 100

Copyright (C) Seven & i Holdings Co., Ltd. All Rights Reserved.
Existing-Store Growth Strategy (New Layout)
9
Sales counter
Entrance
Freezer
Expand counterIncrease rice product and chilled cases
Entrance
Rice products, chilled case
Magazines
Ice cream
Walk-in refrigerator
Walk-in refrigerator
Expand eat-in area
New
layout
Expand chilled-foods reach-in
Previous layout
Time Numberof stores
FY2018
Existing stores 800
New stores 1,100
Cumulative in FY2022
Existing stores
10,000+ new stores*
◆New layout rollout plan
* Excluding small stores and special locations, etc.
“Increase in eating out” and “expansion in demand for take-home meals” are expected to accelerate
Change internal layout in line with sales composition change
*APSD increase effect of 30,000 – 40,000 yen expected

Copyright (C) Seven & i Holdings Co., Ltd. All Rights Reserved.
100 99 103
106
114 110
120 122
110
106 100
108
125
133
147
140
147
152
135 132
80
90
100
110
120
130
140
150
160
Nov.2015
Dec. Jan.2016
Feb. Mar. Apr. May Jun. Jul. Aug. Sep. Oct.
10
New SEVEN CAFÉIntegrated café latte machine
Hot latte Hot coffee
Iced latte Iced coffee
◇To be rolled out at all stores during FY2018*Rolled out at 2,800 stores as of February 28, 2017
Existing-Store Growth Strategy (Strengthen MDSE Capabilities)
◆Sales in pilot sales area
Hokkaido area café latte pilot sales launch
SEVEN CAFÉ sales grew significantly in the café latte pilot sales area of Hokkaido
Hokkaido areaIndex of SEVEN
CAFÉ sales
NationwideIndex of SEVEN
CAFÉ sales
*Index taking the level for the fiscal year ended November 2015 as 100
Development of special milk to replace the conventional ice
milk beads

Copyright (C) Seven & i Holdings Co., Ltd. All Rights Reserved.
◆Minimum wage trend (Tokyo)
Response to Risk (Labor Environment Change)
(1) Establish an environment that enables convenience store franchisees to achieve an expanding equilibrium in store management ⇒Existing store growth
(2) Encourage future new owners to become franchisees⇒Growth from new store openings
703 719
932
500
600
700
800
900
1,000
2000 2002 2004 2006 2008 2010 2012 2014 2016
100
103.7104.6
105.6
106.1
106.9107.6
100
102.7
104.8
105.3
106.5
106.7107.4
98
100
102
104
106
108
110
FY2011 FY2012 FY2013 FY2014 FY2015 FY2016 FY2017
RevenuesPersonnel expenses
Source: Ministry of Health, Labour and Welfare
(Yen) (index)Increase of 213 yen over ten years◆Revenue and personnel expenses of franchised stores
(Index taking 2010 level as 100/All store basis)
Capture opportunities for further growth by taking steps to enhance franchisee satisfaction
Conduct 1% Special Discount on Seven-Eleven Franchise Royalty Fees from September 2017 (Impact of approx. 16 bn yen over 12 months)
・Expanded application of social insurance enrollment
・Stricter management of working hours
Stay flat
Factors in rising labor cost by 5-6%
11
837

Copyright (C) Seven & i Holdings Co., Ltd. All Rights Reserved.
12
Introduction of dishwashers for washing counter product sales equipment
Increasing the quality of customer service while improving work efficiency
◇Roll-out at all stores during FY2018*Rolled out at 1,260 stores as of February 28, 2017
Productivity Improvement (Support for Work Style Reforms)
Sterilization effect improves quality in termsof safety and reliability
Manual washing → dishwasherApprox. 1 hour shorter
Reduced 1 hour/dayApprox. (300) thousand yen/year
◆Water usage (per store)
◆Personnel expenses
◆Work time
Reduction effectapprox. (20)%/year
SEJ’s provisional calculation based on store trials
12

Copyright (C) Seven & i Holdings Co., Ltd. All Rights Reserved.
Sorting at distribution center
Data transmission to stores Tail lift vehicles Reduce product
inspection timeRFID IC chips are attached to associate the product and the wheeled cart
Sorting data is sent to stores Unload using tail lift Simply pass the RFID reader to perform delivery and product inspection
13
Effect from utilization of RFID
●Effect from energy saving system:Daily product inspection time 170 min. ⇒ 8 min.(Corresponds to a personnel expense reduction of approx. 800 thousand yen/year)
●Effect from improvement the work efficiency of drivers:A major reduction in work for sorting and loading at the center, unloading goods from the vehicle to the cart, and unloading goods in the store had the following effects:(1)Promotion of employment of female drivers (2)Improved working conditions for drivers
Productivity Improvement (Support for Work Style Reforms)
Launch trial test of energy saving system for product inspection at stores using RFIDs around Aug.
*1: RFID: A technology for contactless reading of datafrom an IC chip though transmission of radio waves

Copyright (C) Seven & i Holdings Co., Ltd. All Rights Reserved. 14
Main Initiatives and Numerical Targets for FY2018
FY2018 plan YOY changeTotal store sales 4,708.0 bn yen +192.3 bn yenOperating income 244.0 bn yen +0.5 bn yen
Existing stores YOY 101.5% -GPM/YOY change 32.1% +0.3%
Store Openings 1,600 (82)Net increase in stores 700 (150)Capital expenditure 180.0 bn yen +54.9 bn yen・Monitor cost effectiveness of advertising expenses and to control them・The sales boost effect from new layout and introduction of dishwashing machines
has not been factored in・Store openings: 1,682
⇒1,600 as railway store openings finish their cycle, and bolster the scrap & build strategy ・Main capital expenditure
⇒New layout [+27.0 bn yen], café latte machines [+13.5 bn yen], dishwashers [+15.0 bn yen]
Copyright (C) Seven & i Holdings Co., Ltd. All Rights Reserved.
7-Eleven, Inc.SEI
15
Copyright (C) Seven & i Holdings Co., Ltd. All Rights Reserved.
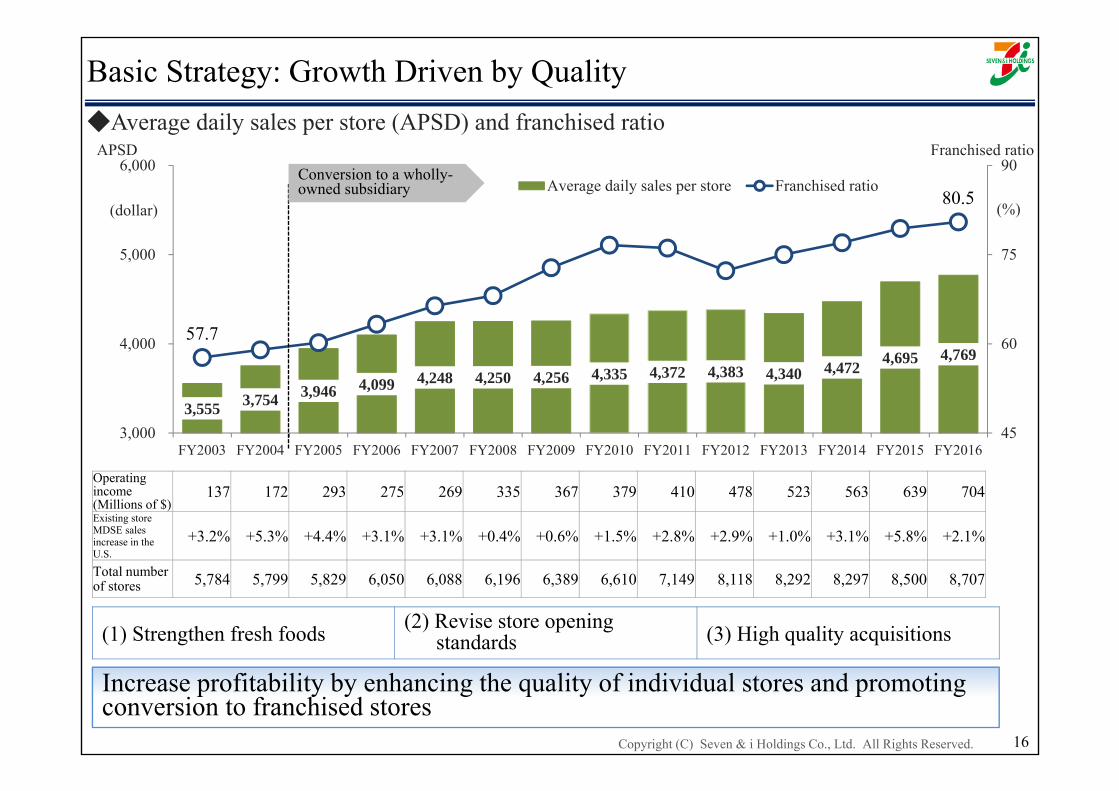
3,555 3,754 3,946 4,099 4,248 4,250 4,256 4,335 4,372 4,383 4,340 4,472 4,695 4,76957.7
80.5
3,000
4,000
5,000
6,000
FY2003 FY2004 FY2005 FY2006 FY2007 FY2008 FY2009 FY2010 FY2011 FY2012 FY2013 FY2014 FY2015 FY201645
60
75
90Average daily sales per store Franchised ratio
(dollar) (%)
APSD Franchised ratio
Increase profitability by enhancing the quality of individual stores and promoting conversion to franchised stores
16
Operating income (Millions of $)
137 172 293 275 269 335 367 379 410 478 523 563 639 704Existing store MDSE sales increase in the U.S.
+3.2% +5.3% +4.4% +3.1% +3.1% +0.4% +0.6% +1.5% +2.8% +2.9% +1.0% +3.1% +5.8% +2.1%
Total number of stores 5,784 5,799 5,829 6,050 6,088 6,196 6,389 6,610 7,149 8,118 8,292 8,297 8,500 8,707
Conversion to a wholly-owned subsidiary
Basic Strategy: Growth Driven by Quality◆Average daily sales per store (APSD) and franchised ratio
(1) Strengthen fresh foods (2) Revise store openingstandards (3) High quality acquisitions

Copyright (C) Seven & i Holdings Co., Ltd. All Rights Reserved.
Acquisition of Some of Sunoco LP Retail Assets
17
(1)Major gasoline company withdrawing from retail business leaves rare opportunity to acquire high quality stores
(2)Support existing store base
◆Background to the acquisition
*1 Sunoco LP figures are extracted or estimated from its disclosed materials (10-K)
MDSE sales Approx. $4,800/day/store Equal to or greater than APSD at SEIGasoline sales Approx. 5,100 gallons/day/store Approx. 1.5 times SEI’s gallon volume
◆Overview of Sunoco LP’s retail business (fiscal year ended December 31, 2016)*1
Acquisition amount $3,305 .6million (sale and leaseback planned ),increase probability of medium- to long-term growth
Enhanced supply chain
No. of Sunoco stores to be acquired
No. of SEI’sexisting stores*2
TotalNo. of stores
Midwest area (State of Texas) Approx. 550 Approx. 680 Approx. 1,230
Southeast area (State of Florida, etc.) Approx. 110 Approx. 810 Approx. 920
Northeast area (State of New York, etc.) Approx. 450 Approx. 2,960 Approx. 3,410
Total for three areas 1,108 Approx. 4,450 Approx. 5,560
◇SEISales increase and medium- to long-term profitability enhancement through expansion of high quality stores
◇Sunoco LPStrategic withdrawal from retail business and concentration on wholesale business
◆Number of stores to be acquired
*2 No. of SEI stores: as of Dec. 31, 2016

Copyright (C) Seven & i Holdings Co., Ltd. All Rights Reserved.
72 89 106 129 197 267 291 416 341 238 163 197 300 400 500213 4371 36
352
662
121
181 159
1,108
293
704
0
300
600
900
1,200
1,500
FY2005 FY2006 FY2007 FY2008 FY2009 FY2010 FY2011 FY2012 FY2013 FY2014 FY2015 FY2016 FY2017 FY2018 FY20190
200
400
600
800
1,000Stores opened through M&A
Organic store openings
Operating income
Number of store openings
18
Conduct M&As on high-quality targetsBuild a supply chain
FY2019 targetsNo. of stores: 10,000APSD: $5,000Operating income: $1.0 bn
StrategicM&As
Make profitable
Strategic M&As
Make profitable
Medium-Term Plan; Accelerate Growth Driven by Quality
*1 Operating cash flow: (operating income × 60%) + depreciation and amortization*2 Free cash flow: Operating cash flow – Capital expenditure [informal calculation]
(Millions of $) 2005-2010(annual average)
2011-2016(annual average)
Capital expenditure 453 1,288Operating income 320 553Depreciation and amortization 398 506Operating cash flow*1 590 838Free cash flow*2 136 (449)Operating income CAGR 5.3% 11.4%
◆Comparison of cash flows and compound annual growth rate (CAGR) of operating income before and after strategic M&As
◆Number of stores and operating incomeOperating income(Millions
of $)

Copyright (C) Seven & i Holdings Co., Ltd. All Rights Reserved. 19
Main Initiatives and Numerical Targets for FY2017
FY2017 plan YOY changeTotal store sales 3,141.0 bn yen +405.8 bn yenOperating income 89.0 bn yen +12.3 bn yen
Existing stores YOY 103.1% -GPM/YOY change 34.9% +0.1%
Store openings 1,408 +1,052Net increase in stores 1,188 +981
Capital expenditure 510.0 bn yen +293.2 bn yen
The amount of capital expenditure and number of acquired stores associated with the acquisition of some of Sunoco LP’s retail assets have been incorporated into the plan, but not the financial data from revenues from operations downward. The data will be announced promptly once the details become clear.
Exchange rate U.S.$1= ¥108.78(FY2017 result), ¥110.00(FY2018 plan)

Copyright (C) Seven & i Holdings Co., Ltd. All Rights Reserved.
Ito-YokadoIY
20

Copyright (C) Seven & i Holdings Co., Ltd. All Rights Reserved.
Food
House holdgoods Apparel
Tenants
Further strengthening+
Tenant mix
Changes in customer needs and divergence of product policy
◆Composition ratio in FY2017
0
Changes in Customer Needs
◆Trends of operating income by MDSE categories(FY2001-FY2017 results)
21
46%
20%
25%
14%
29%
66%
0% 20% 40% 60% 80% 100%
Promote store structure reforms; review and revitalize store format and sales area composition
Sales composition ratio
Sales floor composition ratio
Operating income
(Billionsof ¥)

Copyright (C) Seven & i Holdings Co., Ltd. All Rights Reserved.
Response ⇒ GMS Business Structure Reforms (Announced in Medium-Term Management Plan)
22
◆Number of stores by store format
Conversion to Ario 9
Tenant mix 31
Redevelopment, etc. 67
Total107
ArioDownsize directly operated sales floor space for apparel and household goods in line with the expiration of leases, targeting an operating profit margin of 3%* by strengthening shopping centers overall
GMS Increase efficiency per area by downsizing apparel and household goods sales floor space and increasing the share of food. Conduct real estate redevelopment in cooperation with tenants
Food specialty store Food is a growth category; conduct operations primarily in the Tokyo metropolitan area
◆Future direction by store format*Closures in FY2018: 8 stores
At thestart of
FY2017
New stores during
FY2017
Closures in FY2017
At thestart of
FY2018
New stores during
FY2018
Closures between
FY2018 –FY2021
At the end of FY2021
Ario 17 1 - 18 1 1 18
Superstore 136 - 9 127 - 20 107Food specialty store 29 3 6 26 - 4 22
Total 182 4 15 171 1 25 147

Copyright (C) Seven & i Holdings Co., Ltd. All Rights Reserved.
GMS Reform in FY2018 and the Medium-Term Management Plan
23
◆Store structure reforms (results for FY2017 and Medium-Term Management Plan)
Number of stores planned to undergo redevelopment FY2020 FY2021 FY2022 FY2023 From FY2024
onwards
Redevelopment, etc. 67 4 6 6 8 43
◆Timing of store openings in redevelopment initiatives, etc.
●Store redevelopment will be considered mainly for stores that have been operating for 30 years or longer●Figures for FY2021 onwards are planned figures, and we are currently examining conversion to Ario or measures for
tenant mix in the case were plans change due to discussions with the owner or government, or trends in construction expenses.
Promote store structure reforms and real estate redevelopment centered on 107 superstores as of the end of FY2021.
Number of stores planned to undergo structure reforms
Carried out in FY2017
Planned for FY2018
Plan up to FY2020
From FY2021 onwards
Conversion to Ario 9 - 2 6 1
Tenant mix 31 2 8 15 6
◆Additional measures for store structure reforms(Renovation of existing Ario stores ⇒Reduction of directly operated area and expansion of tenants)
Planned number of stores FY2018 FY2019 FY2020 From FY2021onwards
Renovation of existing Ario stores 18 9 4 5 2
Includes renovations by the same store
Copyright (C) Seven & i Holdings Co., Ltd. All Rights Reserved.
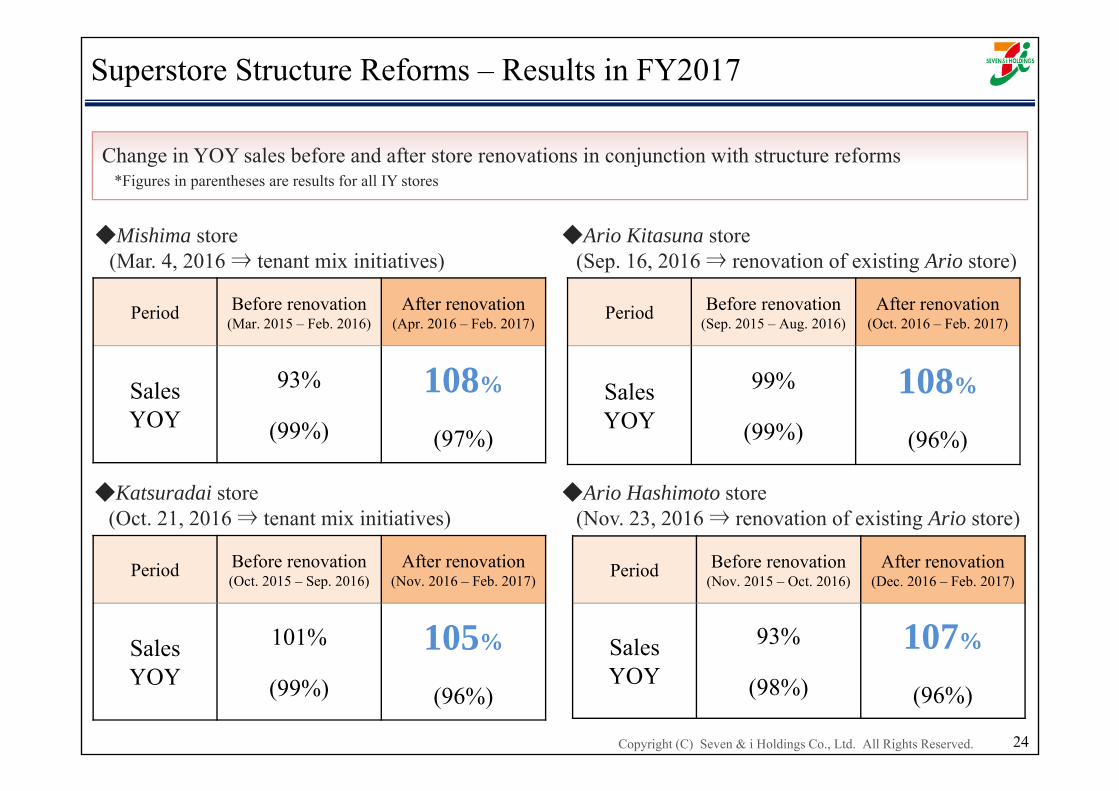
Superstore Structure Reforms – Results in FY2017
24
◆Mishima store(Mar. 4, 2016 ⇒ tenant mix initiatives)
Period Before renovation(Mar. 2015 – Feb. 2016)
After renovation(Apr. 2016 – Feb. 2017)
Sales YOY
93%
(99%)
108%
(97%)
Period Before renovation(Sep. 2015 – Aug. 2016)
After renovation(Oct. 2016 – Feb. 2017)
Sales YOY
99%
(99%)
108%
(96%)
Period Before renovation(Oct. 2015 – Sep. 2016)
After renovation(Nov. 2016 – Feb. 2017)
Sales YOY
101%
(99%)
105%
(96%)
Period Before renovation(Nov. 2015 – Oct. 2016)
After renovation(Dec. 2016 – Feb. 2017)
Sales YOY
93%
(98%)
107%
(96%)
Change in YOY sales before and after store renovations in conjunction with structure reforms*Figures in parentheses are results for all IY stores
◆Ario Kitasuna store(Sep. 16, 2016 ⇒ renovation of existing Ario store)
◆Katsuradai store(Oct. 21, 2016 ⇒ tenant mix initiatives)
◆Ario Hashimoto store(Nov. 23, 2016 ⇒ renovation of existing Ario store)

Copyright (C) Seven & i Holdings Co., Ltd. All Rights Reserved.
37.6 bn 37.1 bn
34.4 bn
40.4 bn
33.6 bn
38.1 bn37.2 bn 36.5 bn
40.0 bn
45.7 bn46.9 bn
44.8 bn
51.3 bn 52.1 bn53.7 bn
47.4 bn
44.1 bn
38.9 bn
40.2%39.6%
39.0%38.2%
36.3%
35.0%
36.4%37.3%
39.6%
37.2%36.4%
30.3%
32.9%
29.3%
33.8%
32.2%33.4%
30.5%
26.0
28.0
30.0
32.0
34.0
36.0
38.0
40.0
42.0
200
250
300
350
400
450
500
550
600
FY2006 FY2009 FY2011 FY2013 FY2015FY2016Q1 Q2 Q3 Q4
FY2017Q1 Q2 Q3 Q4
Inventory GPM
◆Apparel inventory and GPM
Optimize Inventory Level of Apparel
25
Apparel inventory Apparel GPM
Year-end inventory/GPM for the year Quarter-end inventory/GPM for the quarter
(Billions of ¥) (%)
Promote optimization of inventory level in line with sales and reduction of losses⇒Synergies are anticipated due to past accomplishments as well, due to
optimization of inventory and improvement of GPM
307.3 290.5 278.1 265.6 240.0 255.0 240.0 230.8 204.0 193.3 187.0 179.0
◇Apparel sales (Billions of ¥)
GPM in FY201632.3%
GPM in FY201732.5%55
50
45
40
35
30
25
20

Copyright (C) Seven & i Holdings Co., Ltd. All Rights Reserved. 26
Main Initiatives and Numerical Targets for FY2018
FY2018 plan YOY changeOperating revenue 1,260.0 bn yen +4.9 bn yenOperating income 4.0 bn yen +3.9 bn yen
Existing stores YOY 100.0% -GPM/YOY change 30.1% +1.0%
・Store closure effect Operating income +0.4 bn yen(FY2017; 15 FY2018 Q1; 5)
・Effect of integrating Seven Bi no Garden Co., LTD.⇒The cosmetic and drugs business of the household goods division that was transferred to
Seven Bi no Garden Co., LTD. in a company split was transferred to IY on March 1 in an absorption-type company split.Operating revenue of +47.0 bn yen and operating income of +1.0 bn yen are forecast
・Changes in sales area composition ratio (tenants sales area composition ratio)⇒Increase the tenant ratio of 44% at the end of FY2017 to 50% or higher by the end of FY2020
・Store closure plan ⇒No change to the store closure policy of closing 40 stores by February 28, 2021
Capital expenditure 19.3 bn yen (11.3) bn yenStore closures 8 (7)
Copyright (C) Seven & i Holdings Co., Ltd. All Rights Reserved.
Sogo & SeibuSS
27

Copyright (C) Seven & i Holdings Co., Ltd. All Rights Reserved. 28
7.4 bn
11.2 bn10.0 bn 10.1 bn 10.2 bn
7.4 bn
4.3 bn
846.8 bn830.3 bn
811.0 bn801.5 bn 803.0 bn 803.4 bn
760.7 bn
0.0
5.0
10.0
15.0
20.0
600
700
800
900
FY2011 FY2012 FY2013 FY2014 FY2015 FY2016 FY2017
Operating income
Operating revenue
◆Trends of operating revenue and operating income ◆Management Challenges
Operating income
Department store structural reforms are urgently neededPromote selection and concentration, and implement store structure reforms conducting at target stores where reforms are likely to be effective
Closed one
store
CA-PEX 25.2 bn 13.3 bn 15.4 bn 12.1bn 12.7 bn 12.6 bn 11.7 bn
Revenues from Operations, Operating Income, and Management Challenges
Year-by-year contraction of department store market
Growth investment scope limited by declining profits
Detailed negotiations with H2O Retailing Corp. are in progressDetails to be announced as they are confirmed
(Billions of ¥)
(Billions of ¥)
Closed one
store
Closed two
storesClosed
one store
Closed four
stores

Copyright (C) Seven & i Holdings Co., Ltd. All Rights Reserved. 29
100
127121
132141
130124
90
100
110
120
130
140
150
FY2011 FY2012 FY2013 FY2014 FY2015 FY2016 FY2017
Operating income growth YOY at SEIBU Ikebukuro
◆Operating income growth YOY at SEIBU Ikebukuro(indexed as FY2011 = 100)
(Index)
Results of Initiatives at Ikebukuro Flagship Store and Strategyfor FY2018
Expansion of domains that have received investment for growth has contributed significantly to store profits
Net sales (change over 10
years)
Operating income (change
over 10 years)
Cosmetics 167% 214%Ladies miscellaneous total 130% 183%
Ladies apparel 80% Lower incomeLadies select
products 145% Returned to profit
Apparel total 99% Lower incomeArt and jewelry 149% 273%
Household goods total 130% Returned to
profitFood total 115% 152%Tenant total 115% -Store total 112% 124%
◆Operating income at SEIBU Ikebukuro(before allocation of head-office expenses)
2009 -2011 Food sales area renovation2010 Cosmetics sales area renovation 2015 -2017 Luxury sales
area renovation
◆SEIBU Tokorozawa changes in food sales and customer numbersAdopt two-floor format for food●1st Phase – From Nov. 23, 2016●2nd Phase – From Feb. 25, 2017●3rd Phase – May 2017
Grand opening
Before renovation(Sep.1,2016 – Nov.22, 2016)
After renovation(Nov. 23, 2016-Mar. 31, 2017)
YOYSales
96%(97%)
111%(100%)
Before renovation(Sep.1,2016 – Nov.22, 2016)
After renovation(Nov. 23, 2016-Mar. 31, 2017)
YOYNo. of
customer
95%(97%)
119%(106%)
*Figures in parentheses are store totals

Copyright (C) Seven & i Holdings Co., Ltd. All Rights Reserved.
Expansion of Successful Example at SEIBU Ikebukuro
30
Use a PDCA cycle to expand successful examples from SEIBU Ikebukuro to other stores and achieve growth
SEIBU TokorozawaRegional leader store strategy
Sogo ChibaFood and lifestyle strategy
FY2019 onwardexpand the successful example to other stores in the Tokyo metropolitan areaSogo Chiba, Sogo Omiya
Adopt two-floor format for foodDouble-digit growth in food sales after renovationAfter verifying the effect, examine expansion to other stores
Food and experiences closely aligned to community needs
Sogo YokohamaCosmetics and beauty strategy
Strengthen cosmetics
Strengthenfood &
consumptionof “experience”

Copyright (C) Seven & i Holdings Co., Ltd. All Rights Reserved. 31
Main Initiatives and Numerical Targets for FY2018
・Effect of FY2017 structural reforms ⇒Operating income +1.4 bn yen・Impact of four store closures in FY2018 ⇒Net sales (48.5) bn yen
Operating income (0.6) bn yen・SEIBU Tokorozawa food strengthening accomplishments⇒Overall store sales increased led by food
・Main growth investments in FY2018⇒Sogo Yokohama (strengthen cosmetics) Planned for second half of FY2018
Sogo Chiba (renovate annex building) Planned for second half of FY2018SEIBU Tokorozawa (strengthen food)
FY2018 plan YOY changeOperating revenue 708.9 bn yen (51.7) bn yenOperating income 5.0 bn yen +0.6 bn yen
Existing stores YOY 99.5% -GPM/YOY change 24.2% +0.3%
Capital expenditure 13.0 bn yen +1.2 bn yen

Copyright (C) Seven & i Holdings Co., Ltd. All Rights Reserved.
Nissen HoldingsNHD
32

Copyright (C) Seven & i Holdings Co., Ltd. All Rights Reserved.
“Move Away from General Catalogue Mail Order Sales” and“Strengthen Size-Oriented Business Strategy”
33
◆Compositional ratio of LL size in the marketWomen’s
apparel market LL and above Compositional ratio
Adult women
population31.33 million 3.60 million 11.5%
Scale 5,829.0 bn yen 205.9 bn yen 3.5%
・Number of LL-sized customer members: 2.3 mllion・Biggest player with large-size market sales share of 6%
・Specification and manufacturing expertise in pursuit of optimal wearer comfort
◆Nissen’s predominance
The large-size sales channel is dispersed, and there are no purchasing locations for consumers
◆Opening of Japan’s first fashion e-commerce mall specializing in size-oriented merchandize (alinoma)
E-commerce mall bringing together 39 Japanese brands from many different companiesGrand opening on April 6 (Thu.)<Example of brands in the mall>
PC Smartphone
Considerable opportunities in the absence of a developed market
Leverage competitive advantage in the large-size market to develop a new market
Source: Female Population in 2015, Statistics Bureau, Ministry of Internal Affairs and Communications Blues will be prev subs.Source: Women’s Apparel Market Scale 2013, Yano Research Institute Ltd. Source: Estimates based on Nissen Co., Ltd.’s in-house Internet member survey (n=4,821) (2015)

Copyright (C) Seven & i Holdings Co., Ltd. All Rights Reserved.
The Omni-Chanel StrategyGroup Financial Strategy
34

Copyright (C) Seven & i Holdings Co., Ltd. All Rights Reserved. 35
Seven & i Holdings’ vision for Omni-Channel
●Launch an app around next spring targeting 80 million smartphone users●Aim for simultaneous release among multiple operating companies in addition
to SEJ
●Strengthen CRM strategies combining real stores with IT
●Ascertain purchase data for all customers, including customers paying by cash, rather than customers using nanaco only
Set the launch of an app to achieve further leap ahead centered on CRM strategy to next spring and make a sweeping revision of functions under development
The Omni-Channel Strategy

Copyright (C) Seven & i Holdings Co., Ltd. All Rights Reserved.
Group Financial Strategy
36
Joining with the retail frontline to achieve growth in the financial businessAiming to create new financial services by Seven & i Group
Objective: Further enhance convenience by providing financial services
●Provide new payment services for the Group’s 22 million daily customers
●Establish a Group financial strategy team bringing together Seven & i Holdings and financial Group companies

Copyright (C) Seven & i Holdings Co., Ltd. All Rights Reserved.
Change in Business Segments
37

Copyright (C) Seven & i Holdings Co., Ltd. All Rights Reserved. 38
Change in Business Segments
[Previous segments]
Convenience Store Operations
Superstore Operations
Department Store Operations
Food Services
Financial Services
Mail Order Services
Others
Domestic Convenience Store Operations
Seven-Eleven Japan Co., Ltd.Seven-Meal Service Co., Ltd.SEVEN-ELEVEN HAWAII, INC.SEVEN-ELEVEN (CHINA)
INVESTMENT CO., LTD.
Overseas Convenience Store Operations
7-Eleven, Inc.SEJ Asset Management & Investment
Company
Superstore OperationsIto-Yokado Co., Ltd. York-Benimaru Co., Ltd.York Mart Co., Ltd.SHELL GARDEN CO., LTD.
Department Store Operations
Sogo & Seibu Co., Ltd.GOTTSUO BIN CO., LTD.
Financial ServicesSeven Bank, Ltd. Seven Financial Service Co., Ltd. Seven Card Service Co., Ltd.Seven CS Card Service Co., Ltd.
Specialty Store Operations
Seven & i Food Systems Co., Ltd.Akachan Honpo Co., Ltd.THE LOFT CO., LTD.Nissen Holdings Co., Ltd.
OthersSeven & i Create Link., Ltd.Seven & i Netmedia Co., Ltd.SEVEN & i Publishing Co., Ltd.
[New segments] [Major operating companies]
Note:Segment changeSegment-related company changes

Copyright (C) Seven & i Holdings Co., Ltd. All Rights Reserved.
Financial Strategy
39

Copyright (C) Seven & i Holdings Co., Ltd. All Rights Reserved.
Financial Strategy
40
Capital expenditures
FY2018 plan: 807.0 bn yen (+422.8 bn yen YOY)
Domestic convenience store operations: 183.2 bn yen (+57.2 bn yen YOY)
Overseas convenience store operations:510.0 bn yen (+362.7 bn yen YOY)
Shareholder returns
Policy to maintain consolidated payout ratio of 40%
FY2017:Dividend per share of 90 yen; dividend payout ratio of 82.3%
FY2018 forecast:Dividend per share of 90 yen; dividend payout ratio of 45.0%
●Invest aggressively in domestic and overseas convenience stores, which are a growth pillar
●Maintain dividend payout ratio of 45%, higher than the target of 40%

This document contains certain statements based on the Company’s current plans, estimates,strategies, and beliefs; all statements that are not historical fact are forward-lookingstatements. These statements represent the judgments and hypotheses of the Company’smanagement based on currently available information. It is possible that the Company’sfuture performance will differ from the contents of these forward-looking statements.Accordingly, there is no assurance that the forward-looking statements in this document willprove to be accurate.