financial results q3 fy15 - niit€¦ · financial results q3 fy15 january 16, 2015 . slide •...
TRANSCRIPT

SLIDE
Financial Results Q3 FY15
January 16, 2015

SLIDE
• Increased global economic uncertainty due to financial and geo-political risks; World Bank reduces outlook on global growth. Sharp decline in commodity prices creates risks and opportunities.
• Corporate training market in US and Europe remains robust; Companies are looking for ways to transform their organization to solve business problems, eliminate waste and drive value
• In India, while expectations of improved business performance have increased, recovery remains fragile; uncertainly persists on structural reforms in the short term
• In India, Government has announced plans to form new skill development policy by March’15
• In IT Sector, increased attrition driving the hiring activity. Student sentiment remains weak
• Growing opportunities in Beyond-IT and New Age IT programs
Business confidence improved but environment remains weak
2 Environment
SLIDE
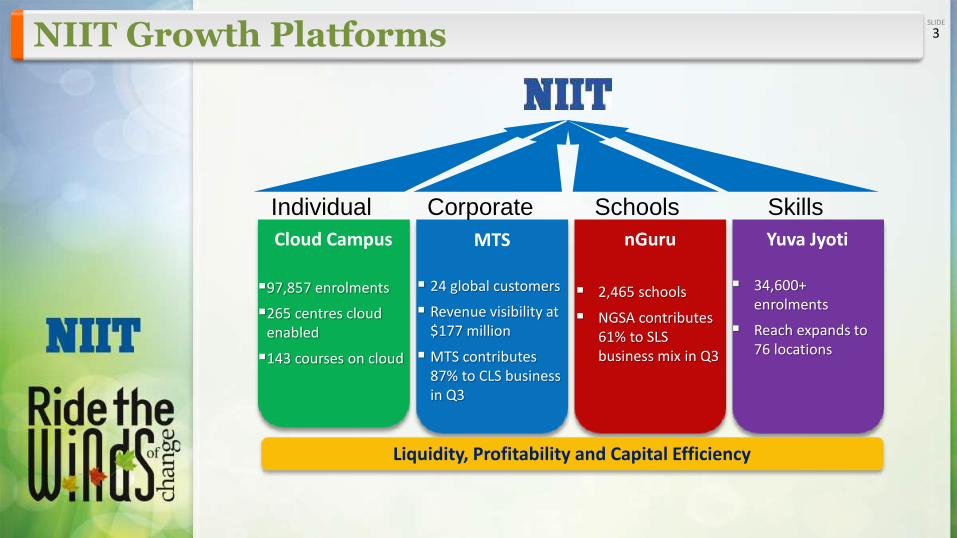
Cloud Campus
97,857 enrolments
265 centres cloud enabled
143 courses on cloud
MTS
24 global customers
Revenue visibility at $177 million
MTS contributes 87% to CLS business in Q3
nGuru
2,465 schools
NGSA contributes 61% to SLS business mix in Q3
Yuva Jyoti
34,600+ enrolments
Reach expands to 76 locations
Individual Corporate Schools Skills
NIIT Growth Platforms 3
Liquidity, Profitability and Capital Efficiency

SLIDE
Corporate Learning Solutions
• Revenue at Rs 1,360 Mn (up 28% YoY); EBITDA margin at 12%
• MTS revenue up 35% YoY, contributes 87% to CLS
• 3 MTS contracts signed during Q3; Added 1 new MTS customer
Individual Learning Solutions
• Revenue at Rs 769 Mn (down 16%)
• Good traction in the new Multi Stream, Modular RevGNIIT program ; 23% growth in RevGNIIT enrolments; Beyond-IT products contribute 33% to revenue mix (vs 28% LY)
School Learning Solutions
• Order Intake of Rs 130 Mn up 41% YoY; added 69 schools during the quarter
• NGSA Revenue at Rs 193 Mn; contributes 61% to revenue mix
NIIT: Business Transformation underway
• Rationalization of Subsidiary Company structure – Scheme of arrangement approved by Stock exchanges; Order passed by High Court to convene meeting of Shareholders & Creditors
• Revitalized organization structure for next phase of growth; Initiated refresh of Product portfolio, consolidation including capacity recalibration and cost reduction
4 Q3’FY15: In Perspective
NIIT wins the ‘Best Educational Website’ award at the 5th Annual India Digital Awards by Internet and Mobile Association of India
Leveraging seasonally weak quarters to drive business transformation

SLIDE
• Strong growth in Corporate Learning helps overcome weakness in Individual Learning and planned ramp down in GSA business
• EBITDA impacted by Business Transformation initiatives, business mix and operating leverage • Depreciation down 17% YoY, driven by planned reduction in capital intensity • Improvement in Net Other Income on account of lower net Interest costs and partial recovery
of certain doubtful debt provisions
5 Key Financials
INR Mn Q3 FY15 Q3 FY14 YoY Q2 FY'15 QoQ
System wide Revenue 3,112 3,357 -7% 3,457 -10%
Net Revenue 2,482 2,336 6% 2,604 -5%
Operating expenses 2,424 2,193 11% 2,423 0%
EBITDA 57 143 -60% 181 -68%
EBITDA% 2% 6% -380 bps 7% -464 bps
Depreciation 152 184 -17% 147 4%
Net Other Income 4 -46 108% -39 110%
Profit before Tax -91 -87 -4 mn -5 -87 mn
Tax 4 14 -10 mn 0 4 mn
Operational Net Profit -95 -101 6 mn -5 -90 mn
Share of Profits from Associates 114 113 1% 108 5%
PAT 18 12 55% 103 -82%
Basic EPS (Rs.) 0.1 0.1 55% 0.6 -82%

SLIDE
Net Revenue
EBITDA
Business Mix 6
Individual
31%
Schools
13%
Corporate
55%
Skills
2%
Q3 FY15
Growth
Corporate +28%
Individual -16%
Skills +695%
Schools -11%
Individual
39%
Schools
15%
Corporate
45%
Skills
0%
Q3 FY14
Individual
(99)
Schools
8 Corporate
157
Skills
(8)
Q3 FY15
Individual
15 Schools
20
Corporate
133
Skills
(25)
Q3 FY14
INR Mn Change
Corporate +24 Mn
Individual -115 Mn
Skills +17 Mn
Schools -12 Mn

SLIDE
7
• Revenue Volume growth: 28% YoY and 9% QoQ
• Strong business momentum, driven by 35% growth in MTS; MTS contributes 87% to CLS revenues vs 82% LY
• 3 MTS contracts signed and 1 new MTS customer added. New contract transitions add to the quarter’s costs
• Order Intake of $ 24.1 Mn; Pending Order Book: $64.5 Mn; 73% executable over next 12 months
• Revenue Visibility at $ 177 Mn
Corporate Learning Solutions
Rs. Mn Q3 FY15 Q3 FY14 YoY Q2 FY15 QoQ
Net Revenues 1,360 1,059 28% 1,248 9%
EBITDA 157 133 18% 144 10%
EBITDA % 12% 13% -99 bps 12% 6 bps
Ranked amongst Top Gamification Companies by TrainingIndustry.com

SLIDE
8
• Beyond-IT products contribute 33% to revenue mix versus 28% in Q3 FY14
• Initiated Industry sector demand led Product portfolio expansion
• Revitalized organization structure for next phase of growth
• On- ground consolidation including capacity recalibration and cost reduction.
• MoU with Guian New Area, China to support Big Data industry
• Overall Enrolments at 56,126; Order Intake of Rs 621 Mn;
• Overall placements at 6,028
Individual Learning Solutions
Rs. Mn Q3 FY15 Q3 FY14 YoY Q2 FY15 QoQ
System wide Revenues 1,399 1,939 -28% 1,857 -25%
Net Revenues 769 917 -16% 1,004 -23%
EBITDA -99 15 -756% 44 -326%
EBITDA % -13% 2% -1459 bps 4% -1733 bps

SLIDE
9
• Revenue @ Rs 39 Mn up 695% YoY
• New hub and spoke model initiated to accelerate presence across the country
• Over 3,400 enrolments during the quarter
• Business consolidation into the Skills & Careers Group
Skill Building Solutions
Rs. Mn Q3 FY15 Q3 FY14 YoY Q2 FY15 QoQ
System wide Revenues 39 5 695% 35 11%
Net Revenues 39 5 695% 35 11%
EBITDA -8 -25 17 mn -13 5 mn

SLIDE
10
• NGSA revenue at Rs 193 Mn; contributes 61% to revenue mix
• Revenue & EBITDA impacted by GSA contract completion due to planned ramp down of government business
• Order intake of Rs 130 Mn up 41% YoY fuelled by 69 new private schools
School Learning Solutions
Rs. Mn Q3 FY15 Q3 FY14 YoY Q2 FY15 QoQ
Net Revenues 314 355 -11% 318 -1%
EBITDA 8 20 -60% 7 21%
EBITDA % 3% 6% -304 bps 2% 46 bps
MathLab Impact Study* Positive experience with MathLab
95%
Principals
85%
Students Teachers
84%
*Conducted by a Big 4 firm

SLIDE
11
* excluding project retainers
Headcount up 7 QoQ and up 59 YoY
People
3,607 3,478 3,427 3,324 3,279
3,129 2,969 2,942 2,927 3,021 3,028
AMJ'12 JAS'12 OND'12 JFM'13 AMJ'13 JAS'13 OND'13 JFM'14 AMJ'14 JAS'14 OND'14

SLIDE
Share Holding Pattern 12
33% 34% 34% 34% 34% 34% 34%
19% 19% 14% 14% 11% 10% 11%
12% 12%12% 13% 15% 15% 13%
35% 35% 40% 39% 40% 41% 43%
AMJ'13 JAS'13 OND'13 JFM'14 AMJ'14 JAS'14 OND'14
Promoters FIIs FIs and Mutual Funds Individual and Corporates
Percentages may not add to 100% due to rounding

SLIDE
Thank You! 13