financial review q2 january–june 2021 29 july 2021
TRANSCRIPT

Financial review Q2 January–June 2021
29 July 2021

FINNLINES PLC Financial review Q2 2021 2
FINNLINES PLC FINANCIAL REVIEW JANUARY–JUNE 2021 (unaudited) Press Release 29 July 2021
FINNLINES’ RESULT UP IN THE SECOND QUARTER – REFLECTS IMPROVED CARGO VOLUMES JANUARY–JUNE 2021
• Revenue EUR 270.8 (236.4 in 2020) million, increase 14.6%. • Result before interest, taxes, depreciation and amortization (EBITDA) EUR 71.0 (66.4) million, increase 6.9%. • Result for the reporting period EUR 36.3 (31.7) million, increase 14.4%. • Interest bearing debt increased by EUR 36.1 million and was EUR 403.7 (367.6) million at the end of the period.
APRIL–JUNE 2021
• Revenue EUR 146.8 (105.8 in 2020) million, increase 38.7%. • Result before interest, taxes, depreciation and amortization (EBITDA) amounted to EUR 40.8 (28.2) million, increase 44.5%. • Result for the reporting period EUR 23.1 (11.0) million, increase 110.3%.
KEY FIGURES
MEUR 1–6 2021 1–6 2020 4–6 2021 4–6 2020 1–12 2020 Revenue 270.8 236.4 146.8 105.8 484.0 Result before interest, taxes, depreciation and amortisation (EBITDA) 71.0 66.4 40.8 28.2 140.8 Result before interest and taxes (EBIT) 38.5 34.2 24.4 12.2 76.2 % of revenue 14.2 14.5 16.6 11.5 15.7 Result for the reporting period 36.3 31.7 23.1 11.0 69.7 Stakeholders’ equity/share, EUR 13.93 13.56 13.90 13.60 14.07 Equity ratio, % 56.5 58.2 56.5 58.2 60.7 Net debt/EBITDA 2.8 2.1 2.8 2.1 2.3 Interest bearing debt, MEUR 403.7 367.6 403.7 367.6 331.7 Net gearing, % 56.0 50.3 56.0 50.3 45.5
EMANUELE GRIMALDI, PRESIDENT AND CEO, IN CONJUNCTION WITH THE REVIEW “The Finnlines Group’s revenue for January–June 2021 was EUR 270.8 million, an increase of 14.6% compared to the corresponding period in previous year. The result for the reporting period was EUR 36.3 million – an increase of 14.4% compared to EUR 31.7 million in January–June 2020. Earnings before interest, taxes, depreciation and amortisation, EBITDA, amounted to EUR 71.0 (66.4 in 2020) million. Our financial performance has improved regardless of the fact that passenger services remained subdued due to Finland’s tight Covid-19 related travel restrictions.
Finnlines’ profitability has improved during the last quarter, mainly due to increased cargo volumes. During the first half of 2021, Finnlines transported 391 (357 in 2020) thousand cargo units, shipped 90 (60) thousand cars and carried 228 (227) thousand private and commercial passengers. Finnlines transports more than a third of the one million rubber-tyred units, which pass annually through Finland’s major shipping routes. Finland–Estonia, Finland–Sweden and Finland–German are the main sea bridges to foreign trade in Finland. Finnlines’ extensive route network provides the Finnish export industry with a regular and reliable way into the European market, while ensuring the transport of goods from abroad to Finland that are important for security of supply.
We have noted that safe travel over the borders has gradually normalised in Europe and that the Finnish restrictions are gradually reaching the EU level. The total recovery of passenger travel is yet to come, but the more Finland aligns its travel restrictions with the rest of Europe, the more rapidly the passenger business by sea between Finland and EU returns to market terms and less state subsidies are needed. We continue to provide our environmentally friendly services on market terms without public support.
More stringent regulations from EU and IMO force the shipping industry to find ways to cut emissions, and introduce new technology. Finnlines has adopted a green path in its strategy already several years ago when decisions were made on its EUR 0.5 billion Green Newbuilding Programme. The first new ultra green hybrid ro-ro vessel will be delivered this autumn and two others will follow in early 2022. In addition, two eco-efficient Superstar ro-pax vessels will be delivered in 2023 and the construction of the first Superstar ro-pax vessel started in June, while the construction of the second is scheduled to start in October. On the whole, the Programme comprises a total of five new vessels, which are all hybrid and state-of-the-art vessels from the environmental point of view.
Finnlines, as a Finnish company and with its Finnish flagged fleet, has established itself as a key provider of maritime transport among customers, not to mention its importance for Finland’s security of supply. Now, with an extensive recruitment campaign ongoing to man the superb green and eco-efficient vessels, Finnlines stands strong and well positioned to pave the way for the new green path of the shipping industry.”

FINNLINES PLC Financial review Q2 2021 3
FINNLINES PLC, FINANCIAL REVIEW JANUARY–JUNE 2021 (unaudited)
FINNLINES’ BUSINESS Finnlines is a leading shipping operator of ro-ro and passenger services in the Baltic Sea, the North Sea and the Bay of Biscay. The Company’s passenger-freight vessels offer services from Finland to Germany and via the Åland Islands to Sweden, as well as from Sweden to Germany. Finnlines’ ro-ro vessels operate in the Baltic Sea, the North Sea and the Bay of Biscay. The Company has subsidiaries and sales offices in Germany, Belgium, Great Britain, Sweden, Denmark and Poland. In addition to sea transportation, the Company provides port services in Helsinki and Turku.
As an agent for Grimaldi Lines and Atlantic Container Line (ACL) in Finland and Russia, Finnlines connects Helsinki, St. Petersburg and Paldiski with the Grimaldi Group network in the Mediterranean, West Africa, as well as the Atlantic coast of both North and South America.
GROUP STRUCTURE Finnlines Plc is a Finnish public limited company, which operates under Finnish jurisdiction and legislation. At the end of the reporting period, the Group consisted of the parent company and 20 subsidiaries. In April 2021, Finnlines acquired the shares of real estate limited liability company Vuosaaren Porttikeskus, whose ownership at Vuosaari includes Gatehouse, Hansaterminal and P8-Porttikeskus parking house. Finnlines Group is headquartered in the Gatehouse.
Finnlines Plc is fully owned by the Grimaldi Group, which is one of the world’s largest operators of ro-ro vessels and the largest operator of the Motorways of the Sea in Europe for both passengers and freight. The Grimaldi Group, headquartered in Naples, operates a fleet of more than 130 vessels and employs approximately 16,000 people. It serves over 140 ports in 50 countries in the Mediterranean Sea, North Europe, West Africa, North and South America. The Grimaldi Group comprises seven shipping companies, including Finnlines, Atlantic Container Line (ACL), Malta Motorways of the Sea (MMS) and Minoan Lines.
GENERAL MARKET DEVELOPMENT Finnlines’ main operating area connects trade partners around the Baltic Sea. Based on the OECD Eurostat, the change of Gross Domestic Product in Europe was negative during the first quarter of 2021 in comparison with the same period in 2020. Compared with the fourth quarter of 2020, the reported GDP in Germany decreased in the first quarter of 2021 by 1.8%, while in Sweden the corresponding increase was 0.2%. In Finland GDP declined in the first quarter by 0.1% compared with the previous quarter. (Eurostat 2021.)
Based on the statistics by Statistics Finland for January–May, the Finnish seaborne imports carried in container, lorry and trailer units (measured in tons) increased by 2% and exports increased by 8%. During the same period private and commercial passenger traffic between Finland and Sweden decreased by 71%, between Finland and Germany the traffic decreased by 29%. (Statistics Finland.)
FINNLINES TRAFFIC In April 2021, Finnlines increased the vessel capacity and time-chartered MS Eurocargo Savona from the Grimaldi Group. The vessel started to operate in Hanko–Rostock traffic while MS Finnpulp was moved in TRE traffic as a second vessel, increasing the number of departures between Germany, Russia and Finland. During the second quarter Finnlines operated on average 21 (20) vessels in its own traffic.
The cargo volumes transported during January–June totalled approximately 391 (357 in 2020) thousand cargo units, 90 (60) thousand cars (not including passengers’ cars) and 682 (522) thousand tons of freight not possible to measure in units. In addition, some 228 (227) thousand private and commercial passengers were transported.
FINANCIAL RESULTS January–June 2021 The Finnlines Group recorded revenue totalling EUR 270.8 (236.4) million in the reporting period, an increase of 14.6% compared to the same period in the previous year. Shipping and Sea Transport Services generated revenue amounting to EUR 258.1 (225.2) million, of which passenger related revenue was EUR 14.2 (14.6) million. The revenue of Port Operations was EUR 24.1 (21.3) million. During the first half of 2021, transported cargo volumes increased clearly compared to last year. In January–June 2021 the number of private passengers remained below last year’s level. In Port Operations the revenue increased due to the higher amount of cargo. The internal revenue between the segments was EUR 11.4 (10.1) million.
Result before interest, taxes, depreciation and amortisation (EBITDA) was EUR 71.0 (66.4) million, an increase of 6.9%.
Result before interest and taxes (EBIT) was EUR 38.5 (34.2) million.
As a result of the improved financial position, net financial expenses decreased to EUR -2.3 (-2.9) million. Financial income was EUR 0.1 (0.2) million and financial expenses EUR -2.3 (-3.1) million. Result before taxes (EBT) increased by EUR 4.9 million and was EUR 36.2 (31.3) million. The result for the reporting period was EUR 36.3 (31.7) million.
FINNLINES PLC Financial review Q2 2021 4
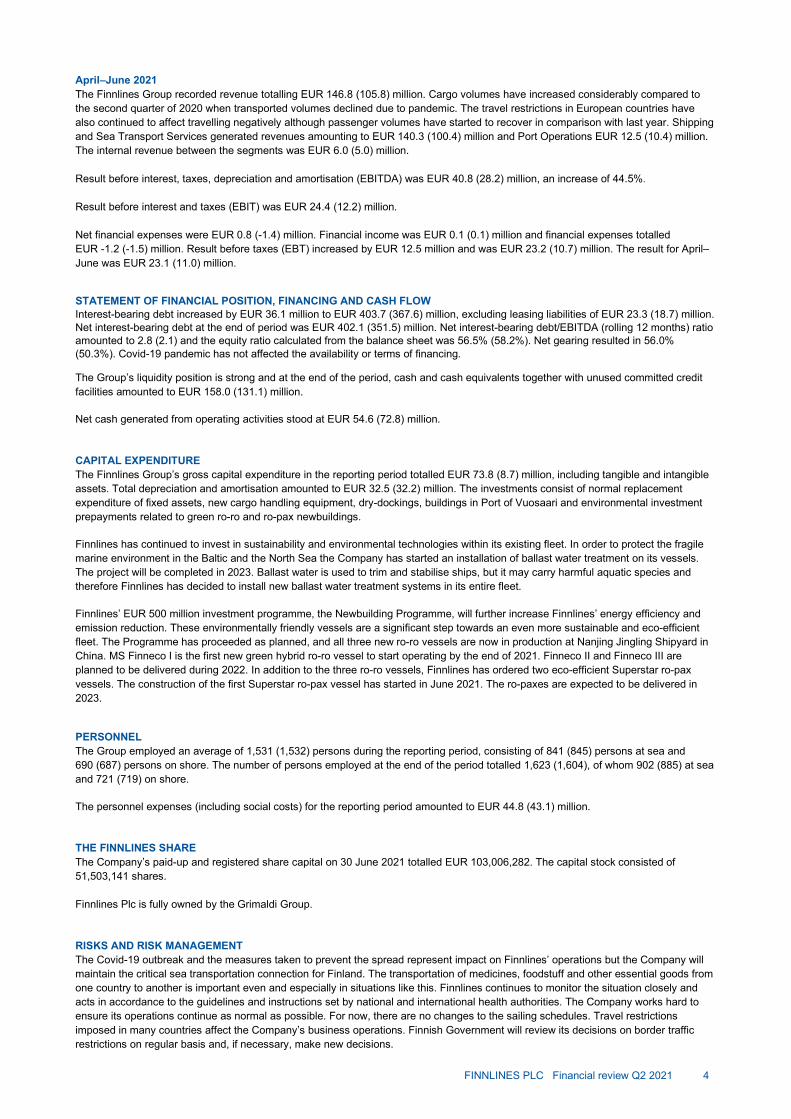
April–June 2021 The Finnlines Group recorded revenue totalling EUR 146.8 (105.8) million. Cargo volumes have increased considerably compared to the second quarter of 2020 when transported volumes declined due to pandemic. The travel restrictions in European countries have also continued to affect travelling negatively although passenger volumes have started to recover in comparison with last year. Shipping and Sea Transport Services generated revenues amounting to EUR 140.3 (100.4) million and Port Operations EUR 12.5 (10.4) million. The internal revenue between the segments was EUR 6.0 (5.0) million. Result before interest, taxes, depreciation and amortisation (EBITDA) was EUR 40.8 (28.2) million, an increase of 44.5%. Result before interest and taxes (EBIT) was EUR 24.4 (12.2) million. Net financial expenses were EUR 0.8 (-1.4) million. Financial income was EUR 0.1 (0.1) million and financial expenses totalled EUR -1.2 (-1.5) million. Result before taxes (EBT) increased by EUR 12.5 million and was EUR 23.2 (10.7) million. The result for April–June was EUR 23.1 (11.0) million.
STATEMENT OF FINANCIAL POSITION, FINANCING AND CASH FLOW Interest-bearing debt increased by EUR 36.1 million to EUR 403.7 (367.6) million, excluding leasing liabilities of EUR 23.3 (18.7) million. Net interest-bearing debt at the end of period was EUR 402.1 (351.5) million. Net interest-bearing debt/EBITDA (rolling 12 months) ratio amounted to 2.8 (2.1) and the equity ratio calculated from the balance sheet was 56.5% (58.2%). Net gearing resulted in 56.0% (50.3%). Covid-19 pandemic has not affected the availability or terms of financing.
The Group’s liquidity position is strong and at the end of the period, cash and cash equivalents together with unused committed credit facilities amounted to EUR 158.0 (131.1) million.
Net cash generated from operating activities stood at EUR 54.6 (72.8) million.
CAPITAL EXPENDITURE The Finnlines Group’s gross capital expenditure in the reporting period totalled EUR 73.8 (8.7) million, including tangible and intangible assets. Total depreciation and amortisation amounted to EUR 32.5 (32.2) million. The investments consist of normal replacement expenditure of fixed assets, new cargo handling equipment, dry-dockings, buildings in Port of Vuosaari and environmental investment prepayments related to green ro-ro and ro-pax newbuildings.
Finnlines has continued to invest in sustainability and environmental technologies within its existing fleet. In order to protect the fragile marine environment in the Baltic and the North Sea the Company has started an installation of ballast water treatment on its vessels. The project will be completed in 2023. Ballast water is used to trim and stabilise ships, but it may carry harmful aquatic species and therefore Finnlines has decided to install new ballast water treatment systems in its entire fleet.
Finnlines’ EUR 500 million investment programme, the Newbuilding Programme, will further increase Finnlines’ energy efficiency and emission reduction. These environmentally friendly vessels are a significant step towards an even more sustainable and eco-efficient fleet. The Programme has proceeded as planned, and all three new ro-ro vessels are now in production at Nanjing Jingling Shipyard in China. MS Finneco I is the first new green hybrid ro-ro vessel to start operating by the end of 2021. Finneco II and Finneco III are planned to be delivered during 2022. In addition to the three ro-ro vessels, Finnlines has ordered two eco-efficient Superstar ro-pax vessels. The construction of the first Superstar ro-pax vessel has started in June 2021. The ro-paxes are expected to be delivered in 2023.
PERSONNEL The Group employed an average of 1,531 (1,532) persons during the reporting period, consisting of 841 (845) persons at sea and 690 (687) persons on shore. The number of persons employed at the end of the period totalled 1,623 (1,604), of whom 902 (885) at sea and 721 (719) on shore.
The personnel expenses (including social costs) for the reporting period amounted to EUR 44.8 (43.1) million.
THE FINNLINES SHARE The Company’s paid-up and registered share capital on 30 June 2021 totalled EUR 103,006,282. The capital stock consisted of 51,503,141 shares. Finnlines Plc is fully owned by the Grimaldi Group.
RISKS AND RISK MANAGEMENT The Covid-19 outbreak and the measures taken to prevent the spread represent impact on Finnlines’ operations but the Company will maintain the critical sea transportation connection for Finland. The transportation of medicines, foodstuff and other essential goods from one country to another is important even and especially in situations like this. Finnlines continues to monitor the situation closely and acts in accordance to the guidelines and instructions set by national and international health authorities. The Company works hard to ensure its operations continue as normal as possible. For now, there are no changes to the sailing schedules. Travel restrictions imposed in many countries affect the Company’s business operations. Finnish Government will review its decisions on border traffic restrictions on regular basis and, if necessary, make new decisions.

FINNLINES PLC Financial review Q2 2021 5
Finnlines is exposed to business risks that arise from the capacity of the fleet existing in the market, counterparties, prospects for export and import of goods, and changes in the operating environment. The risk of overcapacity is reduced through scrapping of aging vessels, on the one hand, and the more stringent environmental requirements, on the other. The continuity of operations is ensured by safeguarding critical functions and essential resources. The majority of the Group’s non-current assets consist of its fleet. The fleet is always insured to its full value.
Stricter environmental regulations (e.g. NOx, SOx and CO2 emission, wastewater and ballast water regulations) are the risk factors that could affect the Group’s business. However, through the constant renewal and development of the fleet, using the latest technology and innovations, Finnlines is very well-positioned to greatly mitigate this risk.
The effect of fluctuations in the foreign trade is reduced by the fact that the Company operates in several geographical areas. This means that slow growth in one country is compensated by faster recovery in another. Finnlines continuously monitors the solidity and payment schedules of its customers and suppliers. Currently, there are no indications of imminent risks related to counterparties but the Company continues to monitor the financial position of its counterparties. Finnlines holds adequate credit lines to maintain liquidity in the current business environment.
Finnlines has cash and unused committed credit facilities over EUR 150 million and the Company has initiated cost saving plans in April 2020, which both have continued to enable the Company to mitigate the negative effects of Covid-19 pandemic.
LEGAL PROCEEDINGS Finnlines has made an appeal to the Helsinki Administrative Court of the National Emergency Supply Agency’s decision concerning the compensation of costs for securing maritime transport. Finnlines has also appealed to Market Court concerning the Finnish Transport and Communications Agency's calls for tenders concerning imposing a public service obligation for the aid of maritime traffic on the Turku/Naantali–Mariehamn/Långnäs–Stockholm, Kapellskär–Mariehamn, Naantali–Långnäs, Grisslehamn–Eckerö and Helsinki–Tallinn routes. In addition, Finnlines has made a complaint to the European Commission concerning Covid-19 situation related selective and discriminatory aid measures launched by the Finnish authorities.
Finnlines is in addition involved in a few legal proceedings and disputes whose outcome cannot be predicted, but taking into account the information that is available at present, their outcome is not expected to have any substantial impact on the Group’s profit.
CORPORATE GOVERNANCE The Corporate Governance Statement can be reviewed on the Company’s website: www.finnlines.com.
EVENTS AFTER THE REPORTING PERIOD There are no significant events to report.
OUTLOOK AND OPERATING ENVIRONMENT Although some travel restrictions have been eased and the Finnish Government has a plan for gradual opening of travelling, some uncertainties remain in passenger operations.
Finnlines deployed cost saving measures from April 2020, which has enabled the Company to maintain proper cost efficiency during this year as well. All in all, the year looks promising with increased export and import volumes, and, including the delivery of the first new large and ultra green ro-ro vessel at the very end of the year.
The Finnlines Group has a strong balance sheet, and considering also Finnlines’ position as a key service provider among its customers, it is expected that the Company maintains its strong position throughout this extraordinary period.
The third financial review of 2021 for the period of 1 January–30 September 2021 will be published on Tuesday, 9 November 2021.
Finnlines Plc The Board of Directors Emanuele Grimaldi President and CEO
FURTHER INFORMATION Tom Pippingsköld, Vice President and Deputy CEO, CFO, tel. +358 40 519 5041, [email protected]

FINNLINES PLC Financial review Q2 2021 6
ENCLOSURES - Reporting and accounting policies - Consolidated statement of comprehensive income, IFRS - Consolidated statement of financial position, IFRS - Consolidated statement of changes in equity, IFRS - Consolidated cash flow statement, IFRS - Revenue and result by business segments - Revenue by geographical area - Revenue by functions - Property, plant and equipment - Leases - Fair value hierarchy - Contingencies and commitments - Revenue and result by quarter - Share information - Events after the reporting period - Calculation of ratios - Related party transactions DISTRIBUTION Main media This interim report is unaudited.
REPORTING AND ACCOUNTING POLICIES This interim report included herein is prepared in accordance with IAS 34 (Interim Financial Reporting) standard. The accounting policies are the same as those applied in the last annual financial statements.
Finnlines Plc entered into the tonnage taxation regime in January 2013. In tonnage taxation, shipping operations transferred from taxation of business income to tonnage-based taxation.
All figures in the accounts have been rounded and, consequently, the sum of individual figures may deviate from the presented sum figure.
The preparation of the interim financial statements in accordance with IFRS requires management to make estimates and assumptions and use its discretion in applying the accounting principles that affect the valuation of the reported assets and liabilities and other information such as contingent liabilities and the recognition of income and expenses in the income statement. Although the estimates are based on the management’s best knowledge of current events and actions, actual results may differ from the estimates. The uncertainties related to the key assumptions were the same as those applied to the consolidated financial statements at the year-end 31 December 2020.
The Covid-19 pandemic has increased uncertainty in economy. Company’s management has assessed Covid-19’s implications to Group’s financial result, balance sheet and cash flow. The pandemic has had negative impact to Group’s operations, but in an attempt to mitigate it, the Company has initiated cost saving plans already in April 2020. The Group has strong balance sheet, cost-efficient operations and unused credit facilities, which all provide financial flexibility. Management has also examined the need for impairment testing its assets. According to Group’s management’s current view, the pandemic does not have such long-term effects that would degrade Groups goodwill or other non-current assets. Considering the Finnlines Group’s investment to energy-efficient fleet, it can be expected that the Company will remain strong through this period in time. The pandemic has not caused material increase in the amount of expected credit losses.
Finnlines Group acquired shares of Kiinteistö Oy Vuosaaren Porttikeskus real estate company in April 2021. The property is mainly used as Finnlines’ headquarter and for its own activities. The cost method in line with IAS 16 is applied for the whole property. Part of the buildings/premises are leased out to tenants under operating leases. The group intends to change the articles of association of the mutual real estate company into ordinary real estate company.

FINNLINES PLC Financial review Q2 2021 7
CONSOLIDATED STATEMENT OF COMPREHENSIVE INCOME, IFRS
EUR 1,000 4–6 2021 4–6 2020 1–6 2021 1–6 2020 1–12 2020 Revenue 146,785 105,831 270,841 236,376 484,016 Other income from operations 601 225 823 436 1,303
Materials and services -48,009 -28,046 -89,803 -66,250 -137,964 Personnel expenses -22,873 -21,632 -44,805 -43,111 -83,376 Depreciation, amortisation and impairment losses -16,352 -16,038 -32,509 -32,215 -64,599 Other operating expenses -35,747 -28,167 -66,037 -61,001 -123,164
Total operating expenses -122,981 -93,883 -233,154 -202,577 -409,104 Result before interest and taxes (EBIT) 24,405 12,173 38,510 34,235 76,215 Financial income 41 80 61 171 494 Financial expenses -1,245 -1,512 -2,340 -3,070 -6,065 Result before taxes (EBT) 23,202 10,740 36,231 31,335 70,645 Income taxes -140 228 30 352 -918 Result for the reporting period 23,062 10,969 36,261 31,687 69,727 Other comprehensive income: Other comprehensive income to be reclassified to profit and loss in subsequent periods: Exchange differences on translating foreign operations -2 -20 43 -55 -45 Fair value changes on currency derivatives -535 -1,884 8,242 3,431 -8,245 Other comprehensive income to be reclassified to profit and loss in subsequent periods, total -537 -1,904 8,285 3,376 -8,290 Other comprehensive income not being reclassified to profit and loss in subsequent periods: Remeasurement of defined benefit plans 0 0 0 0 -120 Tax effect, net 21 Other comprehensive income not being reclassified to profit and loss in subsequent periods, total 0 0 0 0 -100 Total comprehensive income for the reporting period 22,525 9,065 44,545 35,063 61,336 Result for the reporting period attributable to: Parent company shareholders 23,062 10,969 36,261 31,687 69,727 23,062 10,969 36,261 31,687 69,727 Total comprehensive income for the reporting period attributable to: Parent company shareholders 22,525 9,065 44,545 35,063 61,336 22,525 9,065 44,545 35,063 61,336 Result for the reporting period attributable to parent company shareholders calculated as earnings per share (EUR/share) Undiluted / diluted earnings per share 0.45 0.21 0.70 0.62 1.35 Average number of shares Undiluted / diluted 51,503,141 51,503,141 51,503,141 51,503,141 51,503,141
Most of the items recognised in the Consolidated Statement of Comprehensive Income fall under the tonnage tax scheme.

FINNLINES PLC Financial review Q2 2021 8
CONSOLIDATED STATEMENT OF FINANCIAL POSITION, IFRS
EUR 1,000 30 Jun 2021 30 Jun 2020 31 Dec 2020 ASSETS Non-current assets Property, plant and equipment 1,016,356 957,245 967,748 Goodwill 105,644 105,644 105,644 Other intangible assets 3,388 3,850 3,671 Other financial assets 7,076 7,075 7,076 Receivables 2,979 13,866 3,929 Deferred tax assets 2,380 2,967 2,370 1,137,821 1,090,646 1,090,438 Current assets Inventories 7,422 5,564 5,967 Accounts receivable and other receivables 119,322 81,915 86,471 Income tax receivables 30 0 32 Cash and cash equivalents 1,581 16,069 1,847 128,355 103,548 94,317 Non-current assets held for sale 14,610 14,610 14,610 Total assets 1,280,787 1,208,805 1,199,365 EQUITY Equity attributable to parent company shareholders Share capital 103,006 103,006 103,006 Share premium account 24,525 24,525 24,525 Translation differences 133 109 114 Fund for invested unrestricted equity 40,016 40,016 40,016 Fair value reserve * 9,620 13,054 1,378 Retained earnings 540,195 517,468 555,413 717,495 698,180 724,453 Non-controlling interests 0 0 0 Total equity 717,495 698,180 724,453 LIABILITIES Long-term liabilities Deferred tax liabilities 46,384 45,989 46,509 Pension liabilities 3,342 3,453 3,331 Provisions 1,697 1,697 1,697 Loans from financial institutions 260,835 232,594 180,383 312,258 283,733 231,920 Current-liabilities Accounts payable and other liabilities 84,655 72,964 73,798 Current tax liabilities 0 0 27 Provisions 215 220 220 Loans from financial institutions 166,163 153,708 168,946 251,033 226,893 242,992 Total liabilities 563,291 510,625 474,912 Total equity and liabilities 1,280,787 1,208,805 1,199,365
* Fair value reserve consists of fair value of effective part of foreign currency forward contracts, for which hedge accounting is applied.

FINNLINES PLC Financial review Q2 2021 9
CONSOLIDATED STATEMENT OF CHANGES IN EQUITY 2020, IFRS
EUR 1,000 Equity attributable to parent company shareholders
Share
capital
Share issue
premium Translation differences
Unrestricted equity
reserve Fair value
reserve Retained earnings Total equity
Reported equity 1 January 2020 103,006 24,525 140 40,016 9,623 537,310 714,620 Comprehensive income for the reporting period:
Result for the reporting period 31,687 31,687 Exchange differences on translating foreign operations -31 -25 -55 Fair value changes on currency derivatives 3,431 3,431 Total comprehensive income for the reporting period 0 0 -31 0 3,431 31,662 35,063
Dividend -51,503 -51,503
Equity 30 June 2020 103,006 24,525 109 40,016 13,054 517,468 698,180
CONSOLIDATED STATEMENT OF CHANGES IN EQUITY 2021, IFRS
EUR 1,000 Equity attributable to parent company shareholders
Share
capital
Share issue
premium Translation differences
Unrestricted equity
reserve Fair value
reserve Retained earnings Total equity
Reported equity 1 January 2021 103,006 24,525 114 40,016 1,378 555,413 724,452 Comprehensive income for the reporting period:
Result for the reporting period 36,261 36,261 Exchange differences on translating foreign operations 19 24 24 Fair value changes on currency derivatives 8,242 8,242 Total comprehensive income for the reporting period 0 0 19 0 8,242 36,285 44,545
Dividend -51 503 -51,503
Equity 30 June 2021 103,006 24,525 133 40,016 9,620 540,195 717,495

FINNLINES PLC Financial review Q2 2021 10
CONSOLIDATED CASH FLOW STATEMENT, IFRS
EUR 1,000 1–6 2021 1–6 2020 1–12 2020 Cash flows from operating activities Results for the reporting period 36,261 31,687 69,727 Adjustments
Non-cash transactions 32,496 32,080 64,167 Unrealised foreign exchange gains (-) / losses (+) -2 -2 Financial income and expenses 2,280 2,902 5,568 Taxes -30 -352 918
Changes in working capital Change in accounts receivable and other receivables -24,929 5,088 -66 Change in inventories -1,455 588 185 Change in accounts payable and other liabilities 11,961 3,134 3,674 Change in provisions 5 -22 -143
Interest paid -1,067 -1,337 -3,589 Interest received 13 30 50 Taxes paid -130 -114 -252 Other financing items -778 -877 -2,209 Net cash generated from operating activities 54,627 72,803 138,030 Cash flow from investing activities Investments in tangible and intangible assets -73,981 -8,313 -50,401 Sale of tangible assets 358 141 126 Acquisition of non-controlling interests 0 Net cash used in investing activities -73,623 -8,173 -50,275 Cash flows from financing activities Loan withdrawals 159,538 40,000 54,000 Net increase in current interest-bearing liabilities (+) / net decrease (-) -2,118 -18,257 -2,973 Repayment of loans -85,320 -26,326 -91,204 Payment of lease liabilities (2018 Payment of finance lease liabilities) -1,873 -1,673 -3,427 Dividends paid -51,503 -51,503 -51,503 Net cash used in financing activities 18,725 -57,760 -95,108 Change in cash and cash equivalents -271 9,208 -7,353 Cash and cash equivalents 1 January 1,847 6,870 9,208 Effect of foreign exchange rate change 5 -9 -8 Cash and cash equivalents at the end of periods 1,581 16,069 1,847
FINNLINES PLC Financial review Q2 2021 11
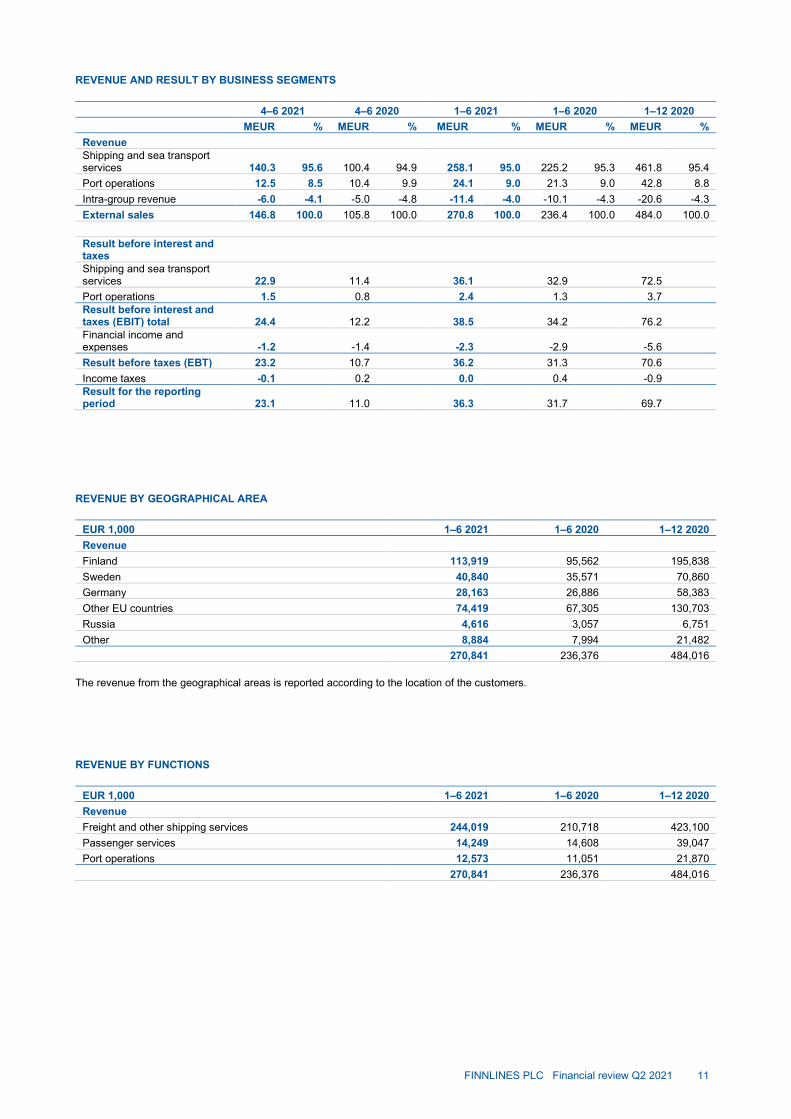
REVENUE AND RESULT BY BUSINESS SEGMENTS
4–6 2021 4–6 2020 1–6 2021 1–6 2020 1–12 2020 MEUR % MEUR % MEUR % MEUR % MEUR % Revenue Shipping and sea transport services 140.3 95.6 100.4 94.9 258.1 95.0 225.2 95.3 461.8 95.4 Port operations 12.5 8.5 10.4 9.9 24.1 9.0 21.3 9.0 42.8 8.8 Intra-group revenue -6.0 -4.1 -5.0 -4.8 -11.4 -4.0 -10.1 -4.3 -20.6 -4.3 External sales 146.8 100.0 105.8 100.0 270.8 100.0 236.4 100.0 484.0 100.0 Result before interest and taxes
Shipping and sea transport services 22.9
11.4 36.1 32.9 72.5
Port operations 1.5 0.8 2.4 1.3 3.7 Result before interest and taxes (EBIT) total 24.4
12.2 38.5 34.2 76.2
Financial income and expenses -1.2
-1.4 -2.3 -2.9 -5.6
Result before taxes (EBT) 23.2 10.7 36.2 31.3 70.6 Income taxes -0.1 0.2 0.0 0.4 -0.9 Result for the reporting period 23.1
11.0 36.3 31.7 69.7
REVENUE BY GEOGRAPHICAL AREA
EUR 1,000 1–6 2021 1–6 2020 1–12 2020 Revenue Finland 113,919 95,562 195,838 Sweden 40,840 35,571 70,860 Germany 28,163 26,886 58,383 Other EU countries 74,419 67,305 130,703 Russia 4,616 3,057 6,751 Other 8,884 7,994 21,482 270,841 236,376 484,016
The revenue from the geographical areas is reported according to the location of the customers.
REVENUE BY FUNCTIONS
EUR 1,000 1–6 2021 1–6 2020 1–12 2020 Revenue Freight and other shipping services 244,019 210,718 423,100 Passenger services 14,249 14,608 39,047 Port operations 12,573 11,051 21,870 270,841 236,376 484,016

FINNLINES PLC Financial review Q2 2021 12
PROPERTY, PLANT AND EQUIPMENT 2021
EUR 1,000 Land Buildings Vessels
Machinery and
equipment
Advance payments & acquisitions
under construction Total
Acquisition cost 1 January 2021 72 66,848 1,486,518 65,826 59,521 1,678,784 Exchange rate differences -1 12 11 Increases 1,053 40,993 7,016 808 39,346 89,216 Disposals -49 -33 -82 Reclassifications between items 627 -627 Reclassifications to non-current assets held for sale * -3,297 -22,395 -25,691 Acquisition cost 30 June 2021 1,125 104,544 1,494,112 44,218 98,239 1,742,238 Accumulated depreciation, amortisation and write-offs 1 January 2021 -25,156 -644,563 -44,175 -713,894 Exchange rate differences 1 -11 -10 Cumulative depreciation on reclassifications, increases and disposals -15,159 49 -360 -15,471 Depreciation for the reporting period -1,253 -28,849 -528 -30,630 Accumulated depreciation, amortisation and write-offs 30 June 2021 -41,566 -673,363 -45,074 -760,004 Reclassifications to non-current assets held for sale * 570 10,510 11,081 Carrying value 30 June 2021 1,125 63,548 820,749 9,654 98,239 993,315
Not including right-of-use assets. * The Finnlines Group is negotiating a sale of Port Operations’ assets with carrying value of EUR 14.6 (14.6) million. No impairment losses were recognised on the carrying values of these assets in 2020 or 2021, as according to management’s estimate, the fair value of the assets classified as held for sale was higher than the carrying value at the balance sheet date 30 June 2020 and 30 June 2021.
EUR 1,000 Land and water Buildings and
structures Machinery and
equipment Total Right-of-use assets 2021 Acquisition cost 1 January 2021 18,642 3,832 1,439 23,913 Exchange rate differences 1 1 Increases 7,379 33 7,413 Disposals -2,099 -2,099 Reclassifications between items 2 1 2 Acquisition cost 30 June 2021 26,021 1,735 1,474 29,230 Accumulated depreciation, amortisation and write-offs 1 January 2021 -3,466 -2,202 -776 -6,444 Exchange rate differences Cumulative depreciation on reclassifications and disposals 1,753 Depreciation for the reporting period -907 -430 -158 -1,496 Accumulated depreciation, amortisation and write-offs 30 June 2021 -4,373 -880 -935 -6,188 Carrying value 30 June 2021 21,648 854 539 23,041 Property, plant and equipment, total 1,016,356
EUR 1,000 Buildings Machinery and
equipment Total Assets classified as held for sale 1 January 2021 Acquisition cost Transfer to non-current assets held for sale 3,297 22,395 25,691 Accumulated depreciation Transfer to non-current assets held for sale -570 -10,510 -11,081 Carrying value 30 June 2021 2,726 11,884 14,610

FINNLINES PLC Financial review Q2 2021 13
PROPERTY, PLANT AND EQUIPMENT 2020
EUR 1,000 Land Buildings Vessels
Machinery and
equipment
Advance payments & acquisitions
under construction Total
Acquisition cost 1 January 2020 72 67,348 1,477,184 66,169 19,884 1,630,657
Exchange rate differences 2 -19
-17 Increases 6,870 160 1,331 8,361 Disposals -515 -451 -265 -1,231 Reclassifications between items 14 371 38 -423 0 Reclassifications to non-current assets held for sale * -3,297 -22,395 -25,691 Acquisition cost 30 June 2020 72 63,552 1,483,974 43,689 20,792 1,612,079 Accumulated depreciation, amortisation and write-offs 1 January 2020 -23,747 -587,887 -43,878 -655,511 Exchange rate differences -2 17 15 Cumulative depreciation on reclassifications and disposals 511 450 268 1,229 Depreciation for the reporting period -959 -28,740 -515 -30,213 Accumulated depreciation, amortisation and write-offs 30 June 2020 -24,197 -616,176 -44,108 -684,481 Reclassifications to non-current assets held for sale * 570 10,510 11,081 Carrying value 30 June 2020 72 39,926 867,798 10,091 20,792 938,678
Not including right-of-use assets. * The Finnlines Group is negotiating a sale of Port Operations’ assets with carrying value of EUR 14.6 (15.1) million. No impairment losses were recognised on the carrying values of these assets in 2019 or 2020, as according to management’s estimate, the fair value of the assets classified as held for sale was higher than the carrying value at the balance sheet date 30 June 2019 and 30 June 2020.
EUR 1,000 Land and water Buildings and
structures Machinery and
equipment Total Right-of-use assets 2020 Acquisition cost 1 January 2020 18,642 2,514 1,018 22,174 Exchange rate differences -1 -1 Increases 956 956 Disposals Reclassifications between items -2 -1 -4 Acquisition cost 30 June 2020 18,642 3,468 1,015 23,125 Accumulated depreciation, amortisation and write-offs 1 January 2020 -1,733 -861 -372 -2,966 Exchange rate differences 1 1 Cumulative depreciation on reclassifications and disposals 1 1 1 Depreciation for the reporting period -866 -543 -184 -1,593 Accumulated depreciation, amortisation and write-offs 30 June 2020 -2,599 -1,402 -555 -4,558 Carrying value 30 June 2020 16,042 2,063 460 18,566 Property, plant and equipment, total 957,245
EUR 1,000 Buildings Machinery and
equipment Total Assets classified as held for sale 1 January 2020 Acquisition cost Transfer to non-current assets held for sale 3,297 22,395 25,691 Accumulated depreciation Transfer to non-current assets held for sale -570 -10,510 -11,081 Carrying value 30 June 2020 2,726 11,884 14,610

FINNLINES PLC Financial review Q2 2021 14
LEASES
Finnlines does not apply practical expedient, by which service components are not separated from lease contract components.
Finnlines has included the value of option in such contracts where the leased facility has strategic long term value.
Amounts recognized in profit or loss
EUR 1,000 1–6 2021 1–6 2020 Interest on lease liabilities 30 June 147 120 Expenses relating to short-term leases 53 144 Expenses relating to low-value assets 152 161 Service components of lease payments 30 June 65 99 Lease payments of all leases accounted according to IFRS 16 1,582 1,669 Total cash flow of all leases 30 June 1,852 2,073
Maturity analysis
EUR 1,000 2021 2020 Contractual undiscounted cash flows Less than one year 3,593 3,187 One to five years 9,635 8,482 More than five years 23,212 15,535 Total undiscounted lease liabilities at 30 June 36,440 27,204 Short term leasing liability 2,217 2,928 Long term leasing liability 21,076 15,792 Lease liabilities included in statement of financial position at 30 June 23,293 18,720
FAIR VALUE HIERARCHY OF FINANCIAL INSTRUMENTS
Level 1 - Quoted prices (unadjusted) in active markets for identical assets or liabilities.
Level 2 - Inputs other than quoted prices included within Level 1 that are observable for the asset or liability, either directly (i.e., as prices) or indirectly (i.e., derived from prices).
The Group has loans from financial institutions and pension loans and commercial papers belonging to level 2. Also included in level 2 are foreign currency derivatives acquired to hedge against cash flow risk related to committed vessel orders. There is no material difference between carrying values and fair values of these instruments.
Level 3 - Inputs for the asset or liability that are not based on observable market data (unobservable inputs).
Level 3 includes unlisted shares amounting to EUR 7.1 million (7.1 in 2020), which are valued at the lower of acquisition cost or probable value, as their fair value cannot be reliably measured. Majority of the unlisted shares consists of Steveco Oy’s shares of which Finnlines owns 25.4%. This shareholding is presented in financial assets, because Finnlines has does not have significant influence in Steveco Oy.
FINNLINES PLC Financial review Q2 2021 15
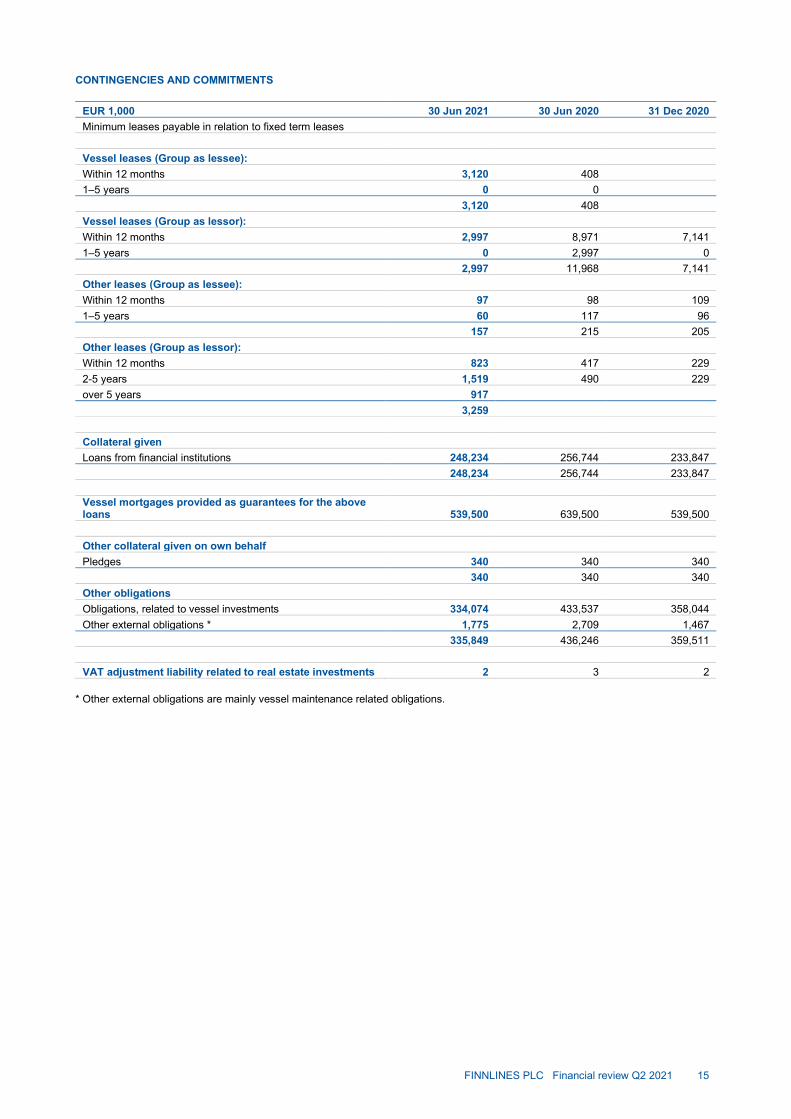
CONTINGENCIES AND COMMITMENTS
EUR 1,000 30 Jun 2021 30 Jun 2020 31 Dec 2020 Minimum leases payable in relation to fixed term leases Vessel leases (Group as lessee): Within 12 months 3,120 408 1–5 years 0 0 3,120 408 Vessel leases (Group as lessor): Within 12 months 2,997 8,971 7,141 1–5 years 0 2,997 0 2,997 11,968 7,141 Other leases (Group as lessee): Within 12 months 97 98 109 1–5 years 60 117 96 157 215 205 Other leases (Group as lessor): Within 12 months 823 417 229 2-5 years 1,519 490 229 over 5 years 917 3,259 Collateral given Loans from financial institutions 248,234 256,744 233,847 248,234 256,744 233,847 Vessel mortgages provided as guarantees for the above loans 539,500 639,500 539,500 Other collateral given on own behalf Pledges 340 340 340 340 340 340 Other obligations Obligations, related to vessel investments 334,074 433,537 358,044 Other external obligations * 1,775 2,709 1,467 335,849 436,246 359,511 VAT adjustment liability related to real estate investments 2 3 2
* Other external obligations are mainly vessel maintenance related obligations.

FINNLINES PLC Financial review Q2 2021 16
REVENUE AND RESULT BY QUARTER
MEUR Q1/21 Q1/20 Q2/21 Q2/20 Q3/21 Q3/20 Q4/21 Q4/20 Revenue Shipping and sea transport services 117.8 124.7 140.3 100.4 121.2 115.4 Port operations 11.7 10.9 12.5 10.4 10.6 10.9 Intra-group revenue -5.4 -5.1 -6.0 -5.0 -5.1 -5.4 External sales 124.1 130.5 146.8 105.8 126.7 120.9 Result before interest and taxes Shipping and sea transport services 13.2 21.5 22.9 11.4 23.0 16.6 Port operations 0.9 0.6 0.6 0.8 1.4 0.9 Result before interest and taxes (EBIT) total 14.1 22.1 24.4 12.2 24.5 17.5 Financial income and expenses -1.1 -1.5 -1.2 -1.4 -1.5 -1.2 Result before taxes (EBT) 13.0 20.6 23.2 10.7 23.0 16.3 Income taxes 0.2 0.1 -0.1 0.2 -0.5 -0.8 Result for the reporting period 13.2 20.7 23.1 11.0 22.5 15.6 EPS (undiluted / diluted) EUR 0.26 0.40 0.45 0.21 0.44 0.30
SHARE INFORMATION
30 Jun 2021 30 Jun 2020 Number of shares 51,503,141 51,503,141
Finnlines Plc is fully owned by the Grimaldi Group.
EVENTS AFTER THE REPORTING PERIOD There are no significant events to report.
FINNLINES PLC Financial review Q2 2021 17
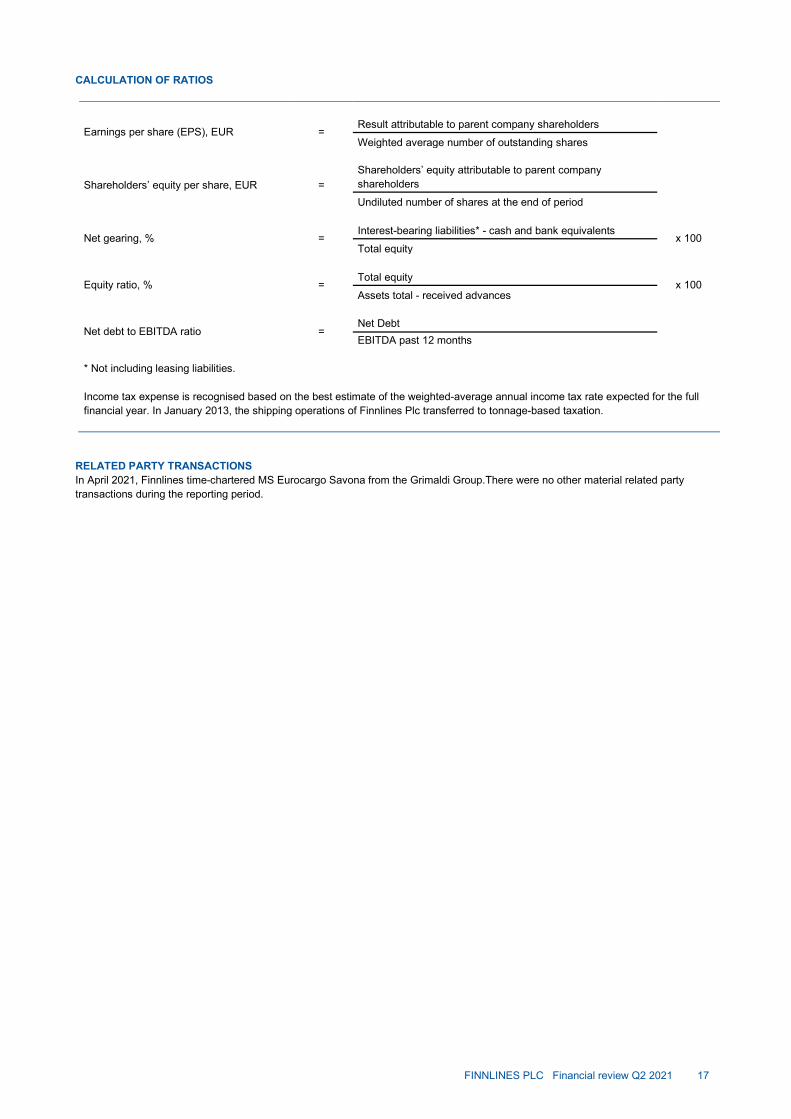
CALCULATION OF RATIOS
Earnings per share (EPS), EUR = Result attributable to parent company shareholders Weighted average number of outstanding shares
Shareholders’ equity per share, EUR = Shareholders’ equity attributable to parent company shareholders Undiluted number of shares at the end of period
Net gearing, % = Interest-bearing liabilities* - cash and bank equivalents
x 100 Total equity
Equity ratio, % = Total equity
x 100 Assets total - received advances
Net debt to EBITDA ratio = Net Debt EBITDA past 12 months
* Not including leasing liabilities. Income tax expense is recognised based on the best estimate of the weighted-average annual income tax rate expected for the full financial year. In January 2013, the shipping operations of Finnlines Plc transferred to tonnage-based taxation.
RELATED PARTY TRANSACTIONS In April 2021, Finnlines time-chartered MS Eurocargo Savona from the Grimaldi Group.There were no other material related party transactions during the reporting period.