financial services for people of modest means: …...financial services for people of modest means:...
TRANSCRIPT

Financial Services for People of Modest Means:
Lessons from Low-Income Credit Unions
By Marva Williams
March 2004
Woodstock Institute 407 S. Dearborn, Suite 550
Chicago, IL 60605 (312) 427-8070
email: [email protected] webpage: www.woodstockinst.org
2004 by Woodstock Institute
Acknowledgments
This report was funded by the Ford Foundation and the MacArthur Foundation, which provide extensive support to community development financial institutions. The author would like to thank the low-income credit unions that participated in this study: Raymond Ponteri of El Paso Employees Federal Credit Union; Faye Crocker of Greater Abbeville Credit Union; and Dale L Johnson of Trustar Federal Credit Union. In addition, Larry Garcia of the El Paso Credit Union Affordable Housing Service Organization; Richard Gose and Bill Hampel of Credit Union National Association; Anthony LaCreta of the National Credit Union Administration; William Myers of Alternatives Federal Credit Union; Ellen Seidman of Shore Bank Advisory Services; Patricia Sterner of JFB and Associates; and Caryl Stewart of Vermont Development Federal Credit Union provided invaluable assistance. Thanks also to Woodstock Institute staff, Jeffrey Allington, Beverly Berryhill, Malcolm Bush, Katy Jacob, Geoff Smith, and Patricia Woods-Hessing for their support and guidance.
About the Author
Marva is Senior Vice President of Woodstock Institute. Marva has extensive experience in community economic development practice and research. Her program areas include community development financial institutions (CDFI), micro-enterprise development and community reinvestment coalition-building. Marva has recently completed an analysis of asset building programs, payday lending, CDFI investment programs, and the development of bank accounts and financial literacy training for lower-income unbanked consumers. Marva also convenes the Chicago CRA Coalition. Marva holds a Master of urban and regional planning from the University of Pittsburgh and a Ph.D. in urban planning and public policy from Rutgers University’s Bloustein School of Planning and Public Policy.

Executive Summary Credit unions have a rich history, steeped in movements to improve the lives of low- and moderate-income consumers. Their stated purpose is to serve people of modest means and promote thrift among their members by affording them an opportunity to accumulate their savings. There is also an emphasis on the wise or productive use of credit. Thus, financial education and counseling to enable members to manage their financial affairs effectively is also stressed by credit unions. Credit unions are distinct from banks in three major areas. Credit unions are organized among people with a common bond. Fields of membership (FOM) include an association, such as church membership; occupation or employment; or residence in a community. Second, credit unions are not-for-profit cooperatives, and are therefore exempt from many federal and local taxes. This exemption is based on credit unions’ organizational structure, not charitable goals or mission. Third, credit unions are not subject to Community Reinvestment Act (CRA) policies and therefore, unlike other regulated financial institutions, do not have an affirmative obligation to serve lower-income people or communities. As a result of their mission, credit unions can make a significant contribution to reducing the number of unbanked and provide services to lower-income consumers. In fact, many credit unions offer financial services and loans desired by lower-income consumers. However, there have been several recent debates about whether credit unions are adequately serving people of modest means. Research conducted by Woodstock Institute found that credit unions in the six-county Chicago region served much lower percentages of lower-income households than middle- and upper-income households. The General Accounting Office (GAO) found that lower-income consumers were a lower proportion of consumers that predominantly use credit unions rather than banks. The credit union industry asserts that the industry’s FOM restrictions inhibit credit unions from penetrating lower-income markets. Due to regulatory and other industry changes, there are now more opportunities for credit unions to increase their penetration of lower-income markets: • More credit unions are adopting community FOMs, giving them the flexibility to serve all
consumers in a community. • Many credit unions provide services and loans that are appropriate for lower-income consumers. • The National Credit Union Administration, the national credit union regulator, has made it easier
for credit unions to adopt underserved areas, this facilitating their ability to recruit lower-income members.
• Pressures to rescind credit union tax exemptions may influence the credit union industry to
consider ways to retain the exemption by focusing on services for lower-income consumers. Low-income credit unions (LICUs), which serve a higher proportion of lower-income consumers than mainstream credit unions, can provide lessons on serving this community. LICU is a designation given by the NCUA. To receive the designation, at least half of a credit union’s members must earn less than 80 percent of the average for all wage earners or less than 80 percent of the median household income for the nation. The number of LICUs grew appreciably from 1990-2002, as have their assets and

ii
membership. Further, the average LICU in 2002 is larger and has more assets than credit unions designated as LICUs in 1990. LICUs have managed to significantly increase their loan volume while reducing loan delinquencies. Legacy LICUs, which account for 16.2 percent of all LICUs, are a subset of LICUs that were established by 1990. These LICUs have smaller assets, members, loans, and shares than other LICUs. However, Legacy LICUs have raised a higher proportion of subsidies, in the form of non-member deposits and secondary capital, than other LICUs. Case studies of three LICUs, El Paso Employees FCU of Texas, Greater Abbeville FCU of South Carolina, and Trustar FCU of Minnesota, were employed in this report to provide lessons on how mainstream credit unions can more effectively serve lower-income consumers and communities. These lessons include the importance of providing financial education and counseling services; establishing partnerships with other community organizations or businesses; generating financial support; developing financially sustainable initiatives; and establishing effective marketing strategies. Financial Education and Counseling: The bedrock of asset development programs is financial literacy. Credit unions can help consumers manage financial products effectively, recognize and avoid high cost services, repair credit, and develop savings habits. Helping youth develop savings by offering special accounts and savings incentives is also a crucial role for credit unions. Partnerships: Credit unions can maximize their effectiveness and leverage resources by forming partnerships with other financial institutions, credit union associations, community or consumer organizations, and local businesses. The partnerships described in this report allowed the credit unions to develop new loan and financial services or programs for lower-income consumers, subsidize program expenses, and increase revenue. Financial Support: Although they are not permitted to accept non-member deposits or secondary capital investments, mainstream credit unions with services for lower-income consumers are often eligible for support from government agencies. In addition, intermediaries also provide financial assistance for programs that benefit underserved communities. Appendix B of this report contains a list of national resources. Sustainability: Cross selling products is a key way to build financial sustainability. Credit unions can also improve their financial status by adjusting loan underwriting procedures, encouraging members to use electronic technology and recruiting businesses to underwrite special loan or other services for their employees. Know Your Customer: The programs of the LICUs profiled in this report work because they are adapted to the needs of their membership. A ‘one size fits all’ approach may not address the lending and service needs of diverse communities. Credit unions may need to modify loan underwriting standards, hire additional collections staff, establish new service or loan programs, utilize competitive cost structures, or develop new ways to promote products. Marketing: In addition to engaging in traditional advertising, the LICUs profiled in this report sponsor and participate in community events. Community activism also helped establish the credit unions as a community leader, develop relationships with local employers and agencies, and market credit union products. There is also is a role for a credit union community reinvestment policy. Critics may assert that the Community Reinvestment Act (CRA) is not a panacea, and they would be right. CRA performance

iii
ratings are inflated—the overwhelming majority of banks receive satisfactory or higher ratings. Bank regulators do not rigorously determine the market penetration of financial service products, such as savings and checking accounts. Further, CRA is in sore need of modernizing to reflect the modern financial services industry. Since the regulation was enacted over 30 years ago, a larger proportion of lending and financial services are conducted by financial institutions that are not subject to CRA. However, there is little argument that CRA has instigated a significant increase in residential loans and financial services in lower-income communities. Institutions that are subject to CRA make a higher proportion of prime conventional mortgage loans to lower-income people and neighborhoods than institutions that are not covered by CRA. An analysis conducted by the Joint Center for Housing Studies at Harvard University found that CRA-regulated lenders originated a higher proportion of loans to lower-income people and communities than they would if CRA did not exist.1CRA also benefits racial minorities. From 1993 to 1999, the number of conventional home mortgage loans to African-Americans and Hispanics increased 119 and 116 percent respectively, due in large part to CRA regulations and organizing.2 Further, community activists and bank regulators are considering ways to apply CRA to non-traditional banks, which like some credit unions, do not serve a well defined community market. These experiences can be useful to establishing a reinvestment policy for credit unions that do not have community FOM. The following recommendations were published in a 2002 Woodstock Institute study, Rhetoric and Reality: An Analysis of Mainstream Credit Unions’ Record of Serving Low-Income People.3 They are designed to give credit unions an affirmative obligation to serve people of modest means by requiring data collection, enabling monitoring of credit unions, and providing the public and other interested parties the ability to comment on credit union performance. 1. Congress should amend the Federal Credit Union Act to insert language that more clearly states
credit unions’ mission and responsibility to serve low-income people. That amendment should include mandatory, publicly available data disclosure about whom credit unions serve by income and race. These data should be broken down by product usage.
2. The National Credit Union Administration (NCUA) should use these data to conduct regular
examinations of credit unions for compliance with the mandate to serve low-income people. Examinations should include appropriate incentives and sanctions. The credit union merger and examination processes should include opportunities for public comment about credit unions’ record of serving low-income people.
3. The Community Reinvestment Act (CRA) should be amended to include credit unions. Credit
unions without a community charter should be examined on how well they serve low-income members. In addition, there should be an assessment of the percentage of lower-income people who qualify for membership that the credit union actually serves.
4. All credit unions that use the 1998 NCUA provision that permits healthy credit unions to expand
into low-income communities should be regularly examined to determine how many low-income
1Joint Center for Housing Studies at Harvard University. 2002.
2National Community Reinvestment Corporation. 2000. 3Jacob, Bush, and Immergluck. 2002.

iv
people they serve in those communities. A credit union’s ability to continue to use this provision should depend on a clear record of actually serving low-income members.
5. All credit unions should develop and aggressively market products and services that are affordable
and accessible to low-income people. 6. NCUA should carefully check the status of low-income designated credit unions (LICUs) to
determine whether they are continuously fulfilling the criteria for low-income membership and service.
7. Large mainstream credit unions should support LICUs through investments or other means. 8. LICUs and mainstream credit unions should increase their efforts to enroll firms and associations
with low-wage employees. The retail sector appears to offer a special opportunity for credit unions to recruit new members. Credit unions could also attract other low-income households by offering services such as affordable retail accounts, additional branches in low-income areas, direct deposit of Social Security and other transfer payments, and creative savings vehicles such as individual development accounts (IDAs).
9. Those mainstream credit unions whose active membership includes significant percentages of low-
income people should encourage the rest of the industry to follow their example by publicizing their record and their strategies.
10. Community development organizations should develop relationships with credit unions that are
similar to those that they have with banks in order to encourage credit unions to adopt more responsible and creative practices to serve low-income people.
Table of Contents
Page
Chapter I: Introduction 1 Chapter II: The U.S. Credit Union Movement 3 Chapter III: The Trends of the Low-Income Credit Union Industry 1990-2002 19 Chapter IV: Low-Income Credit Union (LICU) Case Studies 31 El Paso Employees Federal Credit Union 33 Greater Abbeville Federal Credit Union 43 Trustar Federal Credit Union 51 Chapter V: Financial Services for People of Modest Means: Lessons from LICUs 61 Appendix A: Glossary of Terms 65 Appendix B: Resources for Building Financial Services for People of Modest Means 67 References 69
Charts
Page Chart 1: Federal Credit Unions with Community FOMs 1998-2002 11
Chart 2: Number of Active LICUs 1990-2002 20
Chart 3: Number of LICU Members 1990-2002 21
Chart 4: Median Assets of LICUs 1990-2002 22
Chart 5: Net Capitalization Rates of LICUs 2002 22
Chart 6: Amount of Secondary Capital Investments 2002 23
Chart 7: Average Deposit per LICU Member 1990-2002 24
Chart 8: Percent Non-Member Deposits of LICUs 1990-2002 24
Chart 9: Average LICU Loan 1990-2002 25
Chart 10: LICU Loan to Share Ratios 1990-2002 26
Chart 11: LICU Loan Delinquency Rates 1990-2002 26
Chart 12: Operating Expense Ratios of LICUs 1990-2002 27

Tables
Page Table 1: LICU Field of Membership (FOM) 2002 20
Table 2: LICU Financial Data 1990-2002 28
Table 3: EL Paso County Demographics 2000 34
Table 4: El Paso County Economic Census 1997 35
Table 5: El Paso Employees FCU 2002 35
Table 6: El Paso Employees FCU Financial Trends 1992 and 2002 37
Table 7: Financial Service Accounts of El Paso Employees FCU 2002 38
Table 8: El Paso Employees FCU Loan Volume 2002 39
Table 9: Greater Abbeville Demographics 2000 44
Table 10: Greater Abbeville Economic Census 1997 44
Table 11: Greater Abbeville FCU 2002 45
Table 12: Greater Abbeville FCU Financial Trends 1992 and 2002 47
Table 13: Financial Service Accounts of Greater Abbeville FCU 2002 48
Table 14: Greater Abbeville FCU Loan Volume 2002 49
Tables (cont’d)
Page Table 15: International Falls Region Demographics 2000 52
Table 16: International Falls Region Economic Census 1997 53
Table 17: Trustar FCU 2002 54
Table 18: Trustar FCU Financial Trends 1992 and 2002 55
Table 19: Trustar FCU Financial Service Accounts 2002 56
Table 20: Trustar FCU Loan Volume 2002 57

Chapter I
Introduction Financial Services for People of Modest Means: Lessons from Low Income Credit Unions seeks to demonstrate that mainstream credit unions can improve their penetration of lower-income markets by applying the ‘lessons learned’ of the LICU industry. It builds on a legacy of Woodstock Institute’s research on credit unions and their services for lower-income consumers and communities. Credit unions offer affordable services that are essential to asset development in underserved communities, including savings and checking accounts, loans, check cashing, wire transfers, and financial counseling. The Institute has published several reports on community development credit unions (CDCUs) and low-income credit unions (LICUs), whose mission is to provide loans and services to disadvantaged consumers. CDCUs are a very diverse category of credit unions that support community development. Members of the National Federation of CDCUs, CDCUs serve urban and rural communities in all parts of the U.S. Further, CDCUs often work in predominantly minority communities and may be affiliated with community-based organizations or churches. ‘Low-income’ is a designation given to credit unions by the National Credit Union Administration (NCUA). To qualify for this designation, at least half of a credit union’s members must earn 80 percent or less of the median household income for the community. In addition to assessing and supporting CDCUs and LICUs, it is also essential to determine the role that mainstream credit unions play in underserved communities. CDCUs and LICUs have a very limited scale, representing less than 15 percent of all credit unions. With over 10,000 institutions representing 80 million people, U.S. credit unions have a significant role to play in providing services in underserved areas. Further, the Federal Credit Union Act (FCU Act) emphasizes the role of credit unions in providing affordable services and credit to consumers of small means. In 2002, the Institute published Rhetoric and Reality: An Analysis of Mainstream Credit Unions’ Record of Serving Low-Income People. Rhetoric and Reality which refuted the credit union movement’s claim that it meets the savings and credit needs of “persons of modest means.” It found that credit unions in the six-county Chicago region serve much lower percentages of lower-income households than middle- and upper-income households. Rhetoric and Reality virtually changed the rhetoric in the industry and was widely discussed. Further, many credit union industry leaders confirmed the empirical findings. 1 This report applies lessons from the LICU industry to mainstream credit unions. The number of LICUs has grown significantly, from 244 in 1990 to 901 in 2002. During this period of time, LICU membership increased by 734.8 percent, to over 2.8 million in 2002. Lending to members also grew appreciably. Total lending by LICUs increased over 1,700 percent from 1990 to 2002 and the average loan volume per LICU increased from $1.9 million in 1990 to $9.4 million in 2002. Although LICU loan volume increased significantly, loan delinquencies decreased. In 2002, loan delinquencies were 1.7 percent, a decrease of almost 3 percent from 1990. LICUs appear to serve a higher proportion of modest-income consumers than mainstream credit unions. The average account balance per member was $3,976 in 2002 compared to almost $6,000 for mainstream credit unions.
1National Credit Union Administration. 2002.
2
However, providing lessons of the LICU industry is not sufficient to enable credit unions to serve more lower-income consumers. It is essential to develop or modify current credit unions practices, policies, and regulations to affect a deeper penetration of the underserved markets. Chapter II of this report is a review of recent regulatory, competitive, and community reinvestment trends of the mainstream credit union industry. It concludes with a description of opportunities for mainstream credit unions to improve their penetration of lower-income markets and credit union community reinvestment policy recommendations. Chapter III is an analysis of LICUs from 1990-2002. It describes the LICU industry’s tremendous growth in assets, membership, and lending. Legacy LICUs, a subset of LICUs that were established by 1990 and still operating in 2002, are also analyzed. The analysis of Legacy LICUs eliminates some of the volatility that more recently designated LICUs may exhibit. Case studies of El Paso Employees FCU, Greater Abbeville FCU, and Trustar FCU comprise Chapter IV. The case studies include community profiles and the history and background of each credit union. A description of their credit union’s financial trends, financial services, and lending is also provided. Chapter V is a description of lessons from the LICU industry that can be employed by mainstream credit unions to improve their penetration of lower-income markets. These lessons include the importance of providing financial education and counseling services; establishing partnerships with other community organizations or businesses; generating financial support; developing financially sustainable initiatives; and establishing effective marketing strategies. There are two appendices to this report. Appendix A is a glossary of terms used in this report. A compilation of resources for credit unions interested in building financial services for people of modest means is provided in Appendix B.
3
Chapter II
The U.S. Credit Union Movement
This chapter explores the mainstream credit union industry. It begins with a description of the industry’s history and background, starting with their introduction in the U.S. in the early 1900s. A portrayal of credit union’s regulatory climate is provided in the second section. The third section identifies recent trends of the credit union industry, including their growth in size, increased competitiveness, culture shifts, and record of serving lower-income consumers. The chapter concludes with a description of opportunities for mainstream credit unions to improve their penetration of lower-income markets and credit union community reinvestment policy recommendations. History and Background Credit unions have a rich history, steeped in movements to improve the lives of low- and moderate-income consumers. First organized in the United States in 1908, credit unions were intended to be self- reliant by pooling the savings of members to provide services and loans. It was the involvement of Edward Filene, owner of Filene Department stores, which accelerated the growth of the movement. Filene, who first became interested in the credit union concept in 1907 during a trip to India, took a major role in founding credit unions in the U.S., lobbying for legislation and developing a national organization of credit unions. Filene posited that credit unions should serve people of small means who need credit at reasonable rates to finance consumer purchases.2 At that time, commercial banks did not customarily make consumer loans. Credit unions began filling that void by providing affordable, short-term credit.3 Credit unions are controlled and governed by their members with a common bond. Members ‘buy a share’ of ownership in the credit union by establishing a savings or share account. A member’s control or voting privilege is not related to the amount of their member’s deposits. Each member is entitled to no more than one vote irrespective of their account balances. Under the encouragement of Filene, Massachusetts became the first state to establish a credit union enabling law in 1909.4 By 1925, 26 states had passed credit union legislation and in 1934 the Federal Credit Union Act (FCU Act) was signed into law by President Roosevelt. The FCU Act emphasizes the role of credit unions in providing affordable services and credit to consumers with modest-incomes. The preamble states that the FCU Act will:
…establish a Federal Credit Union System, to establish a further market for securities of the United States and to make more available to people of small means credit for provident purposes through a national system of cooperative credit, thereby helping to stabilize the credit structure of the United States.
2Isbister. 1994.
3Ibid.
4National Credit Union Administration. 1999.
4
The mission of credit unions is further defined by model federal credit union bylaws. It states that credit unions will promote thrift among their members by affording them an opportunity to accumulate their savings. There is also an emphasis on the wise or productive use of credit.5 Thus, financial education and counseling to enable members to manage their financial affairs effectively is also stressed in credit union literature.6 In addition to services, credit and financial education, credit unions also provide leadership opportunities for members. The board of directors, all volunteers, is elected by the members of the credit union. Members may also attend and participate in membership meetings and serve on credit union committees. Regulation of Credit Unions In many respects, federal credit unions are regulated similarly to banks with federal charters. In fact, federally regulated and/or insured credit unions administered by the National Credit Union Administration (NCUA) operate under statutes and rules virtually identical to those applicable to banks and thrifts.7 Further, like banks, deposits in credit union are insured for up to $100,000 by an agency of the federal government. The Federal Deposit Insurance Corporation (FDIC) insures bank deposits. NCUA provides deposit insurance for credit union members. Last, the dividends of credit union members, as well as bank customers, are subject to taxation. However, credit unions are distinct from banks in three major areas. First, membership in credit unions is limited to people with a common bond. Second, credit unions are subject to different tax policies than banks and thrifts. Third, credit unions are not required to comply with federal community reinvestment policies. Common Bond Credit unions are organized among people with a common bond, such as church membership, occupation, employment, or geographic community. Only those individuals within the field of membership (FOM) are eligible to join a credit union. This common bond is the credit union’s FOM. NCUA also permits select employee groups (SEGs) or multiple groups of employers to form a credit union FOM. Credit unions may also have multiple common bond FOMs. For instance, a credit union’s FOM may include several churches and employers. Credit Union Tax Exemptions Federal credit unions are cooperative, not-for-profit organizations that are organized as instrumentalities of the United States, and therefore, are tax exempt under U.S. Internal Revenue Services (IRS) Section 501(c)(1). The tax exemption, which was established in 1937, applied to all cooperatives, including mutual savings banks, and mutual insurance companies. However, these
5National Credit Union Administration. 1999. 6National Credit Union Administration Office of Examination and Insurance. 1999. 7United States Department of the Treasury. 2001.
5
institutions lost their tax exemption in 1951.8 It is estimated that the federal income tax-exemption of credit unions will cost the U.S. Treasury $13.7-16.2 billion from 2000-2009.9 In addition to an exemption from paying federal income taxes, with the exception of real property taxes, credit unions are also exempt from state and local taxes. 10 Therefore, state and local treasuries also forgo revenue due to credit union tax exemptions. There is no indication that the tax-exemption is due to credit union’s mission to serve people of modest means although it has been cited by credit union leaders as a reason to retain the exemption. The top exemption is based on the non-for-profit, cooperative structure of credit unions. In addition to their cooperative structure, the tax-exemption is justified by the credit union industry for other reasons. Unlike banks, the excess earnings of credit unions revolve into capital or reserves, or are distributed to its members in the form of higher deposit rates, lower loan rates, and less expensive fees.11 Further, the boards of directors of credit unions are volunteers and receive no compensation. Credit union leaders argue that if they were subject to taxation that their members would suffer: credit unions would be forced to increase loan interest rates and lower dividends. Further, they contend that the taxes would have to be paid out of funds that should be set aside for loan loss reserves, therefore weakening the safety and soundness of the credit union industry.12 Bankers contend that their tax-exemption gives credit unions a competitive advantage. They charge that it enables credit unions to offer higher dividends on savings and investment products and lower loan interest rates and fees. The banking industry argues that removing credit union’s tax-exemptions will ‘even the playing field.’ There have been several recent attempts to impose taxes on credit unions. The U.S. Internal Revenue Service (IRS) has audited several state-chartered credit unions to determine whether they should pay unrelated business income taxes (UBIT).13 UBIT is a federal tax paid by tax-exempt organizations that engage in revenue generating activities that are substantially unrelated to the organization’s purpose. There is no clear definition of credit union activities that may be subject to UBIT. However, the IRS is considering taxing income from credit and life insurance sales, credit/debit card interchanges, ATMs, and other non-deposit financial services.14 Several states, including California, Iowa, New Mexico, Oregon, and Utah, have considered imposing taxes on state chartered credit unions. These proposed policies would only apply to very large credit unions, ranging from at least $100 million in assets in New Mexico and Utah to over $1 billion in California.15
8American Bankers Association. N.D. 9United States Department of the Treasury. 2001. 10National Credit Union Administration. 1999. 11Credit Union National Association. 2003. 12Ibid. 13Federal credit unions are exempt from UBIT because they are instrumentalities of the federal government. 14Gentile. 2003. 15Credit Union National Association. N.D.

6
Although tax proposals were not approved, in 2003, the Utah legislature authorized a two-year study of the Utah credit union and banking industries to identify any action they should take in future sessions.16 It also restricted member business lending by three of the state’s largest credit unions by imposing a tax on the earnings of these loans.17, 18 However, Utah’s business lending limitations are effectively null and void. The three credit unions subject to the new regulation were permitted by the NCUA to convert to a federal charter in the summer of 2003.19 The American Bankers Association (ABA), which has been challenging the credit union industry for the past decade, subsequently filed a suit against the NCUA for allowing one of these credit unions to serve a seven county FOM in Utah. They charge that this FOM does not constitute a ‘well-defined local community” as required by NCUA FOM regulations. Some credit union leaders believe that taxation is inevitable and have already developed business plans to convert to a bank charter.20 In fact, eight credit unions have received approval from the Office of Thrift Supervision (OTS) to convert to a thrift charter since 1998.21 NCUA allows credit unions to convert to a mutual savings bank or a mutual savings association with the approval of the credit union’s board of directors and by a majority vote of the members that vote on the conversion. A conversion does not require the approval of NCUA. However, a regional NCUA director must approve the credit union’s proposed methods and procedures for the membership vote on the conversion. NCUA also stipulates that no director or senior staff can receive any economic benefits as a result of the conversion, other than their customary salary and compensation.22 In response to concerns that more credit unions will convert to bank charters, the NCUA is considering a proposal that would augment disclosures to members regarding a proposed conversion. In particular, NCUA would like to notify members that they could lose their share of membership in the institution in as little as two years, if after the credit union converts to a thrift charter, it then converts to a stockholder-owned bank.23 CUNA has made further recommendations. It would like to require that credit unions have a quorum of at least 20 percent of their members to vote on a conversion to a bank.24 Credit Unions and Community Reinvestment Policy
16Mitchell. 2003. 17Nii. 2003. 18Banks won the battle with big credit unions. 2003. 19Rubenstein. 2003. 20Storey. 2003. 21Office of Thrift Supervision. 2003. 22National Credit Union Administration. 2001. 23National Credit Union Administration Office of the Chairman. 2003. 24Credit Union National Association. 2003.
7
Although credit unions with assets over $30 million and an office in a metropolitan statistical area (MSA) are required to file Home Mortgage Disclosure Act (HMDA) 25 reports, credit unions are not subject to Community Reinvestment Act (CRA) policies.26 CRA is a federal regulation intended to encourage banks and thrifts to meet the credit needs of their entire market or assessment area, including low- and moderate-income neighborhoods. Their community reinvestment performance, which is evaluated periodically by one of four federal agencies, can be taken into account during considerations of an institution's application for a merger or acquisition. There is clear and growing evidence that CRA has resulted in a significant expansion of credit in the lower-income and minority communities. Credit union leaders argue that a community reinvestment policy is not needed because there is no evidence that credit unions do not serve their entire FOM adequately. Further, they contend that credit unions are restricted to serving consumers within a FOM, making a community reinvestment policy difficult, if not impossible, to implement. However, community activists contend that there is a role for a carefully crafted community reinvestment policy that recognizes the institutional and regulatory status of credit unions that requires them to penetrate modest-income markets more effectively. There was a recent policy that would have imposed a modest community reinvestment requirement on the credit union industry. Under the leadership of former Chairman Norman D’Amours, the NCUA approved the Community Action Plan (CAP) policy in October 2000. CAP required community chartered credit unions to establish plans for serving lower-income consumers and communities within their FOM.27 A credit union’s CAP would also be available for public comment and would be considered by regulators when a credit union requests a merger or FOM expansion.28 CAP was much less restrictive than CRA. CRA gives ALL retail banks an affirmative obligation to serve consumers in their entire assessment area. Further, periodic examinations are conducted by federal bank regulators to determine a bank’s CRA performance. Despite its leniency and limited applicability, CAP policy was rescinded by the NCUA Board shortly after Dennis Dollar, the current NCUA Chair, took office in 2001. The Board and credit union leaders who pressed for the abolition of CAP provided several justifications. First, they argued that credit unions do not need a regulation requiring them to serve their members because they are already working in underserved areas. Second, although there is no evidence that community reinvestment lending is inherently more risky than other lending, there was some concern in the credit union industry that it could harm a credit union’s safety and soundness. Third, they contended that a community reinvestment policy would be costly and burdensome to implement.29 Fourth, credit union officials argued that more credit unions are increasingly adopting community FOMs that include underserved communities. However, there is no documentation that this has resulted in the inclusion of more lower-income members.
25The Home Mortgage Disclosure Act (HMDA) was enacted by Congress in 1975. It requires that some financial institution file annual
reports on home mortgage applicants and borrowers. HMDA makes available to the public information that helps to show whether financial institutions are serving the housing credit needs of their neighborhoods and communities.
26CRA requires that banks and savings and loans provide loans, services, and investments in their entire assessment area, including low-
and moderate-income communities. 27Duran. 2001. 28Berenbaum. 2002. 29National Credit Union Administration. 2003.
8
There are, however, strong arguments for regulatory and legislative community reinvestment policy for credit unions. Woodstock Institute made a series of policy and practice recommendations in 2002 to improve credit union membership of lower-income markets.30 Further, a suit brought by the National Community Reinvestment Coalition (NCRC), a coalition of community reinvestment organizations, claimed that the NCUA did not follow proper procedure when it repealed CAP.31 NCRC and other community reinvestment activists contend that credit unions, like other financial institutions that provide deposit and financial services, should be required to provide public disclosures on their services to lower-income people and that the repeal undermined efforts to enable lower-income consumers to join the financial mainstream. Further, they argued that FOM policies are no longer an obstacle to serving lower-income consumers. An increasing number of credit unions are adopting community FOMs (see below) that allow them to serve anyone who lives, worship, attends school, or works within a community. Last, community advocates argued that a community reinvestment policy can be designed to minimize reporting responsibilities and costs. For instance, CRA examinations of small banks are much less extensive than large bank examinations. A credit union reinvestment policy could exempt or require fewer filings of small credit unions. Although the suit filed by NCRC was dismissed by the U.S. District Court in November 2003, NCRC and other community activists are advocating the establishment of federal community reinvestment policies for credit unions.32 Recent Credit Union Trends The credit union movement has changed in many fundamental ways since its founding. First, the size and scope of credit unions has grown significantly. Second, credit union regulations have become increasingly flexible, especially those regulations that address FOM. Third, the cooperative culture of credit union culture has changed due to growing competition and deterioration of membership loyalty. Fourth, there is some contention that credit union membership is increasingly affluent and that the proportion of credit union members of modest means is diminishing. Credit Union Consolidation and Growth Since their genesis in the early 1900s, the credit union movement has expanded appreciably. By 2002, there were 9,688 state- and federal-chartered credit unions insured by NCUA with total assets of $557 billion. However, the industry is becoming increasingly concentrated. From 1998 to 2002, the number of state- and federal-chartered credit unions declined from 11,125 to 9,688, a 12.9 percent decrease. Much of the reduction in the number of credit unions is due to mergers and acquisitions. From 1995-2001, 1,506 credit unions were merged.33 Therefore, credit unions are getting larger. From 2000 to 2002, the average assets of federal credit unions increased by 65 percent, from $33 million to over $51 million. Further, the number of credit unions with assets under $2 million decreased by over one-fifth, and the number with assets between $2 million and $10 million declined from 3,373 to 3,022.34 One
30Jacob, Bush, and Immergluck. 2002.
31Morrison. 2003. 32Lacking Merit, NCRC Looks to Congress on CAP. 2003. 33Cook. 23 July, 2003. 34National Credit Union Administration. N.D.

9
credit union expert predicts that in less than ten years there will be only about 6,000 surviving credit unions and very few will have assets under $10 million.35 Some credit union leaders blame new NCUA regulations for the reduction in the number of small credit unions. Prompt and corrective action (PCA), a component of the 1998 Credit Union Membership Access Act (CUMAA), was instituted by Congress in response to the failure of a few corporate credit unions and to stabilize the Share Insurance Fund.36 PCA is an early warning system used by NCUA to identify credit unions that are not sufficiently capitalized. It mandates that credit unions with net capital ratios of 6 percent or less develop a plan that addresses how they will improve their net worth. NCUA also has the authority to direct an undercapitalized institution to refrain from increasing its asset size, elect a new board of directors, or hire new staff. Ultimately, an institution may be placed in receivership if it remains critically undercapitalized and shows no ability to recover.37 In addition to these penalties, PCA also makes it very challenging for credit unions to grow. The net capital ratio is the percent of net capital to total assets. Increasing deposits also increases assets, and therefore can actually imperil a credit union’s capitalization rate if income does not grow at the same rate. Credit union membership is also on the rise. The number of credit union members increased from 73.5 million in 1998 to 80.9 million in 2002, a 10.1 percent increase. There are several explanations. First, many credit unions now offer a wide diversity of consumers products, making them comparable to banks. Second, more liberal FOM regulations have expanded credit union markets (see next section for more information). Third, there is evidence that consumers are growing weary with the number of bank mergers that result in a disruption of continuity. A 2000 survey by the Massachusetts Credit Union League found that some of the state’s credit unions experienced a 25 percent or higher increase in the number of draft (checking) accounts from the previous year during a major bank merger. This rate is more than double the average annual growth of other financial institutions. A credit union manager asserted that their new customers were former bank customers “who don’t want to get their accounts sold again.”38 Regulatory Flexibility NCUA regulations have made it easier for credit unions to tap into larger FOMs. Credit unions have also recently received approval to expand their member business lending. Field of Membership Changes: In 1934, federal credit unions were only permitted to serve members with a common bond, whether employment, occupation, association, or a community. Multiple common bond FOMs, which were permitted by NCUA in the early 1980s, allow credit unions to include multiple select employee groups (SEGs) in their membership and to accept members from companies in unrelated industries and professions. As a result of the growth of credit union membership due to this policy, the American Bankers Association (ABA) brought suit against the NCUA for permitting AT&T Family Credit Union and others to obtain multiple common bond FOMs.
35Matz. 2002. 36Seidman. 2003. 37Pacenaz. 2002. 38Agosta. 2000.
10
The case went all the way to the U.S. Supreme Court, which ultimately ruled, in a narrow five to four vote, in favor of the ABA in February 1998.39 The suit by the ABA and the Supreme Court ruling catalyzed significant grassroots organizing and lobbying in an effort to allow credit unions to continue serving multiple SEGs. Those efforts resulted in the Congressional approval of the Credit Union Membership Access Act (CUMAA) which was approved in July 1998. CUMAA expands the membership bases of credit unions by liberalizing policies for multiple common bond charters and community charters.40 By permitting multiple common bond groups, the NCUA allows credit unions to adopt a wide number of trade, industry, and professional (TIP) groups. Community or geographic FOMs typically allows anyone who lives, works, worships, or attends school in that community to join the credit union. In order to receive a community FOM, a credit union must document that the proposed area is a ‘well-defined locality, community, neighborhood, or rural district’ comprised of individuals with common interests or interactions. Multiple political jurisdictions may be permitted if the population does not exceed 500,000 or is comprised of a Metropolitan Statistical Area (MSA) with a population of 1,000,000 or less. NCUA requests that applicants for a community FOM submit evidence that the area is a well-defined community, including evidence of shared/common facilities, common organizations and clubs, area newspapers or other periodicals, history of area, or a description of the common characteristics and background of residents. NCUA will also consider documents that describe how the area and its residents are distinguishable from the immediate surrounding areas and residents.41 CUMAA does not include an objective or measurable criteria of a local community. CUMAA did impose FOM limitations. In addition to restricting the size of the community that can be adopted, Congress made it clear that the NCUA should encourage the creation of separately charter credit unions where appropriate. Therefore, credit unions are prohibited from adding new groups with more than 3,000 members to multiple common bond credit unions.42 Chart 1 documents the increasing number of credit unions with community FOMs. In 1998, there were 412 credit unions with a community FOM. The number of community credit unions increased by over 100 percent from 1998 to 2002 to almost 900.43 Further, 124 Community FOM conversions were approved by NCUA from January-September of 2003.44 Chart 1
Federal Credit Unions with Community FOMs 1998-2002
39Seiberg. 1998. 40Reosti. 2003.
41National Credit Union Administration. 2003. 42American Bankers Association. 2000. 43National Credit Union Administration. 2003. 44National Credit Union Administration. N.D.
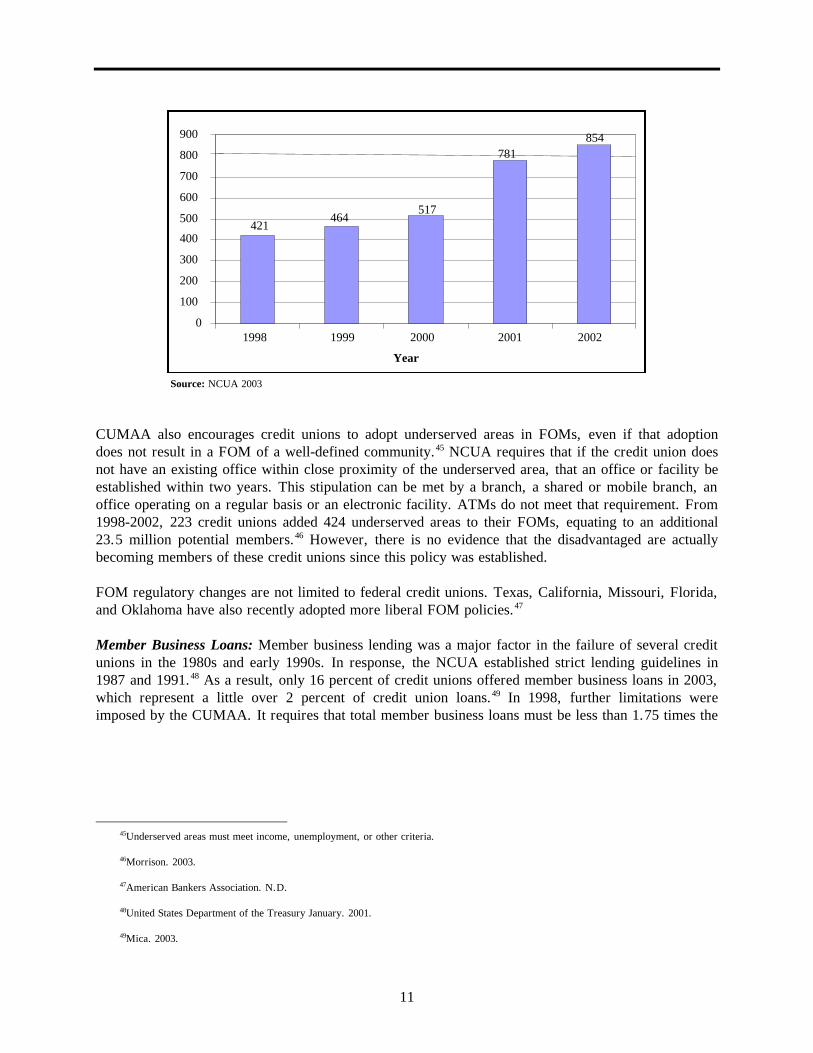
11
Source: NCUA 2003
CUMAA also encourages credit unions to adopt underserved areas in FOMs, even if that adoption does not result in a FOM of a well-defined community.45 NCUA requires that if the credit union does not have an existing office within close proximity of the underserved area, that an office or facility be established within two years. This stipulation can be met by a branch, a shared or mobile branch, an office operating on a regular basis or an electronic facility. ATMs do not meet that requirement. From 1998-2002, 223 credit unions added 424 underserved areas to their FOMs, equating to an additional 23.5 million potential members.46 However, there is no evidence that the disadvantaged are actually becoming members of these credit unions since this policy was established. FOM regulatory changes are not limited to federal credit unions. Texas, California, Missouri, Florida, and Oklahoma have also recently adopted more liberal FOM policies.47 Member Business Loans: Member business lending was a major factor in the failure of several credit unions in the 1980s and early 1990s. In response, the NCUA established strict lending guidelines in 1987 and 1991.48 As a result, only 16 percent of credit unions offered member business loans in 2003, which represent a little over 2 percent of credit union loans.49 In 1998, further limitations were imposed by the CUMAA. It requires that total member business loans must be less than 1.75 times the
45Underserved areas must meet income, unemployment, or other criteria. 46Morrison. 2003. 47American Bankers Association. N.D. 48United States Department of the Treasury January. 2001. 49Mica. 2003.
421 464
517
781 854
0
100
200
300
400
500
600
700
800
900
1998 1999 2000 2001 2002
Year
12
actual net worth of the credit union.50 For these reasons, most of the member business loans of credit unions are underwritten as personal loans or home equity loans, although the loans proceeds may be used for a member’s enterprise. Two major policy changes by the NCUA and US Small Business Administration (SBA) may increase small business lending. First, in September 2003, the NCUA Board approved a final rule that will increase access to small business capital for credit union members.51 The rule allows well-capitalized credit unions to make unsecured member business loans, does not count certain participation loans when calculating member business loan limits, streamlines member business loan documentation requirements, and reduces the weight of member business loans when assessing risk.52 Second, SBA made it easier for credit unions to make member business loans in 2003.53 While community chartered credit unions have been making SBA-backed loans for more than 20 years, the SBA reinterpreted its lender participation regulations to allow all credit unions with sufficient lending capabilities to join its loan delivery system. 54 By June 2003, over 100 credit unions were members of the SBA lender pool.55 Other: The U.S. House of Representatives’ Judiciary and Financial Services Committees have approved a bill that further expands market opportunities for credit unions. Among other features, it allows them to cash checks to persons eligible for membership (but not currently a member), and permits voluntary mergers of multiple bond credit unions, regardless of size. The bill also permits a community credit union to retain all employee groups if it merges with or acquires a multiple bond credit union. The bill will be considered by the full House of Representatives in the spring of 2004. Changing Credit Union Culture There have been major changes to the culture of credit unions. First, there is an increased sense of competition between credit unions and with other financial institutions. Second, some credit union leaders are concerned that the loyalty or commitment of members is declining. Third, community activists contend that credit unions are decreasingly serving people of modest means. Growing Industry Competition: Due to changes in FOM regulations, more credit unions have adopted community or geographic FOMs. As a result, credit unions can market their products in entire cities or
50Credit Union Membership Access Act. 1998. 51National Credit Union Administration. 2003. 52National Credit Union Administration. 2003. 53SBA is a federal program that provides financial and technical assistance to small businesses. Since its beginning in 1953, the SBA has
provided financial assistance totaling more than $167 billion to more than 1.2 million businesses. The 7(a) Loan Guaranty Program is one of SBA's primary lending programs. It provides loans to small businesses unable to secure financing on reasonable terms through normal lending channels. The program operates through private-sector lenders that provide loans which are, in turn, guaranteed by the SBA -- the Agency has no funds for direct lending or grants.
54Small Business Administration. 14 February, 2003. 55Johnson. 2003.
13
counties. From 2001-2002, NCUA approved expansions into areas with more than 30 million potential new credit union members.56 Although credit unions only have 6.5 percent share of deposits as compared to the bank industry’s 93.5 percent share, bankers are concerned that liberalized FOM regulations have given credit unions an unfair competitive advantage.57 They also claim that if credit unions continue to expand beyond a common bond, that they should no longer be tax exempt.58 The liberalized FOM regulations also mean that more credit unions now have overlapping markets. The resulting increased competition for members within the same FOM means that the cooperative spirit between credit unions is diminishing. As early as 1995, a group of five California credit unions asked the NCUA to develop policies to minimize competition between credit unions. They wrote that the “increased competition among credit unions must be balanced against the threat to the cooperative nature of credit unions and the credit union movement.”59 Their concern was generated by a suit against the NCUA by a credit union concerned that a proposed merger would result in a poaching of its members. There have also been changes in credit union management. Some industry experts assert that due to decreased employment opportunities in the banking industry, there has been an influx of former bankers in credit union management. These former bankers often do not understand or appreciate the ethos of the credit union movement and they are accused of trying to make credit unions ‘quasi-banks.’60 This issue may be exacerbated in the next five years when it is projected that up to 25 percent of credit unions managers will retire.61 Diminishing Membership Loyalty: Credit union members are increasingly using credit unions as their primary financial institutions. In 1983, 28 percent of members used the credit union as its primary financial institution. This increased to 44 percent in 1998.62 However, the loyalty of membership, a hallmark of the credit union movement, may be diminishing. Consumers are no longer joining credit unions because they share a common bond, but due to attractive loan and account interest rates, convenience, and services. As a result, credit unions are expanding their range of financial products and services and have become much more price conscious.
56Pacenaz. 2002. 57Storey. 2003. 58Kline. 1998. 59Arndorfer. 1995. 60Storey. 2003. 61Gentile. 2003. 62American Bankers Association. N.D.
14
Serving Consumers of Modest Means Many credit unions offer programs or services that are suitable to lower-income consumers. A 2003 survey conducted by CUNA asked credit unions to identify financial services appropriate for low- and moderate-income households, defined as households with incomes of $40,000 or less.63 Of the 2,548 credit unions in the sample, 1,090 responded. Of these, 93 credit unions had recently added an underserved area to their FOM. The researchers of this study acknowledge that there was some data collection bias and therefore the results may not represent the credit union industry as a whole. They acknowledged that credit unions with a commitment to serving lower-income consumers were more likely to respond to the survey. In fact, 334 or 31 percent of the respondents were LICUs. Key findings include that 65 percent of credit unions make share-secured loans, 41 percent sell money orders, 36 percent provide financial or debt counseling, and 31 percent offer risked-based lending. Further, almost 30 percent of those surveyed have become members of local organizations serving lower-income markets. Although it is too early to make generalizations, the survey asked the credit unions that had recently added an underserved area to their FOM to provide information on membership penetration of the expansion area. The general penetration rate, after a seven month period, was 3 percent. However, 10 percent of the credit unions had penetration rates between 20 to 40 percent.64 Further, approximately 85 percent have a branch in or in close proximity to the adopted underserved community. No information was provided on the incomes of the new members from the underserved community. The Credit Union National Association (CUNA), a trade association of credit unions, recently developed Project Differentiation. The goal of Project Differentiation is to encourage credit unions to establish a "Statement of Commitment to Members,” which includes a plan to meet the needs of members of all income levels. It also encourages credit unions to participate in or sponsor financial education workshops, improve the diversity of their membership, and engage in community service. Reports from credit unions participating in Project Differentiation have resulted in a compilation of qualitative data on credit union efforts to reach the underserved. There are very few empirical studies that measure the impact of credit unions on lower-income consumers and communities. Credit unions are not required to collect and disseminate information on the incomes or other characteristics of their members. However, four recent empirical studies may shed some light on this issue. The studies were conducted by the U.S. Treasury (1999), Woodstock Institute (2002), the Filene Institute (1999), and the U.S. General Accounting Office (GAO) (2003). The U.S. Treasury Department surveyed 1,030 of the 1,514 credit unions that had member business loans as of June 1999. 65 The report found that 13 percent of their outstanding member business loans went to members with household incomes less than $30,000. Another 20 percent of the loans were to households with incomes between $30,000 and $50,000. By comparison, 35 percent of all U.S. households had incomes below $30,000 and 23 percent had incomes between $30,000 and $50,000 in
63Credit Union National Association. 2003. 64Credit Union National Association. 2003. 65The report was one of two reports that Congress directed the Department of the Treasury to establish in CUMAA. The second report
compared the regulatory and competitive environment of credit unions with other depository institutions.

15
2000.66 However, Treasury believes that these results should be interpreted cautiously due to data inaccuracies. First, 80 or 7.8 percent of the credit unions that participated in the survey did not provide any household income data. Treasury reports that these credit unions tended to have the largest member business loan portfolios, and therefore, the household income of borrowers was reported in only 65.4 percent of all the member business loans. Second, some credit unions may have provided out-of-date household income data that did not reflect the borrower’s income at the time of the survey. Treasury’s findings must also be regarded within the context of credit union member business lending. In June 2000, only 14 percent of credit unions made member business loans.67 Further, member business loans, which totaled $4.3 billion, represented only 1.5 percent of the total $287.4 billion loan volume of credit unions in 2000. Rhetoric and Reality: An Analysis of Mainstream Credit Unions’ Record of Serving Low-Income People is a 2002 report by Woodstock Institute. The authors found that credit unions in the six-county Chicago region serve much lower percentages of lower-income households than middle- and upper-income households. Only 12 percent of households earning between $10,000-$20,000, and 23 percent of households earning between $30,000-$40,000 had a credit union member. In contrast, 40 percent of upper-income households with incomes between $60,000-$70,000 had a credit union member. The study found that African-Americans were slightly more likely to be credit union members. After controlling for income, age, and education level, being African-American more than doubled the odds of a person having a credit union account. It also reduced his or her odds of having a bank account by more than one-half. This finding, the authors assert, is partly explained by the fact that the Chicago region African-Americans may be “over-represented” in public sector jobs or other highly-unionized industries that often sponsor credit unions.68 The Filene Institute and the GAO both used data from the Federal Reserve Board’s Survey of Consumer Finances (SCF). However, the researchers analyzed the data differently. The 1999 Filene Institute analysis of 1998 SCF data examined the characteristics of different classes of financial service consumers. GAO used 2001 SCF data in its report published in 2003 to determine patterns of financial service utilization by different classes on consumers. The Filene Institute is a nonprofit research organization that is governed by an administrative board that includes CEOs’ of credit unions, representatives from CUNA and academics. The Filene Institute analysis of 1998 SCF data reported relatively small differences in median and average household incomes of consumers that predominantly or only use banks or credit unions. The mean household income of consumers that predominantly use banks was approximately $63,000, over $3,000 more than those that predominantly use credit unions. Similarly, the median household of income of consumers that only use credit unions ($27,000) was $3,000 lower than those that only use banks. In contrast, those that predominantly use credit unions had slightly higher median household incomes ($53,000) than those who predominantly use banks ($49,000), a difference of $4,000. The GAO found that lower-income consumers were a lower proportion of consumers that predominantly use credit unions (36 percent) rather than banks (42 percent). Households that only or primarily use credit unions were more likely to be moderate to higher incomes than those that only or primarily use banks.
66U.S. Census. 2002.
67United States Department of the Treasury. January 2001. 68Jacob, Bush, and Immergluck. 2002.
16
The GAO report also utilized 2001 Home Mortgage Disclosure Act (HMDA) data to identify the income of households that received mortgages from credit unions and banks. They found that credit unions made a lower proportion of mortgage loans to low- and moderate-income households (27 percent) than banks (34 percent). Further, banks appear to serve a higher proportion of consumers at the bottom of the economic ladder. Credit unions made 7 percent of their loans to low-income households compared to 12 percent by banks.69 Conclusion
The lack of data on credit union membership is an enduring problem that hinders empirical research to determine lending patterns by income, race, or other factors. However, a review of four empirical studies does demonstrate that there is some basis for concern regarding credit union service to people of modest means. Despite CUNA and other initiatives, other trends, including the recruitment of former bank executives to manage credit unions, growing size of credit unions and increasing competitive pressures, may make the recruitment of lower-income members even less likely. Last, the rescission of CAP was a real blow to efforts to improve credit union penetration in underserved communities. Although it is not related to their mission to serve people of modest means, credit unions and their members receive significant benefits from their exemption from most federal and state taxes. Credit unions enjoy a completive advantage because they do not have to factor this cost into service and loan price structures. Higher interest payments for share accounts, lower rates on loans, and less expensive basic financial services benefit credit union members. Lower-income consumers should also be able to receive these benefits. There are many opportunities to increase membership of lower-income consumers in credit unions: • More credit unions are adopting community FOMs, giving them the flexibility to serve all
consumers in a community. • Many credit unions already provide services and loans that are appropriate to lower-income
consumers. • The adoption of underserved areas has been made easier by the NCUA, making it easier for credit
unions to recruit lower-income members. • Pressures to rescind credit union tax exemptions may influence the credit union industry to
consider ways to retain the exemption by focusing on services for lower-income consumers. In addition, there is a role for community reinvestment policy for credit unions. CRA is not a panacea. CRA performance ratings are inflated—the overwhelming majority of banks receive satisfactory or higher ratings. Bank regulators do not rigorously determine the market penetration of financial service products, such as savings and checking accounts. Further, more lending and financial services are being conducted by financial institutions that fall outside of CRA.
69General Accounting Office. 2003.
17
However, CRA has instigated a significant increase in loans and services in lower-income communities. Institutions that are subject to CRA make a higher proportion of prime conventional mortgage loans to lower-income people and neighborhoods than institutions that are not covered by community reinvestment regulations. An analysis conducted by the Joint Center for Housing Studies at Harvard University found that CRA-regulated lenders originated a higher proportion of loans to lower-income people and communities than they would if CRA did not exist.70 CRA also benefits racial minorities. From 1993 to 1999, the number of conventional home mortgage loans to African-Americans and Hispanics increased 119 and 116 percent respectively.71 In addition, CRA policy is evolving. Community activists and bank regulators are considering ways to apply CRA to non-traditional banks, which like some credit unions, do not serve a well defined community market. There may be some lessons from this effort that will enable the establishment of an appropriate community reinvestment policy for credit unions that do not have a community FOM. The following recommendations were published in a 2002 Woodstock Institute study, Rhetoric and Reality: An Analysis of Mainstream Credit Unions’ Record of Serving Low-Income People.72 They are designed to enable data collection on credit union membership and lending, and give credit unions an affirmative obligation to serve people of modest means: 1. Congress should amend the Federal Credit Union Act to insert language that more clearly states
credit unions’ mission and responsibility to serve low-income people. That amendment should include mandatory, publicly available data disclosure, including race and income information, on the households or consumers that credit unions serve. These data should be broken down by product usage.
2. The National Credit Union Administration (NCUA) should use these data to conduct regular
examinations of credit unions for compliance with the mandate to serve low-income people. Examinations should include appropriate incentives and sanctions. The credit union merger and examination processes should include opportunities for public comment about credit unions’ record of serving low-income people.
3. The Community Reinvestment Act (CRA) should be amended to include credit unions. Credit
unions without a community charter should be examined on how well they serve low-income members. In addition, there should be an assessment of the percentage of lower-income people who qualify for membership that the credit union actually serves.
4. All credit unions that use the 1998 NCUA provision that permits healthy credit unions to expand
into low-income communities should be regularly examined to determine how many low-income people they serve in those communities. A credit union’s ability to continue to use this provision should depend on a clear record of actually serving low-income members.
5. All credit unions should develop and aggressively market products and services that are affordable
and accessible to low-income people.
70Joint Center for Housing Studies at Harvard University. 2002. 71National Community Reinvestment Corporation. 2000. 72Jacob, Bush, and Immergluck. 2002.
18
6. NCUA should carefully check the status of low-income designated credit unions (LICUs) to determine whether they are continuously fulfilling the criteria for low-income membership and service.
7. Large mainstream credit unions should support LICUs through investments or other means. 8. LICUs and mainstream credit unions should increase their efforts to enroll firms and associations
with low-wage employees. The retail sector appears to offer a special opportunity for credit unions to recruit new members. Credit unions could also attract other low-income households by offering services such as affordable retail accounts, additional branches in low-income areas, direct deposit of Social Security and other transfer payments, and creative savings vehicles such as individual development accounts (IDAs).
9. Those mainstream credit unions whose active membership includes significant percentages of low-
income people should encourage the rest of the industry to follow their example by publicizing their record and their strategies.
10. Community development organizations should develop relationships with credit unions that are
similar to those that they have with banks in order to encourage credit unions to adopt more responsible and creative practices to serve low-income people.
Chapter III

19
The Trends of the Low-Income Credit Union Industry 1990-2002
This chapter is an analysis of LICUs from 1990-2002. It includes active credit unions that were designated LICUs in that year. A subset of LICUs that were established by 1990, or Legacy LICUs, is analyzed separately. The analysis of Legacy LICUs eliminates some of the volatility that more recently designated LICUs may distort aggregate performance statistics. This analysis demonstrates that the LICU industry has grown considerably over the past 12 years. Further, the average LICU in 2002 is larger and has more assets than credit unions designated as LICUs in 1990. Introduction A low-income credit union or LICU is a federal or state credit union serving a membership of which more than half earn less that 80 percent of the national median household income. The designation is made by NCUA and is based on a demographic analysis of the number of members residing in lower-income zip codes; documentation of members' wages or household incomes in loan files; membership surveys; or a demographic analysis of credit unions’ geographic or community of field of membership (FOM). LICUs are permitted more flexibility by NCUA than other credit unions. They may receive deposits from non-members, are eligible for NCUA’s Community Development Revolving Loan Program, and can also receive secondary capital investments. NCUA also allows LICUs to append their FOM, without regard to operational area, to another low-income group constituting an occupational, associational, or community common bond. Type of Charter Over 85 percent of LICUs in 2002 had a federal charter. The remainder were state chartered credit unions. Most LICU deposits are insured by the NCUA—therefore they are subject to some level of federal regulation and examination. Number of LICUs The number of LICUs is displayed by Chart 2. By 2002, there were 901 LICUs, an increase of 269.3 percent from 1990. Much of this growth occurred due to the designation of existing credit unions as LICUs. Of 244 LICUs in 1990, 146 were still operating in 2002.

20
Membership Table 1 is an analysis of the FOM of LICUs in 2002. Almost 30 percent of LICUs have a geographic or community field of membership (FOM). This means that they have considerable membership flexibility. Generally, anyone who lives, works, attends schools, or worships in the area can join a community credit union. LICUs with religious affiliations or associated with government, education, service or manufacturing employers were also prevalent. Almost one-fifth of LICUs have a state charter.
Chart 2 Number of Active LICUs
1990-2002
244 224270
356 382
588
901
0
200
400
600
800
1000
1990 1992 1994 1996 1998 2000 2002
Year
Num
ber
of A
ctiv
e L
ICU
s
Table 1 LICU Field of Membership (FOM)
2002
Type of FOM Number Percent
Community Credit Unions 269 29.9%
State Chartered Credit Unions73 161 17.9%
Religious 114 12.7%
Manufacturing 95 10.5%
Service Industry 83 9.2%
Educational 70 7.8%
Government. 62 6.9%
Associational-other than religious 42 4.7%
Military 5 0.6%
Total 901 100%
73State chartered credit unions that are insured by NCUA can receive LICU designations.

21
Chart 3 Number of LICU Members
1990-2002
343 359549
848
2,866
2,017
1,120
-
500
1,000
1,500
2,000
2,500
3,000
3,500
1990 1992 1994 1996 1998 2000 2002
Year
Num
ber
of M
embe
rs (
000s
)
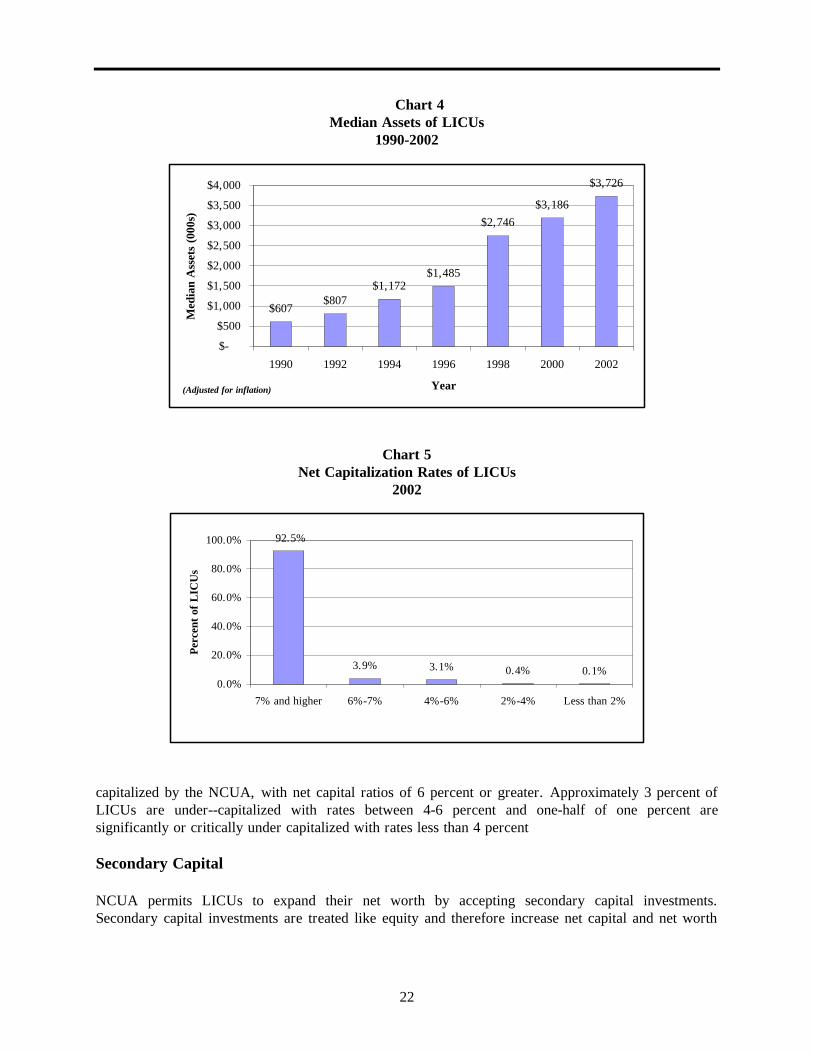
The growth in LICU membership grew almost three times faster than the growth in the number of LICUs (see Chart 3). Membership increased by 734.8 percent from 343,297 in 1990 to over 2.8 million in 2002. The average number of members per LICU grew by 126.1 percent, from 1,407 to 3,181. (Legacy LICUs have slightly smaller average membership of 2,719 in 2002.) However, LICU membership is relatively small. The average membership of mainstream credit unions is over 8,000.74 Assets and Capitalization Due to the increase in large credit unions with LICU designations, LICU assets have increased significantly. The number of LICUs with assets over $20 million increased from 5 or 2.0 percent in 1990 to 148 or 16.4 percent in 2002. Further, as Chart 4 indicates, LICU median assets increased over 500 percent to $3.7 million in 2002. Average assets increased by 392.6 percent, from $2.9 million to $14.4 million. Although they have comparable levels of membership, the median and average assets of Legacy LICUs were $1.6 million and $8.1 million, respectively. LICUs are significantly smaller than other credit unions. The average assets of mainstream credit unions was $55 million in 2002.75 The 2002 net capitalization rates of LICUs are depicted in Chart 5. The net capital of LICUs grew to 11.2 percent in 2002, an increase of approximately three percent from 1990.The net capital of Legacy LICUs was also 11.2 percent in 2002. This is comparable to the 11 percent net capitalization rate of mainstream credit unions.76 Further, over 95 percent of LICUs are categorized as well or adequately
74National Credit Union Administration. 2003. 75Ibid. 76National Credit Union Administration. 2003.
22
Chart 4 Median Assets of LICUs
1990-2002
$607$807
$1,172$1,485
$2,746
$3,186
$3,726
$-
$500
$1,000
$1,500
$2,000
$2,500
$3,000
$3,500
$4,000
1990 1992 1994 1996 1998 2000 2002
Year
Med
ian
Ass
ets
(000
s)
Chart 5 Net Capitalization Rates of LICUs
2002
3.9% 3.1% 0.4% 0.1%
92.5%
0.0%
20.0%
40.0%
60.0%
80.0%
100.0%
7% and higher 6%-7% 4%-6% 2%-4% Less than 2%
Per
cent
of
LIC
Us
capitalized by the NCUA, with net capital ratios of 6 percent or greater. Approximately 3 percent of LICUs are under--capitalized with rates between 4-6 percent and one-half of one percent are significantly or critically under capitalized with rates less than 4 percent Secondary Capital NCUA permits LICUs to expand their net worth by accepting secondary capital investments. Secondary capital investments are treated like equity and therefore increase net capital and net worth
(Adjusted for inflation)

23
ratios. The investments are subordinate to all other credit union debt and must have a term of at least five years. Only 5.9 percent of LICUs in 2002 had secondary capital investments. The balance of the investments ranged from $1,600 to $2,465,000, with an average of approximately $230,000 (see Chart 6.) Legacy LICUs much more aggressively pursued secondary capital investments. They raised over 50 percent of total secondary capital investments in 2002 although they only account for 16.2 percent of LICUs.
Chart 6 Amount of Secondary Capital Investments
2002
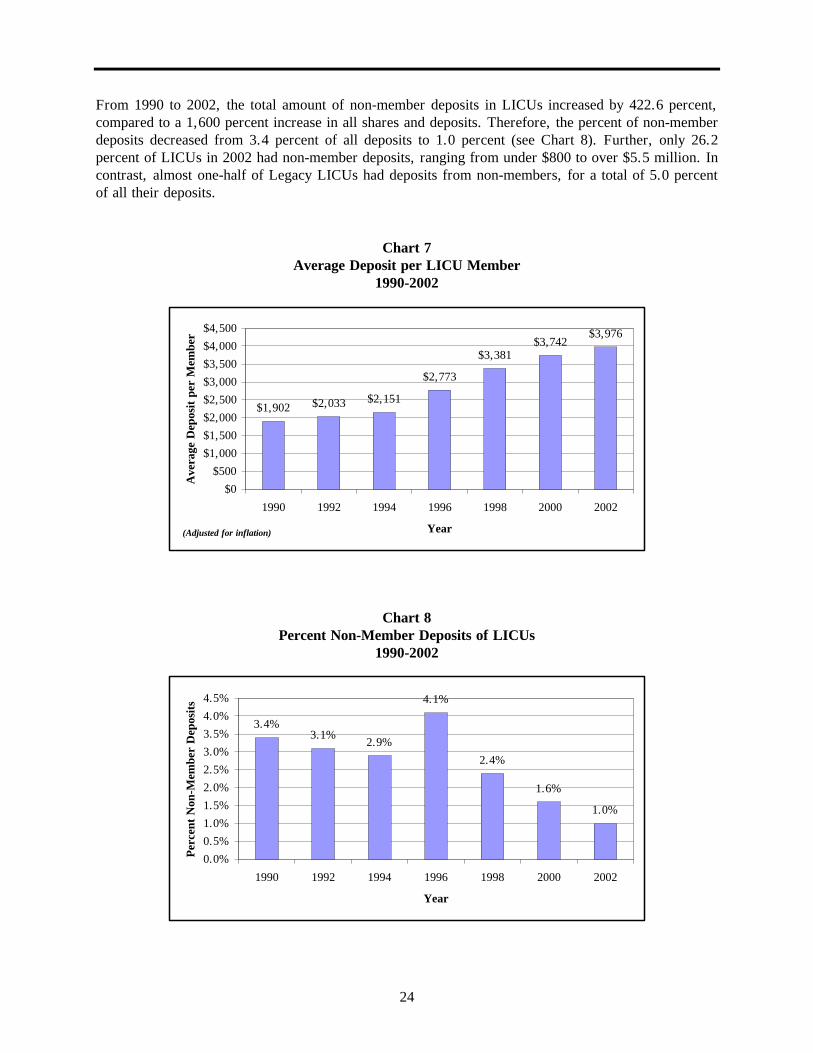
Shares and Deposits The total balance of share and deposit accounts of LICUs grew over 1,600 percent from 1990 to 2002, two times the growth in the number of members of LICUs. Average shares and deposits per LICU grew from $2.6 million in 1990 to $12.6 million in 2002. The average account balance per member was $3,976 in 2002 (Chart 7) compared to almost $6,000 for mainstream credit unions.77 The members of Legacy LICUs have the lowest account balances, at $2,602 in 2002. Lower account balances may be due to several reasons. LICUs may have lower average account balances because they serve a higher proportion of lower-income consumers than mainstream credit unions. As a result of their mission to serve lower-income communities, NCUA allows LICUs to accept deposits from non-members, such as banks, foundations, churches, and mainstream credit unions.
77National Credit Union Administration. 2003.
13
9
11 13
7
0
2
4
6
8
10
12
14
$1,600- 50,000
$50,001- 75,000
$75,001- 100,000
$100,001- 250,000
Over $250,000
Num
ber
of L
ICU
s
24
From 1990 to 2002, the total amount of non-member deposits in LICUs increased by 422.6 percent, compared to a 1,600 percent increase in all shares and deposits. Therefore, the percent of non-member deposits decreased from 3.4 percent of all deposits to 1.0 percent (see Chart 8). Further, only 26.2 percent of LICUs in 2002 had non-member deposits, ranging from under $800 to over $5.5 million. In contrast, almost one-half of Legacy LICUs had deposits from non-members, for a total of 5.0 percent of all their deposits.
Chart 7 Average Deposit per LICU Member
1990-2002
$1,902 $2,033 $2,151
$2,773
$3,381$3,742
$3,976
$0
$500
$1,000
$1,500
$2,000
$2,500
$3,000
$3,500
$4,000
$4,500
1990 1992 1994 1996 1998 2000 2002
Year
Ave
rage
Dep
osit
per
Mem
ber
Chart 8
Percent Non-Member Deposits of LICUs 1990-2002
3.4%3.1%
2.9%
4.1%
2.4%
1.6%
1.0%
0.0%
0.5%
1.0%
1.5%
2.0%
2.5%
3.0%
3.5%
4.0%
4.5%
1990 1992 1994 1996 1998 2000 2002
Year
Per
cent
Non
-Mem
ber
Dep
osit
s
(Adjusted for inflation)

25
Chart 9 Average LICU Loan
1990-2002
$4,267$4,674 $4,529
$6,287$6,918
$7,345
$5,614
$0
$1,000
$2,000
$3,000
$4,000
$5,000
$6,000
$7,000
$8,000
1990 1992 1994 1996 1998 2000 2002
Year
Ave
rage
LIC
U L
oan
Lending The total lending of LICUs increased over 1,700 percent from 1990 to 2002. The average loan volume for LICUs increased from $1.9 million in 1990 to $9.4 million in 2002. However, as Chart 9 indicates, the average loan to members grew by a more modest rate of 72.1 percent, from $4,267 in 1990 to $7,345 in 2002. This is comparable to the average loan of $8,000 for mainstream credit unions.78 The average loan of Legacy LICUs was $5,871 in 2002. The ratio of LICU loans to shares was relatively stable in 1990 and 2002, increasing by only three percent to 74.2 percent (see Chart 10). The 2002 loan to share ratio of Legacy LICUs was comparable, at 72.0 percent in 2002. Mainstream had a slightly lower loan to share ratio of approximately 71 percent.79 The 1990-2002 loan delinquency rates of LICUs are presented in Chart 11. Although LICU loan volume increased significantly, their loan delinquencies fell to 1.7 percent in 2002, a decrease of almost three percent from 1990. Further, the loan delinquencies rate of Legacy LICUs was 2.8 percent, a nearly two percent decrease from 1990. Despite the fact that their loan delinquencies have fallen, LICU loan delinquencies rates are higher than mainstream credit unions. Their loan delinquencies were approximately three-quarters of one percent in 2002.80
78National Credit Union Administration. 2003.
79Ibid. 80National Credit Union Administration. 2003.
(Adjusted for inflation)

26
Chart 10 LICU Loan to Share Ratios
1990-2002
71.3%
67.6%
72.9%
80.9%
76.5%
80.7%
74.2%
60.0%
65.0%
70.0%
75.0%
80.0%
85.0%
1990 1992 1994 1996 1998 2000 2002
Year
Loa
n to
Sha
re R
atio
Chart 11 LICU Loan Delinquency Rates
1990-2002
4.5%
3.6%
2.2% 2.2% 2.2%1.7% 1.7%
0.0%
1.0%
2.0%
3.0%
4.0%
5.0%
1990 1992 1994 1996 1998 2000 2002
Year
Per
cent
Del
inqu
ent
Loa
ns
Income and Expenses The average gross income of LICUs increased 225.6 percent from 1990 to 2002. However, operating expenses are increasing as a percentage of gross income. The 1990 and 2002 operating expense ratio of LICUs was 48.0 percent and 53.0 percent, respectively (see Chart 12). In contrast, the operating
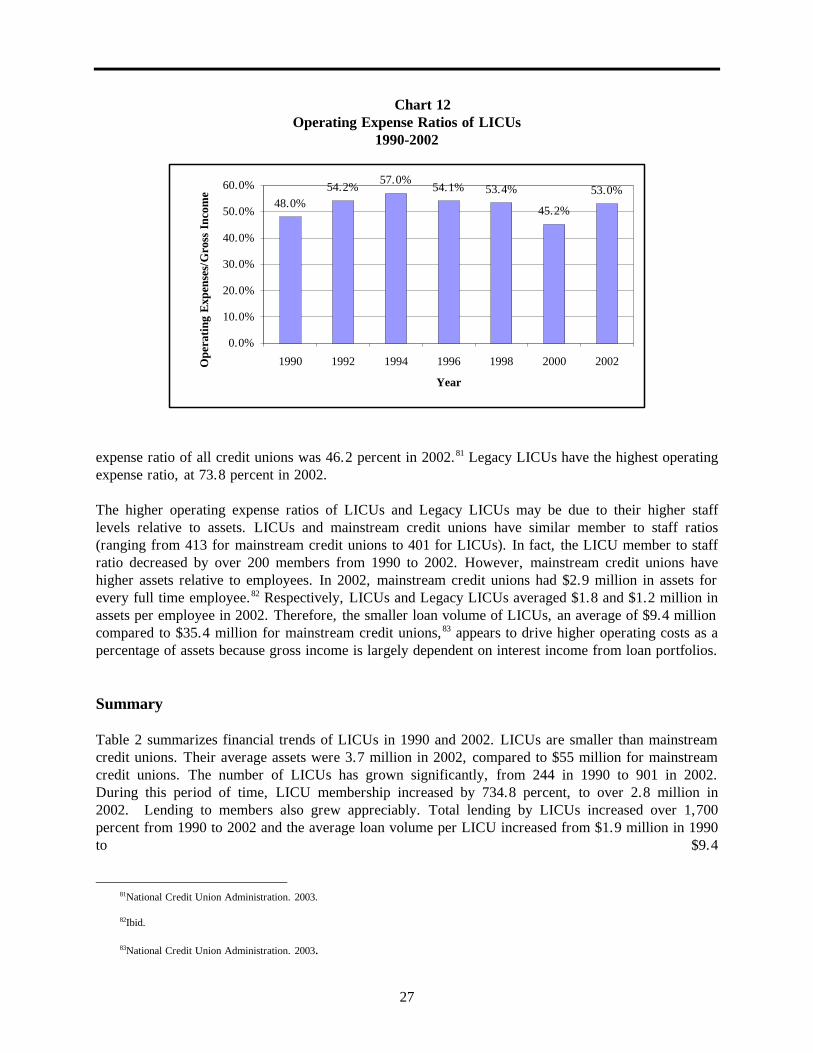
27
Chart 12 Operating Expense Ratios of LICUs
1990-2002
48.0%54.2%
57.0%54.1% 53.4%
45.2%
53.0%
0.0%
10.0%
20.0%
30.0%
40.0%
50.0%
60.0%
1990 1992 1994 1996 1998 2000 2002
Year
Ope
rati
ng E
xpen
ses/
Gro
ss I
ncom
e
expense ratio of all credit unions was 46.2 percent in 2002.81 Legacy LICUs have the highest operating expense ratio, at 73.8 percent in 2002. The higher operating expense ratios of LICUs and Legacy LICUs may be due to their higher staff levels relative to assets. LICUs and mainstream credit unions have similar member to staff ratios (ranging from 413 for mainstream credit unions to 401 for LICUs). In fact, the LICU member to staff ratio decreased by over 200 members from 1990 to 2002. However, mainstream credit unions have higher assets relative to employees. In 2002, mainstream credit unions had $2.9 million in assets for every full time employee.82 Respectively, LICUs and Legacy LICUs averaged $1.8 and $1.2 million in assets per employee in 2002. Therefore, the smaller loan volume of LICUs, an average of $9.4 million compared to $35.4 million for mainstream credit unions,83 appears to drive higher operating costs as a percentage of assets because gross income is largely dependent on interest income from loan portfolios. Summary Table 2 summarizes financial trends of LICUs in 1990 and 2002. LICUs are smaller than mainstream credit unions. Their average assets were 3.7 million in 2002, compared to $55 million for mainstream credit unions. The number of LICUs has grown significantly, from 244 in 1990 to 901 in 2002. During this period of time, LICU membership increased by 734.8 percent, to over 2.8 million in 2002. Lending to members also grew appreciably. Total lending by LICUs increased over 1,700 percent from 1990 to 2002 and the average loan volume per LICU increased from $1.9 million in 1990 to $9.4
81National Credit Union Administration. 2003. 82Ibid. 83National Credit Union Administration. 2003.

28
Table 2 LICU Financial Data
1990-2002
LICUs 1990 Adj. LICUs 2002 Adj.% Change 1990-2002
2002 Legacy LICUs Adj
% Change 1990-2002
Number of Active LICUs 244 901 269.3% 146 -40.2%Total Number of Members 343,297 2,865,720 734.8% 396,964 15.6%Average Number of Members per LICU 1,407 3,181 126.1% 2,719 93.2%Median Number of Members per LICU 552 1,264 129.0% 983 78.1%
Average Assets per LICU $2,929,821 $14,430,878 392.6% $8,109,552 176.8%Median Assets per LICU $606,831 $3,725,839 514.0% $1,584,591 161.1%Net Capital to Assets Ratio 8.4% 11.2% 2.8% 11.2% 2.8%
Average Shares/Deposits per LICU $2,675,973 $12,646,086 372.6% $7,075,402 164.4%Median Shares/Deposits per LICU $530,200 $3,114,827 487.5% $1,301,722 145.5%Total Number of Share/Deposit Accounts per LICU 418,556 4,365,860 943.1% 563,095 34.5%Total Amount of Shares/Deposit Accounts $652,937,445 $11,394,123,070 1645.1% $1,033,008,652 58.2%Average Balance of Share/Deposit Accounts $1,837 $2,610 42.1% $1,835 -0.1%Average Balance of Share/Deposit Accounts Per Member $1,902 $3,976 109.0% $2,602 36.8%
Total Non-Member Deposits $22,252,864 $116,298,531 422.6% $51,323,160 130.6%Average Amount of Non-Member Deposits $91,200 $129,077 41.5% $351,528 285.4%Percent of Non-Member Deposits 3.4% 1.0% -2.4% 5.0% 1.6%
Loan to Share Ratio 71.3% 74.2% 3.0% 72.0% 0.7%Total Number of Loans 109,083 1,151,776 955.9% 126,658 16.1%Total Amount of Loans $465,460,758 $8,460,058,850 1717.6% $743,615,809 59.8%Average Amount of Loans per LICU $1,907,626 $9,389,632 392.2% $5,093,259 167.0%Median Amount of Loans per LICU $321,035 $2,274,679 608.5% $765,801 138.5%Average Amount of LICU Loans $4,267 $7,345 72.1% $5,871 37.6%Percent of Delinquent Loans 4.5% 1.7% -2.7% 2.8% -1.7%
Total Gross Income $77,467,947 $931,493,959 1102.4% $94,223,579 21.6%Average Gross Income $317,492 $1,033,845 225.6% $645,367 103.3%Total Operating Expenses $37,206,706 $493,898,991 1227.4% $60,189,505 61.8%Operating Expense Ratio 48.0% 53.0% 5.0% 73.8% 25.8%
Average Number of Part-Time Employees 2 7 250.0% 6 200.0%Average Number of Full-Time Employees 1 2 100.0% 3 200.0%Assets to Employee Ratio $1,071,686 $1,821,310 69.9% $1,242,256 15.9%Member to Staff Ratio 603 401 -33.5% 416 -31.0%
million in 2002. Although LICU loan volume increased significantly, loan delinquencies decreased. In 2002, loan delinquencies were 1.7 percent, a decrease of almost 3 percent from 1990. The average account balance per LICU member was $3,976 in 2002 compared to almost $6,000 for mainstream credit unions. Although the net capitalization rate of LICUs is similar to that of mainstream credit unions, they have higher operating costs due to a greater number of employees per assets. It appears that credit union employment is fixed until economies of scale are reached. Relatively few LICUs have taken advantage of their ability to augment their deposits or capital. In 2002, only 26.2 percent of LICUs had non-member deposits and less than 6 percent had secondary capital investments.

29
Legacy LICUs are credit unions established in 1990 and still operating in 2002. These credit unions, which account for 16.2 percent of all LICUs in 2002, have smaller assets, membership, loans, and shares than other LICUs. They also have the highest operating expense ratio and loan delinquencies. However, Legacy LICUs have raised more subsidies, in the form of non-member deposits and secondary capital, than other LICUs. The growth in the number of LICUs is encouraging to those concerned about credit union services to lower-income consumers and communities. It is essential to monitor the loans and services of LICUs to determine their impact and provide lessons to mainstream credit unions on means to penetrate lower-income markets. In addition, NCUA should regularly assess the membership structure of LICUs to assure that 80 percent of their members have incomes below the area median or average.

30

31
Chapter IV
Low-Income Credit Union (LICU) Case Studies
The following chapter profiles case studies of three LICUs: El Paso Employees FCU of Texas; Greater Abbeville FCU of South Carolina; and Trustar FCU of Minnesota. These credit unions were selected because they are diverse in size and membership. Although data on the incomes or race of credit union members are not available, these credit unions were recommended by community and credit union experts because of their reputation for effectively serving people of modest means in their communities. Two of the three case studies are fairly large credit unions, with assets of $64 million and $130 million in 2002, and therefore may be more representative of mainstream credit unions. The case studies begin with a profile of the community the credit unions serves. This is followed by the history and background of the credit unions and an analysis of its financial trends from 1992-2002. A description of the credit unions financial services follows. The last section of each case study is an analysis of its lending.

32
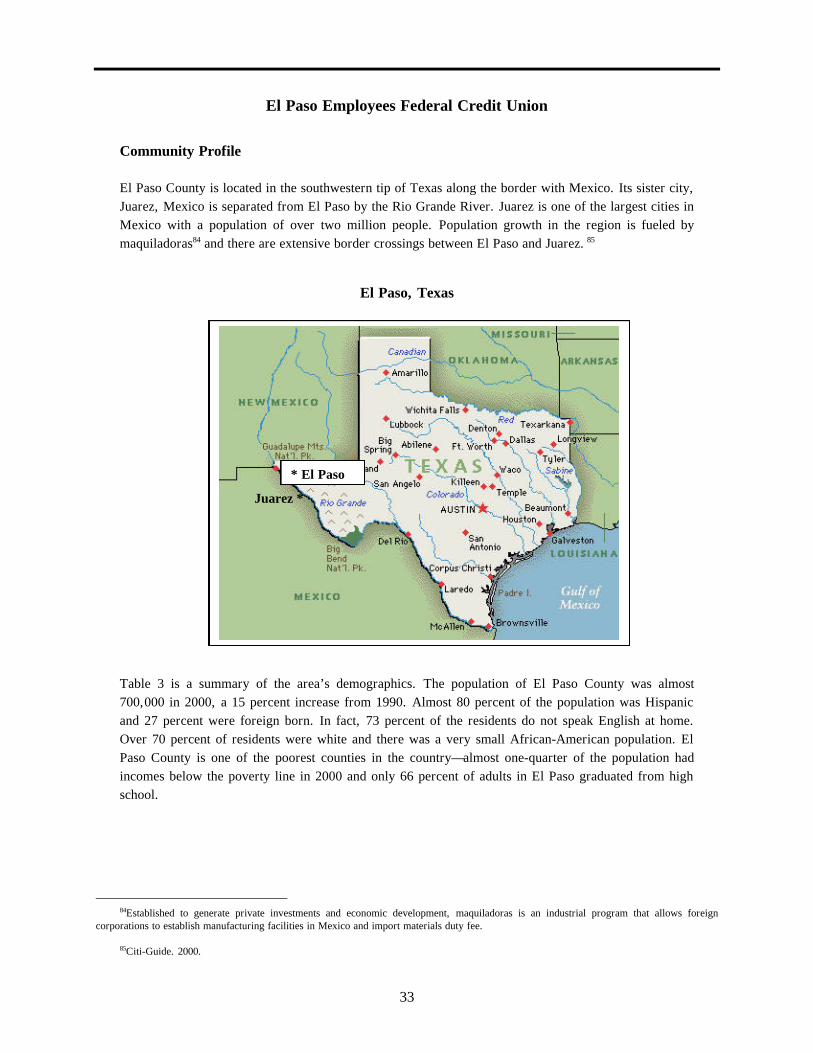
33
El Paso Employees Federal Credit Union
Community Profile
El Paso County is located in the southwestern tip of Texas along the border with Mexico. Its sister city, Juarez, Mexico is separated from El Paso by the Rio Grande River. Juarez is one of the largest cities in Mexico with a population of over two million people. Population growth in the region is fueled by maquiladoras84 and there are extensive border crossings between El Paso and Juarez. 85
El Paso, Texas
Table 3 is a summary of the area’s demographics. The population of El Paso County was almost 700,000 in 2000, a 15 percent increase from 1990. Almost 80 percent of the population was Hispanic and 27 percent were foreign born. In fact, 73 percent of the residents do not speak English at home. Over 70 percent of residents were white and there was a very small African-American population. El Paso County is one of the poorest counties in the country—almost one-quarter of the population had incomes below the poverty line in 2000 and only 66 percent of adults in El Paso graduated from high school.
84Established to generate private investments and economic development, maquiladoras is an industrial program that allows foreign
corporations to establish manufacturing facilities in Mexico and import materials duty fee. 85Citi-Guide. 2000.
* El Paso
Juarez *
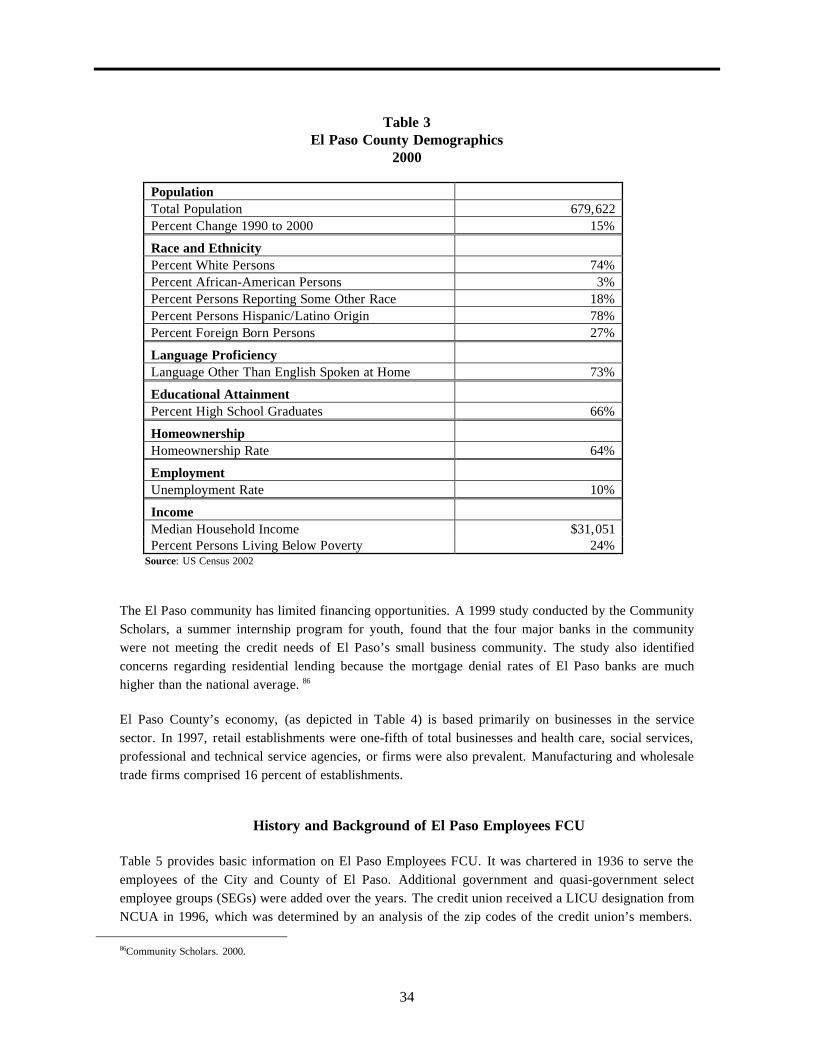
34
Table 3
El Paso County Demographics 2000
Population Total Population 679,622 Percent Change 1990 to 2000 15%
Race and Ethnicity
Percent White Persons 74% Percent African-American Persons 3% Percent Persons Reporting Some Other Race 18% Percent Persons Hispanic/Latino Origin 78% Percent Foreign Born Persons 27%
Language Proficiency
Language Other Than English Spoken at Home 73%
Educational Attainment
Percent High School Graduates 66%
Homeownership
Homeownership Rate 64%
Employment
Unemployment Rate 10%
Income
Median Household Income $31,051 Percent Persons Living Below Poverty 24%
Source: US Census 2002
The El Paso community has limited financing opportunities. A 1999 study conducted by the Community Scholars, a summer internship program for youth, found that the four major banks in the community were not meeting the credit needs of El Paso’s small business community. The study also identified concerns regarding residential lending because the mortgage denial rates of El Paso banks are much higher than the national average. 86 El Paso County’s economy, (as depicted in Table 4) is based primarily on businesses in the service sector. In 1997, retail establishments were one-fifth of total businesses and health care, social services, professional and technical service agencies, or firms were also prevalent. Manufacturing and wholesale trade firms comprised 16 percent of establishments.
History and Background of El Paso Employees FCU
Table 5 provides basic information on El Paso Employees FCU. It was chartered in 1936 to serve the employees of the City and County of El Paso. Additional government and quasi-government select employee groups (SEGs) were added over the years. The credit union received a LICU designation from NCUA in 1996, which was determined by an analysis of the zip codes of the credit union’s members.
86Community Scholars. 2000.
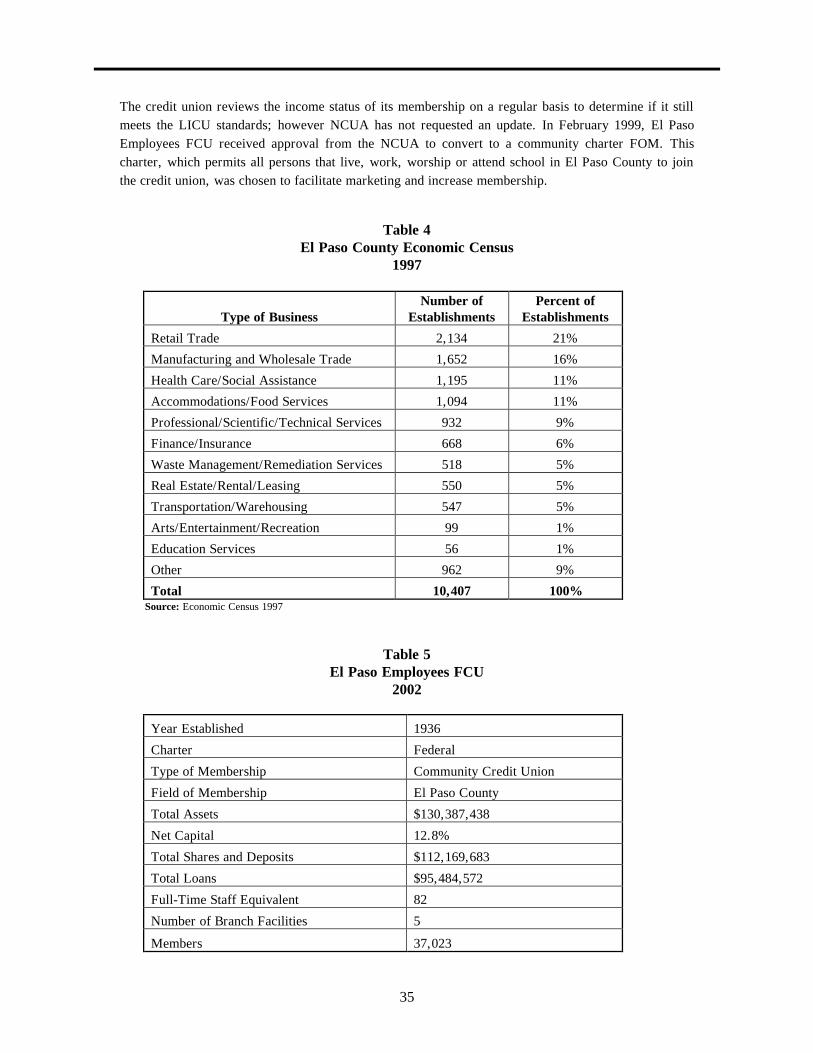
35
The credit union reviews the income status of its membership on a regular basis to determine if it still meets the LICU standards; however NCUA has not requested an update. In February 1999, El Paso Employees FCU received approval from the NCUA to convert to a community charter FOM. This charter, which permits all persons that live, work, worship or attend school in El Paso County to join the credit union, was chosen to facilitate marketing and increase membership.
Table 4 El Paso County Economic Census
1997
Type of Business
Number of Establishments
Percent of Establishments
Retail Trade 2,134 21%
Manufacturing and Wholesale Trade 1,652 16%
Health Care/Social Assistance 1,195 11%
Accommodations/Food Services 1,094 11%
Professional/Scientific/Technical Services 932 9%
Finance/Insurance 668 6%
Waste Management/Remediation Services 518 5%
Real Estate/Rental/Leasing 550 5%
Transportation/Warehousing 547 5%
Arts/Entertainment/Recreation 99 1%
Education Services 56 1%
Other 962 9%
Total 10,407 100% Source: Economic Census 1997
Table 5 El Paso Employees FCU
2002
Year Established 1936
Charter Federal
Type of Membership Community Credit Union
Field of Membership El Paso County
Total Assets $130,387,438
Net Capital 12.8%
Total Shares and Deposits $112,169,683
Total Loans $95,484,572
Full-Time Staff Equivalent 82
Number of Branch Facilities 5
Members 37,023

36
Source: NCUA 2002
The mission of El Paso Employees FCU is to provide quality services to its members in a professional, cooperative, and friendly manner. The credit union has over $130 million in assets and a staff of 82 employees. There are five credit union branches with three additional facilities planned within the next five years. In fact, two properties for new branches have already been purchased in growing suburban communities. In the long-term, the credit union also plans to establish a branch in an underserved area in Donna Ana County, New Mexico.
The credit union's senior management is comprised of a president and five vice presidents responsible for lending, operations, marketing, finance, and information systems. The board has 11 volunteer members. There are several permanent board committees that oversee budget and finance, personnel, loans and collections, and property management. A five-member Supervisory Committee conducts internal audits in cooperation with an accounting firm.
Credit union management has decided to focus on offering basic financial services. Their strategy is to offer basic services at a cost that is slightly below the market price and then to engage in cross selling of other products, especially loans. Credit union management believes that this strategy is important because consumers in El Paso are very price conscious. Further, El Paso Employees FCU does not offer relationship-based pricing—fees and interest rates are the same for everyone, regardless of account balance or whether the member has other credit union products. In fact, the credit union markets this practice to its members. It stresses that credit scores are not used to determine loan interest rate charges and so "what you see is what you get at El Paso Employees FCU".
The credit union earns most of its income from loans. Its fee income is generally limited to charges for negative behavior. El Paso Employees FCU’s largest source of fee income is non-sufficient funds fees, which are $17.50 per return. In addition, the credit union earns significant income from foreign transactions at its ATMs—about half of the transactions conducted with their ATMs are by non-members.
Members of the El Paso Employees FCU traditionally prefer personal services and therefore the credit union has a high transaction volume. However, this is slowly beginning to decrease as more members start to use direct deposit, ATMs, and telephone banking.
The credit union engages in marketing and promotions. The majority of the $200,000 annual marketing budget is used to advertise select financial service and loan products. An advantage of this strategy is that credit union leadership can track the efficacy of these promotions by keeping track of the number of people who ask for the product. El Paso Employees FCU works with local employers to make presentations or provide information to new employees. To increase name recognition, the credit union also sponsors community events and scholarships. There are plans to conduct a promotion that will ‘brand’ the credit union in the El Paso market in 2004.
Credit union staff is encouraged to participate in community activities. The employees of El Paso Employees FCU help raise funds for the Rainbow Room, a nonprofit foster care agency. Employees also support several local scholarship funds, the United Way, and other local charities.

37
El Paso Employees FCU has a very close relationship with the Texas Credit Union League. The League encouraged the credit union to obtain a LICU designation in 1996 and was also instrumental in the establishment of a credit union affordable home mortgage lending partnership (see below).
There have been nascent policy proposals to tax state chartered credit unions in Texas to help fund a $10 billion budget shortfall. Banks support this policy because they believe tax exemptions give credit unions undue competitive advantages.
El Paso Employees FCU Financial Trends
The management of El Paso Employees FCU posits that a strong capital position is crucial to support the credit union’s expansion plans. Therefore, they keep tight control of the net capital ratio by controlling asset growth. The credit union also has a policy of transferring earnings, after dividends are paid, into equity to increase the credit union’s net worth. As a result, the net capital of El Paso Employees FCU in 2002 was almost 13 percent. However, credit union management is concerned that retaining sufficient equity may become a challenge in the future. As the financial market becomes more competitive in El Paso, the credit union may struggle to maintain earnings.
El Paso Employees FCU’s financial trends are summarized in Table 6. The operating expenses of the credit union are significantly higher than that of mainstream credit unions. El Paso Employees FCU’s operating expense ratio increased from 61.1 percent in 1992 to 70.9 percent in 2002 (see Table 6). This increase is not due to the credit union’s ratio of members to staff, which is 465 compared to an average of 415 for LICUs and 413 for all credit unions. Rather, the higher employment cost may be due to the credit
Table 6 El Paso Employees FCU Financial Trends
1992 and 2002
1992
2002
Percent Change
Assets $53,874,061 $130,387,438
142.0%
Percent Net Capital 12.6% 12.8% 0.3% Secondary Capital - - - Total Shares and Deposits $44,714,967 $112,169,68
3 150.9%
Number of Share/Deposit Accounts 31,421 59,411 89.1% Mean Balance of Share/Deposit Accounts $1,423 $1,888 32.7% Amount of Non-Member Deposits - - - Percent Non-Member Deposits - - - Dividends 3.3% 2.0% -1.3% Operating Expense Ratio 61.1% 70.9% 9.8% Loan to Share Ratio 70.6% 85.1% 14.5% Number of Loans 9,664 11,565 19.7% Total Amount of Loans $31,583,769 $95,484,572 202.3%

38
Mean Amount of Loan to Borrowers $3,268 $8,256 152.6% Percent Delinquent Loans 1.0% 0.5% -0.5% Percent of Loan Charge Offs 1.0% 0.7% -0.3% Percent Member Business Loans - - - Mean Amount of Member Business Loans to Borrowers
- - -
Total Number of Members 21,138 37,023 75.1% Ratio of Members to CU Employees 432:1 465:1 7.7%
Source: NCUA 2002
union’s membership. El Paso Employees FCU has smaller assets per employee than mainstream credit unions due to smaller average loans. El Paso Employees FCU has $1.6 in assets per employee; the ratio for mainstream credit unions is $2.9 million.
Financial Services
The credit union provides a range of affordable financial services. El Paso Employees FCU’s basic share and draft accounts have no service fees and the minimum deposit for a share account is only $15. Further, there is no minimum balance requirement for the draft account. Other savings accounts include Vacation, Christmas, Youth Clubs accounts, and longer-term savings products such as certificates of deposit and IRA/KEOGH accounts.
Regular share accounts are the most popular credit union financial service product (Table 7). There are almost 40,000 share accounts for a total balance of approximately $43 million. The average balance of share accounts is $1,125. The credit union has $33 million in share certificates and $20 million in share draft accounts. The average deposit of all accounts is $1,888, considerably less than the $6,000 average for mainstream credit unions.
Table 7 Financial Service Accounts of El Paso Employees FCU
2002
Total
Deposits
Number of
Accounts
Percent of Total Deposits
Average Deposit
Regular Shares $43,551,475 38,714 38.8% $1,125 Share Certificates $33,233,617 2,241 29.6% $14,830 Share Drafts $20,129,233 16,728 17.9% $1,203 Money Market Shares $8,969,051 469 8.0% $19,124 IRA/KEOGH Accounts $6,286,307 1,259 5.6% $4,993 Total Shares and Deposits $112,169,68
3 59,411 100% $1,888
Source: NCUA 2002
The credit union has ten ATMs and offers free ATM and debit cards, Internet and telephone banking, direct deposit and payroll deductions. Basic financial education workshops are provided to community groups and members using the FDIC’s Money Smart curriculum. The credit union also sponsors

39
workshops on other personal finance issues such as preventing identity theft. Credit union members with poor credit ratings that require long-term assistance are referred to the local consumer credit counseling agency.
In 2001, El Paso Employees FCU and seven other local credit unions formed the El Paso Credit Union Affordable Housing LLC or EPCUAH (see next section on lending). In 2002, the partnership received a $92,504 First Accounts grant from the Treasury Department. The grant is being used to encourage unbanked low- and moderate-income individuals to establish accounts with one of the participating credit unions.87 By mid-2003, EPCUAH established 548 savings accounts and other accounts, and held financial literacy and homeownership classes for 650 consumers. Through its volunteer income tax assistance (VITA) program, EPCUAH prepared 50 income tax returns for recipients of the earned income tax credit (EITC) in 2003.88 89
Lending
Table 8 describes El Paso Employees FCU’s active lending program. The credit union’s lending increased over 200 percent from 1992 to 2002. In 2002, the credit union’s loan volume was over $95 million and its loan to share ratio increased from 70.6 percent in 1992 to 85.1 percent in 2002. The average loan for the credit union was a little over $8,000, about the same as mainstream credit unions and slightly higher than its LICU peers.
Table 8 El Paso Employees FCU Loan Volume
2002
Amount of Loans
Number of Loans
Percent of Loans
Average Loan
New Vehicle Loans $29,549,640 1,915 30.9% $15,431 Used Vehicle Loans $28,488,444 2,808 29.8% $10,145 Unsecured Loans/Lines of Credit $17,196,521 3,744 18.0% $4,593 Other Real Estate Loans/Lines of Credit $8,376,862 388 8.8% $21,590 Total First Mortgage Real Estate Loans/ Lines of Credit
$6,544,189
136
6.9%
$48,119
Unsecured Credit Card Loans $3,443,264 2,185 3.6% $1,576 All Other Loans/Lines of Credit $1,885,652 389 2.0% $4,847 Total $95,484,572 11,565 100% $8,256
Source: NCUA 2002
87United States Department of the Treasury. 2003. 88El Paso Credit Union Affordable Housing. 2003. 89The Department of the Treasury’s First Accounts program provides financial resources to develop and implement programs for the
unbanked or underbanked. There are no additional funds at this time.

40
Most of the credit union’s loans are consumer loans. Loans for new and used vehicles are approximately one-half of loan volume and there are a significant number of unsecured loans and credit card loans. El Paso Employees FCU also had $15 million in real estate loans in 2002, comprising about 15 percent of the total loan volume.
El Paso Employees FCU occasionally makes unsecured debt consolidation loans. Further, the credit union will permit borrowers to make principal-only payments if the borrower is experiencing financial difficulties.
The credit union was able to increase its loan portfolio due to several partnerships with regional car dealers. The dealers send loan applications to the credit union electronically for evaluation and approval. The credit union pays a small fee to the auto dealer for each loan that closes. If the loan is approved, the borrower becomes a member of the credit union by making a $15 deposit in a credit union share account at the loan closing. It is estimated that 30-40 percent of indirect loan borrowers remain credit union members after they pay off their loan. El Paso Employees FCU was only able to enter these partnerships when it adopted a community FOM, which has more flexible membership rules. The credit union has very low loan delinquencies. It experienced one-half of one percent delinquencies in 2002 and a charge off rate of 0.7 percent. Credit union management credits an experienced loan manager and a centralized decision-making process for the low delinquencies. In addition, El Paso Employees FCU’s traditional membership, local and state government employees, experience steady employment and wages. There is also a culture of credit union loyalty that encourages repayment of loans. Last, delinquencies are low because the credit union moves quickly if a borrower is behind in payments. The credit union’s two collections staff persons contact borrowers when a loan becomes 30 days overdue. The credit union had to adapt its underwriting standards to the lower incomes and credit ratings of El Paso residents. Credit union management contends that the credit union’s members, although good credit risks in general, have higher debt to income ratios than consumers in other communities. Many credit union members are also burdened with substantial credit card debt.
Home Mortgage Lending: The credit union makes about two to three home mortgages a year. The bulk of its home mortgage loans are refinance loans, which the credit union offers for a minimal financing fee. Texas was one of the last states to allow home equity loans, so the credit union has only provided these loans for the past two years.
There is a significant affordable housing gap in El Paso. First, many consumers have very low incomes. In 2000, 22 percent of all families and 41 percent of female headed families had incomes below the poverty level. Further, over one-third of the households in El Paso County received means-tested public assistance or non-cash benefits in 2000.90 Second, much of the housing stock is relatively old and generally requires considerable renovations. Third, immigrants, who comprise a quarter of the population, often experience significant obstacles to obtaining loans from mainstream financial institutions due to language and cultural barriers. Fourth, residency can also be an issue. The secondary market mandates that borrowers have a minimum three year residency in the U.S.
90El Paso Times. 2001.
41
As a result of these issues, El Paso Employees FCU and seven other credit unions established the El Paso Credit Union Affordable Housing LLC (EPCUAH) to provide affordable home mortgage finance. In total, the eight credit unions have over 400,000 members and $1.9 billion in assets.91 EPCUAH, which is supported by the Texas Credit Union Foundation and the National Credit Union Foundation, provides financial education and counseling, and financing for low- to moderate-income consumers who do not qualify for conventional financing.
EPCUAH uses the interest on a $1 million investment from the participating credit unions to support its operation expenses. To fund loans, EPCUAH borrows from member credit unions at a discounted rate. The loans are then sold to Fannie Mae and the sale proceeds are used to repay the member credit unions. EPCUAH makes direct and participation loans. Partners include several local and federal housing agencies, including the U.S. Department of Housing and Urban Development (HUD), the Housing Authority of the City of El Paso, the El Paso Empowerment Zone Corporation, and the Rural Development and Finance Corporation. Generally, the partners provide credit enhancements that enable the loans to be more flexibly underwritten and still acceptable to Fannie Mae. EPCUAH wanted to keep track of the loans, even those sold to the secondary market. Therefore loans are serviced by the eight participating credit unions.
EPCUAH has established several pilot programs. A second mortgage program has been developed in cooperation from Fannie Mae and the Housing Authority. There is also a lease/purchase financing pilot program that allows borrowers up to three years to achieve credit goals and fully assume the loan for the home. Another EPCUAH program involves a partnership with the El Paso Empowerment Zone. An EPCUAH first mortgage is combined with a second mortgage and down payment assistance funded with Empowerment Zone funds. In 2002, EPCUAH provided $1.1 million in mortgages which were leveraged by $2.2 million in funding from other participating agencies. 92
Financial literacy training is a significant component of EPCUAH programming. It provides financial literacy training through local social service and community-based organizations, employers, and school districts, including mortgage readiness programs using a curriculum developed in cooperation with Fannie Mae, the National Endowment for Financial Education (NEFE), and FDIC’s Money Smart program.
EPCUAH is planning to expand. A nonprofit affiliate will be formed to administer financial literacy training. Mortgage lending will be retained by EPCUAH. EPCUAH’s management would also like to begin making loans to residents of colonias or informal settlements developed by Mexican immigrants in remote areas along the Texas-Mexico border. Housing in the colonias are generally makeshift structures made of wood, cardboard, or other materials.93 EPCUAH plans to offer low interest loans to colonia residents, in partnership with the Texas Department of Housing and Community Affairs, to improve housing conditions.
91El Paso Credit Union Affordable Housing. N.D. 92El Paso Credit Union Affordable Housing. 2003. 93Office of Colonia Initiatives at the Texas Department of Housing and Community Affairs. N.D.
42
Conclusion
El Paso Employees FCU offers extensive services to its lower-income members. The credit union has free or low-cost accounts and provides formal and informal financial literacy education. El Paso Employees FCU has extensive relationships with local employers and provides bank at work services. Its lending program is very extensive. Recognizing the financial management patterns of its membership, El Paso Employees FCU has modified its underwriting procedures. However, it has not sacrificed safety and soundness—the credit union’s loan delinquency rate was only one-half of one percent in 2002. The credit union also maintains several partnerships with local car dealerships that enable it to provide affordable car loans to local consumers and promote membership. El Paso Employees FCU has also given great consideration to marketing and promotions. It utilizes its relationships with local firms to market products to new employees. It also regularly promotes credit union products through mailings, brochures, and advertisements in local publications. The credit union is a member of a unique partnership with seven other credit unions that provides affordable financing and financial education to lower-income consumers interested in home ownership. In addition to investments made by each of the credit unions, EPCUAH has raised substantial program and operations funding from government agencies and national intermediaries. EPCUAH is also planning to provide services to residents of colonias, informal settlements along the border of Texas and Mexico.
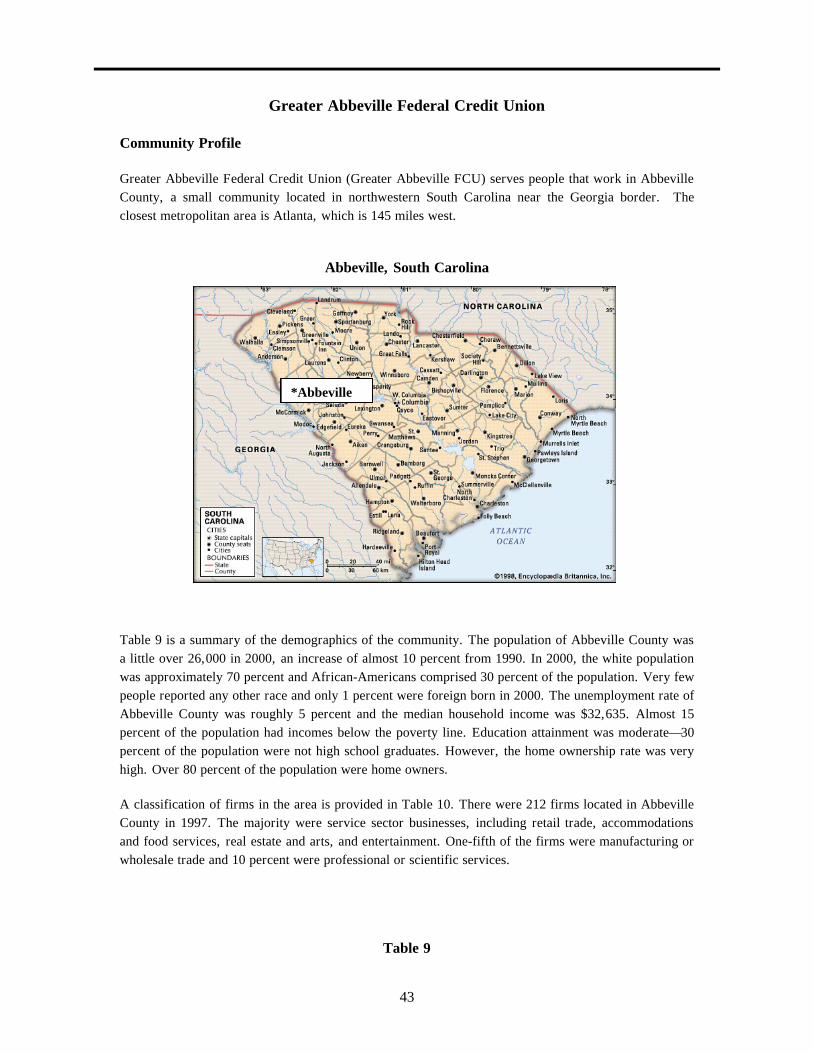
43
Greater Abbeville Federal Credit Union
Community Profile
Greater Abbeville Federal Credit Union (Greater Abbeville FCU) serves people that work in Abbeville County, a small community located in northwestern South Carolina near the Georgia border. The closest metropolitan area is Atlanta, which is 145 miles west.
Abbeville, South Carolina
Exhibit International Falls Region De000
Source: US Census 2000.
Table 9 is a summary of the demographics of the community. The population of Abbeville County was a little over 26,000 in 2000, an increase of almost 10 percent from 1990. In 2000, the white population was approximately 70 percent and African-Americans comprised 30 percent of the population. Very few people reported any other race and only 1 percent were foreign born in 2000. The unemployment rate of Abbeville County was roughly 5 percent and the median household income was $32,635. Almost 15 percent of the population had incomes below the poverty line. Education attainment was moderate—30 percent of the population were not high school graduates. However, the home ownership rate was very high. Over 80 percent of the population were home owners. A classification of firms in the area is provided in Table 10. There were 212 firms located in Abbeville County in 1997. The majority were service sector businesses, including retail trade, accommodations and food services, real estate and arts, and entertainment. One-fifth of the firms were manufacturing or wholesale trade and 10 percent were professional or scientific services.
Table 9
* Abbeville
*Abbeville

44
Greater Abbeville Demographics 2000
Population Total Population 2000 26,167 Total Population 1990 23,862 Percent Change 1990 to 2000 9.70%
Race and Ethnicity
Percent White Persons 68.3% Percent African-American Persons 30.3% Percent Persons Reporting Some Other Race 0.6% Percent Persons Hispanic/Latino Origin 0.8% Percent Foreign Born Persons
Language Proficiency
Language Other Than English Spoken at Home 3.80%
Educational Attainment
Percent High School Graduates 70.1%
Homeownership
Homeownership Rate 80.5%
Employment
Unemployment Rate 5.1%
Income Median Household Income $32,635 Percent Persons Living Below Poverty 13.7%
Source: U.S. Census 2002
Table 10 Greater Abbeville Economic Census
1997
Type of Business
Number of Establishments
Percent of Establishments
Retail Trade 65 31%
Manufacturing and Wholesale Trade 46 22%
Health Care/Social Assistance 29 14%
Accommodations/Food Services 26 12%
Professional/Scientific/Technical Services 10 5%
Waste Management/Remediation Services 8 4%
Real Estate/Rental/Leasing 5 2%
Arts/Entertainment/Recreation 2 1%
Other 19 9%
Total 210 100% Source: Economic Census 1997
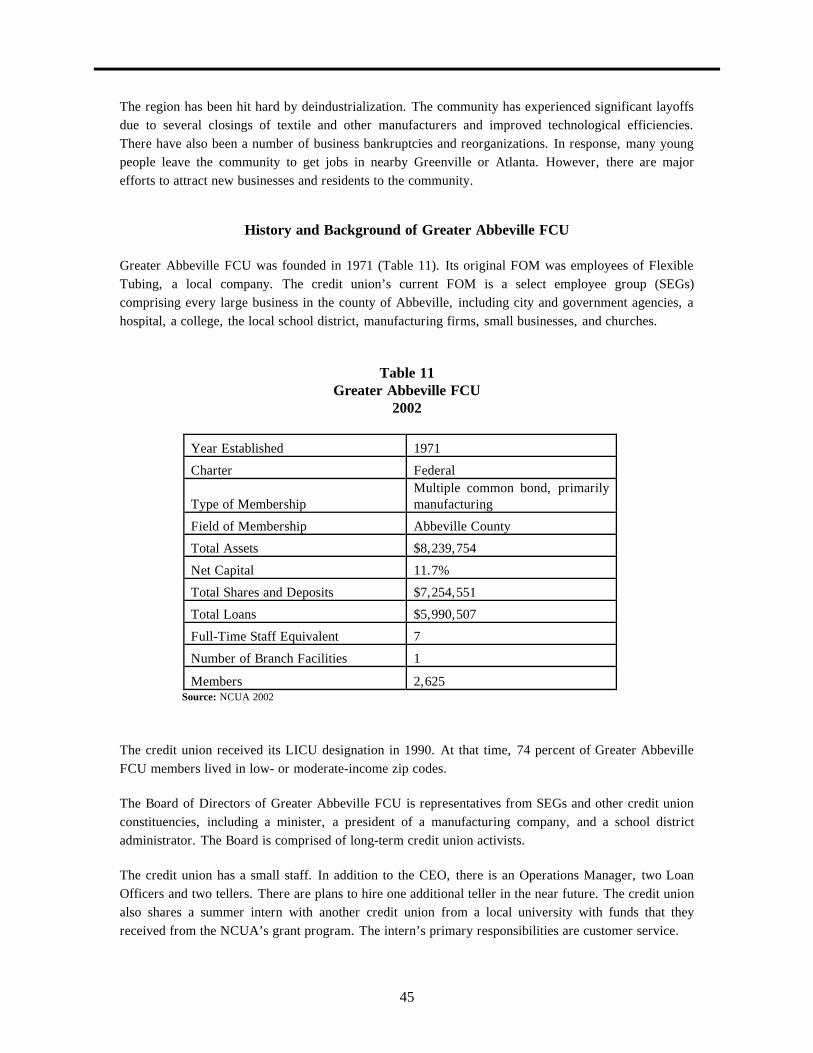
45
The region has been hit hard by deindustrialization. The community has experienced significant layoffs due to several closings of textile and other manufacturers and improved technological efficiencies. There have also been a number of business bankruptcies and reorganizations. In response, many young people leave the community to get jobs in nearby Greenville or Atlanta. However, there are major efforts to attract new businesses and residents to the community.
History and Background of Greater Abbeville FCU
Greater Abbeville FCU was founded in 1971 (Table 11). Its original FOM was employees of Flexible Tubing, a local company. The credit union’s current FOM is a select employee group (SEGs) comprising every large business in the county of Abbeville, including city and government agencies, a hospital, a college, the local school district, manufacturing firms, small businesses, and churches.
Table 11 Greater Abbeville FCU
2002
Year Established 1971
Charter Federal
Type of Membership Multiple common bond, primarily manufacturing
Field of Membership Abbeville County
Total Assets $8,239,754
Net Capital 11.7%
Total Shares and Deposits $7,254,551
Total Loans $5,990,507
Full-Time Staff Equivalent 7
Number of Branch Facilities 1
Members 2,625 Source: NCUA 2002
The credit union received its LICU designation in 1990. At that time, 74 percent of Greater Abbeville FCU members lived in low- or moderate-income zip codes. The Board of Directors of Greater Abbeville FCU is representatives from SEGs and other credit union constituencies, including a minister, a president of a manufacturing company, and a school district administrator. The Board is comprised of long-term credit union activists. The credit union has a small staff. In addition to the CEO, there is an Operations Manager, two Loan Officers and two tellers. There are plans to hire one additional teller in the near future. The credit union also shares a summer intern with another credit union from a local university with funds that they received from the NCUA’s grant program. The intern’s primary responsibilities are customer service.

46
Greater Abbeville FCU has excellent community relationships. The CEO has served as a United Way Campaign Chair and was on the Board of Directors of the local Chamber of Commerce. The CEO is also a member of the small credit union committee of the South Carolina Credit Union League, the local Rotary Association, a hospital foundation board, a county development board, and other local organizations. Greater Abbeville FCU also engages in marketing to increase its membership. It has placed advertisements on local radio stations and billboards and regularly posts notices on the bulletin boards of local employers. Other marketing techniques include distributing brochures at local events and making presentations to employees of local firms.
Greater Abbeville FCU provides all basic financial services as well as consumer and real estate loans. The credit union serves as a local service provider, selling discount movie and theme park tickets, postage stamps, and fax services. Free notary services are available and the credit union maintains a community resource area with brochures on consumer and community issues.
Credit union management is currently considering adopting a community FOM that will include Abbeville and McCormick counties. McCormick is an underserved community with no credit unions and very few bank branches. The staff will write a business plan to assess the viability of the expansion.
Greater Abbeville FCU Financial Trends
As reflected in Table 12, Greater Abbeville FCU is smaller than the other LICUs profiled in this report. The credit union had assets of approximately $8 million in 2002, an increase of almost 200 percent from 1992. It is very well capitalized, with net capital of 11.7 percent which is approximately the same as for all LICUs. The loan to share ratio of Greater Abbeville FCU is 82.6 percent, which is about ten percent higher than the average for LICUs. However, the 2002 loan to share ratio represents a decrease from 92 percent in 1992-although loan volume increased by almost 150 percent from 1992 to 2002. The credit union’s average loan increased by 192.6 percent from 1992 to 2002 to $5,315, which is about $2,000 more than the LICU average. Loan delinquencies were almost 4 percent in 2002, over two percent higher than the LICU average. However, delinquencies decreased to 1.1 percent by June 2003 due to charge offs. The credit union’s operating expense ratio was fairly high in 2002 at 74.6 percent, an increase from 63.7 percent in 1992. This may be due to the credit union’s staffing. The ratio of members to staff is 375, compared to 415 for all LICUs.
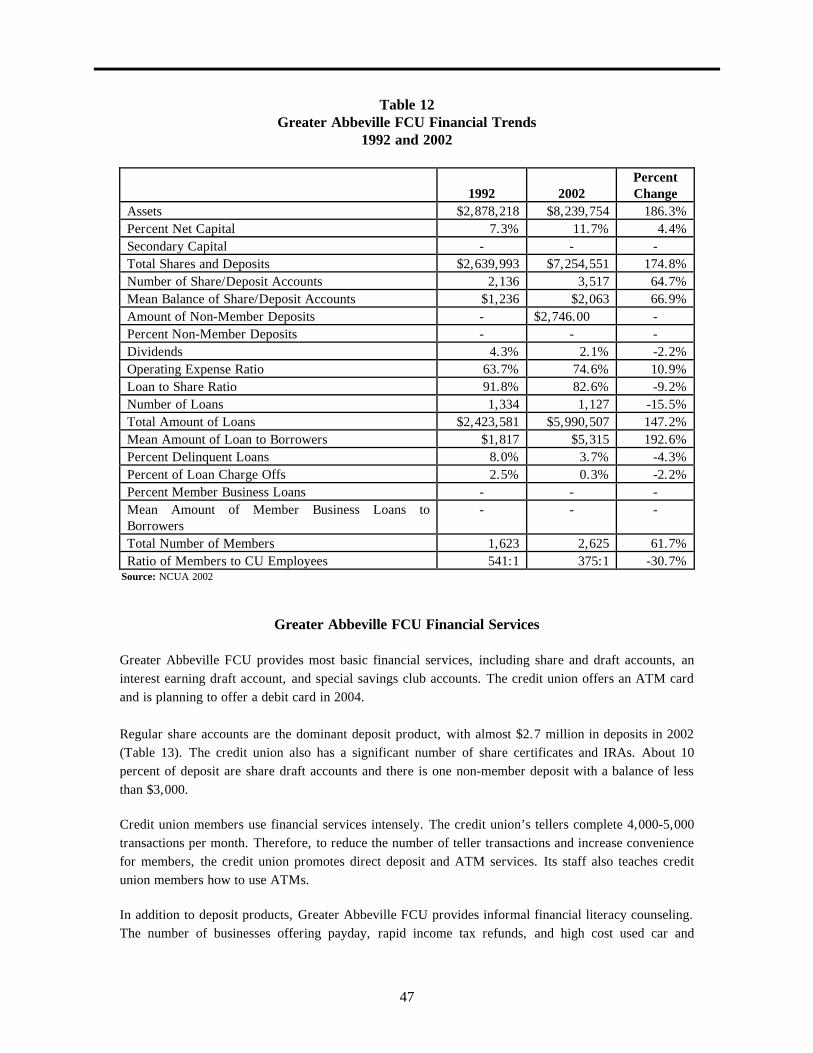
47
Table 12 Greater Abbeville FCU Financial Trends
1992 and 2002
1992
2002
Percent Change
Assets $2,878,218 $8,239,754 186.3% Percent Net Capital 7.3% 11.7% 4.4% Secondary Capital - - - Total Shares and Deposits $2,639,993 $7,254,551 174.8% Number of Share/Deposit Accounts 2,136 3,517 64.7% Mean Balance of Share/Deposit Accounts $1,236 $2,063 66.9% Amount of Non-Member Deposits - $2,746.00 - Percent Non-Member Deposits - - - Dividends 4.3% 2.1% -2.2% Operating Expense Ratio 63.7% 74.6% 10.9% Loan to Share Ratio 91.8% 82.6% -9.2% Number of Loans 1,334 1,127 -15.5% Total Amount of Loans $2,423,581 $5,990,507 147.2% Mean Amount of Loan to Borrowers $1,817 $5,315 192.6% Percent Delinquent Loans 8.0% 3.7% -4.3% Percent of Loan Charge Offs 2.5% 0.3% -2.2% Percent Member Business Loans - - - Mean Amount of Member Business Loans to Borrowers
- - -
Total Number of Members 1,623 2,625 61.7% Ratio of Members to CU Employees 541:1 375:1 -30.7%
Source: NCUA 2002
Greater Abbeville FCU Financial Services
Greater Abbeville FCU provides most basic financial services, including share and draft accounts, an interest earning draft account, and special savings club accounts. The credit union offers an ATM card and is planning to offer a debit card in 2004. Regular share accounts are the dominant deposit product, with almost $2.7 million in deposits in 2002 (Table 13). The credit union also has a significant number of share certificates and IRAs. About 10 percent of deposit are share draft accounts and there is one non-member deposit with a balance of less than $3,000. Credit union members use financial services intensely. The credit union’s tellers complete 4,000-5,000 transactions per month. Therefore, to reduce the number of teller transactions and increase convenience for members, the credit union promotes direct deposit and ATM services. Its staff also teaches credit union members how to use ATMs. In addition to deposit products, Greater Abbeville FCU provides informal financial literacy counseling. The number of businesses offering payday, rapid income tax refunds, and high cost used car and

48
personal finance loans have exploded in the community in recent years. Most of the credit union’s counseling services are done on a one-on-one basis with members at the ‘teaching moment,’ such as when a member

49
Table 13 Financial Service Accounts of Greater Abbeville FCU
2002
Total
Deposits
Number of
Accounts
Percent of Total Deposits
Average Deposit
Regular Shares $2,772,285 2,625 38.2% $1,056 Share Certificates $2,381,638 140 32.8% $17,012 Share Drafts $649,968 409 9.0% $1,589 IRA/KEOGH Accounts $1,382,591 84 19.1% $0 Total Other Shares $65,323 258 0.9% $253 Money Market Shares $0 0 0.0% $0 Non-Member Deposit $2,746 1 0.0% $2,746 Total Shares and Deposits $7,254,551 3,517 100.0% $2,063
Source: NCUA 2002
is denied a loan due to bad credit. At that time, the loan officer will offer assistance, such as reviewing a member’s credit report and recommending steps to improve their credit rating. In January 2004, Greater Abbeville FCU began taking a more proactive approach to financial counseling and offered a series of financial literacy classes at a local church. Credit union management plans to focus on savings mobilization and credit repair as an alternative to societal messages that promote consumer spending and credit. The classes will encourage consumers to make small deposits on a regular basis as a way of building wealth.
The management of Greater Abbeville FCU is deliberating the possibility of offering check cashing services for non-members94 for a fee. Several local convenience stores and pawnshops in the community provide check cashing services for as much as 10 percent of the value of the check. The credit union believes that cashing checks for non-members could allow them to increase membership and generate fee income. Greater Abbeville FCU offers a credit and debt repair program. For $5 a month, the credit union will make payments from a member’s share or draft account to one to three creditors on accounts that are delinquent or in default, such as medical and credit card bills and repossessed auto loans. Thirty-four members have participated in the program.
Greater Abbeville FCU Lending
The credit union’s largest loan portfolio is for used vehicles. Car ownership is vital because the community does not have a public transportation system and an automobile is essential to employment (Table 14). Greater Abbeville FCU also makes loans for the purchase of new vehicles, and has refinanced high cost car loans for credit union members. Unfortunately, the credit union has been
94The NCUA allows credit unions to cash the checks of non-members if they are employed by a business that is a member of the credit
union. There have been proposals for the credit union industry to expand this service to other non-members.

50
unable to establish
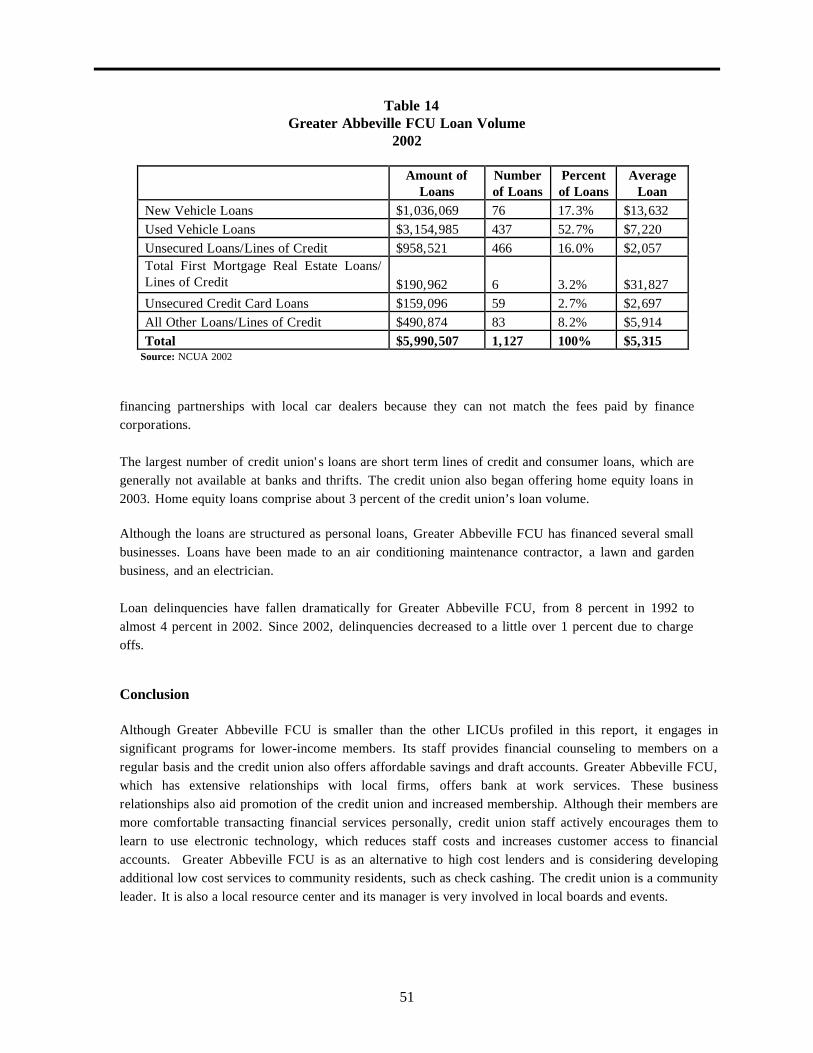
51
Table 14 Greater Abbeville FCU Loan Volume
2002
Amount of Loans
Number of Loans
Percent of Loans
Average Loan
New Vehicle Loans $1,036,069 76 17.3% $13,632 Used Vehicle Loans $3,154,985 437 52.7% $7,220 Unsecured Loans/Lines of Credit $958,521 466 16.0% $2,057 Total First Mortgage Real Estate Loans/ Lines of Credit
$190,962
6
3.2%
$31,827
Unsecured Credit Card Loans $159,096 59 2.7% $2,697 All Other Loans/Lines of Credit $490,874 83 8.2% $5,914 Total $5,990,507 1,127 100% $5,315
Source: NCUA 2002
financing partnerships with local car dealers because they can not match the fees paid by finance corporations. The largest number of credit union's loans are short term lines of credit and consumer loans, which are generally not available at banks and thrifts. The credit union also began offering home equity loans in 2003. Home equity loans comprise about 3 percent of the credit union’s loan volume. Although the loans are structured as personal loans, Greater Abbeville FCU has financed several small businesses. Loans have been made to an air conditioning maintenance contractor, a lawn and garden business, and an electrician. Loan delinquencies have fallen dramatically for Greater Abbeville FCU, from 8 percent in 1992 to almost 4 percent in 2002. Since 2002, delinquencies decreased to a little over 1 percent due to charge offs.
Conclusion
Although Greater Abbeville FCU is smaller than the other LICUs profiled in this report, it engages in significant programs for lower-income members. Its staff provides financial counseling to members on a regular basis and the credit union also offers affordable savings and draft accounts. Greater Abbeville FCU, which has extensive relationships with local firms, offers bank at work services. These business relationships also aid promotion of the credit union and increased membership. Although their members are more comfortable transacting financial services personally, credit union staff actively encourages them to learn to use electronic technology, which reduces staff costs and increases customer access to financial accounts. Greater Abbeville FCU is as an alternative to high cost lenders and is considering developing additional low cost services to community residents, such as check cashing. The credit union is a community leader. It is also a local resource center and its manager is very involved in local boards and events.

52

53
Trustar Federal Credit Union
Community Profile
Trustar Federal Credit Union (Trustar FCU) is located in International Falls, Minnesota. The International Falls region is located in northern Minnesota, near the border with Canada. The area is infamous for being one of the coldest communities in the United States.
International Falls, Minnesota
Table 15 is a summary of the demographic characteristics of the International Falls region. There were about 85,000 residents in 2000, a 10 percent gain in population from 1990. The community was predominantly white and 5 percent were Hispanic. Most of the population that reported a race other than white or African American were American Indian. Foreign born persons constituted 2 percent of the population and 5 percent spoke a language other than English at home. Over 10 percent of the population had incomes below the poverty line. The median income ranged from $30,651 in Wadena County to $36,262 in Koochiching County and over 12 percent of the households had annual incomes less than $10,000 per year. Almost 9 percent of the residence had incomes between $10,000 and $14,999. About 80 percent of the adults in Koochiching County were high school graduates and the unemployment rate in 2000 was 6 percent.
International Falls *

54
Table 15 International Falls Region Demographics95
2000
Population Total Population 2000 86,843 Total Population 1990 78,776 Percent Change 1990 to 2000 10.2%
Race and Ethnicity
Percent White Persons 87.4% Percent African-American Persons 0.3% Percent Persons Reporting Some Other Race 10.9% Percent Persons Hispanic/Latino Origin 5.0% Percent Foreign Born Persons 2.2%
Language Proficiency
Language Other Than English Spoken at Home 4.9%
Educational Attainment Percent High School Graduates 82.7%
Homeownership Homeownership Rate 77.8%
Employment Unemployment Rate 6.7%
Income Median Household Income $30,651-36,262 Percent Persons Living Below Poverty 14.5%
Source: U.S. Census 2000
The largest employer in the International Falls region is the Boise Cascade Corporation, a paper mill with 1,150 employees.96 According to the 1997 Economic Census, the region had a total of 1,238 business establishments (Table 16). Retail trade businesses comprised the majority of businesses (39 percent) and arts/entertainment/recreation sector was 20 percent of establishments. Local, state, and federal governments, including border patrol and homeland security, schools, and transportation, are significant employers in the region.
History and Background of Trustar FCU Trustar FCU was chartered in July 1960 as the MANDO Employees Credit Union. In the mid-1970’s the name changed to Boise Employees Credit Union. In 1999, the credit union adopted a community FOM in Koochiching County and became a federally chartered credit union. In June 2003, the name was changed to Trustar and its FOM was expanded to all those that live, work, worship, or attend school in Beltrami, Hubbard, Koochiching, and Wadena counties. One of the challenges of receiving
95Trustar FCU’s FOM was expanded to International Falls Region, comprising Beltrami, Hubbard, Koochiching, and Wadena
counties, in 2003.
96International Falls Area Chamber of Commerce. 2003.

55
approval from NCUA

56
Table 16 International Falls Region Economic Census
1997
Type of Business
Number of Establishments
Percent of Establishments
Retail Trade 477 33%
Manufacturing and Wholesale Trade 200 14%
Health Care/Social Assistance 129 9%
Accommodations/Food Services 244 17%
Professional/Scientific/Technical Services 103 7%
Waste Management/Remediation Services 74 5%
Real Estate/Rental/Leasing 52 4%
Arts/Entertainment/Recreation 43 3%
Other 116 8%
Total 1,438 100% Source: Economic Census 1997
for the community FOM was demonstrating a relationship between the four counties due to the wide dispersal of population in this rural community. However, the credit union was afforded some flexibility by NCUA because it expanded to underserved communities. The target market of Trustar FCU is working class families. The mission of the credit union is ‘to enrich the lives of our members’ and its value statement is ‘not for profit, not for charity, but for service’. Credit union leaders maintain that the purpose of Trustar FCU is to provide high quality, affordable services and loans for consumers and businesses. Trustar FCU has grown significantly in the past ten years. In 1992 there was one credit union office, six employees, and $25 million in assets. A new headquarters building was completed in 1995 and by 2002 Trustar had four locations, 45 employees, and over $64 million in assets (Table 17). From 1992-2002, there was an 86.8 percent increase in members to almost 9,000 in 2002 and a 188.6 percent increase in loans. This growth is projected to continue. Trustar FCU management plans to add a fifth credit union branch in Bemidji County in 2005. Much of the growth of the credit union is due to its ability to compete with banks. The credit union offers lower rates than competing banks and unlike most banks, regularly makes small consumer loans. In addition, Trustar FCU management asserts that they gained members because some consumers were frustrated with multiple bank mergers in the region. Employer relationships are also a significant factor for expansion. The credit union markets its products with major employers, including Boise Cascade. Trustar FCU management also credits its headquarters building, which is quite large by community standards, for increasing the credit union’s legitimacy and attracting new members. Trustar FCU is known in the region for early adoption of new banking technologies. It was the first financial institution in the area to install ATMs and to offer Internet banking. Further, Trustar FCU provided one of the first local Internet access services in 2000.
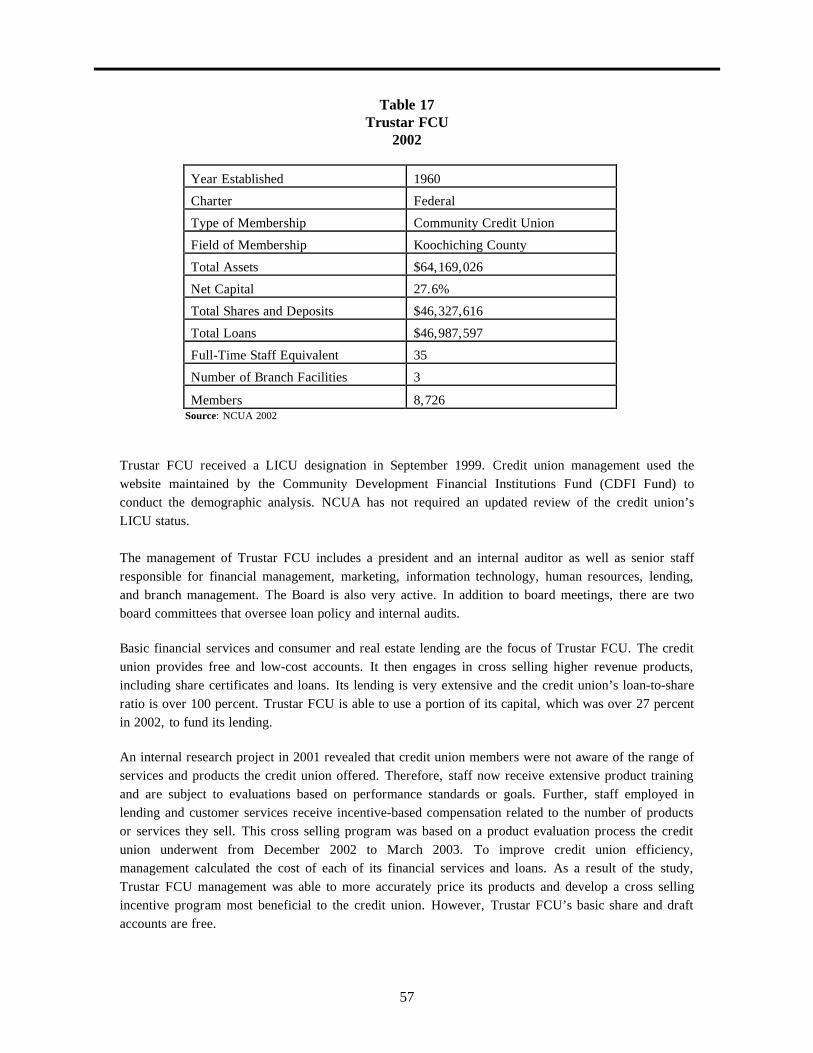
57
Table 17 Trustar FCU
2002
Year Established 1960
Charter Federal
Type of Membership Community Credit Union
Field of Membership Koochiching County
Total Assets $64,169,026
Net Capital 27.6%
Total Shares and Deposits $46,327,616
Total Loans $46,987,597
Full-Time Staff Equivalent 35
Number of Branch Facilities 3
Members 8,726 Source: NCUA 2002
Trustar FCU received a LICU designation in September 1999. Credit union management used the website maintained by the Community Development Financial Institutions Fund (CDFI Fund) to conduct the demographic analysis. NCUA has not required an updated review of the credit union’s LICU status. The management of Trustar FCU includes a president and an internal auditor as well as senior staff responsible for financial management, marketing, information technology, human resources, lending, and branch management. The Board is also very active. In addition to board meetings, there are two board committees that oversee loan policy and internal audits. Basic financial services and consumer and real estate lending are the focus of Trustar FCU. The credit union provides free and low-cost accounts. It then engages in cross selling higher revenue products, including share certificates and loans. Its lending is very extensive and the credit union’s loan-to-share ratio is over 100 percent. Trustar FCU is able to use a portion of its capital, which was over 27 percent in 2002, to fund its lending. An internal research project in 2001 revealed that credit union members were not aware of the range of services and products the credit union offered. Therefore, staff now receive extensive product training and are subject to evaluations based on performance standards or goals. Further, staff employed in lending and customer services receive incentive-based compensation related to the number of products or services they sell. This cross selling program was based on a product evaluation process the credit union underwent from December 2002 to March 2003. To improve credit union efficiency, management calculated the cost of each of its financial services and loans. As a result of the study, Trustar FCU management was able to more accurately price its products and develop a cross selling incentive program most beneficial to the credit union. However, Trustar FCU’s basic share and draft accounts are free.

58
Trustar FCU staff has extensive relationships with local businesses. Although it no longer has select employer group (SEG) members, it does maintain special relationships with local employers, including loan promotions and new employee orientations. Local employers appreciate lowering their payroll costs by offering direct deposit of payroll through the credit union. In addition, Trustar FCU staff volunteer on community boards and committees and the credit union supports scholarship and other programs. Trustar FCU has received local awards, including a business of the year award from the International Falls Chamber of Commerce. An insurance agency was added to the credit union in October 2001. Members-Plus LLC, a limited liability credit union service organization (CUSO), offers automobile, home, life, health, and business insurance products of 18 insurance companies. Members-Plus was established so that the credit union could serve as the community’s ‘one stop shop’ for financial services and to facilitate the sale of investment products. Members-Plus LLC has produced strong financial performance and its income subsidizes the cost of providing credit union products and services with slender profit margins.
Trustar FCU Financial Trends
Table 18 is a summary of Trustar FCU’s financial trends. The credit union had over $54 million in assets in 2002, an increase of 158.1 percent from 1992 (see Table 18). During this period of time, the membership of the credit union grew by 86.8 percent. The credit union has a very high capital ratio of over 27 percent, which has supported the credit union’s growth and its extensive lending.
Table 18 Trustar FCU Financial Trends
1992 and 2002
1992
2002
Percent Change
Assets $24,865,142 $64,169,026 158.97% Percent Net Capital 32.97% 27.56% -5.41% Secondary Capital - - - Total Shares and Deposits $16,589,483 $46,327,616 179.26% Number of Share/Deposit Accounts 7,728 16,110 108.46% Mean Balance of Share/Deposit Accounts $2,147 $2,876 33.96% Amount of Non-Member Deposits - - - Percent Non-Member Deposits - - - Dividends 4.11% 2.06% -2.05% Operating Expense Ratio 40% 76% 35.31% Loan to Share Ratio 98.14% 101.42% 3.28% Number of Loans 2,058 5,296 157.34% Total Amount of Loans $16,281,259 $46,987,597 188.60% Mean Amount of Loan to Borrowers $7,911 $8,872 12.15% Percent Delinquent Loans 3.22% 1.87% -1.35% Percent of Loan Charge Offs 0.16% 0.29% 0.13% Percent Member Business Loans - - - Mean Amount of Member Business Loans to Borrowers
- - -

59
Total Number of Members 4,670 8,726 86.85% Ratio of Members to CU Employees 667:1 252:1 -62.25%
Source: NCUA 2002
The operating expense ratio of the credit union is relatively high, at 75.6 percent, compared to 53.0 percent of all LICUs in 2002. This is due primarily to staff expenses. The credit union has 252 members per staff, compared to 415 for all LICUs. Staffing and other operating expenses increased due to the recent four county expansion. Trustar FCU management projects that operating expense ratio will remain relatively high until the credit union reaches $125 million in assets and there are greater economies of scale. The credit union does not have any non-member deposits or secondary capital investments.
The gross income of the credit union was $4.9 million in 2002, of which 83.5 percent was interest income. Trustar FCU’s fee income was approximately $700,000, most of which are overdraft fees and fees for late loan payments and secondary market loan originations. Trustar FCU also earns considerable income from foreign ATM transaction fees during the tourist season. The credit union has a total of six ATMs, several of which are located off-site at a supermarket, a chain restaurant, and a gas station.
Trustar FCU Financial Services
The credit union offers standard deposit products, and direct deposit and payroll deductions can be arranged. The basic share and draft accounts are free and there is no credit check for the share account. Draft account customers are subject to a credit check and a Chex Systems review, although credit union managers maintain that less than 5 percent of the applicants for draft accounts are declined. Minnesota law prohibits a financial institution from opening an account if the applicant has experienced a closed account within the previous 12 months for non-sufficient funds activity. This is the major reason that draft account applicants are declined. The credit union enjoys a very high market penetration with its basic account products. The draft account penetration is over 50 percent.
Table 19 is an itemization of Trustar FCU’s account products. Regular share accounts comprise the majority of deposits at the credit union, followed by its share certificates and share drafts. The average balance of a share account is about $2,000 and the average draft account has a balance of almost $1,600. The highest account balance is share certificates followed by IRA and Keogh accounts.
Table 19
Trustar FCU Financial Service Accounts 2002
Total Deposits
Number of
Accounts
Percent of Total Deposits
Average Deposit
Regular Shares $20,916,440 10,027 45.1% $2,086 Share Certificates $15,288,939 1,112 33.0% $13,749 Share Drafts $7,050,083 4,431 15.2% $1,591 IRA/KEOGH Accounts $3,004,248 282 6.5% $10,653 Total Other Shares $67,907 258 0.1% $263
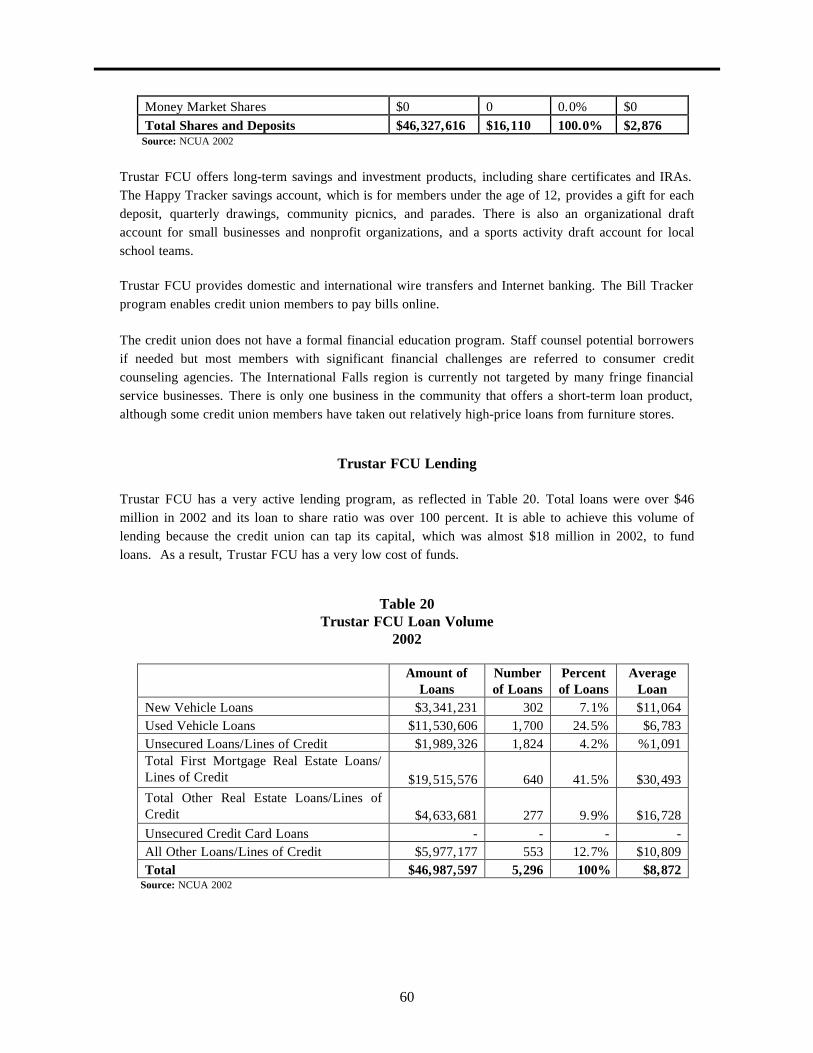
60
Money Market Shares $0 0 0.0% $0 Total Shares and Deposits $46,327,616 $16,110 100.0% $2,876
Source: NCUA 2002
Trustar FCU offers long-term savings and investment products, including share certificates and IRAs. The Happy Tracker savings account, which is for members under the age of 12, provides a gift for each deposit, quarterly drawings, community picnics, and parades. There is also an organizational draft account for small businesses and nonprofit organizations, and a sports activity draft account for local school teams. Trustar FCU provides domestic and international wire transfers and Internet banking. The Bill Tracker program enables credit union members to pay bills online.
The credit union does not have a formal financial education program. Staff counsel potential borrowers if needed but most members with significant financial challenges are referred to consumer credit counseling agencies. The International Falls region is currently not targeted by many fringe financial service businesses. There is only one business in the community that offers a short-term loan product, although some credit union members have taken out relatively high-price loans from furniture stores.
Trustar FCU Lending
Trustar FCU has a very active lending program, as reflected in Table 20. Total loans were over $46 million in 2002 and its loan to share ratio was over 100 percent. It is able to achieve this volume of lending because the credit union can tap its capital, which was almost $18 million in 2002, to fund loans. As a result, Trustar FCU has a very low cost of funds.
Table 20
Trustar FCU Loan Volume 2002
Amount of
Loans Number of Loans
Percent of Loans
Average Loan
New Vehicle Loans $3,341,231 302 7.1% $11,064 Used Vehicle Loans $11,530,606 1,700 24.5% $6,783 Unsecured Loans/Lines of Credit $1,989,326 1,824 4.2% %1,091 Total First Mortgage Real Estate Loans/ Lines of Credit
$19,515,576
640
41.5%
$30,493
Total Other Real Estate Loans/Lines of Credit
$4,633,681
277
9.9%
$16,728
Unsecured Credit Card Loans - - - - All Other Loans/Lines of Credit $5,977,177 553 12.7% $10,809 Total $46,987,597 5,296 100% $8,872
Source: NCUA 2002
61
Unlike many other credit unions of its size, Trustar FCU has a large real estate loan portfolio. In 2002, it had over $19 million in first mortgage real estate loans and lines of credit and $4 million in other real estate loans or lines of credit (primarily second mortgages). The credit union has developed an interest rate safe guard for real estate loans. It has instituted a ‘call option’ so that every three to five years the interest rate of Trustar FCU’s loans can be renegotiated to reflect the current interest rate environment. In addition, the credit union does not maintain or portfolio its loans but sells them on the secondary market to CUNA Mutual. The credit union’s loan delinquency was almost 2 percent in 2002, slightly higher than the average 1.7 percent delinquencies for LICUs. The slightly higher rate may be due to the Trustar FCU’s real estate lending—one delinquency can make a substantial impact on loan losses. Credit union management is concerned that if current economic trends persist that they may experience more delinquencies and charge offs. From January to June 2003, 18 credit union members filed bankruptcy. Therefore, a full-time loan collections staff person was recently hired. The credit union has engaged in various lending promotions and partnerships. In 1999, it began a three- year promotion in partnership with Boise Cascade, which was interested in improving the computer literacy of its staff. The credit union offered no-interest loans of up to $3,000 for a two-year term to Boise Cascade employees to purchase personal computers. The loan payments were made by payroll deduction and Boise Cascade made interest payments in one lump sum when the loans were closed. The credit union has offered open ended loans for over 20 years. An open ended loan allows a borrower to take out multiple loans as sub-accounts to the original loan. A master loan application is taken so the member does not have to provide the same information for each loan. This procedure reduces administrative costs because new documents do not have to be executed, shortens the approval period, and facilitates cross selling. The credit union does not engage in significant level of business lending due to NCUA regulations and lack of business lending experience. However, Trustar FCU does make loans for business purposes that are underwritten as consumer or home refinance loans, including a loan to an independent electrical contractor for the purchase of a service vehicle and a loan to a small rancher for $50,000 for a horse trailer. Credit union management plans to increase member business lending due to a recent NCUA decision to relax business lending regulations and an increase in the number of business members. They are currently exploring the possibility of taking a share of participation business loans through a credit union service organization or in partnership with the Small Business Administration (SBA). The credit union began risked-based pricing on loans in April 2000. The interest rate on a five-year consumer loan can range from 6 percent for borrowers with A-rated credit to 18 percent to E credit borrowers. This policy does offer some flexibility. If the borrower is able to generate a larger downpayment, the credit union can offer a lower interest rate. Further, the interest rate can be renegotiated if a borrower improves their credit rating during the term of the loan. Trustar FCU management contends that members like this policy for several reasons. First, people with better credit ratings appreciate having lower rates. Second, those with poor credit scores are more concerned with the size of the payment than the interest rate--their most important objective is to negotiate an affordable payment. Third, the credit union emphasizes that they are taking a risk and that a bank would, in all likelihood, not make the loan at all.
62
Conclusion
Trustar FCU is a major financial player in the International Falls region—over 50 percent of the consumers in the region have draft accounts with the credit union. The credit union has established itself as a local leader as the first financial institution to provide electronic and Internet services and offer Internet access services. Trustar FCU provides informal financial education to its members and has established an account for youth to promote lifelong savings habits. The credit union also makes affordable loans to local businesses. Trustar FCU management has developed several strategies to enhance the credit union’s financial sustainability. First, the credit union utilizes an open-ended loan process that allows members to take out multiple loans with a minimum of loan documentation. Second, it has identified high margin products and services for its staff cross selling incentives. Third, Trustar FCU has established an ancillary financial services business that sells insurance and also has the potential to market investment products. Fourth, the credit union has engaged in a loan partnerships with a local firm that paid the interest expenses on computer loans for its employees.

63

64
Chapter V
Financial Services for People of Modest Means: Lessons from LICUs
Due to their focus on serving people of modest means, LICUs can provide some lessons to mainstream credit unions on effectively serving lower-income people. These lessons include the importance of providing financial education and counseling services; establishing partnerships with other community organizations or businesses; generating financial support; developing financially sustainable initiatives; and establishing effective marketing strategies. (Additional policy recommendations to improve mainstream credit union services to people of modest means are included in Chapter II.) Financial Education and Counseling The bedrock of asset development programs is financial literacy. Credit unions, by employing formal and informal training and counseling, can teach members how to manage financial products effectively, recognize and avoid high cost services, repair credit, and develop savings habits. El Paso Employees FCU, Greater Abbeville FCU, and Trustar FCU tellers and loan staff regularly provide counseling to credit union members in the teachable moment—when a member seeks to cash a check from a predatory lender or is rejected for a loan. El Paso Employees FCU offers formal financial literacy training and refers members with long-term training needs to local consumer credit counseling agencies. Further, home ownership counseling is offered through its partnership with the El Paso Affordable Housing LLC. Helping youth develop savings habits is a crucial role for credit unions. To promote youth involvement in the credit union, Trustar FCU offers the Happy Tracker savings account. The account holders are eligible for several savings incentives, including a gift for each deposit and a quarterly raffle. Partnerships Credit unions can maximize their effectiveness and leverage resources by forming partnerships with other financial institutions, credit union associations, community or consumer organizations, and local businesses to increase lending, improve marketing, and promote credit union membership. El Paso Employees FCU partnered with seven area credit unions to establish a comprehensive affordable home ownership program. The partnership allows the credit unions to share expenses and minimize the investment needed to build the program. It is unlikely that any of the credit unions would have been able to establish such programs in a cost-effective manner on their own. State credit union leagues can play a role in supporting efforts to penetrate underserved markets. The Texas Credit Union League encouraged credit unions in its state to obtain a LICU designation, which enables them to raise funds through non-member deposits and secondary capital investments. The Texas Credit Union League also convened a meeting of credit unions to discuss the development of an affordable housing partnership, resulting in the establishment of the El Paso Credit Union Affordable Housing LLC.
65
Employers are also an important resource for credit unions. El Paso Employees FCU, Greater Abbeville FCU, and Trustar FCU market and provide ‘bank at work’ services to the new staff of area businesses. These partnerships enable the credit union to grow its membership, minimize the firm’s payroll costs, and are a tremendous convenience to employees. Business partnerships can also improve loan revenues. Trustar FCU leveraged its relationship with a local business to develop a loan program for its employees. El Paso Employees FCU has increased its loan portfolio and membership by financing the loans of customers of area car dealers. However, credit unions may wish to enter into such arrangements cautiously. A partnership with a disreputable business could result in significant loan losses and a poor reputation for the credit union. Financial Support Although they are not permitted to accept non-member deposits or secondary capital investments, there are several sources of financial support for mainstream credit unions with programs for lower-income consumers. (Appendix B includes a list of national resources.) Government agencies can be a good resource for operations and project funding that benefit lower-income consumers. The El Paso Credit Union Affordable Housing LLC has raised significant funding from the National Credit Union Foundation, Fannie Mae, the U.S. Department of Housing and Urban Development (HUD), and the Housing Authority of the City of El Paso to implement its affordable housing program. The cost of the El Paso Credit Union Affordable Housing LLC’s financial literacy training was underwritten by the U.S. Treasury’s First Accounts Program as well as other national intermediaries (see Appendix A). Sustainability Cross selling credit union products is a key way to build financial sustainability. Trustar FCU has an extensive cross selling program. Employees receive incentives to sell higher revenue products identified by the financial analysis of the credit union’s products. The credit union also developed an insurance agency to increase revenues. Adjusting loan underwriting procedures can cut credit union expenses and increase loan revenue. Trustar FCU’s open ended loan enables the credit union to make multiple loans with minimal paperwork. Encouraging members to use electronic technology can also reduce credit union costs. Greater Abbeville FCU tellers encourage members to use direct deposit and to obtain an ATM card to reduce the number of teller transactions. Employers may be willing to underwrite loan programs. Boise Cascade’s interest rate grant to Trustar FCU for computer loans to their employees allowed the credit union to collect the interest from the loans in advance. Know Your Customer

66
The programs of the LICUs profiled in this report work because they are adapted to the needs of their membership. A ‘one size fits all’ approach may not address the lending and service needs of diverse communities. El Paso Employees FCU recognizes that although its members are generally sound credit risks, they are slow payers and often have higher debt to income ratios than consumers in other markets. Therefore, the credit union has also adapted its underwriting standards and employed a vigilant collections staff to make calls to members when loans are overdue. In addition, El Paso Employees FCU’s branch expansion plans reflect changing demographic shifts in population. Last, the credit union is aware that the local market is very price conscious. Therefore, El Paso Employees FCU’s basic share and draft accounts have no service fees and the minimum deposit for a share account is only $15. Further, there is no minimum balance requirement for the draft account. To learn more about its customers, Trustar FCU conducted an internal audit that demonstrated the need to communicate more effectively with members regarding the range of services and loans the credit union offers. Trustar FCU is also an early adopter to new financial services technology in its market. It was the first institution in the area to install ATMs and offer Internet banking. It also took the lead by providing the region’s first local Internet access service. Greater Abbeville FCU identified a need for a local community resource center. It therefore has become a major source of information on community services and opportunities, and also provides other community services, such as tickets to local events. Affordable check cashing services are also limited in the region. Therefore, regulations permitting, Greater Abbeville FCU will expand check cashing for nonmembers. The credit union’s credit and debt repair program has enabled several local residents to improve their credit ratings and its car loans are essential in a community with no public transportation system. Greater Abbeville FCU also serves a niche as an alternative to high priced consumer loans by providing short-term lines of credit and consumer loans, which are generally not available at local banks.
Marketing Community activism, such as sponsoring local events and volunteering with social service and business agencies, establishes credit unions as a community leader, aids the development of relationships with local employers, and helps promote credit union membership. The credit unions also engage in traditional promotional and advertising strategies. Greater Abbeville FCU has an extensive local marketing campaign, including placing advertisements on local radio stations and billboards. El Paso Employees FCU uses marketing materials, such as mailings and advertisements in local publications, for special product promotions. The credit union is then able to determine the efficacy of alternative promotion strategies and outlets by assessing the sales of the products. Conclusion The LICUs selected for this report demonstrate the capacity of credit unions to serve lower-income consumers and communities. El Paso Employees FCU, Greater Abbeville FCU and Trustar FCU also provide useful information on program development and sustainability. Further research and documentation of LICUs and mainstream credit unions should be conducted to enable the industry to

67
fulfill its mission of serving people of modest means. In addition, LICUs membership structure must be regularly monitored to assess whether they remain eligible for LICU designations.
Appendix A

68
Glossary of Terms Assets: anything of commercial value owned by a credit union. Typically includes cash, outstanding loans (minus allowance for loan losses), real estate, furniture and fixtures, and equipment. Common Bond: a factor that defines or delineates a group of people, such as employment or church membership. Community Credit Union: a credit union with a field of membership (FOM) that consists of people who live, work, attend school, or worship in a well defined community. Delinquent Loans: loans that are over two months overdue. The comparative measure of this statistic is the loan delinquency rate or percentage of delinquent loans, which is the number of delinquent loans divided by the total number of loans. Field of Membership (FOM): defines people allowed to join a credit union. Legacy LICU: LICUs established by 1990 and still active in 2002. Low-Income Credit Union (LICU): LICU is a designation given to credit unions by the NCUA. To receive the designation, at least half of a credit union’s members must earn less that 80 percent of the median household income of the community. Loan to Share Ratio: the gross amount of loans divided by the amount of shares in a credit union, this ratio measures the extent to which a credit union has ‘turned-around’ deposits into loans to members. A common indicator of profit potential, the higher the loan to share ratio, the more profitable the credit union. Mainstream Credit Unions: describes credit unions that do not have a LICU designation. For the purpose of this study, LICUs are compared to all federally insured credit unions. Member Business Loans (MBL): loans that are made for commercial, corporate, business investments, venture, or agricultural purposes. Does not include loans for less than $50,000 or which are secured by residential real estate, credit union shares, or a governmental guarantee. Credit unions wishing to engage in MBL must establish a loan policy that addresses security and collateral requirements, among other issues. Multiple Common Bond Credit Union: a credit union FOM comprised of several groups of people with a common bond. For instance, a FOM can include members of several churches and employees of a local business. Net Capital: a measure on total investments (minus member deposits) in a credit union. It includes regular reserves, secondary net capital, accumulated unrealized gains or losses, other reserves, undivided earnings, and net income. The Net Capital to Assets Ratio divides net capital by total assets. Non-Member Deposits: unlike other credit unions, LICUs are able to accept deposits from non-members. These deposits are insured like members’ deposits.

69
Operating Expense Ratio: the percent of operating, or non-interest expenses, to gross income. Operating expenses include salaries, rent, and other overhead costs. Credit unions strive to control operating expenses so they can maximize interest expenses, which include dividends and interest on shares for members. Secondary Capital Investments: LICUs are allowed to increase their capital base and cover potential operating losses by accepting investments from ‘non-natural’ persons. These investments are required by NCUA to be uninsured, have a maturity of at least five years, and be subordinated to all other claims on the credit union. Select Employee Groups (SEGs): credit unions are allowed to add to their fields of membership groups with a common bond, including employee groups. Shares: all members of credit unions are in effect, owners of the credit union. Their deposits therefore represent shares. Credit unions offer regular share accounts (savings accounts); share draft accounts (checking accounts); and share certificate (certificates of deposit) accounts. Single Common Bond Credit Union: a credit union with a FOM that encompass of one group with a common bond. Types of Charter: credit unions can be chartered and regulated by federal or state government. However, most state chartered credit unions receive some level of federal regulations because most of their members’ deposits are insured by the National Credit Union Share Insurance Fund. Underserved Community: a community that meets at least one criteria of economic distress as defined by the Community Development Banking and Financial Institutions Act of 1994. Criteria include percentage of people living in poverty, median income, and unemployment.
70
Appendix B
Resources for Building Financial Services for People of Modest Means
America Saves Consumer Federation of America (202) 387-6121 www.americasaves.org
America Saves is a national coalition convened by the Consumer Federation of America to help families save and build wealth utilizing local savings campaigns.
Coalition of Community Development Financial Institutions 1601 N. Kent Street, Suite 803 Arlington, VA 22209 (703) 894-0475 www.cdfi.org
The CDFI Coalition coordinates industry wide initiatives to increase the availability of capital, credit, and financial services to CDFIs in low-income communities. It pro-motes public policy related to CDFIs, monitors the activities of the CDFI Fund, and sponsors a bi-annual national policy conference.
Community Development Financial Institutions Fund (CDFI Fund) 601 13th Street, N.W., Suite 200 South Washington, DC 20005 (202) 622-8662 www.treas.gov/cdfi
Administered by the U.S. Treasury Department, the CDFI Fund provides seed and expansion capital to community-based banks, credit unions, loan funds and micro-lenders. Also administers the New Markets Tax Credit (NMTC) Program which provides tax credits to investors in community development projects.
Corporation for Enterprise Development (CFED) 777 N. Capitol Street, N.E., Suite 800 Washington, DC 20002 (202) 408-9788 www.cfed.org
CFED promotes asset-building and economic op-portunity strategies, primarily in low-income and dis-tresssed communities. It coordinates several savings programs, including Individual Development Accounts (IDAs).
Department of the Treasury www.treas.gov (202) 622-1260
The Treasury provides resources and materials on electronic funds transfer (EFT), direct deposit, and many other banking and consumer issues.
Federal Deposit Insurance Corporation (FDIC) MoneySmart program (800) 934-3342 www.fdic.gov
FDIC has a host of information on financial literacy and basic banking. FDIC also runs the MoneySmart program, which works with community groups, financial institutions, and governmental bodies to implement financial literacy programs and bilingual curricula.
Fannie Mae (202) 752-7000 www.fanniemae.com
Fannie Mae is one of the two major players in the secondary mortgage market. They provide materials and resources on homebuyer education and consumer educa-tion.
National Community Capital Association 620 Chestnut Street, Suite 572 Philadelphia, PA 19106 (215) 923-4754 www.communitycapital.org
A national membership organization of CDFIs, NCCA provides financing, training, consulting, and advocacy. It operates several CDFI finance and investment products, operates a CDFI Start-up Service and other training, and help CDFIs develop and implement new programs.
National Community Investment Fund (NCIF) 7054 South Jeffery Boulevard Chicago, IL 60649 (773) 420-4910 www.ncif.org
NCIF’s mission is to increase the number and capacity of domestic, insured, depository institutions that provide loans, services and investments in lower-income com-munities. It provides loans, investments, deposits, and engages in research projects documenting best practices.

71
National Credit Union Foundation 601 Pennsylvania Ave., N.W., Suite 600 S. Bldg. Washington, DC 20004-2601 (800) 356-9655 www.ncuf.org
Provides grants to credit unions for special projects, operations or lending programs. Areas of interest include financial literacy, minority outreach, and cooperative development.
National Congress of Community Economic Development (NCCED) 1030 15th Street, N.W., Suite 325 Washington, D.C. 20005 (877) 44-NCCED www.ncced.org
An association of community organizations that engage in small business, affordable housing, and community development. NCCED conducts public policy research, provides technical assistance, and disseminates information through its newsletters publications, trainings, and conferences.
National Endowment for Financial Education (NEFE) 5299 DTC Boulevard, Suite 1300 Greenwood Village, CO 80111 (303) 741-6333 www.nefe.org
NEFE and the Cooperative Extension Service created the High School Financial Planning Program (HSFPP) to facilitate financial education in high schools. NEFE also has an online clearinghouse of financial literacy materials.
National Federation of Community Development Credit Unions (NFCDCU) 120 Wall Street, 10th Floor New York, New York 10005 (212) 809-1850 www.natfed.org
The Federation is a coalition of 225 CDCUs dedicated to revitalizing low-income communities. It provides training, investments, grants, technical assistance, and advocates on the behalf of CDCUs.
National Credit Union Administration Office of Credit Union Development 1775 Duke Street Alexandria, VA 22314 (703)518-6610 www.ncua.gov
Provides assistance to small and low-income credit unions, including a revolving loan fund, technical assistance, and a College Student Internship Program.
Neighborhood Reinvestment Corporation (NRC) 1325 G Street, N.W., Suite 800 Washington, DC 20005-3100 (202) 220-2300 www.nw.org
A national network of local non-profit organizations that work to revitalize older, distressed communities. Credit Union Partnerships With NeighborWorks Organizations: Proven Models for Success is a NRC report with eight case studies of homeownership partnerships between credit and NeighborWorks organizations.
Woodstock Institute 407 S. Dearborn, Suite 550 Chicago, IL 60605 (312) 427-8070 www.woodstockinst.org
Has a long history of credit union research and technical assistance, including documenting best practices of CDCUs and assessing whether mainstream credit unions serve people of modest means. The Institute has also documented best practices of financial services and asset development programs for lower-income consumers.

72
References
"Banks Won the Battle With Big Credit Unions." StandardNET. 16 March, 2003. "Credit Union Membership Access Act." H.R.1151 (1998): Section 203. Limitation on Member
Business Loans. 1998. "Lacking Merit, NCRC Looks to Congress on CAP." 2003. Agosta, Veronica. "Mergers by Banks Prove a Boon to Credit Unions." American Banker. 6 July,
2000. American Bankers Association. "National Credit Union Administration Field of Membership Rule."
January 2000. ________. The Changing Face of Credit Unions. N.D. Arndorfer, James B. "Five Groups' Leaders Ask the Regulator to Put Some Breaks on Competition."
American Banker. 11 November, 1995. Berenbaum, David, "Press Release: NCRC Challenges Repeal of Regulation Aimed at Helping Low-
Income and Minority Communities Gain Access to Credit. “National Community Reinvestment Coalition. 22 January, 2002.
Citi-Guide. "Brief History of Juarez." 2000. [http://www.citi-guide.com/mexico/m-juarez-history.asp].
1 July, 2003. Community Scholars. Furthering the Community Conversation: An Overview of Lending Issues in El
Paso, Texas. 2000. Cook, Sarah Snell. "Credit Unions Fend Off DOJ Attempt to Block Pre-Merger Exemption in Reg
Relief." Credit Union Times 14, no. 30. 23 July, 2003. Credit Union National Association. "2003 Serving Members of Modest Means Survey Report." 2003. ________, "Why Credit Unions Are Tax Exempt." 2003. ________, "Proactive Bill Will Improve CU Regulation." 2003. ________, "CUNA Strategic Working Document: CU Taxation." N.D. Duran, Nicole, "CRA-Like Credit Union Rule May Be Revoked." 2001.
73
El Paso Credit Union Affordable Housing, LLC. Monthly Board Status Report. 2003. ________. Credit Union Service Organization. N.D. El Paso Times. "Population and Housing Profile: El Paso County, Texas." August 2001. General Accounting Office. Changes in Credit Union Industry. Washington DC. 2003. Gentile, Paul. "Credit Union Boards Need to Look Long-term to Keep Talented Execs Locked In."
Credit Union Times 14, no. 30. 23 July, 2003. ________. "Credit Union Groups Strategize to Combat IRS' Renewed Interest in the Unrelated
Business Income Tax." Credit Union Times 14, no. 30. 23 July, 2003. International Falls Area Chamber of Commerce. "Area Facts." [http://www.intlfalls.org/facts.htm]. 28
July, 2003. Isbister, John. Thin Cats: The Community Development Credit Union Movement in the United States.
Davis, CA: University of California Center for Cooperatives. 1994. Jacob, Katy, Malcolm Bush, and Dan Immergluck. "Rhetoric and Reality: An Analysis of Mainstream
Credit Unions’ Record of Serving Low-Income People." February 2002. Johnson, JoAnn. National Federal Credit Union Annual Meeting. 25 July, 2003. Joint Center for Housing Studies at Harvard University. The 25th Anniversary of the Community
Reinvestment Act: Access to Capital in an Evolving Financial Services System. Harvard University. 2002.
Kline, Alan. "Washington State Banks Join Forces to Lobby for Limits on Credit Unions." American
Banker. January 1998. Matz, Deborah. "Speech to Credit Union Affiliates of New Jersey 68th Annual Meeting." 23
November, 2002. Mica, Dan, Credit Union National Association, to Members of the House Financial Services
Committee. 28 April, 2003. Mitchell, Lesley. "2 Utah CUs Jump to Fed Charters." 2003. Morrison, David. "Credit Unions Step into Underserved Areas Vacated by Banks." Credit Union
Times 14, no. 30. 23 July, 2003. National Community Reinvestment Corporation. How Is CRA Doing? NCRC. 2000. National Credit Union Administration. The Federal Credit Union Act. October 1998. ________. Federal Credit Union Bylaws. NCUA. 1999.
74
National Credit Union Administration. "Part 708a of Rules and Regulations." November 2001. ________. Is a Credit Union Right for Me? Alexandria, VA. June 2002. National Credit Union Administration. 2002 Statistics for Federally Insured Credit Unions. 2003. National Credit Union Administration. "Community Conversion Study." 2003. ________. "Chartering and Field of Membership Manual." March 2003. National Credit Union Administration, "Board Issues Proposed Member Business Lending Rule."
2003. National Credit Union Administration. "Organization and Operations of Federal Credit Unions 2 CFR
Part 701." [http://www.ncua.gov/ref/IRPS/IRPS02-2.html]. 20 August, 2003. National Credit Union Administration. “Revisions to Member Business Lending Regulation Adopted."
September 2003. National Credit Union Administration. 2002 Midyear Statistics for Federally Insured Credit Unions.
NCUA. N.D. National Credit Union Administration. "Community Charter Approvals." N.D. National Credit Union Administration Office of Examination and Insurance. Federal Credit Union
Handbook. NCUA. 1999. National Credit Union Administration Office of the Chairman. "Dollar Says NCUA Will Review
Regulations on Disclosures For Credit Unions Converting to Thrifts." August 2003. Nii, Jennifer K., "Credit Union Tax Proposal Called Dangerous Step." 2003. Office of Colonia Initiatives at the Texas Department of Housing and Community Affairs. "Office of
Colonia Initiatives." [http://www.tdhca.state.tx.us/au_colonias.htm]. 2003. N.D. Office of Thrift Supervision. "Director's Orders 1998-2003." [www.ots.treas.gov]. 3 December, 2003. Pacenaz, Matt, "Shaky Credit: Between a Recession and Regulators, Can Small Credit Unions
Survive?" 2002. Reosti, John, "ABA to Sue NCUA over Expansion of Credit Union." 2003. Rubenstein, Jim. "ABA, Utah Banks Bring FOM Suit in Salt Lake Court." Credit Union Times 14,
No. 30. 23 July, 2003. Seiberg, Jaret. "Banks Win Supreme Court Victory Over Credit Unions." American Banker. 26
February, 1998. Seidman, Ellen, to Marva E. Williams. 1 December, 2003.
75
Small Business Administration, "SBA Expands Opportunities for Small Business through Credit
Unions." 14 February, 2003. Storey, Charlene Komar, "At the Crossroads?" 2003. United States Department of the Treasury. 2001. United States Department of the Treasury. "Summary of May 2002 Grant Awards." January 2003.
[http://www.treas.gov/firstaccounts/grantawards.html]. ________. January 2001.

Woodstock Institute Woodstock Institute, a Chicago nonprofit incorporated in 1973, works locally and nationally to promote sound community reinvestment and economic development in lower-income and minority communities. It collaborates with community organizations, financial institutions, foundations, government agencies, and others to promote its goals. The Institute engages in applied research, policy analysis, technical assistance, public education, and program design and evaluation. Its areas of expertise include: CRA and fair lending policies, financial and insurance services, small business lending, community development financial institutions, and economic development strategies. Malcolm Bush Marva Williams President Senior Vice President
Patricia Woods-Hessing Administrative Director