financial services practice - global management consulting
TRANSCRIPT

Financial Services Practice
Navigating the ShiftingTerrain of North AmericanAsset Management

Cover image: L’espoir Du Volubius by Alexander Calder
© 2015 Calder Foundation, New York / Artists Rights Society (ARS), New York

Introduction
Strong Performance and a PositiveOutlook in North American Asset
Five Critical Challenges AssetManagers Must Address
Imperatives for Asset Managers
Navigating the ShiftingTerrain of North AmericanAsset Management
Introduction
Strong Performance and a Positive Outlook in North American Asset Management
Five Critical Challenges Asset Managers Must Address
Imperatives for Asset Managers
2
6
13
28

2 Navigating the Shifting Terrain of North American Asset Management
The North American asset management industry is in a robust
state of health, as measured by assets under management,
revenues and profits. However, the route forward for
individual firms is less certain than it might appear based on
the positive momentum of the past five years. Fundamental
shifts in client demand, product innovation, distribution,
technology and regulation are reshaping the terrain of the
industry and will require asset managers to rethink their
traditional operating models. The industry is at an inflection
point on a number of these dimensions, and the next five
years represent a once-in-a-generation opportunity for North
American asset management firms to position themselves for
lasting success.
Assets under management (AUM) for North American firms
reached an all-time high of $31 trillion in 2014, with revenues
Introduction
Introduction

3
and profits growing at a double-digit clip
to $111 billion and $37 billion respectively.
Most impressively, the industry’s operat-
ing margins reached 33 percent, an 11-
percentage-point improvement from the
lows of 2009. These gains appear to have
been preserved even into the volatile mar-
kets of 2015, and the capital markets
continue to look favorably on the asset
management industry, with valuations and
multiples pegged at a meaningful pre-
mium to other financial services sectors.
The positive momentum of the industry
has been propelled by a set of powerful
global cyclical and secular trends. A
multi-year boom in asset prices has
served as a rising tide for the entire in-
dustry, but meaningful net new flows
have resulted from a structural shift to
managed assets (away from deposits
and direct holdings of stocks and bonds),
the rise of new pools of capital (e.g., de-
fined contribution [DC] pensions, insur-
ance general accounts, high-net-worth
investors and sovereign wealth funds), a
shift in portfolio construction practices
toward “bar-belled” portfolios that bal-
ance conservative and high-risk invest-
ments, and opportunities created by
increased regulations on banks.
This benign, growth-friendly environment
has not benefited all managers equally.
There will always be leaders and laggards
in any industry, but the performance
gap—measured in net flows, revenue
growth and operating margins—between
top- and bottom-performing firms has
been significant in North America, which
raises the question of what the leaders
are doing differently. The most distin-
guishing factor common to winning firms
is their ability to identify and compete in
the “sweet spots” at the intersection of
industry tailwinds and their intrinsic
strengths as an organization.
This report lays out five key questions that
leadership teams will need to address:
1. How should asset managers re-
spond to the passive investments
revolution? The passive revolution is
proceeding apace, with passive prod-
ucts accounting for over 100 percent
of industry net flows since 2009. A
closer look at this trend, however, re-
veals that while the surge in passives
is real, rumors of the demise of active
management have been somewhat ex-
aggerated. The full story includes the
parallel development of more special-
ized active strategies such as alterna-
tives and multi-asset solutions, which
have attracted $1.6 trillion of flows
since 2009. Perhaps the most salient
implication of the surge of passives
has been an increased demand for
transparency into the true returns and
value add of strategies. The passive
revolution continues to make headway,
however, as product innovations such
as smart beta take advantage of pas-
sive building blocks to deliver sophisti-
cated outcomes. Firms need to decide
where to compete and how to win
across the active-passive spectrum
and redesign their investment
processes to deliver superior results.
Active firms, in particular, will need to
develop a sharper and more nuanced
Navigating the Shifting Terrain of North American Asset Management

4
framing of their value propositions that
encompasses, for example, not only
their profile of returns, but their ap-
proach to managing risk.
2. What are the best approaches to
serving a fragmenting client base
through an expanding array of dis-
tribution channels? The distribution
landscape continues to diversify from
the traditional platforms to include an
array of smaller firms (e.g., registered
investment advisers [RIAs]) as well as
more direct channels, including a new
set of technology-enabled models. The
fragmentation of the client base has
been exacerbated by managers seek-
ing a foothold in high-potential emerg-
ing markets. Distribution tailored to
deliver the uniformity and scale re-
quired by traditional platforms will
come under increasing pressure. McK-
insey believes managers should be
thinking ahead to “Distribution 2.0”—a
set of new data- and technology-en-
hanced sales models amplified by
force multipliers like powerful branding
and marketing. Firms will also need to
make deliberate choices about where
to focus by geography and segment
and ensure that their distribution ap-
proaches are both scalable and fit for
purpose for the next generation of in-
vestors and intermediaries.
3. How should asset managers drive
innovation with advances in data
and technology? Successful asset
managers have long relied on technol-
ogy for the essential “plumbing” that
connects the investment ecosystem.
But increased availability of data, cou-
pled with quantum leaps in analytic
approaches and processing power,
opens up new possibilities for man-
agers to gain a competitive edge in
their investment management and dis-
tribution processes. For example,
leading firms have already begun min-
ing open source data for investable in-
sights that can be used to deliver
alpha. Leaders are also leveraging
data and technology to improve distri-
bution, by translating data on financial
advisor behavior to precisely target on-
the-ground retail distribution forces.
The biggest hurdle—at least to start—
will be attracting top talent in these
new areas in an era in which competi-
tion for that talent is at an all-time
high, both within and outside the asset
management industry.
4. What are the keys to creating and
sustaining operating leverage? The
rising markets of the past five years
have masked a multitude of cost in-
creases and operational complexities
across almost every functional area in
asset management. As a result, the un-
derlying cost base of the North Ameri-
can industry has risen in tandem with
its revenues, seemingly disproving the
asset management business model’s
promise of operating leverage and leav-
ing the industry’s profitability suscepti-
ble to a market downturn. Asset
managers will need to focus on retool-
ing their operating models for efficiency,
simplicity and scalability to ensure that
the growth that they gain in the coming
years proves to be profitable.
Navigating the Shifting Terrain of North American Asset Management

5
5. How should asset managers deal
with the rising tide of regulation?
Over the past five years, the asset
management industry has remained a
secondary focus for regulators, as at-
tention has fallen disproportionately on
the balance-sheet-dependent financial
institutions that were at the center of
the financial crisis. It would be naïve to
expect this state of affairs to continue
indefinitely, and a wave of regulations,
focusing on fee transparency, product
neutrality, fiduciary standards and even
market stability and fund liquidity, is
gathering on the horizon. Regulation
will invariably be part of the “new nor-
mal.” But history has shown that regu-
lation can be a powerful driver of
innovation and growth (witness the rise
of target-date funds). McKinsey be-
lieves that asset managers will need to
take a proactive approach to regulation
that goes beyond compliance to seek-
ing out opportunities that arise from
regulatory discontinuities. Success will
require more than just increased regula-
tory awareness. Firms will need to
make a holistic shift to a more client-
centric and fiduciary mindset.
While it is difficult to make five-year pre-
dictions for an industry, McKinsey believes
that the forces at work in North American
asset management will change the terms
of success for individual firms. A review of
the leading firms in five years will show
that they made definitive choices about
their position on the passive-active axis
and demonstrated clear value add in their
investment strategies. They will have rein-
vented their distribution models to ensure
scalability in a fragmented landscape, and
used data and technology for competitive
advantage in their core investment and
distribution capabilities. They will have re-
designed and streamlined their operating
models for greater efficiency and scalabil-
ity and made tough choices about where
they can be sustainably profitable, and
where they should scale back. They will
also have made a virtue out of the neces-
sity of new regulations and discovered op-
portunities for growth.
This report draws on McKinsey’s Per-
formance Lens research on asset man-
agement, including the annual McKinsey
Global Asset Management Survey, which
gathers benchmarking data from more
than 300 asset managers—more than
100 from North America, representing
$26 trillion (roughly 75 percent) of AUM—
and the annual Global Growth Cube,
which provides a granular breakdown of
historical and forward-looking AUM, rev-
enue and net flows data for 44 regions
and countries, 9 client segments, 12
asset classes and 5 vehicles.
Navigating the Shifting Terrain of North American Asset Management
A review of the leading firms in fiveyears will show that they made
definitive choices about their positionon the passive-active axis anddemonstrated clear value add in their investment strategies.

formance andPositive OutloNorth Americ
6 Navigating the Shifting Terrain of North American Asset Management
The global asset management industry has been on a
robust trajectory since the beginning of 2009, with assets,
revenues and profitability all at record highs. During this
time, the industry has added $28 trillion in AUM, double the
growth in new assets between 2005 and 2009.
This sustained wave of growth has been propelled largely
by the continued upward momentum of financial markets
and asset prices. Of the $28 trillion in AUM added since the
start of 2009, net new flows contributed $4.5 trillion, or
about 16 percent of asset growth. That said, net flows have
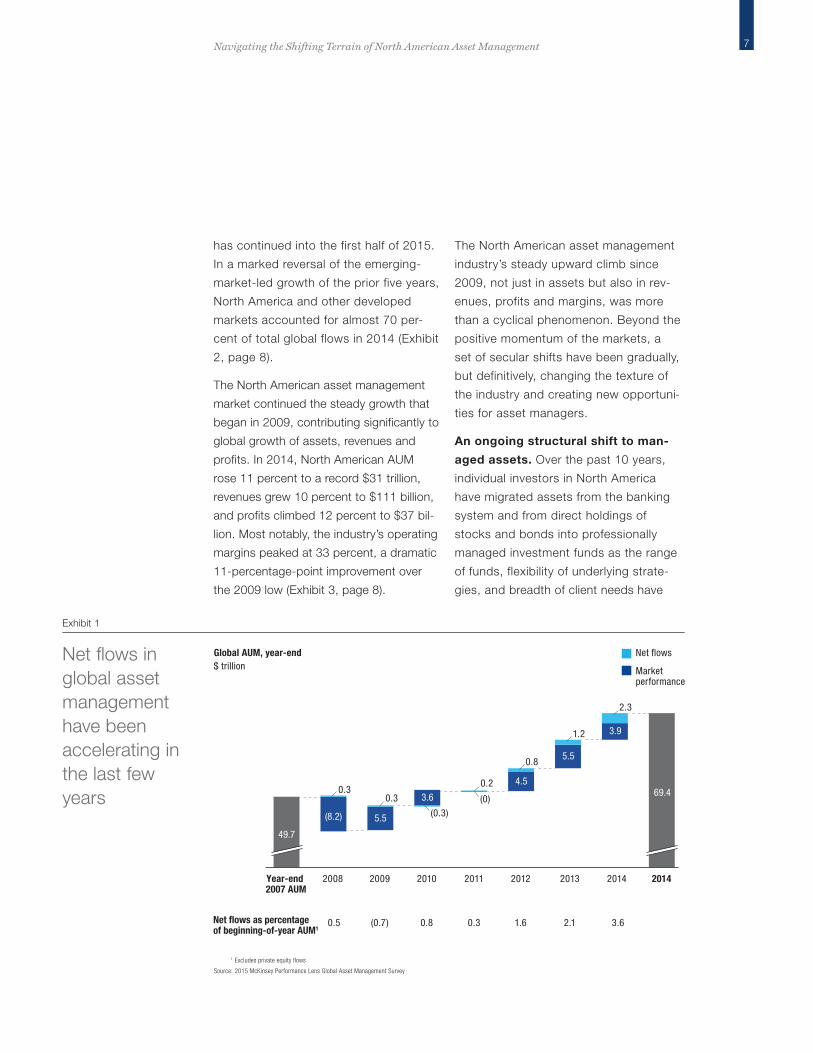
been accelerating over the past few years, with growth
rates of about 3.6 percent in 2014 (Exhibit 1), driven in
large part by retail investors.
There was a strong resurgence of developed market
investors as a source of flows in 2014, and that momentum
Strong PerformanceAnd a Positive OutlookIn North American Asset Management
d o
c
7Navigating the Shifting Terrain of North American Asset Management
has continued into the first half of 2015.
In a marked reversal of the emerging-
market-led growth of the prior five years,
North America and other developed
markets accounted for almost 70 per-
cent of total global flows in 2014 (Exhibit
2, page 8).
The North American asset management
market continued the steady growth that
began in 2009, contributing significantly to
global growth of assets, revenues and
profits. In 2014, North American AUM
rose 11 percent to a record $31 trillion,
revenues grew 10 percent to $111 billion,
and profits climbed 12 percent to $37 bil-
lion. Most notably, the industry’s operating
margins peaked at 33 percent, a dramatic
11-percentage-point improvement over
the 2009 low (Exhibit 3, page 8).
The North American asset management
industry’s steady upward climb since
2009, not just in assets but also in rev-
enues, profits and margins, was more
than a cyclical phenomenon. Beyond the
positive momentum of the markets, a
set of secular shifts have been gradually,
but definitively, changing the texture of
the industry and creating new opportuni-
ties for asset managers.
An ongoing structural shift to man-
aged assets. Over the past 10 years,
individual investors in North America
have migrated assets from the banking
system and from direct holdings of
stocks and bonds into professionally
managed investment funds as the range
of funds, flexibility of underlying strate-
gies, and breadth of client needs have
0.8
Year-end 2007 AUM
5.5
0.3
(8.2)
0.3
2011 2010
3.6
2008
49.7
2009
0.2
2014
2013
5.5
2012
4.5
3.9
69.4
2014
0.3 0.8 0.5 (0.7) 2.1 1.6 3.6
2.3
1.2
(0.3) (0)
Global AUM, year-end $ trillion
Net flows as percentage of beginning-of-year AUM1
Net flows
Marketperformance
Net flows in global asset management have been accelerating in the last few years
Exhibit 1
1 Excludes private equity flows
Source: 2015 McKinsey Performance Lens Global Asset Management Survey

8 Navigating the Shifting Terrain of North American Asset Management
NorthAmerica
Developed markets
Developed markets
Emerging markets
Emerging markets4
777
35,236
LatinAmerica
16 265
1,442
Central/Eastern Europe
10 77
268
Middle East/Africa
234 497
1,990
EmergingAsia
4153
1,335
4,074
WesternEurope
846
2,429
20,712
1,5962,302
61,628
675
2,173
7,774
Global totals
2,271
4,475
69,402
(119)
Japan
(79) (339)
3,645
Australia
51
331
2,035
Net flows, including all asset classes1
$ billion 2014 net flows2
2009-14 cumulative net flows2
2014 year-end AUM
North America and other developed markets accounted for 70% of flows in 2014
Exhibit 2
1 Excludes private equity fund-raising
2 Arrows for net flows not to scale
3 Includes $300 billion in 2014 net money market flows from China
4 Includes CEE, Emerging Asia, Middle East and Africa and LatAm; includes money market and alternatives
Source: McKinsey Performance Lens Global Growth Cube
Profits2
$ billion
Revenues2
$ billion
AUM$ trillion
Traditional asset management industry only (excludes alternatives AUM)1
Operating marginPercent
2007 2008 2009 2010 2011 2012 2013 2014
33 32 29 30 22 27 28 33
29 332525
17 20 2137
8510188
79 71 79 83
111
23 282519 22 23 23 31
North American asset management operating margin has improved dramatically since 2009
Exhibit 3
1 Includes third-party AUM only (excludes general account assets)
2 Calculated based on overall industry margins for traditional asset managers
Source: 2015 McKinsey Performance Lens Global Asset Management Survey and McKinsey Performance Lens Global Growth Cube

9
expanded. In 2014, asset managers ac-
counted for 37 percent of North Ameri-
can financial assets, compared to 35
percent in 2007.
The emergence of new pools of capi-
tal. Four investor groups have now fully
come of age, accounting for 89 percent
of global net flows between 2009 and
2014: DC pension systems, insurance
general accounts, sovereign wealth funds
and high-net-worth investors in emerging
markets (primarily Asia) (Exhibit 4). The
result has been an expansion of assets to
be managed and clients to be served,
and North American asset managers
have captured a large share of this op-
portunity both locally and abroad.
Continuing evolution in asset alloca-
tion practices. Institutions and retail in-
termediaries alike are increasingly
demanding specialized exposures (e.g.,
emerging markets, high yield), diversifi-
cation (e.g., alternatives), and solutions-
based products (e.g., target-date funds,
tactical asset allocation funds, multi-
asset income funds). North American
asset managers have responded with a
wave of product innovation to meet
these needs. Between 2009 and 2014,
the three categories listed above ac-
counted for over 60 percent of new as-
sets and 90 percent of new revenues,
and have been part of an overall product
mix shift that helped the industry sustain
healthy revenue margins, even in the
Navigating the Shifting Terrain of North American Asset Management
35
14
14
26
1,393
567
536
1,018
14
4
3
10
High-net-worth,emerging markets1
Definedcontribution
Sovereignwealth funds
Insurance
2009-14 net flows, global $ billion
Share of global flows Percent
Share of 2014 global AUM Percent
Four investor groups have accounted for 89% of global net flows since 2009
Exhibit 4
1 Retail flows in emerging markets, including CEE, LatAm, Asia-exc. Japan, GCC and African countries
Source: McKinsey Performance Lens Global Growth Cube

10 Navigating the Shifting Terrain of North American Asset Management
Alternatives
Money market
Multi-asset
Specialty active fixed income and equity3
Core active fixed income and equity2
Passive1
$50 billion $9 trillion100%=
Contribution to U.S. average AUM growth, 2009-14 Percent
Contribution to U.S. revenue growth, 2009-14 Percent
12
3
26
21
44
-6
25
21
25
20
16
-7
Three asset classes have accounted for more than 60% of new assets and 90% of new revenues in the U.S. since 2009
Exhibit 5
1 Excludes passive assets held in multi-asset strategies
2 Includes large cap, income/yield and unconstrained equity strategies, as well as core/core+, bank loans, long duration, short duration, and tax-exempt fixed-income strategies
3 Includes mid/small cap, global/international and EM equity strategies, as well as high-yield, TIPS, flexible, global/international and EM fixed-income strategies
Source: 2015 McKinsey Performance Lens Global Asset Management Survey and McKinsey Performance Lens Global Growth Cube
18x
14x
12x
U.S. historical one-year trailing P/E ratios,1 1994-2014
BankingInsurance
Asset management X Average offinancial sector
4Q 1994 5
10
15
20
25
4Q 1998 4Q 2002 4Q 2006 4Q 2010 4Q 2014
U.S. asset managers trade at a consistent premium compared to banks and insurers
Exhibit 6
1 Median price-to-earnings ratio after extraordinary items at quarter end; number of firms varies each quarter
Source: McKinsey Global Asset Management Practice; SNL Financial

11
face of a steady growth of passive as-
sets (Exhibit 5).
Opportunities arising from banking
regulation. Post-crisis regulation has re-
quired banks to fortify their capital bases,
leading many balance-sheet-driven firms
in the financial system to scale back or
exit certain areas of their traditional lend-
ing and capital markets activity. Asset
managers are starting to fill the voids cre-
ated by this retreat, with burgeoning
growth in credit products, such as direct
lending to middle-market companies, as
well as efforts to develop origination, syn-
dication and crossing platforms to facili-
tate the trading of illiquid securities.
As a result of these shifts, the outlook for
the North American asset management
industry is robust, particularly in the con-
text of the broader financial services in-
dustry. Capital markets have maintained
a positive view of the quality of asset
management earnings, with publicly held
asset managers trading at a consistent
premium to banks and insurers (Exhibit 6).
These higher valuations reflect the strong
growth outlook for the asset manage-
ment industry. A simple decomposition of
2015 price-to-book ratios in the U.S. in-
dicates that up to one-third of current
capital market valuation for the asset
management industry as a whole is
based on prospects for future growth
over and above current earnings. In con-
trast, for banks and insurers, valuations
are driven almost entirely by current earn-
ings, with equity investors giving little
credit to future growth (Exhibit 7). The
Navigating the Shifting Terrain of North American Asset Management
U.S. firms1 Current performance2 Growth expectations3
Asset managers
Insurers
Banks
2.0x
1.2x
1.4x
1.0x
0.4x
0.2x 1.6x
1.6x
3.0x
Up to one-third of capital market valuation for U.S. asset managers is based on expectations for growth
Exhibit 7
1 Common equity including goodwill for asset management; tangible equity excluding goodwill for banks; tangible equity excluding goodwill and AOCI for insurance
2 Includes growth and profitability improvement
3 Based on net income estimates for full-year 2015
Source: McKinsey Global Asset Management Practice; Bloomberg

F A
12
asset management industry has excelled
not just in past performance, but also
with future prospects.
However, it is worth noting that com-
pared with broader U.S. equity market
valuations, which are close to pre-crisis
peaks, asset manager valuations have
moderated over the previous decade.
This may reflect an awareness in the
capital markets of the structural chal-
lenges that asset managers will face in
designing new products, maintaining
their revenues and holding down costs
in the coming years.
Navigating the Shifting Terrain of North American Asset Management

Five Critical CAsset Manag
13Navigating the Shifting Terrain of North American Asset Management
Five Critical Challenges AssetManagers Must Address
The rising tide of the markets has lifted all boats in the
North American asset management industry, but it has not
closed the gap between the top and bottom performers.
Some firms are far better positioned to capitalize on the
opportunities created by the benign investment
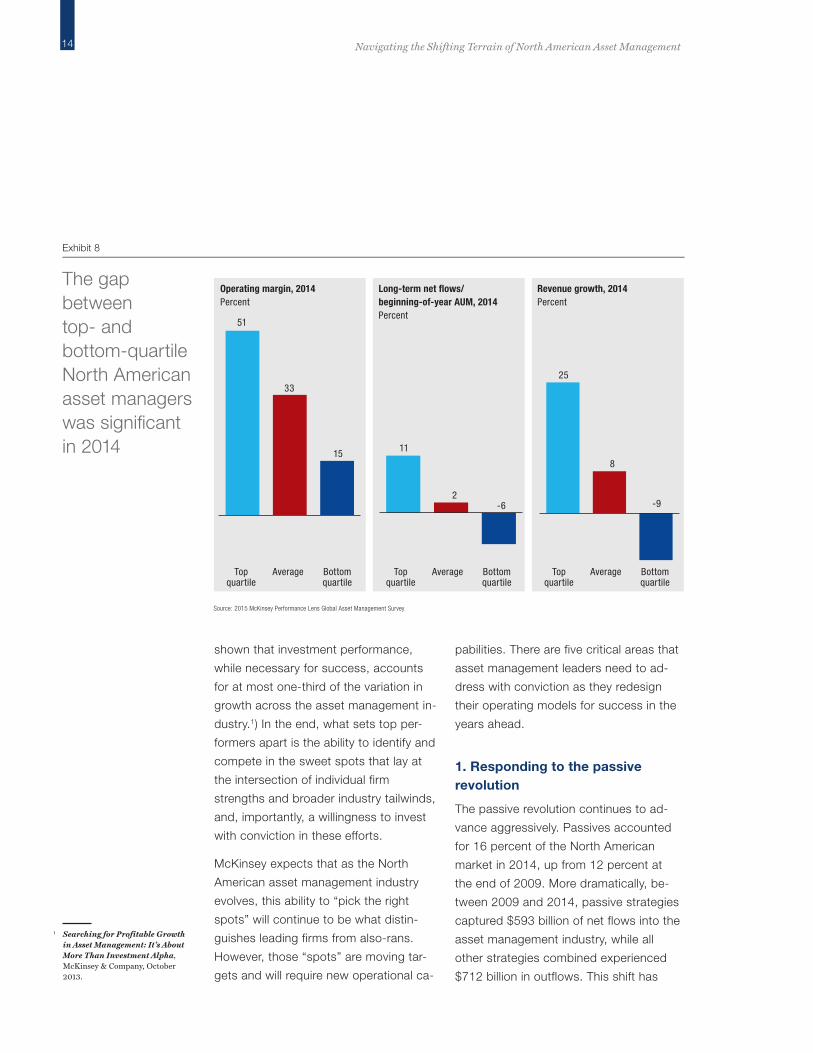
environment. In 2014, firms in the top quartile
outperformed those in the bottom quartile by 17
percentage points in net flows, 34 percentage points in
revenue growth, and 36 percentage points in operating
margin (Exhibit 8, page 14).
This performance variation cannot be attributed to simple
factors like size, specific asset class capabilities, client
segment focus or even ownership structure. Nor can the
performance disparity be explained solely by differences in
investment performance. (Previous McKinsey research has
14 Navigating the Shifting Terrain of North American Asset Management
shown that investment performance,
while necessary for success, accounts
for at most one-third of the variation in
growth across the asset management in-
dustry.1) In the end, what sets top per-
formers apart is the ability to identify and
compete in the sweet spots that lay at
the intersection of individual firm
strengths and broader industry tailwinds,
and, importantly, a willingness to invest
with conviction in these efforts.
McKinsey expects that as the North
American asset management industry
evolves, this ability to “pick the right
spots” will continue to be what distin-
guishes leading firms from also-rans.
However, those “spots” are moving tar-
gets and will require new operational ca-
pabilities. There are five critical areas that
asset management leaders need to ad-
dress with conviction as they redesign
their operating models for success in the
years ahead.
1. Responding to the passiverevolution
The passive revolution continues to ad-
vance aggressively. Passives accounted
for 16 percent of the North American
market in 2014, up from 12 percent at
the end of 2009. More dramatically, be-
tween 2009 and 2014, passive strategies
captured $593 billion of net flows into the
asset management industry, while all
other strategies combined experienced
$712 billion in outflows. This shift has
25
8
-9
11
2 -6
51
33
15
Topquartile
Average Bottomquartile
Topquartile
Average Bottomquartile
Topquartile
Average Bottomquartile
Operating margin, 2014Percent
Long-term net flows/beginning-of-year AUM, 2014Percent
Revenue growth, 2014Percent
The gap between top- and bottom-quartile North American asset managers was significant in 2014
Exhibit 8
Source: 2015 McKinsey Performance Lens Global Asset Management Survey
1 Searching for Profitable Growthin Asset Management: It’s AboutMore Than Investment Alpha,McKinsey & Company, October2013.

15Navigating the Shifting Terrain of North American Asset Management
spurred some soul-searching on the part
of active-only managers on the longer-
term positioning of their franchises.
The market’s shift to passive investments
is related in part to investment perform-
ance. Over the last 20 years, the degree
to which active managers have been able
to deliver superior returns has steadily
decreased across almost all major strate-
gies. In U.S. large-cap equities, for exam-
ple, the gap between top- and
bottom-quartile manager performance
declined, from almost 11 percent from
1995 to 2002 to 5.6 percent between
2010 and 2014 (Exhibit 9). This narrow-
ing distribution of returns can be attrib-
uted to several factors, including a more
rapid flow of information leading to
higher-quality research, increased effi-
ciency of markets, and heightened com-
petition among a growing number of
skilled portfolio managers. The steady
rise of markets over the past few years
has also done active managers few fa-
vors as beta has come to dominate alpha
as a source of returns. In addition, active
managers have had to contend with a
meaningful degree of cash drag in a
world with near-zero yields.
Based on the headlines, the passive in-
vestments revolution appears to be an
unstoppable force that threatens to up-
end the asset management industry and
transform its economics. The reality is
more nuanced. There is indeed meaning-
ful room for continued passive growth,
Average annual spread between top- and bottom-quartile returns for all U.S. actively managed strategies using same preferred benchmark,1 1995-2014
2.3
6.16.26.35.6
6.3
3.6
7.3
8.78.7
7.7
9.4
1.4
9.0
10.010.710.9
13.1 U.S. small/midcap
U.S. large cap
Global equity
2003-2009 2010-20141995-2002
Emergingmarkets equity Internationalequity
U.S. core bond
The ability of active managers to deliver excess returns has steadily decreased across almost all major strategies
Exhibit 9
1 Benchmarks used: U.S. large cap – S&P 500; U.S. small/mid cap – Russell 2000; global equity – MSCI World; international equity – MSCI EAFE; emerging markets equity – MSCI EM; U.S. core bond – Barclays US Aggregate
Source: McKinsey Global Asset Management Practice; eVestment

16 Navigating the Shifting Terrain of North American Asset Management
but the facts suggest that rumors of the
imminent death of active management
are at least somewhat exaggerated.
A closer look reveals that collateral dam-
age from the passive revolution has fallen
disproportionately on “plain vanilla” ac-
tive product segments, in particular the
world of active equities, which in North
America has suffered $2.6 trillion of out-
flows between 2009 and 2014. To be
sure, a good portion of these assets
were displaced outright by lower-cost
passive equity mandates. But many
analyses fail to account for a parallel de-
velopment on the other end of the prod-
uct “barbell”: the demand for more
specialized strategies within the world
of active management, in particular
alternatives and multi-asset solutions,
which garnered $1.6 trillion of flows in
the same period (Exhibit 10). These
strategies, many of which aim to create
value across benchmarks and asset
classes, have become the new focus for
alpha generation, with many even using
passive building blocks to construct
strategies that ultimately have a high ac-
tive content in cross-benchmark alloca-
tion and to deliver what some have
termed “specialized beta.” While security
selection within mature, highly-liquid
asset markets and within the confines of
narrow benchmarks is becoming in-
creasingly efficient and commoditized
by passive investing, many investors,
both retail and institutional, are seeking
Alternatives2Activeequity
Multi-asset1
1.21
Moneymarket
0.17
Activefixed income
-1.03
0.43 0.59
Passivefixed income
1.03
Passiveequity
-2.61
2014 AUM 1.0 4.6 2.8 11.5 6.8 3.9 4.6
North America cumulative net flows, 2009-2014$ trillion >5%
2009-14 average annual net flows
0-5% <0%Specialized strategies within the world of active management received $1.6 trillion of flows between 2009 and 2014
Exhibit 10
1 Includes actively managed target-date funds 2 Includes retail alternatives
Source: McKinsey Performance Lens Global Growth Cube

17Navigating the Shifting Terrain of North American Asset Management
exposure to more specialized markets
and believe in the potential for value cre-
ation across benchmarks. These strate-
gies—in many but not all cases
“unconstrained” or multi-asset-class—are
attracting attention and flows across seg-
ments. The challenge for asset managers
will be to show that they can create value
beyond a passive allocation strategy, par-
ticularly as these new product markets
mature and competition increases.
Growth in passive investments has been
significant in terms of asset flows, but
the associated revenue represents a rel-
atively small portion of the industry’s
overall revenue pool. For example, de-
spite accounting for over 100 percent of
industry net flows over the past six
years, passive investments accounted
for just 3 percent of new U.S. industry
revenues. This fact raises a deeper con-
cern about the potential for passive
products to commoditize the market and
exert downward pressure on pricing
across the board.
A granular view of the market is instruc-
tive (Exhibit 11). An analysis of major
product categories by both net flows and
changes in revenue margins reveals sev-
eral interesting insights. The most signifi-
cant price compression took place within
the world of passive products; passive
equity and fixed-income revenue margins
both declined by an average of about 2
percent over the period. The next-biggest
pricing impact was (unsurprisingly) in ac-
1.0
4 0 -10 -3.0
10 8 2
4.0
0
-1.0
3.0
2.0
-2.0
12 6 -2 -4 -6 -8
Alternatives
Multi-asset
Active specialtyfixed income
Active corefixed income
Passivefixed income
Active coreequity
Active specialtyequity
Passiveequity
Average annual net flows, 2009-14
Average annual change inrevenue margin, 2009-14
U.S. net flow growth and change in revenue margin by asset class1
PercentBubble size = 2014 AUM
Passive Active
In the U.S., the most significant margin compression took place in passives
Exhibit 11
1 Active core equity includes U.S. large cap equity; active core fixed income includes core, core plus and municipal bonds; active specialty equity includes foreign, global, EM and U.S. small/mid-cap; active specialty fixed income includes global, EM, high yield, TIPS and unconstrained
Source: 2015 McKinsey Performance Lens Global Asset Management Survey and McKinsey Performance Lens Global Growth Cube

18 Navigating the Shifting Terrain of North American Asset Management
tive core equities, the very products that
were being displaced by passive.
Most interestingly, average pricing actu-
ally increased moderately in a number of
high-demand categories, like multi-asset
solutions and specialty fixed income;
some of this was due to mix shifts and
new product innovation, but, by and large,
these categories sustained their margins
because investors continued to value
what the categories delivered to their
portfolios. If anything, it appears that the
use of low-cost passive instruments may
have increased some investors’ “budget”
for more specialized strategies.
In the end, strategies that lack differenti-
ation are a magnet for passive disinter-
mediation. It is not so much individual
asset classes that are susceptible to
displacement, but rather individual asset
managers who fail to differentiate them-
selves from the benchmark. An analysis
suggests that about 10 percent of the
active industry could fall into this
“benchmark-hugging” category, and is
thus a prime target for disintermediation
in the near term. This slice of the market
offers immediate room for growth for
passive managers, but not enough to
forecast the overthrow of the active
regime (Exhibit 12).
This is not to say that the rest of the in-
dustry is immune from the passive invest-
ments challenge, as passive players
continue to innovate with their products.
Passivestrategies1
Total U.S.assets
~3
Activestrategies
“Benchmark- hugging” fixed income and equity2
~33
~5
Differentiatedstrategies
Core multi-asset and money market
Core fixed incomeand equity3
~28
~13
~6
~6
~17 ~83 9-11 ~17 ~18 ~39
U.S. asset management market, 2014$ trillion
Examples
Share of totalPercent
AlternativesSpecialty fixed income and equity
BalancedTarget dateMoney market
Large-cap equityCore fixed income
Active strategies that track benchmark
About 10% of U.S. managed assets fall into the “benchmark- hugging” category
Exhibit 12
1 Excludes passive multi-asset and target date
2 Includes actively managed strategies whose returns were within 100-350 bps of preferred benchmark (depending on sub-asset class) in at least three-quarters of the past 10 years
3 Excludes “benchmark-hugging” strategies
Source: McKinsey Global Asset Management Practice; eVestment; Simfund

19Navigating the Shifting Terrain of North American Asset Management
A nuance often lost in the passive-active
dynamic is the blurring of boundaries be-
tween the two categories, embodied by
the rise of “smart beta” and factor-based
strategies that claim to deliver superior,
index-beating returns with a superior risk
profile at a lower cost and with greater
predictability than active management.
Many sophisticated investors and their
intermediaries are in the midst of explor-
ing and experimenting with the use cases
of such strategies in their portfolios.
It is also important to note that the
growth of passive investments itself faces
challenges. Investors recognize that most
of the growth in passives has taken place
during an unusual period of rising mar-
kets and low volatility. The resilience of
passives in the face of cyclical change
and a shifting macroeconomic environ-
ment is open to question. Recent
events—specifically the “flash crash” in
the prices of a small number of ETFs dur-
ing the stock market decline in August
2015—have also caused some to ques-
tion the premise of passives being a “safe”
and highly flexible strategy. While most of
the ETFs that failed on August 24th were
small and had limited liquidity, a few large
ETFs experienced significant variances in
prices relative to their indices, spurring
debate among market participants and
regulators on the resilience of this
broader set of vehicles during a crisis.
Looking forward, it will be critical for
asset managers to go beyond the simple
active/passive dichotomy and develop a
clear position on where they will com-
pete and how they will stand out in an
environment where investor preferences
are likely to be in flux. Active managers,
in particular, will need to develop a far
sharper and more nuanced articulation
of their value proposition to their clients,
not only in terms of the uniqueness and
durability of their “edge” in generating
alpha, but extending to their ability to
manage risks, liquidity and volatility to
deliver superior results across a range of
market conditions. Key actions that
asset managers will need to consider in-
clude redesigning the active investment
process (and associated investor incen-
tives), accelerating the development of
specialized active products and multi-
asset solutions, and entering the more
specialized segments of the passive
market (including hybrid strategies that
leverage passive building blocks) to bal-
ance growth and revenue potential.
2. Serving a fragmenting clientbase across an expanding array ofdistribution channels
Asset management has been transition-
ing from its traditional business-to-
business model to one that is business-
to-business-to-consumer across its most
important growth segments. In North
America, changes in governmental and
corporate policies on retirement have
shifted the client nexus from defined
benefit (DB) pension plans with thou-
sands of participants to millions of indi-
vidual households making their own
investment decisions through DC plans
or dispersed financial intermediaries.
These shifts alone have made the retail

20 Navigating the Shifting Terrain of North American Asset Management
segment a critical source of new asset
flows, which in turn creates a new set of
distribution challenges.
In North America, the retail distribution
landscape has been clearly evolving, with
a diverse and growing set of constituents.
A significant portion of retail assets con-
tinues to be managed on the large tradi-
tional platforms and through major
broker-dealers, but two other channels—
RIAs and direct/discount brokerages—
have been gaining momentum. A number
of factors are driving this growth, includ-
ing the trend of breakaway advisors
seeking greater autonomy, client disillu-
sionment with the commission-based
brokerage model, and the emergence of
younger investors who are drawn to the
simplicity and immediacy of technology-
enabled direct channels.
Collectively, RIAs and discount and direct
investment channels took about 4 per-
cent of the U.S. retail market between
the beginning of 2009 and 2014, and
many expect that momentum to continue
through 2020 (Exhibit 13).
Asset managers selling through large bro-
kerage firms have traditionally designed
their distribution models with a focus on
uniformity and scale. In recent years,
many firms have bolstered their coverage
of the large distributor home offices that
oversee the selection of asset managers
for recommended lists and the position-
ing of individual funds into asset alloca-
Independentbroker-dealers
Bank andinsurers
Private banks
Discount/direct
Regional broker-dealers
RIA/IFA2
Major broker-dealers -4
3
1
-2
0
1
1
1.3
1.9
0.9
0.4
0.9
1.0
0.8
3.9
3.7
1.7
1.4
2.1
2.1
1.9
Channels1
2014 AUM, U.S. $ trillion
Market share change, 2009-14 Percent
AUM change2009-14 $ trillion
RIAs and discount and direct investment channels have been growing share in U.S. retail
Exhibit 13
1 Includes SMAs, OEFs, CEFs, VAs; excludes money market funds, fixed annuities, limited partnerships and collective investment trusts
2 Includes IFAs, dual-registered, and ETF strategists
Source: McKinsey Performance Lens Growth Cube; Strategic Insight; Investment Company Institute
21Navigating the Shifting Terrain of North American Asset Management
tion models. Now, the diversification of
the retail client base is undercutting the
scalability of these models, not only be-
cause of the challenges of geographical
reach (e.g., the dispersion of major RIAs
outside traditional money centers), but
also because asset managers must meet
the needs of diverse groups of advisors
and satisfy the preferences of multiple
subsets of end-investors.
The growth of direct and discount chan-
nels—particularly those using digital inter-
faces—will further increase the
complexity of the distribution landscape.
A segment of the client base will in-
evitably become increasingly comfortable
with more commoditized forms of advice
(e.g., on asset allocation), which will
make brand recognition and clear prod-
uct value propositions paramount. Distri-
bution, in this paradigm, becomes as
much about marketing as it is about the
traditional levers of sales.
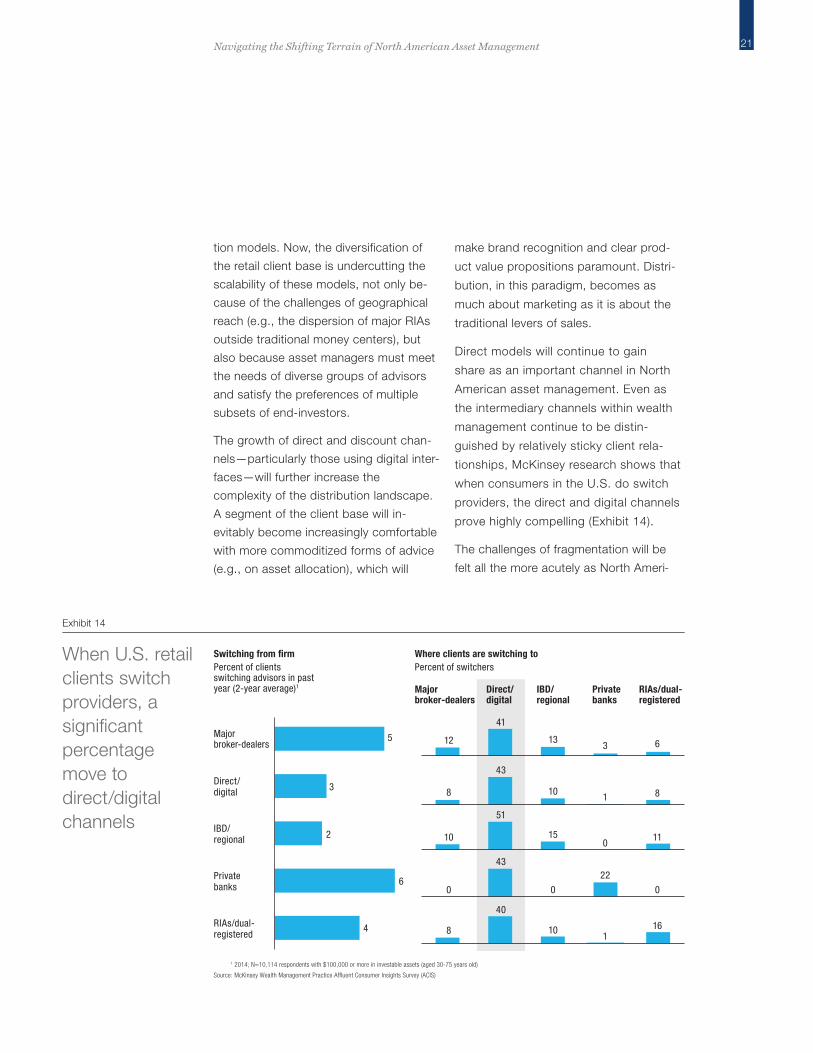
Direct models will continue to gain
share as an important channel in North
American asset management. Even as
the intermediary channels within wealth
management continue to be distin-
guished by relatively sticky client rela-
tionships, McKinsey research shows that
when consumers in the U.S. do switch
providers, the direct and digital channels
prove highly compelling (Exhibit 14).
The challenges of fragmentation will be
felt all the more acutely as North Ameri-
IBD/regional
Privatebanks
Direct/digital
Major broker-dealers
RIAs/dual-registered
RIAs/dual-registered
Private banks
IBD/ regional
Direct/ digital
Major broker-dealers 63
13
41
125
3
2
6
4
8110
43
8
110
15
51
10
0
22
0
43
0
161
10
40
8
Switching from firmPercent of clients switching advisors in past year (2-year average)1
Where clients are switching toPercent of switchers
When U.S. retail clients switch providers, a significant percentage move to direct/digital channels
Exhibit 14
1 2014; N=10,114 respondents with $100,000 or more in investable assets (aged 30-75 years old)
Source: McKinsey Wealth Management Practice Affluent Consumer Insights Survey (ACIS)

22 Navigating the Shifting Terrain of North American Asset Management
can asset managers seek to expand into
fast-growth emerging markets. These ef-
forts will bring their own challenges: mul-
tiple languages, regulatory regimes,
jurisdictions, competitive dynamics and
distribution relationships, all of which
challenge the scalability of a traditional
one-size-fits-all sales model.
These changes in the retail client base
give asset managers opportunities to
grow share in new and underpenetrated
markets or segments; but they also
present a degree of operational com-
plexity that can put pressure on prof-
itability. The increased diversity in retail
channels will force managers to choose
thoughtfully where to focus by geogra-
phy and segment. Firms will need to
continue to innovate in distribution and
build scalability into their product plat-
forms to balance the demands of
greater specialization with the ability to
generate profitable growth.
The diversification of retail channels will
also require a shift in how firms think
about client value. Instead of taking a
purely sales-focused view of the market
(e.g., metrics based on gross sales and
redemptions), firms will need to consider
the net present value of client segments,
which can vary widely by channel when
factors like client acquisition costs and
asset churn are taken into account.
3. Leveraging advances in dataand technology to drive innovation
Asset management is a data-centric in-
dustry, with technology-enabled “plumb-
ing” that facilitates information flows
across internal functions, as well as ex-
ternally to clients and other market par-
ticipants. Recent technological advances
have significantly enhanced risk-related
analytics, improved trade execution and
helped firms address increased compli-
ance and regulatory complexity within
capital markets.
Over the next five years, data and tech-
nology will continue to play a critical role
in core asset management functions.
Now, however, industry leaders will begin
to aggressively adopt analytical ap-
proaches and technologies (and talent)
from outside the industry to reinvent the
core activities of investing and distribution.
On the investment front, a step change
in the availability of non-traditional data
and processing power, as well as rapid
advances in new techniques of semantic
analysis and machine-learning, will give
asset managers an unprecedented abil-
ity to mine terabytes of unstructured
data for signals, patterns and relation-
Advances in data analytics andtechnology have the potential totransform investment processes,making new sources of insight
available to portfolio managers andfreeing up research bandwidth from
routine tasks.

23
ships, with the potential to yield in-
vestable insights. Tools and technolo-
gies that were once the sole preserve of
“black box” quantitative investment firms
are now increasingly available to tradi-
tional investors.
Advances in data analytics and technol-
ogy have the potential to transform invest-
ment processes, making new sources of
insight available to portfolio managers
(e.g., real-time insights via web-scraping)
and freeing up research bandwidth from
routine tasks (e.g., searching multiple
pages of regulatory filings and annual re-
ports). Asset management firms are ex-
perimenting with these capabilities to build
an edge in delivering alpha, and industry
leaders are likely to turn them into a
source of competitive advantage.
Distribution is another area ripe for dis-
ruption through data and technology
(Exhibit 15). For example, with the un-
precedented availability of data on finan-
cial advisor behavior (some of it newly
available from large distributors for a fee),
leading firms are beginning to use ad-
vanced analytics to more precisely target
on-the-ground retail distribution forces.
Leaders in the industry will develop next-
generation, technology-enabled whole-
saling models aimed at drastically
increasing sales return on investment.
The true elephant in the room in terms of
data and technology is the question of
talent. Firms seeking to take the lead in
analytics, data-mining and technology-
based portfolio insights will need to de-
velop new value propositions to attract
Navigating the Shifting Terrain of North American Asset Management
Enhanced prospecting
Defensive intelligence
Personalized marketing
Smart salesforce reallocation
Optimized sales coverage
Targeted campaigns
Predicting which advisors will outperform their current segments; prioritizing outreach to advisors based on potential to improve prospecting efficiency
Identifying and addressing advisors likely to redeem/underperform, and prioritizing informed sales conversations to stem outflows from at-risk advisors
Focusing marketing messages and sales conversations on products advisors are most likely to purchase/redeem, based on common product associations
Delivering segment-specific marketing materials and sales conversations that address the key considerations within individual advisors’ investment processes
Prioritizing advisors based on future potential and alignment to firm value proposition.
Using attitudinal and behavioral segmentation to improve success rates among advisors
Serving advisors with their preferred format and frequency of interaction, and delivering the optimal level of service while conserving salesforce resources
Aligning salesforce with advisor segments they are best positioned to serve, by matching strengths with the capabilities advisor segments value most
Targeting efforts when key competitor products are underperforming or experiencing a PM change
Advanced analytics can transform distribution in a number of ways
Exhibit 15
Source: McKinsey Global Asset Management Practice

24
employees from outside the industry with
a more diverse array of skills and talents.
They will not be alone, as firms across
many industries are seeking to build an
edge in digital talent.
4. Creating and sustainingoperating leverage
Conventional wisdom holds that asset
management is an industry with signifi-
cant operating leverage. A doubling of
AUM in a particular fund, according to
this view, should not require anything
close to a doubling of the underlying
costs of management.
Recently, however, operating leverage has
been in short supply. The underlying cost
base of the North American asset man-
agement industry has risen almost as fast
as revenues. From 2009 to 2014, North
American asset managers2 added a col-
lective $20 billion to their cost base,
amounting to an annualized 7 percent in-
crease in costs, versus an annualized 7
percent increase in overall AUM and an
annualized 9 percent increase in revenues.
While operating margins have improved,
costs as a proportion of AUM have ranged
between 25 to 27 basis points over the
past few years (Exhibit 16).
Some of the rising costs are variable—for
instance, performance-related compensa-
tion. But a large portion of the industry’s
incremental costs stems from the increas-
Navigating the Shifting Terrain of North American Asset Management
2014
74
3
2013
68
3 2
63
54
20122009
1
8%
9%
8%
15%
CAGR 2009-14
7%
2%
27 27 26 25 Total cost/AUMBps
Estimated North American asset management industry costs by function, $ billion, traditional industry (excluding alternatives AUM)
Sales and marketing
InvestmentmanagementOperationsand technology
Legal/compliance/riskManagement/administration
14
27
12
12
16
29
13
1411
11
25
14
13
10
20
10
The cost base of the North American asset management industry has risen almost as quickly as revenues
Exhibit 16
Source: 2015 McKinsey Performance Lens Global Asset Management Survey and McKinsey Performance Lens Global Growth Cube
2 Includes traditional assets only(excludes alternatives).

25
ing complexity of operating models. As
firms bring a more sophisticated range of
products to market, enter new geo-
graphic markets with distinct require-
ments around product vehicles, and scale
up in legal and compliance resources to
meet regulatory demands, their operating
models become more complex to keep
pace. In addition, a significant chunk of
industry costs (an increase of $6 billion
compared to 2009) has gone into the
sales and marketing arms race, with
some firms ramping up sales resources in
the face of resurgent flows.
Growth in the industry’s cost base has
important implications for financial per-
formance and strength. As discussed
earlier, a majority of the industry’s growth
has come from market appreciation—the
kind of growth that should not have a
meaningful impact on costs. If costs con-
tinue to increase in parallel with the mar-
kets, the gains in assets, revenues and
profitability of the past several years
could be vulnerable to a market down-
turn, or just to a pause in the upward
climb in asset prices managers have en-
joyed for several years.
The efficiency and scalability of an asset
manager’s operating model will be the
critical determinant of whether the
growth it captures is sustainable and,
perhaps more important, profitable. A
sound operating model is one that is de-
signed to carry out a firm’s strategy.
Building such a model will demand a
consistent set of choices across client
focus, product platforms, geographic
footprint and a firm’s operational spine. In
the coming years, McKinsey expects new
operating model components to include:
greater use of remote and digital sales
channels, both independently and as a
complement to traditional sales forces; a
dedicated focus on scalability of product
platforms (including ruthless product pri-
oritization and leveraging of cross-border
funds to penetrate smaller markets); opti-
mization of geographic footprints; and
greater use of outsourced operational
and technology resources that effectively
“variable-ize” important spend categories.
5. Finding opportunities in therising tide of regulation
Success in asset management is always
subject to the realities of regulation. His-
tory has shown that regulation can be
both a constraint and an opportunity.
Perhaps the best example is the rise of
target-date funds, a product with ap-
proximately $1.1 trillion in AUM in the
U.S., which is expected to generate
$600 billion to $700 billion in cumulative
net flows in DC alone over the next six
Navigating the Shifting Terrain of North American Asset Management
The efficiency and scalability of an asset manager’s operating
model will be the critical determinantof whether the growth it captures issustainable and, perhaps more
important, profitable.

26
years (albeit with moderate yields and
concentrated among a few managers).
One of the major drivers of the growth in
target-date funds was the Department of
Labor’s regulation regarding Qualified
Default Investment Alternatives in 2007,
which created a privileged position for
investment funds that balanced long-
term appreciation and capital preserva-
tion through a mix of equity and
fixed-income investments and that were
managed in a way that took account of
the employee’s age or retirement date.
Managers that moved quickly on this
opportunity realized tremendous bene-
fits, as over $400 billion of net new as-
sets flowed into DC target-date funds
over the past six years.
To date, the asset management industry
has remained a secondary focus for reg-
ulators, as added scrutiny and new rules
have fallen mainly on balance-sheet-
dependent financial institutions that
played a more prominent role in the
global financial crisis. But the next wave
of global financial services regulation is
on the horizon, and much of it will impact
the asset management industry in both
direct and indirect ways (Exhibit 17).
The near-term focus of asset manage-
ment regulation will likely center on the
retail side of the business, given the
resurgence of retail flows into the market
and broader secular shifts (e.g., the move
from DB to DC) that are making the cur-
rent generation of retail investors the first
Navigating the Shifting Terrain of North American Asset Management
Initiative
Solvency II
Central Securities Depositories
Basel III
IMD II
PRIPs
EMIR
MiFID II
Financial Transaction Tax ("Tobin")
UCITS V
AIFMD
Regulation on indices
DOL fiduciary standards
SEC uniform fiduciary standard
UK RDR
Canada best interest duty/fee transparency
Australia Future of Financial Advice
2017 2009 2013 2011 2015
FATCA Wealth management-specific regulation
Assetmanagement-specific regulation
Financial services regulation with spillovers into asset management
Financial services overall
Preliminary consultation Rule making National translation/implementation The next wave of financial services regulation will have direct and indirect impacts on asset management
Exhibit 17
Source: McKinsey Global Asset Management Practice
27
to fully own the risks of their retirement.
Regulators seem to be focusing on four
key areas: transparency in pricing, dis-
tributor incentives (e.g., commissions
and revenue-sharing), open architecture
in key platforms, and a unified set of fidu-
ciary standards in asset and wealth man-
agers’ relationships with individual
investors. Fund liquidity requirements and
broader questions around the implica-
tions on market stability of large funds
operating in more specialized market
segments are also likely to be longer-
term areas of focus.
If enacted in their most stringent forms,
new regulations could have far-reaching
effects on the economics of the asset
management industry. For example, the
U.S. Department of Labor’s proposal to
extend fiduciary standards to advice
provided to retirement savers could sig-
nificantly limit the advice that wealth
managers will be able to provide to indi-
vidual investors. Implications could
range from incentivizing managers to
guide investors into low-cost passive
products (“conflict-free” investments) to
shifts in retirement plan product line-ups
and the DC asset mix, with more assets
remaining in employers’ retirement plans
and fewer rolling over into IRA accounts.
On the macro front, more severe regula-
tory scenarios on fund liquidity could
create new sources of “cash drag” on
active investment vehicles, further in-
creasing the challenge of competing
against passive. Similarly, broader mar-
ket liquidity guidelines could constrain
the growth of passive vehicles in less
mainstream markets.
To position themselves for success over
the next five years, asset managers will
need to significantly step up their regu-
latory approach. This means going be-
yond a reactive, compliance-driven
approach to rethinking business models
and product lineups in order to take ad-
vantage of opportunities created by reg-
ulatory discontinuities. For many, it will
also require a fundamental shift to a
more client-centric and fiduciary mind-
set, which leading firms will embed
deeply within their cultures.
■ ■ ■
There is no single best response to the
five critical challenges described in this
report—and there are many answers
that could be “wrong,” that is, sub-opti-
mal. The urgent task for North American
asset managers is to fully understand
the scope and nature of the challenges
they face, make clear choices concern-
ing their place in the active/passive
spectrum, their approach to distribution,
data and technology, operating models,
and regulation, and invest with commit-
ment in their chosen path.
Navigating the Shifting Terrain of North American Asset Management

mperatives foAsset Manag
28 Navigating the Shifting Terrain of North American Asset Management
Imperatives for Asset Managers
The core driver of success in asset management may be
unchanged: winning firms choose the right spots and
play to their own strengths. However, the means of
achieving this will evolve in a significant way over the
next five years. A winning strategy for 2020 will address
a mix of longer-term secular forces (e.g., demographic
shifts in developed markets, the rise of emerging
markets), medium-term industry trends (e.g., the
concurrent rise of alternative and passive investments),
and fundamental discontinuities that will create both
challenges and opportunities in the near term (e.g.,
technology and regulation).
Given this confluence of changes across multiple time
horizons, asset managers aspiring to industry leadership
owe it to themselves and their stakeholders to take a

o
29Navigating the Shifting Terrain of North American Asset Management
structured approach to building strategic
alignment within their organizations to pre-
pare for success in 2020.
In McKinsey’s view, five core steps are
essential to the development of a long-
term strategy grounded in industry reali-
ties and implemented through a set of
highly practical initiatives:
■ Agree on aspirations and strategic vi-
sion. As a first step, leadership teams
should come to a consensus about
their view of the future of the industry
with respect to regulation, the evolution
of client needs and changes in distribu-
tion, and compare this vision with their
firm’s current path. How well-positioned
is the firm to succeed in three years, if
no significant changes are made? What
are the aspirations for success in the
market of the future, and how will suc-
cess be defined?
■ Assess strengths against market oppor-
tunities. Leadership teams should take
a clear-eyed look at which of their core
strengths distinguish them in the mar-
ketplace, and which capabilities can be
developed into strengths in the future.
Which market opportunities will be
most compelling, and how do these op-
portunities line up against the firm’s cur-
rent strengths? What new capabilities
should the firm incubate and develop,
and what implications would these have
for the firm’s core value proposition?
■ Develop and prioritize future scenarios.
Leadership teams should consider pos-
sible market, macro and regulatory sce-
narios, and their implications for the
current business portfolio and firm per-
formance. That is, for each scenario,
how does the firm’s mix of geographic
footprint, product and solution set, tar-
get clients and investment skills line
up? Where are the biggest opportuni-
ties for breakout growth, and are there
outcomes that would represent unac-
ceptable risks to the franchise?
■ Make tough choices and trade-offs
through resource reallocation. Leader-
ship teams must make deliberate
choices regarding the specific product
and segment areas where they will
focus. Trying to be all things to all peo-
ple is rarely a winning strategy, and
firms are best served by choosing a lim-
ited number of areas—say, three to
five—where they aspire to be distinc-
tive. These decisions must be sup-
ported by aggressive reallocation of
resources. In keeping with the princi-
ples of zero-based budgeting, firms
should challenge themselves by asking
whether they would be allocating re-
sources the same way if they were re-
building from the ground up.
Trying to be all things to all peopleis rarely a winning strategy, andfirms are best served by choosinga limited number of areas—say,three to five—where they aspire to
be distinctive.

30 Navigating the Shifting Terrain of North American Asset Management
■ Develop a holistic operating plan that
bridges operating platform, governance
and culture. Key questions to consider
include: What are the implications of
our new strategy for our operating
model and talent requirements? How
do our current organizational structure
and culture need to evolve to meet the
demands of our new strategy? Decid-
ing on near-, medium- and long-term
priorities must be a focus, along with a
strategic roadmap and a clear timeline
for making change happen.
Meaningful changes in strategic position-
ing and operating model will be required
for asset managers aiming for industry
leadership in 2020, but there are also
several elements of continuity that are
critical to building an enduring and thriv-
ing firm. A relentless pursuit of excellence
in three areas will continue to be funda-
mental to the success of any firm:
■ Robust investment processes that drive
performance. Leading firms ensure that
the design and functioning of their in-
vestment engine and its underlying
processes are rooted in sources of
competitive advantage and that they
can deliver for clients in a reliable and
repeatable way. Performance matters,
but so does consistency.
■ Client-centric sales and servicing capa-
bilities. Leading asset managers can
mobilize across all functions and geog-
raphies to meet a set of well-articulated
client needs. Success factors include
clarity in terms of roles and processes
and, just as important, ensuring that
the entire organization shares a consis-
tent and appropriate fiduciary mindset.
■ Strength in leadership and talent devel-
opment. Asset management has al-
ways been a talent-based industry, but
leading firms go beyond the classic
paradigm of “attracting and retaining”
talent to nurturing that talent to reach
their full potential. This capability will
become even more important in the in-
creasingly globalized asset manage-
ment landscape of 2020, and leading
firms will focus particularly on develop-
ing well-rounded cross-functional busi-
ness leaders.
■ ■ ■
The North American asset management
industry has had a very strong run over the
past five years, and the next five will offer
continued opportunities for success. How-
ever, even the leading firms of today will
not be able to coast their way to future
performance. Shifts in product preferences,
distribution channels, industry regulation
Meaningful changes in strategicpositioning and operating modelwill be required for all assetmanagers aiming for industry
leadership in 2020, but there arealso several elements of continuitythat are critical to building anenduring and thriving firm.

31Navigating the Shifting Terrain of North American Asset Management
and the role of technology are changing
the terms of success. Winning firms of to-
morrow will recognize the impact of these
shifts, and will take the first steps in re-
designing their business and operating
models for a new industry landscape.
Pooneh Baghai
Onur Erzan
Ju-Hon Kwek
Fabrice Morin
The authors would like to thank Owen Jones, Joseph Lai and Nancy Szmolyan for their contributions to this report.

32 Navigating the Shifting Terrain of North American Asset Management
About McKinsey & Company
McKinsey & Company is a management consulting firm that helps many of theworld’s leading corporations and organizations address their strategic chal-lenges, from reorganizing for long-term growth to improving business perform-ance and maximizing profitability. For more than 85 years, the firm’s primaryobjective has been to serve as an organization’s most trusted external advisoron critical issues facing senior management. With consultants in more than 50countries around the globe, McKinsey advises clients on strategic, operational,organizational and technological issues.
McKinsey’s Global Wealth & Asset Management Practice serves asset man-agers, wealth management companies and retirement firms globally on issuesof strategy, organization, operations and business performance. Our partnersand consultants have deep expertise in all facets of asset management. Ourproprietary research spans all institutional and retail segments, asset classes(e.g., alternatives) and products (e.g., ETFs, outcome-oriented funds). Our pro-prietary solutions provide deep insights into the flows, assets and economics ofeach of the sub-segments of these markets and into the preferences and be-haviors of consumers, investors and intermediaries.
To learn more about McKinsey & Company’s specialized expertise and capabili-ties related to the asset management industry, or for additional informationabout this report, please contact:
Pooneh BaghaiDirector, New York & [email protected]
Pierre-Ignace BernardDirector, [email protected]
Onur ErzanDirector, New [email protected]
Jonathan HarrisDirector, [email protected]
Martin Huber Director, [email protected]
Philipp KochDirector, [email protected]
Alok KshirsagarDirector, [email protected]
Enrico LucchinettiDirector, [email protected]
Joe NgaiDirector, Hong [email protected]
Frédéric VandenbergheDirector, [email protected]
Robert ByrnePrincipal, San [email protected]
Gemma D’AuriaPrincipal, [email protected]
Nick HoffmanPrincipal, [email protected]
Daniel GourvitchPrincipal, New [email protected]
Fumiaki KatsukiPrincipal, [email protected]
Ju-Hon KwekPrincipal, New [email protected]
Sebastien LacroixPrincipal, [email protected]
Rogerio MascarenhasPrincipal, Sao [email protected]
Fabrice MorinPrincipal, [email protected]
Matteo PaccaPrincipal, [email protected]
Sofia SantosPrincipal, Sao [email protected]
Jill ZuckerPrincipal, New [email protected]

33Navigating the Shifting Terrain of North American Asset Management
Further insights
McKinsey’s Global Wealth & Asset Management Practice publishes frequentlyon issues of interest to industry executives. Our recent reports include:
The Virtual Financial Advisor: Delivering Personalized Advice in the Digital AgeJuly 2015
New Heights Demand Increasing Agility: Global Asset Management OverviewJune 2015
Building on Canada’s Strong Retirement ReadinessFebruary 2015
The New Imperatives: Gaining An Edge in North American AssetManagementDecember 2014
The Trillion-Dollar Convergence: Capturing the Next Wave of Growth in Alternative InvestmentsAugust 2014
Blending Science with Art to Capture Growth in U.S. Retail AssetManagementJuly 2014
Capturing the Rapidly Growing DC Investment-Only Opportunity: The Timefor Decisive Action Is NowMay 2014
Searching for Profitable Growth in Asset Management: It’s About More ThanInvestment AlphaOctober 2013
Defined Contribution Plan Administration: Strategies for Growth in theChallenging Recordkeeping MarketApril 2013

34 Navigating the Shifting Terrain of North American Asset Management
This report is based in part on insights gleaned from McKinsey’s “Performance Lens”
proprietary knowledge suite, which provides a granular perspective on growth and
profitability in the asset management industry.
Global Growth Cube
The Global Growth Cube is grounded in the understanding that asset growth, flows and rev-
enue trends vary greatly across the major regions of the world, reflecting fundamental differ-
ences in market maturity, industry structure and regulatory frameworks.
To provide deep insights on where to compete and to help asset managers make effective
strategic growth, resource allocation, and product decisions, the Global Growth Cube dis-
sects growth and revenue trends into over 4,000 micro-segments across 44 regions and
countries, nine client segments, 12 asset classes, and five product vehicles.
Global Asset Management Survey
The Global Asset Management Survey is the leading survey of its kind in asset management,
with unrivaled coverage (over 300 participants representing 60% of AUM globally and over
100 participants and 75% of AUM in North America), data quality and depth (8,000 busi-
ness performance benchmarks), and the longest track record in the industry.
Now in its 14th year, the survey helps asset managers assess their operational effectiveness
versus relevant peers and identifies actions to improve growth and profitability.
Sales Alpha
McKinsey’s Sales Alpha methodology measures the value-add of sales and marketing
(adjusting for investment performance), utilizing a factor analysis of over 10,000 retail and in-
stitutional products.
This tool conducts detailed fund-level analyses of gross sales, redemptions and net flow
metrics that are aggregated at the channel and company level to help asset managers iden-
tify specific opportunities to improve distribution effectiveness and stimulate faster growth.
Alternatives Survey
McKinsey’s bi-annual Alternatives Survey provides detailed insights into alternatives
usage of institutional investors by client segment and sub-asset class. In 2013, over
300 institutions, representing a broad range of segments and sizes and collectively
managing $2.7 trillion in AUM, took part in the survey.
Additional information regarding McKinsey’s proprietary knowledge of the asset man-
agement industry is available at www.mckinseyperformancelens.com, or by email at
Performance LensWealth & Asset Management
About the Research for This Report

DISCLAIMER
McKinsey is not an investment advisor, and thus McKinsey
cannot and does not provide investment advice. Opinions
and information contained in this material constitute our
judgment as of the date of this material and are subject to
change without notice. They do not take into account your
individual circumstances, objectives, or needs. Nothing
herein is intended to serve as investment advice, or a
recommendation of any particular transaction or
investment, any type of transaction or investment, the
merits of purchasing or selling securities, or an invitation or
inducement to engage in investment activity. While this
material is based on sources believed to be reliable,
McKinsey does not warrant its completeness or accuracy

Financial Services PracticeNovember 2015Copyright © McKinsey & Companywww.mckinsey.com/clientservice/financial_services