financial services - saint paul, minnesota root...accounting services · comprehensive annual...
TRANSCRIPT
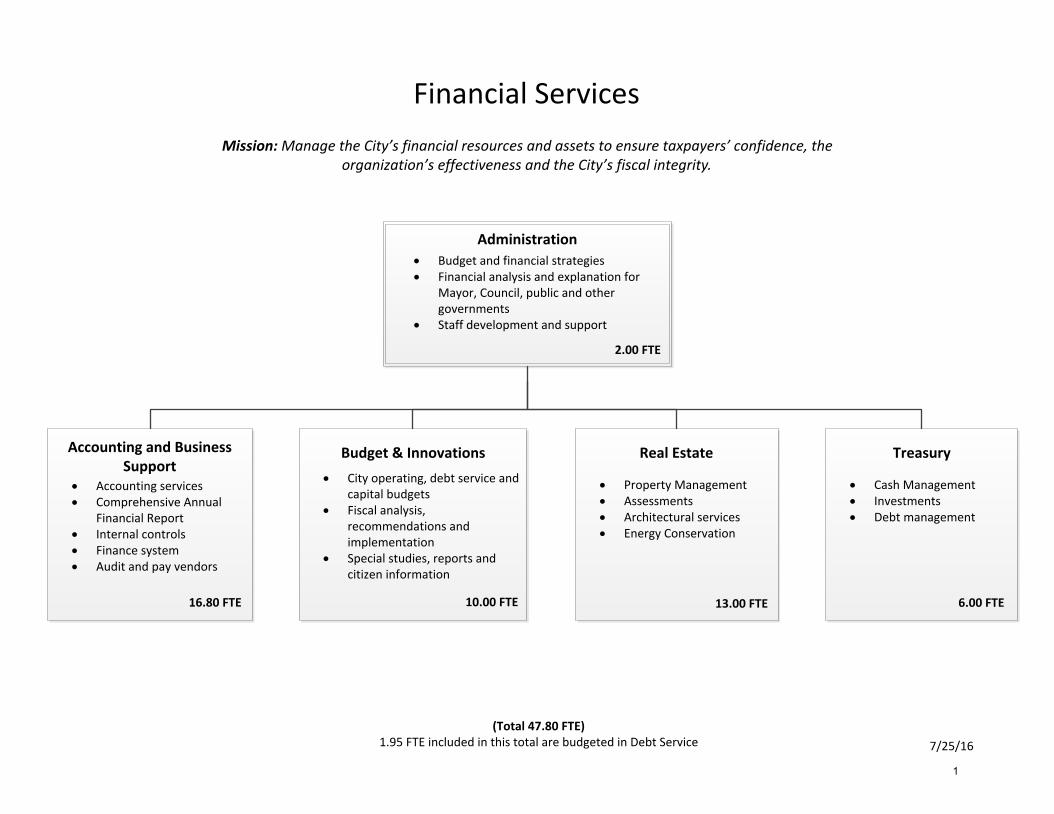
Financial Services
Mission: Manage the City’s financial resources and assets to ensure taxpayers’ confidence, the organization’s effectiveness and the City’s fiscal integrity.
Administration
· Budget and financial strategies· Financial analysis and explanation for
Mayor, Council, public and othergovernments
· Staff development and support
2.00 FTE
· Accounting services· Comprehensive Annual
Financial Report· Internal controls· Finance system· Audit and pay vendors
16.80 FTE
· City operating, debt service and
capital budgets· Fiscal analysis,
recommendations andimplementation
· Special studies, reports andcitizen information
10.00 FTE
· Property Management· Assessments· Architectural services· Energy Conservation
13.00 FTE
· Cash Management· Investments· Debt management
6.00 FTE
(Total 47.80 FTE)1.95 FTE included in this total are budgeted in Debt Service 7/25/16
Real Estate TreasuryAccounting and Business Support
Budget & Innovations
1
Department Description:
Department Goals
Department Facts
● Total General Fund Budget: $3,933,030 Recent Accomplishments
● Total Special Fund Budget: $20,908,245
● Total FTEs: 45.85
● Saint Paul's operating, capital and debt service budgets total over $579 million.
●Received the Government Finance Officers Association (GFOA) Certificate of Achievement
for excellence in reporting for the 38th consecutive year.
●Maintained the city's AAA bond rating from Standard and Poor's and Fitch Ratings due to a
diverse economy, strong financial management and improving debt burden.
●Successfully sold GO, "Green" Sewer Revenue and lease revenue bonds ($28.5 million YTD
in FY16),with historically low interest rates, using various financing tools.
●Led the collaboration with Bloomberg What Works Cities to bring best-in-class open data,
performance management, results-driven contracting practices to Saint Paul.
● Supported the Public Works Transformation Initiative which dramatically improved winter
street maintenance services, communication and organizational design. ●Successfully led
the effort to participate in the Living Cities City Accelerator program to support the
development of green stormwater infrastructure in new development projects.
● OFS processes over $250 million of annual payments to vendors.
● Saint Paul is one of only 215 municipalities nationally with a AAA bond rating.
● OFS manages over $250 million of cash balances and $550 million debt portfolio.
● OFS annually processes $50m+ in assessment and service charges against 83,000
parcels of land.
2017 Proposed Budget
Office of Financial Services
The Office of Financial Services (OFS) plays a vital role in supporting city operations. OFS provides services in four key areas:
Budget and Innovation prepares, implements and monitors annual operating, debt service and capital budgets; provides fiscal analysis and projections for the Mayor and City Council;
provides management, guidance, and facilitation support to city-wide innovation projects.
Accounting and Business Support ensures that all financial transactions and accounting practices conform to generally accepted accounting principles, state law, and city administrative
code and policies; provides business support to city departments related to the implementation, administration and maintenance of the COMET project.
Treasury manages and invests the City's cash resources to earn market rate of return; and manages the City's debt portfolio to ensure competitive rates and timely repayment.
Real Estate Management Services provides property acquisition and disposal services, property management, facility design, space planning, and construction management; facilitates
energy conservation efforts; and processes assessment approvals, billings, and collections.
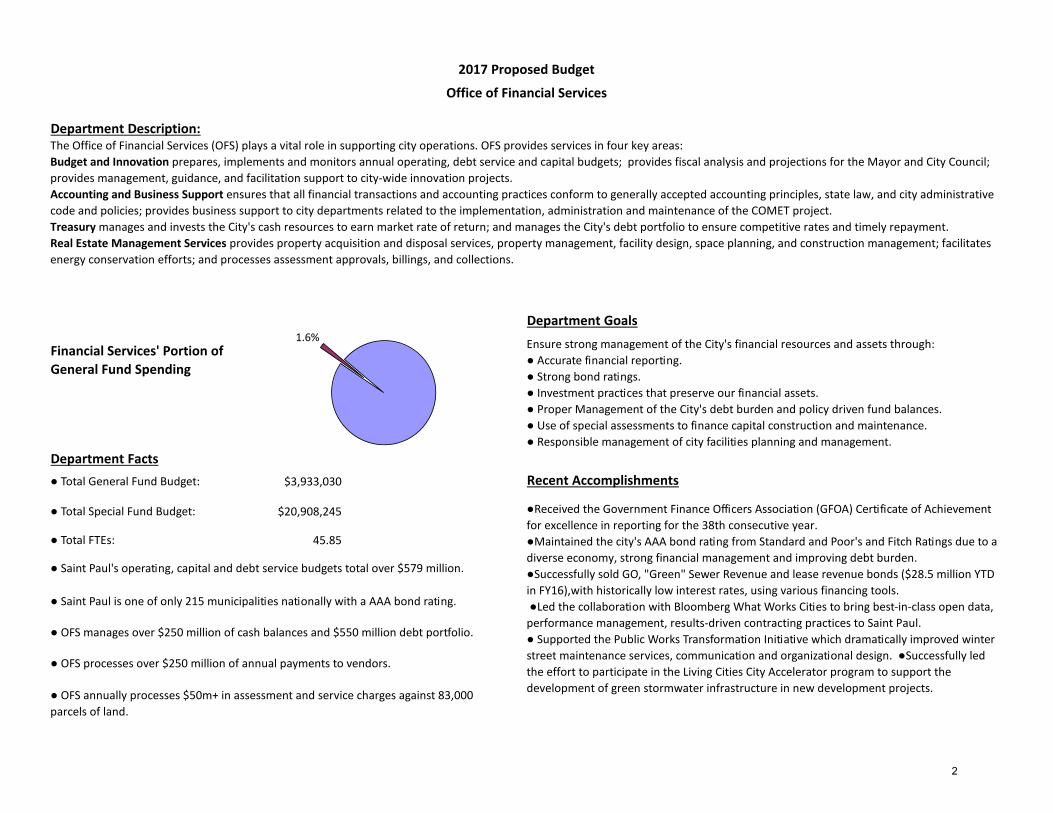
Financial Services' Portion of
General Fund Spending
Ensure strong management of the City's financial resources and assets through:
● Accurate financial reporting.
● Strong bond ratings.
● Investment practices that preserve our financial assets.
● Proper Management of the City's debt burden and policy driven fund balances.
● Use of special assessments to finance capital construction and maintenance.
● Responsible management of city facilities planning and management.
1.6%
2

Fiscal Summary
2015
Actual
2016
Adopted
2017
Proposed Change % Change
2016
Adopted
FTE
2017
Proposed
FTE
Spending
100: General Fund 3,589,074 3,867,555 3,933,030 65,475 1.7% 28.00 27.80
211: General Govt Special Projects 1,983,417 1,770,380 1,930,400 160,020 9.0% - -
215: Assessments 7,078,559 11,992,945 8,104,551 (3,888,394) -32.4% 1.00 1.00
700: Internal Borrowing 172,465 2,916,901 3,378,444 461,543 15.8% - -
710: Central Service Internal 6,995,519 7,548,092 7,494,850 (53,242) -0.7% 17.05 17.05
Total 19,819,034 28,095,873 24,841,275 (3,254,598) -11.6% 46.05 45.85
Financing
100: General Fund 279,827 448,133 448,133 - 0.0%
211: General Govt Special Projects 1,975,878 1,770,380 1,930,400 160,020 9.0%
215: Assessments 6,493,830 11,992,945 8,104,551 (3,888,394) -32.4%
700: Internal Borrowing 165,872 2,916,901 3,378,444 461,543 15.8%
710: Central Service Internal 7,614,229 7,548,092 7,494,850 (53,242) -0.7%
Total 16,529,636 24,676,451 21,356,378 (3,320,073) -13.5%
Budget Changes Summary
2017 Proposed Budget
Office of Financial Services
The proposed budget continues to reflect OFS's key priorities, including aligning staff to manage central accounting functions in the most effective and efficient manner possible, to
solidify the Innovation Team as the primary resource for city-wide innovation and process improvement projects, and to ensure continued strong financial management of city resources.
3

100: General Fund
Spending Financing FTE
Current Service Level Adjustments 81,567 - -
Subtotal: 81,567 - -
Staffing Realignment
A small portion of an FTE has been reclassified as a 0.8 FTE to better align with work assignments.
Staffing adjustment (16,092) - (0.20)
Subtotal: (16,092) - (0.20)
Fund 100 Budget Changes Total 65,475 - (0.20)
Office of Financial Services
Change from 2016 Adopted
4
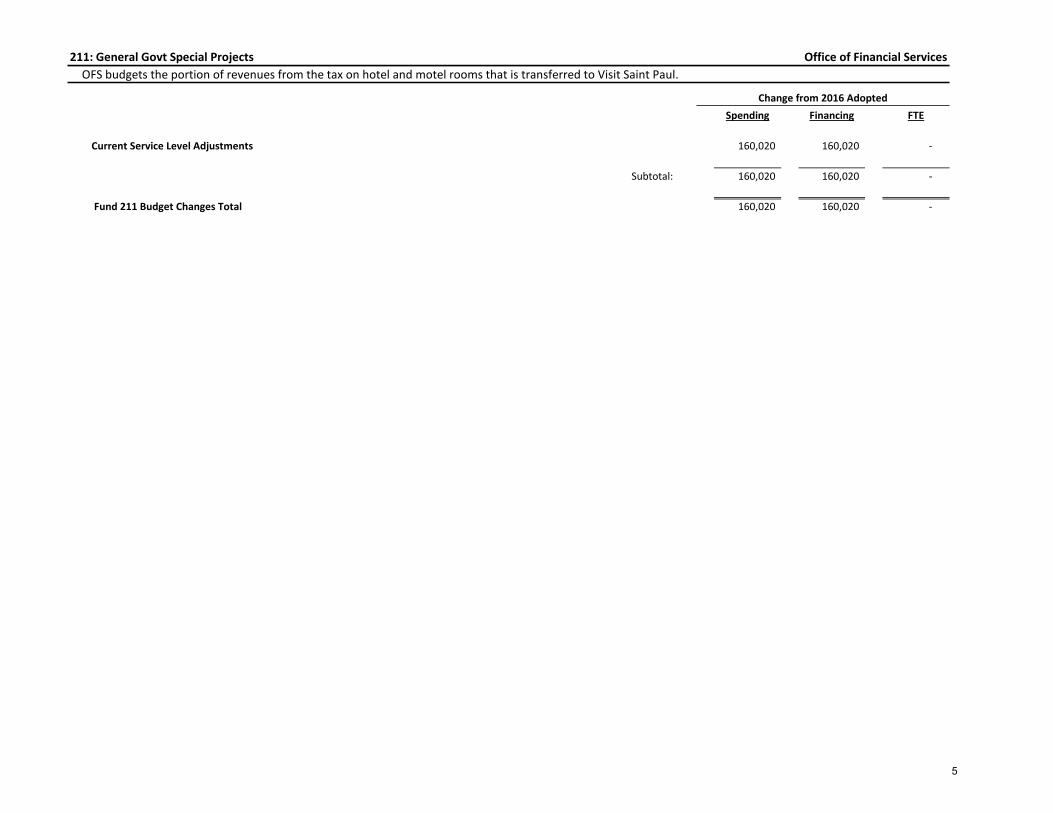
211: General Govt Special Projects
Spending Financing FTE
Current Service Level Adjustments 160,020 160,020 -
Subtotal: 160,020 160,020 -
Fund 211 Budget Changes Total 160,020 160,020 -
Office of Financial Services
Change from 2016 Adopted
OFS budgets the portion of revenues from the tax on hotel and motel rooms that is transferred to Visit Saint Paul.
5
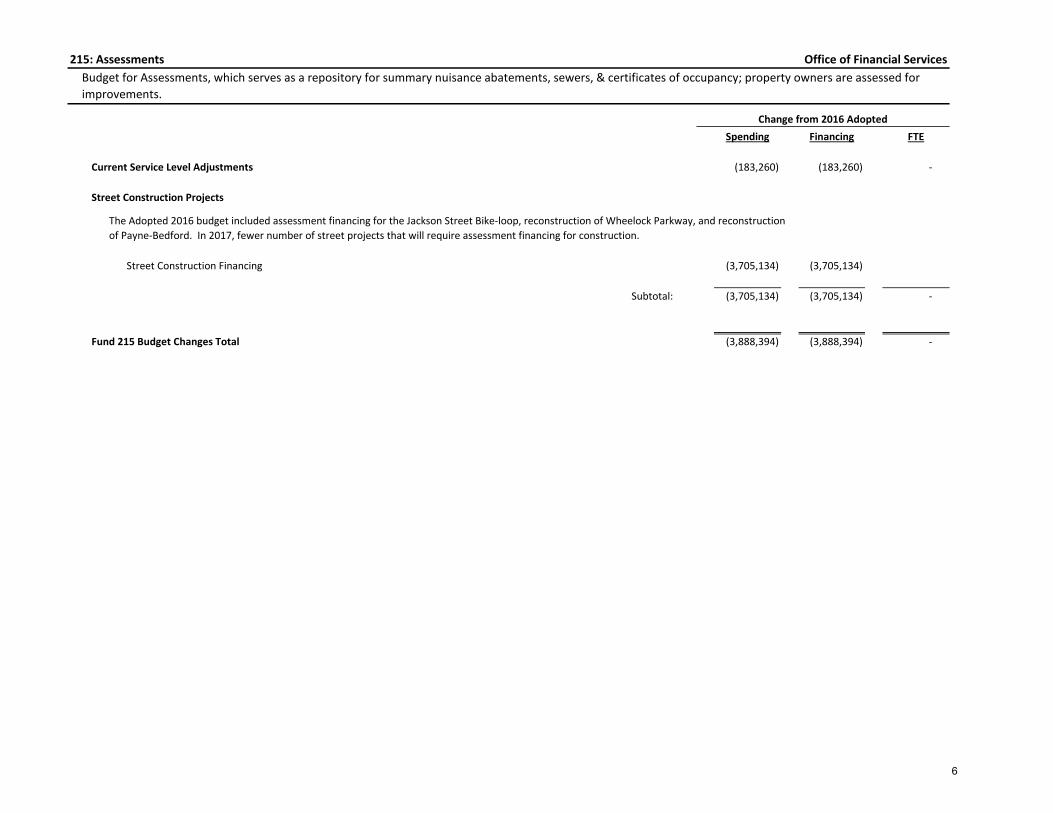
215: Assessments
Spending Financing FTE
Current Service Level Adjustments (183,260) (183,260) -
Street Construction Projects
Street Construction Financing (3,705,134) (3,705,134)
Subtotal: (3,705,134) (3,705,134) -
Fund 215 Budget Changes Total (3,888,394) (3,888,394) -
Office of Financial Services
Budget for Assessments, which serves as a repository for summary nuisance abatements, sewers, & certificates of occupancy; property owners are assessed for
improvements.
Change from 2016 Adopted
The Adopted 2016 budget included assessment financing for the Jackson Street Bike-loop, reconstruction of Wheelock Parkway, and reconstruction
of Payne-Bedford. In 2017, fewer number of street projects that will require assessment financing for construction.
6
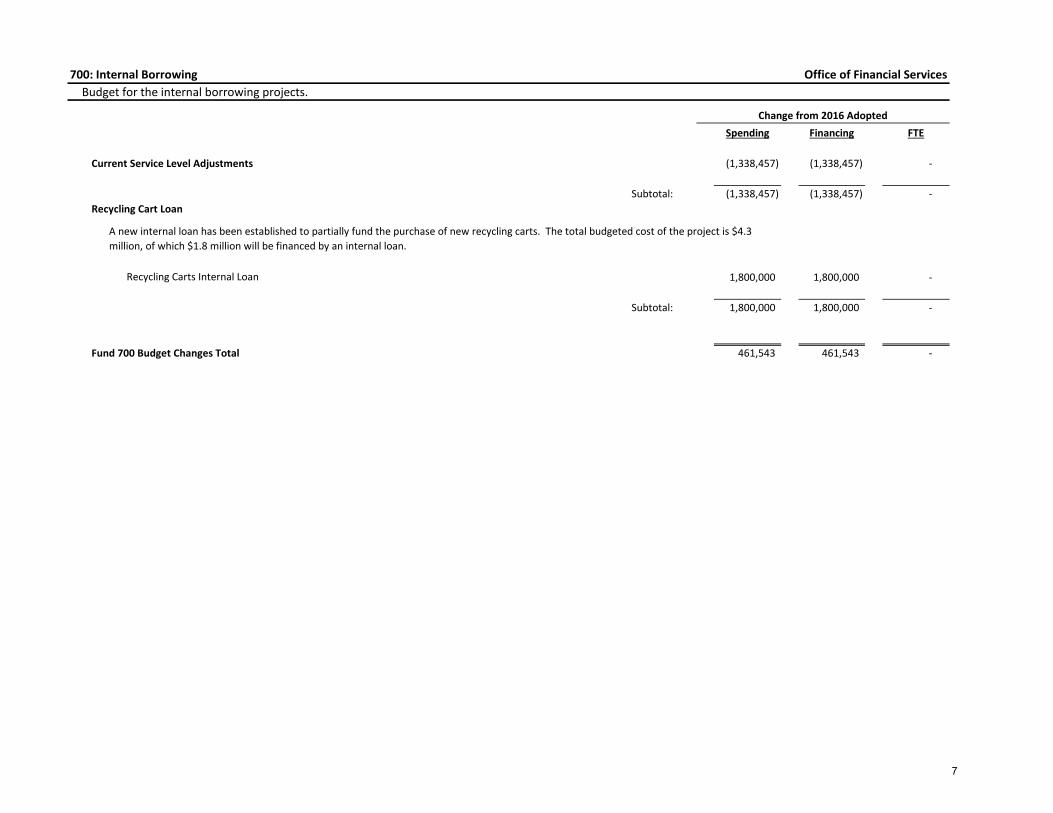
700: Internal Borrowing
Spending Financing FTE
Current Service Level Adjustments (1,338,457) (1,338,457) -
Subtotal: (1,338,457) (1,338,457) -
Recycling Cart Loan
Recycling Carts Internal Loan 1,800,000 1,800,000 -
Subtotal: 1,800,000 1,800,000 -
Fund 700 Budget Changes Total 461,543 461,543 -
Budget for the internal borrowing projects.
Change from 2016 Adopted
Office of Financial Services
A new internal loan has been established to partially fund the purchase of new recycling carts. The total budgeted cost of the project is $4.3
million, of which $1.8 million will be financed by an internal loan.
7
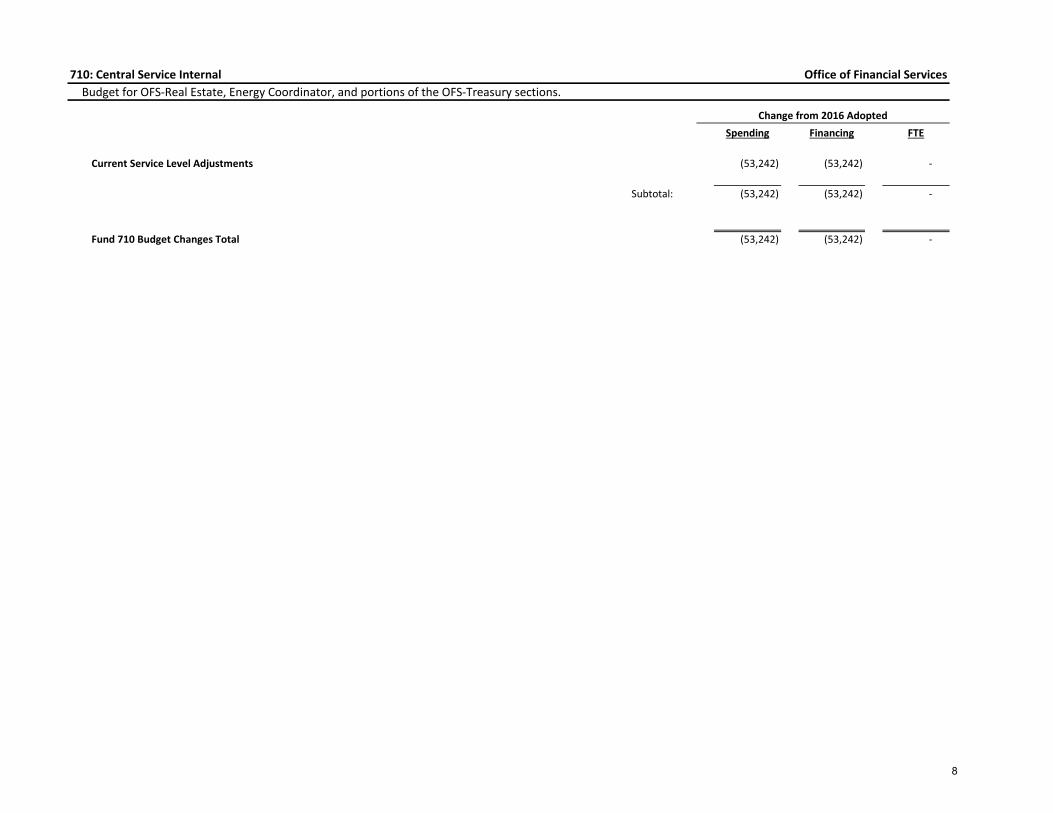
710: Central Service Internal
Spending Financing FTE
Current Service Level Adjustments (53,242) (53,242) -
Subtotal: (53,242) (53,242) -
Fund 710 Budget Changes Total (53,242) (53,242) -
Office of Financial Services
Budget for OFS-Real Estate, Energy Coordinator, and portions of the OFS-Treasury sections.
Change from 2016 Adopted
8
Spending Reports 9

CITY OF SAINT PAULDepartment Budget Summary
(Spending and Financing)Department: Budget Year: 2017
2014Actuals
Change From2016
Adopted
2017Mayor's
Proposed
2016Adopted
2015Actuals
FINANCIAL SERVICES
Spending by FundCITY GENERAL FUND 3,532,936 3,589,074 3,867,555 3,933,030 65,475
GENERAL GOVT SPECIAL PROJECTS 1,888,160 1,983,417 1,770,380 1,930,400 160,020
ASSESSMENT FINANCING 6,899,019 7,078,599 11,992,945 8,104,551 (3,888,394)
INTERNAL BORROWING 350,972 172,465 2,916,901 3,378,444 461,543
CENTRAL SERVICE FUND 7,320,021 6,995,519 7,548,092 7,494,850 (53,242)
TOTAL SPENDING BY FUND 24,841,275 28,095,873 19,819,073 19,991,109 (3,254,598)
Spending by Major AccountEMPLOYEE EXPENSE 4,714,772 5,333,063 5,273,069 4,607,769 59,994 SERVICES 3,582,641 3,648,228 3,485,625 3,665,432 162,603 MATERIALS AND SUPPLIES 404,482 484,136 494,905 355,986 (10,769)PROGRAM EXPENSE 139,355 540,000 165,000 160,425 375,000 ADDITIONAL EXPENSES 1,927,141 2,017,875 1,857,855 1,983,417 160,020 CAPITAL OUTLAY 597,264 113,036 213,036 596,064 (100,000)DEBT SERVICE 120,414 3,898,444 3,326,901 99,686 571,543 OTHER FINANCING USES 8,505,041 8,806,493 13,279,483 8,350,294 (4,472,990)
TOTAL SPENDING BY MAJOR ACCOUNT 24,841,275 28,095,873 19,819,073 19,991,109 (3,254,598)
Financing by Major AccountTAXES 2,137,482 2,085,400 1,925,380 2,130,589 160,020
LICENSE AND PERMIT 19,157 15,000 15,000 9,500
INTERGOVERNMENTAL REVENUE 15,000 15,000
CHARGES FOR SERVICES 7,420,387 7,066,394 7,168,318 7,749,523 (101,924)
ASSESSMENTS 6,492,198 6,745,000 7,570,000 6,705,319 (825,000)
INVESTMENT EARNINGS 304,201 523,400 434,173 204,501 89,227
MISCELLANEOUS REVENUE 110,801 (5,000) 5,000 (205,753) (10,000)
OTHER FINANCING SOURCES 34,337 4,911,183 7,543,580 135,208 (2,632,397)
TOTAL FINANCING BY MAJOR ACCOUNT 21,356,377 24,676,451 16,728,888 16,518,563 (3,320,074)
10
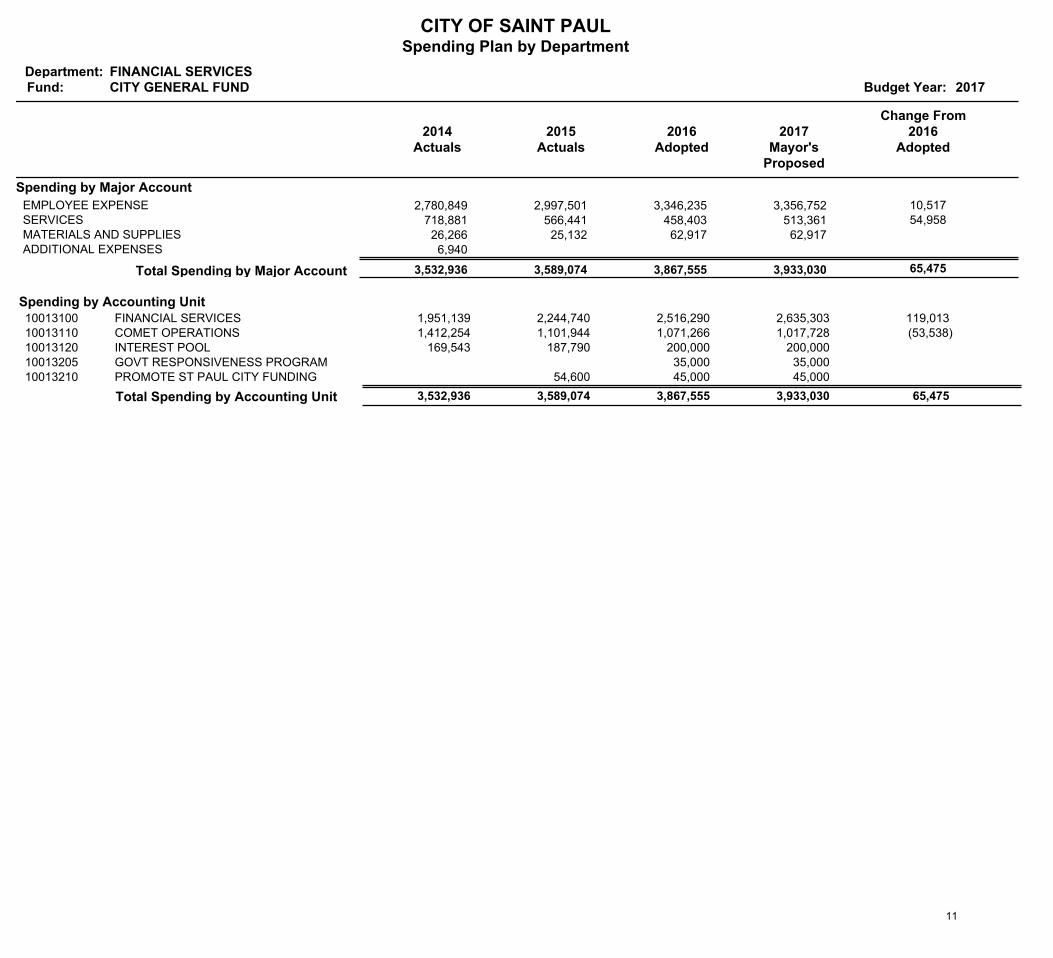
CITY OF SAINT PAULSpending Plan by Department
Department:Fund: Budget Year: 2017
FINANCIAL SERVICESCITY GENERAL FUND
2014Actuals
Change From2015
Actuals2016
Adopted2017
Mayor's Proposed
2016Adopted
Spending by Major Account
2,780,849 2,997,501 3,346,235 3,356,752 EMPLOYEE EXPENSE 10,517 718,881 566,441 458,403 513,361 SERVICES 54,958 26,266 25,132 62,917 62,917 MATERIALS AND SUPPLIES 6,940 ADDITIONAL EXPENSES
65,475 3,933,030 3,867,555 3,589,074 3,532,936 Total Spending by Major Account
Spending by Accounting UnitFINANCIAL SERVICES 1,951,139 2,635,303 2,516,290 2,244,740 10013100 119,013 COMET OPERATIONS 1,412,254 1,017,728 1,071,266 1,101,944 10013110 (53,538)INTEREST POOL 169,543 200,000 200,000 187,790 10013120GOVT RESPONSIVENESS PROGRAM 35,000 35,000 10013205PROMOTE ST PAUL CITY FUNDING 45,000 45,000 54,600 10013210
Total Spending by Accounting Unit 3,532,936 3,933,030 65,475 3,589,074 3,867,555
11
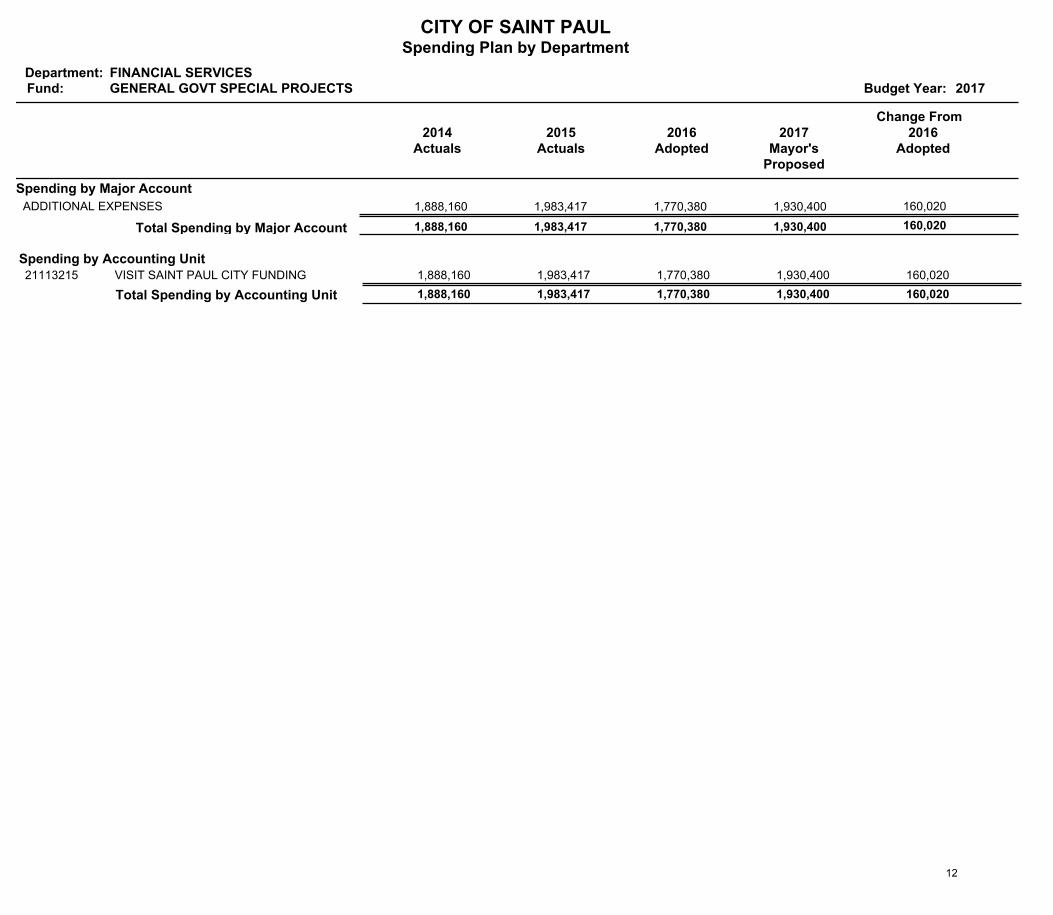
CITY OF SAINT PAULSpending Plan by Department
Department:Fund: Budget Year: 2017
FINANCIAL SERVICESGENERAL GOVT SPECIAL PROJECTS
2014Actuals
Change From2015
Actuals2016
Adopted2017
Mayor's Proposed
2016Adopted
Spending by Major Account
1,888,160 1,983,417 1,770,380 1,930,400 ADDITIONAL EXPENSES 160,020
160,020 1,930,400 1,770,380 1,983,417 1,888,160 Total Spending by Major Account
Spending by Accounting UnitVISIT SAINT PAUL CITY FUNDING 1,888,160 1,930,400 1,770,380 1,983,417 21113215 160,020
Total Spending by Accounting Unit 1,888,160 1,930,400 160,020 1,983,417 1,770,380
12
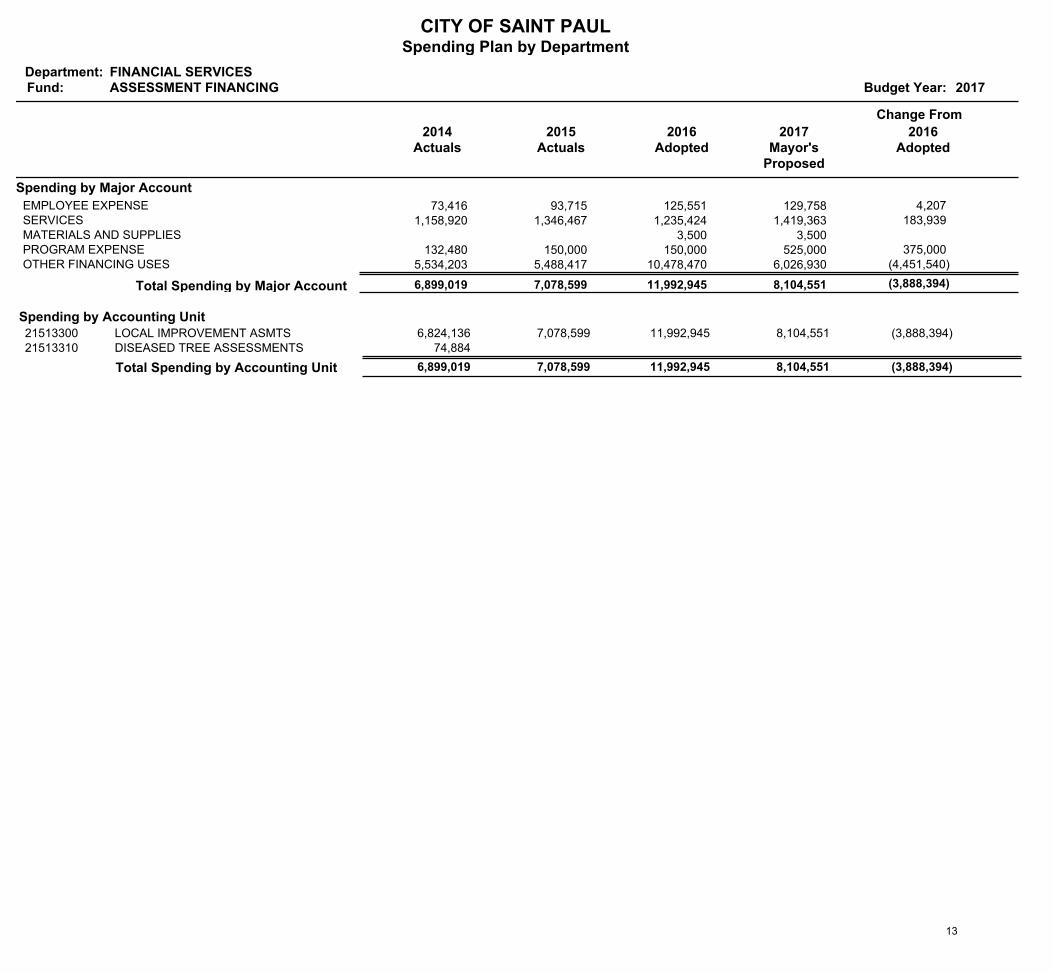
CITY OF SAINT PAULSpending Plan by Department
Department:Fund: Budget Year: 2017
FINANCIAL SERVICESASSESSMENT FINANCING
2014Actuals
Change From
2015Actuals
2016Adopted
2017Mayor's
Proposed
2016Adopted
Spending by Major Account
73,416 93,715 125,551 129,758 EMPLOYEE EXPENSE 4,207 1,158,920 1,346,467 1,235,424 1,419,363 SERVICES 183,939
3,500 3,500 MATERIALS AND SUPPLIES 132,480 150,000 150,000 525,000 PROGRAM EXPENSE 375,000
5,534,203 5,488,417 10,478,470 6,026,930 OTHER FINANCING USES (4,451,540)
(3,888,394) 8,104,551 11,992,945 7,078,599 6,899,019 Total Spending by Major Account
Spending by Accounting UnitLOCAL IMPROVEMENT ASMTS 6,824,136 8,104,551 11,992,945 7,078,599 21513300 (3,888,394)DISEASED TREE ASSESSMENTS 74,884 21513310
Total Spending by Accounting Unit 6,899,019 8,104,551 (3,888,394) 7,078,599 11,992,945
13

CITY OF SAINT PAULSpending Plan by Department
Department:Fund: Budget Year: 2017
FINANCIAL SERVICESINTERNAL BORROWING
2014Actuals
Change From
2015Actuals
2016Adopted
2017Mayor's
Proposed
2016Adopted
Spending by Major Account
1 SERVICES 32,041 87,475 87,475 ADDITIONAL EXPENSES 18,880 9,940 2,666,901 3,128,444 DEBT SERVICE 461,543
300,050 162,525 162,525 162,525 OTHER FINANCING USES
461,543 3,378,444 2,916,901 172,465 350,972 Total Spending by Major Account
Spending by Accounting UnitWEST MIDWAY TIF LOAN 309,343 250,000 250,000 117,638 70013701RIVOLI BLUFF LOAN 1,351 70013702LOWERTOWN BALLPARK LOAN 8,236 138,000 54,472 70013704 138,000 FRIENDS OF SPPL LOAN 354,812 97 70013705 354,812 ENERGY INITIATIVE LOANS 32,042 145,269 166,901 258 70013706 (21,632)POLICE RMS LOAN 300,000 2,500,000 70013707 (2,200,000)RECYCLING CART LOAN 2,190,363 70013708 2,190,363
Total Spending by Accounting Unit 350,972 3,378,444 461,543 172,465 2,916,901
14
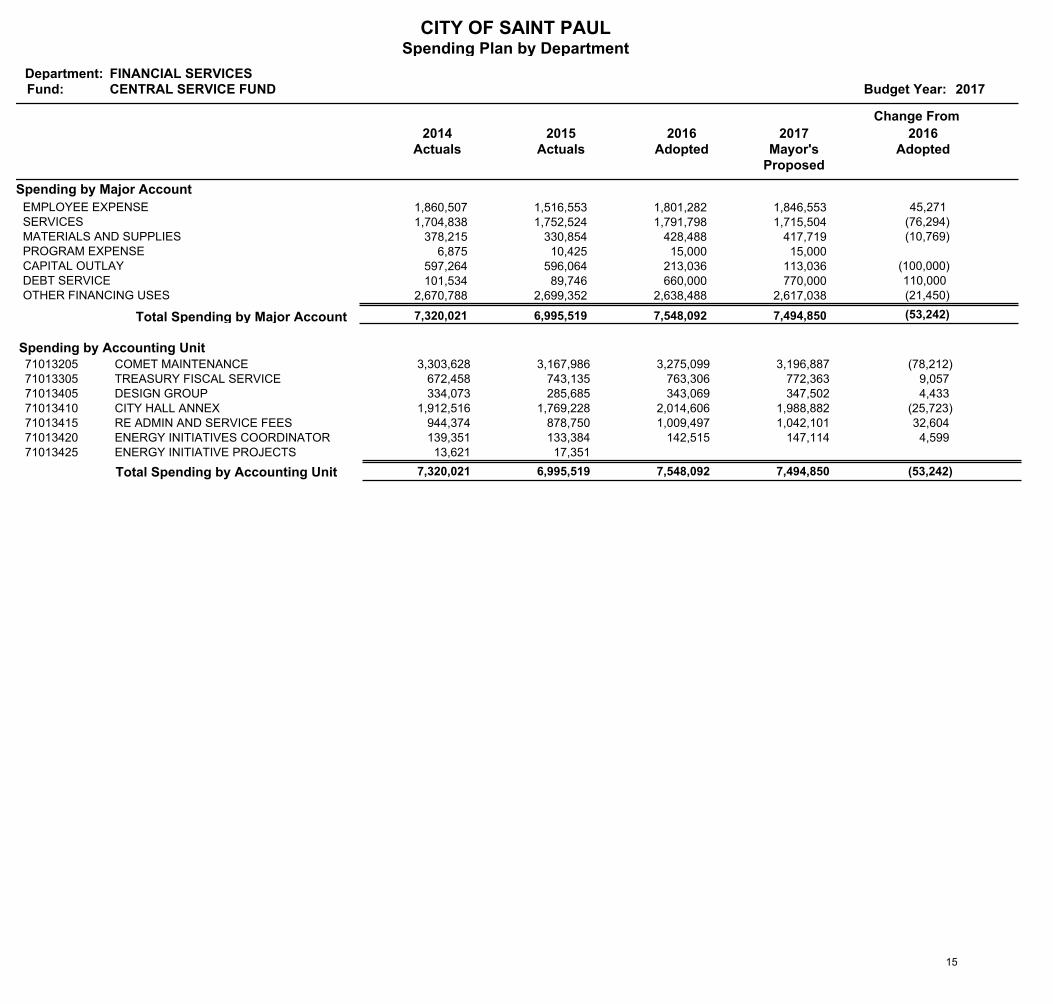
CITY OF SAINT PAULSpending Plan by Department
Department:Fund: Budget Year: 2017
FINANCIAL SERVICESCENTRAL SERVICE FUND
2014Actuals
Change From
2015Actuals
2016Adopted
2017Mayor's
Proposed
2016Adopted
Spending by Major Account
1,860,507 1,516,553 1,801,282 1,846,553 EMPLOYEE EXPENSE 45,271 1,704,838 1,752,524 1,791,798 1,715,504 SERVICES (76,294)
378,215 330,854 428,488 417,719 MATERIALS AND SUPPLIES (10,769) 6,875 10,425 15,000 15,000 PROGRAM EXPENSE
597,264 596,064 213,036 113,036 CAPITAL OUTLAY (100,000) 101,534 89,746 660,000 770,000 DEBT SERVICE 110,000
2,670,788 2,699,352 2,638,488 2,617,038 OTHER FINANCING USES (21,450)
(53,242) 7,494,850 7,548,092 6,995,519 7,320,021 Total Spending by Major Account
Spending by Accounting UnitCOMET MAINTENANCE 3,303,628 3,196,887 3,275,099 3,167,986 71013205 (78,212)TREASURY FISCAL SERVICE 672,458 772,363 763,306 743,135 71013305 9,057 DESIGN GROUP 334,073 347,502 343,069 285,685 71013405 4,433 CITY HALL ANNEX 1,912,516 1,988,882 2,014,606 1,769,228 71013410 (25,723)RE ADMIN AND SERVICE FEES 944,374 1,042,101 1,009,497 878,750 71013415 32,604 ENERGY INITIATIVES COORDINATOR 139,351 147,114 142,515 133,384 71013420 4,599 ENERGY INITIATIVE PROJECTS 13,621 17,351 71013425
Total Spending by Accounting Unit 7,320,021 7,494,850 (53,242) 6,995,519 7,548,092
15
Financing Reports 16
CITY OF SAINT PAULFinancing by Company and Department
Budget Year:
CITY OF SAINT PAULCompany:
Department: FINANCIAL SERVICES
Change From
2016Adopted
2015Actuals
2014Actuals
Account Account Description
2016Adopted
2017Mayor's
Proposed
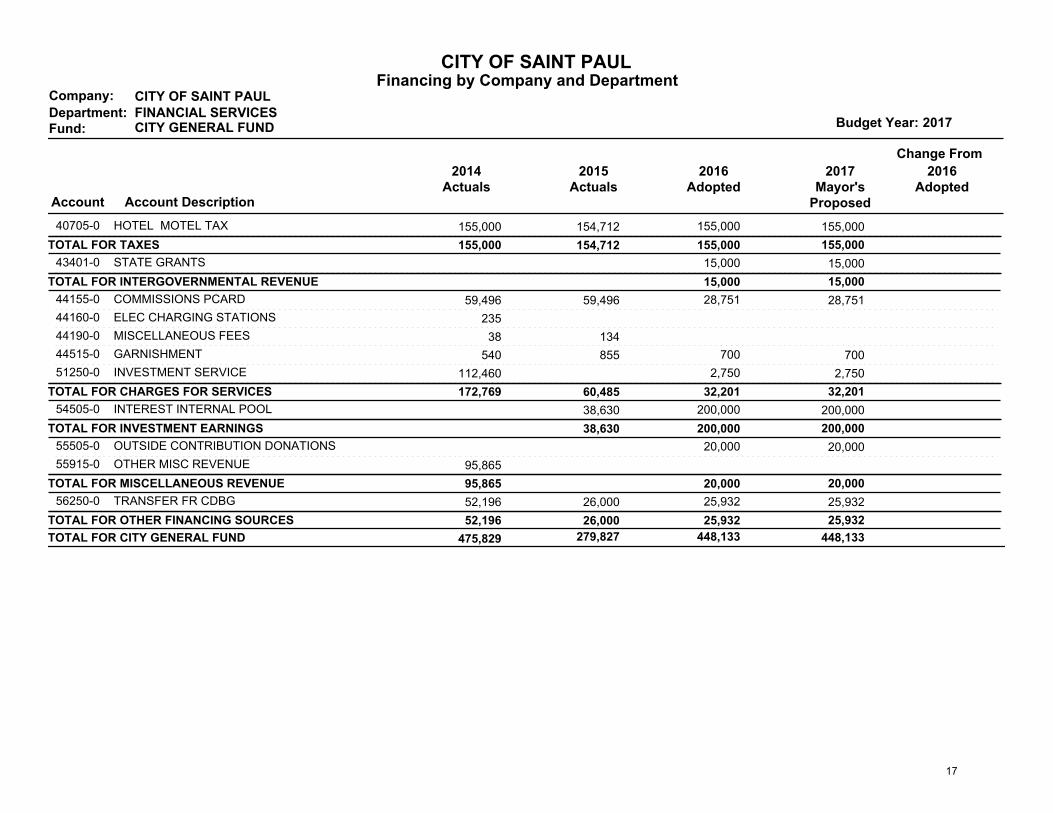
Fund: CITY GENERAL FUND 2017
HOTEL MOTEL TAX40705-0 155,000 154,712 155,000 155,000
TOTAL FOR TAXES 155,000 154,712 155,000 155,000
STATE GRANTS43401-0 15,000 15,000
TOTAL FOR INTERGOVERNMENTAL REVENUE 15,000 15,000
COMMISSIONS PCARD44155-0 59,496 59,496 28,751 28,751
ELEC CHARGING STATIONS44160-0 235
MISCELLANEOUS FEES44190-0 38 134
GARNISHMENT44515-0 540 855 700 700
INVESTMENT SERVICE51250-0 112,460 2,750 2,750
TOTAL FOR CHARGES FOR SERVICES 172,769 60,485 32,201 32,201
INTEREST INTERNAL POOL54505-0 38,630 200,000 200,000
TOTAL FOR INVESTMENT EARNINGS 38,630 200,000 200,000
OUTSIDE CONTRIBUTION DONATIONS55505-0 20,000 20,000
OTHER MISC REVENUE55915-0 95,865
TOTAL FOR MISCELLANEOUS REVENUE 95,865 20,000 20,000
TRANSFER FR CDBG56250-0 52,196 26,000 25,932 25,932
TOTAL FOR OTHER FINANCING SOURCES 52,196 26,000 25,932 25,932
448,133 TOTAL FOR CITY GENERAL FUND 475,829 279,827 448,133
17
CITY OF SAINT PAULFinancing by Company and Department
Budget Year:
CITY OF SAINT PAULCompany:
Department: FINANCIAL SERVICES
Change From
2016Adopted
2015Actuals
2014Actuals
Account Account Description
2016Adopted
2017Mayor's
Proposed
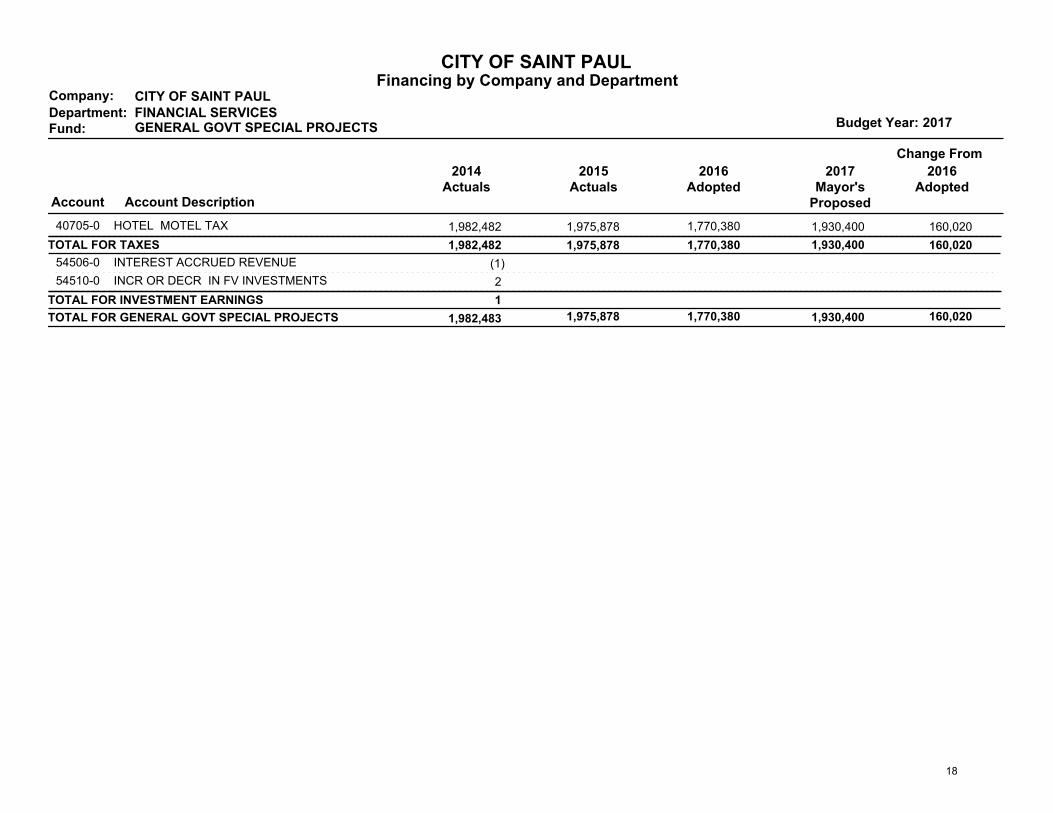
Fund: GENERAL GOVT SPECIAL PROJECTS 2017
HOTEL MOTEL TAX40705-0 160,020 1,982,482 1,975,878 1,770,380 1,930,400
160,020 TOTAL FOR TAXES 1,982,482 1,975,878 1,770,380 1,930,400
INTEREST ACCRUED REVENUE54506-0 (1)
INCR OR DECR IN FV INVESTMENTS54510-0 2
TOTAL FOR INVESTMENT EARNINGS 1
1,930,400 TOTAL FOR GENERAL GOVT SPECIAL PROJECTS 1,982,483 1,975,878 1,770,380 160,020
18
CITY OF SAINT PAULFinancing by Company and Department
Budget Year:
CITY OF SAINT PAULCompany:
Department: FINANCIAL SERVICES
Change From
2016Adopted
2015Actuals
2014Actuals
Account Account Description
2016Adopted
2017Mayor's
Proposed
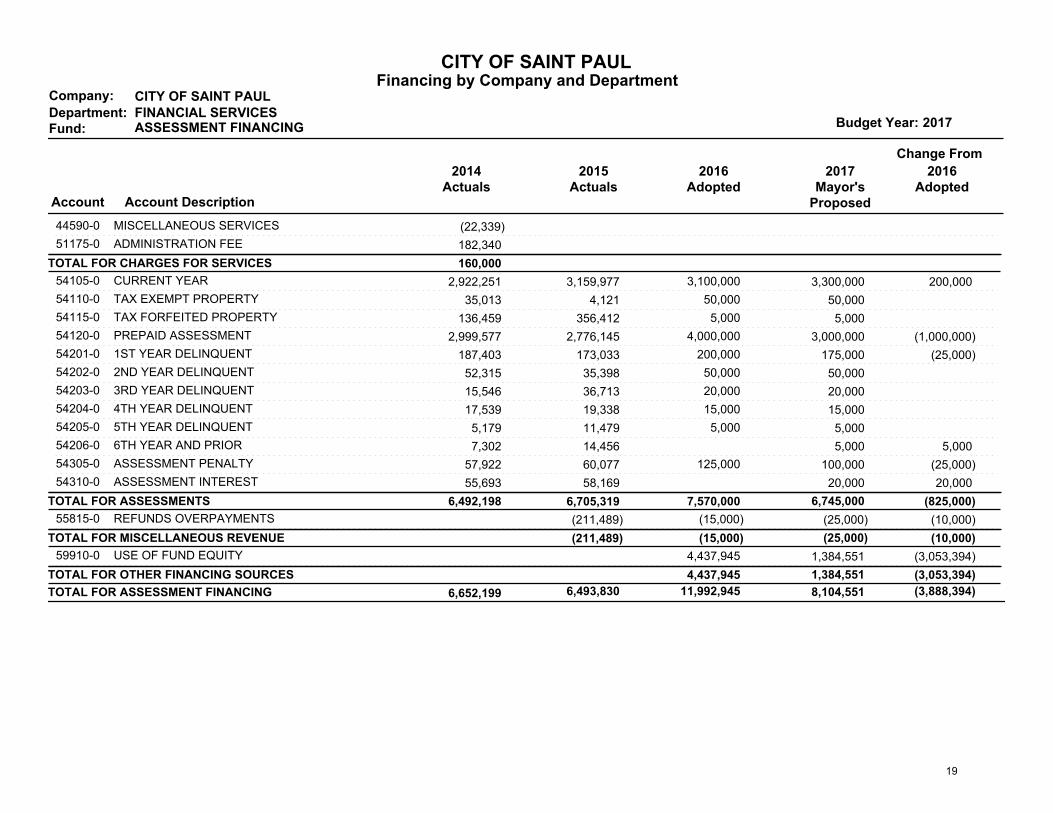
Fund: ASSESSMENT FINANCING 2017
MISCELLANEOUS SERVICES44590-0 (22,339)
ADMINISTRATION FEE51175-0 182,340
TOTAL FOR CHARGES FOR SERVICES 160,000
CURRENT YEAR54105-0 200,000 2,922,251 3,159,977 3,100,000 3,300,000
TAX EXEMPT PROPERTY54110-0 35,013 4,121 50,000 50,000
TAX FORFEITED PROPERTY54115-0 136,459 356,412 5,000 5,000
PREPAID ASSESSMENT54120-0 (1,000,000) 2,999,577 2,776,145 4,000,000 3,000,000
1ST YEAR DELINQUENT54201-0 (25,000) 187,403 173,033 200,000 175,000
2ND YEAR DELINQUENT54202-0 52,315 35,398 50,000 50,000
3RD YEAR DELINQUENT54203-0 15,546 36,713 20,000 20,000
4TH YEAR DELINQUENT54204-0 17,539 19,338 15,000 15,000
5TH YEAR DELINQUENT54205-0 5,179 11,479 5,000 5,000
6TH YEAR AND PRIOR54206-0 5,000 7,302 14,456 5,000
ASSESSMENT PENALTY54305-0 (25,000) 57,922 60,077 125,000 100,000
ASSESSMENT INTEREST54310-0 20,000 55,693 58,169 20,000
(825,000)TOTAL FOR ASSESSMENTS 6,492,198 6,705,319 7,570,000 6,745,000
REFUNDS OVERPAYMENTS55815-0 (10,000)(211,489) (15,000) (25,000)
(10,000)TOTAL FOR MISCELLANEOUS REVENUE (211,489) (15,000) (25,000)
USE OF FUND EQUITY59910-0 (3,053,394) 4,437,945 1,384,551
(3,053,394)TOTAL FOR OTHER FINANCING SOURCES 4,437,945 1,384,551
8,104,551 TOTAL FOR ASSESSMENT FINANCING 6,652,199 6,493,830 11,992,945 (3,888,394)
19
CITY OF SAINT PAULFinancing by Company and Department
Budget Year:
CITY OF SAINT PAULCompany:
Department: FINANCIAL SERVICES
Change From
2016Adopted
2015Actuals
2014Actuals
Account Account Description
2016Adopted
2017Mayor's
Proposed
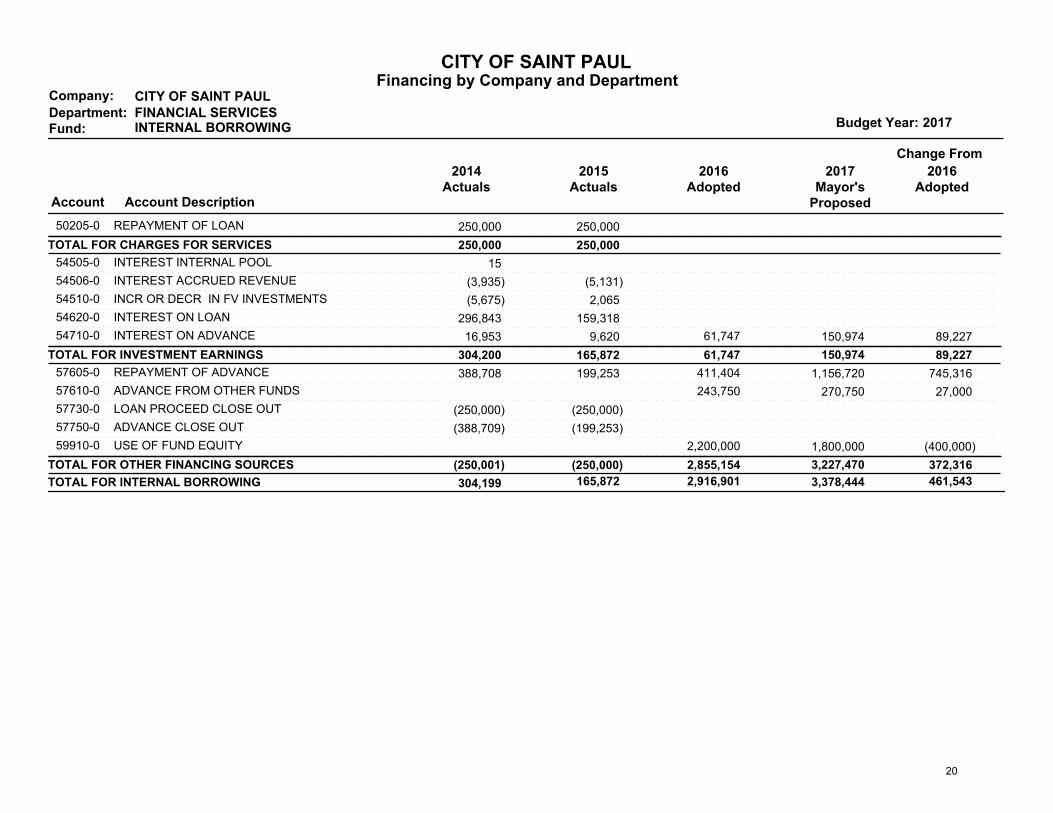
Fund: INTERNAL BORROWING 2017
REPAYMENT OF LOAN50205-0 250,000 250,000
TOTAL FOR CHARGES FOR SERVICES 250,000 250,000
INTEREST INTERNAL POOL54505-0 15
INTEREST ACCRUED REVENUE54506-0 (3,935) (5,131)
INCR OR DECR IN FV INVESTMENTS54510-0 (5,675) 2,065
INTEREST ON LOAN54620-0 296,843 159,318
INTEREST ON ADVANCE54710-0 89,227 16,953 9,620 61,747 150,974
89,227 TOTAL FOR INVESTMENT EARNINGS 304,200 165,872 61,747 150,974
REPAYMENT OF ADVANCE57605-0 745,316 388,708 199,253 411,404 1,156,720
ADVANCE FROM OTHER FUNDS57610-0 27,000 243,750 270,750
LOAN PROCEED CLOSE OUT57730-0 (250,000) (250,000)
ADVANCE CLOSE OUT57750-0 (388,709) (199,253)
USE OF FUND EQUITY59910-0 (400,000) 2,200,000 1,800,000
372,316 TOTAL FOR OTHER FINANCING SOURCES (250,001) (250,000) 2,855,154 3,227,470
3,378,444 TOTAL FOR INTERNAL BORROWING 304,199 165,872 2,916,901 461,543
20
CITY OF SAINT PAULFinancing by Company and Department
Budget Year:
CITY OF SAINT PAULCompany:
Department: FINANCIAL SERVICES
Change From
2016Adopted
2015Actuals
2014Actuals
Account Account Description
2016Adopted
2017Mayor's
Proposed
Fund: CENTRAL SERVICE FUND 2017
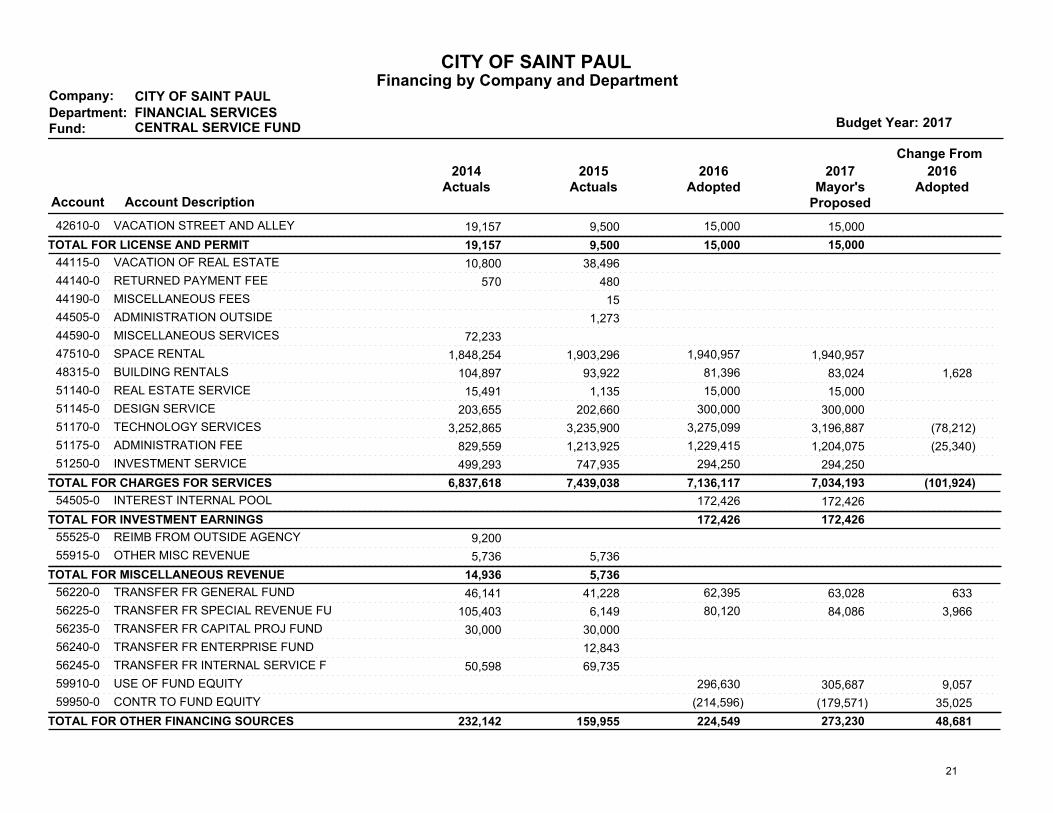
VACATION STREET AND ALLEY42610-0 19,157 9,500 15,000 15,000
TOTAL FOR LICENSE AND PERMIT 19,157 9,500 15,000 15,000
VACATION OF REAL ESTATE44115-0 10,800 38,496
RETURNED PAYMENT FEE44140-0 570 480
MISCELLANEOUS FEES44190-0 15
ADMINISTRATION OUTSIDE44505-0 1,273
MISCELLANEOUS SERVICES44590-0 72,233
SPACE RENTAL47510-0 1,848,254 1,903,296 1,940,957 1,940,957
BUILDING RENTALS48315-0 1,628 104,897 93,922 81,396 83,024
REAL ESTATE SERVICE51140-0 15,491 1,135 15,000 15,000
DESIGN SERVICE51145-0 203,655 202,660 300,000 300,000
TECHNOLOGY SERVICES51170-0 (78,212) 3,252,865 3,235,900 3,275,099 3,196,887
ADMINISTRATION FEE51175-0 (25,340) 829,559 1,213,925 1,229,415 1,204,075
INVESTMENT SERVICE51250-0 499,293 747,935 294,250 294,250
(101,924)TOTAL FOR CHARGES FOR SERVICES 6,837,618 7,439,038 7,136,117 7,034,193
INTEREST INTERNAL POOL54505-0 172,426 172,426
TOTAL FOR INVESTMENT EARNINGS 172,426 172,426
REIMB FROM OUTSIDE AGENCY55525-0 9,200
OTHER MISC REVENUE55915-0 5,736 5,736
TOTAL FOR MISCELLANEOUS REVENUE 14,936 5,736
TRANSFER FR GENERAL FUND56220-0 633 46,141 41,228 62,395 63,028
TRANSFER FR SPECIAL REVENUE FU56225-0 3,966 105,403 6,149 80,120 84,086
TRANSFER FR CAPITAL PROJ FUND56235-0 30,000 30,000
TRANSFER FR ENTERPRISE FUND56240-0 12,843
TRANSFER FR INTERNAL SERVICE F56245-0 50,598 69,735
USE OF FUND EQUITY59910-0 9,057 296,630 305,687
CONTR TO FUND EQUITY59950-0 35,025 (214,596) (179,571)
48,681 TOTAL FOR OTHER FINANCING SOURCES 232,142 159,955 224,549 273,230
21

CITY OF SAINT PAULFinancing by Company and Department
Budget Year:
CITY OF SAINT PAULCompany:
Department: FINANCIAL SERVICES
Change From
2016Adopted
2015Actuals
2014Actuals
Account Account Description
2016Adopted
2017Mayor's
Proposed
Fund: CENTRAL SERVICE FUND 2017
7,494,849 TOTAL FOR CENTRAL SERVICE FUND 7,103,853 7,614,229 7,548,092 (53,244)
24,676,451 21,356,377 (3,320,075)TOTAL FOR FINANCIAL SERVICES 16,529,635 16,518,563
22
CITY OF SAINT PAULFinancing Plan by Department
Department:Fund: Budget Year: 2017
FINANCIAL SERVICESCITY GENERAL FUND
2014Actuals
Change From
2015Actuals
2016Adopted
2017Mayor's
Proposed
2016Adopted
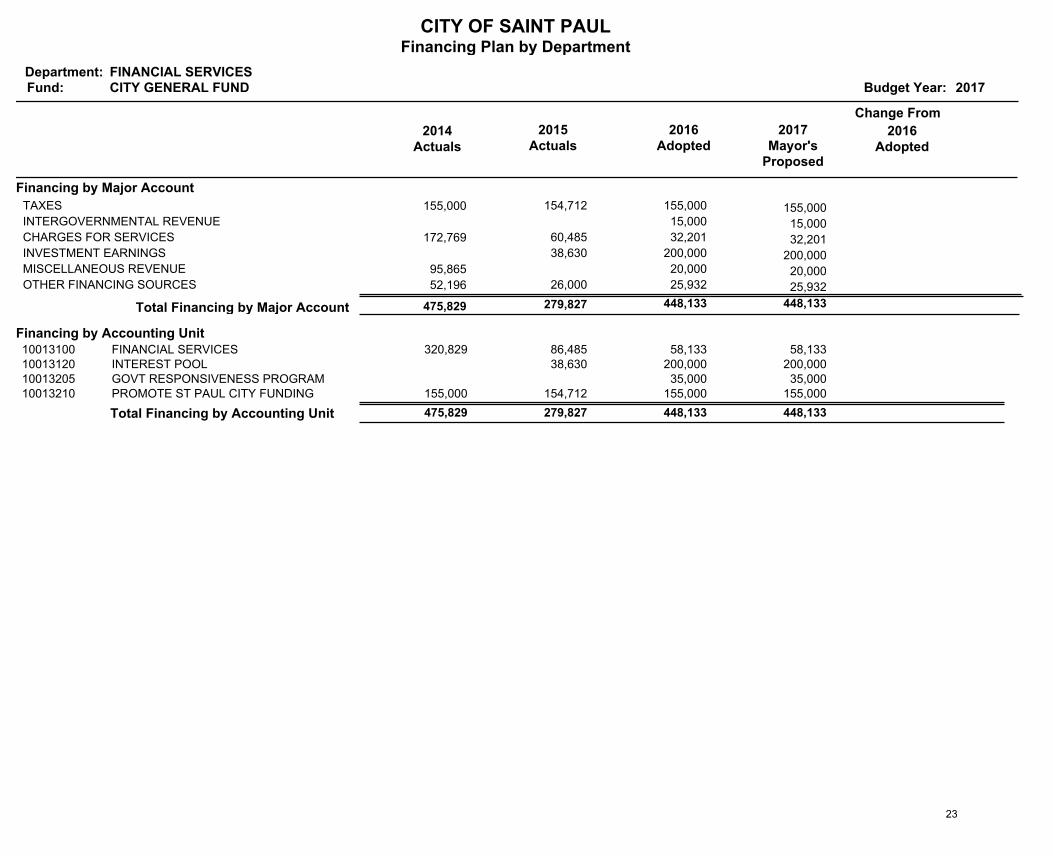
Financing by Major Account
155,000 154,712 155,000 155,000 TAXES
15,000 15,000 INTERGOVERNMENTAL REVENUE
172,769 60,485 32,201 32,201 CHARGES FOR SERVICES
38,630 200,000 200,000 INVESTMENT EARNINGS
95,865 20,000 20,000 MISCELLANEOUS REVENUE
52,196 26,000 25,932 25,932 OTHER FINANCING SOURCES
448,133 448,133 279,827 475,829 Total Financing by Major Account
Financing by Accounting UnitFINANCIAL SERVICES 320,829 58,133 58,133 86,485 10013100INTEREST POOL 200,000 200,000 38,630 10013120GOVT RESPONSIVENESS PROGRAM 35,000 35,000 10013205PROMOTE ST PAUL CITY FUNDING 155,000 155,000 155,000 154,712 10013210
Total Financing by Accounting Unit 475,829 448,133 279,827 448,133
23

CITY OF SAINT PAULFinancing Plan by Department
Department:Fund: Budget Year: 2017
FINANCIAL SERVICESGENERAL GOVT SPECIAL PROJECTS
2014Actuals
Change From
2015Actuals
2016Adopted
2017Mayor's
Proposed
2016Adopted
Financing by Major Account
1,982,482 1,975,878 1,770,380 1,930,400 TAXES 160,020
1 INVESTMENT EARNINGS
160,020 1,930,400 1,770,380 1,975,878 1,982,483 Total Financing by Major Account
Financing by Accounting UnitVISIT SAINT PAUL CITY FUNDING 1,982,482 1,930,400 1,770,380 1,975,878 21113215 160,020 GENERAL GOVT INACTIVE GRANTS 1 21113899
Total Financing by Accounting Unit 1,982,483 1,930,400 160,020 1,975,878 1,770,380
24

CITY OF SAINT PAULFinancing Plan by Department
Department:Fund: Budget Year: 2017
FINANCIAL SERVICESASSESSMENT FINANCING
2014Actuals
Change From
2015Actuals
2016Adopted
2017Mayor's
Proposed
2016Adopted
Financing by Major Account
160,000 CHARGES FOR SERVICES
6,492,198 6,705,319 7,570,000 6,745,000 ASSESSMENTS (825,000)
(211,489) (15,000) (25,000)MISCELLANEOUS REVENUE (10,000)
4,437,945 1,384,551 OTHER FINANCING SOURCES (3,053,394)
(3,888,394) 8,104,551 11,992,945 6,493,830 6,652,199 Total Financing by Major Account
Financing by Accounting UnitLOCAL IMPROVEMENT ASMTS 6,344,875 8,104,551 11,992,945 6,232,515 21513300 (3,888,394)DISEASED TREE ASSESSMENTS 105,722 99,764 21513310DOWNTOWN FACADE PROGRAM 162,570 128,137 21513315FIRE PROTECTION SYSTEMS 39,032 33,414 21513320
Total Financing by Accounting Unit 6,652,199 8,104,551 (3,888,394) 6,493,830 11,992,945
25
CITY OF SAINT PAULFinancing Plan by Department
Department:Fund: Budget Year: 2017
FINANCIAL SERVICESINTERNAL BORROWING
2014Actuals
Change From
2015Actuals
2016Adopted
2017Mayor's
Proposed
2016Adopted
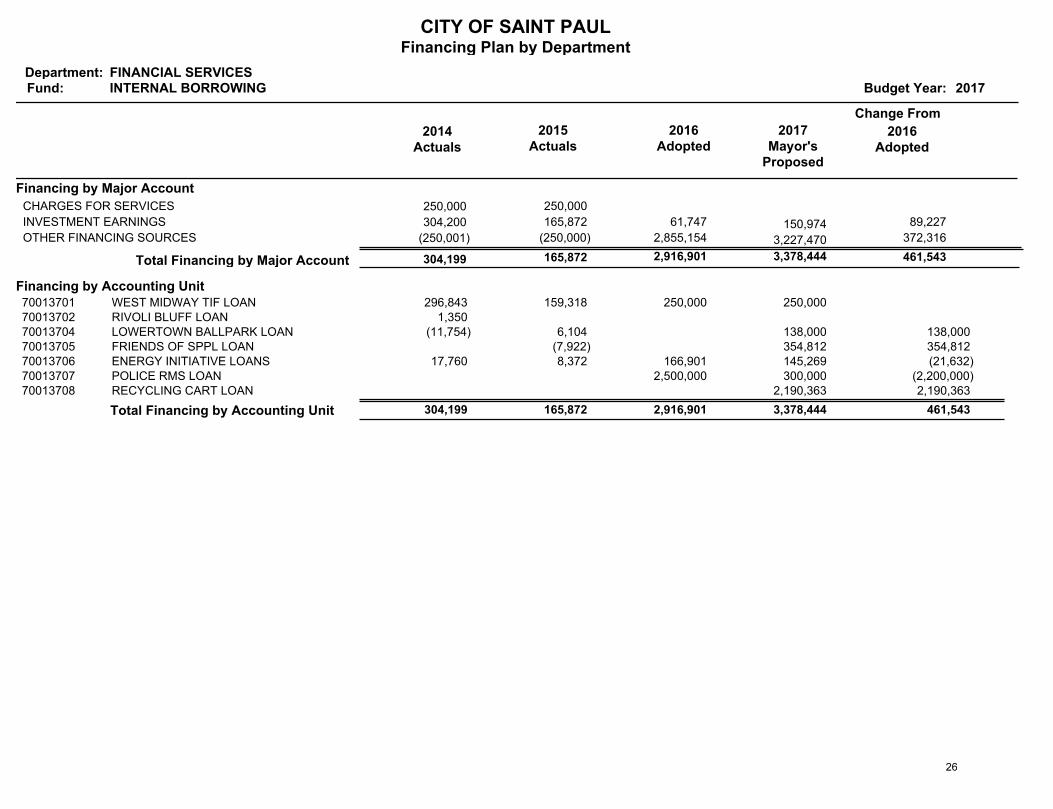
Financing by Major Account
250,000 250,000 CHARGES FOR SERVICES
304,200 165,872 61,747 150,974 INVESTMENT EARNINGS 89,227
(250,001) (250,000) 2,855,154 3,227,470 OTHER FINANCING SOURCES 372,316
461,543 3,378,444 2,916,901 165,872 304,199 Total Financing by Major Account
Financing by Accounting UnitWEST MIDWAY TIF LOAN 296,843 250,000 250,000 159,318 70013701RIVOLI BLUFF LOAN 1,350 70013702LOWERTOWN BALLPARK LOAN (11,754) 138,000 6,104 70013704 138,000 FRIENDS OF SPPL LOAN 354,812 (7,922)70013705 354,812 ENERGY INITIATIVE LOANS 17,760 145,269 166,901 8,372 70013706 (21,632)POLICE RMS LOAN 300,000 2,500,000 70013707 (2,200,000)RECYCLING CART LOAN 2,190,363 70013708 2,190,363
Total Financing by Accounting Unit 304,199 3,378,444 461,543 165,872 2,916,901
26

CITY OF SAINT PAULFinancing Plan by Department
Department:Fund: Budget Year: 2017
FINANCIAL SERVICESCENTRAL SERVICE FUND
2014Actuals
Change From2015
Actuals2016
Adopted2017
Mayor's Proposed
2016Adopted
Financing by Major Account
19,157 9,500 15,000 15,000 LICENSE AND PERMIT
6,837,618 7,439,038 7,136,117 7,034,193 CHARGES FOR SERVICES (101,924)
172,426 172,426 INVESTMENT EARNINGS
14,936 5,736 MISCELLANEOUS REVENUE
232,142 159,955 224,549 273,230 OTHER FINANCING SOURCES 48,681
(53,244) 7,494,849 7,548,092 7,614,229 7,103,853 Total Financing by Major Account
Financing by Accounting UnitCOMET MAINTENANCE 3,252,865 3,196,887 3,275,099 3,235,900 71013205 (78,212)TREASURY FISCAL SERVICE 499,863 772,363 763,306 748,415 71013305 9,057 DESIGN GROUP 304,793 300,000 300,000 232,675 71013405CITY HALL ANNEX 1,962,352 1,988,883 2,014,606 1,997,218 71013410 (25,724)RE ADMIN AND SERVICE FEES 976,307 1,089,602 1,052,566 1,264,330 71013415 37,036 ENERGY INITIATIVES COORDINATOR 101,937 147,114 142,515 129,955 71013420 4,599 ENERGY INITIATIVE PROJECTS 5,736 5,736 71013425
Total Financing by Accounting Unit 7,103,853 7,494,849 (53,244) 7,614,229 7,548,092
27