financial stability indicators: advantages and ... · pdf file70 financial stability...
TRANSCRIPT
FINANCIAL STABILITY INDICATORS: ADVANTAGES AND DISADVANTAGESOF THEIR USE IN THE ASSESSMENT OF FINANCIAL SYSTEM STABILITY 69
FINANCIAL STABILITY INDICATORS: ADVANTAGES AND DISADVANTAGES OF THEIRUSE IN THE ASSESSMENT OF FINANCIAL SYSTEM STABILITY
Adam Geršl and Jaroslav Heřmánek, CNB
This article sets out to describe and discuss the methodology of selected financial soundness and financial stabilityindicators, including the attempts to construct an aggregate financial stability indicator. The article also presentsto the public for the first time the values of the IMF's core Financial Soundness Indicators for the Czech Republicand other selected countries and tries to construct an aggregate financial stability indicator for the Czech bankingsector.
1. INTRODUCTION
In response to the global financial crises in the 1980s and 1990s, national and international institutions started tomonitor the soundness of the financial system more intensively. A wide range of instruments is used to assessfinancial system stability in analytical practice. These include in particular analysis of quantitative indicators offinancial system soundness and stability, including stress testing. These indicators strive to cover the issue offinancial stability as a systemic phenomenon and therefore concern not only financial institutions and markets,but also the real and government sectors as the main debtors of financial institutions, and also the financialinfrastructure (IMF and WB 2005).
Unlike price stability, financial stability has neither an established definition nor an aggregate indicator that thecentral bank can use as a measure of financial instability. Whereas at least some consensus has been reached onthe definition of financial stability, the construction of an aggregate financial stability indicator is still in theresearch and experimental phase.
This article discusses the financial soundness indicators used (sections 2 and 3) and some of the existing effortsto construct an aggregate financial stability indicator (section 4). Based on the international experience, anaggregate financial stability indicator is then experimentally compiled for the Czech Republic, focusing on thestability of the banking sector (section 5). As most of the indicators relate primarily to banks (deposit takers) askey institutions in the financial system, the quantitative assessment of financial stability concentrates on indicatorsof the soundness of the banking sector.
2. IMF FINANCIAL SOUNDNESS INDICATORS AND ECB MACRO-PRUDENTIAL INDICATORS
The objective of the set of financial stability indicators is to provide users with a rough idea of the soundness ofthe financial sector as a whole. It would be ideal, of course, if these indicators were comparable at theinternational level. To achieve this objective, the International Monetary Fund (IMF) in co-operation with nationalauthorities in 1999 (concurrently with the launching of the FSAP project) launched an initiative focused onformulating a definition and single methodology for the compilation of Financial Soundness Indicators (FSIs).124
This initiative resulted in the creation of a Compilation Guide on Financial Soundness Indicators, which wasdiscussed in detail in 2002 and 2003 and the final version of which was published in March 2006 (IMF 2006).
The total of 39 FSIs are divided into two groups (see Table 1). The first group consists of the main indicators (thecore set) relating to the banking sector (12 indicators). The remaining 27 recommended indicators belong to thesecond group (the encouraged set), which includes some other banking sector indicators, but also indicators fromnon-bank financial institutions, non-financial corporations, households, financial markets and property markets.The inclusion of non-banking sector indicators in the FSIs reflects the interconnection of the financial and realsectors, as, for example, unfavourable developments in the corporate sector pass through to the loan portfolio ofbanks and may thus have a negative effect on financial stability.125
124 The Financial Sector Assessment Program (FSAP) is a joint IMF/WB program focused on the assessment of the soundness and development ofthe financial sector.
125 Within the FSAP the IMF and the World Bank use far more indicators of financial soundness, stability and structure, see IMF and WB (2005).The FSIs thus represent just a selection of the most important indicators in order to cover the largest possible number of countries (this is why,for example, some market indicators are missing, since they are not available in numerous countries).
70
FINANCIAL STABILITY INDICATORS: ADVANTAGES AND DISADVANTAGESOF THEIR USE IN THE ASSESSMENT OF FINANCIAL SYSTEM STABILITY
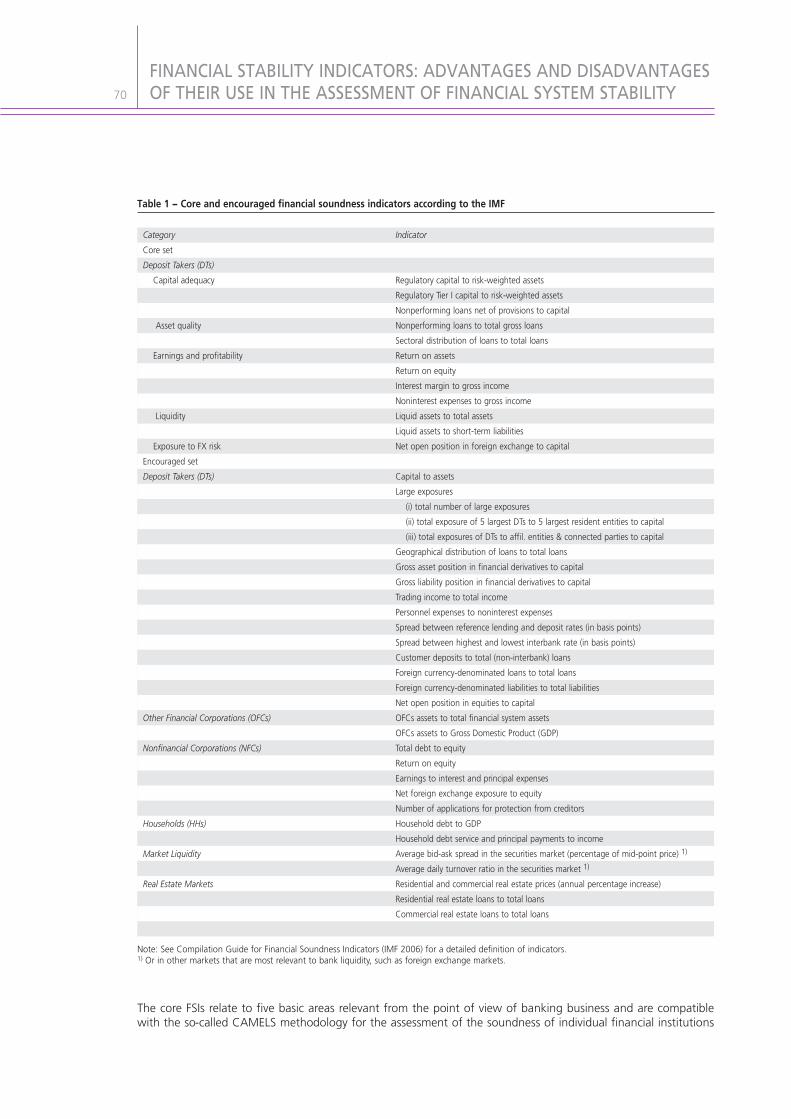
The core FSIs relate to five basic areas relevant from the point of view of banking business and are compatiblewith the so-called CAMELS methodology for the assessment of the soundness of individual financial institutions
Table 1 − Core and encouraged financial soundness indicators according to the IMF
Note: See Compilation Guide for Financial Soundness Indicators (IMF 2006) for a detailed definition of indicators.1) Or in other markets that are most relevant to bank liquidity, such as foreign exchange markets.
CategoryCore setDeposit Takers (DTs)
Capital adequacy
Asset quality
Earnings and profitability
Liquidity
Exposure to FX risk Encouraged setDeposit Takers (DTs)
Other Financial Corporations (OFCs)
Nonfinancial Corporations (NFCs)
Households (HHs)
Market Liquidity
Real Estate Markets
Indicator
Regulatory capital to risk-weighted assets Regulatory Tier I capital to risk-weighted assetsNonperforming loans net of provisions to capitalNonperforming loans to total gross loans Sectoral distribution of loans to total loansReturn on assetsReturn on equity Interest margin to gross income Noninterest expenses to gross income Liquid assets to total assetsLiquid assets to short-term liabilitiesNet open position in foreign exchange to capital
Capital to assets Large exposures
(i) total number of large exposures(ii) total exposure of 5 largest DTs to 5 largest resident entities to capital(iii) total exposures of DTs to affil. entities & connected parties to capital
Geographical distribution of loans to total loans Gross asset position in financial derivatives to capital Gross liability position in financial derivatives to capital Trading income to total income Personnel expenses to noninterest expenses Spread between reference lending and deposit rates (in basis points)Spread between highest and lowest interbank rate (in basis points)Customer deposits to total (non-interbank) loans Foreign currency-denominated loans to total loans Foreign currency-denominated liabilities to total liabilities Net open position in equities to capital OFCs assets to total financial system assetsOFCs assets to Gross Domestic Product (GDP)Total debt to equity Return on equity Earnings to interest and principal expenses Net foreign exchange exposure to equity Number of applications for protection from creditorsHousehold debt to GDP Household debt service and principal payments to incomeAverage bid-ask spread in the securities market (percentage of mid-point price) 1)
Average daily turnover ratio in the securities market 1)
Residential and commercial real estate prices (annual percentage increase)Residential real estate loans to total loans Commercial real estate loans to total loans
FINANCIAL STABILITY INDICATORS: ADVANTAGES AND DISADVANTAGESOF THEIR USE IN THE ASSESSMENT OF FINANCIAL SYSTEM STABILITY 71
(Capital adequacy, Asset quality, Management soundness, Earnings, Liquidity, Sensitivity to market risk).126 Thecapital adequacy indicators measure the banking sector's ability to absorb sudden losses and are thus closest tothe "resilience to shocks" concept, whereas the asset quality indicators are directly associated with potential risksto banks' solvency. The profitability indicators measure the ability to absorb losses without any impact on capital,while the liquidity indicators measure banks' resilience to cash flow shocks. Foreign currency exposure is anindicator measuring a bank's risk exposure with regard to movements in asset prices on financial markets. Themanagement quality indicators were ultimately not included in the FSIs owing to difficulties connected withquantifying indicators that are qualitative in nature (Sundararajan et al. 2002).
The main goal of the FSIs is international comparability, which should be guaranteed by the fact that all countriespublishing FSIs will use the same methodology. International comparability is, however, still limited by somedifferences at national level, particularly in accounting standards but also in the data collection formats neededfor calculating the FSIs.127
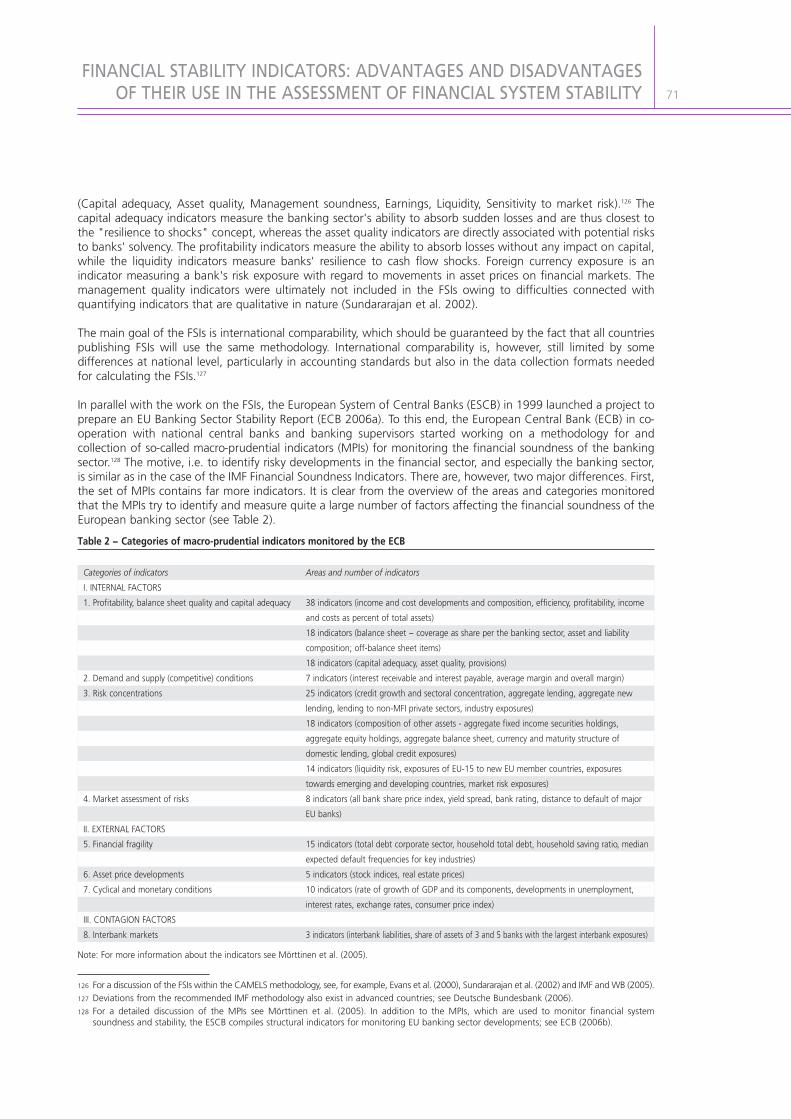
In parallel with the work on the FSIs, the European System of Central Banks (ESCB) in 1999 launched a project toprepare an EU Banking Sector Stability Report (ECB 2006a). To this end, the European Central Bank (ECB) in co-operation with national central banks and banking supervisors started working on a methodology for andcollection of so-called macro-prudential indicators (MPIs) for monitoring the financial soundness of the bankingsector.128 The motive, i.e. to identify risky developments in the financial sector, and especially the banking sector,is similar as in the case of the IMF Financial Soundness Indicators. There are, however, two major differences. First,the set of MPIs contains far more indicators. It is clear from the overview of the areas and categories monitoredthat the MPIs try to identify and measure quite a large number of factors affecting the financial soundness of theEuropean banking sector (see Table 2).
126 For a discussion of the FSIs within the CAMELS methodology, see, for example, Evans et al. (2000), Sundararajan et al. (2002) and IMF and WB (2005).127 Deviations from the recommended IMF methodology also exist in advanced countries; see Deutsche Bundesbank (2006).128 For a detailed discussion of the MPIs see Mörttinen et al. (2005). In addition to the MPIs, which are used to monitor financial system
soundness and stability, the ESCB compiles structural indicators for monitoring EU banking sector developments; see ECB (2006b).
Table 2 − Categories of macro-prudential indicators monitored by the ECB
Note: For more information about the indicators see Mörttinen et al. (2005).
Categories of indicatorsI. INTERNAL FACTORS1. Profitability, balance sheet quality and capital adequacy
2. Demand and supply (competitive) conditions3. Risk concentrations
4. Market assessment of risks
II. EXTERNAL FACTORS5. Financial fragility
6. Asset price developments7. Cyclical and monetary conditions
III. CONTAGION FACTORS8. Interbank markets
Areas and number of indicators
38 indicators (income and cost developments and composition, efficiency, profitability, incomeand costs as percent of total assets)18 indicators (balance sheet − coverage as share per the banking sector, asset and liabilitycomposition; off-balance sheet items)18 indicators (capital adequacy, asset quality, provisions)7 indicators (interest receivable and interest payable, average margin and overall margin) 25 indicators (credit growth and sectoral concentration, aggregate lending, aggregate newlending, lending to non-MFI private sectors, industry exposures)18 indicators (composition of other assets - aggregate fixed income securities holdings, aggregate equity holdings, aggregate balance sheet, currency and maturity structure of domestic lending, global credit exposures)14 indicators (liquidity risk, exposures of EU-15 to new EU member countries, exposurestowards emerging and developing countries, market risk exposures)8 indicators (all bank share price index, yield spread, bank rating, distance to default of majorEU banks)
15 indicators (total debt corporate sector, household total debt, household saving ratio, medianexpected default frequencies for key industries)5 indicators (stock indices, real estate prices)10 indicators (rate of growth of GDP and its components, developments in unemployment,interest rates, exchange rates, consumer price index)
3 indicators (interbank liabilities, share of assets of 3 and 5 banks with the largest interbank exposures)
72
FINANCIAL STABILITY INDICATORS: ADVANTAGES AND DISADVANTAGESOF THEIR USE IN THE ASSESSMENT OF FINANCIAL SYSTEM STABILITY
Second, within the ESCB most bank-related MPIs are compiled and published on a consolidated basis, i.e. theindicators for banks in one country also include their branches and subsidiaries in other EU countries, as well asother financial institutions controlled by them. This concept allows aggregate data to be constructed for the EUas a whole and thus provides a view of the banking system in the European context. However, it leads to someloss of the link between economic developments based on the territorial principle and the evolution of the MPIspublished for the "purely domestic" banking sector in countries where foreign banks from the EU are heavilyrepresented (e.g. new Member States, including the Czech Republic).129
A comparison of the structure of the IMF and ECB indicators reveals that they overlap. Nonetheless, they displaysome methodological differences (e.g. as regards consolidation) and overlap only partially or differ in terms of thecoverage of the data monitored. Although the MPI set includes far more indicators than the FSI set, Mörttinen etal. (2005, pp. 54−57) demonstrate that some FSIs (particularly in the set of encouraged indicators) have noequivalent MPIs within the ESCB. When monitoring financial stability, it is therefore appropriate to combine thetwo sets of relevant indicators.
The method of assessing the financial or banking stability indicators is a separate question. Although for someindicators there exist certain "optimal" values, which are even anchored in national regulations (e.g. a thresholdof 8% for capital adequacy, a value close to zero for net open positions in foreign exchange), many otherindicators have no such absolute "benchmarks". The assessment should thus focus on the evolution of indicatorsover time and on comparisons with other countries.
The FSIs may, however, be used in stress testing.130 A big advantage of stress tests is that they provide a linkbetween individual FSIs and, unlike the indicators, which are relatively static in nature, also allow us to take intoaccount the potential losses that the financial sector would suffer in the event of a shock (Craig and Sundararajan2003). The results of regular stress testing, especially of the banking sector, may thus also serve as an additionalfinancial soundness indicator. Another area where stress testing offers substantial value added compared to themonitoring of simple indicators is the analysis of the systemic risk associated with interbank contagion.
3. IMF FINANCIAL SOUNDNESS INDICATORS FOR THE CZECH REPUBLIC AND SELECTED COUNTRIES
In 2004, the project to prepare a single methodology for the IMF Financial Soundness Indicators was supplementedwith a FSI compilation pilot project in some 60 countries (Coordinated Compilation Exercise). The results of thisexercise, including the values of individual indicators at the end of 2005 and the metadata, i.e. the statisticalmethodology, were published by the IMF in January 2007. The Czech Republic took part in this pilot study.
The set of FSIs published allows us to make quite a reliable comparison of banking sector FSIs across countries,despite some methodological differences and slight discrepancies due to national limitations as regards datacollection. Table 3 presents the core set of FSIs, i.e. banking sector indicators, for the Czech Republic as comparedto other Central European countries in 2005.131
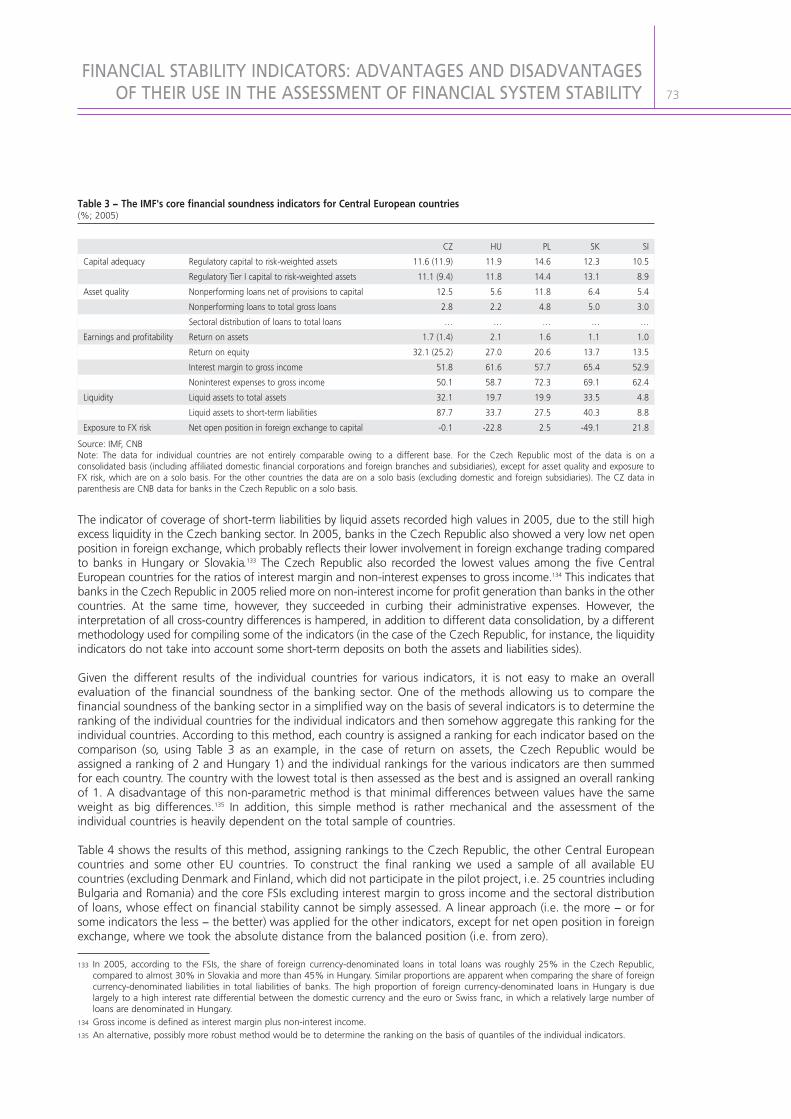
Although the comparison of the data across individual Central European countries is complicated by rather differentdata consolidation methods used for the calculation of the indicators (most of the Czech data are on a consolidatedbasis, whereas the underlying data for the other countries are not subject to cross-border or cross-sectorconsolidation), some assessment of the indicators is possible. This is confirmed by the relatively similar values of some indicators available for the Czech Republic on both a consolidated and unconsolidated (solo) basis (seeTable 3).132 Table 3 shows that for some indicators (capital adequacy, non-performing loans to total gross loans,liquid assets to total assets) the Czech Republic was ranked roughly in the middle in 2005, whereas for others itsposition was extreme (a higher share of net non-performing loans in regulatory capital vs. high return on equity).
129 The IMF Financial Soundness Indicators are also compiled on a consolidated basis; see IMF (2006). Nonetheless, the Compilation Guide offersseveral possible types of consolidation when compiling FSIs, including on an unconsolidated basis on the territorial principle (i.e. including foreign-controlled banks operating in the domestic market).
130 For the stress testing methodology see Čihák (2004a, 2004b). The CNB regularly uses stress testing, develops it and publishes the results; seeCNB (2004, 2006a) and the article Credit risk and stress testing of the banking sector in the Czech Republic in the thematic part of this report.
131 For simplicity we present here the results for the core FSIs only. The IMF website, however, also provides data for some encouraged indicators; seehttp://www.imf.org. Large files describing the metadata, i.e. the methodology for the construction of the individual indicators, were also disclosed.
132 However, the other comparisons use the official FSI figures published on the IMF website.
FINANCIAL STABILITY INDICATORS: ADVANTAGES AND DISADVANTAGESOF THEIR USE IN THE ASSESSMENT OF FINANCIAL SYSTEM STABILITY 73
The indicator of coverage of short-term liabilities by liquid assets recorded high values in 2005, due to the still highexcess liquidity in the Czech banking sector. In 2005, banks in the Czech Republic also showed a very low net openposition in foreign exchange, which probably reflects their lower involvement in foreign exchange trading comparedto banks in Hungary or Slovakia.133 The Czech Republic also recorded the lowest values among the five CentralEuropean countries for the ratios of interest margin and non-interest expenses to gross income.134 This indicates thatbanks in the Czech Republic in 2005 relied more on non-interest income for profit generation than banks in the othercountries. At the same time, however, they succeeded in curbing their administrative expenses. However, theinterpretation of all cross-country differences is hampered, in addition to different data consolidation, by a differentmethodology used for compiling some of the indicators (in the case of the Czech Republic, for instance, the liquidityindicators do not take into account some short-term deposits on both the assets and liabilities sides).
Given the different results of the individual countries for various indicators, it is not easy to make an overallevaluation of the financial soundness of the banking sector. One of the methods allowing us to compare thefinancial soundness of the banking sector in a simplified way on the basis of several indicators is to determine theranking of the individual countries for the individual indicators and then somehow aggregate this ranking for theindividual countries. According to this method, each country is assigned a ranking for each indicator based on thecomparison (so, using Table 3 as an example, in the case of return on assets, the Czech Republic would beassigned a ranking of 2 and Hungary 1) and the individual rankings for the various indicators are then summedfor each country. The country with the lowest total is then assessed as the best and is assigned an overall rankingof 1. A disadvantage of this non-parametric method is that minimal differences between values have the sameweight as big differences.135 In addition, this simple method is rather mechanical and the assessment of theindividual countries is heavily dependent on the total sample of countries.
Table 4 shows the results of this method, assigning rankings to the Czech Republic, the other Central Europeancountries and some other EU countries. To construct the final ranking we used a sample of all available EUcountries (excluding Denmark and Finland, which did not participate in the pilot project, i.e. 25 countries includingBulgaria and Romania) and the core FSIs excluding interest margin to gross income and the sectoral distributionof loans, whose effect on financial stability cannot be simply assessed. A linear approach (i.e. the more − or forsome indicators the less − the better) was applied for the other indicators, except for net open position in foreignexchange, where we took the absolute distance from the balanced position (i.e. from zero).
133 In 2005, according to the FSIs, the share of foreign currency-denominated loans in total loans was roughly 25% in the Czech Republic, compared to almost 30% in Slovakia and more than 45% in Hungary. Similar proportions are apparent when comparing the share of foreigncurrency-denominated liabilities in total liabilities of banks. The high proportion of foreign currency-denominated loans in Hungary is due largely to a high interest rate differential between the domestic currency and the euro or Swiss franc, in which a relatively large number ofloans are denominated in Hungary.
134 Gross income is defined as interest margin plus non-interest income. 135 An alternative, possibly more robust method would be to determine the ranking on the basis of quantiles of the individual indicators.
Table 3 − The IMF's core financial soundness indicators for Central European countries(%; 2005)
Source: IMF, CNBNote: The data for individual countries are not entirely comparable owing to a different base. For the Czech Republic most of the data is on a consolidated basis (including affiliated domestic financial corporations and foreign branches and subsidiaries), except for asset quality and exposure to FX risk, which are on a solo basis. For the other countries the data are on a solo basis (excluding domestic and foreign subsidiaries). The CZ data in parenthesis are CNB data for banks in the Czech Republic on a solo basis.
Capital adequacy
Asset quality
Earnings and profitability
Liquidity
Exposure to FX risk
Regulatory capital to risk-weighted assetsRegulatory Tier I capital to risk-weighted assetsNonperforming loans net of provisions to capitalNonperforming loans to total gross loans Sectoral distribution of loans to total loansReturn on assetsReturn on equityInterest margin to gross income Noninterest expenses to gross incomeLiquid assets to total assetsLiquid assets to short-term liabilitiesNet open position in foreign exchange to capital
CZ HU PL SK SI11.6 (11.9) 11.9 14.6 12.3 10.511.1 (9.4) 11.8 14.4 13.1 8.9
12.5 5.6 11.8 6.4 5.42.8 2.2 4.8 5.0 3.0… … … … …
1.7 (1.4) 2.1 1.6 1.1 1.032.1 (25.2) 27.0 20.6 13.7 13.5
51.8 61.6 57.7 65.4 52.950.1 58.7 72.3 69.1 62.432.1 19.7 19.9 33.5 4.887.7 33.7 27.5 40.3 8.8-0.1 -22.8 2.5 -49.1 21.8
74
FINANCIAL STABILITY INDICATORS: ADVANTAGES AND DISADVANTAGESOF THEIR USE IN THE ASSESSMENT OF FINANCIAL SYSTEM STABILITY
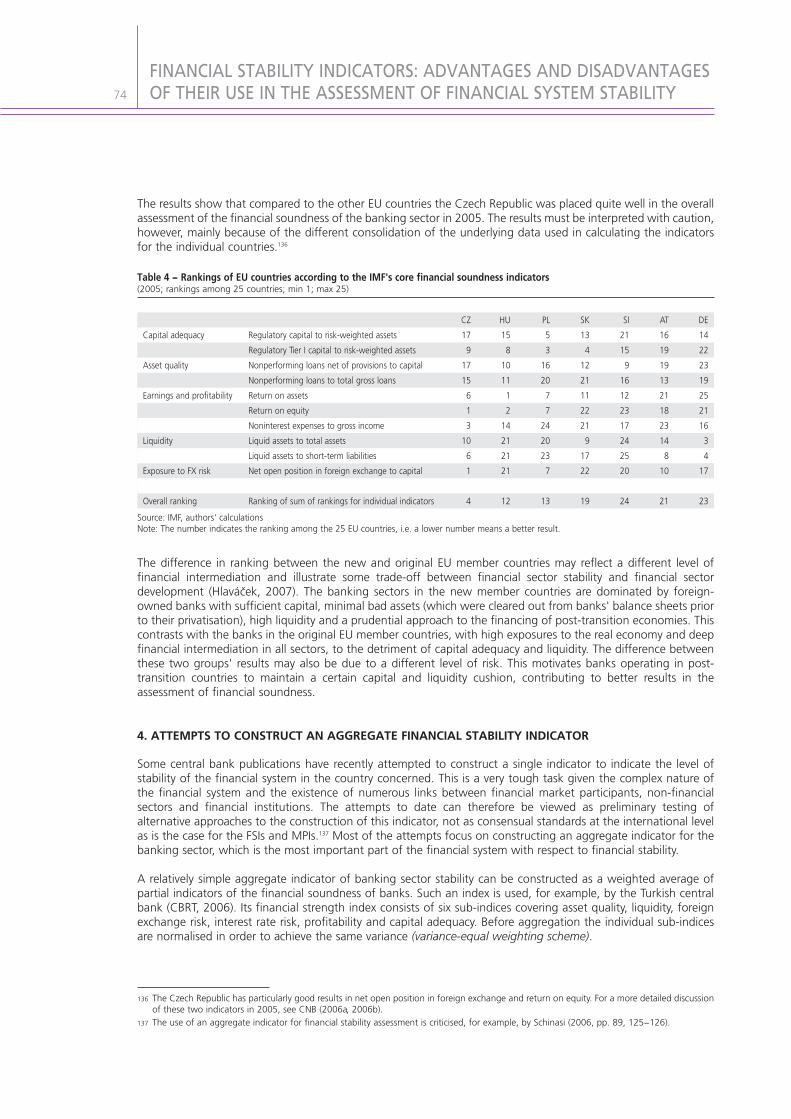
The results show that compared to the other EU countries the Czech Republic was placed quite well in the overallassessment of the financial soundness of the banking sector in 2005. The results must be interpreted with caution,however, mainly because of the different consolidation of the underlying data used in calculating the indicatorsfor the individual countries.136
The difference in ranking between the new and original EU member countries may reflect a different level offinancial intermediation and illustrate some trade-off between financial sector stability and financial sectordevelopment (Hlaváček, 2007). The banking sectors in the new member countries are dominated by foreign-owned banks with sufficient capital, minimal bad assets (which were cleared out from banks' balance sheets priorto their privatisation), high liquidity and a prudential approach to the financing of post-transition economies. Thiscontrasts with the banks in the original EU member countries, with high exposures to the real economy and deepfinancial intermediation in all sectors, to the detriment of capital adequacy and liquidity. The difference betweenthese two groups' results may also be due to a different level of risk. This motivates banks operating in post-transition countries to maintain a certain capital and liquidity cushion, contributing to better results in theassessment of financial soundness.
4. ATTEMPTS TO CONSTRUCT AN AGGREGATE FINANCIAL STABILITY INDICATOR
Some central bank publications have recently attempted to construct a single indicator to indicate the level ofstability of the financial system in the country concerned. This is a very tough task given the complex nature ofthe financial system and the existence of numerous links between financial market participants, non-financialsectors and financial institutions. The attempts to date can therefore be viewed as preliminary testing ofalternative approaches to the construction of this indicator, not as consensual standards at the international levelas is the case for the FSIs and MPIs.137 Most of the attempts focus on constructing an aggregate indicator for thebanking sector, which is the most important part of the financial system with respect to financial stability.
A relatively simple aggregate indicator of banking sector stability can be constructed as a weighted average ofpartial indicators of the financial soundness of banks. Such an index is used, for example, by the Turkish centralbank (CBRT, 2006). Its financial strength index consists of six sub-indices covering asset quality, liquidity, foreignexchange risk, interest rate risk, profitability and capital adequacy. Before aggregation the individual sub-indicesare normalised in order to achieve the same variance (variance-equal weighting scheme).
136 The Czech Republic has particularly good results in net open position in foreign exchange and return on equity. For a more detailed discussionof these two indicators in 2005, see CNB (2006a, 2006b).
137 The use of an aggregate indicator for financial stability assessment is criticised, for example, by Schinasi (2006, pp. 89, 125−126).
Table 4 − Rankings of EU countries according to the IMF's core financial soundness indicators(2005; rankings among 25 countries; min 1; max 25)
Source: IMF, authors' calculationsNote: The number indicates the ranking among the 25 EU countries, i.e. a lower number means a better result.
Capital adequacy
Asset quality
Earnings and profitability
Liquidity
Exposure to FX risk
Overall ranking
Regulatory capital to risk-weighted assetsRegulatory Tier I capital to risk-weighted assetsNonperforming loans net of provisions to capitalNonperforming loans to total gross loans Return on assetsReturn on equityNoninterest expenses to gross incomeLiquid assets to total assetsLiquid assets to short-term liabilitiesNet open position in foreign exchange to capital
Ranking of sum of rankings for individual indicators
CZ HU PL SK SI AT DE17 15 5 13 21 16 149 8 3 4 15 19 22
17 10 16 12 9 19 2315 11 20 21 16 13 196 1 7 11 12 21 251 2 7 22 23 18 213 14 24 21 17 23 16
10 21 20 9 24 14 36 21 23 17 25 8 41 21 7 22 20 10 17
4 12 13 19 24 21 23

FINANCIAL STABILITY INDICATORS: ADVANTAGES AND DISADVANTAGESOF THEIR USE IN THE ASSESSMENT OF FINANCIAL SYSTEM STABILITY 75
An alternative method is to construct an aggregate financial soundness indicator using daily data from thefinancial markets (such as prices of banking shares and other financial assets). The reason is that such data cansignal any difficulties in the financial sector in advance, as indicated by market perceptions about their probability.The financial fragility indicator presented by experts from the US Federal Reserve System (Nelson and Perli 2005)and the financial stress index calculated by experts of the Canadian central bank (Illing and Liu 2003) are examplesof such an approach.
A sensible approach is to combine information from the financial markets with information from the financialstatements of financial institutions. This approach has been adopted, for example, by the Swiss central bank inthe construction of a "stress index" for the banking sector (SNB, 2006). Along with indicators derived from banks'balance sheets and performance (change in profitability, capital, asset quality and the number of bank branches),this approach thus also uses market indicators (change in prices of banking shares and bonds) and other indicatorssuch as interbank exposure and additional supervisory information (the share of bank assets in the regulator's"watch list").
Experts from the Netherlands central bank have opted for quite an original approach to the construction of theindex (van den End 2006). The financial stability conditions index is constructed on the basis of an enlargedmonetary conditions index and thus contains interest rates, the effective exchange rate, real estate and stockprices, the solvency of financial institutions and volatility of the stock index of financial institutions. An innovationin this index is, however, the introduction of upper and lower critical limits to take account of potential non-lineareffects. Too low an index value means increased instability, whereas too high a value may result in theaccumulation of financial imbalances, since very positive developments and minimal market volatility may lead todistortion of relative prices, inefficient fund allocation and lower prudence and risk limits. Therefore, the idealevolution of the index is one within a particular financial stability band.
A new approach to the construction of an aggregate financial stability indicator consists in calculating default riskat the level of the entire financial system, or its main sectors, for instance using the Merton model (Van den Endand Tabbae, 2005).138 A similar systemic risk indicator based on the stochastic default risk distribution of individualinstitutions as an operational financial stability indicator is proposed, for example, by Čihák (2007). The advantageof these indicators lies in their close linkage with problems in the financial sector (default of major financialinstitutions or a sector) and with the business cycle. The disadvantages include, however, demanding analysis andin some cases also the existence of a liquid stock market with a good representative sample of individual sectors.
5. THE CHOICE OF A BANKING STABILITY INDEX FOR THE CZECH REPUBLIC
On the basis of the debate above we try to construct experimentally a simple aggregate banking sector stabilityindex and discuss its advantages and disadvantages. The use of market indicators in the case of the Czech Republicruns into the problems of a limited number of listed banks, a minimal number of listed bank bonds and a relativelyshallow capital market in general. To construct the index, whose working name is the banking stability index, wethus have the traditional ratio indicators only.
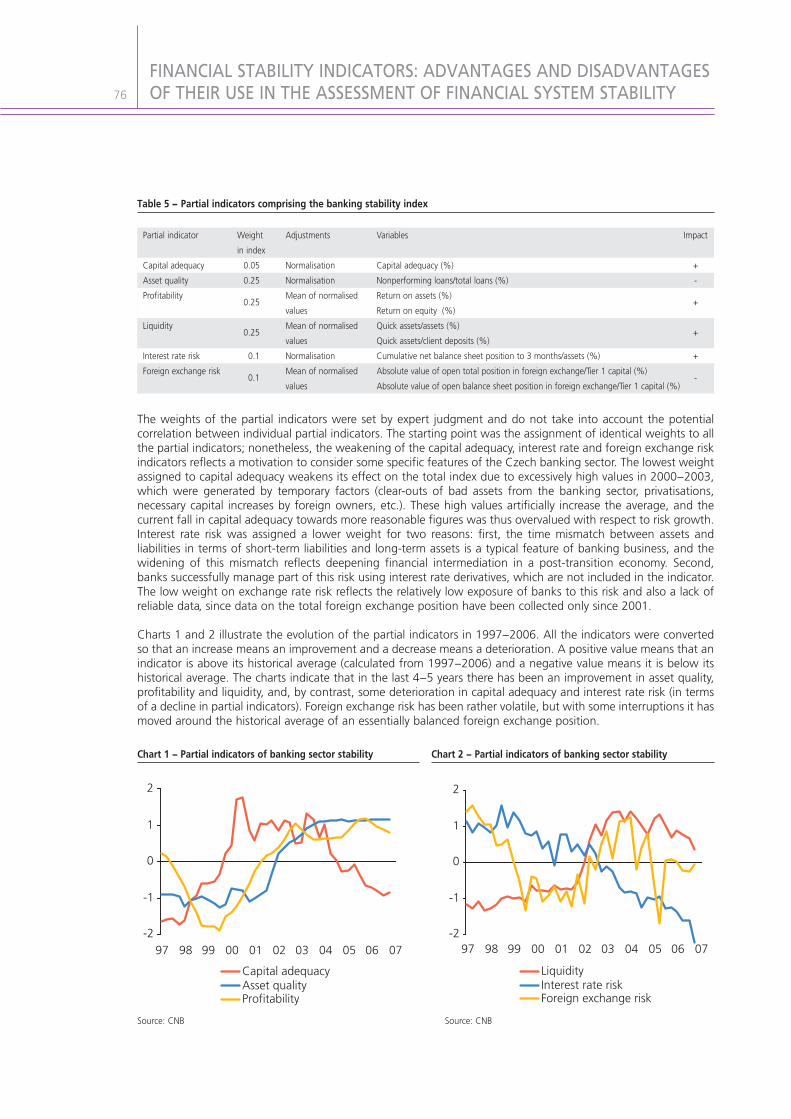
Table 5 shows the partial indicators that were chosen for the construction of the aggregate index, including theirweights. The selection of the individual partial indicators was governed by current international practice. Capitaladequacy and profitability indicate the cushion which a bank has at its disposal against potential risks. Assetquality evaluates the degree of credit risk. Liquidity measures a bank's reserve against potential liquidity problems.Interest rate risk measures the time mismatch between assets and liabilities and indirectly measures the potentiallosses caused by a potential rise in interest rates.139 Foreign exchange risk covers banks' exposure to exchange ratemovements in both directions. All the partial indicators were normalised before aggregation so that they have thesame variance.
138 For an explanation of the Merton model and its use in financial stability analyses in the CNB, see, for example, Jakubík (2006). 139 In the terminology of the capital adequacy framework (Basel II), this risk is termed interest rate risk in the banking book and is sometimes also
referred to as the time mismatch between assets and liabilities (CNB 2006b). This risk arises when a rise in interest rates forces a bank to payhigher interest on the liability side (e.g. remunerated demand deposits or deposits with a short interest rate fixation period) without it beingable to charge higher rates on the asset side (e.g. loans with longer fixation periods). This time mismatch in possible refixation leads directlyto losses. In addition, there is interest rate risk in the trading book, which expresses the potential losses in the trading portfolio (e.g. bonds andother assets held for trading and sensitive to interest rate changes) caused by movements in market interest rates.
76
FINANCIAL STABILITY INDICATORS: ADVANTAGES AND DISADVANTAGESOF THEIR USE IN THE ASSESSMENT OF FINANCIAL SYSTEM STABILITY
The weights of the partial indicators were set by expert judgment and do not take into account the potentialcorrelation between individual partial indicators. The starting point was the assignment of identical weights to allthe partial indicators; nonetheless, the weakening of the capital adequacy, interest rate and foreign exchange riskindicators reflects a motivation to consider some specific features of the Czech banking sector. The lowest weightassigned to capital adequacy weakens its effect on the total index due to excessively high values in 2000−2003,which were generated by temporary factors (clear-outs of bad assets from the banking sector, privatisations,necessary capital increases by foreign owners, etc.). These high values artificially increase the average, and thecurrent fall in capital adequacy towards more reasonable figures was thus overvalued with respect to risk growth.Interest rate risk was assigned a lower weight for two reasons: first, the time mismatch between assets andliabilities in terms of short-term liabilities and long-term assets is a typical feature of banking business, and thewidening of this mismatch reflects deepening financial intermediation in a post-transition economy. Second,banks successfully manage part of this risk using interest rate derivatives, which are not included in the indicator.The low weight on exchange rate risk reflects the relatively low exposure of banks to this risk and also a lack ofreliable data, since data on the total foreign exchange position have been collected only since 2001.
Charts 1 and 2 illustrate the evolution of the partial indicators in 1997−2006. All the indicators were convertedso that an increase means an improvement and a decrease means a deterioration. A positive value means that anindicator is above its historical average (calculated from 1997−2006) and a negative value means it is below itshistorical average. The charts indicate that in the last 4−5 years there has been an improvement in asset quality,profitability and liquidity, and, by contrast, some deterioration in capital adequacy and interest rate risk (in termsof a decline in partial indicators). Foreign exchange risk has been rather volatile, but with some interruptions it hasmoved around the historical average of an essentially balanced foreign exchange position.
Table 5 − Partial indicators comprising the banking stability index
Partial indicator
Capital adequacyAsset qualityProfitability
Liquidity
Interest rate risk Foreign exchange risk
Weightin index
0.050.25
0.25
0.25
0.1
0.1
Adjustments
NormalisationNormalisationMean of normalised valuesMean of normalised valuesNormalisationMean of normalised values
Impact
+-
+
+
+
-
Variables
Capital adequacy (%)Nonperforming loans/total loans (%)Return on assets (%)Return on equity (%)Quick assets/assets (%)Quick assets/client deposits (%)Cumulative net balance sheet position to 3 months/assets (%)Absolute value of open total position in foreign exchange/Tier 1 capital (%)Absolute value of open balance sheet position in foreign exchange/Tier 1 capital (%)
-2
-1
0
1
2
97 98 99 00 01 02 03 04 05 06 07
Capital adequacyAsset qualityProfitability
-2
-1
0
1
2
97 98 99 00 01 02 03 04 05 06 07
LiquidityInterest rate riskForeign exchange risk
Chart 1 − Partial indicators of banking sector stability Chart 2 − Partial indicators of banking sector stability
Source: CNB Source: CNB

Chart 3 shows the evolution of the resulting banking stability index together with the evolution of the economicenvironment in the Czech Republic, which of course has affected the banking sector. We can identify three basicphases in the evolution of the index. The low and falling index values in 1997−1999 are due to economicproblems and a banking crisis in the Czech Republic in the second half of the 1990s. That period was characterisedby poor asset quality, low profitability and liquidity of banks and relatively low capital. At the time, the economywas in recession and banks and debtors were adversely affected by high interest rates.
In 1999−2001, there was a modest economic recovery and interest rates fell gradually, which had a positive effecton the economy and on the banking sector. However, the improvement in the index in this period was driven moreby structural and institutional changes, since the banking sector was being cleaned up and consolidated, badassets were being cleared out, and essential ownership changes were being made (privatisation to foreignstrategic owners, see Bárta, Geršl and Singer, 2007). Since 2002 the index has been fluctuating in positive values.Another reason for the improving stability is the favourable phase of the business cycle, associated with economicgrowth and low interest rates. Only in this phase is it probably meaningful to interpret developments on the basisof standard financial soundness and stability indicators.
The slight fall in the banking stability index recently can be explained by a combination of falling capital adequacyand liquidity and increasing interest rate risk amid unchanged asset quality and profitability. This evolution of thetotal indicator and the partial indicators is largely due to credit expansion in a situation of low interest rates inrecent years. The rise in lending binds more capital to risk-weighted assets, thereby decreasing capital adequacy.This decrease is also due in large part to repatriation of bank earnings in the form of dividends paid to foreignowners. Low real interest rates support growth in long-term loans, but at the same time reduce the opportunitycosts of holding money in the form of sight deposits, which leads to a short time position for liabilities, a wideningof the time mismatch between assets and liabilities and a rise in interest rate risk.
The decline in the banking stability index can also be interpreted as a return to average values and capitaladequacy optimisation in a situation of credit growth. The fall in the index may also reflect a smaller need for"cushions" against potential risks in an environment of increased financial and economic stability. The evolutionof the index is not inconsistent with stress tests, which indicate that the banking sector has good resilience topotential shocks.140
That said, the present evolution of the banking stability index may signal some risks going forward. Should thecredit expansion continue at a similar rate as in the previous three years, banks will be forced to strengthen their
FINANCIAL STABILITY INDICATORS: ADVANTAGES AND DISADVANTAGESOF THEIR USE IN THE ASSESSMENT OF FINANCIAL SYSTEM STABILITY 77
-2
-1
0
1
2
1997 1998 1999 2000 2001 2002 2003 2004 2005 2006 2007
-3036912151821
Banking stability index (left-hand scale)GDP growth (%; right-hand scale)3M PRIBOR (%; right-hand scale)
Phase 1 Phase 2 Phase 3
Chart 3 − Banking stability index
Source: CNB
140 See the article Credit risk and stress testing of the banking sector in the Czech Republic in the thematic part of this report.
78
FINANCIAL STABILITY INDICATORS: ADVANTAGES AND DISADVANTAGESOF THEIR USE IN THE ASSESSMENT OF FINANCIAL SYSTEM STABILITY
capital adequacy and decrease the time mismatch between assets and liabilities, probably using interest ratederivatives and other instruments. In the event of a cooling of economic activity or a rise in interest rates, banksmay also face more danger from an increase in unpaid loans. Some banks have already started to react to thissituation in advance by increasing their capital or changing their profit distribution strategy.
6. CONCLUSIONS
To assess the stability of the financial system and its most important part, i.e. the banking sector, it is appropriateto use a number of quantitative indicators and combine various approaches, including the calculation of financialsoundness indicators, stress testing and some aggregate view of the development of the financial or bankingsector based on a simple aggregate indicator.
Financial stability indicators compiled at the level of international institutions such as the IMF or the ECB facilitatethe assessment of financial soundness and stability in international comparison thanks to their singlemethodology. Recently published data from an IMF pilot project for the compilation of financial soundnessindicators indicate that the Czech banking sector compares quite favourably with the other EU countries.
An aggregate financial stability indicator may serve as a first step towards better operationalising the concept offinancial stability and building a more appropriate framework for assessing financial stability. The experimentallycompiled banking stability index for the Czech Republic constitutes one of the alternative methods forconstructing an aggregate financial stability indicator. The discussion of its pros and cons, however, suggests thatit cannot simply be used to assess financial stability without knowledge and use of other supporting instrumentsand indicators. Nonetheless, it may serve as the basis for further efforts to construct quantitative indicators thatbetter reflect the nature of the financial system and its links with the real sector and other countries.
REFERENCES
Bárta, V., Geršl, A., Singer, M. (2007): The Czech Banking Sector after 16 years of Restructuring: FundamentalChanges and Costly Lessons. In: Institutional Foundations for Sound Finance, Washington, IMF/WB 2007
CBRT (2006): Financial Stability Report, Central Bank of the Republic of Turkey, June 2006, Volume 2
Craig, R. S., Sundararajan, V. (2003): Using Financial Soundness Indicators to Assess Risks to Financial Stability, in:Ugolini, P. C., Schaechter, A., Stone, M. R. (eds): Challenges to Central Banking from Globalized Financial Systems(Papers presented at the ninth conference on central banking), IMF Washington, 2003
CNB (2004): Financial Stability Report 2004, Czech National Bank, December 2004
CNB (2006a): Financial Stability Report 2005, Czech National Bank, May 2006
CNB (2006b): Banking Supervision 2005, Czech National Bank, June 2006
Čihák, M. (2004a): Stress Testing: A Review of Key Concepts, CNB Internal Research and Policy Note 2/2004
Čihák, M. (2004b): Designing Stress Tests for the Czech Banking System, CNB Internal Research and Policy Note3/2004
Čihák, M. (2007): Systemic Loss: A Measure of Financial Stability, Czech Journal of Economics and Finance1−2/2007
Deutsche Bundesbank (2006): Financial Soundness Indicators: A Contribution to Improving the WorldwideAvailability of Data for Financial Stability Analysis, Financial Stability Review, November 2006
Evans, O., Leone, A., Gill, M., Hilbers, P. (2000): Macroprudential Indicators of Financial System Soundness, IMFOccasional Paper No. 192

FINANCIAL STABILITY INDICATORS: ADVANTAGES AND DISADVANTAGESOF THEIR USE IN THE ASSESSMENT OF FINANCIAL SYSTEM STABILITY 79
ECB (2006a): EU Banking Sector Stability, European Central Bank, November 2006
ECB (2006b): EU Banking Structures, European Central Bank, October 2006
Hlaváček, M. (2007): Financial Stability Analysis in a Developing Economy, Czech Journal of Economics andFinance 1−2/2007, pp. 2−4
Illing, M., Liu, Y. (2003): An Index of Financial Stress for Canada, Bank of Canada Working Paper No. 2003−14
IMF and WB (2005): Financial Sector Assessment: A Handbook, International Monetary Fund and World BankSeptember 2005
IMF (2006): Financial Soundness Indicators: Compilation Guide, International Monetary Fund, March 2006
Jakubík, P. (2006): Macroeconomic Credit Risk Model. Financial Stability Report 2005, Czech National Bank, May 2006, pp. 84−92
Mörttinen L., Poloni P., Sandras P., Vesala J. (2005): Analysing Banking Sector Conditions: How to Use Macro-prudential Indicators, ECB Occasional Paper no. 26, April 2005
Nelson, W. R., Perli, R. (2005): Selected Indicators of Financial Stability. 4th Joint Central Bank Research Conferenceon "Risk Measurement and Systemic Risk", ECB Frankfurt am Main, November 2005
Schinasi, G. J. (2006): Safeguarding Financial Stability: Theory and Practice, Washington, D.C., InternationalMonetary Fund
Sundararajan V., Enoch C., San José A., Hilbers, P., Krueger R., Moretti M., Slack G. (2002): Financial SoundnessIndicators: Analytical Aspects and Country Practices, IMF Occasional Paper No. 212
SNB (2006): Financial Stability Report, Schweizerische Nationalbank, June 2006
Van den End, J. W. (2006): Indicator and Boundaries of Financial Stability, DNB Working Paper No. 97/March 2006
Van den End, J. W., Tabbae, M. (2005): Measuring Financial Stability: Applying the MfRisk Model to theNetherlands, DNB Working Paper No. 30/March 2005