financial stability report 2015 - swiss national bank stability report 2015 financial stability...
TRANSCRIPT

Financial Stability Report 2015


Financial Stability Report 2015


Financial Stability Report 2015 3
1 Overall assessment 4
2 Macroeconomic environment 7
2.1 Key risks 7
2.2 Scenarios 12
3 Exposures and resilience 14
3.1 Big banks 14
3.2 Domestically focused commercial banks 19
Contents
Financial Stability Report 20154
1 Overall assessment
MACROECONOMIC ENVIRONMENTInternational economic and financial conditions for the Swiss banking sector have improved over the last 12 months, but substantial risks remain. The domestic environment has become more challenging.
Global conditions have improved overall, although developments have been uneven, with marked differences between the euro area, the US and emerging markets. There has been some progress in the euro area, but uncertainty remains elevated and credit quality in southern member states is still low. In the US, positive signs dominate and the economy has grown robustly overall. In emerging markets, financial conditions have tightened on the back of slower economic growth.
In Switzerland, conditions were relatively favourable in 2014, but have become more challenging due to the strong appreciation of the Swiss franc that followed the discontinuation of the minimum exchange rate in January 2015. Meanwhile, imbalances on the Swiss mortgage and real estate markets have remained broadly unchanged at high levels.
Under its baseline scenario, the Swiss National Bank (SNB) is assuming that global economic conditions improve, as economic growth remains strong in the US and accelerates in the euro area. Meanwhile, the strength of the Swiss franc reduces growth in Switzerland. The further decline in interest rates on the money and capital markets carries the risk of a renewed increase in imbalances on the Swiss mortgage and residential real estate markets over the medium term, particularly in the residential investment property segment.
In addition to the baseline scenario, the SNB uses four different adverse scenarios to assess banking sector resilience against unlikely, highly unfavourable but possible developments in economic and financial conditions. They focus on developments that would be of particular relevance for the Swiss banking sector. Under the first adverse scenario, the euro area debt crisis re-escalates, causing widespread financial and banking stress. The second scenario assumes a major crisis in emerging markets, comparable to the crises in the second half of the 1990s. Under the third scenario, the US enters a deep recession, which is transmitted to the rest of the world. The fourth scenario assumes, for most advanced economies, falling real estate and share prices coupled with an increase in interest rates, an inverted yield curve and economic stagnation; for Switzerland, the scenario
parameters have been calibrated to reflect the severity of events observed in the 1990s.
BIG BANKSFurther improving resilienceOver the past year, the Swiss big banks have continued to improve their capital situation, albeit at a slower pace than the year before. They already meet most of the look-through (i.e. fully implemented) requirements of the Swiss ‘too big to fail’ regulations and the international Basel III framework, both of which will apply from 2019. The SNB recommends that the big banks do not lose momentum in their efforts to improve their resilience. This is particularly warranted with regard to the leverage ratio.
Resilience needs to be further improved for three reasons: First, the risks associated with economic and financial conditions remain high. The big banks’ loss potential relative to their capitalisation continues to be substantial, both under the adverse scenarios considered by the SNB and when measured on the basis of the losses experienced during the recent financial crisis. Second, while the Swiss big banks’ risk-weighted capital ratios are above the average for large globally active banks, the same cannot yet be said for their leverage ratios. Third, it can be expected that regulatory developments at both international and national level will result in increased capital requirements. The Swiss big banks should prepare for these developments.
RWA problem identified, but not yet resolvedRisk-weighted assets (RWA) play a key role in the capital regulation of banks. In recent years, both markets’ and authorities’ confidence in RWA calculated using the model-based approach has steadily declined. A number of studies have shown that, in some instances, model-based RWA do not properly reflect a bank’s economic risks. As a consequence, capital ratios calculated using model-based RWA may overstate the true level of resilience.
To address this problem, regulatory initiatives have beenlaunched at international and national level. At international level, the Basel Committee on Banking Supervision is fundamentally revising the standardised approach and examining the introduction of a floor for internally modelled RWA based on this revised standardised approach. One important objective of the floor would be to ensure that capital requirements based on banks’ internal models do not fall below a prudent level. At national level, the Swiss Financial Market Supervisory Authority (FINMA) – together with the big banks and with the support of the SNB – has conducted a comparison between RWA calculated using the model-based and standardised approaches. The results of this comparison, in addition to the measures already taken by FINMA and those expected at international level, will be taken into account by a working group led by the Federal Department of Finance (FDF). This working group will draw up proposals and the associated legal adjustments

Financial Stability Report 2015 5
for implementing the recommendations in the Federal Council’s ‘too big to fail’ evaluation report.
Alongside these regulatory initiatives, the SNB still considers it necessary that the big banks increase transparency with regard to RWA. FINMA has now called on these banks to disclose the differences between calculations using the model-based and standardised approaches. Such enhanced transparency is necessary to restore the credibility of model-based RWA and to strengthen market discipline.
The SNB continues to hold the view that risk-weighted capital requirements (including a floor for model-based RWA) and leverage ratio requirements should complement each other. Risk-weighted requirements should guide economic decisions at the margin, while the leverage ratio should serve as a backstop. Yet, until the measures to resolve the RWA problem take effect – which will restore the credibility of RWA and establish transparency – it is prudent to give a greater weighting to the leverage ratio when assessing the big banks’ resilience. Indeed, analysts increasingly pay attention to the leverage ratio when assessing and comparing banks.
DOMESTICALLY FOCUSED COMMERCIAL BANKSIncreased mortgage exposure, stable capital situationIn 2014, domestically focused banks further increased their exposure to the Swiss mortgage and residential real estate markets. While the share of new loans with high loan-to-income (LTI) ratios – a measure of affordability risk – remained persistently high, mortgage lending growth and the share of new mortgage loans with a high loan-to-value (LTV) ratio decreased. Hence, the increase in exposure was lower than in previous years. These developments occurred against the backdrop of broadly unchanged imbalances on the mortgage and real estate markets.
With respect to bank capitalisation, the situation remained largely unchanged in 2014. First, the domestically focused banks’ available capital increased in step with the size of their balance sheets. Hence, despite pressure from historically low interest rate margins on profitability and continued growth of their balance sheets, their leverage ratios remained stable at high levels by historical standards. This was mainly the result of increased profit retention. Second, their risk-weighted capital ratios increased slightly compared to 2013 and are significantly above regulatory minimum requirements overall.
From an economic perspective, domestically focused banks’ resilience may be lower than suggested by their regulatory capitalisation (cf. Financial Stability Report from 2012 to 2014). To assess the banks’ capital adequacy from an economic standpoint, the SNB conducts stress tests. The focus here is on two scenarios that are particularly relevant for these banks in the light of their risk exposures: the euro area debt crisis scenario and the interest rate shock scenario. According to estimates by the SNB, losses
would be substantial and would deplete a large proportion of banks’ surplus capital under both scenarios. However, losses would be significantly higher under the interest rate shock scenario. Under both scenarios, most domestically focused banks should be able to absorb these losses without seeing their capitalisation fall below the regulatory minimum. Nevertheless, a number of banks are estimated to fall close to or even below the regulatory minimum. Under the interest rate shock scenario, the cumulative market share of these banks would be significant.
The depletion of a large proportion of banks’ surplus capital under both scenarios would lead to a general weakening of the banking sector. Experience in Switzerland and abroad suggests that this could present a challenge for financial stability and significantly affect banks’ ability to lend, with negative repercussions for the real economy.
These results highlight the importance of banks holding significant capital surpluses relative to the regulatory minimum requirements. The activation of the countercyclical capital buffer (CCB) in 2013 and its increase in 2014 made a significant contribution in this respect.
Risk of renewed increase in imbalances on mortgage and real estate marketsGrowth in mortgage volumes and residential real estate prices has stayed roughly in line with fundamentals in recent quarters. As a result, overall, imbalances on the mortgage and residential real estate markets have remained broadly unchanged since the last Financial Stability Report. From a financial stability perspective, this is a positive development.
However, imbalances remain at a high level. In addition, the further decline of capital and money market interest rates, partly into negative territory, following the monetary policy decision in January 2015 carries the risk of a renewed increase in imbalances on the Swiss mortgage and residential real estate markets over the medium term.
First, compared to alternative assets, investments in real estate appear to have become more attractive for banks, commercial investors and households. In the residential investment property segment in particular, additional demand from investors searching for yield might push prices up further.
Second, the unprecedented interest rate environment creates additional incentives for banks to incur higher interest rate and credit risks. Increasing maturity transformation and extending the volume of lending might be ways to compensate for negative liability margins and to stabilise short-term profitability. Such strategies would further increase banks’ exposure to large interest rate shocks and to a correction on the mortgage and real estate markets. Given these risks to financial stability, banks and authorities should remain alert and, if necessary, take measures to contain such risks.

Financial Stability Report 20156
Should momentum on the mortgage and residential real estate markets pick up again, additional measures directly targeting banks’ risk-taking in mortgage lending might become necessary.1 In this regard, particular attention should be paid to the investment property segment. This segment is more likely to be materially affected by the additional demand from investors searching for yield in the current environment. Furthermore, the measures taken so far have predominantly addressed the segment of owner-occupied residential real estate.
Moreover, interest rate risk exposure in the banking book should be appropriately backed with capital. The Basel Committee is currently consulting on policy options to strengthen international standards on capital and disclosure requirements for interest rate risk in the banking book. Given the significance of this risk factor, banks should ensure that they adopt a conservative stance towards the measurement and management thereof. In this context, the SNB supports FINMA’s efforts to ensure that risk-taking by individual banks is reduced or backed by specific capital charges whenever the risk exposure is deemed exceptionally large by historical or industry standards.
In parallel with these measures, the SNB will continue to monitor developments on the mortgage and real estate markets closely, and will reassess the need for an adjustment to the CCB on a regular basis.
1 For a description of the measures taken so far to address risks related to developments on the mortgage and residential real estate markets, cf. SNB, Annual Report, 2012, 2013 and 2014.

Financial Stability Report 2015 7
2 Macroeconomic environment
International economic and financial conditions for the Swiss banking sector have improved over the last 12 months, but substantial risks remain. The domestic environment has become more challenging.
Global conditions have improved overall, although developments have been uneven, with marked differences between the euro area, the US and emerging markets. In the euro area, the economic and financial environment has become more favourable and banking sector reform has progressed. However, uncertainty remains elevated, notably due to the situation in Greece. Furthermore, real GDP is still slightly below its pre-crisis peak for the euro area as a whole (cf. chart 1) and substantially below its peak in southern member states, with negative consequences for credit quality. In the US, positive signs dominate: the economy has grown robustly overall and most indicators point to favourable credit quality. Stock and real estate prices have risen further. In emerging markets, financial conditions have tightened on the whole. On the back of slower economic growth, credit risk premia for corporate and sovereign debt have increased, and stock prices have declined slightly overall.
In Switzerland, conditions were relatively favourable in 2014, but have become more challenging due to the strong appreciation of the Swiss franc that followed the discontinuation of the minimum exchange rate in
January 2015. After a solid expansion in the second half of 2014, economic momentum in Switzerland has slowed markedly. Meanwhile, imbalances on the Swiss mortgage and residential real estate markets have remained broadly unchanged at high levels. The further decline in interest rates on the money and capital markets carries the risk of a renewed increase in imbalances over the medium term, particularly in the residential investment property segment.
More generally, the prolonged period of low interest rates carries risks for global financial stability. A continuation of the low interest rate environment could contribute to a further build-up of existing imbalances, and even to the formation of new ones, for example on bond, stock and real estate markets.
2.1 KEY RISKS
In its analysis, the SNB tracks key economic and financial risks to the Swiss banking sector, focusing on credit quality, real estate and stock markets, banks’ funding conditions and interest rates. Given the highly integrated nature of this sector, the analysis includes both international and domestic developments.
GLOBALLY UNEVEN CREDIT QUALITYIn line with the generally uneven economic conditions, credit quality varies across countries. In the euro area, there have been signs of an improvement in private credit quality over the last 12 months, but sovereign and private credit quality in southern member states remains low. In the US, private credit quality is relatively high, in keeping with the generally favourable economic conditions. In emerging markets, there are signs that sovereign and corporate credit quality decreased, against the backdrop of slower economic growth. In Switzerland, credit quality has deteriorated slightly.
real gdpDeviation from Q1 2008 level, in percent Chart 1
%
–10.0
–7.5
–5.0
–2.5
0.0
2.5
5.0
7.5
10.0
2008 2009 2010 2011 2012 2013 2014 2015
FSR 2014
Euro areaSpain
ItalyUS
Switzerland
Sources: SNB, Thomson Reuters Datastream

Financial Stability Report 20158
Sovereign credit qualityIn the euro area, sovereign credit quality has remained broadly unchanged over the last 12 months, and sovereign risk is still a concern for southern member states. For the euro area as a whole, aggregate public debt relative to GDP and average sovereign risk premia have been stable. Sovereign risk premia are at low levels for most member states, but continue to be considerably above the euro area average in large southern states, with no further declines over the last 12 months (cf. chart 2). In large southern member states, public debt relative to GDP has increased moderately, whereas public deficits have fallen overall.
In the US, the UK and Japan, sovereign risk premia have stayed low, despite public debt levels that are comparable to or above those of southern euro area member states. Inthe US and the UK, public debt relative to GDP has stabilised, whereas in Japan debt has risen further from an already exceptionally high level.
In emerging markets, sovereign risk premia have tended to increase overall, albeit with differences across countries. One of the largest rises occurred in Russia, reflecting falling commodity prices and geopolitical tensions. Public debt in Russia, however, is low from a historical perspective. Substantial increases in risk premia have also been observed in Brazil – another commodity exporter with diminishing growth prospects. In China, by contrast, sovereign risk premia have stayed stable, whereas public debt has continued to trend upwards.
Corporate credit qualityOverall, corporate credit quality in Europe has tentatively improved over the last 12 months, but remains low in southern member states of the euro area. The ratio of credit rating downgrades to total rating changes in Europe has fallen and is below its historical average (cf. chart 3). Currently, the number of firms upgraded exceeds the number downgraded. However, bond spreads on corporate
sovereign credit default swap premiaPremia for credit protection (five-year senior) Chart 2
Basis points
0
200
400
600
800
1 000
1 200
2007 2008 2009 2010 2011 2012 2013 2014 2015
FSR 2014
Germany Spain Italy US Russia China Brazil
Source: Bloomberg
rating downgrades ratioNumber of downgrades relative to total number of rating changes, moving average over four quarters Chart 3
%
30
40
50
60
70
80
90
1995 1996 1997 1998 1999 2000 2001 2002 2003 2004 2005 2006 2007 2008 2009 2010 2011 2012 2013 2014 2015
FSR 2014
Europe* US
* EU-17 countries plus Switzerland, Norway and Iceland.Source: Moody´s
Financial Stability Report 2015 9
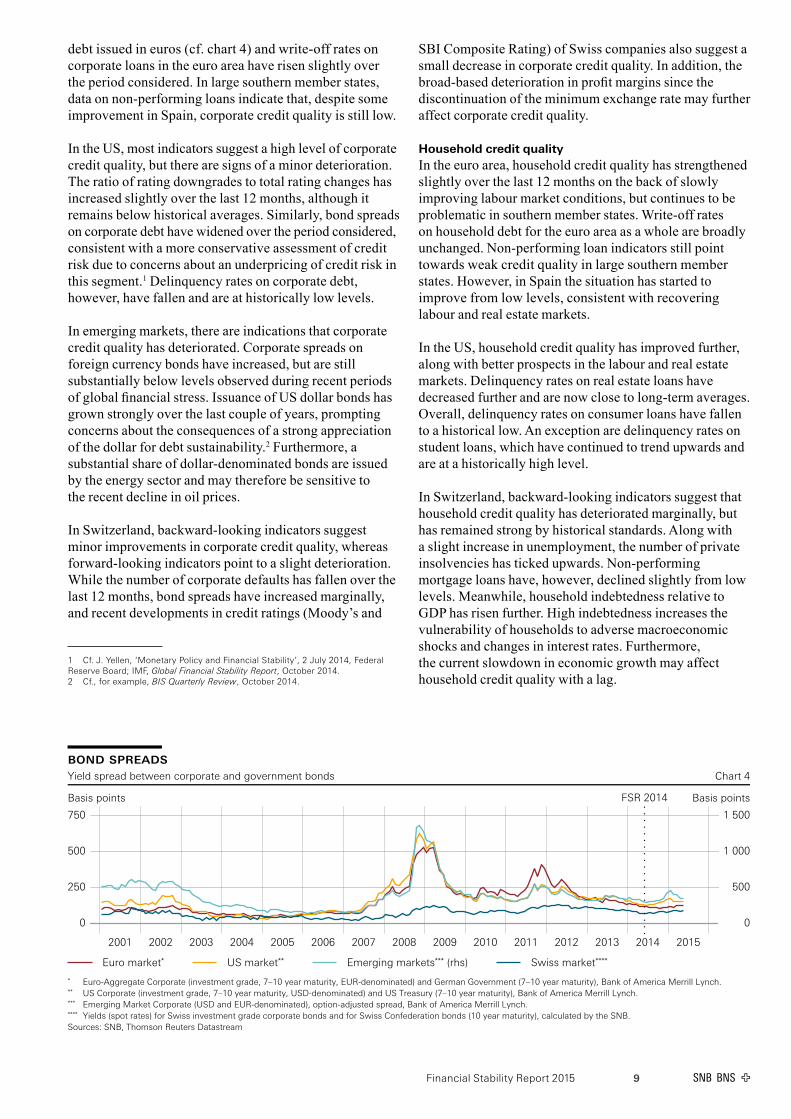
debt issued in euros (cf. chart 4) and write-off rates on corporate loans in the euro area have risen slightly over the period considered. In large southern member states, data on non-performing loans indicate that, despite some improvement in Spain, corporate credit quality is still low.
In the US, most indicators suggest a high level of corporate credit quality, but there are signs of a minor deterioration. The ratio of rating downgrades to total rating changes has increased slightly over the last 12 months, although it remains below historical averages. Similarly, bond spreads on corporate debt have widened over the period considered, consistent with a more conservative assessment of credit risk due to concerns about an underpricing of credit risk in this segment.1 Delinquency rates on corporate debt, however, have fallen and are at historically low levels.
In emerging markets, there are indications that corporate credit quality has deteriorated. Corporate spreads on foreign currency bonds have increased, but are still substantially below levels observed during recent periods of global financial stress. Issuance of US dollar bonds has grown strongly over the last couple of years, prompting concerns about the consequences of a strong appreciation of the dollar for debt sustainability.2 Furthermore, a substantial share of dollar-denominated bonds are issued by the energy sector and may therefore be sensitive to the recent decline in oil prices.
In Switzerland, backward-looking indicators suggest minor improvements in corporate credit quality, whereas forward-looking indicators point to a slight deterioration. While the number of corporate defaults has fallen over the last 12 months, bond spreads have increased marginally, and recent developments in credit ratings (Moody’s and
1 Cf.J.Yellen,‘MonetaryPolicyandFinancialStability’,2 July 2014,FederalReserve Board; IMF, Global Financial Stability Report,October 2014.2 Cf., for example, BIS Quarterly Review,October 2014.
SBI Composite Rating) of Swiss companies also suggest a small decrease in corporate credit quality. In addition, the broad-based deterioration in profit margins since the discontinuation of the minimum exchange rate may further affect corporate credit quality.
Household credit qualityIn the euro area, household credit quality has strengthened slightly over the last 12 months on the back of slowly improving labour market conditions, but continues to be problematic in southern member states. Write-off rates on household debt for the euro area as a whole are broadly unchanged. Non-performing loan indicators still point towards weak credit quality in large southern member states. However, in Spain the situation has started to improve from low levels, consistent with recovering labour and real estate markets.
In the US, household credit quality has improved further, along with better prospects in the labour and real estate markets. Delinquency rates on real estate loans have decreased further and are now close to long-term averages. Overall, delinquency rates on consumer loans have fallen to a historical low. An exception are delinquency rates on student loans, which have continued to trend upwards and are at a historically high level.
In Switzerland, backward-looking indicators suggest that household credit quality has deteriorated marginally, but has remained strong by historical standards. Along with a slight increase in unemployment, the number of private insolvencies has ticked upwards. Non-performing mortgage loans have, however, declined slightly from low levels. Meanwhile, household indebtedness relative to GDP has risen further. High indebtedness increases the vulnerability of households to adverse macroeconomic shocks and changes in interest rates. Furthermore, the current slowdown in economic growth may affect household credit quality with a lag.
bond spreadsYield spread between corporate and government bonds Chart 4
Basis points Basis points
0
250
500
750
2001 2002 2003 2004 2005 2006 2007 2008 2009 2010 2011 2012 2013 2014 2015
0
500
1 000
1 500
FSR 2014
Euro market* US market** Emerging markets*** (rhs) Swiss market****
* Euro-Aggregate Corporate (investment grade, 7–10 year maturity, EUR-denominated) and German Government (7–10 year maturity), Bank of America Merrill Lynch.** US Corporate (investment grade, 7–10 year maturity, USD-denominated) and US Treasury (7–10 year maturity), Bank of America Merrill Lynch.*** Emerging Market Corporate (USD and EUR-denominated), option-adjusted spread, Bank of America Merrill Lynch.**** Yields (spot rates) for Swiss investment grade corporate bonds and for Swiss Confederation bonds (10 year maturity), calculated by the SNB.Sources: SNB, Thomson Reuters Datastream

Financial Stability Report 201510
REAL ESTATE MARKETS MOVE UPWARDS IN MOST ADVANCED ECONOMIESReal estate prices have increased in most advanced economies over the last 12 months, with imbalances persisting in several European countries. Meanwhile, momentum has slowed in emerging markets.
In Europe, real estate markets have generally gained momentum. In the euro area, real estate prices have, overall, reached their trough and started to rise again. In particular, markets are recovering in some countries that have recently experienced a housing crisis, such as Spain. Outside the euro area, price growth has picked up considerably in the UK. Compared to fundamentals such as rents (cf. chart 5), prices remain high in several European countries, including the UK and France.
In the US, prices have continued to rise, but the pace has slowed. As prices have increased broadly in line with
rents, the price-to-rent ratio has stabilised close to its long-term average. In emerging markets, the momentum on real estate markets has weakened overall. Prices have fallen in China and Russia, and remained stable in Brazil.
In Switzerland, price momentum has been moderate overall. Prices in the owner-occupied segment have risen only slightly faster than can be explained by fundamentals such as rents, GDP or population growth. As a result, the imbalances in the apartment sector mentioned in the last Financial Stability Report have since remained broadly unchanged at a high level. In the residential investment property (buy-to-let) segment of the market, prices have continued to rise faster than rents, leading to a further decrease in gross initial yields (i.e. the ratio of rental returns to transaction prices).
It is too early to fully assess the effect of the monetary policy decision in January 2015 on the Swiss real estate
price-to-rent ratio: deviation from average*
Chart 5
%
–40
–20
0
20
40
60
80
87 88 89 90 91 92 93 94 95 96 97 98 99 00 01 02 03 04 05 06 07 08 09 10 11 12 13 14 15
FSR 2014
France Spain US UK Switzerland, apartments Switzerland, single-family houses
* The average is calculated over the period from 1970 to 2015, or over the period for which data are available.Sources: BIS, OECD, SFSO, Thomson Reuters Datastream, Wüest & Partner
stock market indicesDatastream global indices (indexed to 30 May 2014 = 100) and volatility Chart 6
0
40
80
120
160
2004 2005 2006 2007 2008 2009 2010 2011 2012 2013 2014 2015
0
20
40
60
80
FSR 2014
Euro areaUS
UKJapan
Emerging markets (in USD)Switzerland
Volatility index* (rhs)
* The index used is the Chicago Board Options Exchange Market Volatility Index (VIX), which measures the implied volatility of index options on the S&P 500.Source: Thomson Reuters Datastream

Financial Stability Report 2015 11
market. However, over the medium term the further decline in interest rates on the money and capital markets carries the risk of a renewed increase in imbalances, particularly in the residential investment property segment. While slower economic growth and uncertainty about the economic outlook might dampen demand for residential real estate, negative interest rates on the capital and money markets and continuing record low mortgage rates appear to make the buying of real estate particularly attractive. Although yields on real estate investments have decreased steadily over the last few years, they remain high compared to returns on alternative investments. The corresponding yield spread widened further since January 2015.
STOCK PRICES RISE OVERALLStock markets have rallied in Japan over the last 12 months, while prices in the euro area, the UK and the US have grown more moderately (cf. chart 6). In emerging markets,
stock prices have declined slightly overall, with marked differences across countries; in China, for example, stock prices have risen strongly. In Switzerland, stock prices have grown over the same period, despite a large drop in January 2015. Stock market volatility has increased slightly, after having reached the lowest level since the beginning of the financial crisis in June 2014.
In most advanced economies, stock prices have risen faster than earnings over the last 12 months. In the US, the cyclically adjusted price/earnings ratio is slightly above its 40-year average, indicating highly valued stocks (cf. chart 7). Long-term data, which cover more than 100 years, even indicate that the price/earnings ratio is currently substantially above its historical average. In the UK, the euro area and Japan, the price/earnings ratio is below its 40-year average, while in Switzerland, it is close to average. The low interest rate environment carries risks
credit default swap averagesAverage of biggest banks (five-year senior) Chart 8
Basis points
0
100
200
300
400
500
600
700
2005 2006 2007 2008 2009 2010 2011 2012 2013 2014 2015
FSR 2014
France, Germany & Netherlands Italy & Spain US UK Switzerland
Sources: Bloomberg, SNB calculations
ratio of share prices to long-term average earnings: deviation from average*
Chart 7
%
–75
–50
–25
0
25
50
75
100
125
1996 1997 1998 1999 2000 2001 2002 2003 2004 2005 2006 2007 2008 2009 2010 2011 2012 2013 2014 2015
FSR 2014
Euro area US UK Japan Emerging markets (in USD) Switzerland
* The average of earnings is calculated using a ten-year moving average. The average of the price/earnings ratio is calculated over the period from 1985 to 2015, or overthe period for which data are available.
Source: Thomson Reuters Datastream

Financial Stability Report 201512
for stock markets, as a normalisation of interest rates might lead to price declines.
STABLE FUNDING CONDITIONSBanks’ funding conditions have remained broadly unchanged over the last 12 months. Short-term funding conditions for banks, measured by three-month LIBOR-OIS spreads, remain favourable in all major currencies. Meanwhile, CDS risk premia on banks’ medium-term bonds have stabilised, with levels differing considerably across countries (cf. chart 8). Developments in credit risk premia for banks in large southern member states of the euro area roughly parallel those in the corresponding premia for sovereign risk: premia continue to be higher than in other advanced economies and have moved sideways over the last 12 months. Given the large sovereign bond holdings of many European banks, there remains a strong link between the two sectors, and stress in one may spill over to the other.
INTEREST RATES DECLINE FURTHERThe general level of interest rates has decreased further over the last 12 months. Short-term interest rates have remained roughly constant in the US and the UK, but have fallen further in the euro area and Switzerland. In the latter two, interest rates on central bank deposits are currently negative. Meanwhile, the three-month Libor is close to zero in the euro area and below zero in Switzerland.
In most advanced economies, long-term interest rates have declined over the last 12 months, despite an increase in spring 2015 (cf. chart 9). In Switzerland, government bond yields turned negative in early 2015 and have since remained close to zero. Term premia are currently at historically low levels. Bond market volatility has been
generally higher in the last 12 months, as indicated, for example, by the MOVE index.
In the medium term, as economic conditions improve further and monetary policy becomes less accommodative, interest rates should revert to higher levels. Historical experience shows that interest rates can normalise rapidly and unexpectedly. Moreover, interest rates may significantly overshoot long-term averages during the normalisation process.
2.2 SCENARIOS
To capture the different sources of risk to the banking sector, the SNB considers a baseline scenario and four adverse scenarios for developments in the economic environment and in financial market conditions. The baseline scenario describes the most likely outcome given currently available information. By contrast, the adverse scenarios are designed to assess the resilience of the Swiss banking sector against unlikely, highly unfavourable but possible developments in economic and financial conditions. They focus on developments that would be of particular relevance for the Swiss banking sector. All four adverse scenarios concentrate on macroeconomic and financial risks, but exclude operational and legal risks for banks. This is because the materialisation of operational and legal risks is largely independent of the underlying economic scenario. The impact of the different scenarios on the Swiss banking sector as regards banks’ loss potential and resilience is examined in chapter 3.
BASELINE SCENARIOUnder the baseline scenario, international economic conditions for the Swiss banking sector improve, whereas domestic conditions weaken. Economic growth remains
long-term interest rates: ten-year government bonds Chart 9
%
0
2
4
6
8
10
12
1996 1997 1998 1999 2000 2001 2002 2003 2004 2005 2006 2007 2008 2009 2010 2011 2012 2013 2014 2015
0
50
100
150
200
250
300
FSR 2014
Germany Italy US UK Japan Switzerland MOVE index (rhs)
Sources: Bloomberg, Thomson Reuters Datastream

Financial Stability Report 2015 13
above potential in the US and accelerates in the euro area, while some major emerging markets experience weak growth. In Switzerland, the strength of the Swiss franc reduces growth, leading to a moderate increase in unemployment. The environment of historically low interest rates carries the risk of a renewed increase in imbalances on the Swiss mortgage and residential real estate markets, particularly in the residential investment property segment.
ADVERSE SCENARIOSEuro area debt crisis: The debt crisis in the euro area re-escalates. Sovereign risk premia for southern euro area member states rise abruptly, resulting in widespread financial and banking stress. Confidence declines and a deep recession spreads across Europe, originating from the southern member states. Stress in the euro area banking sector and financial markets also spills over to the US and Switzerland, triggering a fall in share prices and a widening of corporate spreads. The severity of the scenario is guided by the global financial crisis in 2008/2009, but is centred on acute banking stress in the euro area, with a recession in Switzerland which is deeper than in 2009 and leads to a sharp drop in Swiss real estate prices. The scenario, while similar to the euro area debt crisis scenario in last year’s Financial Stability Report, features negative interest rates for Switzerland and the euro area.
Emerging market crisis: A major crisis erupts in emerging markets, comparable to the crises during the second half of the 1990s. Emerging market bond spreads rise sharply and stock markets fall. The severe deterioration in financial conditions causes economic growth in these countries to decline sharply, and default rates on corporate and household debt increase substantially. Financial stress is transmitted to advanced economies, including Switzerland,
and stock markets fall sharply. Short-term financing conditions for banks are impaired. The impact on real economic growth in advanced economies is limited. The scenario is similar to the emerging market crisis scenario in last year’s Financial Stability Report.
US recession: There is a severe recession in the US, which spreads to the rest of the world. The deep recession causes US unemployment to surge to historically high levels. There is a significant increase in financial stress, and US real estate and share prices drop sharply. There are also major consequences for the rest of the world. Switzerland, Europe and Japan fall into recession and there is a marked slowdown in emerging markets. The scenario specification is similar to the ‘severely adverse scenario’ of the US Federal Reserve’s 2015 stress test and to the US recession scenario in last year’s Financial Stability Report.
Interest rate shock: Most advanced economies (including Switzerland) experience falling real estate and share prices, coupled with a sudden and substantial increase in interest rates, an inverted yield curve and economic stagnation. For Switzerland, the shocks of the scenario have been calibrated to reflect the severity of events observed in the 1990s. The main difference to the interest rate shock scenario in last year’s Financial Stability Report is that the shocks in the present scenario have an international dimension, while in the previous scenario they were limited to Switzerland.

Financial Stability Report 201514
3 Exposures and resilience
The activities of banks as intermediaries involve risks. These risks can materialise in particular when the economic environment and financial market conditions deteriorate. The ensuing loss potential depends on the scenario assumed and on banks’ exposures. From a financial stability perspective, it is essential that banks hold sufficient capital to absorb potential losses resulting from their activities, even under a very adverse scenario.
The SNB analyses the resilience of the Swiss banking sector by estimating the loss potential under the scenarios described in chapter 2.2 and then comparing this loss potential to banks’ capital. The analysis is performed separately for big banks and domestically focused commercial banks.
3.1 BIG BANKS
Over the past year, the Swiss big banks have continued to improve their capital situation, albeit at a slower pace than the year before. They already meet most of the look-through requirements of the Swiss ‘too big to fail’ regulations and the international Basel III framework, both of which will apply from 2019.
The SNB recommends that the big banks do not lose momentum in their efforts to improve their resilience. This is particularly warranted with regard to the leverage ratio. Resilience needs to be further improved for three reasons: First, the big banks’ loss potential continues to be substantial relative to their capitalisation. Second, while the Swiss big banks’ risk-weighted capital ratios are above the average for large globally active banks, the same cannot yet be said for their leverage ratios. Third, it can be expected that regulatory developments at both international and national level will result in increased capital requirements. The Swiss big banks should prepare for these developments.
In recent years, both markets and authorities worldwide have identified a problem with model-based RWA: in some instances, they do not properly reflect a bank’s economic risks. Against this backdrop, the SNB continues to hold the view that risk-weighted capital requirements (including a floor for model-based RWA) and leverage ratio requirements should complement each other. Risk-weighted requirements should guide economic decisions at the margin, while the leverage ratio should serve as a backstop. Yet, until the measures currently being discussed to resolve the RWA problem take effect – which will
restore the credibility of RWA and establish transparency – it is prudent to give a greater weighting to the leverage ratio when assessing the big banks’ resilience. Indeed, analysts increasingly pay attention to the leverage ratio when assessing and comparing banks.
The next section outlines the exposures and loss potential of the Swiss big banks. This is followed by an assessment of the big banks’ resilience, focusing on the development of the regulatory capital figures, an appraisal of the banks’ capitalisation, the market’s assessment of their resilience, and a discussion of the RWA problem.
3.1.1 ExPOSURES AND IMPACT OF SCENARIOSThe assessment of loss potential is based on an inventory of the big banks’ risk exposures, and on the analysis of these exposures’ sensitivity to a combination of shocks implied in each scenario. The results are described in qualitative terms and illustrated with exposure and balance sheet data. This takes into account, in particular, the fact that risk exposures and sensitivities can be measured in a number of different ways. The size of hedged net positions and sensitivities to shocks cannot be disclosed, as they are based on confidential bank-internal data.
Both big banks publish their own risk assessments, which cannot, however, be directly compared with the SNB’s loss potential estimates, for two reasons. Either they provide statistical measures that are not based on scenarios, or the big banks do not publish information on the severity of the stress scenario applied.
As regards statistical measures of loss potential, Credit Suisse reported a position risk of CHF 21 billion,1 or CHF 35 billion if operational and other risks are included, and UBS reported risk-based capital of CHF 30 billion.2 Owing to different methodologies, these two statistical measures are not directly comparable.
Overall assessment of loss potentialThe big banks’ loss potential under the adverse scenarios has remained broadly unchanged over the last year and is still substantial. The highest loss potential results from the euro area debt crisis scenario and the US recession scenario, followed by the emerging market crisis scenario and the interest rate shock scenario. In general, the loss potential stems primarily from write-downs and losses on loans in Switzerland and the US, counterparty exposure from derivatives and securities financing transactions, and equity positions. Irrespective of the scenarios considered, losses can also result from operational and legal risks.
1 Source:QuarterlyreportforQ1 2015.CreditSuissebasesitscalculationofpositionriskonitsEconomicCapitalModel.Thepositionriskfiguresusedherecorrespond to the statistical loss potential over a one-year horizon. The probability that this level of losses will not be exceeded is 99.97%.2 Source:QuarterlyreportforQ1 2015.UBSbasesitscalculationofrisk-basedcapitalonitsstatisticalriskframework.Therisk-basedcapitalfigurescorrespondto the statistical loss potential over a one-year horizon. The probability that this level of losses will not be exceeded is 99.90%.

Financial Stability Report 2015 15
Substantial loss potential on loans A deterioration of credit quality in Switzerland, as implied by the interest rate shock and euro area debt crisis scenarios, could lead to substantial losses at Switzerland’s two big banks, owing to write-downs and credit defaults. At the end of 2014, they had loans outstanding against domestic clients totalling CHF 323 billion, CHF 264 billion of which in the form of mortgage loans.3 In the past few years, the big banks’ mortgage loan portfolios have grown at a slower pace than the market as a whole. About half of their mortgage loans are linked to real estate in cantons which have registered a particularly strong rise in real estate prices over the last 15 years. However, the regional diversification of the big banks’ mortgage portfolios is well above the average for the rest of the Swiss banks.
A deterioration of credit quality in the US, as described in the euro area debt crisis and US recession scenarios, would lead to substantial losses for the big banks in connection with corporate loans. At end-March 2015, the big banks had unsecured claims outstanding against the private sector (excluding banks) totalling around CHF 75 billion.4 In the case of Credit Suisse, additional losses would materialise from its exposures to real estate and structured assets if these investments were to lose value due to a decline in real estate prices. As an indication of loss potential, Credit Suisse reports a position risk on such instruments of over 17% of its total position risk.5
Substantial loss potential on counterparty exposuresCounterparty exposures result from derivatives and securities financing transactions. Under the four adverse scenarios, they lead to high losses at the Swiss big banks due to financial stress affecting their counterparties. At end-2014, regulatory gross counterparty credit risk exposures amounted to CHF 252 billion, excluding hedges and collateral.6
Substantial loss potential on equities A sharp decrease in share prices around the world could lead to substantial losses, depending on the effectiveness of hedging. At end-March 2015, the big banks’ gross trading portfolios in equities totalled CHF 160 billion.7 These holdings are partly hedged with derivatives positions. As an indication of loss potential, Credit Suisse reports a position risk for equities of around 11% of its total position risk.8
3 Source: SNB.4 Source: SNB. Alongside claims against companies, this also includes claims againstprivatehouseholds.Unsecuredclaimsmayincludetradingandotherliquid assets with comparatively low risk.5 Source:QuarterlyreportforQ1 2015.SinceCreditSuissedoesnotdiscloseanybreakdownofpositionriskbasedonaconfidenceintervalof99.97%,towhich the discussion of total loss potential refers, the breakdown of position risk publishedbyCreditSuisse(whichisbasedonaconfidenceintervalof99%)isused here.6 Sources:UBS,Annual Report,2014;CreditSuisse,Basel III(Pillar 3)disclosures for 2014.7 Sources:QuarterlyreportsforQ1 2015.8 Source:QuarterlyreportforQ1 2015.
3.1.2 RESILIENCEThe analysis of the big banks’ resilience is based on loss-absorbing capital in a ‘going concern’ perspective, on the one hand, and total capital, on the other. Going-concern loss-absorbing capital comprises Common Equity Tier 1 (CET1), using the definition of the look-through Basel III framework, plus high-trigger contingent capital instruments as set out in the Swiss ‘too big to fail’ regulations. The Swiss regulations also define a requirement in the form of low-trigger contingent capital instruments. According to the Federal Council’s ‘too big to fail’ dispatch, these low-trigger contingent capital instruments are primarily aimed at ensuring the maintenance of systemically important functions and the orderly resolution of the residual bank, and are therefore important in a ‘gone concern’ perspective. The sum of CET1 and the two types of contingent capital instruments constitutes total capital.
Capital situation improved furtherOver the past year, the Swiss big banks have further improved their capital situation, albeit at a slower pace than the year before (cf. table 1). Overall, the improvement is mainly due to the issuance of contingent capital instruments – especially low-trigger instruments. At Credit Suisse, two-thirds of the increase in total capital over the past year is attributable to contingent capital instruments, while at UBS, the entire increase is due to contingent capital.9
Both big banks have increased their risk-weighted ‘too big to fail’ (TBTF) capital ratios. Credit Suisse’s TBTF going-concern loss-absorbing capital ratio increased from 12.2%10 in the first quarter of 2014 to 13.0% in the first quarter of 2015, while for UBS, the ratio rose from 13.6% to 14.9% during the same period. Both banks thus comply with the look-through requirements for going-concern loss-absorbing capital which will apply from 2019. As regards total capital, between the first quarter of 2014 and the first quarter of 2015, risk-weighted TBTF capital ratios increased from 14.4% to 16.2% at Credit Suisse, and from 16.8% to 20.6% at UBS. UBS also already meets the risk-weighted total capital requirements applicable from 2019, while Credit Suisse’s ratio is slightly below the required level.11
The banks’ risk-weighted Basel III CET1 capital ratios have also improved. At Credit Suisse, the look-through CET1 ratio increased from 9.3% in the first quarter of 2014
9 Sources:QuarterlyreportsforQ1 2014andQ1 2015.NotethatQ1 2014numbersforCreditSuisseareonaproformabasis(cf. footnote 10).10 To assure comparability with last year’s Financial Stability Report,Q1 2014numbers for Credit Suisse are presented on a pro forma basis. These numbers takeintoaccountthechargearisingfromthesettlementregardingUScross-bordermatters.Accordingtoitspressreleaseof20 May 2014,CreditSuisse’slook-throughBasel IIICET1ratiowouldhavebeen9.3%attheendofQ1 2014had this charge been applied at that time. The other pro forma capital ratios in table 1arederivedfromthisproformaBasel IIICET1ratio.11 Total capital requirements depend on the current size and market share of the big banks. Accordingly, the requirements change over time. Based on currently available data, and assuming that size and market share remain constant, the corresponding total capital requirements as of 2019 are around 17.1% of RWA for CreditSuisseandabout18.4%ofRWAforUBS.Sources:QuarterlyreportsforQ1 2015.

Financial Stability Report 201516
to 10.0% in the first quarter of 2015; at UBS, it rose from 13.2% to 13.7% during the same period. Thus, both big banks comply with their respective international CET1 capital ratio requirement of 8.5% (Credit Suisse) and 8% (UBS), which will apply from 2019.12
Overall, the big banks have also improved their leverage ratios. At Credit Suisse, the TBTF going-concern loss-absorbing leverage ratio13 increased from 3.0% in the first quarter of 2014 to 3.4% in the first quarter of 2015. The corresponding ratio at UBS improved slightly, from 3.1% in the first quarter of 2014 to 3.2% in the first quarter of 2015. Both banks therefore meet the look-through requirements on going-concern loss-absorbing capital (3.1% of total exposure) which will apply from 2019.
12 UnderBaselIII,theSwissbigbanksarerequiredtoholdCET1capitaltotalling8.5%(CreditSuisse)and8.0%(UBS)oftheirRWAfrom2019onwards.Thisrequirementcomprisestheminimumof4.5%,thecapitalconservationbufferof2.5%andthesurchargeforglobalsystemicallyimportantbanksof1.5%inthecaseofCreditSuisseand1.0%inthecaseofUBS.UndertheTBTFregulations,the Swiss big banks are required to hold CET1 capital totalling 10% of their RWA. Thisrequirementcomprisestheminimumof4.5%andabufferof5.5%.13 Thegoing-concernloss-absorbingleverageratioisdefinedastheratio ofloss-absorbingcapitaltoTBTFtotalexposure.Uptoend-2014,thelattercorrespondstototalexposureunderBaselIIIasdefinedinDecember 2010.From2015,TBTFtotalexposurereferstoBaselIIItotalexposureasdefined inJanuary 2014.NotethatUBSpublishesitsTBTFtotalleverageratiobasedonboththeoldandthenewBaselIIIdefinitionoftotalexposure.
In terms of total capital, both banks also comply with the corresponding requirements applicable from 2019.14
Since the beginning of 2015, banks across the world have been required to disclose their Basel III leverage ratios.15 For the first quarter of 2015, Credit Suisse reported a Basel III leverage ratio of 3.6%, and UBS a ratio of 3.4%. Both institutions therefore exceed the minimum level of 3% envisaged by the Basel Committee.
Resilience needs to be strengthened furtherAlthough the big banks already meet most of the look-through regulatory requirements that will apply from 2019, the SNB recommends that both banks do not lose momentum in their efforts to improve their resilience. This is particularly warranted with regard to the leverage ratio.
Resilience needs to be further improved for three reasons.First, the risks associated with economic and financial
14 Inthe‘toobigtofail’regulations,theleverageratioisdefinedrelativetotherisk-weighted requirements. The 3.1% corresponds to the risk-weighted 13% requirementforloss-absorbingcapital.Withregardtothe17.1%(CreditSuisse)and18.4%(UBS)totalcapitalrequirement,theleverageratiois4.1%and4.4%respectively.15 The Basel III rules only require the disclosure of leverage ratios according to the framework’s transitional arrangements. However, the look-through leverage ratio can easily be calculated using other information that is subject to disclosure requirements.
regulatory capital ratios and requirementsLook-through Table 1
Credit Suisse UBS
Q1 2013* Q1 2014on a proformabasis**
Q1 2015 Require-mentfrom 2019
Q1 2013 Q1 2014 Q1 2015 Require-mentfrom 2019
Ratios (in percent)
Basel III CET1 capital ratio 8.6 9.3 10.0 8.5*** 10.1 13.2 13.7 8.0***
TBTF going-concern loss-absorbingcapital ratio 10.0 12.2 13.0 13.0 10.3 13.6 14.9 13.0
TBTF total capital ratio 10.0 14.4 16.2 17.1 11.8 16.8 20.6 18.4
Basel III leverage ratio – – 3.6 – – – 3.4 –
TBTF going-concern loss-absorbing leverage ratio**** 2.3 3.0 3.4 3.1 2.3 3.1 3.2 3.1
TBTF total leverage ratio**** 2.3 3.6 4.2 4.1 2.6 3.8 4.5 4.4
Levels (in CHF billions)
TBTF total capital 29.0 40.3 46.2 – 30.4 38.0 44.5 –
Of which Swiss CET1 24.8 25.9 28.1 – 26.2 29.9 29.6 –
Of which high-trigger contingent capital 4.2 8.2 8.9 – 0.4 1.0 2.6 –
Of which low-trigger contingent capital – 6.1 9.2 – 3.8 7.1 12.3 –
RWA 291 280 284 – 259 227 216 –
TBTF total exposure**** 1 280 1 124 1 103 – 1 175 988 991 –
* In its quarterly report for Q1 2013, Credit Suisse published a TBTF going-concern loss-absorbing capital ratio of 11.0% (p. 48). In addition to fully implemented loss-absorbingcapital as defined in theFinancial Stability Report, Credit Suisse’s figure also comprises securities,which FINMA advised may be included until end-2018 at the latest (cf. also2013 Financial Stability Report).
** Taking into account the charge arising from the settlement regarding US cross-border matters. According to its press release of 20 May 2014, Credit Suisse’s look-throughBasel III CET1 ratio would have been 9.3% at the end of Q1 2014 had this charge been applied at that time. The other pro forma capital figures in table 1 are derived fromthis pro forma Basel III CET1 ratio. Cf. also footnote 10.
*** Under the TBTF regulations, the Swiss big banks are required to hold CET1 capital totalling10% of their RWA.**** From 2015, TBTF total exposure refers to Basel III total exposure as defined in January 2014. TBTF total exposure figures for Q1 2013 are phase-in values.
Sources: Quarterly reports of Credit Suisse and UBS

Financial Stability Report 2015 17
conditions remain high (cf. chapter 2). The big banks’ loss potential relative to their capitalisation continues to be substantial, both under the adverse scenarios considered by the SNB and when measured on the basis of the losses experienced during the recent financial crisis.16 For financial stability in Switzerland, it is important that the big banks remain adequately capitalised, even in the event of such losses occurring. While the adverse scenarios reflect unlikely, highly unfavourable developments in economic and financial conditions, they are not overly conservative. The loss potential derived from these scenarios is well below the losses experienced in the financial crisis, even after taking into account the fact that the big banks reduced their total assets and RWA. In addition, the losses experienced during the financial crisis were contained by extensive public support measures.
Second, an international comparison of the regulatory capital ratios of the Swiss big banks reveals an uneven picture with regard to resilience. While their risk-weighted capital ratios are above the average for large globally active banks,17 the same cannot yet be said for their leverage ratios. For instance, their Basel III leverage ratios
16 Foranestimateoflossesintherecentfinancialcrisis,cf.BankofEngland,‘TheFinancialPolicyCommittee’sreviewoftheleverageratio’,October 2014.This estimated that losses were up to 9% of banks’ balance sheets.17 ThiscomparisonisbasedonBaselIIITier 1capitalratios.Thisensuresthatcontingent capital instruments, which are loss-absorbing in a going-concern perspective, are also taken into account. Since these instruments play an importantroleintheSwiss‘toobigtofail’regulations,theSwissbigbanks’Tier 1capital – particularly that of Credit Suisse – is not made up exclusively of CET1 capital.
are below average.18 Improving the leverage ratio, including in an international comparison, is of particular significance given that the ratio is gaining in importance as a measure of banks’ resilience and that, as experience has shown, it can quickly become the focus of market attention during a crisis. The requirement – applicable since the beginning of 2015 – to disclose leverage ratios under Basel III enables a direct international comparison.
Third, it can be expected that regulatory developments at both international and national level will result in increased capital requirements, especially for the big banks (cf. ‘International and national developments regarding capital regulations’, p. 19). It is important that the big banks prepare for this expected future increase in international and Swiss capital requirements by strengthening their resilience.
Market assessment of big banks’ resilienceMarket prices such as CDS premia provide an indication of how the market assesses the banks’ resilience. The greater the credit risk and the lower the assessment of resilience, the higher the premium on a given CDS. According to CDS premia, the market assesses the resilience of the Swiss big banks as above average or average in an international comparison. Following a marked decline after the peak of the financial crisis,
18 Cf.alsoIMF,‘Switzerland:ConcludingStatementofthe2015ArticleIVMission’,23 March 2015.Withinthecontextofitsannualcountryreport,theIMFagain recommends that leverage ratios be quickly brought into line with those of other large globally active banks.
international comparison of cds premiaPremia for credit protection (five-year senior) Chart 10
Basis points
0
50
100
150
200
250
300
350
400
05 06 07 08 09 10 11 12 13 14 15
Credit SuisseMedian of large globally active banks
UBS
Source: Bloomberg

Financial Stability Report 201518
CDS premia of both Swiss and other large globally active banks have since been relatively stable (cf. chart 10).
However, market prices give a distorted picture of globally active banks’ resilience, because they include market expectations as regards the probability and effectiveness of government support in a crisis (‘too big to fail’ issue). For example, CDS premia reflect the market’s view of the likelihood that the underlying credit will be repaid. It is irrelevant who repays the investment – the bank or a third party, such as the government. Therefore, market prices overstate globally active banks’ intrinsic resilience in general.
Credit ratings from Moody’s and Standard & Poor’s (S&P) explicitly reflect the fact that the ‘too big to fail’ issue is not yet resolved.19 These ratings still include the expectation of government support. However, efforts to address the ‘too big to fail’ issue have already had an impact: all major rating agencies have reduced or are in the process of reducing the rating uplifts resulting from government support for large globally active banks.20 This reflects, in particular, more stringent restrictions imposed on authorities regarding the use of public funds for bank bailouts, as well as improved resolvability and resolution measures.
RWA problem identified, but not yet resolvedRWA play a key role in the capital regulation of banks. In general, there are two approaches to calculating RWA: the standardised approach, which prescribes risk weights for predefined classes of positions; and the model-based approach, under which the banks use their own internal models to calculate the risk weights of different positions.
In recent years, both markets’ and authorities’ confidence in model-based RWA has steadily declined.21 In theory, a bank’s risks can be more accurately quantified using the model-based approach than using the standardised approach. In practice, however, market participants, analysts and authorities worldwide are questioning the extent to which such model-based RWA actually reflect a bank’s economic risks, ensure an adequate level of resilience and allow comparison across banks.
A number of international and national studies have shown that the concerns over model-based RWA are justified. For instance, international studies have revealed significant differences in RWA between banks using the model-based approach. These can only be partially explained by differences in the level of risk taken by the banks. In
19 Cf. also IMF, ‘How big is the implicit subsidy for banks seen as too important to fail?’ in: Global Financial Stability Report,April 2014.Inits‘toobigtofail’report, the Federal Council also noted that the ‘too big to fail’ issue was not yet resolvedinSwitzerland(cf.FederalCouncil,‘Toobigtofail’,18 February 2015).20 For example, Moody’s has recently lowered this rating uplift for most globally active banks. Cf. Moody’s Investor Service, ‘Moody’s concludes reviews on 13 globalinvestmentbanks’ratings’,28 May 2015.ForS&P,cf.,forexample,‘S&PTakesVariousRatingActionsOnCertainU.K.,German,Austrian,AndSwissBanksFollowingGovernmentSupportReview’,3 February 2015.21 Cf., in this regard, SNB, Financial Stability Report, 2012, 2013 and 2014.
studies carried out by the Basel Committee, the participating banks were asked to calculate the RWA for identical hypothetical portfolios, using their models. The highest value of RWA calculated in this manner was more than twice the lowest value.22
Studies at national level have also shown that model-based RWA are too low in some cases. For example, at the end of 2012, FINMA, in an analysis of domestic residential mortgages, concluded that the average risk weights used in internal models were around four times lower than those under the standardised approach. A more comprehensive comparison – conducted by FINMA with the support of the SNB – of the big banks’ RWA for credit risk using model-based and standardised approaches, showed that these RWA are also too low in other portfolios.23 As a result, the big banks’ effective risks in some portfolios are not adequately reflected by model-based RWA, and thus not appropriately backed with capital. Based on these analyses, FINMA has introduced an initial set of corrective measures, mainly imposing specific multipliers for individual institutions.24
Various international and national regulatory initiatives have been launched (cf. ‘International and national developments regarding capital regulations’, p. 19), with the aim of addressing the RWA problem. At international level, a number of working groups of the Basel Committee are looking at the calculation of RWA. A key element of the set of measures currently being discussed is the introduction of a floor for internally modelled RWA based on the revised standardised approach. At national level, the results of the aforementioned RWA comparison, in addition to the measures already taken by FINMA and those expected at international level, will be taken into account by a working group led by the FDF. This working group will draw up proposals and the associated legal adjustments for implementing the recommendations in the Federal Council’s ‘too big to fail’ evaluation report.
Alongside these regulatory initiatives, the SNB still considers it necessary that the big banks increase transparency with regard to RWA.25 At international level, the largest US banks report their credit risk RWA according to both the model-based and standardised approaches. At national level, FINMA has now called on the banks to disclose the differences between calculations using the model-based and standardised approaches.26 Disclosure of RWA according to the standardised approach
22 Cf. Basel Committee on Banking Supervision, Regulatory consistency assessment programme (RCAP) – Analysis of risk-weighted assets for market risks, January 2013;Regulatory consistency assessment programme (RCAP) – Analysis of risk-weighted assets for credit risk in the banking book,July 2013.Forthisstudy,risk weights were reported rather than RWA; cf. also EBA, Interim results of the EBA review of the consistency of risk-weighted assets,26 February2013;Barclays,The dog that dug,21 September 2012.23 Cf. ‘Models and their limitations’, FINMA Annual Media Conference,31 March 2015.24 Thesemultiplierswillbephasedinandbecomefullyeffectivebythebeginningof2019.Sources:Banks’quarterlyreportsforQ1 2015.25 Cf., in this regard, Financial Stability Report, 2012, 2013 and 2014.26 Cf. ‘Models and their limitations’, FINMA Annual Media Conference,31 March 2015.

Financial Stability Report 2015 19
would provide a benchmark for model-based RWA and facilitate comparison across banks.27 Such enhanced transparency is necessary to restore the credibility of model-based RWA and to strengthen market discipline.
The SNB continues to hold the view that risk-weighted capital requirements (including a floor for model-based RWA) and leverage ratio requirements should complement each other. Risk-weighted requirements should guide economic decisions at the margin, while the leverage ratio should serve as a backstop. Yet, until the international and national measures to resolve the RWA problem take effect – which will restore the credibility of RWA and establish transparency – it is prudent to give a greater weighting to the leverage ratio when assessing the big banks’ resilience. Indeed, analysts increasingly pay attention to the leverage ratio when assessing and comparing banks.
27 Analysts’ estimates of RWA according to the standardised approach show that there is a market demand for such a parallel calculation. Cf., for example, the UBScalculationwhichyieldsanestimateofRWAforcreditriskatCreditSuissebased on the standardised approach that is around double the level of model-basedRWA.Sources:‘CreditSuisseGroup:RWAupwardpressurecouldresultinlowercashdividends’,UBSGlobalResearch,25 November 2014.
3.2 DOMESTICALLY FOCUSED COMMERCIAL BANKS
In 2014, domestically focused banks further increased their exposure to the Swiss mortgage and residential real estate markets. While the share of new loans with high LTI ratios – a measure of affordability risk – remained persistently high, mortgage lending growth and the share of new mortgage loans with a high LTV ratio decreased. Hence, the increase in exposure was lower than in previous years. These developments occurred against the backdrop of broadly unchanged imbalances on the mortgage and real estate markets.
With respect to capitalisation, the situation at these banks remained largely unchanged in 2014. First, the domestically focused banks’ available capital increased in step with the size of their balance sheets. Hence, despite pressure from historically low interest rate margins on profitability and continued growth of their balance sheets, their leverage ratio remained stable at high levels by historical standards. This was mainly the result of increased profit retention. Second, their risk-weighted capital ratios increased slightly compared to 2013 and are significantly above regulatory minimum requirements overall.
International and national developments regarding capital regulations
Regulatory developments at international level The Basel Committee on Banking Supervision is formulating a set of measures to improve risk-weighted capital requirements. These measures are based on the principle that model-based and standardised approaches should complement each other. Enhanced transparency is likely to be a key component of these measures. The measures under discussion are threefold. First, the standardised approach is to be fundamentally revised. Second, the Basel Committee is examining the introduction of a floor for internally modelled RWA based on the revised Basel III standardised approach. The floor would be designed to ensure that the RWA of banks using internal models do not fall below a prudent level. Third, the Committee aims to improve certain elements of the model-based approach, too. Regulatory developments at national level In February 2015, the Federal Council identified a need for action with regard to ‘too big to fail’ regulations,1 and commissioned a working group led by the FDF to
1 Cf.FederalCouncil,‘Toobigtofail’,18February2015.
draw up proposals and the associated legal adjustments required.2 The proposals are aimed at solving the ‘too big to fail’ issue, which, as measured by the ratio between the big banks’ total assets and domestic GDP, is particularly pronounced in Switzerland. The Federal Council is building on the recommendations made by the group of experts on the further development of the financial market strategy (Brunetti group of experts).3 The need for action identified in the field of capital regulation involves, in particular, a recalibration of the capital requirements for systemically important banks. Both risk-weighted and leverage ratio requirements should rank among the highest internationally. The recalibration of capital requirements will take into account the results of a comparison between RWA calculated using the model-based and standardised approaches, which was conducted by FINMA – together with the big banks and with the support of the SNB – as well as the measures already taken by FINMA and those expected at international level.
2 Cf.FederalCouncilpressreleaseof18February2015.3 Cf. Final report by the group of experts on the further development of the financialmarketstrategy,1December2014.
Financial Stability Report 201520
From an economic perspective, domestically focused banks’ resilience may be lower than suggested by their regulatory capitalisation. While stress test results suggest that most banks should currently be able to withstand relevant adverse scenarios, they also emphasise the importance of banks holding significant capital surpluses relative to the regulatory minimum requirements. Hence, when defining their capital plans and lending or interest rate risk policy, banks should ensure that they are able to absorb the potential losses associated with significant adverse shocks. Caution is especially warranted in the current context of exceptionally low interest rates.
The next section outlines the exposures and loss potential of the domestically focused banks. Chapter 3.2.2 provides an assessment of these banks’ resilience, focusing on the development of the regulatory capital figures and an appraisal of the banks’ capitalisation from an economic point of view.
3.2.1 ExPOSURES AND IMPACT OF SCENARIOSSlower increase in mortgage lending volumeIn 2014, mortgage lending growth of domestically focused banks decreased to 4.3% from 5.1%28 at end-2013, parallel to the market as a whole (3.6% compared to 4.3% at end-2013).29 As a result of the reduced momentum, the mortgage-to-GDP ratio increased at a slower pace. Moreover, imbalances as measured by the difference between the mortgage-to-trend GDP ratio and its long-term trend remained broadly unchanged at a high level in 2014. Data for the first quarter of 2015 suggest that mortgage growth has remained broadly unchanged since end-2014.
28 Thisfigurediffersfromtheonereportedinlastyear’sFinancial Stability Report due to changes in the sample of banks.29 Figures refer to nominal growth rates.
Meanwhile, the further decline in interest rates on the money and capital markets following the monetary policy decision in January 2015 – in some cases, they have been well into negative territory since early 2015 – carries the risk of a renewed increase in imbalances on the mortgage and residential real estate markets in the medium term. Falling interest rates appear to have increased the attractiveness of real estate investments compared to alternative assets. This may lead to additional demand and to subsequent pressure on prices, in particular for the residential investment property segment.
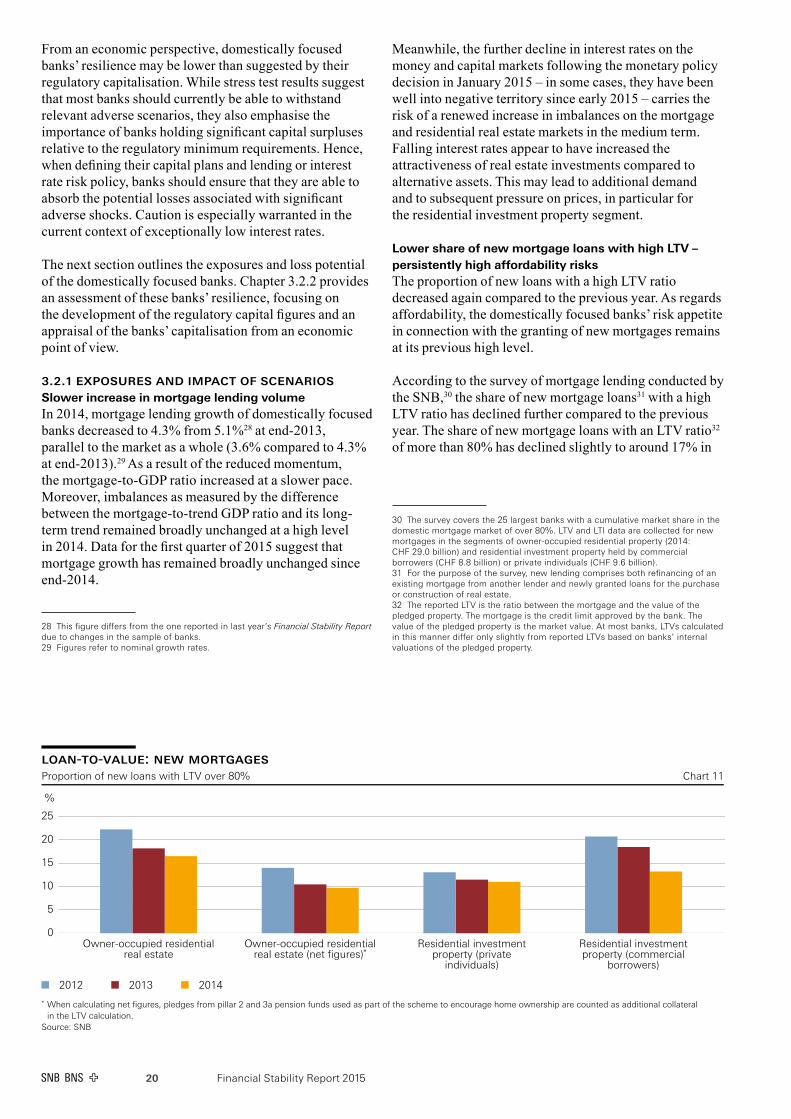
Lower share of new mortgage loans with high LTV – persistently high affordability risksThe proportion of new loans with a high LTV ratio decreased again compared to the previous year. As regards affordability, the domestically focused banks’ risk appetite in connection with the granting of new mortgages remains at its previous high level.
According to the survey of mortgage lending conducted by the SNB,30 the share of new mortgage loans31 with a high LTV ratio has declined further compared to the previous year. The share of new mortgage loans with an LTV ratio32 of more than 80% has declined slightly to around 17% in
30 Thesurveycoversthe25largestbankswithacumulativemarketshareinthedomesticmortgagemarketofover80%.LTVandLTIdataarecollectedfornewmortgages in the segments of owner-occupied residential property (2014: CHF 29.0 billion)andresidentialinvestmentpropertyheldbycommercialborrowers(CHF 8.8 billion)orprivateindividuals(CHF 9.6 billion).31 Forthepurposeofthesurvey,newlendingcomprisesbothrefinancingofanexisting mortgage from another lender and newly granted loans for the purchase or construction of real estate.32 ThereportedLTVistheratiobetweenthemortgageandthevalueofthepledged property. The mortgage is the credit limit approved by the bank. The valueofthepledgedpropertyisthemarketvalue.Atmostbanks,LTVscalculatedinthismannerdifferonlyslightlyfromreportedLTVsbasedonbanks’internalvaluations of the pledged property.
loan-to-value: new mortgagesProportion of new loans with LTV over 80% Chart 11
%
0
5
10
15
20
25
Owner-occupied residentialreal estate
Owner-occupied residentialreal estate (net figures)*
Residential investmentproperty (private
individuals)
Residential investmentproperty (commercial
borrowers)
2012 2013 2014
* When calculating net figures, pledges from pillar 2 and 3a pension funds used as part of the scheme to encourage home ownership are counted as additional collateralin the LTV calculation.
Source: SNB

Financial Stability Report 2015 21
gross terms, or about 10% in net terms33 in the owner-occupied residential property segment, and to around 11% in the case of residential investment property held by private individuals. For residential investment property held by commercial borrowers, the data indicate a more pronounced decline in the proportion of new mortgages with a high LTV ratio, from 18% to 13% (cf. chart 1134).
By contrast, affordability risks measured by the LTI ratio were broadly unchanged year-on-year and remain high in all segments (cf. chart 12). The SNB survey indicates that, in 2014, for 42% of the new mortgage volume granted for financing owner-occupied residential property, the imputed costs35 would exceed one-third of gross wage or pension income at an interest rate of 5%. In the residential investment property segment, similar levels of affordability risk are discernible for properties held by private individuals, while affordability risk appears slightly lower for properties held by commercial borrowers. At an interest rate of 5%, the imputed costs would no longer be covered by net rents for nearly 42% of the new mortgage volume for private individuals and around 32% for commercial borrowers. When interpreting these figures, it should be borne in mind that they are based on a standardised definition of income and hence
33 Whencalculatingnetfigures,pledgesfrompillar 2and3apensionfundsusedas part of the scheme to encourage home ownership are counted as additional collateralintheLTVcalculation.Itshould,however,benotedthattheeffectivenessoftheprotectionprovidedbysuchadditionalcollateralagainstcredit losses in the banking sector in the event of a major price correction in the Swiss real estate market remains untested.34 Valuesaggregatedoverthecalendaryearaccordingtomortgagelendingvolume.35 The imputed costs used for this estimate comprise the imputed interest rate (5%)plusmaintenanceandamortisationcosts(1%each).Theaveragemortgagerateoverthelast50 yearsisalmost5%.
can deviate from a bank’s own measure of affordability risk based on internal definitions.36
Affordability risk remains highly relevant, despite the ongoing trend towards a higher proportion of loans with medium-term repricing maturities, which offer some protection to borrowers against the effects of rising interest rates. Based on figures for end-2014, the share of the mortgage volume with a repricing maturity of more than five years has increased slightly from last year, yet still amounts to roughly 25%. Consequently, around 75% of the mortgage volume would be affected by an interest rate shock over a five-year time horizon. Moreover, roughly 35 – 45% of the mortgage volume even has a repricing maturity that is shorter than 12 months.37 Hence, a very high proportion of the loan volume would be affected in the short or medium term following an interest rate change.
Further narrowing of interest rate marginsIn 2014, the average interest rate margin on outstanding claims of domestically focused commercial banks decreased by a further 6 basis points. It has declined by more than 50 basis points or about one-quarter since 2007 (cf. chart 13).38 This development, which is homogeneous
36 Thestandardiseddefinitionofincomeusesonlytheborrower’semploymentorpensionincome.Otherelementswhichhaveapositiveimpactonaffordability(e.g.bonusesandinvestmentincome),aswellasthosewhichhaveanegativeimpact(e.g.leasingorinterestpaymentsonotherbankloans),arenottakenintoconsideration. On average, eligible income according to internal bank guidelines exceedsstandardisedincomeby15–20%;however,differencesbetweenbanksareconsiderable.Asbanksapplydifferentcreditpolicies,theincomecalculatedaccording to banks’ internal guidelines – in contrast to standardised income – is neither directly comparable between banks, nor can it be used for calculating aggregate LTI values.37 Source: SNB statistics.38 Interest rate margins are approximated as net interest income divided by the sumofmortgageclaims,claimsagainstcustomersandfinancialclaims.
loan-to-income: new mortgagesProportion where imputed costs exceed 1/3 of income (owner-occ.) or rents (inv. prop.) at an interest rate of 5% Chart 12
%
0
10
20
30
40
50
Owner-occupied residentialreal estate
Residential investment property(private individuals)
Residential investment property(commercial borrowers)
2012 2013 2014
Source: SNB

Financial Stability Report 201522
across banks, may be attributed to the significant decline in the liability margin.39 The fall in the liability margin stems from the fact that banks have not reduced interest rates on deposits in step with the general level of interest rates.
The pressure on these banks’ core business margins is likely to persist as a result of the introduction of negative interest on sight deposit account balances at the SNB. While interest rates on sight and savings deposits – at least for retail customers – have remained broadly unchanged at levels close to zero, some capital and money market interest rates have been negative since early 2015. As a consequence, liability margins have slipped further into negative territory. This situation is highly unusual,
39 Theliabilitymarginisthedifferencebetweenalternativefundingcostsforthesame maturity on the capital market and the interest paid on the liability. The assetmarginisthedifferencebetweentheinterestontheassetandonthealternative asset with the same maturity on the capital market.
if not unique, by historical standards. In addition, the negative interest charged on sight deposits at the SNB which exceed a certain exemption threshold affects banks’ margins directly. For most domestically focused banks, the negative interest levied on these account balances, however, is small relative to their overall earnings.
Banks have reacted to the further decline of capital and money market interest rates following the monetary policy decision in January 2015 by increasing their asset margin on new mortgages (cf. chart 14). Moreover, a number of banks are applying negative interest rates or higher fees on large deposits from firms and institutional clients. It is questionable, however, whether banks have the capacity to further increase or even maintain their current asset margin on new mortgage lending in order to compensate for the overall pressure on their profitability. Mortgage lending appears particularly attractive in the current interest rate environment, both for banks and non-banks
published interest rates on new fixed rate mortgages and swap ratesEqually weighted average Chart 14
%
–1.0
–0.5
0.0
0.5
1.0
1.5
2.0
2.5
3.0
Jan 14 Feb Mar Apr May Jun Jul Aug Sep Oct Nov Dec Jan 15 Feb Mar Apr May
Fixed rate mortgages, 2 yearsFixed rate mortgages, 5 years
Fixed rate mortgages, 10 yearsSwap rate, 2 years
Swap rate, 5 yearsSwap rate, 10 years
Sources: Bloomberg, SNB
interest rate margin of domestically focused commercial banksNet interest income divided by the sum of mortgage claims, claims against customers and financial claims, weighted average Chart 13
%
1.2
1.3
1.4
1.5
1.6
1.7
1.8
1.9
1995 1996 1997 1998 1999 2000 2001 2002 2003 2004 2005 2006 2007 2008 2009 2010 2011 2012 2013 2014
Sources: FINMA, SNB

Financial Stability Report 2015 23
such as insurance companies or pension funds searching for higher yields on their investments. As a consequence, competition with non-banks in particular might limit banks’ flexibility in setting higher mortgage rates. Thus, the current interest rate environment represents an increasingly difficult challenge for domestically focused banks’ profitability and capital situation.
Persistently high interest rate riskDirect interest rate risk40 in the banking book41 of domestically focused commercial banks – as measured by the impact of a positive interest rate shock on the bank’s net present value42 – has remained broadly unchanged, at a high level, since 2013 (cf. chart 15). If the general level of interest rates were to rise by 200 basis points, the net present value of these banks would decline on average by 13.9% of their Tier 1 capital (2013: 13.3%43). The variation in interest rate risk among these banks is considerable. Excluding banks below the first and above the ninth deciles, the impact ranges from an increase in net present value of 5.0% of their Tier 1 capital (2013: 5.2%) to a decline of 21.3% (2013: 19.5%).
It must be stressed that the uncertainty regarding the banks’ actual exposure to interest rate risk is particularly high in the current interest rate environment. An interest rate increase would help banks restore their liability margin (cf. ‘Further narrowing of interest rate
40 Directinterestrateriskcanresultfromamismatchbetweentherepricingmaturities of a bank’s assets and liabilities. Banks typically use short-term liabilitiestorefinancelong-termloans.Asaresultofsuchmaturitytransformations, interest rates on assets are locked in for longer than interest rates on liabilities. If a bank is in this position, a rise in the interest rate level will reducethepresentvalue(cf.footnote42)ofassetsmoresubstantiallythanthepresent value of liabilities.41 The interest rate risk measure includes all positions in the banking book (excludingnon-linearderivatives),plusthesecuritiesandpreciousmetalstradingportfolio, less short securities positions.42 The present value of a balance sheet position corresponds to its expected futurecashflowdiscountedbytherelevantrisk-freeinterestrate.43 Thisfigurediffersfromtheonereportedinlastyear’sFinancial Stability Report due to changes in the sample of banks.
margins’, p. 21). This effect – which is not captured by the net present value analysis – might offset the negative impact of a moderate interest rate shock on a bank’s net interest income due to maturity transformation. As a consequence, the sensitivity of the net present value to an interest rate shock would overestimate a bank’s actual exposure to direct interest rate risk.44 The further decline of interest rates on the capital and money markets, partly into negative territory, since January 2015 should reinforce this effect.
At the same time, as discussed in detail in the 2013 Financial Stability Report, the net present value analysis described above may underestimate the actual exposure to substantial interest rate shocks. For positions with undefined repricing maturities,45 this measure is based on banks’ assumptions about the repricing maturity of such positions. The negative impact of a substantial interest rate rise on the net present value could be significantly higher if the actual repricing maturity of these positions is shorter than assumed by banks.
Substantial loss potential under adverse scenarios Two of the scenarios discussed in chapter 2.2 are of particular relevance for domestically focused banks: the euro area debt crisis scenario and the interest rate shock scenario.46 According to SNB estimates, losses would be substantial under both scenarios but significantly higher under the interest rate shock scenario, owing to these banks’ strong focus on the Swiss mortgage market.47
44 More generally, the net present value analysis cannot be used to draw direct conclusions about the impact of an interest rate shock on net interest income.45 Positionswithundefinedrepricingmaturitiesinclude:ontheassetsside,sight claims, claims against customers and variable rate mortgage claims; on the liabilities side, sight liabilities and savings deposits.46 Irrespective of the scenarios considered, losses can also result from operational and legal risks.47 Thescenariosaredefinedoverafive-yearhorizon.
interest rate risk of domestically focused commercial banksLosses in net present value as a percentage of Tier 1 capital, assuming a 200 bp interest rate rise Chart 15
%
–20
–15
–10
–5
0
5
10
15
20
25
2002 2003 2004 2005 2006 2007 2008 2009 2010 2011 2012 2013 2014
Weighted average Median Decile 4–6 Decile 3–7 Decile 2–8 Decile 1–9
Sources: FINMA, SNB
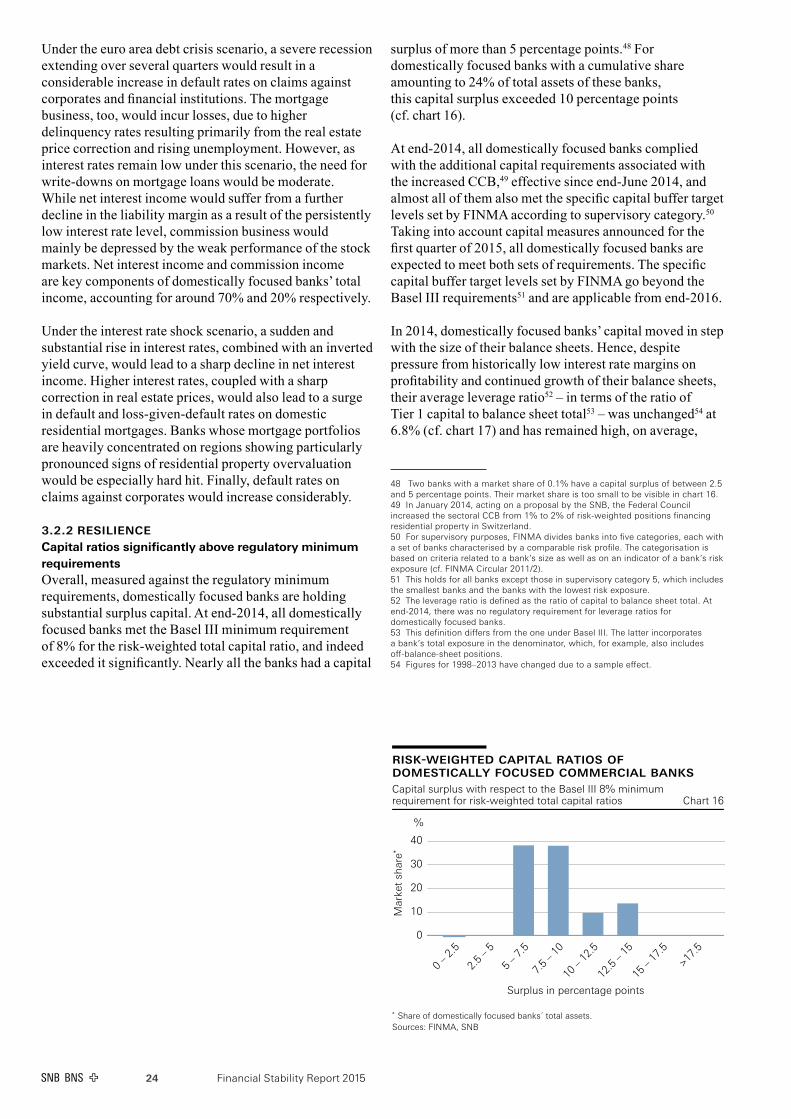
Financial Stability Report 201524
Under the euro area debt crisis scenario, a severe recession extending over several quarters would result in a considerable increase in default rates on claims against corporates and financial institutions. The mortgage business, too, would incur losses, due to higher delinquency rates resulting primarily from the real estate price correction and rising unemployment. However, as interest rates remain low under this scenario, the need for write-downs on mortgage loans would be moderate. While net interest income would suffer from a further decline in the liability margin as a result of the persistently low interest rate level, commission business would mainly be depressed by the weak performance of the stock markets. Net interest income and commission income are key components of domestically focused banks’ total income, accounting for around 70% and 20% respectively.
Under the interest rate shock scenario, a sudden and substantial rise in interest rates, combined with an inverted yield curve, would lead to a sharp decline in net interest income. Higher interest rates, coupled with a sharp correction in real estate prices, would also lead to a surge in default and loss-given-default rates on domestic residential mortgages. Banks whose mortgage portfolios are heavily concentrated on regions showing particularly pronounced signs of residential property overvaluation would be especially hard hit. Finally, default rates on claims against corporates would increase considerably.
3.2.2 RESILIENCECapital ratios significantly above regulatory minimum requirementsOverall, measured against the regulatory minimum requirements, domestically focused banks are holding substantial surplus capital. At end-2014, all domestically focused banks met the Basel III minimum requirement of 8% for the risk-weighted total capital ratio, and indeed exceeded it significantly. Nearly all the banks had a capital
surplus of more than 5 percentage points.48 For domestically focused banks with a cumulative share amounting to 24% of total assets of these banks, this capital surplus exceeded 10 percentage points (cf. chart 16).
At end-2014, all domestically focused banks complied with the additional capital requirements associated with the increased CCB,49 effective since end-June 2014, and almost all of them also met the specific capital buffer target levels set by FINMA according to supervisory category.50 Taking into account capital measures announced for the first quarter of 2015, all domestically focused banks are expected to meet both sets of requirements. The specific capital buffer target levels set by FINMA go beyond the Basel III requirements51 and are applicable from end-2016.
In 2014, domestically focused banks’ capital moved in step with the size of their balance sheets. Hence, despite pressure from historically low interest rate margins on profitability and continued growth of their balance sheets, their average leverage ratio52 – in terms of the ratio of Tier 1 capital to balance sheet total53 – was unchanged54 at 6.8% (cf. chart 17) and has remained high, on average,
48 Twobankswithamarketshareof0.1%haveacapitalsurplusofbetween2.5and5 percentagepoints.Theirmarketshareistoosmalltobevisibleinchart 16.49 InJanuary 2014,actingonaproposalbytheSNB,theFederalCouncilincreasedthesectoralCCBfrom1%to2%ofrisk-weightedpositionsfinancingresidential property in Switzerland.50 Forsupervisorypurposes,FINMAdividesbanksintofivecategories,eachwithasetofbankscharacterisedbyacomparableriskprofile.Thecategorisationisbased on criteria related to a bank’s size as well as on an indicator of a bank’s risk exposure(cf. FINMACircular 2011/2).51 Thisholdsforallbanksexceptthoseinsupervisorycategory 5,whichincludesthe smallest banks and the banks with the lowest risk exposure. 52 Theleverageratioisdefinedastheratioofcapitaltobalancesheettotal.Atend-2014, there was no regulatory requirement for leverage ratios for domestically focused banks.53 ThisdefinitiondiffersfromtheoneunderBaselIII.Thelatterincorporatesa bank’s total exposure in the denominator, which, for example, also includes off-balance-sheetpositions.54 Figuresfor1998–2013havechangedduetoasampleeffect.
risk-weighted capital ratios ofdomestically focused commercial banksCapital surplus with respect to the Basel III 8% minimumrequirement for risk-weighted total capital ratios Chart 16
%
Mar
ket
shar
e*
0
10
20
30
40
0 – 2
.5
2.5
– 5
5 – 7
.5
7.5
– 10
10 –
12.5
12.5
– 15
15 –
17.5
>17.5
Surplus in percentage points
* Share of domestically focused banks´ total assets.Sources: FINMA, SNB

Financial Stability Report 2015 25
by historical standards. This was mainly the result of increased profit retention.
The risk-weighted capital ratio increased slightly to 16.6% in terms of total eligible capital (2013: 16.3%55) and to 15.8% in terms of Tier 1 capital (2013: 15.4%56). In 2014, domestically focused banks’ capital thus grew faster than their RWA. In contrast to the previous year, the RWA were only marginally influenced by regulatory changeovers.57 Hence, the increase in the risk-weighted capital ratio may be interpreted as an improvement in banks’ regulatory capital adequacy.
High resilience and conservative approach to risk neededRegulatory capital ratios may overestimate the actual resilience of these banks in the current environment, as they do not fully capture risks related to exposures to the mortgage and real estate markets and to movements in interest rates (cf. Financial Stability Report from 2012 to 2014). Hence, the adequacy of domestically focused banks’ capital buffers is also assessed by means of stress tests, with a focus on the euro area debt crisis scenario and the interest rate shock scenario.
According to SNB stress tests, the euro area debt crisis scenario would result in substantial losses at many domestically focused banks. Owing to the surplus capital currently held by banks, the cumulative market share of domestically focused banks that are estimated to fall below the regulatory minimum would be small. However, for a number of banks covering a significant share of the
55 Thefigurefor2013haschangedduetoasampleeffect.56 Thefigurefor2013haschangedduetoasampleeffect.57 In 2014, only two banks with a cumulative market share amounting to 1% of total assets of domestically focused banks moved from reporting under the Swiss standardised approach to the international standardised approach.
domestic credit market, the estimated losses would deplete a large proportion of their surplus capital. As a consequence, these banks would no longer meet the specific capital buffer target levels set by FINMA.
Under the interest rate shock scenario, the estimated losses for domestically focused banks would be significantly higher, on average, than under the euro area debt crisis scenario. Even in this case, most banks should be able to absorb these losses without seeing their capitalisation fall below the regulatory minimum. However, at a number of banks with a significant cumulative market share, it is estimated that capitalisation would fall close to or even below the regulatory minimum.
The depletion of a large proportion of banks’ surplus capital under both scenarios would lead to a general weakening of the banking sector. Experience in Switzerland and abroad suggests that this could present a challenge for financial stability and significantly affect banks’ ability to lend, with negative repercussions for the real economy.
These results highlight the importance of banks holding significant capital surpluses relative to the regulatory minimum requirements. The activation of the CCB in 2013 and its increase in 2014 made a significant contribution in this respect. The current interest rate environment also calls for lending and interest rate risk policy to remain especially prudent, both to limit banks’ future loss potential and to help prevent a further build-up of imbalances.
Risk of renewed increase in imbalances on mortgage and real estate marketsAs discussed in chapters 2 and 3.2.1, growth in mortgage volumes and residential real estate prices has stayed roughly in line with fundamentals in recent quarters. As a result, overall, imbalances on the mortgage and residential
tier 1 leverage ratio of domestically focused commercial banksDistribution of Tier 1 capital to asset ratios Chart 17
%
4
5
6
7
8
9
10
11
12
1998 1999 2000 2001 2002 2003 2004 2005 2006 2007 2008 2009 2010 2011 2012 2013 2014
Weighted average Median Decile 4–6 Decile 3–7 Decile 2–8 Decile 1–9
Sources: FINMA, SNB

Financial Stability Report 201526
real estate markets have remained broadly unchanged since the last Financial Stability Report. From a financial stability perspective, this is a positive development.
However, imbalances remain at a high level. In addition, the further decline of capital and money market interest rates, partly into negative territory, following the monetary policy decision in January 2015 carries the risk of a renewed increase in imbalances on the Swiss mortgage and residential real estate markets over the medium term.
First, compared to alternative assets, investments in real estate appear to have become more attractive for banks, commercial investors and households. In the residential investment property segment in particular, additional demand from investors searching for yield might push prices up further.
Second, the new and unprecedented interest rate environment creates additional incentives for banks to incur higher interest rate and credit risks (cf. chapter 3.2.1). Increasing maturity transformation and extending the volume of lending might be ways to compensate for negative liability margins and to stabilise short-term profitability. Such strategies would further increase banks’ exposure to large interest rate shocks and to a correction on the mortgage and real estate markets. Given these risks to financial stability, banks and authorities should remain alert and, if necessary, take measures to contain such risks.
Should momentum on the mortgage and residential real estate markets pick up again, additional measures directly targeting banks’ risk-taking in mortgage lending might become necessary. In this regard, particular attention should be paid to the investment property segment. This segment is more likely to be materially affected by additional demand from investors searching for yield in the current environment. Furthermore, the measures taken so far have predominantly addressed the segment of owner-occupied residential real estate.
Moreover, interest rate risk exposure in the banking book should be appropriately backed with capital. The Basel Committee is currently consulting on policy options to strengthen international standards on capital and disclosure requirements for interest rate risk in the banking book. Given the significance of this risk factor, banks should ensure that they adopt a conservative stance towards the measurement and management thereof. In this context, the SNB supports FINMA’s efforts to ensure that risk-taking by individual banks is reduced or backed by specific capital charges whenever the risk exposure is deemed exceptionally large by historical or industry standards.
In parallel with these measures, the SNB will continue to monitor developments on the mortgage and real estate markets closely, and will reassess the need for an adjustment to the CCB on a regular basis.


Published bySwiss National Bank Financial Stability P.O. Box CH-8022 Zurich Telephone+41586313111
LanguagesEnglish,FrenchandGerman
Further [email protected]
Subscriptions, individual issues, change of addressSwiss National Bank, Library P.O. Box, CH-8022 Zurich Telephone+41586311150 Fax+41586315048 E-mail: [email protected]
Website The publications of the Swiss National Bank are available at www.snb.ch, Publications.
DesignInterbrand Ltd, Zurich
Typeset and printed byNeidhart+SchönAG,Zurich
Publication dateJune2015 ISSN1661-7835(printversion) ISSN1661-7843(onlineversion)
Internet www.snb.ch
Data and data sourcesThebankingstatisticsusedinthisreportarebasedonofficial datasubmittedand/orondatareportedbyindividualbanks.Theanalysis covers big banks and domestically focused commercial banks. The latter comprise banks with a share of domestic loans tototalassetsexceeding50%orwithaprominentroleinthedomesticdepositmarket.Dataonthebigbanksareanalysed on a consolidated basis. This document is based on data as at31May2015.
Copyright ©TheSwissNationalBank(SNB)respectsallthird-partyrights,inparticular rights relating to works protected by copyright (information or data, wordings and depictions, to the extent that theseareofanindividualcharacter).
SNB publications containing a reference to a copyright (© Swiss NationalBank/SNB,Zurich/year,orsimilar)may,undercopyrightlaw,onlybeused(reproduced,usedviatheinternet,etc.)fornon-commercial purposes and provided that the source is mentioned. Their use for commercial purposes is only permitted with the prior express consent of the SNB.
Generalinformationanddatapublishedwithoutreferencetoa copyright may be used without mentioning the source. To the extent that the information and data clearly derive from outside sources, the users of such information and data are obliged to respect any existing copyrights and to obtain the right of use from the relevant outside source themselves.
Limitation of liabilityThe SNB accepts no responsibility for any information it provides. Undernocircumstanceswillitacceptanyliabilityforlossesor damage which may result from the use of such information. This limitation of liability applies, in particular, to the topicality, accuracy, validity and availability of the information.
©SwissNationalBank,Zurich/Berne2015

