financial stability report 27 - oenb
TRANSCRIPT

FINANCIAL STABILITYREPORT 27
Stability and Security. JUNE 2014

The OeNB’s semiannual Financial Stability Report provides regular analyses of Austrian and international developments with an impact on financial stability. In addition, it includes studies offering in-depth insights into specific topics related to financial stability.
Publisher and editor Oesterreichische NationalbankOtto-Wagner-Platz 3, 1090 ViennaPO Box 61, 1011 Vienna, [email protected] (+43-1) 40420-6666Fax (+43-1) 40420-046698
Editorial board Philip Reading, Vanessa Redak, Doris Ritzberger-Grünwald, Martin Schürz, Markus Schwaiger
Coordinator Walter Waschiczek
Editing Dagmar Dichtl, Jennifer Gredler, Rena Mühldorf, Susanne Steinacher
Layout and typesetting Walter Grosser, Birgit Jank
Design Communications and Publications Division
Printing and production Oesterreichische Nationalbank
DVR 0031577
ISSN 2309-7264 (print)ISSN 2309-7272 (online)
© Oesterreichische Nationalbank, 2014. All rights reserved.
May be reproduced for noncommercial, educational and scientific purposes provided that the source is acknowledged.
Printed in accordance with the Austrian Ecolabel guideline for printed matter. REG.NO. AT- 000311

FINANCIAL STABILITY REPORT 27 – JUNE 2014 3
Call for Applications: Visiting Research Program 4
ReportsManagement Summary 8
International Macroeconomic Environment: Economic Momentum Increases
but Financial Sector Weaknesses Remain 11
Corporate and Household Sectors in Austria: Debt Servicing Capacity Slightly Improved 20
Austrian Financial Intermediaries: Regaining Profitability to Increase Resilience of
Crucial Importance 31
Special TopicsThe Priorities of Deleveraging in the Euro Area and Austria and Its Implications for CESEE 50Judith Eidenberger, Stefan W. Schmitz, Katharina Steiner
Macrofinancial Developments in Ukraine, Russia and Turkey from an Austrian
Financial Stability Perspective 64Tina Wittenberger, Daniela Widhalm, Mathias Lahnsteiner, Stephan Barisitz
Capital Market Development in CESEE and the Need for Further Reform 74Krisztina Jäger-Gyovai
Macroprudential Supervision: A Key Lesson from the Financial Crisis 83Judith Eidenberger, David Liebeg, Stefan W. Schmitz, Reinhardt Seliger, Michael Sigmund, Katharina Steiner, Peter Strobl, Eva Ubl
Risk-Bearing Capacity of Households –
Linking Micro-Level Data to the Macroprudential Toolkit 95Nicolás Albacete, Judith Eidenberger, Gerald Krenn, Peter Lindner, Michael Sigmund
Annex of Tables 112
NotesList of Special Topics Published in the Financial Stability Report Series 128
Periodical Publications 129
Addresses 131
Editorial close: June 4, 2014
Opinions expressed by the authors of studies do not necessarily reflect the official
viewpoint of the OeNB or of the Eurosystem.
Contents

4 OESTERREICHISCHE NATIONALBANK
Call for Applications: Visiting Research Program
The Oesterreichische Nationalbank (OeNB) invites applications from external researchers for participation in a Visiting Research Program established by the OeNB’s Economic Analysis and Research Department. The purpose of this program is to enhance cooperation with members of academic and research institutions (preferably postdoc) who work in the fields of macroeconomics, international economics or financial economics and/or pursue a regional focus on Central, Eastern and Southeastern Europe.
The OeNB offers a stimulating and professional research environment in close proximity to the policymaking process. Visiting researchers are expected to collaborate with the OeNB’s research staff on a prespecified topic and to participate actively in the department’s internal seminars and other research activities. They will be provided with accommodation on demand and will, as a rule, have access
to the department’s computer resources. Their research output may be published in one of the department’s publication outlets or as an OeNB Working Paper. Research visits should ideally last between 3 and 6 months, but timing is flexible.
Applications (in English) should include
– a curriculum vitae, – a research proposal that motivates
and clearly describes the envisaged research project,
– an indication of the period envisaged for the research visit, and
– information on previous scientific work.
Applications for 2014 should be emailed to [email protected] November 1, 2014.
Applicants will be notified of the jury’s decision by midDecember. The following round of applications will close on May 1, 2015.

Financial stability means that the financial system – financial intermediaries, financial markets and financial infrastructures – is capable of ensuring the efficient allocation of financial resources and fulfilling its key macroeconomic functions even if financial imbalances and shocks occur. Under conditions of financial stability, economic agents have confidence in the banking system and have ready access to financial services, such as payments, lending, deposits and hedging.


Reports
The reports were prepared jointly by the Foreign Research Division, the Economic Analysis Division, the Financial Stability and Macroprudential Supervision Division and the Supervision Policy, Regulation and Strategy Division, with contributions by Dominik Bernhofer, Gernot Ebner, Eleonora Endlich, Maximilian Fandl, Robert Ferstl, Andreas Greiner, Dieter Huber, Stefan Kavan, Benjamin Neudorfer, Stefan W. Schmitz, Josef Schreiner, Michael Sigmund, Katharina Steiner, Eva Ubl, Zoltan Walko, Walter Waschiczek, Daniela Widhalm and Tina Wittenberger.

8 OESTERREICHISCHE NATIONALBANK
Search for Yield in the Financial Markets ContinuesAfter a slight deceleration in 2013, the global economy has gradually recovered. While the economic dynamics in emerging economies remained largely unchanged amid uncertainties and tighter financial conditions, growth in the industrialized countries picked up, although in early 2014 the ongoing recovery in the U.S.A. lost some momentum. In the euro area, following six consecutive quarters of contraction, economic output began to expand again in the second quarter of 2013, though at a moderate pace. Inflation continued to decrease in the first months of 2014, reflecting still large output gaps as well as a recent decline in commodity prices.
As three EU countries successfully exited their support programs in late 2013 (Ireland) and 2014 (Spain and Portugal), the sovereign debt crisis abated. The reduction of the perceived credit and country risks contributed to a further compression of risk premiums on euro area bonds in the first months of 2014 amid an ongoing search for yield. At the same time, financial market developments in Central, Eastern and Southeastern Europe (CESEE) were driven by the U.S. Federal Reserve System’s “tapering” of the bond purchases it had conducted as part of its quantitative easing policy and the geopolitical tensions caused by the situation in Ukraine. Russia, Turkey and Ukraine were affected in particular and experienced capital outflows and pressure on domestic currencies whereas the impact on the other CESEE countries has been broadly contained so far.
Economic conditions in the CESEE region improved somewhat in the second half of 2013, benefiting from more favorable economic activity in the euro area and an incipient recovery of
domestic demand. However, improving economic activity was not accompanied by livelier loan dynamics. Growth of domestic credit to the private sector remained muted, even showing a downward trend in several countries. Credit quality continued to be weak, with nonperforming loan (NPL) ratios remaining elevated throughout the region, but at least showing some signs of improvement in most countries in 2013. Bank profits remain subdued and have declined in most CESEE countries, but local banking sectors are still well capitalized.
Debt Servicing Capacity of Austrian Businesses and Households Improved
In the wake of the muted expansion of global economic activity, Austria’s economy began to recover moderately in the second half of 2013. Corporate profitability picked up slightly and thus only marginally strengthened the internal financing potential of Austrian nonfinancial corporations. At the same time, external financing activities of enterprises remained subdued, reflecting ample internal liquidity as well as low financing needs for investments. About 60% of the external financing obtained by nonfinancial corporations in 2013 came in the form of equity, mostly unquoted shares and other equity instruments acquired by foreign strategic investors, whereas bank loans were of minor importance. Bonds remained a major source of financing in 2013, primarily for larger companies.
Overall, financing conditions for enterprises and households remained favorable, despite somewhat tighter terms and conditions. Low interest rate levels supported firms’ and households’ ability to service their debt, as did the reduction of both corporate and household debt levels in 2013. How
Management Summary

Management Summary
FINANCIAL STABILITY REPORT 27 – JUNE 2014 9
ever, an aboveaverage share of variable rate loans might pose risks if interest rates were to rise again.
Households’ financial investment remained subdued in 2013. The low interest rate environment fostered a shift to shortterm deposits. After recording (unrealized) valuation gains in their securities portfolios in 2012, Austrian households registered (equally unrealized) valuation losses in 2013.
Prices in the Austrian residential property market continued to rise, but the price increases abated somewhat in the first quarter of 2014. Though growth rates of mortgage loans remained moderate, developments of residential property prices certainly merit closer attention from a financial stability and macroprudential perspective.
One-Off Effects Caused Decline in Bank Profits
The incipient economic recovery and further strengthening of the regulatory and supervisory framework marked the year 2013 for the European banking system. Austrian banks nevertheless faced noticeable headwinds. Low interest rate margins as well as oneoff effects resulted in the first systemwide loss in recent history. The corresponding net loss after tax and minority interests amounted to about EUR 1 billion, but even without oneoff effects, net profits would have been considerably below precrisis levels. Net profits of Austrian subsidiaries in CESEE increased by 5.8% in 2013, but were almost entirely eroded by writedowns of goodwill linked to CESEE subsidiaries. Moreover, compared to precrisis years, profits in CESEE became ever more concentrated, implying a growing reliance on relatively high profits from just a few countries.
While the credit quality situation in Austria remained fairly benign in
2013, Austrian banking subsidiaries in CESEE – although operationally still profitable – were facing considerable loan quality issues in several countries. This trend can be explained by two factors: the inflow of NPLs continued and credit demand has remained sluggish overall.
Austrian banks continued to strengthen their capital ratios through a combination of capital increases, e.g. via rights issues and retained earnings, and reductions in riskweighted assets. After a low in the second quarter of 2008, the aggregate tier 1 capital ratio and the capital adequacy ratio of all Austrian banks continued to improve and reached 11.9% and 15.4%, respectively, by end2013. Nevertheless, there is still market pressure for higher capital ratios, as the gap between Austrian banks and banks in the international business model peer group has widened. In order to strengthen the structural profitability situation and capital generation capacity of banks, it needs to be ensured that banks with an unsustainable business model can leave the market without jeopardizing its stability. This objective has been at the center of recent European legislative initiatives.
Before the Single Supervisory Mechanism (SSM) becomes fully operational later this year, the ECB – together with the national competent authorities – is carrying out a comprehensive assessment of significant banking groups, including six from Austria. This includes an asset quality review and a stress test to promote transparency, dispel lingering concerns about loan quality and provisioning and thereby improve confidence in financial market stability.
Recommendations by the OeNB
The OeNB acknowledges the Austrian financial sector’s progress toward improving financial stability at home and

Management Summary
10 OESTERREICHISCHE NATIONALBANK
in host markets and recommends further strengthening the sustainability of business models.• Banks should continue strengthening
their capital levels – by retaining earnings and/or tapping capital markets – to close the gap between them and their international peers.
• Given the persistent pressure on profitability, banks should strive to address structural issues and improve their cost efficiency.
• Riskadequate provisioning and coverage policies should be further pursued to deal with loan quality issues.
• Banks should continue fulfilling the supervisory minimum standards relating to foreign currency loans and loans with repayment vehicles.
• Banks should strive for sustainable loantolocal stable funding ratios at the subsidiary level and for the riskadequate pricing of liquidity transfers.
• Banks should prepare for increased market pressure for disclosure of liquidity coverage ratio (LCR) data; both investor communications and liquidity risk management, especially at smaller banks, need to be adapted.
• Banks and insurance undertakings should ensure high standards of risk management so that risks are properly addressed and effectively controlled; they should also proactively prepare for contingency situations.
• Insurance undertakings should proactively prepare for Solvency II.

FINANCIAL STABILITY REPORT 27 – JUNE 2014 11
Advanced Economies: Economic Recovery StrengthensGlobal economic activity broadly strengthened in the review period from October 2013 to May 2014 and is expected to improve further in 2014 and 2015. Much of the recent impetus is coming from advanced economies while, on average, growth in emerging economies remained high but largely unchanged in a less favorable external financial environment. In the euro area, macrofinancial risks arise from the low nominal growth environment, in particular from a slowdown in inflation rates reflecting still large output gaps, the recent decline in commodity prices as well as the appreciation of the euro’s nominal effective exchange rate.
In the U.S.A., growth in economic activity lost some momentum during winter but is expected to pick up in the coming quarters. Labor market indicators were mixed but on balance showed further improvement. While private spending remains robust, fiscal policy is holding back the recovery, although to a lesser extent than in 2012 and 2013. Inflation has been running below the longrun objective of 2%, but longterm inflation expectations have remained anchored thus far. In 2014, the Federal Reserve Board reduced its monthly asset purchases further. Improved communication reduced adverse spillovers to emerging economies in early 2014 as compared to mid2013. Given that the employmenttopopulation ratio still signals a significant amount of economic slack, the federal funds rate is expected to remain between 0% and 0.25% for still some time.
In Japan, some underlying growth drivers, notably private investment and exports, have strengthened thanks to the increased growth of trading partners and the substantial yen depreciation over the past 12 months or so. Nevertheless, overall activity is projected to slow in response to the two rounds of consumption tax hikes in April 2014 and October 2015. The unemployment rate has declined further and the inflation rate has picked up substantially, already influencing longterm inflation expectations and actual wage and price settings. The Bank of Japan continues its quantitative and qualitative monetary easing to increase the monetary base at an annual pace of about JPY 60 to 70 trillion. However, according to the IMF, the remaining two arrows of Abenomics – structural reforms and fiscal consolidation beyond 2015 – are essential to achieve the inflation target and higher sustained growth in the long run.
The Swiss National Bank (SNB) has remained committed to its exchange rate ceiling of CHF 1.20 per euro. Although the upward pressure was muted in the review period, the SNB is not considering a possible exit yet.
The moderate recovery of the euro area economy is proceeding but remains fragile and uneven. Preliminary GDP estimates for the first quarter of 2014 surprised on the downside, while inflation rates have decreased to below 1% in most euro area countries. In Germany, supportive monetary conditions, robust labor market conditions and improving confidence have underpinned a pickup in domestic demand. Across the euro area, a strong reduction in the pace of fiscal tightening is
Economic growth solidly positive in the U.S.A. and Japan
Euro area recovery proceeds but inflation is below target
International Macroeconomic Environment: Economic Momentum Increases but Financial Sector Weaknesses Remain

International Macroeconomic Environment: Economic Momentum Increases but Financial Sector Weaknesses Remain
12 OESTERREICHISCHE NATIONALBANK
expected to lift growth, while net exports support the turnaround in the peripheral economies. Unemployment rates have stabilized but are expected to remain at elevated levels throughout 2016. For 2014, the IMF expects only Cyprus to remain in recession.
On June 5, 2014, the Governing Council of the ECB cut its main refinancing rate by 10 basis points to 0.15%, its deposit facility rate by 10 basis points to –0.10% and its marginal lending facility rate by 35 basis points to 0.40%. At the subsequent press conference, ECB President Draghi indicated that policy rates will remain at current levels for an extended period and announced further liquidity measures: a series of targeted longerterm (fouryear) refinancing operations to the amount of some EUR 400 billion that are designed to support bank lending to the real economy; the continuation of fixed rate full allotment tender procedures; a suspension of the sterilization of liquidity injected under the Securities Markets Programme; and preparations for outright quantitative easing purchases. Despite significant improvements, the transmission of monetary policy is still impaired for some countries and economic sectors, which is also reflected in still tight lending standards for nonfinancial businesses. Better funding conditions for banks have allowed them to repay around EUR 550 billion of outstanding longerterm central bank liquidity since late January 2013. The associated increase in money market rates has been muted thus far.
Within the review period, euro area financial stability improved further, reflected inter alia in slightly lower sovereign risk spreads in stressed economies. Ireland, Spain and Portugal have left their respective financial assistance programs successfully, while the pro
grams for Greece and Cyprus remain on track. Adverse effects associated with the crisis in Ukraine have been moderate so far. The implementation of banking union is progressing and market sentiment toward euro area banks has improved – particularly toward those in stressed economies, which however, remain burdened by the large and growing stock of non performing loans.
CESEE: Geopolitical Develop-ments Increase Financial Market Tensions amid Persistently Weak Credit Dynamics
In line with developments in the euro area, economic conditions in Central, Eastern and Southeastern Europe (CESEE) improved somewhat in the second half of 2013. Most of the CESEE region covered in this report benefited from improving sentiment in Europe, more favorable economic activity in the euro area and an incipient recovery of domestic demand.
Against the background of the U.S. Federal Reserve System’s departure from its quantitative easing policy through the gradual reduction (“tapering”) of its bond purchases and especially the geopolitical tensions caused by the situation in Ukraine, financial market developments were less benign, however. The Fed’s decision to scale back its asset purchases caused international investors to relocate some of their funds from emerging markets back to now higheryielding U.S. assets, which sent shockwaves throughout emerging markets worldwide in mid2013. In the CESEE region, Russia, Turkey and Ukraine were affected in particular and experienced capital outflows and pressure on their respective domestic currencies. These developments were exacerbated by rising political risks, at first only in Turkey in connection
Financial market developments in CESEE driven by Fed tapering and
geopolitical tensions

International Macroeconomic Environment: Economic Momentum Increases but Financial Sector Weaknesses Remain
FINANCIAL STABILITY REPORT 27 – JUNE 2014 13
with the government’s response to the Gezi park protests and, more recently, to corruption allegations. Starting from midJanuary, however, the escalating Maidan protests in Ukraine and the subsequent conflict around Crimea and the eastern part of the country, put Russia and Ukraine into the spotlight.
Since endJanuary, all three major rating agencies have cut their Ukraine ratings (Moody’s to Caa3, Fitch to CCC and S&P to CCC), and CDS premiums and Eurobond spreads rose markedly to maximum levels of 1,300 and 1,800 basis points, respectively, in February and March as well as in early May. Then, however, CDS premiums and eurobond spreads retreated noticeably and came down to 800 and 950 basis points at the end of May. In February, the National Bank of Ukraine (NBU) abolished its relatively tight de facto peg to the U.S. dollar, after pressure on the currency intensified and the NBU ran down its foreign currency reserves to very low levels. Foreign currency reserves declined from USD 20.4 billion in December 2013 to
USD 14.2 billion in April 2014, covering less than two months of imports (this reduction, however, was in part also caused by repayments of state and stateguaranteed debt). From early 2014, the hryvnia depreciated by some 35% against the euro and the U.S. dollar and traded at historical lows in April 2014. Against the background of a notable passthrough of currency depreciation to inflation (which rose from 1.2% in February to 3.4% in March), the central bank increased its policy rate by 300 basis points to 9.5% in April 2014, which helped to stabilize the currency somewhat.
Furthermore, the exchange rate also benefited from the approval of a twoyear standby arrangement with the IMF. The program totals USD 17 billion, of which USD 3.2 billion have already been disbursed. This forms part of a broader support package by the international community, which is set to total USD 27 billion over the next two years. International financial aid to cover the sizeable external financing gap became necessary after a support package that the old Yanukovich administra
Ukraine in the spotlight
Basis points Basis points
300
250
200
150
100
50
0
1,400
1,200
1,000
800
600
400
200
0
Five-Year Credit Default Swap Premiums
Chart 1
Source: Thomson Reuters.
Czech Republic Poland Slovakia Ukraine Slovenia Croatia Romania Hungary Bulgaria Turkey Russia
Jan. Feb. Mar. Apr. May June
2013
July Aug. Sep. Oct. Nov. Dec. Jan. Feb. Mar.
2014
Apr. May Jan. Feb. Mar. Apr. May June
2013
July Aug. Sep. Oct. Nov. Dec. Jan. Feb. Mar.
2014
Apr. May
Latest observation: May 30, 2014 Latest observation: May 30, 2014

International Macroeconomic Environment: Economic Momentum Increases but Financial Sector Weaknesses Remain
14 OESTERREICHISCHE NATIONALBANK
tion had agreed on with Russia (consisting in USD 15 billion of eurobond purchases and a gas price discount) was suspended due to political developments.
The political tensions in Ukraine also adversely affected financial market developments in Russia. CDS premiums and eurobond spreads increased considerably from early 2014 with spikes around 300 and 350 basis points in March and April before declining again in May. The Russian ruble’s steady depreciation over 2013 sharply accelerated in January and February 2014 (10% from end2013 to endFebruary 2014 against the U.S. dollar and the euro). This was largely caused by the Fed’s tapering, coupled with Russia’s weakening growth outlook. After the outbreak of the Crimean crisis (endFebruary), the ruble declined by another 2% to 3% before starting a strengthening trend in midMarch. The Central
Bank of the Russian Federation (CBR) contributed to this restabilization by strongly intervening in the foreign exchange market. Foreign exchange sales were substantially larger than provided for by the CBR’s automatic intervention mechanism (daily interventions of up to some USD 11 billion), and foreign currency reserves declined by about USD 40 billion (or 8%) to USD 471 billion from end December 2013 to early May 2014. Furthermore, the CBR raised its key interest rate by 150 basis points in late February 2014 and by a further 50 basis points in late April (to 7.5%) because of a notable passthrough of ruble weakness to consumer prices and because of a rise in inflation expectations. Inflation increased to 7.3% in April from 6.1% in January 2014.
In 2013, the total outflow of private capital from Russia came to USD 60 billion (about 3% of GDP), which exceeded the comparable 2012 value
Financial market conditions deterio-
rate also in Russia
January 1, 2013 = 100; rise = appreciation
110
105
100
95
90
85
80
75
70
65
60
55
Exchange Rates of Selected Currencies against the Euro
Chart 2
Source: Thomson Reuters.
EUR/CZK EUR/PLN EUR/RUB EUR/TRL
EUR/HUF EUR/RON EUR/HRK EUR/UAH
Jan. Mar. May July2013
Sep. Nov. Jan. Mar.2014
May
Latest observation: May 30, 2014

International Macroeconomic Environment: Economic Momentum Increases but Financial Sector Weaknesses Remain
FINANCIAL STABILITY REPORT 27 – JUNE 2014 15
(USD 54 billion). Outflows further accelerated to USD 51 billion in the first quarter of 2014. Against this background and given the weakening economic momentum as well as the threat of more farreaching sanctions against Russia, S&P downgraded its country rating to BBB–. Fitch and Moody’s set their outlook for the country to negative.
The impact of the developments in Ukraine on other CESEE countries has been broadly contained so far. The region has relatively limited direct export linkages with Ukraine, and gas exports from Russia so far seem to run smoothly.
Nevertheless, Turkey and the Czech Republic (to a lesser extent, also Hungary) experienced currency depreciation as well. As mentioned above, the Fed’s tapering as well as rising political risk put pressure on the Turkish lira. In late January 2014, the currency even reached an alltime low after recording a cumulative depreciation of 28% against the U.S. dollar and to 36% against the euro since midMay 2013. Following a decisive interest rate hike (4.5% to 10%) by the Turkish central bank (TCMB) on January 28, 2014, the currency has stabilized and regained roughly 9% against both U.S. dollar and euro. As bank funding was provided at the overnight lending rate of 7.75% prior to the interest rate decision, the effective rate hike was only 225 basis points, however. The currency and other financial market indicators also benefited from a clear vote in favor of the ruling AKP party at local elections at the end of March 2014. As uncertainties declined and risk premium indicators improved, the TCMB decided to reduce the main policy rate by 50 basis points to 9.5% in late May 2014.
In the Czech Republic, the central bank (CNB) decided to start using the
exchange rate as an additional instrument for easing monetary conditions in early November 2013, as the policy rate has been standing at “technically zero” since October 2012 and inflation has declined strongly, increasing the risk of deflation. As a result, the Czech koruna weakened by approximately 5% against the euro and the CNB will intervene to keep the new level of about CZK 27/EUR 1 at least until early 2015.
Falling price pressures were also reported for many other countries of the region in the past months. Against this background, several CESEE central banks continued to pursue a policy of monetary accommodation. Both the Hungarian central bank and the Romanian central bank cut their policy rates in several steps (by a total of 120 basis points to 2.4% in Hungary and by a total of 75 basis points to 3.5% in Romania from midOctober 2013 to late May 2014).
The improvement in economic activity was not accompanied by more vivid financial sector dynamics. Growth of domestic credit to the private sector remained anemic throughout most of CESEE; annual growth rates (adjusted for exchange rate changes) only amounted to around 2% or less in many countries and even showed a downward trend in several cases. The latter is especially true for Slovenia (where the transfer of nonperforming assets into a bad bank caused the credit stock to shrink) but also for Hungary, Bulgaria, Croatia and Romania. These countries have faced a deleveraging of households and/or corporations, which was attributable not only to comparatively weak economic momentum, but also in part to domestic banking sector problems. Credit growth also declined markedly in Russia and Ukraine in the past months in the context of heightened geopolitical tensions in the region.
Impact of the crisis in Ukraine on other CESEE countries broadly contained so far
Credit dynamics still muted in most CESEE countries

International Macroeconomic Environment: Economic Momentum Increases but Financial Sector Weaknesses Remain
16 OESTERREICHISCHE NATIONALBANK
Furthermore, lower growth rates were reported for Turkey in February and March 2014 given monetary policy tightening and macroprudential measures. Nevertheless, credit expansion remained rather vivid in the country.
In Slovenia, a large stock of nonperforming loans (NPLs) is weighing on bank profitability and credit expansion, and the capitalization of the banking sector is low by regional comparison. In midDecember 2013, the government recapitalized five banks with EUR 3.2 billion (9.1% of GDP). Subsequently, NPLs in the value of EUR 3.3 billion were transferred to a bank asset management company. The transfer of a further EUR 1.1 billion of NPLs is expected once the European Commission approves restructuring plans. As a further element of the consolidation of the banking sector, the government has committed itself to fully privatizing two stateowned banks by end2014 and to reducing its stake in the biggest bank to a blocking minority in the medium term. In order to prevent a further accumulation of NPLs, a new legislative framework for corporate restructuring was put into place in December 2013.
In Hungary, the banking system has been negatively affected by various government measures to reduce outstanding foreign currency debt of households as well as by very high sectoral taxes on banks. After Hungarian banks had failed to deliver measures to ease households’ debt servicing burden by the deadline set by the government (November 1, 2013), the existing exchange rate cap scheme for foreign currency loans was extended. Furthermore, the government called on the supreme court and the constitutional court to deliver opinions about the legal status of foreign currency loans in November 2013. Following a final clarification, the government intends to deliver a broadbased solution to foreign currency loans. In order to ease SMEs’ access to credit, the Hungarian central bank (MNB) started a Funding for Growth Scheme (FGS) in June 2013. In September 2013, the MNB decided to prolong the FGS until end2014 and to expand its volume (to a total of close to 10% of GDP) and coverage. According to first indications, however, the utilization of the first new tranche of the prolonged scheme is lagging behind expectations.
%, year on year, adjusted for exchange rate changes
40
30
20
10
0
–10
–20Slovenia
Growth of Credit to the Private Sector
Chart 3
Source: National central banks.1 Nonadjusted.
Q2 13 Q3 13 Q4 13 Q1 14
Slovakia Czech Republic Poland Hungary Bulgaria Romania Croatia Ukraine Russia Turkey1

International Macroeconomic Environment: Economic Momentum Increases but Financial Sector Weaknesses Remain
FINANCIAL STABILITY REPORT 27 – JUNE 2014 17
While the negative effects of low demand seem to lose some importance for explaining weak credit developments, survey evidence suggests that supplyside factors may also have played a role in the observation period. For example, the Emerging Markets Bank Lending Conditions Survey of the Institute of International Finance (IIF) for the fourth quarter of 2013 reports that loan demand continued to improve across all loan categories. Demand for consumer credit was particularly strong, reflecting policy rate cuts and a recovery in private consumption in the region, at least in Central Europe. However, the survey also finds that credit standards were tightened across all loan categories and that funding conditions deteriorated. This development continued in 2014. The IIF survey for the first quarter of 2014 found that bank lending conditions tightened significantly given a marked increase in NPLs and a sharp deterioration in funding conditions. In fact, CESEE witnessed the most aggressive tightening in both domestic and external funding conditions compared to other regions as
geopolitical tensions increased market volatility. Against this backdrop, banks tightened credit standards further across all loan categories. This is especially true for consumer loans, the demand for which subsequently plunged. Loan demand by businesses, in contrast, continued to increase, given the recovery in investment. However, it needs to be noted that not all CESEE countries were equally affected by this development. In Poland and the Czech Republic, for example, both external positions of BIS reporting banks as well as domestic deposits increased notably.
The share of foreign currency loans in total loans to households declined in all countries, most strongly so in Poland (by 3.4 percentage points to 30.7% between mid2013 and the first quarter of 2014). The share, however, remained at high levels in Hungary, Romania and Croatia (ranging from 54.3% to 74.9% in March 2014). While foreign currency loans do not play an important role for the household credit stock in Russia, their share came to 41.2% in Ukraine in the first quarter of 2014. The most recent depreciation
Weak credit development might also be influenced by supply-side factors
Nonperforming loans (NPLs) and loan loss provisions (LLPs) in % of total credit at end of period
35
30
25
20
15
10
5
0NPLs
Slovenia
Banking Sector: Credit Quality
Chart 4
Source: IMF, national central banks, OeNB.
Note: Data are not comparable between countries. NPLs include substandard, doubtful and loss loans, except for Romania and Ukraine (doubtful and loss loans) and for Slovenia(in arrears for more than 90 days).
End-2012 End-2013
LLPs NPLsSlovakia
LLPs NPLsCzech Republic
LLPs NPLsPoland
LLPs NPLsHungary
LLPs NPLsBulgaria
LLPs NPLsRomania
LLPs NPLsCroatia
LLPs NPLsUkraine
LLPs NPLsRussia
LLPs NPLsTurkey
LLPs

International Macroeconomic Environment: Economic Momentum Increases but Financial Sector Weaknesses Remain
18 OESTERREICHISCHE NATIONALBANK
of the hryvnia will therefore most probably have a negative impact on credit quality.
While NPL ratios remained clearly elevated by historical standards, credit quality improved somewhat between 2012 and 2013 in most CESEE countries. This development was most pronounced in Ukraine, followed by Slovenia, where nonperforming assets were transferred into a bad bank in December 2013 (see above). Deteriorating credit quality was reported for Croatia, Romania and Hungary. In the latter two countries, this development was driven by the credit stock declining more strongly than nonperforming assets.
In most countries of the region, total outstanding domestic claims continued to exceed total domestic deposits (relative to GDP) at the end of 2013. However, this funding gap has been narrowing substantially since late 2011 and was practically closed in Romania, Bulgaria and Croatia by the fourth
quarter of 2013. It decreased by 3 to 5.5 percentage points of GDP between end2012 and end2013 in those countries. The reduction in Hungary was roughly of the same magnitude, while the funding gap decreased by nearly 15 percentage points of GDP in Slovenia against the backdrop of asset writeoffs. A wider gap between claims and deposits was reported especially for Turkey as deposit growth could not keep pace with the vigorous expansion of credit. As of late, the gap has also started to increase somewhat in Russia and Ukraine.
The development outlined above is broadly reflected in banks’ net external positions. Countries that reported a declining funding gap reduced their reliance on external funding, while countries with larger funding gaps increasingly turned to international sources to finance credit expansion (Turkey and Ukraine). The banking sector continued to hold net external liabilities in most countries; in Poland, Hungary, Romania, Croatia and Turkey these liabilities were comparatively high relative to GDP. Slovenia and Bulgaria became international creditors in the review period, while the Czech Republic and Slovakia continued to report positive net external assets, as did Russia. In the case of the Czech Republic, however, the international creditor position deteriorated somewhat.
Banking sector profits remained subdued by historical standards and ranged from a return on assets (RoA) of 0.1% in Romania and Ukraine to 1.3% in the Czech Republic at the end of 2013. A somewhat higher RoA of around 2% was reported for Russia and Turkey. Slovenia was the only country to report losses in the review period (–7.5% RoA) as writeoffs weighed on profitability. Operating income only declined marginally, however.
Credit quality remains weak
Reduction in loan-to-deposit
ratios
Profits remain subdued
As a percentage of GDP at end-2013
25
20
15
10
5
0
–5
–10
–15
–20Slovenia
Banking Sector: Gap between Claims and Deposits and Net External Position
Chart 5
Source: ECB, Eurostat, national central banks, national statistical offices, OeNB.
Domestic claims less private sector depositsNet foreign assets (positive value) or liabilities (negative value)
Slovakia Czech Republic
Poland Hungary Bulgaria Romania Croatia Ukraine Russia Turkey

International Macroeconomic Environment: Economic Momentum Increases but Financial Sector Weaknesses Remain
FINANCIAL STABILITY REPORT 27 – JUNE 2014 19
Compared to a year earlier, profitability was somewhat lower in 2013 in most CESEE countries. Only the Slovakian banking sector generated a higher profit, and Hungary and Romania managed to turn a loss in 2012 into a minor profit in 2013 on the back of higher operating profits. In Romania, this development was also fueled by lower provisioning, while in Hungary higher other income played an additional role.
The banking sectors in CESEE remain well capitalized. At end2013, capital adequacy ratios ranged from 13.5% in Russia to 20.9% in Croatia. Compared to end2012, all countries recorded increases in their capital adequacy ratios (in a range from 0.1 to 1.6 percentage points) except Russia and Turkey. While the decline in Russia was rather modest (–0.2 percentage points), it was more notable in Turkey (–2.7 percentage points to 14.6%).
CESEE banking sectors remain well capitalized
Return on assets in %
4
2
0
–2
–4
–6
–8Slovenia
Banking Sector: Profitability
Chart 6
Source: IMF, national central banks, OeNB.
Note: Data are not comparable between countries. Data are based on annual after-tax profit, except for Russia’s, which are based on pretax profit.
End-2012 End-2013
Slovakia Czech Republic
Poland Hungary Bulgaria Romania Croatia Ukraine Russia Turkey

20 OESTERREICHISCHE NATIONALBANK
Corporate Debt Decreased in 2013Austrian Economy Gained MomentumIn the second half of 2013, Austria’s economy overcame stagnation and slowly began to recover moderately in the wake of the revival of global activity. Exports gained momentum in the course of 2013, primarily driven by demand from countries outside the euro area. Order books began to fill up, and business confidence increased. But despite the significant improvement in sentiment, gross fixed capital formation decreased and destocking continued. Capacity utilization rose slightly, although it remained below its longterm average. Demographic factors put upward pressure on residential construction, whereas other construction spending fell in real terms.
Corporate profitability picked up slightly in 2013, benefiting from the gradual recovery of economic conditions and from falling raw material
prices. Moreover, low interest rates supported the nonoperational component of corporate profitability. After dropping by 0.7% in 2012, the gross operating surplus of nonfinancial corporations grew by 0.8% in nominal terms (see chart 7), which is equivalent to a further drop in real terms by 0.8%. However, while in nominal terms gross operating surplus had surpassed precrisis levels already in 2011, in real terms as well as in relation to gross value added of the corporate sector (i.e. the gross profit ratio), it has remained below its precrisis levels. By the fourth quarter of 2013, the gross profit ratio had been on a downward trend for ten consecutive quarters, falling to 39.3% and thus below the levels registered at the height of the crisis.
Further Reduction of External Financing
Mirroring weak earnings growth, the internal financing potential of the Austrian corporate sector grew only
Corporate investment picks up
Profits recover in 2013
Corporate and Household Sectors in Austria: Debt Servicing Capacity Slightly Improved
Annual change in %, four-quarter moving average
Gross Operating SurplusGross operating surplus in % of gross value added, four-quartermoving average
Profit Ratio
15
10
5
0
–5
–10
–15
46
44
42
40
38
36
34
Profitability of Nonfinancial Corporations
Chart 7
Source: Statistics Austria, ECB.
Austria Euro area
2006 2007 2008 2009 2010 2011 2012 2013 2006 2007 2008 2009 2010 2011 2012 2013

Corporate and Household Sectors in Austria: Debt Servicing Capacity Slightly Improved
FINANCIAL STABILITY REPORT 27 – JUNE 2014 21
moderately. Measured as the sum of changes in net worth and depreciation, the corporate sector’s internal financing increased by 3.5% in 2013. At the same time, external financing of nonfinancial corporations remained subdued in 2013 and at EUR 12.8 billion1 even fell below the already very low 2012 value according to financial accounts data. On the one hand, this distinctive slowdown might reflect ample liquidity on the asset side of the balance sheet, on the other hand, financing needs for corporate investment increased only gradually. Thus, as in 2012, the ratio of internal financing to external financing was roughly 1:1 in 2013.
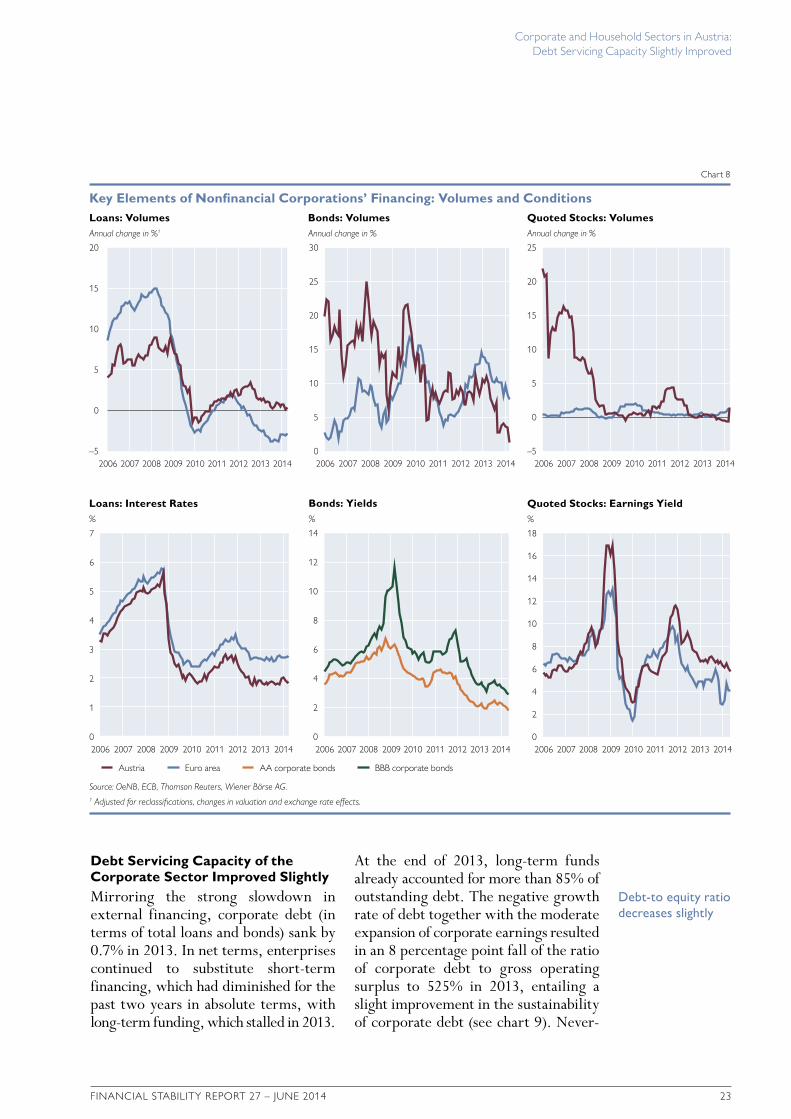
Subdued Growth of Bank Loans
Domestic bank loans made almost no contribution to external financing of the corporate sector in Austria in 2013. According to MFI balance sheet statistics, the annual growth rate of Austrian bank lending to nonfinancial corporations (adjusted for reclassifications, valuation changes and exchange rate effects) was 0.3% in nominal terms in April 2014 (see chart 8), implying a real decrease.2 As enterprises substituted shortterm loans with longterm loans because interest rates were low, this slowing was mainly driven by the decline in lending at shorter maturities (up to one year), while loans with longer maturities – on which loan growth had already rested in the past years – continued to record positive growth. However, despite this deceleration, the Austrian corporate sector has so far escaped the reduction witnessed in the euro area as a whole, where the nominal growth rate has been negative since the first half of 2012.
Both supply and demandside factors may have played a role in recent loan developments. The results of the euro area bank lending survey (BLS) for Austria show that Austrian banks tightened their credit standards for corporate loans slightly but continuously between the second half of 2011 and the first half of 2013 (and again somewhat in the first quarter of 2014). Large firms were more affected than small and mediumsized enterprises (SMEs). Factors related to banks’ capital position as well as heightened risk concerns were behind these tighter lending policies. At the same time, the banks surveyed in the BLS noted a slight decline in corporate loan demand, again primarily from large companies. On the one hand, this can be explained by companies’ lower funding requirements for fixed investment. On the other hand, companies still relied to a considerable extent on internal sources of financing, with sizeable amounts of cash available to finance their activities.
Tighter credit standards affected not only volumes but also terms and conditions of bank loans. Stronger risk discrimination by banks resulted in wider margins on riskier loans, but margins on average loans were also enlarged, in part dampening the reduction of financing costs stemming from monetary policy easing. Thus, the passthrough of the five ECB key interest rate cuts implemented between November 2011 and September 2013 (by 0.25 percentage points each) was incomplete. Corporate lending rates moved within a very narrow band from the beginning of 2013 and were virtually at the same level in April 2014 as at the end of 2012. While interest rates
Substitution of short-term with long-term loans
Lending rates remain low
1 Adjusted for foreign-controlled holdings in special purpose entities (SPEs).2 At the cutoff date, financial accounts data were available up to the fourth quarter of 2013. More recent develop-
ments of financing flows use data from the MFI balance sheet statistics and the securities issues statistics.

Corporate and Household Sectors in Austria: Debt Servicing Capacity Slightly Improved
22 OESTERREICHISCHE NATIONALBANK
fell for all loan volumes and maturities, the decrease was more pronounced for shortterm loans and for larger loans (with a volume of more than EUR 1 million).
Bonds Remain a Major Source of External Finance
A shift toward marketbased debt issuance may also have played a role in the muted demand for bank loans. Although the amount of new bonds issued by Austrian nonfinancial corporations was almost 40% lower than in 2012, new bonds continued to play a significant role for corporate finance, contributing onequarter to the external financing of enterprises in 2013. In March 2014, the nominal annual growth rate of new bond issues slowed down to 1.3% according to the securities issues statistics, but still exceeded that of other financing instruments. While recourse to bonds undoubtedly broadens the corporate sector’s financing sources, such funding is available only to a limited number of mostly larger companies. Moreover, a considerable part of corporate bonds in Austria is issued by corporations that are majorityowned by the public sector.
One major factor for this increased reliance on bond financing was the development of funding costs. Between September 2013 and May 2014, yields on AArated corporate bonds contracted by 68 basis points and yields on BBBrated bonds by 94 basis points, mainly because government bond yields fell, reflecting increased investors’ risk appetite. In a longerterm perspective, yields on BBBrated bonds were 382 basis points and AArated bond yields were 254 basis points lower than in October 2011.3
Stronger Recourse to Trade CreditThe net volume of trade credit drawn by domestic companies increased from EUR 0.8 billion to EUR 2.6 billion in 2013. One reason might be that as a key element of firms’ working capital, trade credit develops broadly along the business cycle. Also, given its relatively informal form and comparatively high cost, increased recourse to trade finance might be an indication that tighter bank credit standards induced firms to seek this kind of finance.
High Contribution of Equity to External Financing
In 2013, EUR 7.7 billion or about 60% of the external financing of nonfinancial corporations came in the form of equity. All of the equity raised in 2013 were unquoted shares and other equity instruments, mostly from foreign strategic investors. Finan cing via listed stocks continued to be affected by the crisis and shrank by EUR 49 million in 2013. In the first four months of 2014, the net issuance of capital on the stock exchange – netting new listings, capital increases and delistings – amounted to EUR 1.5 billion according to securities issues statistics, which was mainly due to the listing of a spinoff of an already listed property company.
Measured by the earnings yield (i.e. the inverse of the pricetoearnings ratio) of the ATX, the cost of raising capital on the Austrian stock market, after having already fallen slightly in 2013, continued to decline in the first five months of 2014 from 6.6% in December 2013 to 5.7% in May 2014. But as the volume of new issues was very low, this was mostly a notional figure.
Decreasing bond yields
Stock market financing still
affected by the crisis
3 Euro area figures are used here, as no time series is available for yields on Austrian corporate bonds.
Corporate and Household Sectors in Austria: Debt Servicing Capacity Slightly Improved
FINANCIAL STABILITY REPORT 27 – JUNE 2014 23
Debt Servicing Capacity of the Corporate Sector Improved SlightlyMirroring the strong slowdown in external financing, corporate debt (in terms of total loans and bonds) sank by 0.7% in 2013. In net terms, enterprises continued to substitute shortterm financing, which had diminished for the past two years in absolute terms, with longterm funding, which stalled in 2013.
At the end of 2013, longterm funds already accounted for more than 85% of outstanding debt. The negative growth rate of debt together with the moderate expansion of corporate earnings resulted in an 8 percentage point fall of the ratio of corporate debt to gross operating surplus to 525% in 2013, entailing a slight improvement in the sustainability of corporate debt (see chart 9). Never
Debt-to equity ratio decreases slightly
Annual change in %1
Loans: VolumesAnnual change in %
Bonds: Volumes
20
15
10
5
0
–5
30
25
20
15
10
5
0
Annual change in %
Quoted Stocks: Volumes
%
Loans: Interest Rates
25
20
15
10
5
0
–5
7
6
5
4
3
2
1
0
Key Elements of Nonfinancial Corporations’ Financing: Volumes and Conditions
Chart 8
Source: OeNB, ECB, Thomson Reuters, Wiener Börse AG.1 Adjusted for reclassifications, changes in valuation and exchange rate effects.
Austria Euro area
%
Bonds: Yields%
Quoted Stocks: Earnings Yield
14
12
10
8
6
4
2
0
18
16
14
12
10
8
6
4
2
0
AA corporate bonds BBB corporate bonds
2006 2007 2008 2009 2010 2011 2012 2013 2014 2006 2007 2008 2009 2010 2011 2012 2013 2014 2006 2007 2008 2009 2010 2011 2012 2013 2014
2006 2007 2008 2009 2010 2011 2012 2013 2014 2006 2007 2008 2009 2010 2011 2012 2013 2014 2006 2007 2008 2009 2010 2011 2012 2013 2014

Corporate and Household Sectors in Austria: Debt Servicing Capacity Slightly Improved
24 OESTERREICHISCHE NATIONALBANK
theless, the ratio of corporate debt to gross operating surplus remained considerably above its precrisis levels, implying that the rise in the vulnerability of the corporate sector in the years 2007 to 2009 has not yet been reversed.
Likewise, the debttoequity ratio came down by 7 percentage points to
112% in 2013. The fact that both the debttoincome ratio and the debttoequity ratio are currently higher in Austria than in the euro area highlights the importance of debt financing in Austria but also reflects the ongoing deleveraging of the corporate sector in a number of euro area countries. The
% of gross operating surplus
Debt%
Debt-to-Equity Ratio1
560
540
520
500
480
460
440
420
400
380
140
130
120
110
100
90
80
70
60
50
2006 2007 2008 2009 2010 2011 2012 2013 2014 2006 2007 2008 2009 2010 2011 2012 2013 2014
% of gross operating surplus
Interest Expenses on MFI Loans2
% of total new lending
Variable Rate Loans
16
14
12
10
8
6
4
2
0
100
98
96
94
92
90
88
86
84
82
80
Risk Indicators for Nonfinancial Corporations
Chart 9
Source: OeNB, ECB, Eurostat, KSV 1870.1 Austria: equity without SPEs. 2 Euro area: euro loans only.
Austria Euro area
% of total loans
Foreign Currency LoansNumber of insolvencies in % of companies, four-quarter moving sum
Insolvencies
14
12
10
8
6
4
2
0
2.4
2.2
2.0
1.8
1.6
1.4
1.2
2006 2007 2008 2009 2010 2011 2012 2013 2006 2007 2008 2009 2010 2011 2012 2013 2006 2007 2008 2009 2010 2011 2012 2013
2006 2007 2008 2009 2010 2011 2012 2013 2014

Corporate and Household Sectors in Austria: Debt Servicing Capacity Slightly Improved
FINANCIAL STABILITY REPORT 27 – JUNE 2014 25
share of equity in the Austrian corporate sector’s total liabilities rose slightly from 42.6% to 43.9% in 2013.
The low interest rate environment continued to support firms’ ability to service their debt. In 2013, the fraction of corporate earnings (gross operating surplus) that had to be spent on interest payments for bank loans declined somewhat further. This decline was reinforced by the very high share of variable rate loans in Austria. While Austrian companies therefore currently have lower interest expenses than their euro area peers, their exposure to interest rate risk is higher. Thus, a rebound of the interest rate level might create a noticeable burden, especially for highly indebted companies, even if a rising debt service burden might eventually be partially offset by the positive impact of an economic recovery on firms’ earnings.
The exposure of the corporate sector to foreign exchange risk, which was never as high as that of the household sector, was reduced further, as the share of foreign currency loans declined to 4.8% in the first quarter of 2014 (more than 4 percentage points below the 2010 level), and thus was only ¼ percentage point higher than in the euro area.
The insolvency ratio (number of corporate insolvencies in relation to the number of existing companies) declined until the first quarter of 2014 (based on a moving fourquarter sum to account for seasonality). This may be due to the moderate path of debt financing and the low interest rate level (which makes debt servicing easier even for highly indebted companies). Furthermore, it may also be attributed to the fact that insolvencies usually lag cyclical
movements. Insolvency liabilities, however, almost doubled in the period under review due to a largescale bankruptcy.
Households’ Financial Investment Decreases FurtherReal Income of Households Declined in 2013
Although the economic recovery set in only gradually, employment augmented markedly in 2013 and early 2014. At the same time, unemployment increased because labor supply, in particular labor from abroad, rose. Yet real disposable household income fell in 2013, mainly reflecting weak real wage growth as well as a marked decline in property income. This reduction in turn dampened private consumption, and spending on durable consumer goods even decreased in real terms. At the same time, the saving ratio diminished to 6.6% in 2013. On the one hand, the low interest rate environment may have reduced the attractiveness of saving. On the other hand, the decline in the saving ratio may reflect the muted development of property income, as this portion of disposable income is more likely to be saved than labor income.
Financial Investment of Households Fell by One-Third in 2013
In parallel with the drop in the saving ratio, financial investment by households4 continued to recede in 2013 and at EUR 6.9 billion amounted to little more than onethird of the precrisis peak value recorded in 2007 (see chart 10).
More than 40% of households’ financial investment went into cash and deposits with banks. Looking at the
Variable rate loans imply interest rate risk
Further drop in the saving ratio
Falling number of insolvencies
Shift to cash and bank deposits with shorter maturities
4 Nonprofit institutions serving households are not included here.

Corporate and Household Sectors in Austria: Debt Servicing Capacity Slightly Improved
26 OESTERREICHISCHE NATIONALBANK
maturity structure of bank deposits, deposits with agreed maturity declined both in 2013 and in 2014 so far, whereas large inflows into overnight deposits were recorded. This shift to cash and shorter maturities suggests a high liquidity preference of households and reflects the low opportunity cost resulting from low interest rates. A breakdown by types of deposit shows that demand deposits continued to grow and time deposits remained stable while savings accounts registered a net decrease. Deposits at building and loan associations, which rose by 1.3% in the first quarter of 2014, represented the only exception on the back of the comparatively attractive interest rates for building loan contracts.
Households’ net financial investment in capital market assets fell to EUR 0.3 billion in 2013 (from EUR 0.9 billion in 2012). Households reduced their holdings of longterm debt securities but increased their portfolios of mutual fund shares. Additionally, there was a slight net inflow into direct holdings of foreign equities. This development reflected the search for yield in a low interest rate environment as well as the recovery of share prices in international markets in the course of 2013.
At EUR 2.0 billion, investment in life insurance contracts and pension funds still had a stabilizing effect on financial investment in 2013, accounting for more than onequarter of financial investment in this period. However, a large share of inflows into these instruments was not the result of current investment decisions, but – given the long maturities and commitment periods – reflected past decisions. One key factor in this context is the demand for funded pension instruments; more
over, life insurance policies often serve as repayment vehicles for foreign currency bullet loans.
Austrian households registered (unrealized) valuation losses of EUR 1.4 billion in their securities portfolios in 2013. These losses were equivalent to 1.4% of their securities holdings at end2012. While debt securities and mutual fund shares in the portfolios of Austrian households registered (unrealized) valuation losses, the increase in share prices in 2013 resulted in valuation gains of quoted stocks equivalent to 6.4% of households’ holdings at end2012. Taking financial investment, valuation losses and other changes5 together, finan cial assets rose by EUR 6.8 billion in 2013.
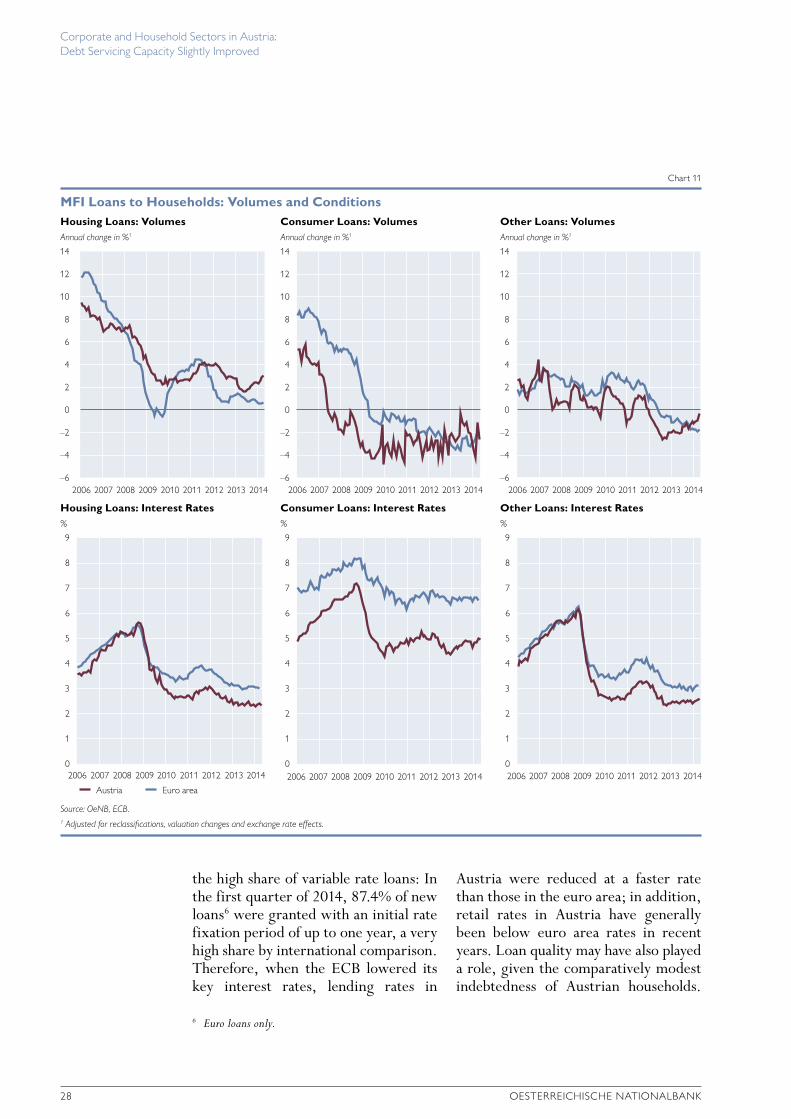
Slight Increase in Housing Loan Growth
Growth of bank lending to households was subdued in early 2014 even if annual growth rates, which had contracted continually for almost two years, recovered slightly from mid2013. In April 2014, bank loans to households (adjusted for reclassifications, valuation changes and exchange rate effects) increased by 1.3% in nominal terms.
A breakdown by currencies shows that eurodenominated loans were still expanding briskly (April 2014: 4.7%), while foreign currency loans continued to recede by doubledigit rates – in April 2014, they had fallen by 10.2% year on year. Broken down by loan purpose (see chart 11), consumer loans as well as other loans contracted by 2.6% and 0.4% year on year, respectively, in April 2014. Housing loans grew by 3.0% year on year, and their growth rate has gained some momentum since
Capital market investment shrinks
(Unrealized) valuation losses
Foreign currency loans continue to
decline
5 Mainly valuation losses in the net equity of households in life insurance investments, primarily fund-linked and index-linked life insurance.

Corporate and Household Sectors in Austria: Debt Servicing Capacity Slightly Improved
FINANCIAL STABILITY REPORT 27 – JUNE 2014 27
mid2013. The favorable financing conditions probably supported the growth of housing loans, and housing market indicators also pointed to an increase in credit demand. As housing prices continued to rise in Austria (see below), households may have needed more funding to purchase real estate. Although no current data on newly completed housing projects are available, the considerable rise in the number of residential building permits in 2013 (+15.8% over the previous year) suggests a rise in construction activity.
Loan conditions remained favorable. Interest rates for shortterm loans (up to one year) stood at 2.83% in April 2014, 0.71 percentage points below their October 2011 level, reflecting the five key interest rate cuts between November 2011 and November 2013 and the associated decline in money market rates. Looking at data across the entire maturity band, interest rates on new housing loans stood at 2.34% in April 2014, which was 0.69 percentage
points lower than the value recorded in October 2011. In the same period, interest rates on consumer loans dropped by 0.19 percentage points to 4.94%.
Households’ Currency and Interest Rate Risks
The indebtedness of Austrian households is rather low by international comparison. At the end of 2013, total household liabilities stood at EUR 168.0 billion according to financial accounts data, down by 0.4% in nominal terms from the 2012 yearend value. As a percentage of net dispo sable income, household debt shrank by 1.3 percentage points to 91.4% (see chart 12).
Given the combination of moderate debt growth and low interest rates, household interest expenses remained subdued. In 2013, they amounted to 2.0% of disposable income, about 2 percentage points less than in 2008, before interest rates began to fall. One factor that accelerated this decline was
Financing conditions remain favorable
Household debt slightly reduced
Interest expenses remain low
EUR billion
Determinants of Changes in Financial Assets
40
30
20
10
0
–10
–20
–30
EUR billion
Components of Financial Investment
20
18
16
14
12
10
8
6
4
2
0
Changes in Households’ Financial Assets
Chart 10
Source: OeNB.
Financial investment Valuation changes Other changes
Deposits Capital market investmentsLife insurance and pension funds Other TotalTotal change in financial assets
2006 2007 2008 2009 2010 2011 2012 2013 2006 2007 2008 2009 2010 2011 2012 2013
Corporate and Household Sectors in Austria: Debt Servicing Capacity Slightly Improved
28 OESTERREICHISCHE NATIONALBANK
the high share of variable rate loans: In the first quarter of 2014, 87.4% of new loans6 were granted with an initial rate fixation period of up to one year, a very high share by international comparison. Therefore, when the ECB lowered its key interest rates, lending rates in
Austria were reduced at a faster rate than those in the euro area; in addition, retail rates in Austria have generally been below euro area rates in recent years. Loan quality may have also played a role, given the comparatively modest indebtedness of Austrian households.
Annual change in %1
Housing Loans: VolumesAnnual change in %1
Consumer Loans: Volumes
14
12
10
8
6
4
2
0
–2
–4
–6
14
12
10
8
6
4
2
0
–2
–4
–6
Annual change in %1
Other Loans: Volumes
14
12
10
8
6
4
2
0
–2
–4
–6
2006 2007 2008 2009 2010 2011 2012 2013 2014
%
Housing Loans: Interest Rates%
Consumer Loans: Interest Rates
9
8
7
6
5
4
3
2
1
0
9
8
7
6
5
4
3
2
1
0
9
8
7
6
5
4
3
2
1
0
%
Other Loans: Interest Rates
MFI Loans to Households: Volumes and Conditions
Chart 11
Source: OeNB, ECB.1 Adjusted for reclassifications, valuation changes and exchange rate effects.
Austria Euro area
2006 2007 2008 2009 2010 2011 2012 2013 2014 2006 2007 2008 2009 2010 2011 2012 2013 2014 2006 2007 2008 2009 2010 2011 2012 2013 2014
2006 2007 2008 2009 2010 2011 2012 2013 2014 2006 2007 2008 2009 2010 2011 2012 2013 2014
6 Euro loans only.

Corporate and Household Sectors in Austria: Debt Servicing Capacity Slightly Improved
FINANCIAL STABILITY REPORT 27 – JUNE 2014 29
The still high proportion of foreign currency loans in total loans remains a major risk factor for the financial position of Austrian households. Although the share of foreign currency loans in total loans has fallen by more than 10 percentage points since 2008, 20.0% of the total loan volume to Austrian households were still denominated in foreign currency in the first quarter of 2014. The considerable reduction is a consequence of the Austrian Financial Market Authority’s minimum standards for granting and managing foreign currency loans, which aim at substantially limiting new foreign cur
rency lending to households. Almost 95% of the foreign currency loans outstanding were denominated in Swiss francs, around 5% in Japanese yen.
Residential Property Prices Continue to RiseIn the first quarter of 2014, the prices in the Austrian residential property market continued to rise, although the price increases abated somewhat. Price dynamics remained very heterogeneous across different regions. In Vienna, prices surged 8.1% year on year, implying ten consecutive years of house price hikes. In the first quarter of 2014, the
Foreign currency loans remain major risk
Rising overvaluation of property prices in Vienna
% of disposable income
Liabilities% of disposable income
Interest Expenses on MFI Loans
110
105
100
95
90
85
80
75
6
5
4
3
2
1
0
% of total loans
Foreign Currency Loans% of total new loans
Variable Rate Loans
Household Risk Indicators
Chart 12
Source: OeNB, Statistics Austria, ECB, Eurostat.
Note: Figures for the euro area reperesent only the interest rate expense on euro-denominated loans.
Austria Euro area
35
30
25
20
15
10
5
0
100
80
60
40
20
0
2006 2007 2008 2009 2010 2011 2012 2013 2006 2007 2008 2009 2010 2011 2012 2013
2006 2007 2008 2009 2010 2011 2012 2013 2014 2006 2007 2008 2009 2010 2011 2012 2013 2014

Corporate and Household Sectors in Austria: Debt Servicing Capacity Slightly Improved
30 OESTERREICHISCHE NATIONALBANK
fundamental residential property price indicator of the OeNB7 pointed to an increasing degree of overvaluation in property prices in Vienna (22%). The price increase in the rest of Austria has been considerably more moderate, amounting to 2.2% in the first quarter of 2014, and the fundamental residential property price indicator does not indicate any overvaluation. On aggregate, residential property prices in Austria increased by 40% between 2007 and the first quarter of 2014 (+22% in real terms, adjusted for HICP inflation)
which contrasts with a slight reduction of residential property prices in the whole euro area (see chart 13).
From an investor’s perspective, the rising relation of property prices to rents observed in Vienna indicates a decreasing yield on property investments. In part, the price increases in Austria reflect a catchingup, as prices had been virtually flat in the years before 2007. Other factors behind these price developments were increased demand due to immigration and possibly also a flight to real assets.
7 See Schneider, M. 2013. Are Recent Increases of Residential Property Prices in Vienna and Austria Justified by Fundamentals? In: Monetary Policy and the Economy Q4/13. 29–46.
2006=100
Residential Property Price Index2006=100
Price-to-Rent Ratios
190
180
170
160
150
140
130
120
110
100
90
150
140
130
120
110
100
90
80
70
60
Residential Property Price Indicators
Chart 13
Source: OeNB, Vienna University of Technology, ECB, Statistics Austria.
Vienna Austria without Vienna Euro area
2006 2007 2008 2009 2010 2011 2012 2013 2014 2006 2007 2008 2009 2010 2011 2012 2013 2014

FINANCIAL STABILITY REPORT 27 – JUNE 2014 31
One-Off Effects Erode Austrian Banks’ ProfitsThe continued economic recovery and further strengthening of the regulatory and supervisory framework for the banking system marked economic and financial developments in Europe in 2013. Macroeconomic uncertainties were reduced and market participants’ confidence in the financial system’s stability improved, resulting in a benign market environment for financial intermediation.1
Nevertheless, Austrian banks faced noticeable headwinds due to continuously low interest margins as well as oneoff effects related to legacy issues, such as goodwill writedowns and large losses at Hypo AlpeAdriaBank International AG. These challenges are a heavy burden on the profitability of the Austrian banking system, leading to the first systemwide loss in recent history. Without taking into account oneoff effects, net profits would have been positive, but still considerably below precrisis levels.
The ongoing period of weak profitability is also the result of structural cost issues in a very competitive domestic market and banks’ continued need to provision for credit risks. While in Austria loan quality remained comparatively favorable in 2013, Austrian banks’ subsidiaries in CESEE – although operationally still profitable – are facing considerable loan quality issues in several countries. This trend can be explained by two factors, which are both linked to the weak economic environment: The inflow of new nonper
forming loans (NPLs) has continued, and credit demand has remained sluggish overall. To promote transparency and dispel lingering concerns about loan quality and provisioning, the ECB, in cooperation with national authorities, is currently performing a comprehensive assessment of the balance sheets of systemically significant European banks. The ECB will publish the results of this exercise in October 2014 before it takes over its supervisory role within the Single Supervisory Mechanism (SSM).
In 2013, bank funding markets continued to strengthen, with further signs of receding fragmentation in both market and deposit funding, and Austrian banks further reduced their liquidity risk exposure. Retail deposits at Austrian banks grew steadily, but the low interest rate environment kept growth rates below their longtime average. Loan growth in Austria was also sluggish: Lending in foreign currency remained low, as intended by supervisory action, but the outstanding volume of such loans (including those linked to repayment vehicles) continues to pose a risk to Austrian banks. Euro loans to domestic customers, however, increased. Both trends continued in early 2014.
In the euro area, banks continued to strengthen their capital ratios by a combination of asset deleveraging and capital increases in 2013. Austrian banks also followed this trend, but the capitalization gap between them and their international peers has widened, and there is persistent market pressure for further improvements.
Austrian Financial Intermediaries: Regaining Profitability to Increase Resilience of Crucial Importance
1 The benign market environment is also reflected in the Austrian Financial Stress Index (AFSI), see chart 20.

Austrian Financial Intermediaries: Regaining Profitability to Increase Resilience of Crucial Importance
32 OESTERREICHISCHE NATIONALBANK
The operating environment remained difficult for insurance undertakings as well, with financial results reflecting a modest, but stable performance. The lowyield environment is set to remain a particular concern for a large number of insurers over the medium term.
Consolidated Profitability of Austrian Banks Negative in 2013
The challenging environment for Austrian banks since the onset of the financial crisis characterized by weak economic growth, higher credit risk provisioning and continuously low interest rate margins has been weighing on banks’ profits. Furthermore, tighter regulation and bank levies, which have been introduced as a direct consequence of the crisis, are shifting public costs back to banks, investors and creditors.
Consequently, Austrian banks recorded a consolidated return on (average) assets (RoA) of close to zero, but slightly negative at –0.04% for 2013 (chart 14). The net loss after tax and minority interests amounted to about EUR 1 billion, compared to a profit of EUR 3 billion in 2012. This result can be attributed to several factors: On the one hand, operations were characterized by ongoing low interest margins and reduced volumes, which led to a decline in consolidated net interest income by 3.4% to EUR 18.6 billion. On the other hand, the net result was affected by writedowns of goodwill linked to subsidiaries in CESEE as well as losses at Hypo AlpeAdriaBank International AG. Without taking into account these negative oneoff effects, the net profit would have been positive, but still below precrisis levels. Moreover, in 2012, results had benefited from positive oneoff effects from buybacks of supplementary and hybrid capital.
CESEE operations, while continuing to be an important contributor to the (operating) profitability of Austrian banks, also come with higher risks: higher NPL ratios, goodwill writedowns and political uncertainty in some countries. These risks have translated into higher risk costs over the past few years. The increasing impact of higher risks on Austrian banks’ overall profitability becomes evident in a widening gap between preprovisioning and realized RoA. Over the past few years, persistently high risk costs – reflecting especially the difficult economic environment in some CESEE countries – have substantially eaten into banks’ overall profitability (chart 14). Since 2008, Austrian banks have had to spend nearly EUR 44 billion, i.e. 65% of total operating profit in the respective period, on covering credit risks; in 2013, this share increased even further, reaching 88%.
Finally, an increase in income from fees and commissions (primarily owing to a recovery in the securities business)
Austrian banks’ profitability affected
by several factors
%
1.4
1.2
1.0
0.8
0.6
0.4
0.2
0.0
–0.2
Consolidated Return on Assetsof the Austrian Banking System
Chart 14
Source: OeNB.
Before provisioning and adjusted for one-off effectsAdjusted for one-off effectsUnadjusted
2006 2007 2008 2009 2010 2011 2012 2013

Austrian Financial Intermediaries: Regaining Profitability to Increase Resilience of Crucial Importance
FINANCIAL STABILITY REPORT 27 – JUNE 2014 33
was not able to offset the significant decrease in trading income (down compared to the previous year’s profits driven by oneoff effects) and lower other (remaining) income items.
In 2013, interest margins on European banks’ new business increased further – to nearly 200 basis points – driven by more riskadequate pricing in the euro area’s southern peripheral countries. Despite increasing on a similar scale, the level of interest margins in Austria remained well below the European average (chart 15, lefthand panel). But this improvement had little impact on the margin on existing stock (chart 15, righthand panel), as the volume of new business was rather low.2
As regards existing business, small Austrian banks (i.e. banks with total assets below EUR 2 billion) were affected by the steady decline in interest margins over the past few years, which put pressure on their profitability given their heavy reliance on net interest income (chart 15, righthand panel).
Another factor which explains the comparatively small interest margin is the competitive pressure that results from the high number of banks operating in Austria (790 registered banks as of end2013; this high figure is mostly due to the prominent role of the decentralized sectors with their high density of branches). Together with a rigid cost structure, longterm structural problems have negative implications for profitability. Therefore, the current process of restructuring and redimensioning of cost structures is likely to continue.
In order to strengthen the structural profitability and capital generation capacity of banks, it is necessary that banks with an unsustainable business model that does not yield positive returns over the medium term may leave the market without jeopardizing its stability. This objective has also been at the center of recent legislative initiatives, such as the EU Bank Recovery and Resolution Directive (BRRD).
Low interest margins on domestic business
… including structural (cost) issues
2 The definitions of interest margins in chart 15 (left-hand and right-hand panels) are not completely identical, therefore comparability is limited.
Basis points Basis points
Interest Margins on New Business withHouseholds and Nonfinancial Corporations
Net Interest Margins on Domestic (Existing)Business
250
200
150
100
50
0
250
200
150
100
50
02003 2005 2007 2009 2011 2013
Interest Margins of Austrian Banks
Chart 15
Source: OeNB, ECB. 1 Total banking sector excl. nationalized banks. 2 Total assets of less than EUR 2 billion.
Note: Unconsolidated data.
Austria Euro area
2003 2005 2007 2009 2011 2013
Total banking sector1 Small banks2

Austrian Financial Intermediaries: Regaining Profitability to Increase Resilience of Crucial Importance
34 OESTERREICHISCHE NATIONALBANK
Net profits of Austrian subsidiaries in CESEE came to EUR 2.2 billion in 2013, up 5.8% on the previous year, amounting to an RoA of approximately 0.8%. However, on a consolidated level, this profit was almost entirely offset by writedowns of goodwill linked to CESEE subsidiaries. What is more, in the past, the profit sources of Austrian subsidiaries had been evenly distributed across CESEE, which also yielded risk diversification benefits; in recent years, by contrast, profits have increasingly come from just a few countries (chart 16), namely the Czech Republic, Slovakia, Russia and Turkey.3 The relatively high profits in these few markets highlight
a concentration risk and the need for a sustainable growth strategy in the region. Recent turmoil in some of these markets has also underlined the fragility of the current earnings situation.
Loan Quality: Benign Conditions in Austria, Deterioration in CESEE
While loan quality conditions in Austria remained fairly benign in 2013, Austrian banks’ subsidiaries in CESEE are still facing noticeable headwinds. This ongoing weakness can be explained by two factors, both of which are linked to the fragile economic environment in several countries: The inflow of new nonperforming loans (NPLs) continued, and credit demand has remained sluggish overall. As a consequence, the consolidated share of NPLs in the Austrian banking system stabilized at a high 8.6%, while the consolidated loan loss provision ratio (LLPR) continued to rise to 4.8% at the end of 2013, resulting in an improved coverage ratio ahead of the asset quality review under the ECB’s comprehensive assessment of significant banks (see chart 17 and box 1).
Loan quality in Austria remained largely unchanged in 2013, as highlighted by the unconsolidated LLPR (stock of specific loan loss provisions as a share of total nonbank loans), which has been rangebound between 3.0% and 3.5% since 2010. However, chart 18 illustrates substantial differences between banks: Small and locally active banks4 had a relatively stable LLPR of approximately 4.2%, while significant
CESEE: profits increasingly
concentrated in certain markets and eroded by goodwill
write-downs
Quality of domestic loan portfolio
broadly stable, especially at small
locally active banks
3 As a significant joint venture in Turkey is not covered separately by the Austrian supervisory reporting framework, its results are not included in the analysis of subsidiaries. See also Wittenberger et al. 2014. Macrofinancial Developments in Ukraine, Russia and Turkey from an Austrian Financial Stability Perspective, in this issue.
4 In this context, we define small and locally active banks as banks with total assets of less than EUR 2 billion on an unconsolidated basis.
EUR billion
4.5
4.0
3.5
3.0
2.5
2.0
1.5
1.0
0.5
0.0
–0.5
–1.0
Distribution of Profits of Austrian Subsidiaries in CESEE
Chart 16
Source: OeNB.
CZ RO RU HRHU UA BGRS SI Other
SK
CZ CZ CZ CZ CZ CZ
RO
RO RO RO
RO
RO
RU
RU RU RU RU
RU
HR
HR HR HR
HR HR
HU
HU HU
HU HU
HU
2008 2009 2010 2011 2012 2013

Austrian Financial Intermediaries: Regaining Profitability to Increase Resilience of Crucial Importance
FINANCIAL STABILITY REPORT 27 – JUNE 2014 35
Austrian banks5 experienced a very strong increase in provisioning in recent years.
Bank lending to nonbanks in Austria declined slightly in 2013 (–0.4% year on year). This decline was driven by reduced lending to nonbank financial intermediaries and the government, while the volume of loans to households and corporates was slightly higher than the corresponding prioryear figure. In the first quarter of 2014, the volume of loans to domestic customers declined by 0.2% (year on year), driven by an upswing in lending to households compared to end2013.
Regarding lending to households, lending for housing and home improvement continued to outpace general
lending growth, but the share of housing loans to total loans is still below the European average. Nevertheless, the recent strong increase in residential property prices, particularly in Vienna, coupled with continued mortgage lending growth may entail a higher risk of credit losses for banks compared with previous periods. Therefore, what is called for is great vigilance and strict monitoring by the supervisory authorities to assess whether sufficiently conservative credit standards and adequate risk pricing are applied.
In 2013, the share of foreign currency loans (FCLs) in Austria declined further. By the end of the year, 12.3% of all loans to customers were denominated in a foreign currency. In the first
Positive loan growth in Austria in 2013 limited to lending to households and corporations
Share of foreign currency loans in total loans continues to fall
5 The following Austrian banks are deemed “significant” according to the Single Supervisory Mechanism (SSM) regime and are participating in the comprehensive assessment and the stress test: BAWAG P.S.K. Bank für Arbeit und Wirtschaft und Österreichische Postsparkasse AG, Erste Group Bank AG, Raiffeisenlandesbank Oberösterreich AG, Raiffeisenlandesbank Niederösterreich-Wien AG, Raiffeisen Zentralbank Österreich AG and Österreichische Volksbanken-Aktiengesellschaft as well as Unicredit Bank Austria (which participates in the SSM as part of its Italian parent).
Ratios for the consolidated nonbank loan portfolio in %
10
9
8
7
6
5
4
3
2
1
0
57
56
55
54
53
52
51
50
49
48
47
Loan Quality of the Austrian BankingSystem
Chart 17
Source: OeNB.
Loan loss provision ratioNonperforming loan ratioCoverage ratio (right-hand scale)
2009 2010 2011 2012 2013
Provisions on customer loans in %
5.0
4.5
4.0
3.5
3.0
2.5
2.0
1.5
1.0
0.5
0.0
Loan Loss Provisions in Austria(Domestic Business)
Chart 18
Source: OeNB. 1 Subsector of less significant banks.
Significant banksLess significant banks
Small locally active banks1
Total
2006 2007 2008 2009 2010 2011 2012 2013

Austrian Financial Intermediaries: Regaining Profitability to Increase Resilience of Crucial Importance
36 OESTERREICHISCHE NATIONALBANK
quarter of 2014, this share decreased further (12.1%). Despite the 2.2 percentage point drop in outstanding FCLs compared to end2012 and limited new foreign currency lending to Austrian borrowers, legacy assets continue to be a relevant issue for the Austrian banking system. The maturity profile of FCLs shows that most of these loans will mature from 2017 onward; a particular challenge is related to the fact that 70% of FCLs to households are bullet loans, more than 90% of which are linked to repayment vehicles.
Therefore, strict compliance with the supervisory foreign currency minimum lending standards (as of January 2013) will be an important element in containing the various risks related to this type of lending (credit risk, currency risk, market risk).
The total loan volume of Austria’s top six credit institutions’ CESEE subsidiaries declined moderately in 2013, mainly due to the planned sale of a subsidiary of UniCredit Bank Austria in Ukraine,6 resulting in a discontinuation of the reporting of the respective exposure. Without this planned sale, the overall exposure would have remained broadly stable. However, regional heterogeneity is on the rise: Banks have been increasingly focusing on their core markets, reducing their business in countries which are defined as noncore or display macroeconomic and/or political vulnerabilities. Declines in exposures were reported in Ukraine and Hungary, while growth was still strong in Russia, Belarus and Slovakia in the first half of 2013, but slowing down in the second half of the year. The share of loans to households in the overall loan portfolio amounted to
43.3% at end2013, while loans to nonfinancial corporations accounted for the remaining 56.7%.
Supervisory initiatives that have been launched to restrict foreign currency lending in CESEE can be considered effective, as these loans declined by 7.1% year on year (amounting to EUR 74.2 billion at end2013), taking into account exchange rate effects, and thus more strongly than the overall loan portfolio. As a result, the aggregate share of foreign currency loans – the bulk of which is denominated in euro – in total loans decreased from 45.7% to 43.2%.
Turning to nonperforming loans (NPLs), the NPL ratio of Austrian subsidiaries in CESEE remained broadly stable in 2013, standing at 14.9% at yearend (chart 19). The NPL ratio for foreign currency loans increased from 19.4% to 20.2%. Due to different definitions of NPLs and heterogeneous economic and foreign exchange developments in CESEE, crosscountry differences in NPL ratios are still high. While the ratio remained below or close to 5% in some of the most important host countries of Austrian banks (e.g. the Czech Republic, Russia, Slovakia), the NPL ratios of subsidiaries in other countries (Hungary, Serbia, Bosnia and Herzegovina, Croatia) increased markedly in recent years, reaching levels of close to or more than 25%. Regarding other troubled loans, the share of restructured loans amounted to 6.5% of total loans at end2013, which is a slight decline compared to end2012, and renegotiated loans were only of minor importance (3.3% compared with 4.1% in 2012).
NPL coverage ratios I (ratio of loan loss provisions for NPLs to NPLs) in
NPLs of Austrian subsidiaries in
CESEE still rising in several countries
Coverage ratios of Austrian subsidiaries in CESEE improved
in recent years
6 This subsidiary was therefore classified as a disposal group held for sale in the 2013 financial statement; in the income statement, it was included in the item “Total profit or loss after tax from discontinued operations.”
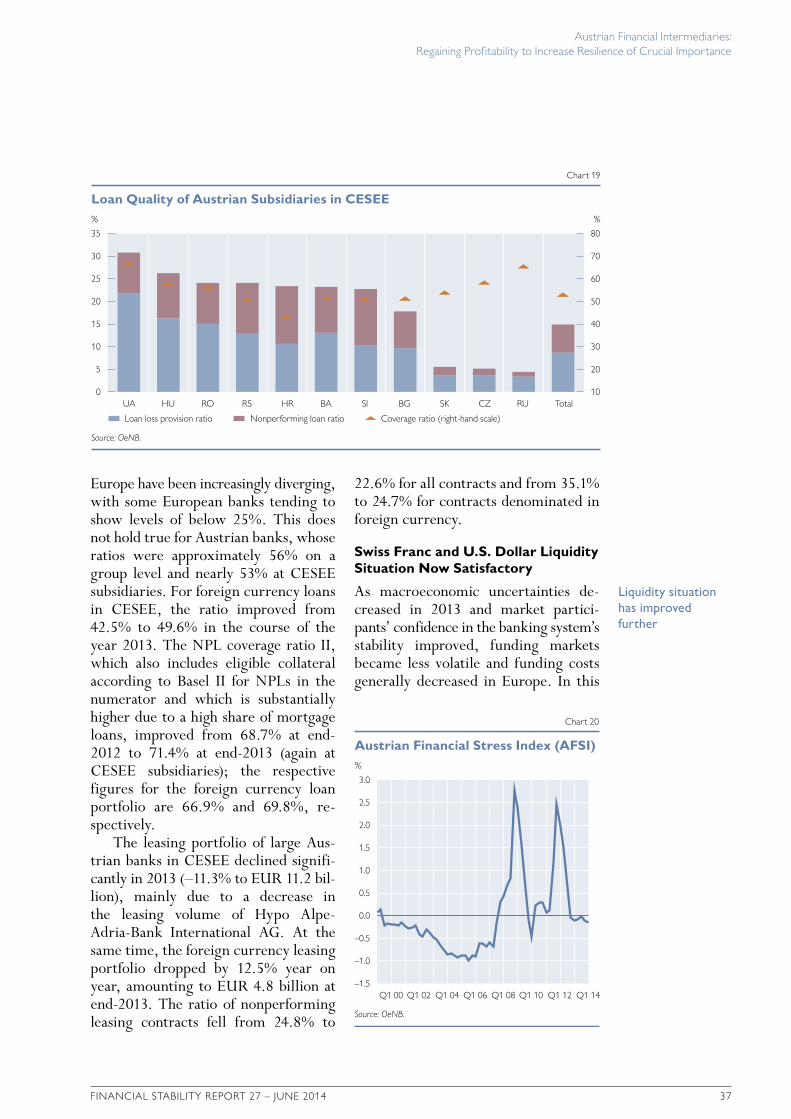
Austrian Financial Intermediaries: Regaining Profitability to Increase Resilience of Crucial Importance
FINANCIAL STABILITY REPORT 27 – JUNE 2014 37
Europe have been increasingly diverging, with some European banks tending to show levels of below 25%. This does not hold true for Austrian banks, whose ratios were approximately 56% on a group level and nearly 53% at CESEE subsidiaries. For foreign currency loans in CESEE, the ratio improved from 42.5% to 49.6% in the course of the year 2013. The NPL coverage ratio II, which also includes eligible collateral according to Basel II for NPLs in the numerator and which is substantially higher due to a high share of mortgage loans, improved from 68.7% at end2012 to 71.4% at end2013 (again at CESEE subsidiaries); the respective figures for the foreign currency loan portfolio are 66.9% and 69.8%, respectively.
The leasing portfolio of large Austrian banks in CESEE declined significantly in 2013 (–11.3% to EUR 11.2 billion), mainly due to a decrease in the leasing volume of Hypo AlpeAdriaBank International AG. At the same time, the foreign currency leasing portfolio dropped by 12.5% year on year, amounting to EUR 4.8 billion at end2013. The ratio of nonperforming leasing contracts fell from 24.8% to
22.6% for all contracts and from 35.1% to 24.7% for contracts denominated in foreign currency.
Swiss Franc and U.S. Dollar Liquidity Situation Now Satisfactory
As macroeconomic uncertainties decreased in 2013 and market participants’ confidence in the banking system’s stability improved, funding markets became less volatile and funding costs generally decreased in Europe. In this
Liquidity situation has improved further
% %
35
30
25
20
15
10
5
0
80
70
60
50
40
30
20
10
Loan Quality of Austrian Subsidiaries in CESEE
Chart 19
Source: OeNB.
Loan loss provision ratio Nonperforming loan ratio Coverage ratio (right-hand scale)
UA HU RO RS HR BA SI BG SK CZ RU Total
%
3.0
2.5
2.0
1.5
1.0
0.5
0.0
–0.5
–1.0
–1.5
Austrian Financial Stress Index (AFSI)
Chart 20
Source: OeNB.
Q1 00 Q1 02 Q1 04 Q1 06 Q1 08 Q1 10 Q1 12 Q1 14

Austrian Financial Intermediaries: Regaining Profitability to Increase Resilience of Crucial Importance
38 OESTERREICHISCHE NATIONALBANK
benign environment, the Austrian Financial Stress Index – introduced in the previous Financial Stability Report – remained low (chart 20),7 and capital market conditions are supportive of funding and capital raisings.
Since the end of September 2013 (the Financial Stability Report 26 cut
off date), the liquidity situation of the Austrian banking system has improved from an already comfortable position. This macroprudential assessment is based on the weekly liquidity report, which is submitted by the 29 largest Austrian banks on a consolidated level (latest data as of May 30, 2014). It
Box 1
The European Asset Quality Review and Stress Test from an Austrian Perspective
The ECB is currently performing a comprehensive assessment of 128 significant banks in the euro area, which comprises an asset quality review (AQR) based on year-end 2013 data and a stress test covering the years 2014 to 2016. Six significant Austrian banking groups participate in this assessment. The comprehensive assessment is carried out by the ECB with close involvement of the national authorities, including in Austria the FMA and OeNB. The overall goal of the exercise is to achieve more transparency about banks’ balance sheets and, where needed, to speed up balance sheet repair by demanding adequate corrective action.
The AQR is currently in phase 2, which covers the on-site review. Phase 1, the selection of portfolios, was completed in February 2014. Phase 2 consists of ten overlapping work blocks, which are currently executed in line with the project schedule. The central element is the review of credit files and collateral values based on samples that are drawn from the selected portfolios. Since these activities require an extensive workload that has to be conducted on site in line with ECB methodology, several international auditing firms were commissioned to perform these tasks in Austria. Furthermore, a wide-ranging quality assurance process has been established at the European and national levels to ensure the consistent application of the methodology across participating banks and geographies, and considerable staff resources of national authorities (including the OeNB) have been allocated to these tasks.
As regards the EU-wide stress test, the scenarios and methodology were published at the end of April 2014 by the relevant European bodies (EBA, ECB). The exercise will assess banks’ resilience to an adverse scenario that was designed based on the current systemic risk assessment at the European level. It assumes, inter alia, a cumulative deviation of 7 percentage points from the baseline real GDP growth path for the entire EU from 2014 to 2016 (6.7 percentage points for Austria), a foreign exchange shock and a global reassessment of risks in equity and bond markets. The publication of the common methodology and scenarios in April 2014 marked the operative start of the bottom-up stress test calculation by the participating banks; national authorities and the ECB are closely involved in preparations, management and quality assurance.
The results of the AQR and the stress test will be published jointly in fall 2014. The current timeline foresees the publication of results before the ECB’s assumption of super-visory tasks for significant banks in the countries participating in the SSM, which is scheduled for November 2014. Given the current stage of the comprehensive assessment and the agreed publication strategy among SSM countries, no indication on the likely results for participating Austrian banks can be given prior to the publication of the results.
7 Details of the methodology of the Austrian Financial Stress Index (AFSI) can be found in Financial Stability Report 26 (December 2013). In general, an AFSI below zero is an indication of no current financial stress in Austria.

Austrian Financial Intermediaries: Regaining Profitability to Increase Resilience of Crucial Importance
FINANCIAL STABILITY REPORT 27 – JUNE 2014 39
covers about 80% of total assets of the Austrian banking sector. The cumulated net funding gap (maturities up to 12 months without money market operations and foreign exchange swaps, aggregated across all currencies) amounts to about –EUR 34 billion and has been basically unchanged since the end of September 2013. The aggregate liquidity risk exposure is sufficiently covered by substantial liquidity riskbearing capacity; the respective cumulated counterbalancing capacity stands at about EUR 109 billion (+10% since the end of September 2013).
Due to tightened supervision by the Austrian authorities and lessons learned from the crisis, Austrian banks have substantially improved their liquidity situation in Swiss francs and U.S. dollars compared to 2009. After years of gradual adjustment, Austrian banks’ liquidity situation is sound in both currencies. Since the end of September 2013, domestic banks have managed to turn a U.S. dollar cumulated net funding gap into a surplus. This improvement was driven by a reduction of assets in foreign currency through the sale of subsidiaries and successful supervisory action in the area of foreign currency lending, while banks also improved the funding structure and counterbalancing capacity for their remaining foreign currency assets. The Swiss franc cumulated net funding gap continued to improve as well (–25% since the end of September 2013). In addition, liquidity buffers increased, so that the cumulated counterbalancing capacity improved by 60% to –EUR 3.2 billion compared with the end of September 2013.
Despite these encouraging developments, pockets of vulnerability remain.
Especially smaller banks are faced with substantial concentration risk regarding their high quality liquid assets (HQLA). They need to diversify across counterparties and funding instruments and also ensure sufficient diversification across assets, asset classes and issuers in their counterbalancing capacity. In addition, it remains banks’ responsibility to ensure that their HQLA composition reflects changes in market liquidity. Adapting liquidity risk management to properly reflect the marketbased indicators of HQLA is highly recommended.8
Market pressure to reduce liquidity risk and improve liquidity risk disclosure will increase with the European Commission’s delegated act pursuant to Article 460 of the Capital Requirements Regulation (CRR) entering into force and the publication of the final requirements for disclosure related to the Liquidity Coverage Ratio (LCR). The delegated act is scheduled to enter into force by end2014; it will be based on the results of the EBA report on the LCR impact assessment. This report showed that the average LCR of EU banks was 115% at the end of 2012 (five years ahead of the implementation of the envisaged 100% LCR requirement). Twothirds of the bank sample already had an LCR above 100% and only onesixth an LCR below 60%. The report also included unweighted data of net cash outflows and liquidity buffers and revealed that for Austrian banks in the sample, contractual net outflows over the following 30 days are six times higher than their HQLA, while for other banks the ratio is above eight.
The recalibration of the LCR in January 2013 increased the average LCR in the sample by 15 percentage points and reduced the liquidity short
Market pressure for LCR disclosure expected
8 See also Guidance for Supervisors on Market-Based Indicators of Liquidity published by the Basel Committee on Banking Supervision in January 2014.

Austrian Financial Intermediaries: Regaining Profitability to Increase Resilience of Crucial Importance
40 OESTERREICHISCHE NATIONALBANK
fall by about EUR 550 billion to EUR 264 billion (or 0.8% of total assets in the sample). The lowering of the bar increases the role of disclosure and market discipline. In January 2014, the Basel Committee on Banking Supervision (BCBS) published its final require
ments for LCRrelated disclosures, which have to be implemented by national authorities no later than January 1, 2015. The BCBS compromise focuses on the quarterly disclosure of simple averages for a number of LCR components based on 90 daily observations.
Box 2
Deposit Guarantee Schemes and Bank Recovery and Resolution Directives Adopted
On April 15, 2014, the European Parliament adopted the Directive on Deposit Guarantee Schemes (DGSD). The DGSD, designed to further strengthen depositor confidence, recasts Directive 94/19/EC and its subsequent amendments and will enter into force at the beginning of July 2014 at the latest. Within one year after entry into force, the DGSD needs to be trans-posed into national law. Harmonized deposit guarantee schemes are complements to the Single Supervisory Mechanism (SSM) and the Single Resolution Mechanism (SRM), both key pillars of the future banking union.
However, the DGSD does not represent a system change toward a common DGS, as in some aspects it maintains the diversity in national systems; rather, it is a further harmonization of existing rules. The aim of the DGSD is to ensure sufficient financial means in DGSs by introducing ex-ante financing arrangements with a minimum target level of 0.8% of covered deposits to be reached within a ten-year period and collected from banks’ contributions. In the event of bank deposits becoming unavailable, DGSs under the new regime are to ensure faster payouts to depositors: by 2024 within 7 working days compared with currently 20 working days. Moreover, according to the directive, DGSs must be supervised on an ongoing basis and regular stress tests of the systems must be performed. Depositors will no longer have to submit an application for repayment if their deposits become unavailable. The determination of their eligibility for repayment will be further simplified and harmonized. The coverage level will remain at EUR 100,000 per depositor and per institution.
In Austria, the DGSD requires a change from the current ex-post funded system to an ex-ante funded system. The estimated Austrian target level will amount to around EUR 1.5 billion, requiring annual contributions of EUR 150 million. Contributions will be calculated on the basis of covered deposits and the risk profiles of individual banks.
The Directive establishing a framework for the recovery and resolution of credit institutions and investment firms (Bank Recovery and Resolution Directive – BRRD) was adopted by the EU Council on May 6, 2014.1 It provides capabilities to tackle potential bank problems at three stages: preparatory and preventative, early intervention, and resolution. Early intervention in unsound or failing institutions should ensure the continuity of the institution's critical functions, while minimizing the impact of an institution's failure on the economy and financial system.
As a further key element, the BRRD requires credit institutions to set up recovery plans. National resolution authorities will be set up and draft resolution plans for institutions. Credible resolution instruments, including the write-down of shareholders’ capital and bail-in of creditors,2 complete the toolbox. Certain liabilities, including deposits covered by the DGS, will be excluded from write-downs.
While one aim of the BRRD is to minimize the need for public support for failing banks, the application of government financial stabilization tools, including temporary public owner-
1 See also OeNB. 2013. Box 3 – Preparations for a European Banking Union. Financial Stability Report 26. 2 The bail-in tool shall be available from January 1, 2016, at the latest.

Austrian Financial Intermediaries: Regaining Profitability to Increase Resilience of Crucial Importance
FINANCIAL STABILITY REPORT 27 – JUNE 2014 41
Despite financial market conditions improving and customers’ risk appetite starting to increase, retail deposits at Austrian banks grew steadily in 2013 on an unconsolidated basis (+2.5% year on year). Nevertheless, the low interest rate environment kept growth rates below precrisis levels, and figures for the first quarter of 2014 show a reduction in deposit growth, especially in savings deposit growth. The loantodeposit ratio improved to 119% in 2013, also driven by sluggish credit growth. A similar path was observed for funding by Austrian banks’ subsidiaries in CESEE, where the aggregate funding gap closed in 2012, and the deposit surplus increased in 2013, continuing the positive trend of recent years. However, there are differences across the region as subsidiaries in some countries are still dependent on intragroup liquidity transfers.
The Austrian “sustainability package”9 adopted by the OeNB and the
Vast majority of Austrian subsidiaries in CESEE has sustainable business model
ship of an institution as a last resort, is not precluded, if financial stability would otherwise be jeopardized. However, such public support may only be provided under strict conditions.
The BRRD requires Member States to set up national ex-ante resolution financing arrange-ments (funds) to support the application of resolution tools. Banks will have to make annual contributions to enable the financing arrangement to reach within ten years a target level of at least 1% of covered deposits of all the credit institutions authorized in the respective country. According to current estimates, annual ex-ante contributions of credit institutions authorized in Austria will amount to about EUR 180 million, with the target level being EUR 1.8 billion.3
Banks’ capacity to absorb losses will be further strengthened by new minimum requirements for own funds and eligible liabilities, which authorities will set for each institution based on size, risk and business model.
In Austria, the Banking Intervention and Restructuring Act4 currently provides for preventive and early intervention measures. The transposition of the BRRD into Austrian law requires certain amendments, including the establishment of a resolution authority5 and a resolution fund. Also, the new resolution tools have to be incorporated into national law.
3 These funds will be transferred to the Single Resolution Fund within the SRM once the SRM becomes operational and the Intergovernmental Agreement on the transfer and mutualisation of contributions to the Single Resolution Fund enters into force (by January 1, 2016, as currently envisaged; the target level is to be reached by January 1, 2024). Under the SRM, the time span to reach the target level may decrease by one year compared to the BRRD regime. In that case, the respective annual contributions would increase accordingly.
4 Bankeninterventions- und Restrukturierungsgesetz (BGBl. I Nr. 160/2013). 5 This authority will also set up resolution plans, which, according to the current law, are drafted by the institutions them-
selves.
EUR billion %
30
25
20
15
10
5
0
–5
–10
15,0
12,5
10,0
7,5
5,0
2,5
0
–2,5
–5,0
Customer Funding Gaps at CESEESubsidiaries of Austrian Banks
Chart 21
Source: OeNB.
Total (left-hand scale)% of customer loans (right-hand scale)
2006 2007 2008 2009 2010 2011 2012 2013
9 FMA and OeNB. 2012. Supervisory guidance on the strengthening of the sustainability of the business models of large internationally active Austrian banks. http://www.oenb.at/en/Financial-Stability/Systemic-Risk-Analysis/Sustainability-of-large-Austrian-banks-Business-Models.html

Austrian Financial Intermediaries: Regaining Profitability to Increase Resilience of Crucial Importance
42 OESTERREICHISCHE NATIONALBANK
FMA in 2012 stipulates that the stock and flow loantolocal stable funding ratios (LLSFRs) at the CESEE subsidiaries of Austria’s three largest banks and the riskadequate pricing of intragroup liquidity transfers to subsidiaries be monitored. These measures are based on the Austrian supervisors’ experience that banking subsidiaries which entered the recent financial crisis with high (i.e. above 110% stock) LLSFRs were significantly more likely to exhibit higher loan loss provisioning rates than subsidiaries that had been following a more conservative and balanced business and growth model. Therefore, banking subsidiaries with stock LLSFRs above 110% are considered to be “exposed,” and the sustainability of their new business is monitored more closely. All supervisory findings are regularly shared and discussed with the respective banks as well as their host and home super visors.
By end2013, more than 80% of monitored subsidiaries were considered not to be exposed since their stock LLSFRs were below 110%. Only one exposed subsidiary was also found to exhibit an unsustainable trend in its new (yearonyear) business. Besides these results, monitoring also focuses on intragroup liquidity transfer volumes and the fund transfer pricing (FTP) models applied, which helps assess the dependency of foreign subsidiaries on parent bank funding and the adequacy of banks’ internal risk and pricing models.
Higher Capitalization Remains Priority
In the euro area, banks strengthened their capital positions amid ongoing deleveraging in 2013. In Austria, improvements have been achieved through a combination of capital increases, e.g. via rights issues and retained earnings,
and reductions in riskweighted assets. Though recent external capital raisings have been successful and helped repay state participation capital at some banks, there is still market pressure for higher capital ratios. However, weak profitability makes internal capital generation more difficult.
After their low in the second quarter of 2008, the aggregate tier 1 capital ratio and the capital adequacy ratio of all Austrian banks continued to improve, reaching 11.9% and 15.4%, respectively, by end2013. The OeNB acknowledges banks’ positive progress to date, but there is more to be done, since the capitalization of Austrian banks remains below that of their European peer group. In particular, the gap between the capitalization of Austria’s top three banks (11.4%) and their European peers (13.6%) and CESEE peers (12.7%) is still significant. At the same time, however, the top three Austrian banks have a higher (better) leverage ratio10 than their European peers. This can be attributed to the fact that in contrast to the tier 1 capital ratio, the leverage ratio does not take into account the risk weighting of assets.
Small and locally active Austrian
banks have above-average
capital ratios
Gap between top 3 Austrian banks and peer groups in percentage points
2.5
2.0
1.5
1.0
0.5
0.0
Peer Group Comparisonof Tier I Ratios
Chart 22
Source: OeNB.
Business model peers (31)CESEE peers (12)
2008 2009 2010 2011 2012 2013
10 Leverage ratio defined as tier 1 capital to total assets.

Austrian Financial Intermediaries: Regaining Profitability to Increase Resilience of Crucial Importance
FINANCIAL STABILITY REPORT 27 – JUNE 2014 43
The distribution of capital ratios among Austrian banks highlights the solid capitalization of small and locally active banks compared to larger banks. At the end of 2013, the median tier 1 capital ratio of all Austrian banks stood at 14.9%, 3.4 percentage points above the aggregate mean (chart 23). The higher median ratio essentially reflects the large number of locally active banks
with aboveaverage capitalization: Half of all Austrian banks around the median (i.e. the second and third quartiles) post tier 1 capital ratios between 11.4% and 19.7%. But the chart also shows that the total range of ratios has increased over time, indicating a growing heterogeneity among those small banks.
The allocation of bank capital within the Austrian banking system mirrors banks’ sustained commitment to foreign business. Roughly 40% of Austrian credit institutions’ consolidated tier 1 capital was located abroad in 2013, mainly at CESEE subsidiaries. At large banks, this share was even higher. At the end of 2013, Austrian subsidiaries had an aggregate tier 1 ratio of 15.5%, well above their individual group ratios. The higher capitalization is also due to the fact that higher minimum requirements apply to these banks; Austrian subsidiaries also surpass these higher requirements. Recent developments in the field of macroprudential supervision in Europe suggest that a lot of countries are going to use macroprudential supervision to increase the capitalization of their banks.
Nearly 40% of capital is allocated abroad
%
21
19
17
15
13
11
9
7
Change in Aggregate Tier 1Capital Ratio of Austrian Banks
Chart 23
Source: OeNB.
2nd quartile 3rd quartileMean Median
2009 2010 2011 2012 2013
Box 3
Overview of Macroprudential Measures in the EU
The new European banking legislation1 (Capital Requirements Regulation and Capital Require-ments Directive – CRR/CRD) has established a legal framework for macroprudential super-vision. Based on this new framework, since the beginning of 2014 a number of supervisory authorities in EU Member States have notified the European Systemic Risk Board (ESRB) of macroprudential policy measures to address specific risks to financial stability in their jurisdictions or have announced their intention to do so in the near future.
Belgium: The Belgian central bank (NBB) notified the ESRB and the European Banking Authority (EBA) of a measure based on Article 458 CRR to increase risk weights for retail exposures secured by Belgian residential immovable property by a linear add-on of 5 percentage points for all banks using an internal ratings-based approach for this type of credit risk. The macroprudential measure is intended to increase the resilience of the banking system against potential adverse developments in parts of the Belgian real estate market and is scheduled to apply as of July 1, 2014. This measure is subject to a “European safeguard procedure” involving
1 Regulation (EU) No. 575/2013 on prudential requirements for credit institutions and investment f irms of 26 June 2013 (CRR) and Directive No. 2013/36/EU on access to the activity of credit institutions and the prudential supervision of credit institutions and investment f irms of 26 June 2013 (CRD).

Austrian Financial Intermediaries: Regaining Profitability to Increase Resilience of Crucial Importance
44 OESTERREICHISCHE NATIONALBANK
Low Interest Rate Environment Remains Main Risk to Austrian Insurance SectorBetter market conditions in 2013 led to a stable investment performance of Austrian mutual funds, pension funds and insurance undertakings, but there are still uncertainties regarding a potential resurgence of the sovereign debt crisis or an increase in risk appetite given the intensified search for yield in a prolonged period of low interest rates.
Generating adequate investment earnings remains the main challenge for the Austrian insurance sector. Given that only new premiums and expired investments are reinvested at current market interest rates, the effects of the low interest rate environment materialize rather slowly. Still, insurers need to adjust to this challenging environment and reconsider their investment strategies. From a macroprudential perspective, it is crucial to monitor investment portfolios of insur
ance undertakings to detect a potential shift to riskier assets early.
The asset allocation of Austrian insurers has already changed noticeably over the past five years: Whereas in 2009, almost 50% of all assets were invested in bank securities, the share came down to 38% in 2013. The strongest growth in this time period was recorded for securities of nonfinancial corporations. Although the importance of investments in banks decreased, insurers’ exposure to the financial sector is still substantial (60% of total securities holdings). Therefore, the contagion risks between Austrian financial intermediaries also remain high. Although direct lending by insurance undertakings is permitted, the exposure through loans to corporates remained at a low level.
The profitability (measured as the return on investment) of Austrian life insurance undertakings in 2013 was well above the guaranteed interest rate
Profitability is the main challenge
for insurance undertakings
assessments and opinions by the EBA and the ESRB and the option for the European Commission to propose to the EU Council an implementing act rejecting the measure.
Croatia: The Croatian central bank (HNB) notified the ESRB and the EBA of the application of a systemic risk buffer of additional common equity tier (CET) 1 capital of 1.5% for all banks and of 3% for large banks in Croatia in accordance with Article 133 CRD. Based on Article 124 CRR, the HNB also sets stricter criteria for the application of the 35% risk weight to exposures secured by mortgages on residential property in the standardized approach regarding credit risk. These measures are to address structural systemic risks prevailing in the real economy and the financial sector in Croatia.
Netherlands: The Dutch central bank (DNB) notified the ESRB and the EBA of its decision to impose an additional CET 1 capital requirement of 3% on the three largest Dutch banks and of 1% on another bank that is also deemed systemically relevant. The measure is based on the CRD capital buffer framework regarding systemically important banks and long-term structural risks to financial stability. This policy complements macroprudential measures previously adopted by the DNB to address systemic risks emanating from the real estate sector.
Sweden: The Swedish Financial Supervisory Authority (FI) decided that the four largest banks must hold additional CET 1 capital of 3% in the form of a systemic risk buffer (Article 133 CRD) as of 2015 and a further 2% within the framework of pillar 2. In order to strengthen the resilience of the banking system, the FI also increased the risk weight floor for Swedish mortgages from 15% to 25%. Furthermore, FI has announced its intention to activate the counter-cyclical capital buffer, which is part of the CRD buffer framework. A decision about the level of this tool, which is designed to address the procyclical dimension of risks to financial stability, is expected to be made in fall 2014.
Austrian Financial Intermediaries: Regaining Profitability to Increase Resilience of Crucial Importance
FINANCIAL STABILITY REPORT 27 – JUNE 2014 45
on new business and also still above the guaranteed rate on the stock of 2.7%. Austrian and European supervisors already responded to the risk of a prolonged period of low interest rates: At the national level, the FMA introduced additional provisioning requirements, which will have to be built up over the next ten years, depending on the individual company’s (stock) guaranteed interest rate and a benchmark interest rate. At the European level, the European Insurance and Occupational Pensions Authority (EIOPA) will include scenarios of a prolonged period of low interest rates in its 2014 insurance stress test. The participation of Austrian insurance undertakings in this exercise is rather high: More companies than required by EIOPA are set to take part.
The amendment of the Austrian Insurance Contract Act, which is expected for mid2014, will mark the implementation of the first phase of Solvency II. It will define the systems of
governance and prescribe a forwardlooking assessment of undertakings’ own risk, the submission of additional information to the supervisor and the preapplication of internal models.
The net asset value of mutual funds reached EUR 150 billion in 2013 (+1.1% year on year), but was still below its precrisis level (EUR 170 billion in early 2007). The main challenge of mutual funds is to regain the confidence of (retail) investors; at the same time, the share of specialized funds (institutional investors) continued to grow, accounting for about 44% of total net asset value at end2013. The overall investment performance of funds was moderate in 2013 (2.7% return on investment) and heterogeneous across asset classes: While the performance of equity funds was the main positive driver (accounting for more than 10%), bond funds only yielded 0.2%.
The fund industry is preparing for the implementation of the Alternative
Fund industry only slowly regains confidence of retail investors
%
100
80
60
40
20
0
Securities Held by Austrian InsuranceUndertakings
Chart 24
Source: OeNB.
Note: Figures in EUR billion.
Banks:
32.7 Banks:
30.6
Other financial
corporations:
13.9
Other financial
corporations:
19.3
Sovereign:
15.0
Sovereign:
19.7
Nonfinancialcorporations: 6
Nonfinancialcorporations:
11
2009 2013
%8
7
6
5
4
3
2
1
0
Return on Investment and MinimumGuaranteed Interest Ratefor New Contracts
Chart 25
Source: FMA, OeNB.
Return on 10-year Austrian government bondsMinimum guaranteed interest on Austrian life insurancecontracts (new contracts)Return on interest of Austrian life insurance companies(annual data)
1997 1999 2001 2003 2005 2007 2009 2011 2013

Austrian Financial Intermediaries: Regaining Profitability to Increase Resilience of Crucial Importance
46 OESTERREICHISCHE NATIONALBANK
Investment Fund Managers (AIFM) Directive, which puts institutional funds, hedge funds, real estate funds and private equity funds for the first time under a common European regulatory framework. Most of the licensing and registrations of AIFMs in Austria was completed in the first half of 2014.
Since their establishment in 2006, Austrian severance funds have built up funds by an average 20% p.a. At the end of 2013, the sum of accrued severance benefits came to EUR 6.2 billion, and asset volumes will continue to grow for the next five to ten years. After that, outflows due to claims will gain in importance relative to inflows and volume growth will be restricted, requiring adequate liquidity management. Severance funds’ historical returns on assets were rather heterogeneous both within the sector and over time (chart 26).
The Market’s View – Geopolitical Risks Related to Ukraine Contrast Generally Benign Financial Market Developments
International financial market conditions have remained generally positive. Austrian listed banks performed very
well into the first months of 2014, and Raiffeisen Bank International has taken the opportunity to issue new equity to increase capitalization. However, increased tensions in Ukraine, economic risks in Russia and potential spillover effects have had a negative impact on Austrian banks’ equity prices thereafter. In this environment, the lagging performance of Austrian bank equities in 2014 so far (compared to that of other European banks) can also be attributed to a renewed interest in bank equities from weaker euro area countries; more generally, the subdued profitability outlook for Austrian banks as a result of the weak business environment, elevated credit risk costs, adverse economic policy decisions and (in some cases) expectations that highly profitable markets such as Russia are prone to a turn in their benign credit cycle may also have played a role.
Research analysts and credit rating agencies point to the improvements in Austrian banks’ capitalization since 2007. However, they also note that internationally active Austrian banks still have belowaverage capitalization levels and consider it as one of their key weaknesses. Further, the prevailing low interest rate margins are considered as a factor leaving little room for maneuver. Developments in Ukraine, Russia and Turkey are increasingly seen as challenges for Austrian banks.11 On a positive note, Austrian banks’ generally sound business model (retail banking) and their solid liquidity position are seen as strengths. As a consequence of the recent adoption of the EU Bank Recovery and Resolution Directive (BRRD), rating agencies are about to review government support for banks, which may, in turn, lead to lower
Liquidity management crucial for severance funds
%
1.5
1.0
0.5
0.0
–0.5
–1.0
–1.5
Return on Assets of AustrianSeverance Funds
Chart 26
Source: OeNB.
11 See also Wittenberger et al. 2014. Macrofinancial Developments in Ukraine, Russia and Turkey from an Austrian Financial Stability Perspective, in this issue.

Austrian Financial Intermediaries: Regaining Profitability to Increase Resilience of Crucial Importance
FINANCIAL STABILITY REPORT 27 – JUNE 2014 47
ratings, in particular for Austrian banks, which benefit from an average uplift by 3 to 4 notches due to the implicit assumption of government support.
OeNB Assessment and Recommendations
The reverberations of the recent financial, economic and sovereign debt crisis, including loan quality issues and the low interest rate environment, are still challenging the earnings potential of the Austrian financial sector. While the OeNB acknowledges the Austrian financial sector’s progress toward improving financial stability at home and in host markets, it recommends further strengthening the sustainability of business models by taking the following actions:• Banks should continue strengthening
their capital levels – by retaining earnings and/or tapping capital markets – to close the capitalization gap between them and their inter national peers.
• Given persistent pressure on profitability, banks should strive to address
structural issues and improve their cost efficiency.
• Riskadequate provisioning and coverage policies should be further pursued to deal with loan quality issues.
• Banks should continue fulfilling supervisory minimum standards relating to foreign currency loans and loans with repayment vehicles.
• Banks should strive for sustainable loantolocal stable funding ratios at the subsidiary level and for risk adequate pricing of liquidity transfers.
• Banks should prepare for increased market pressure for disclosure of LCR data; both investor communications and liquidity risk management, especially at smaller banks, need to be adapted.
• Banks and insurance undertakings should ensure high standards of risk management so that risks are properly addressed and effectively controlled; they should also proactively prepare for contingency situations.
• Insurance undertakings should proactively prepare for Solvency II.


Special Topics

50 OESTERREICHISCHE NATIONALBANK
1
Popular perception holds that bank deleveraging implies a reduction of loans to the real economy (households and nonfinancial corporations).2 Many commentators fear that deleveraging would restrict economic growth in the euro area, Austria and CESEE: The paralysis of the euro area unsecured
interbank market and higher capital and liquidity requirements have caused a reduction of outstanding loans to small and mediumsized enterprises (SMEs) (e.g. Infelise, 2014), which is believed to hamper economic growth. While larger corporations can directly access capital markets as alternative financing
The Priorities of Deleveraging in the Euro Area and Austria and Its Implications for CESEE
Bank deleveraging is often used synonymously for a reduction in the supply of credit to the real economy, which hampers economic growth. In this paper, we investigate this hypothesis empirically. We define deleveraging as the increasing ratio of capital to total assets and aim at identifying the priorities of recent deleveraging in the euro area and Austria and its implications for Central, Eastern and Southeastern Europe (CESEE). The data analysis utilizes ECB balance sheet data for monetary financial institutions (MFIs) for the euro area and Austria; reporting data of Austrian banks at the consolidated level and BIS locational statistics are employed to study the impact of deleveraging on credit to the real economy in CESEE. We focus on the crisis and postcrisis period from October 2008 to February 2014 (latest available data). In addition, we study developments in the precrisis period from June 2003 to October 2008.
The data reveal that banks in the euro area and Austria did in fact deleverage. In the crisis and postcrisis period, the priorities of deleveraging are similar in the euro area and in Austria. The process was predominantly driven by the numerator (capital), which contributed 88% to deleveraging in the euro area and 73% in Austria.
The denominator of leverage (total assets) contributed the remaining shares. In both samples, the decrease in total assets was driven by reductions in interbank lending and external assets. Funding for the real economy increased in the euro area and in Austria.
As external asset reductions play a major role in deleveraging in both the euro area and Austria, we analyze the relevant developments in CESEE in detail. The priorities of Austrian banks’ deleveraging in CESEE are similar to those of banks in the euro area and Austria: They were driven by capital increases (99%). The small reduction of total assets in the sample was due to reductions of interbank lending, cash and central bank reserves; funding for households and nonfinancial corporations slightly increased. In line with developments in the euro area and in Austria, banks’ sovereign exposure in CESEE increased, too. However, at the disaggregate level, Austrian banks reduced their activities in some countries during the past five years. But these reductions did not translate into decreasing funding for households and nonfinancial corporations in these countries.
We conclude that from a macroprudential perspective, euro area and Austrian banks as well as their subsidiaries in CESEE have set the right priorities in deleveraging since October 2008.
JEL classification: G21, F36Keywords: Deleveraging, excessive deleveraging, balance sheet growth, economic growth
Judith Eidenberger, Stefan W. Schmitz, Katharina Steiner1
1 Oesterreichische Nationalbank, Financial Stability and Macroprudential Supervision Division, [email protected], [email protected] (corresponding author) and [email protected].
The authors would like to thank Andreas Greiner and Tina Wittenberger for valuable comments and data support.2 See, inter alia, IMF (2010, pp. 18), Cohen-Setton and Vallée (2011) and Cœuré (2013).
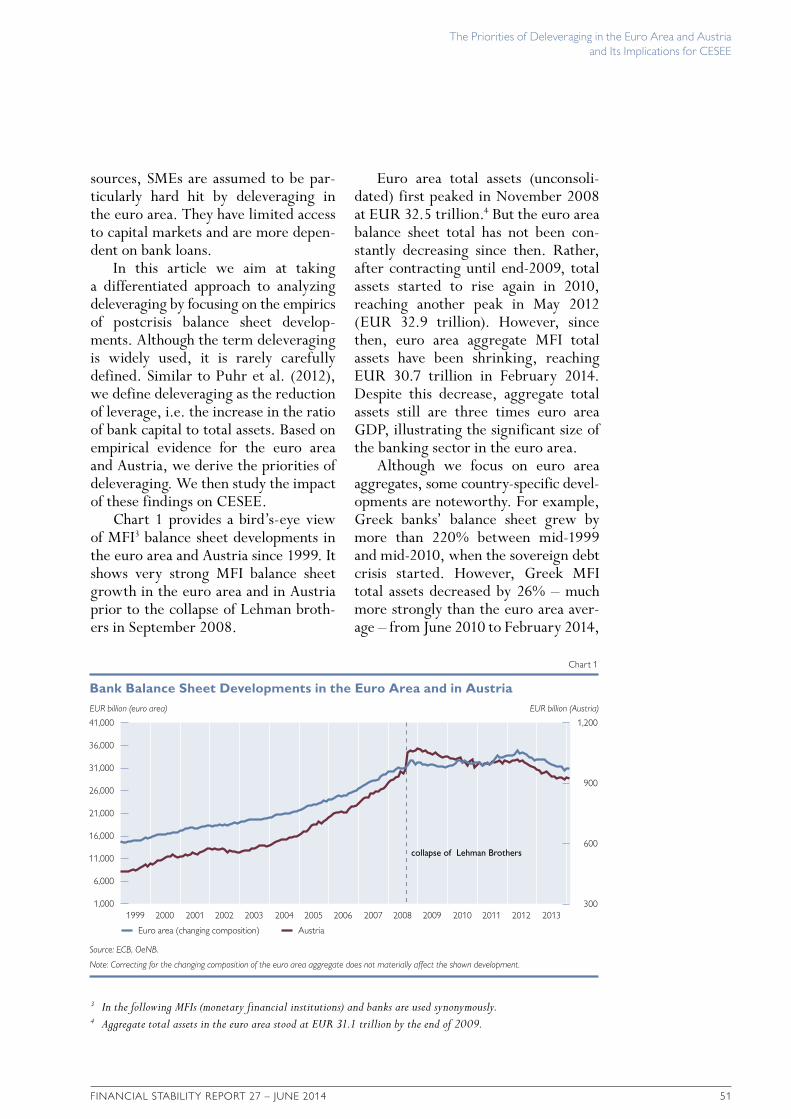
The Priorities of Deleveraging in the Euro Area and Austria and Its Implications for CESEE
FINANCIAL STABILITY REPORT 27 – JUNE 2014 51
sources, SMEs are assumed to be particularly hard hit by deleveraging in the euro area. They have limited access to capital markets and are more dependent on bank loans.
In this article we aim at taking a differentiated approach to analyzing deleveraging by focusing on the empirics of postcrisis balance sheet developments. Although the term deleveraging is widely used, it is rarely carefully defined. Similar to Puhr et al. (2012), we define deleveraging as the reduction of leverage, i.e. the increase in the ratio of bank capital to total assets. Based on empirical evidence for the euro area and Austria, we derive the priorities of deleveraging. We then study the impact of these findings on CESEE.
Chart 1 provides a bird’seye view of MFI3 balance sheet developments in the euro area and Austria since 1999. It shows very strong MFI balance sheet growth in the euro area and in Austria prior to the collapse of Lehman brothers in September 2008.
Euro area total assets (unconsolidated) first peaked in November 2008 at EUR 32.5 trillion.4 But the euro area balance sheet total has not been constantly decreasing since then. Rather, after contracting until end2009, total assets started to rise again in 2010, reaching another peak in May 2012 (EUR 32.9 trillion). However, since then, euro area aggregate MFI total assets have been shrinking, reaching EUR 30.7 trillion in February 2014. Despite this decrease, aggregate total assets still are three times euro area GDP, illustrating the significant size of the banking sector in the euro area.
Although we focus on euro area aggregates, some countryspecific developments are noteworthy. For example, Greek banks’ balance sheet grew by more than 220% between mid1999 and mid2010, when the sovereign debt crisis started. However, Greek MFI total assets decreased by 26% – much more strongly than the euro area average – from June 2010 to February 2014,
3 In the following MFIs (monetary financial institutions) and banks are used synonymously.4 Aggregate total assets in the euro area stood at EUR 31.1 trillion by the end of 2009.
EUR billion (euro area) EUR billion (Austria)
41,000
36,000
31,000
26,000
21,000
16,000
11,000
6,000
1,000
1,200
900
600
3001999 2000 2001 2002 2003 2004 2005 2006 2007 2008 2009 2010 2011 2012 2013
Bank Balance Sheet Developments in the Euro Area and in Austria
Chart 1
Source: ECB, OeNB.
Note: Correcting for the changing composition of the euro area aggregate does not materially affect the shown development.
Euro area (changing composition) Austria
collapse of Lehman Brothers

The Priorities of Deleveraging in the Euro Area and Austria and Its Implications for CESEE
52 OESTERREICHISCHE NATIONALBANK
when it stood at the level of March 2008. Banks’ balance sheet size in Spain almost tripled between 1999 and early 2012, when it reached its peak. During the last two years, total assets fell by around 16% in Spain to the level of April 2008. Even in these two countries, the reductions of total assets are small compared to their excessive precrisis growth.
The Austrian balance sheet total (unconsolidated5) reached its highest level in January 2009 (EUR 1.1 trillion). Since then, a downward trend has been observed; at the end of February 2014, total assets stood at EUR 922.4 billion (–14%).
Chart 2 provides an overview of the leveraging and deleveraging process that accompanied changes in (unconsolidated) total assets6 in the euro area and in Austria.
In the precrisis period, the leverage ratio (capital in percent of total assets) of euro area banks remained quite stable. After an increase from 5.2% in January 1999 to 5.9% in August 2002, it decreased again to 5.3% immediately
after the Lehmann collapse (chart 2). In the postcrisis period, the leverage ratio rose quite steadily to 8%.
The leverage ratio of Austrian banks started from a slightly lower level – 4.9% – in January 1999 and had caught up to the euro area level by July 2003. It then increased to almost 7.4% in June 2005 and subsequently reached a trough in November 2008 at 6.8%. In the postcrisis period, it has steadily increased to 10.8%.
What has driven the deleveraging process? In both the euro area and in Austria, the numerator (capital) has contributed the lion’s share to the process. In the euro area, 88% of deleveraging has been due to capital increases, in Austria the comparable share is 73%.
Although the reduction of total assets has played a relatively minor role in deleveraging, we investigate its main drivers. The paper is structured along the following lines: In section 1 we analyze the numerator of the leverage for euro area MFIs in more detail; in section 2 we conduct the same exercise
5 MFI data are collected on an unconsolidated basis. To capture relevant developments in CESEE we will analyze a different data source in section 2.2.
6 MFI data do not contain off-balance sheet items; but they do contain data on on-balance sheet derivatives.
Capital in % of total assets
12
10
8
6
4
2
01999
MFI Leverage Ratios in the Euro Area and in Austria
Chart 2
Source: ECB.
Euro area (changing composition) Austria
collapse of Lehman Brothers
2000 2001 2002 2003 2004 2005 2006 2007 2008 2009 2010 2011 2012 2013

The Priorities of Deleveraging in the Euro Area and Austria and Its Implications for CESEE
FINANCIAL STABILITY REPORT 27 – JUNE 2014 53
for Austrian data. Based thereon, we investigate the implications of our findings for (de)leveraging in CESEE. Section 3 provides an assessment of our findings from the perspective of macroprudential supervision. Section 4 concludes.
1 Deleveraging in the Euro Area
Chart 3 illustrates the pre and postcrisis path of different asset and liability categories based on aggregate balance sheet data of euro area MFIs.
Between June 2003 and October 2008,7 both capital and total assets expanded strongly (chart 3, upper panel). The former grew by 55% (from EUR 1.1 trillion to EUR 1.7 trillion), the latter by 67% (from EUR 19.5 trillion to EUR 32.5 trillion). About onethird of total asset growth was due to an increase in loans to nonMFI corporates and households (30%). Interbank loans and external assets each represent around 20% of this balance sheet growth. An increase in all asset categories, except for government securities, is observed for this period of around five years. The developments on the liability side are similar (chart 3, lower panel). Deposits of nonMFI corporates and households represent the largest share of the liability increase, followed by interbank deposits and external liabilities.
Between October 2008 and February 2014, the size of euro area aggregate bank balance sheets shrank by 6% to EUR 30.7 trillion; nevertheless, the volume of aggregate total assets is still higher than at the beginning of 2008. We focus on the relative contributions of various asset classes to the net reduction of total assets (chart 3, upper panel). As some asset classes have been expanding since the onset of the crisis, while others have been shrinking, the gross contributions add up to –100%:• The reduction of interbank loans con
tributed –75% (–EUR 1.3 trillion) to the change in total assets.8
• External assets9 accounted for the second highest contribution (–71%, –EUR 1.3 trillion).
• Shares and other equities as well as money market mutual fund shares contributed another –3.8% (–EUR 67 billion).
• These negative contributions were partly offset by increased funding for governments (+38%, +EUR 692 billion)10 and remaining assets11 (+35%, +EUR 635 billion).
• Also, the contribution of credit exposures to the real economy (bonds of nonMFI corporates +3.5% (+EUR 63 billion) and loans to households and nonMFI corporates +1.2% (+EUR 22 billion)12 was positive at 4.7%.
7 October 2008 was selected as the reference point because it provides a snapshot of the situation around the Lehman bankruptcy in September 2008, when aggregate balance sheets were still growing. To have the same post- and precrisis period length of 5 years and 4 months, June 2003 was chosen as the starting point for the comparison.
8 As interbank transactions mainly take place within the euro area, the change in interbank assets is similar to the change in interbank liabilities in absolut terms.
9 External assets are holdings of cash in currencies other than euro, holdings of securities issued by nonresidents of the euro area, loans to nonresidents of the euro area (including banks), and gold and receivables from the IMF (including special drawing rights (SDRs)). They represent claims on nonresidents of the euro area (ECB Manual of MFI balance sheet statistics).
10 Funding for governments consists of holdings of government securities (+32%, +EUR 581 billion) and loans to general government (+6%, +EUR 111 billion).
11 Remaining assets consist of, inter alia, derivatives with a positive gross market value, interim account receivables and other assets not accounted for in the other eleven asset categories.
12 In public discourse, funding for the real economy does not include funding for governments. For consistency reasons we stick to this convention, although funding for governments includes funding of real activities like government services, public investments, and transfers which increase private consumption.

The Priorities of Deleveraging in the Euro Area and Austria and Its Implications for CESEE
54 OESTERREICHISCHE NATIONALBANK
% of total balance sheet increase/decrease
% of total balance sheet increase/decrease
Remaining assets
Securities – general government
Loans – general government
Securities – non-MFIs
Loans – households, nonfinancial corporations and non-MFIs
Fixed assets
Shares and other equities
Money market fund shares
Write-offs, reclassifications, exchange rate adjustments1
Securities – MFIs
External assets
Interbank loans
Deposit liabilites – non-MFIs
Capital and reserves
Remaining liabilities
Deposit liabilities – general government
Money market fund shares
Debt securities issued
Interbank deposit liabilities
External liabilities
Euro Area Banks: Contribution of Asset and Liability Categories to Changes in the Balance Sheet before and after October 2008
Chart 3
Source: ECB and authors’ calculations.
1 Adjustments of loans to non-MFIs.
Note: For example, interbank loans accounted for about 19% of total balance sheet growth in the precrisis period (June 2003 to October 2008). From October 2008 to February 2014, around 75% of the balance sheet decline were caused by reduced interbank lending. The contributions of asset categories to the change of the total balance sheet shown in the chart add up to 100%.
June 2003 to Oct. 2008 (total balance sheet increase) Oct. 2008 to Feb. 2014 (total balance sheet decrease)
–74.9
–71.4
–15.1
–13.7
–2.4
–1.4
0.2
1.2
3.5
6.2
32.3
35.3
18.8
20.5
5.4
–0.3
0.2
3.1
0.4
29.8
6.5
1.5
–0.4
14.0
–100
–100 –80 –60 –40 –20 0 20 40 60 80 100
–80 –60 –40 –20 0 20 40 60
–91.3
–91.0
–28.5
–19.2
0.1
14.3
38.1
77.5
17.3
22.4
13.6
1.4
0.2
13.8
4.8
26.5

The Priorities of Deleveraging in the Euro Area and Austria and Its Implications for CESEE
FINANCIAL STABILITY REPORT 27 – JUNE 2014 55
Chart 3 (lower panel) also provides details regarding the contribution of various liability classes to the reduction of total assets. The data reveal the following contributions from October 2008 to February 2014 (as some liability classes have been expanding since the onset of the crisis, while others have been shrinking, the gross contributions add up to –100%):• The largest contribution to the reduc
tion of total liabilities stemmed from external liabilities (–91%, –EUR 1.6 trillion).
• Interbank liabilities made a similar contribution (–91%).
• Debt securities issued and money market mutual funds added another –29% (–EUR 513 billion) and –19% (–EUR 345 billion), respectively.
• Deposit liabilities to general governments made a neutral contribution (±0%).
• The strong reduction of external and interbank liabilities was partly counterbalanced by increases in remaining liabilities (+14%, +EUR 257 billion).
• Deposit liabilities of nonMFIs and capital added +78% (+EUR 1.4 trillion) and 38% (+EUR 684 billion), respectively.
The data show that capital increases rank highest in the priorities of deleveraging, followed by the reduction of interbank and external assets. Contrary to popular opinion, bank funding for the real economy has actually increased after the crisis, despite substantial recapitalizations. To find out how this deviation from popular perception can be explained, we first correct loan data for writeoffs, reclassifications and exchange rate adjustments, which cause substantial deviations of changes in loan stocks from loan flows in the data set and are often not adjusted for. Second, we focus on bank funding to the real economy rather than loans; in this way,
we can capture banks’ role in large nonfinancial corporations’ increasing reliance on market funding. Overall, we find that since the outbreak of the crisis (1) funding for governments by euro area banks has increased strongly and (2) funding for the real economy has risen somewhat. Given the overall reduction of total assets, this implies that euro area banks’ asset mix has shifted toward funding for governments and the real economy at the expense of external assets and interbank assets. Total funding for the real economy (bank loans plus nonfinancial corporations’ bond holdings) has increased by about 5% of the October 2008 stock.
The funding mix of euro area banks has also undergone substantial changes since October 2008; deposit liabilities and capital have increased at the expense of external and interbank liabilities. Two additional observations are noteworthy: First, external liabilities are mainly denominated in U.S. dollars. Euro area banks witnessed a wholesale run on their U.S. dollar liabilities, which was particularly disruptive in the early phase of the crisis (as evidenced by high demand for U.S. dollar funding from the Eurosystem via the U.S. dollar swap facility) and in the second half of 2011 (as evidenced by the data on the largest U.S. money market fund exposures). These funding shocks led to the reduction of external U.S. dollar assets. Second, euro area banks’ substantial reduction of debt issued suggests that, in aggregate, euro area banks are not funding constrained.
2 Deleveraging in Austria
At Austrian banks, the contribution of the reduction of total assets to deleveraging (27%) has been higher than at their euro area peers (12%). In addition, Austrian banks have been key players in CESEE for more than 20 years, with

The Priorities of Deleveraging in the Euro Area and Austria and Its Implications for CESEE
56 OESTERREICHISCHE NATIONALBANK
almost 70% of their total international exposure being located in the region.13 Hence, they have often been in the midst of the European deleveraging debate. The European Banking Coordination (“Vienna”) Initiative was founded because there were fears that foreign banks in CESEE in general, and Austrian banks in particular, would reduce their financing of the real economy in the region. In the following sections we study the priorities of deleveraging for Austrian banks (2.1.) and their impact on loans to the real economy in CESEE (2.2.).
2.1 Austria: Small Balance Sheet Decline Relative to Precrisis Growth
The structure of the aggregate balance sheet of Austrian banks at the unconsolidated level largely resembles the one of euro area banks, although lending to the nonfinancial private sector in Austria is substantially higher, accounting for onethird of total assets.14 Interbank loans are the second largest asset category, accounting for 20% of total assets, followed by external assets with a share of 17% in total assets in February 2014.
In the precrisis period, these asset categories were the main drivers of Austrian banks’ balance sheet growth, which increased by 85% from mid2003 to its peak at the beginning of the financial crisis in October 2008. In particular, interbank lending was a major driver, accounting for onethird of precrisis balance sheet growth, followed by external assets (26%) and loans to households and nonfinancial corporations (22%), as shown in chart 4 (upper panel). Government securities and loans as well as money market
fund shares and fixed assets hardly contributed to the increase in total assets to about EUR 1 trillion in October 2008.
In the postcrisis period, the aggregate balance sheet dropped to EUR 922 billion (about –8%) until February 2014, which corresponds to the precrisis level of the first quarter of 2008.
Which asset categories contributed to the decline of total assets? To find out, we focus again on the relative contributions of various asset classes to the net reduction of total assets (chart 4, upper panel). As some asset classes have been expanding since the onset of the crisis, while others have been shrinking, the gross contributions add up to –100%:• The reduction of interbank loans
contributed –68% (–EUR 94 billion) to the reduction of total assets.
• External assets accounted for the second highest contribution (–45%, –EUR 63 billion).
• Securities of MFIs added –15% (–EUR 21 billion) and remaining assets –3% (–EUR 4.5 billion).
• These negative contributions were partly offset by funding for governments (+14%, +EUR 19 billion) and shares and other equity (+4%, +EUR 6 billion).
• Also, the contribution of credit exposure to the real economy, which includes bonds of nonMFIs (–0.9%, –EUR 1.2 billion) and loans to households as well as loans to the real economy (+10%, +EUR 20 billion), was positive at 9.1%.
The relative contributions of various liability categories to the reduction of total liabilities are also depicted in chart 4 (lower panel):
13 In absolute terms, the exposure of Austrian banks to CESEE amounted to about EUR 202 billion at end-2013.14 When not only loans to non-MFIs but also loans to the general government as well as securities of non-MFIs and
the general government are taken into account, the share rises to 42% of total assets.

The Priorities of Deleveraging in the Euro Area and Austria and Its Implications for CESEE
FINANCIAL STABILITY REPORT 27 – JUNE 2014 57
% of total balance sheet increase/decrease
% of total balance sheet increase/decrease
Loans – households, nonfinancial corporations and non-MFIs
Securities – general government
Shares and other equities
Loans – general government
Money market fund shares
Fixed assets
Securities – non-MFIs
Write-offs, reclassifications, exchange rate adjustments1
Remaining assets
Securities – MFIs
External assets
Interbank loans
Deposit liabilites – non-MFIs
Capital and reserves
Money market fund shares
Remaining liabilities
Deposit liabilities – general government
External liabilities
Debt securities issued
Interbank deposit liabilities
Austrian Banks: Contribution of Asset and Liability Categories to Changes in the Balance Sheet before and after October 2008
Chart 4
Source: ECB, OeNB and authors’ calculations.
1 Adjustment to loans non-MFIs.
Note: For example, interbank loans accounted for one-third of total balance sheet growth in the precrisis period (June 2003 to October 2008). After October 2008, two-thirds of the balance sheet decline were caused by declining interbank lending. The contributions of asset categories to the change of the total balance sheet shown in the chart add up to 100%.
June 2003 to Oct. 2008 (total balance sheet increase) Oct. 2008 to Feb. 2014 (total balance sheet decrease)
–100 –80 –60 –40 –20 0 20 40 60
–80 –60 –40 –20 0 20
–67.6
–45.0
–14.9
–3.3
4.2
–0.9
–0.8
–0.1
0.8
4.5
13.1
10.0
33.2
26.3
7.2
5.8
4.1
1.7
0.0
0.0
–0.3
4.1
0.0
17.9
40
–86.6
–33.2
–19.4
–3.4
–2.9
0.2
18.6
26.7
36.1
21.8
7.3
1.3
5.8
0.0
8.4
19.3

The Priorities of Deleveraging in the Euro Area and Austria and Its Implications for CESEE
58 OESTERREICHISCHE NATIONALBANK
• The largest contribution to the reduction of total liabilities stemmed from interbank deposits (–87%, –EUR 121 billion).
• Debt securities issued constituted the second largest contribution (–33%, –EUR 46 billion).
• External liabilities accounted for –19% (–EUR 27 billion), general government deposits accounted for –3.4% (–EUR 5 billion) and remaining liabilities for –3% (–EUR 4 billion).
• Money market mutual funds remained neutral (±0 %).
• Deposit liabilities of nonMFIs and capital added +27% (+EUR 37 billion) and +19% (+EUR 26 billion), respectively.
The priorities of deleveraging in Austria are very similar to those in the euro area: Capital increases rank highest, followed by decreases in interbank loans and external assets. Banks’ exposure shifted toward funding for governments and the real economy, which actually increased. The latter (bank loans plus holdings of nonfinancial corporations’ bonds) has increased by 9.1% since October 2008.
2.2 CESEE: Shift in the Funding Structure Supports Sustainable Lending
At the beginning of the financial and economic crisis in 2008, concerns about widespread deleveraging in the CESEE region15 emerged. There were fears that
Austrian banks’ exposure to CESEE would feature prominently in the priorities of deleveraging. In section 2.1 we find that external assets have indeed contributed substantially to the reduction of total assets. In line with developments in the euro area and in Austria, Austrian banks’ subsidiaries operating in CESEE increased their leverage ratio at the aggregated subconsolidated level from 9.5% at the end of 2008 to 12.4% at end2013.16 Two questions arise: (1) Have Austrian banks reduced funding for their CESEE subsidiaries? (2) What are the priorities of deleveraging of Austrian banks’ subsidiaries in CESEE?
To answer these questions, we first investigate Austrian parent banks’ exposure visàvis their CESEE subsidiaries based on the locational statistics provided by the BIS.17 These data point to a decline of aggregate crossborder capital flows from Austrian banks18 to CESEE by about 25% from end2008 to end2013. On the one hand, this was due to the supervisory measures to limit the risk arising from foreign currency loans.19 The foreign currency loan business model had been based on parent banks’ market access to foreign currency funding (predominantly in euro, Swiss francs and U.S. dollars). The Austrian parent would channel the funds to CESEE subsidiaries to refinance local foreign currency loans, which at the end of 2008 amounted to more than
15 FMA (2010).16 Source: Reporting data of Austrian banks. The data are adjusted for the sale of UniCredit Bank Austria’s operations
in Kazakhstan and Erste Bank’s subsidiary in Ukraine as well as the purchase of Polbank by Raiffeisen Bank International in April 2012 (equal to total assets of EUR 6 billion). The change in ownership from ÖVAG to Sberbank is included in the data as Sberbank continues to report the subsidiaries’data because the CESEE head-quarters is located in Austria.
17 We subsume 28 countries under the acronym CESEE, including the country groups CIS, Southeastern Europe and the Central and Eastern European countries that joined the EU in 2004 and 2007, respectively.
18 The locational BIS statistics measure aggregate international claims and liabilities vis-à-vis nonresidents of banks’ offices located in Austria at the unconsolidated level.
19 See, inter alia, FMA (2010) and ESRB (2011).

The Priorities of Deleveraging in the Euro Area and Austria and Its Implications for CESEE
FINANCIAL STABILITY REPORT 27 – JUNE 2014 59
51% of the stock of total lending to the private sector in CESEE. In the course of the crisis, many CESEE currencies depreciated and foreign currency loan obligations and debt servicing costs increased. In addition, supervisory authorities in Austria and CESEE introduced measures to restrict further foreign currency lending. From end2008 to end2013, foreign currency loans in CESEE declined by about 16% (adjusted for foreign currency effects) to about EUR 74 billion.20 As a consequence, crossborder liquidity provision by Austrian parent banks required to fund these loans dropped as well. Liquidity transfers from Austrian parent banks to CESEE subsidiaries declined by EUR 12 billion (34%) from end2008 to end2013 according to the Austrian central credit register. At the same time, the
funding structure of Austrian banks’ CESEE subsidiaries shifted toward local funding. Chart 5 shows that deposits of nonbanks at Austrian subsidiaries in CESEE increased by about 16% from end2008 to end2013. This rebalancing constituted an explicit objective of the Austrian “sustainability package”21 aimed at improving the funding mix of “exposed” subsidiaries (with loantolocal stable funding ratios (LLSFR) of more than 110%) and at increasing their capital buffers.22 Chart 5 also displays the decline of the loantodeposit ratio (LDR) of Austrian banks in CESEE from the beginning of 2009 to end2013 in line with the policy objective. On the other hand, the reduction of crossborder liquidity transfers to CESEE subsidiaries also reflects a reduction of current account
20 The reported figure is based on the additional data request, a biannual survey among Austrian banks on their operations in CESEE.
21 The Austrian “sustainability package” is a set of measures implemented by the OeNB and the FMA. For details, see FMA and OeNB (2012).
22 The latest available results of the sustainability monitoring are described in the Reports section of this Financial Stability Report.
EUR billion %
180
170
160
150
140
130
120
110
100
120
115
110
105
100
952008
Loans, Deposits and Loan-to-Deposit Ratio of Austrian Banks’ Subsidiaries in CESEE
Chart 5
Source: OeNB.
Note: The data shown in this chart include all Austrian banks’ subsidiaries.
Deposits of nonbanks Loans to nonbanks (after provisioning) Loan-to-deposit ratio (LDR, right-hand scale)
2009 2010 2011 2012 2013

The Priorities of Deleveraging in the Euro Area and Austria and Its Implications for CESEE
60 OESTERREICHISCHE NATIONALBANK
deficits of CESEE countries23 in the course of the crisis. Before the crisis, these current account deficits had been funded to a large extent via shortterm interbank funding. In the postcrisis period, they declined substantially – by about EUR 8 billion – from end2008 to –0.6 billion at end2013.
Second, we study changes in the composition of the balance sheets of Austrian banks’ subsidiaries. Again, we focus on lending to the real economy. In a first step, we observe that the leverage ratio (capital to total assets) increased from 9.5% to 12.4% (end2008 to end2013). The increase has almost entirely been driven by the rise in capital, contributing 99% to the change in the ratio. Although the reduction of total assets has played a minor role, we investigate its main drivers.
Overall, the size of the aggregate balance sheet of Austrian banks’ subsidiaries in CESEE at the subconsolidated level has decreased by about 2.6% since October 2008. However, these figures also include asset disposals, which were substantial in the region.24 Accounting for these asset disposals allows to uncover organic changes and shows that the aggregate balance sheet at the subconsolidated level decreased by 0.3% (EUR 0.8 billion) from end2008
to end2013.25 The major categories in total assets are loans to the real economy (60% of total assets), followed by debt securities to nonfinancial corporations, nonMFIs and MFIs (18%) at end2013. Again, we focus on the relative contributions of the major asset classes to the net decrease in total assets. As some asset classes have been expanding since the onset of the crisis, while others have been shrinking, the gross contributions add up to –100%:26
• The reduction of interbank loans (–542% or –EUR 4.2 billion) and cash and cash reserves with central banks (–533%, –EUR 4.1 billion) contributed most to the reduction of total assets. Also, the contribution of the loan exposure to the real economy (households, nonfinancial corporations and nonMFIs) was negative (–432%, –EUR 3.3 billion). This decline was driven by financing for nonMFIs, which decreased by –14% (–EUR 4.2 billion). By contrast, loans to households and nonfinancial corporations increased slightly by 1% (+EUR 0.8 billion). Taking into account foreign currency effects, lending to households and nonfinancial corporations even increased by 5% from end2008 to end2013.27
23 The current account data are based on the following sample of CESEE countries where Austrian banks are active: CESEE EU Member States (Czech Republic, Slovakia, Slovenia, Croatia, Hungary, Poland, Bulgaria and Romania) as well as the following Southeastern European countries: Albania, Bosnia and Herzegovina, Montenegro, former Yugoslav Republic of Macedonia, Serbia and Kosovo.
24 These asset disposals include the sale of most of ÖVAG’s CESEE subsidiaries in 2011 (equal to total assets of about EUR 9.4 billion), the sale of UniCredit Bank Austria’s operations in Kazakhstan (total assets of about EUR 5 billion) at end-2012, and the sale of Erste Bank’s subsidiary in Ukraine (total assets of about EUR 600 million) in April 2013.
25 The data are adjusted for the sale of UniCredit Bank Austria’s operations in Kazakhstan and Erste Bank’s subsidiary in Ukraine as well as the purchase of Polbank by Raiffeisen Bank International in April 2012 (equal to total assets of EUR 6 billion). The change in ownership from ÖVAG to Sberbank is included in the data as Sberbank continues to report the subsidiaries’data because the CESEE headquarters is located in Austria.
26 The following list includes a selection of the most important asset categories in terms of their contribution to the change in the total balance sheet. As the change in the total balance sheet is relatively small, the contributions of the respective balance sheet positions are relatively big in terms of percentages.
27 The reported figure is based on the additional data request, a biannual survey among Austrian banks on their operations in CESEE and is adjusted as outlined in footnote 25.

The Priorities of Deleveraging in the Euro Area and Austria and Its Implications for CESEE
FINANCIAL STABILITY REPORT 27 – JUNE 2014 61
• These negative contributions were mostly offset by holdings of securities of nonfinancial corporations, nonMFIs and MFIs, which contributed most to the balance sheet increase (+2,000%, +EUR 15.4 billion).
• Also the sovereign exposure via loans to the central government and public debt instruments added +308% (+EUR 2.4 billion).
These priorities of deleveraging refute common claims of decreasing funding for the real economy: Lending to the real economy has remained broadly stable when adjusted for loan loss provisioning. The decline in loans to nonbanks shown in chart 5 has been mainly driven by loans to nonMFIs as well as the surge in loan loss provisioning (+190%) and foreign currency effects.
Yet, Austrian banks have reduced their total exposure (adjusted for foreign currency effects) to some countries – in particular, to Hungary (–31%), Ukraine (–32%) and Slovenia (–19%) – during the past five years. These strategic portfolio adjustments show that credit demand and economic conditions differ across CESEE and that Austrian banks have somewhat shifted their regional focus; but overall, their funding for households and nonfinancial corporations in CESEE has remained broadly stable.
3 Interpretation of Our Findings from a Macroprudential Perspective
The dominant role of capital increases in the priorities of deleveraging in the euro area, in Austria and at CESEE subsidiaries of Austrian banks is very welcome from a macroprudential perspective. Also, the composition of the relatively small contribution of the
reduction of total asset/liabilities can be considered positive.
The reduction of banks’ reliance on shortterm unsecured interbank funding for longterm illiquid assets in the euro area, in Austria and in CESEE is in line with macroprudential objectives.
First, it contributes to a reduction of interconnectivity and, consequently, a decrease in potential contagion and the propagation of shocks within the banking systems of the euro area, Austria and CESEE.
Second, before the crisis, excessive loan growth in some euro area and CESEE countries had been funded by shortterm unsecured interbank deposits. This had led to excessive maturity transformation. Macroprudential supervision aims at preventing both developments. The shift of the funding mix from interbank loans toward deposits contributes to financial stability.28
Third, the decline in interbank flows reflects macroeconomic rebalancing in the euro area and in CESEE. Countries that have experienced liquidity shocks after 2008 are those that had relied substantially on shortterm interbank funding of their significant current account deficits before 2008 (Constâncio, 2014). These countries have reduced their current account deficits. Consequently, the corresponding inflows to fund these deficits have dropped as well. From a macroprudential perspective, the reduction of balance of payment deficits which had been funded by shortterm interbank capital inflows supports financial stability in the euro area and in CESEE.
Fourth, when the EONIA is very low, interbank deposits are not profitable for lenders.29 Since mid2012, mar
28 For a discussion of the impact of microprudential regulation on the unsecured interbank market, see Schmitz (2012).
29 For details, see Schmitz (2013).
The Priorities of Deleveraging in the Euro Area and Austria and Its Implications for CESEE
62 OESTERREICHISCHE NATIONALBANK
ket rates have been so low that they merely cover the cost of providing interbank funding. The latter includes counterparty credit risk costs, idiosyncratic liquidity risk costs and capital costs. Holding excess liquidity in the Eurosystem’s deposit facility does not carry any of these risks. With the spread between EONIA and the deposit facility rate declining, lending in the interbank market became increasingly unattractive. From a macroprudential perspective, banks should not be pressured to invest in assets that yield a negative return after credit and liquidity risk charges and cost of capital.
Assessing the prominent role of external assets in the priorities of deleveraging is less straightforward from a macroprudential perspective. In the euro area, the decrease in external assets reflects a more difficult U.S. dollar funding environment. From a macroprudential perspective, it is exposure for which funding diminishes or becomes more fragile that should be reduced. In addition, external assets in many cases do not constitute core assets of euro area banks. These assets are more likely to be subject to a negative selection bias. Borrowers who are denied credit by their local banks, say, in Asia, turn to foreign banks. From a macroprudential perspective, the reduction in such assets is not a concern. Finally, the reduction in external assets was due to sales of foreign subsidiaries, loan portfolios and writedowns (including subprime related assetbacked securities). Macroprudential supervision supports balance sheet repair.30
The decrease in shortterm intragroup funding of CESEE subsidiaries by Austrian banks was predominantly due to three drivers: (1) the reduction
in foreign currency loans in CESEE (a consequence of measures taken by Austrian and CESEE supervisory authorities to limit the risk arising from foreign currency loans), (2) the improvement of the funding mix of CESEE subsidiaries toward local deposits and (3) the improvement of current account balances in the region. From a macroprudential perspective, all three developments are, in principle, welcome.
We find that despite reductions in total assets in the euro area and in Austria, bank funding for the real economy has increased. Nevertheless, calls for policies that incentivize banks to increase loans feature prominently on the agenda of politicians and economic commentators. From a macroprudential perspective, however, high loan growth at interest rates that do not cover credit, liquidity and systemic risk costs is not a sustainable policy objective. It leads to the misallocation of capital and risk in the economy. Both are disruptive to financial stability and sustainable economic growth.
4 Conclusions
Analyzing euro area and Austrian MFI data and Austrian reporting data, we find that postcrisis deleveraging was significant in the euro area, in Austria and in CESEE. Capital increases ranked highest in the priorities of delever aging, followed by reductions of interbank and external assets. At euro area banks, capital increases contributed 88% to deleveraging, at Austrian banks this share was 73% and at Austrian banks’ CESEE subsidiaries it was 99%. The small reductions in total assets were driven by interbank and external assets. The asset mixes of euro area banks, Austrian banks and their CESEE subsidiaries shifted toward funding for
30 See, inter alia, ECB (2014) and IMF (2014).

The Priorities of Deleveraging in the Euro Area and Austria and Its Implications for CESEE
FINANCIAL STABILITY REPORT 27 – JUNE 2014 63
governments and the real economy. Banks have also rebalanced their liability compositions from interbank and external liabilities to more stable fund
ing sources, such as capital and deposits by nonMFIs. Our assessment of these developments from a macroprudential perspective is, in general, positive.
5 ReferencesCœuré, B. 2013. Reviving credit growth in the euro area. Speech at the Paris Europlace Inter-
national Financial Forum “Growth and Investment Opportunities in Europe” on July 11, 2013.Cohen, B. H. and M. Scatigna. 2014. Banks and capital requirements: channels of adjustment.
BIS Working Papers No 443.Cohen-Setton, J. and S. Vallée. 2011. Banks deleveraging in a liquidity crisis. http://www.bruegel.org/nc/blog/detail/article/290-banks-deleveraging-in-a-liquidity-crisis/
(retrieved on June 2, 2014).Constâncio, V. 2014. Banking Union – meaning and implications for the future of banking. Speech
at the Banking Union Conference at Navarra University, Madrid, on April 24, 2014.European Banking Authority. 2013. Report on impact assessment for liquidity measures
under Article 509(1) of the CRR. December.European Banking Coordination “Vienna” Initiative. 2012. Working Group on NPLs in
Central, Eastern and Southeastern Europe. March.European Banking Coordination “Vienna” Initiative. 2014. CESEE Deleveraging and
credit monitor. May.ECB. 2013. Financial Stability Review. November.European Systemic Risk Board. 2011. Recommendation of the European Systemic Risk
Board of 21 September 2011 on lending in foreign currencies.FMA. 2010. Extension of the FMA Minimum Standards for Granting and Managing Foreign
Currency Loans and Loans with Repayment Vehicles of 16 Ocotber 2003. FMA and OeNB. 2012. Supervisory guidance on the strengthening of the sustainability of the
business models of large internationally active Austrian banks. March 14. IMF. 2010. Global Financial Stability Report. October.IMF. 2013. Financial Sector Assessment Program European Union – Financial Integration and
Fragmentation in the European Union. Technical Note. IMF. 2014. Global Financial Stability Report. April.Infelise, F. 2014. Supporting access to finance by SMEs: Mapping the initiatives in five EU countries.
ECMI Research Report 9.J.P. Morgan. 2013. Flows & Liquidity – severe balance sheet shrinkage. November 22.Laeven, L., L. Ratnovski and H. Tong. 2014. Bank Size and Systemic Risk. IMF Staff Discussion
Note SDN/14/04.Puhr, C., S. W. Schmitz, R. Spitzer and H. Hesse. 2012. Room for manoeuvre: The
deleveraging story of Eurozone banks since 2008. VoxEU. 14 June. http://www.voxeu.org/index.php?q=node/8090 (retrieved on June 2, 2014). Schmitz, S. W. 2012. The Liquidity Coverage Ratio Under Siege. July 25. http://www.economonitor.com/blog/2012/07/the-liquidity-coverage-ratio-under-siege/
(retrieved on June 2, 2014).Schmitz, S. W. 2013. The Impact of the Liquidity Coverage Ratio (LCR) on the Implementation
of Monetary Policy. Economic Notes 42 (2). 135–70.Takáts, E. and C. Upper. 2013. Credit and growth after financial crises. BIS Working Papers
No 416.

64 OESTERREICHISCHE NATIONALBANK
1
Austrian banks have early taken advantage of Austria’s geographical proximity to the Central, Eastern and Southeastern European (CESEE) economies and expanded into the region over the past two decades. CESEE has been the key growth market for Austrian banks, which benefited strongly from the catchingup process in financial services. Having steadily reinforced their foreign business focus on the CESEE region, Austrian banks operated 63 fully consolidated retailoriented subsidiaries in 18 countries in CESEE with total assets of EUR 265 billion at yearend 2013. Compared with other Western European banks, Austrian banks are among the biggest players, holding a market share of about 20% in CESEE, while Italian, French and German banks hold shares of 17%, 15% and 11%, respectively. Austrian banks’ claims are largest on the Czech Republic, Croatia, Romania, Russia, Slovakia and Hungary. Turkey is also among the largest obligors when the estimated total exposure of
Austrian banks in domestic and foreign ownership is taken into consideration.2 The aggregate exposure to CESEE has grown moderately since 2009, but there have been large differences in how exposures to individual countries developed. While Austrian banks’ foreign claims on Ukraine have decreased mark
Macrofinancial Developments in Ukraine, Russia and Turkey from an Austrian Financial Stability Perspective
Recent bouts of international financial market volatility and adverse geopolitical developments have put the spotlight on Ukraine, Russia and Turkey. While Austrian banks benefited from a benign macrofinancial environment in Russia and Turkey, in particular with regard to the swift recovery from the 2008–09 crisis period, they are burdened by legacy issues of the last credit boom in Ukraine. By discussing macrofinancial developments in Ukraine, Russia and Turkey, this study sets the scene for a more in-depth analysis of Austrian banks’ activities in these countries.
JEL classification: G21, G28, P34Keywords: Banking sector, Austrian banks, financial stability, risks, vulnerabilities
Tina Wittenberger, Daniela Widhalm,
Mathias Lahnsteiner, Stephan Barisitz1
1 Oesterreichische Nationalbank, Financial Stability and Macroprudential Supervision Division, [email protected] and [email protected], and Foreign Research Division, [email protected] and [email protected]. The authors are grateful to Gernot Ebner (OeNB)
for valuable comments and suggestions.2 Some of the data used for the analysis of Austrian banks’ activities in Turkey were estimated on the basis of publicly
available data as parts of these business figures are not fully covered by the Austrian supervisory reporting framework. This is due to the fact that the banks concerned do not run fully consolidated subsidiaries (but hold, e.g., equity interests in a joint venture).
End-2009 = 100
200
180
160
140
120
100
80
60Q4 09 Q4 10 Q4 11 Q4 12 Q4 13
Austrian Banks’ Exposure in CESEE
Chart 1
Source: OeNB.
CESEE RomaniaHungary
UkraineTurkey Russia Czech Republic

Macrofinancial Developments in Ukraine, Russia and Turkey from an Austrian Financial Stability Perspective
FINANCIAL STABILITY REPORT 27 – JUNE 2014 65
edly by 15%, exposures to Russia and Turkey have grown briskly by around 70% and 80%, respectively, since 2009. The following analysis will shed light on banking activities in Ukraine, Russia and Turkey.
Profitability of Austrian Banks’ Subsidiaries Marked by Heterogeneous Developments in CESEE – Profits Increasingly Stem from Russia and Turkey
Austrian banks’ activities in CESEE are important drivers of the domestic banking sector’s profitability.3 The higher profitability comes with higher risks, though. This becomes evident especially when comparing operations in individual countries. In the runup to the crisis that started in 2008, the business of Austrian banks’ subsidiaries was profitable in almost all CESEE countries. However, since the outbreak of the crisis, developments in the countries of the region have been heterogeneous. For example, macroeconomic as well as banking indicators such as credit quality and profitability deteriorated markedly in Ukraine. Austrian banks’ subsidiaries operating in Ukraine posted outright losses of EUR 182 million in 2009, compared with precrisis profits of EUR 236 million (i.e. 2.5% RoA) in 2008. Although business recovered modestly in the following years (with a net loss of EUR 11 million and an RoA of –0.1% in 2013), banks are still faced with challenges related to the precrisis boom and the strong crisis impact; the amount of nonperforming loans is high and private sector credit demand is subdued due to already relatively elevated indebtedness and weaker macroeconomic conditions since the outbreak of the crisis. More recently, geopolitical risks arising from political
developments in Ukraine may further weigh on banks’ operating environment and hence on their activities.
The heterogeneity in CESEE becomes even more apparent when comparing developments in Ukraine with developments in Russia and Turkey. The latter two countries became more attractive to banks due to differing business cycles, a lower level of market penetration in some loan segments and a relatively lower level of private sector indebtedness. As a consequence, the main contributions to Austrian banks’ profitability have increasingly stemmed from subsidiaries in Russia and from activities in Turkey. In both countries, profit growth is primarily linked to loan growth, with consumer loans playing an increasing part. The profitability of Austrian banks in Russia and in Turkey is markedly above the CESEE subsidiaries’ average. Austrian banks’ subsidiaries in Russia registered an RoA of 2.9% in the fourth quarter of 2013 compared to the Austrian subsidiaries’ CESEE average of 0.8%. Accordingly, more than 40% of net profits of Austrian subsidiaries in CESEE stemmed from business in Russia at yearend 2013 (up from 14% in 2009) and an estimated profit share of probably more than 10% stemmed from activities in Turkey. These figures illustrate that Austrian banks rely quite strongly on profits from these two countries; as a result, they are particularly vulnerable to adverse local developments.
Austrian Banks Withdraw from Ukraine as the Macrofinancial and Political Environment Remains ChallengingUkraine’s banking sector was strongly hit by the crisis in 2008–09 and has not fully recovered since then; credit quality has remained very weak and profitability
3 See the Reports section for more information on the profitability of Austrian banks active in CESEE.
Macrofinancial Developments in Ukraine, Russia and Turkey from an Austrian Financial Stability Perspective
66 OESTERREICHISCHE NATIONALBANK
low. There is continued deleveraging and derisking by Western European banks. In 2008, nonRussian foreign banks accounted for 40% of bank assets while in 2013 the corresponding figure was 16%; however, the respective share of Russian banks increased from 8% to 11%. Over the same period, Ukrainian stateowned banks increased their market share to 18%. Austrian subsidiaries’ market share fell to 7% in 2013 from 14% in 2008 due to deleveraging and the sale of subsidiaries, which was in line with the withdrawal of other European banks from Ukraine. Currently, three Austrian subsidiaries are still active in Ukraine, their total assets amounting to EUR 8.2 billion in the fourth quarter of 2013 (down from EUR 11.8 billion in 2008). One of the three remaining subsidiaries is intended to be sold, however.
The loan portfolio of the Ukrainian banking system is dominated by corporate loans. The proportion of loans denominated in foreign currency – mainly in U.S. dollars and, to a lesser extent, in euro – has declined since 2009 but still accounted for 34% at
end2013. Foreignowned banks operating in Ukraine still report the highest shares in foreign currency loans (FCLs).
Austrian banks’ subsidiaries (excluding the aforementioned one that was put on sale) had outstanding loans of EUR 3.6 billion in 2013, more than twothirds of which are corporate loans. In the household loan segment, mortgage loans represented 68%, whereas the share of consumer loans came to 16%. FCLs accounted for 45% of total loans. 59% of FCLs by Austrian banks were loans to corporations and 41% were loans to households. Moderate credit growth of 2% was registered in 2013 (year on year, exchange rate adjusted), which was driven by corporate lending, whereas retail loans decreased. In general, loan growth in the Ukrainian banking sector has been rather low since end2011 against the background of overall macroeconomic trends. New lending in the corporate segment was mostly supported by banks in Ukrainian owner ship.
Due to the severe economic crisis, asset quality has deteriorated sharply since 2008. Nonperforming loans (NPLs),
Box 1
Macroeconomic Developments in Ukraine
Ukraine experienced one of the sharpest downturns in CESEE during the crisis period, with GDP plummeting by 14.8% in 2009. The subsequent, mainly private consumption-driven recovery in 2010 and 2011 was followed by stagnation in 2012 and 2013. After dropping to 1.5% in 2009, Ukraine’s current account deficit widened continuously. In 2013, the current account gap reached 8.9% of GDP, and – together with considerable external debt service needs – contributed to an overall high level of external vulnerability. Following a sharp depre-ciation of the hryvnia from September 2008 to March 2009, the National Bank of Ukraine (NBU) pursued a relatively tight de facto peg against the U.S. dollar from early 2009 until early 2014. The NBU ran down its foreign currency reserves to very low levels (USD 15.4 billion in February 2014, covering only two months of imports) to keep the exchange rate stable, as the hryvnia repeatedly came under pressure. As pressures intensified further in January and February 2014, the NBU finally let the exchange rate float. From end-2013 to mid-April 2014, the currency lost more than 30% against the U.S. dollar. Against this background and pointing to the exchange rate pass-through on inflation, the NBU raised the discount rate by 300 basis points to 9.5% in mid-April. Since then the hryvnia has stabilized, also thanks to the IMF-led international support package.

Macrofinancial Developments in Ukraine, Russia and Turkey from an Austrian Financial Stability Perspective
FINANCIAL STABILITY REPORT 27 – JUNE 2014 67
according to the definition of the IMF (including substandard, doubtful and loss loans), reached about 40% of total loans in 2012. The NPL ratio of Austrian banks’ subsidiaries is above that of other CESEE subsidiaries.
On the back of deleveraging, the systemwide loantodeposit ratio (LDR) came down from an extraordinarily high 223% in mid2009 to 136% in 2013. The banking sector’s net external liabilities declined from 16% to 5% of GDP, but both figures started to rise again in the course of 2013. Austrian subsidiaries’ LDR came to 112% in September 2013.
The Ukrainian banking system reported a capital adequacy ratio of 18.3% in 2013, which is above the local regulatory minimum requirement of 10%. Austrian subsidiaries’ capitalization remained stable in 2013 (18.7%) and is above the average of Austrian subsidiaries in CESEE (17.7%).
Recent political developments in Ukraine pose new challenges to banks in the country. There is a risk of deposit outflows as the current political and economic situation is very fragile and confidence in the banking sector is diminishing. During the times of violent clashes between the police and protesters in Kiev in early 2014, depositor confidence showed signs of erosion, as reflected by considerable deposit outflows in the first quarter of 2014 (–12% in exchange rateadjusted terms). A larger deposit run was avoided by the National Bank of Ukraine restricting the withdrawal of foreign currency deposits and banks limiting cash withdrawals at ATMs. In April, the deposit market showed some signs of stabilization, but banks experienced continued deposit withdrawals in some eastern regions of Ukraine due to political
unrest. A recurrent or further erosion of depositor confidence potentially limits the funding opportunities of Ukrainian banks and may eventually lead to a rise of committed intragroup funding by parent banks to their Ukrainian subsidiaries. Moreover, the Ukrainian central bank may act as a lender of last resort. Deteriorating asset quality due to further adverse developments would lead to growing credit provisioning, which in turn could weigh on the profitability of banks in Ukraine and, eventually, put a strain on their capital adequacy ratio.
Austrian Banks Stepped Up Activities in Russia, Benefiting from the Credit Boom
Since the crisis of 2008–09, the Russian banking sector has fared quite well. From 2011 on, lending has been a driving force of GDP growth. Retail lending, while still rather modest, grew most dynamically. The driving forces of the Russian credit boom have been the oil price recovery (from early 2009 to early 2012), relatively brisk domestic demand growth (partly driven by public wage adjustments) and financial deepening in the highly profitable retail sector on the demand side and the “deposit boom,” increasing or high profits of natural resources enterprises and official liquidity assistance on the supply side.4
Austrian banks’ subsidiaries in Russia held total assets of EUR 35 billion in 2013, corresponding to 13.2% of Austrian CESEE subsidiaries’ total assets. This makes Russia the third most important market for Austrian banks (in terms of total assets), followed by the Czech Republic (24.5%) and Croatia (13.3%). Total assets of Austrian banks in Russia have grown by more than
4 For more details see Barisitz and Lahnsteiner (2010) as well as Barisitz (2013).

Macrofinancial Developments in Ukraine, Russia and Turkey from an Austrian Financial Stability Perspective
68 OESTERREICHISCHE NATIONALBANK
50% since 2009 (compared to a growth rate of more than 70% for the entire Russian banking sector). Austrian banks commanded a market share of around 3% in 2013.
The loan portfolio of the Russian banking system is dominated by loans to nonfinancial corporations (around 70%), whereas retail loans make up about 30% (i.e. mortgage and consumer loans). The outstanding loans of Austrian banks’ subsidiaries amounted to EUR 22.4 billion. Again, corporate loans represent the largest part (68%), followed by retail loans, accounting for around onethird. FCLs made by Austrian banks amounted to EUR 8.1 billion, 90% of which are denominated in U.S. dollars. 95% of FCLs were taken out by nonfinancial corporations. Compared to total loans, about half of the
loans extended by Austrian subsidiaries to nonfinancial corporations are denominated in foreign currency. In comparison with Russian banks, Austrian subsidiaries have a significantly higher share of FCLs in total loans (36% vs. 18%).
The Russian banking system registered credit growth of 19% during 2013, mainly driven by retail loan growth (over 30% in 2013). Corporate loans increased by nearly 13% in 2013. Total loans of Austrian banks’ subsidiaries in Russia grew by 8.1% to EUR 22.4 billion in 2013 (year on year), mainly driven by retail lending (+35% year on year), whereas corporate lending slightly decreased (–1%). Growth in the retail segment was to a large extent driven by consumer lending, whereas mortgage loans increased at a slower pace. 77% of retail loans (and 25% of
Box 2
Macroeconomic Developments in Russia
Since the global financial crisis of 2008–09, the Russian economy has benefited from slowly improving international economic activity, particularly from the strong recovery of the oil price and the improvement of the country’s terms of trade. While Russian GDP had declined sharply in 2009 (–7.8%), it rebounded rather swiftly and in 2011 exceeded the precrisis level. Over time, growth was increasingly driven by domestic demand, particularly household consumption. The latter was stimulated by years of generous increases of public salaries and pensions as well as by lending activity, notably credit to households, which gathered momentum and from 2011 expanded in double-digit rates (in real terms). Large current account surpluses were achieved on the back of high oil prices. Although having risen recently, Russia’s gross external debt remains at a relatively modest level (33.5% of GDP at end-2013), but considerably exceeds the amount of its still large foreign exchange reserves (EUR 355 billion or about 23% of GDP in mid-March 2014). The impact of the Ukrainian crisis and of Western sanctions have increased uncertainty, which further dampens the investment and growth outlook for Russia, at least in the short term.
Increased uncertainty was reflected in surging net private capital outflows from Russia (USD 50.6 billion in the first quarter of 2014) and an accelerated depreciation of the ruble in early 2014. As European banks are more active in Russia than in Ukraine, to them spillover effects from Russia are more relevant than spillover effects from Ukraine. Compared to other European banks, Austrian banks have the largest exposure (as a percentage of GDP) to Russia.
The impact of an accelerated depreciation of the ruble on the back of geopolitical risks has to be closely monitored. However, the shock-absorbing factors at the systemic level remain considerable, including a high level of deposits. Profitability is still high and the banking sector has a net external creditor position. The authorities still have room for maneuver: Russia boasts an almost balanced budget, very low public debt and still substantial (if shrinking) gross international reserves.

Macrofinancial Developments in Ukraine, Russia and Turkey from an Austrian Financial Stability Perspective
FINANCIAL STABILITY REPORT 27 – JUNE 2014 69
total loans) that Austrian banks’ subsidiaries have made in Russia are consumer loans. Apart from the surge in consumer loans and the increase in personal indebtedness, the credit boomrelated risks to the Russian banking sector are widespread connected lending and weak risk management capacities as well as potentially higher levels of nonperforming loans, modest provisioning and eroding capital adequacy. Starting from 2012, lending growth decelerated, which can be attributed to the general economic slowdown, but also to moral suasion and some prudential measures taken by the Central Bank of the Russian Federation (CBR).
Credit quality indicators look favorable but should be treated with caution during a credit boom, as they are lagging indicators and could deteriorate quickly. Austrian banks’ loan loss provision ratio even improved since the outbreak of the crisis (by –3.0 percentage points to 3.3% between 2009 and 2013) due to strong credit growth and a reduction in the stock of loan loss provisions. The NPL ratio at Austrian banks’ Russian subsidiaries was about 4% in 2013.
Loan growth appears to be largely funded by deposits, as indicated by the systemwide LDR amounting to about 100% in 2013. The Russian banking sectors’ main funding sources are customer deposits of households (around 29% of total liabilities in 2013) and corporates (around 32%). Competition for deposits increased and put pressure on interest margins. Moreover, reliance on funding from governmentrelated institutions – the largest part came from the CBR – rose to 11% of liabilities in 2013 from 9.2% in 2012. Russian stateowned banks attracted 79% of funding
from government related sources in 2013. The LDR of Austrian subsidiaries amounted to almost 100% in 2013. Deposits at Austrian banks’ subsidiaries in Russia made up 62% of total liabilities in 2013 and have increased by 73% since 2009. Loan growth funded by local stable funding sources is in line with the Austrian supervisory guidance5 implemented in March 2012, which is aimed at strengthening the sustainability of the business models of large internationally active Austrian banks.
Aside from profitability and funding, capitalization serves as an important risk buffer. At the sector level, the capitalization of Russian banks declined. As of January 2014, the capital adequacy ratio was 12.9%, down from 13.7% at the beginning of 2013. According to estimates of the CBR, twothirds of banking assets growth is attributable to credit growth, and onethird of the increase is related to regulatory changes. The capitalization of Austrian subsidiaries in Russia declined to 14.5% in 2013, from 16.1% in 2009, and was lower than the Austrian CESEE subsidiaries’ average (17.7% in 2013). Likewise, the tier 1 ratio of Austrian subsidiaries in Russia was 12.8% in 2013 compared to the respective CESEE average of 15.5%.
Austrian Banks Increased Activities in Turkey and Benefit from the Credit Boom
Austrian banks have significant business interests in Turkey: On the one hand, there are crossborder direct lending and interbank credit lines, on the other hand, and more importantly, one Austrian bank operates a joint venture with a share in total assets amounting to EUR 22.1 billion in 2013. The joint
5 For further information see http://www.fma.gv.at/de/ueber-die-fma/presse/pressemitteilungen/pressemitteilungen-detail/article/nachhaltigkeitspaket-fuer-oesterreichs-banken-soll-finanzmarktstabilitaet-staerken.html.

Macrofinancial Developments in Ukraine, Russia and Turkey from an Austrian Financial Stability Perspective
70 OESTERREICHISCHE NATIONALBANK
venture is the fourth largest bank in Turkey and has a market share of roughly 10%.
The systemwide loan portfolio in Turkey is dominated by loans to large nonfinancial corporations (42% in 2013), followed by retail loans with a share of around onethird and loans to SMEs (26%). The share of FCLs in total loans amounted to roughly 30% in 2013, which is lower than in other CESEE countries. Foreign currency lending has been strictly regulated in Turkey since 2009.6 The majority of outstanding FCLs – which are mostly denominated in U.S. dollars – was extended to nonfinancial corporations. Overall, approximately half of the outstanding volume of corporate loans is denominated in foreign currency. Austrian banks’ loan portfolio in Turkey broadly mirrors these patterns.
Next to high GDP growth, Turkey has experienced a credit boom since 2010. Annual credit growth averaged 24% (exchange rateadjusted) between
2010 and 2013. Throughout the boom, credit terms were loosened, as banks were increasingly willing to lend to less creditworthy borrowers. According to Moody’s, unsecured personal consumer credit has expanded by around 105% and credit card debt by 87% since 2010. At 113%, loans to SMEs also spurred credit growth during this period. Clearly, the unsecured consumer and SME segments are particularly vulnerable to a less benign economic environment. Austrian banks’ activities in Turkey also involve high loan growth rates in the retail and in the nonfinancial corporate segments. Moreover, the Austrian joint venture bank has a significant market share in the fastgrowing credit card business. Given the high credit growth rates, the Central Bank of the Republic of Turkey took a number of macroprudential measures, in particular to curb the growth of consumer loans (e.g. introduction of higher risk weights, higher provisioning requirements, credit card limits in
Box 3
Macroeconomic Developments in Turkey
Turkey’s economy rebounded swiftly from the 2008–09 crisis period. Following a recession in 2009 (–4.8%), economic growth was buoyant in 2010 and 2011 (averaging 9%) before slowing down in 2012 and 2013 (averaging 3.3%). In 2013, the growth structure became increasingly unbalanced, as economic activity was driven by partly credit-financed domestic demand, while the contribution of net exports turned increasingly negative. Turkey’s strong growth also helped keep the fiscal deficit (1.6% of GDP in 2013) and public debt (36% of GDP) at low levels. However, the current account deficit widened from 2.2% in 2009 to 8% of GDP in 2013. Turkey has become vulnerable to external shocks also due to the fact that the financing of the considerable current account gap has been fragile and strongly reliant on short-term capital inflows since 2009. In 2013, the lira repeatedly came under considerable pressure (mainly due to the U.S. Federal Reserve’s first tapering announcement and rising political risks). The cumulative depreciation between mid-May 2013 and January 2014 amounted to 28.2% against the U.S. dollar and to 36.1% against the euro. On January 28, 2014, the Central Bank of the Republic of Turkey (CBRT) decided to raise the main policy rate from 4.5% to 10% p.a. Following this step, the lira stabilized and recovered a small part of its earlier losses until end-March.
6 There is a ban on foreign currency lending to households. Corporates, whether they are hedged or not, are allowed to borrow in foreign currency from local banks, provided that the foreign currency loan amount is greater than USD 5 million and that the maturity is longer than one year.
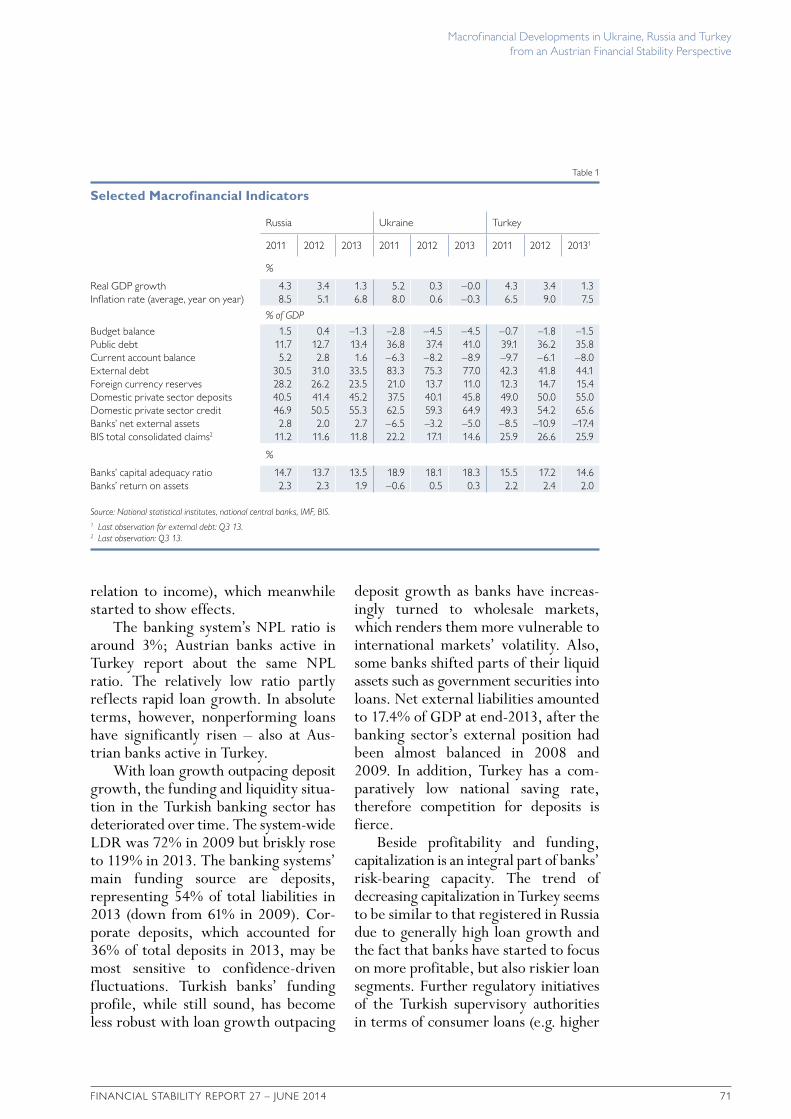
Macrofinancial Developments in Ukraine, Russia and Turkey from an Austrian Financial Stability Perspective
FINANCIAL STABILITY REPORT 27 – JUNE 2014 71
relation to income), which meanwhile started to show effects.
The banking system’s NPL ratio is around 3%; Austrian banks active in Turkey report about the same NPL ratio. The relatively low ratio partly reflects rapid loan growth. In absolute terms, however, nonperforming loans have significantly risen – also at Austrian banks active in Turkey.
With loan growth outpacing deposit growth, the funding and liquidity situation in the Turkish banking sector has deteriorated over time. The systemwide LDR was 72% in 2009 but briskly rose to 119% in 2013. The banking systems’ main funding source are deposits, representing 54% of total liabilities in 2013 (down from 61% in 2009). Corporate deposits, which accounted for 36% of total deposits in 2013, may be most sensitive to confidencedriven fluctuations. Turkish banks’ funding profile, while still sound, has become less robust with loan growth outpacing
deposit growth as banks have increasingly turned to wholesale markets, which renders them more vulnerable to international markets’ volatility. Also, some banks shifted parts of their liquid assets such as government securities into loans. Net external liabilities amounted to 17.4% of GDP at end2013, after the banking sector’s external position had been almost balanced in 2008 and 2009. In addition, Turkey has a comparatively low national saving rate, therefore competition for deposits is fierce.
Beside profitability and funding, capitalization is an integral part of banks’ riskbearing capacity. The trend of decreasing capitalization in Turkey seems to be similar to that registered in Russia due to generally high loan growth and the fact that banks have started to focus on more profitable, but also riskier loan segments. Further regulatory initiatives of the Turkish supervisory authorities in terms of consumer loans (e.g. higher
Table 1
Selected Macrofinancial Indicators
Russia Ukraine Turkey
2011 2012 2013 2011 2012 2013 2011 2012 20131
%
Real GDP growth 4.3 3.4 1.3 5.2 0.3 –0.0 4.3 3.4 1.3Inflation rate (average, year on year) 8.5 5.1 6.8 8.0 0.6 –0.3 6.5 9.0 7.5
% of GDP
Budget balance 1.5 0.4 –1.3 –2.8 –4.5 –4.5 –0.7 –1.8 –1.5Public debt 11.7 12.7 13.4 36.8 37.4 41.0 39.1 36.2 35.8Current account balance 5.2 2.8 1.6 –6.3 –8.2 –8.9 –9.7 –6.1 –8.0External debt 30.5 31.0 33.5 83.3 75.3 77.0 42.3 41.8 44.1Foreign currency reserves 28.2 26.2 23.5 21.0 13.7 11.0 12.3 14.7 15.4Domestic private sector deposits 40.5 41.4 45.2 37.5 40.1 45.8 49.0 50.0 55.0Domestic private sector credit 46.9 50.5 55.3 62.5 59.3 64.9 49.3 54.2 65.6Banks’ net external assets 2.8 2.0 2.7 –6.5 –3.2 –5.0 –8.5 –10.9 –17.4BIS total consolidated claims2 11.2 11.6 11.8 22.2 17.1 14.6 25.9 26.6 25.9
%
Banks’ capital adequacy ratio 14.7 13.7 13.5 18.9 18.1 18.3 15.5 17.2 14.6Banks’ return on assets 2.3 2.3 1.9 –0.6 0.5 0.3 2.2 2.4 2.0
Source: National statistical institutes, national central banks, IMF, BIS.1 Last observation for external debt: Q3 13. 2 Last observation: Q3 13.

Macrofinancial Developments in Ukraine, Russia and Turkey from an Austrian Financial Stability Perspective
72 OESTERREICHISCHE NATIONALBANK
RWAs) may translate into lower capital ratios. Also, in the light of unfavorable internal and external developments, such as political turmoil and diminishing liquidity in emerging markets worldwide, a slowdown in economic growth, deteriorations in credit quality and reductions in credit demand, the operating environment will become increasingly challenging for banks in Turkey.
Conclusions
Austrian banks are important players in CESEE and have benefited from diversified exposures in an increasingly heterogeneous region. Over the last years, a benign credit cycle in Russia and Turkey led to increased profits from these two economies; however, this makes the banks active in these two countries vulnerable to adverse local developments. Furthermore, in the recent past, profits have increasingly come from fast credit growth, mainly in consumer finance (including the credit card business, especially in Turkey). As this segment is particularly vulnerable to a less benign economic environment, it could be a drag on banks’ profitability and weaken their capacity to improve capitalization. And although NPL ratios seem favorable,
NPLs have started to deteriorate in absolute volumes.
Since the outbreak of the crisis in 2008, Austrian banks have reduced their exposure to Ukraine. Banks have faced severe headwinds in Ukraine due to the legacy of the past credit boom, weak macrofinancial conditions, the unstable political situation and geopolitical tensions. A further destabilization in Ukraine would put pressure on banks’ funding, profitability and capitalization.
On top of the aforementioned vulnerabilities, increased geopolitical risks in Ukraine and Russia as well as domestic political turmoil in Turkey, macroeconomic imbalances, the general reduction in liquidity in emerging markets worldwide and deteriorating economic conditions will further affect banks’ operating environment and activities. Banks should step up their risk buffers; although Austrian banks’ riskbearing capacity is higher than in 2008, capitalization needs to be improved further, given banks’ risk profile and heightened external risks. Moreover, Austrian banks should further enhance their risk management practices. The developments in Ukraine, Russia and Turkey need to be monitored carefully and banks should proactively prepare for contingency situations.

Macrofinancial Developments in Ukraine, Russia and Turkey from an Austrian Financial Stability Perspective
FINANCIAL STABILITY REPORT 27 – JUNE 2014 73
ReferencesBank Austria. 2013. Geschäftsbericht 2013.Barisitz, S. 2013. Credit Boom in Russia despite Global Woes – Driving Forces and Risks:
In: Financial Stability Report 26. 82–99.Barisitz, S., U. Gunther and M. Lahnsteiner. 2012. Ukrainian Banks Face Heightened
Uncertainty and Challenges. In: Financial Stability Report 23. 50–57.Barisitz, S. and M. Lahnsteiner. 2010. Russian Banks on the Route of Fragile Recovery.
In: Financial Stability Report 20. 77–85.Barisitz, S. and M. Lahnsteiner. 2009. Investor Commitment Tested by Deep Crisis: Banking
Development in Ukraine. In: Financial Stability Report 18. 69–77.Central Bank of the Republic of Turkey. 2013. Financial Stability Report. Volume 17.
November.Central Bank of the Russian Federation. 2012. Banking Supervision Report.EBRD. 2014. Regional Economic Prospects in EBRD Countries of Operations: May 2014.Fitch Ratings. 2014. Turkish Banks: Resilient Loss Absorption Capacity. Testing Times but
Reasonable Capital Ratios Provide Adequate Buffers. March 14. Fitch Ratings. 2014. Russian Banks Datawatch 2013. Growth Moderating, Increased Retail Risks,
Liquidity Concerns for Small Banks. February 3.Fitch Ratings. 2013. Russian Banks Datawatch: Full-Year 2012. Tighter Funding, Capital and
Slower Economy Constrains Growth, But Performance Solid. January 29.Fitch Ratings. 2013. Ukrainian Banking Sector Outlook: Still Under Pressure. November 29.International Monetary Fund. 2013. Turkey. Staff Report for the 2013 Article IV Consultation.
November 1.International Monetary Fund. 2012. Turkey. Financial System Stability Assessment. IMF Country
Report No. 12/261. September.Moody’s. 2014. Turkey. Banking System Outlook. March 24. Moody’s. 2014. Russian Bank Asset Quality and Profitability Face Pressure from Ukraine Crisis.
March 6.Moody’s. 2014. Ukraine’s Crisis Affects the Sovereign, Ukraine’s Banks and Corporates, and
Austrian Banks. March 3.Moody’s. 2013. Credit Opinion. Yapi ve Kredi Bankasi AS. July 17.Moody’s. 2013. Moody’s Credit Outlook. News and Analysis. Credit implications of current
events. September 26.

74 OESTERREICHISCHE NATIONALBANK
Before the crisis, crossborder funding in foreign currencies strongly accelerated. Foreign currency lending to households and to other unhedged borrowers was prevalent, implying significant currency risks for the borrowers as well as credit and funding risks for the lenders. When the crisis erupted in 2008, large vulnerabilities in the form of excessive leverage and foreign currency loans were exposed. On the one hand, crossborder net lending turned negative and new loan syndications dropped sharply. On the other hand, weakening currencies inflated loan instalments and caused financial difficulties for unhedged borrowers. These problems have stressed the necessity for measures to strengthen local currency funding and lending by developing domestic capital markets as well as by encouraging longterm savings and investments.1
This paper is structured as follows: Section 1 summarizes the benefits of developed capital markets. In section 2 the main characteristics of capital markets in CESEE are presented, while
section 3 identifies necessary conditions for a developed capital market and subsequently explores to what extent CESEE countries fulfill these conditions. Some international initiatives supporting local capital market development in CESEE are dealt with in section 4 and, finally, section 5 concludes.
1 Benefits of Developed Capital Markets
Developed capital markets complement the financial intermediation role of banks and support the efficient allocation of financial resources. In the presence of wellfunctioning stock and corporate bond markets the corporate sector is less dependent on bank financing. Thus, firms can raise capital at a lower cost, expand their size and achieve economies of scale. The intensified financial flows in a developed capital market result in an increase in capacity and flexibility to react to unexpected market shocks, further leading to a reduction of credit crunch risk. Consequently, the development of capital markets accelerates economic growth and the
Capital Market Development in CESEE and the Need for Further Reform
Domestic capital markets in Central, Eastern and Southeastern Europe (CESEE) are still less developed than capital markets in more advanced economies. Unhedged foreign currency borrowing and dependence on external funding have been among the key vulnerabilities in CESEE during the global economic crisis. Therefore, there is a need for better developed local capital markets in the region, additional sources of domestic funding, and a reduction in foreign exchange exposure in domestic financial markets. International initiatives, such as the Vienna Initiative or the EBRD Local Currency and Capital Markets Development Initiative, support local capital market development in the region. Well-developed capital markets are not only a crucial component for generating economic output, but also foster more stable growth through the ability of diversified financial sources to offset a slowdown of economic activity caused by a credit crunch.
JEL classification: O16, E22, G3, F36Keywords: Central, Eastern and Southeastern Europe, CESEE, capital market, local currency, bond market, corporate bond market, government bond market, stock market, capital market development
Krisztina Jäger-Gyovai1
1 Oesterreichische Nationalbank, Foreign Research Division, [email protected].

Capital Market Development in CESEE and the Need for Further Reform
FINANCIAL STABILITY REPORT 27 – JUNE 2014 75
further enhancement of the financial sector by increasing the quantity and the quality of investment as well as by fostering competition (see Rojas Suarez, 2014; Yartey, 2008; and Mminele, 2013).
The development of local currency and local capital markets can help to reduce unhedged foreign currency borrowing, rendering a country less dependent on capital inflows and less vulnerable to their potential reversal, both having emerged as key vulnerabilities in CESEE during the global economic crisis. However, developing local currency finance and capital markets is a longterm and complex process.
2 The Main Characteristics of Capital Markets in CESEE2
One of the main indicators of capital market development is market capitalization. The capitalization ratio is defined as the share price of listed companies times the number of shares outstanding relative to GDP. To measure the activity of the market, two World Bank indicators are used. The first is the total value traded as a share of
GDP; the second is the turnover ratio, which represents the total value of shares traded during a given period divided by the average market capitalization for that period. A high turnover ratio implies lower transaction costs and consequently higher market efficiency.
These indicators show that, with the exception of some countries, the stock markets in the CESEE region are still underdeveloped, both in terms of size and liquidity. The region can be divided into three groups. The first group includes Russia, Turkey, Croatia and Poland, where stock exchanges show a relatively advanced development by regional standards. On the other side of the scale is the second group, which consists of Slovakia, Romania and the Baltic states. In these countries stock markets are relatively small. The remaining countries, i.e. the third group, exhibit mediumsized stock markets (between 10% and 20% of GDP; see chart 1). Overall, the liquidity of the stock markets in the CESEE region is rather limited, except in Russia and Turkey (see charts 2 and 3).
2 As the indicators used do not change significantly over short time, the latest available World Bank data on stock markets and Eurostat data on government bond markets from 2012 can be considered as representative.
% of GDP, 2012
60
50
40
30
20
10
0EA
Market Capitalization
Chart 1
Source: World Bank, ECB.
Note: EA = euro area.
RU TR HR PL RS CZ HU SI BG UA EE RO LT SK LV

Capital Market Development in CESEE and the Need for Further Reform
76 OESTERREICHISCHE NATIONALBANK
2.1 Government Bond MarketsIn the CESEE region the share of government bonds in total government debt is over 80% (chart 4). There are only a few exceptions but two of them are significant: In the case of Latvia this ratio is around 43% and in Estonia it is even lower with 14%. Looking at the development of this ratio over time, Latvian government bonds’ share in
total debt has decreased significantly since the crisis due to the emergency bailout loan received from the IMF and the EU. In Estonia it has never gone above 40% in the last years.
Apart from these exceptions, it can be stated that differences in the size of government bond markets across CESEE countries can be explained by the size rather than the structure of
% of GDP, 2012
50
45
40
35
30
25
20
15
10
5
0TR
Total Value Traded
Chart 2
Source: World Bank.
RU PL HU CZ RO SI HR EE RS BG UA LT SK LV
%, 2012
160
140
120
100
80
60
40
20
0TR
Turnover Ratio
Chart 3
Source: World Bank.
RU HU PL CZ RO EE SI UA BG LT RS SK LV HR

Capital Market Development in CESEE and the Need for Further Reform
FINANCIAL STABILITY REPORT 27 – JUNE 2014 77
government debt. Hungarian government bonds make up over 60% of GDP. Hungary is followed by Poland, Slovakia and Slovenia with around 45%. The lowest levels both in terms of general government debt and bond size can be found in Estonia, with significantly lower numbers than in other CESEE countries. The maturity struc
ture of government bonds does not differ across countries; the share of long term bonds varies around 75%. However, in Romania only 32% of government bonds have an original maturity of over 5 years and around half of the bonds mature after 1 to 5 years. Looking at the breakdown by holding sectors, Czech government
%, 2012
100
90
80
70
60
50
40
30
20
10
0CZ
Government Bonds’ Share in Government DebtGovernment Bonds in CESEE
Chart 4
SK SI PL LT HU EA BG RO LV EE
% of GDP, 2012
80
70
60
50
40
30
20
10
0EA
Government Bonds as a Percentage of GDP
HU PL SK SI CZ LT RO LV BG EE
%, 2012
100
90
80
70
60
50
40
30
20
10
0RO
Government Bonds by Maturity
Source: Eurostat.
Note: In the case of Hungary the color green indicates a maturity of over 1 year. EA = euro area.
Less than 1 year 1 to 5 years Over 5 years
LV EE PL BG CZ SI SK HU LT
% , 2012
90
80
70
60
50
40
30
20
10
0LT
Government Bonds Held by Nonresidents
SI HU PL SK EE BG CZ

Capital Market Development in CESEE and the Need for Further Reform
78 OESTERREICHISCHE NATIONALBANK
bonds are held mainly by domestic financial corporations, and less than onefourth belongs to nonresidents. By contrast, Lithuanian or Slovenian government bonds are mainly held by foreign investors (chart 4).
2.2 Corporate Bond Markets
In most CESEE countries corporate bond markets remain small, or even nonexistent, like in Romania, Belarus, Lithuania, Serbia, and Bosnia and Herzegovina (chart 5). One exception is the Czech Republic, where the late banking system reform combined with a significant fall in local interest rates might have supported the growth of the corporate bond market. As a consequence, the country has the deepest corporate bond market, accounting for over 20% of GDP (which is still a relatively low share compared to the euro area value of around 90%). Corporate bond market development and average maturity show a strong correlation; the bigger the corporate bond market, the longer the bond maturity observed (chart 6). While in the most developed corporate bond market in CESEE (i.e. in the Czech Republic) the average maturity is close to 12 years, in the least developed markets, the few bonds available mature within 2 to 3 years. Looking at
the currency structure, large variations across countries can be observed. In some countries corporate bonds are primarily issued in foreign currencies, e.g. in Bulgaria, Croatia and Turkey, whereas other countries show more or less equal shares of local and foreign currency bonds, e.g. the Czech Republic, Hungary and Latvia. In the remaining countries corporate bonds are issued merely in local currencies. From the issuer’s point of view it shows that, in the relatively higherdeveloped markets, bonds are predominantly issued by financial issuers, and conversely, in
% of GDP, April 2014
25
20
15
10
5
0CZ
Corporate Bonds as a Percentage of GDP
Chart 5
Source: Bloomberg (April 2014), IMF (2013).
Local currency bonds Foreign currency bonds
SK HU TR HR RU EE SI BG LV UA PL RO BY LT RS BiH
Average maturity in years
Corporate bond market size in % of GDP
14
12
10
8
6
4
2
00 5 10 15 20 25
Average Maturity of Corporate Bonds versus Market Size
Chart 6
Source: Bloomberg (April 2014), IMF (2013).
BYRS LV
UA
RO PLBG
SI
EE
RU SKCZ
R2= 0.6797HR
TR
HU

Capital Market Development in CESEE and the Need for Further Reform
FINANCIAL STABILITY REPORT 27 – JUNE 2014 79
countries with a less developed corporate bond market, nonfinancial issuers dominate. Furthermore, Czech corporate bonds issued by the financial sector are mainly in local currency, but industrial bonds tend to be issued in foreign currency. The latter is valid also for Hungary, but here also financial institutions issue substantial amounts of foreign currency bonds. In Croatia and Bulgaria a small part of bonds is issued in local currency and/or by the financial sector, whereas the industrial bonds dominating the market are in foreign currency (chart 7).
3 Local Capital Market Development Needs Substantial Further Strengthening
It is evident from the data that local capital markets in CESEE need substantial further strengthening. Against this background, necessary conditions for a developed capital market usually can be grouped into several pillars, namely (1) macroeconomic stability, (2) a deep banking sector, (3) high institutional quality, (4) an adequate regulatory and supervisory framework, as well as (5) large domestic savings and investments along with private capital flows. All of these are interrelated and complementary at the same time
(see RojasSuarez, 2014; and Yartey, 2008).
To what extent do countries in the CESEE region fulfill these conditions? To approximate this question we may look at the 2014 Index of Economic Freedom published by the Heritage Foundation. It can provide an idea about corruption, price stability and controls, private property protection by rights and law enforcement, as well as investment and financial freedom in CESEE. The countries that scored highest according to the Index are Estonia, Lithuania and the Czech Republic, whereas Russia, Belarus and Ukraine got the lowest points (chart 8). In the latter countries, many of the necessary characteristics of an appropriate environment for fostering a developed capital market are absent. The highest level of heterogeneity across countries is evident in the “rule of law” category, which is an average of the measure of corruption and property rights. By contrast, the development level in terms of regulatory efficiency and open markets does not show significant differences among the countries, except the relatively low score for Russia, Belarus and Ukraine in the latter category.
Governments and central banks can also influence local capital market
% of GDP
25
20
15
10
5
0CZ
Corporate Bonds by Issuer and Currency
Chart 7
Source: Bloomberg (April 2014), IMF (2013).
Financial issuers, local currency Nonfincancial issuers, local currency Financial issuers, foreign currency Nonfincancial issuers, foreign currency
SK HU TR HR RU EE SI BG LV UA PO RO BY LT RS BiH

Capital Market Development in CESEE and the Need for Further Reform
80 OESTERREICHISCHE NATIONALBANK
development with administrative tools and measures. Governments, as main participants in the bond market, also indirectly influence corporate bond market development as they create the riskfree benchmark by issuing government securities in local currency across various maturities. This benchmark supports the pricing and therefore also the issuance of corporate debt. Capital market development can also be shaped by highlevel policy measures (e.g. policies that encourage the private sector to increase investment or broaden its investor base) or more technical and/or operational reforms (e.g. increase in price transparency), as well as regulatory or legal frameworks (e.g. new forms of taxation and controls). Furthermore, measures related to infrastructure environment (e.g. clearing and settlement) affect capital market development, too (see IMF et al., 2013).
For instance, as of August 1, 2014, Magyar Nemzeti Bank (MNB), Hungary’s central bank, will replace its twoweek MNB bill with a twoweek
deposit facility which will be available only to counterparties and not to foreign or nonbank depositors. One of the objectives is to raise demand for government securities denominated in local currency. However, the longterm impact strongly depends on excluded investors’ reallocation of assets into government securities, where the shortest maturity is for three months as compared to the central bank facility’s twoweek maturity period (see Magyar Nemzeti Bank, 2014). Another example is the ongoing covered bond reform in Poland, which makes it easier for specialized mortgage banks to issue covered bonds. Further examples would be the Bulgarian, Macedonian and Zagreb stock exchanges, which have just started a project promoting the integration of securities markets in order to improve the visibility and efficiency of these markets. The list of government activities designed to further develop local capital markets is long. However, further efforts are needed to achieve deeper and broader capital markets.
Index: 100 = highest degree of economic freedom
80
70
60
50
40
30
20
10
0EE
Index of Economic Freedom
Chart 8
Source: The Heritage Foundation, 2014.
Note: The Index is based on ten factors, grouped into four broad categories. Each of the ten economic freedoms within these categories is graded on a scale of 0 to 100. A country’s overall score is derived by averaging these ten economic freedoms, with equal weight being assigned to each.
Rule of law Limited government Regulatory efficiency Open markets
LT CZ LV MK PL HU AL SK BG RO TR ME SI HR RS BiH MD RU BY UA

Capital Market Development in CESEE and the Need for Further Reform
FINANCIAL STABILITY REPORT 27 – JUNE 2014 81
4 International Initiatives Supporting Local Capital Market Development in CESEE
Further local capital market development in the CESEE region has recently become an increasingly important issue addressed by international initiatives and institutions, such as the Vienna Initiative or the EBRD’s Local Currency and Capital Markets (LC2) Development Initiative.
In the context of the European Bank Coordination (“Vienna”) Initiative (EBCI), a PublicPrivate Sector Working Group on Local Currency and Capital Market Development was established at the Athens Meeting of the EBCI Full Forum in March 2010. At its first meeting in May 2010, the Working Group set up a number of subgroups: one to look at general principles to support local currency lending and capital market development and three countryspecific subgroups covering Hungary, Romania and Serbia. One year later the Working Group published a report summarizing results and recommendations. As the reasons underlying undeveloped or less developed local currency and local capital markets can vary significantly across countries, the report suggests that a countrybycountry approach is needed to address this issue, which will also require coordination between the home and host authorities of crossborder groups. It is further noted that such coordination should complement ongoing efforts in home and host countries as well as the LC2 Initiative launched by the EBRD (for more details see below). The EBCI would be an appropriate platform for promoting this process but it has not effectively taken advantage of this fact yet. However, there are positive signs for the future, as the Vienna Initiative set priorities for 2014, among others the development of faster local funding
sources in CESEE countries (see Vienna Initiative, 2011; and IMF, 2014).
The EBRD has started an attempt to move forward under the Local Currency and Capital Markets (LC2) Development Initiative. The LC2 Initiative was launched in May 2010 and became one of the EBRD’s key strategic initiatives. The initiative aims to support and complement the actions of governments in the CESEE region with the purpose of building up local sources of domestic funding and reducing the use of foreign currency in the domestic financial system. The EBRD contributes to this effort (1) through policy dialogue in coordination with other International Financial Institutions, (2) through knowledge transfer and technical cooperation aiming at development of domestic market infrastructure and (3) through local currency funding, lending, as well as debt and equity investments. The aim is to strengthen the local investor base, especially by supporting pension funds and the insurance sector (see EBRD, 2013).
5 Conclusions
It is evident that domestic capital markets in CESEE are still less developed than in more advanced economies. As a consequence, banks are still by far the dominating financial intermediaries throughout the region. Developing domestic capital markets as an alternative next to a bankbased financial system is a longterm process. Macroeconomic stability plays an important role in this. The greater macroeconomic stability is, the more participants are present in the capital market, enhancing market liquidity. More liquid markets and larger amounts of savings present in the market improve capital allocation and therefore also contribute to capital market development. Overall, there is a need for better economic

Capital Market Development in CESEE and the Need for Further Reform
82 OESTERREICHISCHE NATIONALBANK
policies and for legal and regulatory reforms. Moreover, it is necessary to develop capital market products and the investor base domestically. The
markets need more local (institutional) investors with demand for domestic longterm instruments in local currency.
ReferencesEBRD. 2013. Local currencies, local capital markets and the EBRD. http://www.ebrd.com/pages/news/features/local_currency.shtml (2013 update retrieved on
March 4, 2014).IMF. 2014. Vienna Initiative sets priorities for 2014. Press Release No. 14/11. January 16, 2014.
http://www.imf.org/external/np/sec/pr/2014/pr1411.htm (retrieved on May 16, 2014).IMF, World Bank, EBRD and OECD. 2013. Local Currency Bond Markets – A Diagnostic
Framework. http://www.imf.org/external/np/pp/eng/2013/070913.pdf (retrieved on May 18, 2014).Magyar Nemzeti Bank. 2014. Hungary’s debt structure may be further improved. Press
release. April 24, 2014. http://english.mnb.hu/mnben_pressroom/press_releases/mnben_press-releases_2014/mnben_pressrelease_20140424 (retrieved on May 15, 2014).
Mminele, D. 2013. The importance of well-developed and functioning capital markets for growth and development. Address by Mr Daniel Mminele, Deputy Governor of the South African Reserve Bank, at the Opening Ceremony of the 1st South Africa-China Capital Market Forum conference, Johannesburg, 7 August 2013. http://www.bis.org/review/r130809c.pdf?frames=0 (retrieved on March 6, 2014).
Rojas-Suarez, L. 2014. Towards strong and stable capital markets in emerging market economies. BIS Papers No 75. http://www.bis.org/publ/bppdf/bispap75c.pdf (retrieved on February 25, 2014).
Vienna Initiative. 2011. The European Bank Coordination (“Vienna”) Initiative. Report by the Public-Private Sector Working Group on Local Currency and Capital Market Development. EBCI. http://vienna-initiative.com/wp-content/uploads/2012/08/Working-Group-on-Local-
Currency-and-Capital-Market-Development.pdf (retrieved on May 15, 2014).Yartey, C. A. 2008. The Determinants of Stock Market Development in Emerging Economies: Is
South Africa Different? IMF Working Paper WP/08/32. http://www.imf.org/external/pubs/ft/wp/2008/wp0832.pdf (retrieved on February 24, 2014).

FINANCIAL STABILITY REPORT 27 – JUNE 2014 83
1
Banking crises such as the latest financial crisis of 2008–09 have a major impact on the real economy, reveal fragilities in financial markets and shed light on (often severe) gaps in banking regulation and supervision. Obviously, during the current crisis, banks had inadequate capital and liquidity buffers to absorb shocks. At the moment, a reform of microprudential regulation is well under way within the framework first established more than 25 years ago by the Basel Capital Accord. However, recent literature on the economics of banking regulation highlights that a more innovative approach is required to deal with the three main crisis catalysts as revealed by the current financial crisis:2
• The financial system has become substantially more interconnected and complex over the last twenty years. In addition, more complex contagion
channels have emerged (e.g. derivative exposures), and shocks can now spread throughout the global financial system almost immediately.
• The adverse impact of the financial system’s inherent cyclicality on financial stability was severely underestimated.
• Many banks today are too big to fail. They cannot exit the market without causing substantial negative externalities for other financial institutions and the real economy. As a consequence, they are bailed out by the public sector if necessary.3 This implicit government guarantee leads to severe incentive problems, which in turn result in an inefficient allocation of capital and risk within the economy.
At the European level, these issues are addressed i.a. by the Bank Recovery and Resolution Directive (BRRD), the Single Resolution Mechanism (SRM), the
Macroprudential Supervision: A Key Lesson from the Financial Crisis
In this paper we argue that the introduction of macroprudential supervision constitutes the key lesson from the crisis for financial regulation and supervision. We discuss the complex legal and institutional frameworks of macroprudential supervision in Austria and in the EU. In Austria, we identify room for improving the current institutional setup, e.g. by enhancing the role of the supervisory authority and the central bank, defining a comprehensive macro-prudential strategy (including a communication strategy) and implementing an internal gover-nance structure that avoids blameshifting among the relevant institutions. At the EU level, we find that the ongoing macroprudential review should address the politico-economic challenges posed by the wide-ranging macroprudential powers of the Single Supervisory Mechanism (SSM) to ensure adequate political control. Moreover, we show that traditional microprudential instruments (e.g. Pillar 2) are conceptually ill-suited to pursue macroprudential objectives. We therefore suggest prioritizing macroprudential measures over Pillar 2 measures in the ongoing macroprudential review.
JEL classification: E58, E61, G28Keywords: Financial stability, systemic risks, macroprudential supervision, regulation, super-vision, policymaking
Judith Eidenberger, David Liebeg, Stefan W. Schmitz, Reinhardt Seliger, Michael Sigmund, Katharina Steiner, Peter Strobl, Eva Ubl1
1 All authors: Oesterreichische Nationalbank, Financial Stability and Macroprudential Supervision Division. Corresponding author: [email protected]. The authors wish to thank Susanne Steinacher (OeNB) for helpful comments and valuable language support.
2 See High Level Group on Financial Supervision in the EU (2009) and Nowotny (2013).3 For an analysis of the negative long-term financial stability effects of EU bailouts, see Posch et al. (2009).

Macroprudential Supervision: A Key Lesson from the Financial Crisis
84 OESTERREICHISCHE NATIONALBANK
Single Supervisory Mechanism (SSM), the Capital Requirements Directive IV (CRD IV) and the Capital Requirements Regulation (CRR).4 The CRD IV and the CRR are of particular importance as they introduce EUwide macroprudential supervision by offering a new set of instruments and an elaborate institutional framework to proactively address systemwide risks in the banking sector.
The objective of macroprudential supervision is to contribute to the stability of the financial system as a whole, which requires strengthening the resilience of financial intermediaries and of the financial infrastructure, and limiting the buildup of systemic risks in the economy (e.g. house price bubbles). Ultimately, macroprudential supervision aims at safeguarding the sustainable contribution of the financial sector to economic growth (ESRB, 2011). Macroprudential supervision complements microprudential supervision, monetary policy and fiscal policy.5
This paper is structured along the following lines. First, we analyze the costs of banking crises. Second, we present the legal and institutional framework of macroprudential supervision in Austria and the EU. The third section summarizes the available policy instruments, and the forth section addresses the main challenges of macroprudential impact assessments. The final section concludes.
1 Macroprudential Supervision: An Indispensable Counterpart to Microprudential Supervision
Financial crises usually entail substantial costs for the economy – in terms of both output losses and fiscal costs. Banking crises that follow excessive credit growth tend to last longer and have bigger (negative) real and fiscal impacts (Claessens and Kose, 2013) than other banking crises. Using data provided by Laeven and Valencia (2012), we derive that, on average, banking crises6 cause an output loss of 32% of GDP and fiscal costs of 8% of GDP in the first three crisis years (see the lefthand bars in chart 1). But banking crises following excessive credit growth are even more costly: They entail output losses that are more than twice as high and fiscal costs that are even three times as high (see middle bars of chart 1) as the comparable losses and costs caused by banking crises that do not follow a credit boom (righthand bars)7.
With its focus on individual banks, a pure microprudential policy framework is not able to address systemic risk adequately as it only allows supervisors to tackle idiosyncratic risk at the level of individual banks (via Pillar 2 measures)8. To deal with the increasing risk exposure in the entire banking system, supervisors would have to turn to the legislator to adapt microprudential regulation. In general, however, the
4 For an overview, see European Commission (2014a).5 For more details on complementarity and conflicts with other policy areas, see e.g. Liebeg and Posch (2011).6 The selected sample consists of 35 systemic banking crises in EFTA countries from 1977 to 2008, which is a
subsample of the data provided by Laeven and Valencia (2012). The authors define a systemic banking crisis as a situation that meets two conditions: (1) the banking system shows signs of significant financial distress (as indicated by significant bank runs, losses in the banking system and/or bank liquidations) and (2) significant banking policy intervention measures are taken in response to significant losses in the banking system.
7 Laeven and Valencia (2012) define credit boom years as years in which the deviation of the credit-to-GDP ratio relative to its trend is greater than 1.5 times its historical standard deviation and its annual growth rate exceeds 10%, or as years in which the annual growth rate of the credit-to-GDP ratio exceeds 20%.
8 Pillar 2 refers to the supervisory review that links a bank’s risk profile, risk management and risk mitigation systems to its internal capital planning.

Macroprudential Supervision: A Key Lesson from the Financial Crisis
FINANCIAL STABILITY REPORT 27 – JUNE 2014 85
legislative process takes too long for any such adaptations to be effective in due time, e.g. against a house price bubble.
With the full harmonization of EU banking regulation required under the CRD IV and the CRR, adapting national microprudential regulation to address temporary systemic risk within a Member State has become even less of an option. Macroprudential supervision, by contrast, provides some national discretion to allow Member States to identify potential systemic risk at the national level and to intervene well before it materializes. The macroprudential toolbox contains measures that reduce the probability and the impact of future banking crises.
2 Macroprudential Supervision as a Fundamental Innovation in Financial Supervision
Considering the introduction of the SSM, which aims to centralize banking
supervision at the supranational level, it might seem somewhat surprising that the primary competence in macroprudential supervision rests with the Member States. Financial cycles vary between Member States, as the crisis aptly demonstrated, and the full harmonization of EU microprudential regulation under the CRR restricts Member States’ ability to deal with this heterogeneity. This, in turn, gives rise to politicoeconomic tensions at the EU level: On the one hand, Member States should be equipped with the appropriate tools to address countryspecific systemic risk (e.g. national house price bubbles); on the other hand, such national peculiarities must not be misused to undermine the full harmonization of banking regulation across the EU. Therefore, national macroprudential supervision is embedded in a complex institutional framework at the EU level: Under certain conditions, the European Systemic Risk Board (ESRB)9, the European Banking Authority (EBA), the European Parliament, the European Commission and/or the Council have to be notified of individual macroprudential measures taken by the Member States. In some cases, these institutions have the right to object to national measures. In addition, any potential national inaction bias could be mitigated by the powers of the SSM, which, in case of inaction or insufficient action at the national level, may top up measures taken by, or even take measures in lieu of, the national designated authorities (NDAs). Moreover, the ESRB may also intervene in case of inaction by issuing recommendations and warnings.
This new legal framework has been set up to provide financial supervisors with the power and tools to address
9 The ESRB is part of the European System of Financial Supervision (ESFS). Its purpose is to oversee financial system stability in the EU. For more details on the institutional setup in Austria and the EU, see e.g. Liebeg and Trachta (2013).
% of GDP
50
40
30
20
10
0Output loss Fiscal cost
The Cost of Banking Crises
Chart 1
Source: Laeven and Valencia (2012), OeNB.
Note: Output loss is computed as the cumulative sum of the differences between actual and trend real GDP during the first three years of a crisis, expressed as a percentage of trend real GDP.
Nitou Fiscal costs are defined as the component of gross fiscal outlays related to financial sector restructuring. They include fiscal costs associated with bank recapitalizations but exclude asset purchases and direct liquidity assistance from the Treasury.
All banking crises Crises with credit boomCrises without credit boom
32
8
47
14
22
5

Macroprudential Supervision: A Key Lesson from the Financial Crisis
86 OESTERREICHISCHE NATIONALBANK
systemic risk in a timely and effective manner. The NDA, for instance, may increase capital requirements for all banks within its jurisdiction – a right that has so far been reserved to national and EU legislation. Within the framework of macroprudential supervision, public sector officials are granted the power to infringe individual property rights. As such, the new framework represents a major politicoeconomic innovation in financial supervision at the national level. Prior to the introduction of macroprudential supervision, the right to increase minimum capital requirements (and similar minimum regulatory requirements) was strictly reserved to national legislation (within EU law). To reconcile the need for timely and effective intervention in the buildup of systemic risk and the protection of property rights, the Member States developed institutional frameworks that aim at ensuring the political control of macroprudential supervision.
In this context, Austria established the Financial Market Stability Board (FMSB) in 2014. All relevant national financial stability stakeholders are represented on the FMSB: the Federal Ministry of Finance, the Austrian Fiscal Advisory Council, the Austrian Financial Market Authority (FMA) and the Oesterreichische Nationalbank (OeNB). The FMSB may issue recommendations to the FMA, release warnings on questions of systemic risk and publish its decisions and warnings. The FMA is the Austrian NDA, but the Ministry of Finance has to formally approve most macroprudential measures the FMA takes. The OeNB plays a pivotal role within the Austrian macroprudential supervision framework. It is responsible
for identifying prospective systemic risk and for providing the analytical underpinning of macroprudential measures (including impact assessments of policy measures). In addition, it provides the secretariat to the FMSB.
These rather complex decisionmaking structures aim at ensuring accountability, legitimacy and transparency in the face of such extensive powers.10 The dominant role of the Ministry of Finance is intended to ensure the political control of independent institutions like the OeNB and the FMA. Accountability and transparency are increased by the fact that the FMSB reports to Parliament. However, we regard these safeguards as incomplete. To become more transparent and effective, the FMSB should develop a comprehensive communication strategy. This includes making its deliberations public by issuing regular press statements and the minutes of its meetings, providing information about its regular assessments of key risks and giving reasons for or against taking action. Even then, the FMSB’s complex structure and composition might induce an additional inaction bias and allow for blameshifting among the relevant players. To mitigate this risk, a clear internal governance structure including the aforementioned communication strategy is called for.11 Finally, assigning a more prominent role to the central bank and the supervisory authority would align Austria’s institutional framework for macroprudential supervision with the respective ESRB recommendation and international best practice. Currently, the FMA and the OeNB each nominate only one of six members to the FMSB, while the Ministry of Finance nomi
10 See IMF (2013).11 Here we draw on the recommendations the Financial Stability Board (FSB) made in its peer review on macro-
prudential supervision in Germany, which has a very similar institutional structure (FSB, 2013).

Macroprudential Supervision: A Key Lesson from the Financial Crisis
FINANCIAL STABILITY REPORT 27 – JUNE 2014 87
nates two, which are the FMSB chair and vicechair (with a casting vote). The Ministry of Finance also nominates one member of the Fiscal Advisory Council to participate in the FMSB, while the sixth FMSB member is the chair of the Fiscal Advisory Council.
3 Challenging Objective Requires Comprehensive Set of Instruments
Macroprudential supervision is still in the early stages of development.12 Currently, its main focus is on the banking sector, although its scope is wider. Its ultimate objective of ensuring financial stability is to be reached via five intermediate objectives (ESRB, 2013):• mitigating excessive credit growth,
which is a key driver of financial crises, and reducing leverage, which is a crisis amplifier,
• avoiding excessive maturity mismatches that cause unstable funding,
• preventing direct and indirect exposure concentrations to reduce vulnerabilities to common shocks,
• addressing negative incentives that lead to moral hazard, and
• strengthening the resilience of financial market infrastructures.
To avoid situations in which individual instruments become subject to conflicting intermediate objectives, macroprudential supervisors aim at having at least one instrument at their disposal to tackle each of these intermediate objectives. Consequently, effective macroprudential supervision is based on a comprehensive and complementary set of instruments. Some of these e.g. address banks’ balance sheet structure by requiring higher capital buffers. Oth
ers put limits on the terms and conditions governing new loans, e.g. by defining maximum values for loantovalue and loantoincome ratios. Finally, macroprudential supervisors may address inappropriate incentive structures by capital surcharges and stricter public disclosure requirements.
The key instruments in this context are probably the different types of capital buffers specified in the CRD IV: the countercyclical capital buffer (CCB), the global systemically important institutions (GSII) buffer, the other systemically important institutions (OSII) buffer and the systemic risk buffer (SRB). In Austria, this capital buffer regime is transposed into national law by Articles 23 to 23d Austrian Banking Act. What these capital buffers have in common is that they are applied on top of the minimum capital requirements and that they must be held in core equity tier 1 (CET1) capital. In principle, they can also be combined; however, there are certain limitations to such combinations to ensure a floor or cap on the aggregate impact of macroprudential measures on specific credit institutions, both at the consolidated and subsidiary levels.13 If a credit institution fails to meet its combined buffer requirement, restrictions on dividend payouts will apply and a capital conservation plan has to be prepared.
The CCB (Article 130 CRD IV) is designed to smooth the pronounced cyclicality in the financial system. During a phase of excessive credit growth, additional capital requirements can be imposed on banks, which are then released again during a phase of weak credit supply. The CCB aims at damp
12 Nevertheless, a number of Member States have already announced or imposed measures of macroprudential super-vision (e.g. Belgium, Croatia, the Netherlands and Sweden). See Box 3 – Overview of Macroprudential Measures in the EU, in this issue.
13 See ESRB (2014b) for more details on tools addressing systemically important banks and structural systemic risks.

Macroprudential Supervision: A Key Lesson from the Financial Crisis
88 OESTERREICHISCHE NATIONALBANK
ening excessive credit growth during an upturn and at avoiding excessive credit supply restrictions during a downturn. The competent authorities have to follow a set of principles and calculate a reference rate as a benchmark to guide their judgment in determining whether credit growth is excessive. According to this benchmark, the CCB will usually be set at a rate of between 0% and 2.5% of riskweighted assets, but it could be higher than that under certain circumstances.
The GSII and the OSII buffers (Article 131 CRD IV) apply to credit institutions which are systemically important at the global or domestic level, respectively. Shocks to such institutions are likely to cause contagion within the respective financial system and to produce serious negative consequences for the real economy. As of 2016, it will be possible to set the capital surcharge for GSIIs at between 1% and 3.5% of riskweighted assets. The introduction of the OSII buffer empowers authorities to impose capital charges of up to 2% on systemically important institutions that are not identified as GSIIs. To promote common supervisory practice, the EBA will publish guidelines on how to identify OSIIs.
The SRB (Article 133 CRD IV) addresses structural systemic risks. It can be applied to all banks or to a subset of banks starting from 2014. It does not have a cap. If imposed, its capital surcharge is at least 1% of riskweighted assets. Capital surcharges that exceed 3% need to be authorized by the European Commission, however.
Finally, Article 458 CRR empowers NDAs to raise microprudential requirements if systemic risk increases and is found to have the potential to seriously damage the real economy. However, Article 458 CRR requires an explanation as to why such measures are deemed to
be suitable, effective and proportionate. Microprudential requirements may only be raised if all other available measures are found to inadequately address the specific source of systemic risk. Strict notification, consultation and nonobjection procedures apply, depending on the nature and calibration of the respective measure, and involving authorities such as the EU Council, the EBA, the ESRB, the European Parliament and the European Commission. Moreover, Articles 124 and 164 CRR allow macroprudential supervisors to set higher risk weights (up to 150%) in the standardized approach and stricter loss given default (LGD) parameters in internal ratingsbased (IRB) models for exposures secured by mortgages on immovable property.
In addition to the above measures, the Pillar 2 instruments under Basel III may be tightened if a credit institution is found to pose systemic risks. Pillar 2 should ensure that banks prudently model their capital requirements on the basis of the risks they face; but no matter how prudent banks’ models are, they will not be able to capture the systemic risk that emanates from banks themselves. To address systemic risks via Pillar 2 measures, a thorough Pillar 2 assessment would have to be conducted for each bank individually; this causes “red tape” (high administrative cost for both banks and supervisors). The politicoeconomic checks and balances required for macroprudential supervision are not in place for Pillar 2 measures, however. Pillar 2 measures are imposed by banking supervisors for individual banks.
The communication of macroprudential policy to the public is an important tool in itself. In fact, most macroprudential measures are announced publicly, while the reasoning behind Pillar 2 measures and the underlying

Macroprudential Supervision: A Key Lesson from the Financial Crisis
FINANCIAL STABILITY REPORT 27 – JUNE 2014 89
individual bank data are confidential. Still, the ongoing macroprudential review (Article 513 CRR) should, in principle, aim at maintaining the availability of Pillar 2 measures for reaching macroprudential objectives. But it should be ensured that Pillar 2 does not restrict the implementation of other macro prudential instruments (i.e. SRB, Article 458 CRR).
In addition to the macroprudential instruments covered by EU law, Member States may implement macroprudential instruments under national law (ESRB, 2014a). These include instruments such as defining maximum loantovalue (LTV) and loantoincome (LTI) ratios as well as imposing leverage ratio restrictions. At the current juncture, however, Austrian law does not provide for such instruments – a major shortcoming in Austria’s macroprudential framework. A differentiated macroprudential toolbox would have the major advantage of making macroprudential policy efficient because these tools are flexible and allow targeted application.
Notwithstanding all of the above, macroprudential supervision faces the following challenges:• Forwardlooking risk identification is
methodologically difficult.• Some of the data necessary for pro
spective risk identification are not available, and some of the available time series are relatively short. In Austria, for instance, LTV and LTI data have not been collected so far; the collection of these data should be started as soon as possible.
• Macroprudential measures might potentially be circumvented via the shadow banking sector.
Historical experience with previous instruments targeting systemic risk is mixed. In Austria, traditional instruments aimed at allocating loans to productive investment rather than consumption were quite successful in the 1970s and 1980s.14 Experience in other countries is more mixed.15 In the early stages of the present crisis the Spanish approach, which relied on dynamic provisioning, was first hailed as a success story. A few years later, the collapse of the Spanish banking sector led to a sovereign debt crisis.16 Given the abovementioned challenges and historical experience, we would advise against considering macroprudential supervision a cureall; it adds important instruments to responsible financial supervision, however.
Macroprudential measures are flexible and efficient in the sense that they are applied only if and as long as necessary, i.e. if a specific systemic risk is identified. Their calibration aims at reflecting the degree of systemic risk. They can be targeted at banks and/or on and offbalance sheet positions exposed to the identified systemic risk.
4 The Costs and Benefits of Macroprudential Regulation
Even if a threat to systemic risk is identified, a comprehensive impact assessment is required to ensure that the benefits of any riskmitigating measure outweigh its costs. Evaluating the impact of potential macroprudential measures is a demanding task, which requires sophisticated models, reliable data and expert judgment. It is essential that the methodology, assumptions and data used in an impact assessment are made transparent to allow for evidencebased
14 See Mooslechner et al. (2007). 15 See Elliot et al. (2013), IMF (2013). 16 See White (2013).

Macroprudential Supervision: A Key Lesson from the Financial Crisis
90 OESTERREICHISCHE NATIONALBANK
decisionmaking (Kopp et al., 2010; Ittner and Schmitz, 2013).
Assessing CostsAssessing the cost of macroprudential measures aims not only at quantifying the direct cost of these measures for banks, but also at gauging their macroeconomic impact. The following section discusses issues that play a role when assessing the costs of raising the capital requirements for banks – a key macroprudential measure.
First of all, the term “costs” requires a careful definition. It is crucial to distinguish between private costs (of refinancing incurred by banks) and social costs (the sum of private costs plus externalities). The redistribution of costs within society does not constitute additional social costs. For instance, if the toobigtofail (TBTF) problem is addressed effectively, banks’ debt financing costs increase.17 From the point of view of banks, their private costs go up. But social costs do not increase because the government’s contingent liability is reduced accordingly. They might even decrease as the welfare loss caused by the TBTFrelated moral hazard problem is addressed.
Another example draws on the impact of taxation on leverage and private costs. Higher capital requirements aim at reducing banks’ leverage. Banks will have to replace debt by capital (assuming constant riskweighted assets). On the
one hand, this raises banks’ private costs, part of which consist of higher tax payments as the costs of capital – unlike the costs of debt – are not tax deductible. On the other hand, these higher tax payments constitute budget revenues and as such do not increase social costs.
Second, an economic impact assessment has to distinguish carefully between those adjustments in banks’ balance sheets that are merely a response to market expectations and those that actually result from regulatory reform.18
Third, substitution effects in the financing of the real economy should be considered. Higher credit cost for corporates and private households may be a consequence of banks’ increasing funding cost. However, banks’ rising interest margins should not be translated directly into higher longterm interest rates for the real economy because the real economy might be able to substitute bank loans by other sources of finance (e.g. direct access to debt and equity markets, internal funding and supplier credit).19
Fourth, secondround effects of regulatory reform need to be taken into consideration, e.g. the reaction of banks’ debt financing costs to lower leverage and banks’ behavioral adjustment to regulation are further aspects which impact macroeconomic cost estimates. Both need to be based on careful empirical analysis.
After identifying banks’ private costs of higher capital requirements, we esti
17 The TBTF problem arises if bond holders of a TBTF bank expect the government to bail out this bank if it is insolvent or illiquid. For the bank in question, this implicit government guarantee translates into lower debt financing costs at any given level of capitalization. As the bank is considered TBTF, the government would be expected to bail it out in case the bank runs into trouble, which constitutes a contingent liability for the govern-ment (see the experience of Ireland and Spain during the crisis).
18 Before the current financial crisis, e.g., banks with a core tier 1 (CT1) ratio of 6% were considered well capitalized. With the beginning of the crisis in late 2008 – i.e. even before Basel III became effective – market expectations of an adequate CT1 ratio rose to ratios closer to 10%.
19 From a macroprudential perspective, high credit growth associated with interest rates that do not cover credit and liquidity risk is not an economic policy objective. For a discussion of deleveraging, see Eidenberger, J., S. W. Schmitz and K. Steiner. 2014. The Priorities of Deleveraging in the Euro Area and Austria and Its Implications for CESEE, in this issue.

Macroprudential Supervision: A Key Lesson from the Financial Crisis
FINANCIAL STABILITY REPORT 27 – JUNE 2014 91
mate their macroeconomic impact on the basis of the OeNB’s macroeconomic model. To avoid misrepresenting rises in banks’ private cost as rises in social cost, we incorporate the offsetting effects discussed above into our macroeconomic model. As a result, the impact of individual macroprudential measures on macroeconomic variables like economic growth, employment and budget revenue can be quantified.
Assessing Benefits
The social cost of macroprudential measures is then compared to their social benefits, which are quantified by estimating the reduced likelihood and magnitude of financial crises. The potential negative impact on economic growth caused by the higher cost of credit can then be set in relation to the benefits of a more stable financial system, more sustainable funding for the real economy and more sustainable growth.
Chart 2 illustrates the principles of an impact assessment by drawing on the example of a hypothetical activation of the CCB in 2005. The straight dotted line depicts the precrisis Austrian GDP trend projection (based on quarterly data from 1995 to 2005). The solid line depicts the actual GDP path. It shows that as from the beginning of 2005, economic growth exceeded trend growth. However, at the end of 2008, quarterly GDP went down sharply following the collapse of Lehman Brothers. Since then, economic growth in Austria has remained significantly below its precrisis trend. For illustrative purposes, we engage in a thought experiment: We assume the CCB had been available and activated prior to 2005 and released again in December 2008. We further assume that it would have effectively increased loan margins, reduced loan growth and economic growth before the outbreak of the crisis and improved economic performance
EUR billion
72,000
70,000
68,000
66,000
64,000
62,000
60,000
58,000
56,000
54,000
52,000Q2 03 Q2 04 Q2 05 Q2 06 Q2 07 Q2 08 Q2 09 Q2 10 Q2 11 Q2 12 Q2 13
Hypothetical CCB Activation in 2005: Stylized Cost-Benefit Analysis for Austria
Chart 2
Source: OeNB.
Note: The precrisis trend from which the projection for Austrian GDP was derived was calculated using a Hodrick-Prescott filter. The trend estimate is based on quarterly GDP data for the period from the first quarter of 1995 to the first quarter of 2005.
Trend GDP Austria
Additional (unsustainable) economic growth
GDP Austria Estimated normal business cycle
Output loss caused by financial crisisg Macroprudential objective: loss mitigation
Macroprudential Supervision: A Key Lesson from the Financial Crisis
92 OESTERREICHISCHE NATIONALBANK
afterward.20 The outcome of our assumption is depicted by the dotted curve in chart 2. We chose an approximation of a “normal” Austrian business cycle (i.e. without a banking crisis)21, because macroprudential supervision does not aim at eliminating business cycles. By doing so, we derive the costs and benefits of macroprudential policy measures. Their shortterm costs comprise the loss of unsustainable economic growth during the precrisis credit boom (green area in chart 2); their benefits are that the probability of a banking crisis and its potential impact are reduced and that the resilience of the financial system is increased (red area in chart 2).
Benefits Outweigh Costs
A comprehensive impact assessment compares the estimates of the costs and benefits of proposed measures to quantify their net effect. Kopp et al. (2010) conclude that the benefits of banking regulation in Austria outweigh its costs. In a metastudy on this issue, the Basel Committee on Banking Supervision concludes that, on average, a 1 percentage point increase in the capital adequacy ratio reduces GDP growth by 0.04 percentage points (MAG, 2010). Moreover, it estimates that (under the assumption of permanent welfare losses induced by crises) reducing the probability of a crisis by 1 percentage point increases longterm economic growth by 0.6 percentage points (BCBS, 2010).
Furthermore, Kopp et al. (2010) demonstrate that the cost of banking regulation is lower for banks whose
liquidity situation is more solid and which are better capitalized, have lower returnonequity targets and are more flexible in adjusting their operative cost base to changing environments.
5 ConclusionsThe introduction of macroprudential supervision constitutes a key lesson from the crisis for financial regulation and supervision. Macroprudential supervision offers a new set of instruments and an elaborate institutional framework to proactively address systemic risk within the financial system. The new instruments specified in the CRD IV and the CRR constitute the cornerstones of macroprudential supervision.
Great supervisory powers require democratic checks and balances. The respective institutional framework in Austria aims at balancing the need for timely action and that for accountability, transparency and legitimacy. This requires a comprehensive communication strategy that provides for information on regular assessments of key risks and explains the reasons for or against taking action. The Financial Market Stability Board (FMSB) should have a clear internal governance structure to reduce the risk that blameshifting may take place among the players involved on the back of complex decisionmaking structures. Moreover, the dominance of the Ministry of Finance in macroprudential supervision is at odds with the respective ESRB and IMF recommendations and with international best practice. A more prominent role of the supervisory authority and central bank should be ensured.
20 At least, these are the objectives of the CCB. Nevertheless, the impact of higher capital requirements on the weighted average cost of capital is subject to controversy; similarly, their effects on loan margins, loan demand and economic growth are hard to prove empirically (e.g. SNB, 2014). For the purpose of this illustration, how-ever, we simply assume these effects.
21 Our approximation is based on the average duration and magnitude of the last three business cycles.
Macroprudential Supervision: A Key Lesson from the Financial Crisis
FINANCIAL STABILITY REPORT 27 – JUNE 2014 93
Pillar 2 of the Basel capital accord is found to be illsuited for macroprudential supervision. It is designed to capture the risks banks are exposed to, but not the systemic risk that emanates from banks themselves. To effectively address systemic risk, a thorough Pillar 2 assessment would have to be conducted for each bank individually; such assessments cause high administrative costs for both banks and supervisors. The politicoeconomic safeguards required for macroprudential super vision are not in place for Pillar 2 measures.
Macroprudential supervision is flexible and efficient in the sense that it is applied only if, and for as long as,
necessary, i.e. when a systemic risk is identified. The calibration of macroprudential measures aims at reflecting the degree of systemic risk. They can target banks and/or on and offbalance sheet positions that are exposed to specific risks. Despite adding substantial new powers and instruments to the super visory toolbox, macroprudential supervision also faces substantial challenges and should not be considered a cureall.
Finally, this paper discusses a number of challenges related to regulatory impact assessments that can have a substantial influence on assessment results.
6 ReferencesBCBS. 2010. An assessment of the long-term economic impact of stronger capital and liquidity
requirements. Basel. August.Brunnermaier, M., A. Crocket, C. Goodhart, A. D. Persaud and H. Shin. 2009. The
Fundamental Principles of Financial Regulation. Geneva Reports on the World Economy 11.Claessens, S. and M. A. Kose. 2013. Financial Crises: Explanations, Types, and Implications. IMF
Working Paper 13/28.Elliot, D. J., G. Feldberg and A. Lehnert. 2013. The History of Cyclical Macroprudential
Policy in the United States. In: Finance and Economics Discussion Series Divisions of Research & Statistics and Monetary Affairs. 2013-29. Federal Reserve Board. Washington, D.C.
ESRB. 2011. Recommendation of the ESRB of 22 December 2011 on the macroprudential mandate of national authorities (ESRB/2011/3). OJ 2012/C 41/01.
ESRB. 2014a. Flagship Report on Macro-prudential Policy in the Banking Sector.ESRB. 2014b. ESRB Handbook on Operationalising Macro-prudential Policy in the Banking Sector.European Commission. 2014a. A reformed financial sector for Europe. COM(2014) 279 final.European Commission. 2014b. Banking union: restoring financial stability in the Eurozone.
Memo of 15 April 2014. FSB – Financial Stability Board. 2014. Peer Review of Germany. Review Report. 9 April 2014.
https://www.financialstabilityboard.org/publications/r_140409.pdf (retrieved on June 22, 2014).High Level Group on Financial Supervision in the EU. 2009. Report. http://www.esrb.europa.eu/shared/pdf/de_larosiere_report_en.pdf?062127764c08107c22350
6712d1a133e (retrieved on June 22, 2014).IMF. 2013. Key aspects of macroprudential policy. http://www.imf.org/external/np/pp/eng/2013/061013b.pdf (retrieved on June 22, 2014).Ittner, A. and S. W. Schmitz. 2013. Die Kosten der Bankenregulierung. In: Wirtschaftspolitische
Blätter 4/2014. 673–89.Kopp, E., C. Ragacs and S. W. Schmitz. 2010. The Economic Impact of Measures Aimed at
Strengthening Bank Resilience – Estimates for Austria. In: Financial Stability Report 20. 90–119.

Macroprudential Supervision: A Key Lesson from the Financial Crisis
94 OESTERREICHISCHE NATIONALBANK
Laeven, L. and F. Valencia. 2012. Systemic Banking Crises Database: An Update. IMF Working Paper 12/162.
Liebeg, D. and A. Trachta. 2013. Macroprudential Policy: A Complementing Pillar in Prudential Supervision – The EU and Austrian Frameworks. In: Financial Stability Report 26. 56–61.
Liebeg, D. and M. Posch. 2011. Macroprudential Regulation and Supervision: From the Identification of Systemic Risks to Policy Measures. In: Financial Stability Report 21. 67–83.
MAG. 2010. Assessing the macroeconomic impact of the transition to stronger capital and liquidity requirements. Basel. August.
Mooslechner, P., S. W. Schmitz and H. Schubert. 2007. From Bretton Woods to the Euro: the Evolution of Austrian Monetary Policy from 1969 to 1999. In: Mooslechner, P., S. W. Schmitz and H. Schubert (eds.). From Bretton Woods to the Euro – Austria on the Road to European Integration. OeNB. 21–44.
Nowotny, E. 2013. The economics of financial regulation. In: Dombret, A. and O. Lucius (eds.). Stability of the Financial System: Illusion or Feasible Concept? Cheltenham, UK, Northampton, MA: Edward Elgar. 308–328.
Posch, M., S. W. Schmitz and B. Weber. 2009. EU Bank Packages: Objectives and Potential Conflicts. In: Financial Stability Report 17. 63–84.
SNB. 2014. Antrag der Schweizerischen Nationalbank auf Erhöhung des antizyklischen Kapital-puffers. Press release by the Swiss National Bank. January 23.
White, W. 2013. Summary Presentation “Borders of Macroprudential Policy”. Presentation at the First IMF Financial Stability and Systemic Risk Forum. Washington D.C. March 8.
http://williamwhite.ca/sites/default/files/IMFSummaryPres_v4.pdf (retrieved on June 22, 2014).

FINANCIAL STABILITY REPORT 27 – JUNE 2014 95
The financial and economic crisis that started in summer 2007 has shown that macroprudential supervision and regulation need to be significantly expanded. As a consequence, national and supranational authorities have reinforced their efforts in macroprudential supervision. However, considerable gaps remain in the analytical underpinnings of macroprudential supervision and regulation (see ECB, 2012).1
In Austria, for instance, supervisory data reported by banks fail to capture the riskbearing capacity of households and, as a consequence, of the banking system, as these data lack indepth in
formation on mortgage and consumption loans taken out by households. Therefore, using data from the Household Finance and Consumption Survey (HFCS) in macroprudential analysis represents an opportunity for gaining a comprehensive understanding of the vulnerabilities of Austrian households and banks. Coordinated by the European Central Bank (ECB), the HFCS is the first euro areawide household survey that covers the entire balance sheet of households. In particular, it includes detailed information on all types of assets and debt (ECB, 2013a; ECB, 2013b).
Refereed by: Mario Quagliarello (European Banking Authority)
Risk-Bearing Capacity of Households – Linking Micro-Level Data to the Macroprudential Toolkit
This paper aims to enhance the macroprudential risk assessment of households by integrating micro-level data, namely data from the Household Finance and Consumption Survey (HFCS), into the assessment. As opposed to data reported under the supervisory framework, HFCS data include detailed information on the debt and wealth of Austrian households. This paper outlines three examples of how HFCS data can improve the macroprudential toolkit.
(1) We improve the credit risk parameters in retail models used in OeNB macroeconomic stress tests by incorporating household vulnerability simulations. Vulnerability is modeled based on a combination of four macroeconomic shocks (changes in the unemployment rate, changes in income, changes in short- and long-term interest rates and appreciations of foreign currencies). In the most severe stress scenario, the probability of default (PD) of performing household exposures increases by 2.3 percentage points. (2) We analyze the debt-to-income (D/I) ratio of foreign currency debt holders as a measure of risk-bearing capacity and find that D/I ratios are unevenly distributed among these households. About 20% of foreign currency debt holders have a rather poor risk-bearing capacity in terms of income reserves and carry more than 80% of the loss potential of Swiss franc-denominated loans. (3) We use the HFCS data’s singular quality of allowing the calculation and presentation of initial and c urrent loan-to-value (LTV) ratios to show that initial LTV ratios have a positive relation with debt service-to-income ratios and with the term of a loan, but a negative relation with income.
JEL classification: D10, D14, E44, G10, G21Keywords: Macroprudential risk assessment, household vulnerability, stress tests, loan-to-value ratio, HFCS
Nicolás Albacete, Judith Eidenberger, Gerald Krenn, Peter Lindner, Michael Sigmund1
1 Oesterreichische Nationalbank, Economic Analysis Division, [email protected] and [email protected]; Supervision Policy, Regulation and Strategy Division, [email protected]; Financial Stability and Macro-prudential Supervision Division, [email protected] and [email protected]. The views expressed in this paper are exclusively those of the authors and do not necessarily reflect those of the OeNB or the Eurosystem. The authors would like to thank the referee as well as Pirmin Fessler, Claus Puhr, Vanessa Redak, Martin Schneider and Christoph Siebenbrunner (all OeNB) for helpful comments and valuable suggestions.

Risk-Bearing Capacity of Households – Linking Micro-Level Data to the Macroprudential Toolkit
96 OESTERREICHISCHE NATIONALBANK
This paper contributes to the literature by integrating two research fields: (1) the micro (survey) based analysis of household vulnerability on the one hand and (2) macro prudential analysis based on super visory data on the other. As the two fields tend to use the same terminology but apply it differently, it is necessary to present the differences in termi nology first (section 1). This paper aims to improve the estimation of credit risk parameters in retail models used in the OeNB’s macroeconomic stress tests by including HFCSbased simu lations. These simulations rest upon the scenarios defined in the stress test run under the Financial Sector Assessment Program (FSAP) conducted by the IMF in Austria in 2013 (see IMF, 2014, and Feldkircher et al., 2013). These scenarios are also presented in section 1.
In section 2 we focus on the micro side of our analysis, i.e. the modeling of household vulnerability and changes therein due to macroeconomic developments. In particular, the simulation includes the effect of four different shocks – changes in the unemployment rate, income changes, changes in short and longterm interest rates and appreciations of foreign currencies – on households’ financial margin.
Section 3 gives an overview of where HFCS data can be used for macroprudential analysis. First of all, we present the integration of micro simu lation output into macroeconomic stress tests. Second, we analyze the riskbearing capacity of foreign currency loan holders based on HFCS data. Third, we derive loantovalue (LTV) information of mortgage hold ers from HFCS data. Section 4 concludes.
1 Terminology and ScenariosIn this section we introduce definitions of the basic terminology and discuss stress test scenarios.
1.1 Comparison of Basic
Terminology
There are key differences in the terminology used in the supervisory framework (SF) and the terminology in the literature on household vulnerability (HH).2 To avoid ambiguities and misinterpretations, this section gives an overview of some widely used concepts and provides clear definitions of how technical terms (probability of default, share of exposure to vulnerable households, loss given default) are used further down.
Setting up our methodological framework, we define four sets of households that are observed in the survey. The set of all households is denoted by T. All indebted households are contained in set D. All vulnerable indebted households are in set V. And all vulnerable indebted households with debt exceeding their assets are in set A. Thus, A⊆V ⊆ D⊆ T .
First we need a concept to measure the vulnerability of households. The standard in the literature is a probabilistic framework (e.g. probability of default, PD). In the HH framework, the following binary classification is used. PD(HH) can be defined as follows: PDi = 1 if household i is classified as vulnerable.3 These households are summarized in set V. For all indebted households that are not in V, PDi = 0.
In the supervisory framework, the PD of a household refers to the probability that a household defaults within one year. A loan is defaulted if one of the default criteria under Basel II are met: full repayment unlikely and/or
2 These vulnerability analyses and micro simulations are based on household-level information.3 The definition of vulnerable households is given in section 2.

Risk-Bearing Capacity of Households – Linking Micro-Level Data to the Macroprudential Toolkit
FINANCIAL STABILITY REPORT 27 – JUNE 2014 97
interest or principal payments on a material exposure more than 90 days past due. If PDi = 1, the household has already defaulted. For nondefaulted households the PD lies in the open interval (0,1) and is assigned to all households in set D.
In the literature on household vulnerability, exposure at risk is a very important term. It gives an estimate of the aggregate level of household liabilities that may turn into loans that cannot be repaid. However, to avoid any mixup with the supervisory term “exposure at default” we introduce a different term: share of exposure to vulnerable households (SEvH),
SEvH = i∈V∑ Debti
i∈D∑ Total Debti.
In the supervisory context, loans belonging to the SEvH will most likely be classified in the bad rating categories (i.e. have high PDs) of banks.
Finally, the micro databased literature on vulnerable households defines loss given default (LGD) as follows: For all households i in set A the following ratio is calculated to approximate the losses of banks caused by vulnerable households:4
LGD = i∈A∑ Debti − Assetsi( )i∈D∑ Total Debti
The LGD in the supervisory context specifies the proportion of a loan expo
sure that will be lost (i.e. will not be recoverable) under the assumption that the borrower defaults. The LGD represents a credit risk parameter that is used for determining a bank’s capital requirement under the internal ratingsbased (IRB) approach of Basel II.
1.2 Scenarios
The input for the different scenarios in the stress testing exercise is a combination of international benchmarks and the OeNB forecasting model. We take the following realworld example from previous rounds of stress tests in Austria (table 1) to achieve a clear understanding of the differences in the use of information at the micro level. All the scenarios are hypothetical and no probabilities are attached to the changes of each indicator.
The various scenarios are based on different time frames. For scenarios 1 and 2 (which were used in the FSAP in 2013) the last observed data are from the fourth quarter of 2012, so the first and second years of the scenario refer to 2013–2014. We include scenario 3 in order to see the changes resulting from a more severe recession given by a larger assumed reduction of GDP. This scenario is based on the assumptions of the macro stress testing model in 2010, so that the last observed data are from the fourth quarter of 2009, and the first and second year changes refer to 2010 and 2011.5
In the baseline scenario (scenario 1), the GDP growth rate in year one is assumed to be 1.1% and increases in
4 Depending on which assets are taken into account, one can define alternative LGD measures. In addition to the LGD measure presented here (where all assets of each household are taken into account), for the micro simulations below we additionally use an alternative LGD measure that only takes into account housing wealth:
LGD = i ∈A∑ Debti − Housing wealthi
i∈D∑ Total Debti
5 The forecast path of the exchange rate does not change from scenario 2 to scenario 3 since the scenario at the time it was used in the stress test model in 2010 did not include the modeling of exchange rate developments. Here we use the development shown in scenario 2.
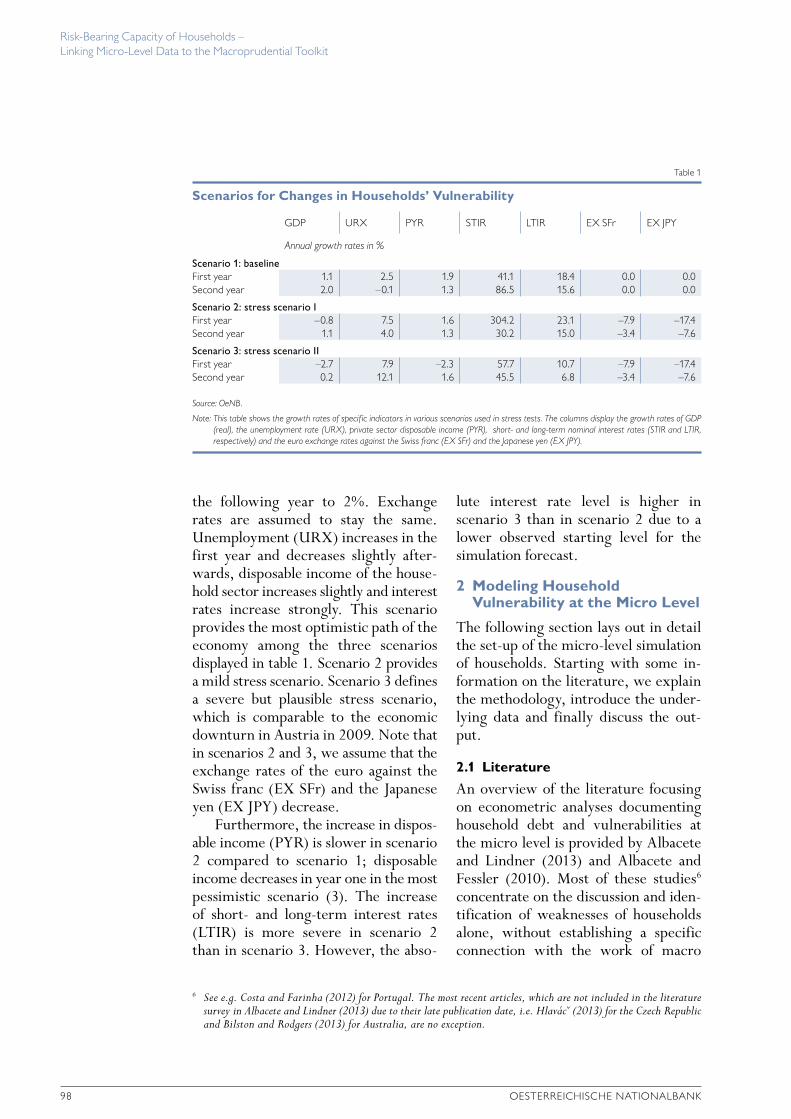
Risk-Bearing Capacity of Households – Linking Micro-Level Data to the Macroprudential Toolkit
98 OESTERREICHISCHE NATIONALBANK
the following year to 2%. Exchange rates are assumed to stay the same. Unemployment (URX) increases in the first year and decreases slightly afterwards, disposable income of the household sector increases slightly and interest rates increase strongly. This scenario provides the most optimistic path of the economy among the three scenarios displayed in table 1. Scenario 2 provides a mild stress scenario. Scenario 3 defines a severe but plausible stress scenario, which is comparable to the economic downturn in Austria in 2009. Note that in scenarios 2 and 3, we assume that the exchange rates of the euro against the Swiss franc (EX SFr) and the Japanese yen (EX JPY) decrease.
Furthermore, the increase in disposable income (PYR) is slower in scenario 2 compared to scenario 1; disposable income decreases in year one in the most pessimistic scenario (3). The increase of short and longterm interest rates (LTIR) is more severe in scenario 2 than in scenario 3. However, the abso
lute interest rate level is higher in scenario 3 than in scenario 2 due to a lower observed starting level for the simulation forecast.
2 Modeling Household Vulnerability at the Micro Level
The following section lays out in detail the setup of the microlevel simulation of households. Starting with some information on the literature, we explain the methodology, introduce the underlying data and finally discuss the output.
2.1 Literature
An overview of the literature focusing on econometric analyses documenting household debt and vulnerabilities at the micro level is provided by Albacete and Lindner (2013) and Albacete and Fessler (2010). Most of these studies6 concentrate on the discussion and identification of weaknesses of households alone, without establishing a specific connection with the work of macro
Table 1
Scenarios for Changes in Households’ Vulnerability
GDP URX PYR STIR LTIR EX SFr EX JPY
Annual growth rates in %
Scenario 1: baselineFirst year 1.1 2.5 1.9 41.1 18.4 0.0 0.0Second year 2.0 –0.1 1.3 86.5 15.6 0.0 0.0
Scenario 2: stress scenario IFirst year –0.8 7.5 1.6 304.2 23.1 –7.9 –17.4Second year 1.1 4.0 1.3 30.2 15.0 –3.4 –7.6
Scenario 3: stress scenario IIFirst year –2.7 7.9 –2.3 57.7 10.7 –7.9 –17.4Second year 0.2 12.1 1.6 45.5 6.8 –3.4 –7.6
Source: OeNB.
Note: This table shows the growth rates of specif ic indicators in various scenarios used in stress tests. The columns display the growth rates of GDP (real), the unemployment rate (URX), private sector disposable income (PYR), short- and long-term nominal interest rates (STIR and LTIR, respectively) and the euro exchange rates against the Swiss franc (EX SFr) and the Japanese yen (EX JPY).
6 See e.g. Costa and Farinha (2012) for Portugal. The most recent articles, which are not included in the literature survey in Albacete and Lindner (2013) due to their late publication date, i.e. Hlavác (2013) for the Czech Republic and Bilston and Rodgers (2013) for Australia, are no exception.

Risk-Bearing Capacity of Households – Linking Micro-Level Data to the Macroprudential Toolkit
FINANCIAL STABILITY REPORT 27 – JUNE 2014 99
models or other sectors of the economy. One noticeable exception is Andersen et al. (2008), who elaborate a potential setup for the integration of microlevel information into the macro stress testing model. On the household side they use – similar to the approach in this paper – information from macromodel forecasts together with microlevel information (survey and register data) for households in order to estimate the rate of vulnerable households and debt at risk, which feed back into the banking model.7 In what follows we propose a methodology for using available microlevel information for macro stress testing models in macroprudential analyses for Austria.
2.2 Methodology
Following Albacete and Fessler (2010), we define the financial margin FMi of a household i as
FMi = Yi − BCi − DSi (1)
where Yi is disposable household income, BCi is basic consumption and DSi is debt service. Financial margins are therefore a continuous measure of how well a household is able to make ends meet.
In order to focus on potentially vulnerable households and to see whether they can pose a threat to the stability of the Austrian financial market, we define a household as vulnerable if it has a negative financial margin (FMi<0) and as not vulnerable otherwise (FMi ≥ 0). The probability of default PDi is then defined as:
PDi =1 if FMi < 0
0 if FMi ≥ 0
⎧⎨⎪
⎩⎪
Thus, PDi is a binary variable that can take only the values 0 or 1 and, therefore, in our model the percentage of vulnerable households equals the mean probability of default, which is the key measure to monitor the resilience of households under different shocks.
Four types of shocks are modeled: changes in the unemployment rate, income changes, changes in the shortterm and longterm interest rates and appreciations of foreign currencies.
The unemployment shock is simulated using the same model as Albacete and Fessler (2010). We use a method that ensures that those employed individuals that have a higher probability of becoming unemployed have a higher chance of being drawn into the sample of newly unemployed individuals than those with a lower unemployment probability (for details, see Albacete and Fessler, 2010). An employment shock results in a decrease of disposable income (Yi in equation (1)) and, consequently, of the financial margins of the household hit by the shock.
The income shock is modeled via a reduction of income of all households (Yi in equation (1)). Unlike the unemployment shock, the income reduction affects all households equally. We use this shock to cover the change in the macro indicator disposable income of the household sector used in the macro stress test model.
The interest rate shock is modeled by an adjustment of the household’s debt service (DSi in equation (1)). A household’s debt service consists of two parts, amortization and interest payments. Obviously, interest payments are the part affected by an interest rate rise. We further distinguish between
7 Andersen et al. (2008) also model micro-level estimations for the corporate and banking sectors, which are not discussed in the paper at hand since the quality of existing procedures is already more advanced and we focus solely on the integration of household-level information into the macro model in Austria.
Risk-Bearing Capacity of Households – Linking Micro-Level Data to the Macroprudential Toolkit
100 OESTERREICHISCHE NATIONALBANK
shortterm and longterm interest rates, assuming that a rise in the shortterm interest rate will only affect loans with variable interest rates, while a rise in the longterm interest rate is going to affect every loan type.
Finally, the exchange rate shock is also modeled by a change of the household’s debt service given that the household has a foreign currency loan. But this time, both parts of the debt service are affected by the appreciation of the foreign currency: First, amortization increases as the outstanding amount in euro has suddenly risen (everything else staying constant); and second, as a consequence of the rise of the outstanding amount, interest payments also increase.
These shocks and the scenarios laid out in section 1.2 are modeled at the micro level. To use the results of this analysis for comprehensive scenario analyses in the macro model we have to combine the shocks of all the components of the financial margin and observe the resulting changes in households’ vulnerability. We model these combined shocks by assuming that the shocks are independent from each other; therefore we look at the change in the financial margin resulting from the sum of each one of the four shocks described above. In an unstable economic environment households that are exposed to various shocks are the ones which are hit hardest. This is captured
by the combination of the shocks that are modeled.
2.3 Data and Definitions
The data for this microlevel analysis were taken from the Austrian HFCS’s 2010 wave. At the Eurosystem level, the HFCS is coordinated by the ECB;8 the OeNB is responsible for conducting the survey in Austria. HFCS data provide detailed information on the whole balance sheet as well as several socioeconomic and sociodemographic characteristics of households in the euro area.9 Additionally, some specific variables for Austria which are not publicly available were used in this study (e.g. infor mation on foreign currency loan holders).
The results reported in the present paper pertain to households in Austria only. All estimates are calculated using the final household weights and the survey’s multiple imputations provided by the data producer (see Albacete et al., 2012b, for a detailed description of the survey methodology).
We calculate each household’s financial margin as follows: For Yi and BCi , we use total monthly net income and total monthly consumption (without rent,10 taxes and durable goods) as recorded by the household. For DSi we use the sum of payments for mortgages (mortgages on the main residence and on other real estate properties) and payments for noncollateralized loans.11
8 The HFCS is envisaged to be conducted about every three years. Hence, an update of the data underlying the micro-level model of household vulnerabilities could be carried out. The HFCS in Austria has no panel component.
9 In the first wave of the HFCS, 15 out of the 17 euro area countries at the time of the field period collected the data. Estonia and Ireland will be included in the second wave.
10 Rents are not part of basic consumption due to data limitations. We only know how much rent is paid by renters, but do not know how much homeowners spend on utilities (e.g. electricity and gas). Hence, we decided to leave out expenditure on rent and utilities from the definition of basic consumption. However, as we are mainly interested in changes of the probability of default and not in its absolute values after the changes, this data limitation should not be problematic.
11 Leasing payments are excluded.

Risk-Bearing Capacity of Households – Linking Micro-Level Data to the Macroprudential Toolkit
FINANCIAL STABILITY REPORT 27 – JUNE 2014 101
Furthermore, we define the household’s debt stock as the sum of the outstanding balance of mortgage debt and the outstanding balance of nonmortgage debt (including credit line/overdraft, credit card debt above the monthly repayment and noncollateralized loans). Finally, gross wealth is defined as the sum of total real assets (main residence, other real estate property, vehicles, valuables, and selfemployment businesses) and total financial assets (deposits, mutual funds, bonds, nonselfemployment private businesses, publicly traded shares, managed accounts, money owed to households, voluntary pension/whole life insurance and other financial assets).
There is a total of 2,380 households in the net sample of the HFCS in Austria. According to the definition above, about 64% of the household population12 do not hold debt, 3% hold debt and are vulnerable and 33% hold debt but are not vulnerable. Among those holding debt, 40% hold only mortgage debt, 48% hold only nonmortgage debt and 12% hold both types of debt. For the analysis, we focus only on indebted households, as it is evident that households without debt cannot pose a threat to the stability of the Austrian financial market.
We empirically implement the shocks as follows: For the unemployment shock we model unemployment for the household’s reference person and assume – for reasons of simplicity – that the other working persons in the same household cannot become unemployed. Each refer
ence person’s probability of becoming unemployed is predicted using a logit model which includes as regressors characteristics of the reference person (age, education and gender) and household characteristics (income, total number of members, number of members in employment, number of members aged 18 and over, number of members aged 65 and over and region). The decrease of disposable household income after the shock is estimated by subtracting 45% of the reference person’s net wage13 from total household income, which corresponds to the unemployment benefits according to the current Austrian unemployment benefit rules (see e.g. BMASK, 2012). We repeat the unemployment shock 1,000 times using a Monte Carlo simulation, calculate PD and LGD each time and finally take the mean of each one of these indicators over all simulated draws.
For the interest and exchange rate shocks we need to estimate the changes in debt service after the interest rate variation and after changes in exchange rates. Therefore, we use HFCS information on the characteristics of credit contracts. In the case of bullet loans, for example, the shock transmission is relatively simple because debt service only consists of interest payments, while amortization is zero. In such cases, debt service R is estimated by R=St–1 ∙ i, where St–1 is the amount still owed (which changes in the exchange rate shock14) and i is the interest rate (which changes in the interest rate
12 According to the survey literature, one has to apply household weights to estimate population parameters. This has been done in the figures provided, so that a share of 64% of the household population in Austria that are not indebted does not necessarily require 64% of households in the sample not to have debts.
13 The reference person’s net wage is estimated by dividing net household income by the number of household members in employment because net income is not available at the person level.
14 For reasons of simplicity, it is assumed that the exchange rate changes of the Japanese yen are equal to the exchange rate changes of the Swiss franc. This assumption is justified by the fact that the vast majority of all foreign currency loans in Austria is held in Swiss francs. According to the HFCS, 93% of all foreign currency loans that are a household’s highest mortgage on its main residence are denominated in Swiss francs.

Risk-Bearing Capacity of Households – Linking Micro-Level Data to the Macroprudential Toolkit
102 OESTERREICHISCHE NATIONALBANK
shock). In the case of loans other than bullet loans, debt service (interest payment and amortization) is estimated by
R = St−1 ⋅i ⋅ 1+ i( )n−t1+ i( )n−t −1
,
where n is the term of the loan and t is the time elapsed since the loan was taken out.15 The change in the debt service of an indebted household due to a shock is estimated by the percentage change of the calculated debt service (debt service after the shock divided by debt service before the shock). This percentage changes are applied to the debt payment recorded by the household in order to calculate the absolute value of the household’s debt service after the shock.
Finally, we implement the income shock simply as a relative change of net household income for all households.
2.4 Micro-Simulation Output
In order to understand the complete picture of households’ liabilities in Austria one needs to estimate and assess the level as well as the distribution of debt and vulnerabilities before looking at the micro simulation investigating stress scenarios for households. The main indicators derived from the first wave of the HFCS 2010 are published and discussed in Albacete and Lindner (2013) and are therefore not described here.
Table 2 shows the results of the micro simulation of the stress scenarios described above. The PD and two LGD measures are split into mortgage
15 There are a few cases in which not all of these parameters were available in the data, either due to nonresponse (e.g. year when the loan was taken out), the structure of the questionnaire (e.g. loan number 4 or above for each loan type) or special cases (e.g. loans without a fixed term). In all these cases the missing parameters were multiply imputed using a Bayesian approach.
Table 2
Micro Simulation of Stress Scenarios Using HFCS Data
PD (HH)1 LGD (HH)2 LGD2 (HH)3
All debt holders
Mortgage debt holders
Non-mortgage debt holders
All debt holders
Mortgage debt holders
Non-mortgage debt holders
All debt holders
Mortgage debt holders
Non-mortgage debt holders
%
Current situation8.99 12.71 7.39 3.60 3.57 11.42 4.98 4.94 18.61
Scenario 1: baselineFirst year 9.32 13.27 7.80 4.21 4.28 11.45 5.61 5.66 18.64Second year 9.21 13.08 7.77 4.21 4.28 11.42 5.60 5.66 18.61
Scenario 2: stress scenario IFirst year 9.58 13.72 7.85 4.24 4.30 11.45 5.63 5.69 18.66Second year 9.46 13.45 7.88 4.23 4.30 11.45 5.63 5.69 18.65
Scenario 3: stress scenario IIFirst year 11.23 15.40 9.47 4.29 4.30 11.86 5.70 5.69 19.10Second year 11.49 15.76 9.78 4.31 4.30 11.93 5.72 5.69 19.21
Source: HFCS Austria 2010, OeNB.1 PD (HH) = share of vulnerable households as a percentage of indebted households.2 LGD (HH) = sum of vulnerable households’ debt that is not covered by their total wealth divided by total debt of all households.3 LGD2 (HH) = sum of vulnerable households’ debt that is not covered by their housing wealth divided by total debt of all households.
Note: The number of simulations is 1,000.

Risk-Bearing Capacity of Households – Linking Micro-Level Data to the Macroprudential Toolkit
FINANCIAL STABILITY REPORT 27 – JUNE 2014 103
and nonmortgage debt to highlight the differences between the two debt markets. We can see that, overall, the current PD of Austrian indebted households is about 9%, which is equivalent to 9% of indebted households being vulnerable according to our financial margin measure. The proportion of total debt held by vulnerable households that is not covered by these households’ assets (LGD) equals 3.6% or, alternatively, about 5% when only housing wealth is taken into account. The scenario simulation shows that PD increases from 9% to up to 11.5% in the strongest scenario (stress scenario II). The increases of LGD are stronger, ranging from 3.6% to up to 4.3% (or from 5% to 5.7% according to the alternative LGD definition).16
Table 2 also shows that while the PD of nonmortgage debt holders is much lower than the one of mortgage debt holders, LGDs are much higher. This is because households in the mortgage debt market probably have a much higher debt service than households in the nonmortgage debt market, but at the same time they are wealthier and can provide more collateral than vulnerable households in the nonmortgage debt market.
This pattern remains the same across all stress scenarios, although the shocks have very different impacts on the two debt markets. While PD changes for mortgage debt holders are similar to PD changes for nonmortgage debt holders, LGDs change much less for households in the nonmortgage debt market than for those in the mortgage debt market. This is a clear indication that in the nonmortgage debt market new vulnerable households, i.e. house
holds that become vulnerable by the stress simulation, tend to have lower nonmortgage debt and higher wealth than the households that are already vulnerable before the shocks.
3 Applying Micro-Level Data in Macroprudential Analysis
This section gives examples of how HFCS data can be used in macroprudential analysis. Solvency stress tests based on macroeconomic scenarios constitute an important area of application. Here, the framework presented in section 2 can be used to model domestic households’ credit risk. Moreover, the data offer an opportunity to refine the sensitivity analyses used for assessing the credit risk emanating from foreign currency shocks to which domestic borrowers in foreign currency are exposed. Finally, HFCS data can be used to derive loantovalue (LTV) information of Austrian real estate household loans.
3.1 Integration of Micro-Level Information into Solvency Stress Testing
Solvency stress tests analyzing the banking system’s vulnerability to macroeconomic downturns are a key component of the OeNB’s macroprudential toolkit. An essential element of a solvency stress test is the translation of the scenarios (baseline and stress) into the risk parameters PD and LGD (in the supervisory context). To that end, econometric models17 are employed that describe how risk parameters evolve during the stress test horizon in terms of relative changes with respect to the starting point. The relative changes are then applied to banks’ individual
16 The SEvH measure (see section 1.1), which is not displayed in the table due to space constraints, ranges from currently 22.6% to up to 27.4% in the strongest scenario.
17 For a detailed presentation of the PD models see Kerbl and Sigmund (2011).
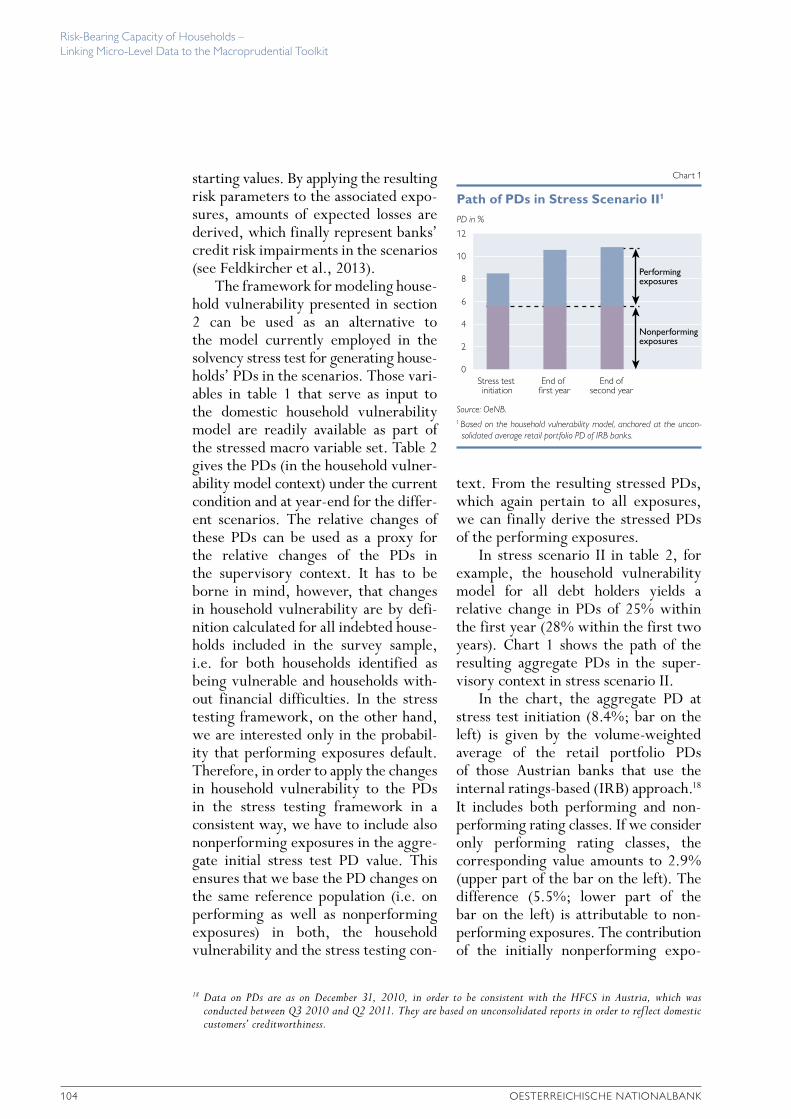
Risk-Bearing Capacity of Households – Linking Micro-Level Data to the Macroprudential Toolkit
104 OESTERREICHISCHE NATIONALBANK
starting values. By applying the resulting risk parameters to the associated exposures, amounts of expected losses are derived, which finally represent banks’ credit risk impairments in the scenarios (see Feldkircher et al., 2013).
The framework for modeling household vulnerability presented in section 2 can be used as an alternative to the model currently employed in the solvency stress test for generating households’ PDs in the scenarios. Those variables in table 1 that serve as input to the domestic household vulnerability model are readily available as part of the stressed macro variable set. Table 2 gives the PDs (in the household vulnerability model context) under the current condition and at yearend for the different scenarios. The relative changes of these PDs can be used as a proxy for the relative changes of the PDs in the supervisory context. It has to be borne in mind, however, that changes in household vulnerability are by definition calculated for all indebted households included in the survey sample, i.e. for both households identified as being vulnerable and households without financial difficulties. In the stress testing framework, on the other hand, we are interested only in the probability that performing exposures default. Therefore, in order to apply the changes in household vulnerability to the PDs in the stress testing framework in a consistent way, we have to include also nonperforming exposures in the aggregate initial stress test PD value. This ensures that we base the PD changes on the same reference population (i.e. on performing as well as nonperforming exposures) in both, the household vulnerability and the stress testing con
text. From the resulting stressed PDs, which again pertain to all exposures, we can finally derive the stressed PDs of the performing exposures.
In stress scenario II in table 2, for example, the household vulnerability model for all debt holders yields a relative change in PDs of 25% within the first year (28% within the first two years). Chart 1 shows the path of the resulting aggregate PDs in the supervisory context in stress scenario II.
In the chart, the aggregate PD at stress test initiation (8.4%; bar on the left) is given by the volumeweighted average of the retail portfolio PDs of those Austrian banks that use the internal ratingsbased (IRB) approach.18 It includes both performing and nonperforming rating classes. If we consider only performing rating classes, the corresponding value amounts to 2.9% (upper part of the bar on the left). The difference (5.5%; lower part of the bar on the left) is attributable to nonperforming exposures. The contribution of the initially nonperforming expo
PD in %
Performingexposures
Nonperforming exposures
12
10
8
6
4
2
0Stress test initiation
Path of PDs in Stress Scenario II1
Chart 1
Source: OeNB.1 Based on the household vulnerability model, anchored at the uncon- solidated average retail portfolio PD of IRB banks.
End of first year
End ofsecond year
18 Data on PDs are as on December 31, 2010, in order to be consistent with the HFCS in Austria, which was conducted between Q3 2010 and Q2 2011. They are based on unconsolidated reports in order to reflect domestic customers’ creditworthiness.

Risk-Bearing Capacity of Households – Linking Micro-Level Data to the Macroprudential Toolkit
FINANCIAL STABILITY REPORT 27 – JUNE 2014 105
sures to the overall stressed PDs stays constant over the stress test horizon. Therefore the change in total PD by 25% (28%) translates into a change in the PD of the performing exposures by 73% (81%).
3.2 Foreign Currency Loans
A particularity of the Austrian financial system is the relatively high share of household loans denominated in foreign currency (see e.g. Boss, 2003; Beer et al., 2008; or Albacete et al., 2012a). The risks associated with an appreciation of the currency in which the loan is denominated – in Austria usually the Swiss franc – visàvis the euro have been a cause of concern with regard to the stability of the Austrian banking system since more than a decade.19 In the past, various supervisory measures have proved effective in substantially reducing new foreign currency lending, thus gradually reducing the overall stock of outstanding foreign currency loans.20
Because these legacy assets will continue to pose a challenge to the Austrian banking system they are subjected to sensitivity analyses in the framework of the OeNB’s macroeconomic stress tests. The most recent test was run in the course of the IMF’s FSAP in 2013 (see IMF, 2014). The sensitivity analysis was confined to Swiss franc loans because, according to supervisory data, they represent more than 90% of all foreign currency loans, which is almost identical to the equivalent estimate from the HFCS (see footnote 14 in section 2.3).
In the context of stress testing domestic foreign currency exposures, data availability is a crucial issue. Although supervisory reporting provides good data on volumes and remaining maturities of these loans at an aggregated level, information about borrowers’ riskbearing capacity is sparse. A crucial parameter in the sensitivity analysis is the ratio D/I, defined as a borrower’s debt repayment obligation D within a certain period of time (e.g. one year) over her/his income within the same period after deducting debt repayment and total consumption. This ratio represents a measure of how well a borrower can cope with an appreciation of the loan currency. No explicit supervisory data on this ratio are available. So far, this parameter was set to a value that is assumed to be consistent with the supervisory requirement that foreign currency loans may only be granted to customers that can adequately cope with an appreciation of the loan currency.
In this context, HFCS data can be used to shed light not only on the magnitude of the average D/I ratio but also on its distribution across households.21 It turns out that the majority of foreign currency borrowers (about 80%) possesses sufficient income reserves to cope even with a substantial appreciation of the Swiss franc visàvis the euro (see also Albacete et al., 2012a).22 However, about 20% of foreign currency borrowers only show a rather poor riskbearing capacity in terms of income reserves. If these weak borrowers are concentrated at certain banks or in certain regions there may exist consid
19 In the stress scenarios (see section 2 above), the impact of changes in the exchange rate is also taken into account.20 The stock of foreign currency loans to Austrian households amounted to EUR 29.5 billion as at end-September 2013
after having declined by 42% in foreign exchange-adjusted terms within the preceding five years (see OeNB, 2013).21 When the indirect credit risk of foreign currency loans is treated in a separate sensitivity analysis this has to be
taken into account in the household vulnerability model of section 2 in order to avoid double counting.22 The appreciation of the Swiss franc vis-à-vis the euro serves as a hypothetical stress scenario. No probability is
attached to this event.

Risk-Bearing Capacity of Households – Linking Micro-Level Data to the Macroprudential Toolkit
106 OESTERREICHISCHE NATIONALBANK
erable concentration risks even when the respective loans are collateralized by real estate.
Chart 2 shows the heterogeneity of Swiss franc loan borrowers as regards their ability to cope with appreciations of the Swiss franc. We divided the borrowers covered in the HFCS into quintiles according to their riskbearing capacity as measured by the D/I ratio. For each quintile the share of losses generated in the FSAP sensitivity analysis is shown.
Chart 2 points to the fact that – according to the model used in the FSAP 2013 sensitivity analysis – more than 80% of the loss potential of Swiss franc loans emanates from only 20% of foreign currency borrowers (located in the fifth quintile).
3.3 Loan-to-Value RatiosA third potential field of application of microlevel information is loantovalue (LTV) ratios. There are different loantovalue ratios that are generally monitored. They differ in terms of their distinct purpose and sometimes also in terms of data availability. We focus on (1) initial and (2) current LTV ratios. To analyze the financial stability of an economy, both measures have to be taken into account. However, it seems obvious that they are different in terms of focus and use.
The initial LTV ratio is defined by the initial amount of (mortgage) debt divided by the value of the specific real estate at the time the mortgage was taken out. Although the ratio is not included in any reporting data in Austria, it should, in principle, be readily available for the creditor that grants the loan. Limits on (initial) LTV ratios are used as a macroprudential tool23 because they can contribute to making financial institutions and households more resilient to shocks to asset prices, interest rates and income. They can be set in a timevarying manner (to mitigate procyclicality) and/or as a static cap.24 Initial LTV limits are usually applied with a focus on a medium to longterm stabilization of financial markets.
By contrast, the current LTV ratio is defined as the currently outstanding amount of (mortgage) debt divided by the current value of the specific real estate. This measure is used to analyze the financial stability of an economy at a specific point in time. The information necessary to calculate the
23 Asian emerging countries have set such limits in the aftermath of the 1990s Asian crisis (Hong Kong Monetary Authority, 2011). But also some European countries like Hungary, Norway and Sweden have recently adopted such credit-limiting policies (Lim et al., 2013).
24 As house prices vary over time, caps on loan-to-income (LTI) or debt-servicing costs-to-income (DTI) may be stricter than LTV limits during phases of rising house prices.
%
90
80
70
60
50
40
30
20
10
01st
quintile
1
Share of Estimated Losses across Debt Repayment Obligation-to-Income Ratio Quintiles1
Chart 2
Source: OeNB.1 Loss estimation based on the model used in the FSAP 2013 sensitivity
analysis.
2nd
quintile
3
3rd
quintile
4
4th
quintile
8
5th
quintile
83

Risk-Bearing Capacity of Households – Linking Micro-Level Data to the Macroprudential Toolkit
FINANCIAL STABILITY REPORT 27 – JUNE 2014 107
current LTV ratio is not generally available to the financial intermediary that granted the loan (except for occasional reevaluations) because it is not known how real estate prices evolve at the individual level. Hence, the information has to come from the debtor. Having an impact on financial stability, this indicator provides important information that can be used to inform a regulator, but – contrary to the initial LTV – it cannot be the target of specific rules.
For a full picture of LTV ratios a combination of householdlevel information (from the HFCS) together with data reported by monetary financial institutions would be desirable. An analysis including both sources could provide a clear understanding of both the creditor and the debtor side. So far, however, the HFCS is the only recently published source that allows an estimation of the LTV ratio of Austrian household real estate loans. The information provided by the HFCS allows the estimation of both initial and current LTV ratios. Albacete and Lindner (2013) show a cyclical pattern of median initial LTV ratios in Austria, with an upward trend since the 1990s (when LTV ratios ranged from 40% to 50%) and peaking before the beginning of the financial crisis in 2008 (60% to 65%). Since then the median LTV has fallen slightly, to below 60% in the years after 2008.25
Granting higher loans in relation to the value of the real estate used as collateral potentially increases the LGD for banks. Higher LTV ratios are, however, only the second line of defense for banks. Therefore, a high income buffer
is essential to absorb shocks and in that way help to prevent default in the first place. Chart 3 shows the median initial LTV ratio for debt servicetogross income ratio26 quintiles. From a macroprudential perspective, it is interesting that households with higher debt servicetoincome ratios have higher LTV ratios.
The first quintile of the debt servicetogross income ratio shows a median initial LTV of 32% whereas the 20% showing the highest debt service ratio have a median LTV ratio of 87%. As a consequence, a loan default is more likely for households with a lower riskabsorbing capacity due to their higher debt service ratio. However, LTV ratios are below 100% even in the fifth quintile. In line with these results, households with lower gross income
25 As these are median estimates caution should be applied when comparing them with aggregate macro data, which can only provide means rather than medians.
26 In contrast to the debt-to-income (D/I) ratio in section 3.2, the denominator here is gross income; so debt repayment and total consumption are not deducted.
Initial LTV ratio in %
100
90
80
70
60
50
40
30
20
10
01st
quintile
Median Initial LTV Ratio across Debt Service-to-Gross Income Ratio Quintiles
Chart 3
Source: OeNB.
2nd
quintile3rd
quintile4th
quintile5th
quintile
32
44
53
74
87

Risk-Bearing Capacity of Households – Linking Micro-Level Data to the Macroprudential Toolkit
108 OESTERREICHISCHE NATIONALBANK
(not taking into account debt service) show higher LTV ratios.
Further analyses reveal a positive relation between the term of a loan and the initial LTV ratio. Arguably, mortgage holders with higher leverage tend to opt for a longer payback period in order to limit the periodic debt service. Therefore, a LTV cap would not only affect loans with longer terms but in that way (and taking into account the results over income quintiles) would limit lending to households with a lower riskbearing capacity. This analysis suggests that introducing and calibrating such a cap on LTV ratios is not an easy task. In order to achieve results that may feed into a targeted macroprudential policy, not only the overall LTV development but also differentiated information such as terms of loans as well as the riskbearing capacity of households has to be considered.
4 Conclusions
This study focuses on how to use microlevel household information from the HFCS in macroprudential analysis. By integrating detailed information about the liability side of households’ balance sheets into macroprudential modeling we aim at increasing our understanding of the ability of households to absorb shocks. So far, domestic households have not been a source of serious risk to the Austrian banking system. However, many examples from other countries (e.g. Spain, the U.S.A. and the U.K.) have shown that indebtedness in the household sector can give rise to problems in the financial sector; therefore a close monitoring of household indebtedness seems warranted.
We identify three possibilities for improving the macroprudential toolkit and present approaches using HFCS data.
First, building on previous work, we develop a model of household vul
nerability. It can be used for deriving estimates of the change of default probabilities (as well as losses) in stress scenarios at the micro level. Applying these results can improve the modeling of Austrian households’ credit risk in the OeNB’s stress test tool ARNIE. In upcoming stress tests the household vulnerability model will replace the existing module for stressing domestic retail portfolios.
Second, we employ HFCS data to estimate the distribution of a parameter measuring the riskbearing capacity of domestic foreign currency borrowers. It turns out that the majority of foreign currency borrowers display a high riskbearing capacity. However, about onefifth of them show a rather poor riskbearing capacity in terms of income reserves, which could lead to problems if the currency in which the loan is denominated appreciates. By using HFCS information, we enhance the parameter calibration in the OeNB’s sensitivity analyses for foreign currency lending. Subsequently, we will analyze whether the exchange rate effects of the macroeconomic stress scenario on foreign currency loans can be integrated into the OeNB’s regular solvency stress test by means of HFCS data. This would lead to a more unified application of the stress scenario.
Third, we use HFCS data to estimate LTV ratios. This way, existing gaps in the supervisory data can be filled. Although HFCS data shed light on the debtors’ side of the mort gage market, additional information about the creditors’ side would be desirable.
This paper shows the potential of an integrated use of supervisory and household data. It is aimed at improving the synergies between microlevel household data analysis and macro prudential risk assessment.

Risk-Bearing Capacity of Households – Linking Micro-Level Data to the Macroprudential Toolkit
FINANCIAL STABILITY REPORT 27 – JUNE 2014 109
ReferencesAlbacete, N. and P. Fessler. 2010. Stress Testing Austrian Households. In: Financial Stability
Report 19. 72–91.Albacete, N., P. Fessler and M. Schürz. 2012a. Risk Buffer Profiles of Foreign Currency
Mortgage Holders. In: Financial Stability Report 23. 58–71.Albacete, N. and P. Lindner. 2013. Household Vulnerability in Austria – A Microeconomic
Analysis Based on the Household Finance and Consumption Survey. In: Financial Stability Report 25. 57–73.
Albacete, N., P. Lindner, K. Wagner and S. Zottel. 2012b. Eurosystem Finance and Consumption Survey 2010: Methodological Notes for Austria. Addendum to Monetary Policy and the Economy Q3/12.
Andersen, H., T. O. Berge, E. Bernhardsen, K.-G. Lindquist and B. H. Vatne. 2008. A Suite-of-Models Approach to Stress-Testing Financial Stability. Staff Memo No. 2. Norges Bank.
Beer, C., S. Ongena and M. Peter. 2008. The Austrian Carry Trade: What Are the Characteristics of Households Borrowing in Foreign Currency? In: Financial Stability Report 16. 108–121.
Bilston, T. and D. Rodgers. 2013. A Model for Stress Testing Household Lending in Australia. In: Bulletin December Quarter 2013. Reserve Bank of Australia. 27–38.
BMASK. 2012. Labour market policy in Austria 2011. Federal Ministry of Labour, Social Affairs and Consumer Protection. http://www.ams.at/_docs/labour_market_policy.pdf (retrieved on February 24, 2014).
Boss, M. 2003. Struktur und Risiken von Fremdwährungskrediten in Österreich. OeNB.Costa, S. and L. Farinha. 2012. Households’ Indebtedness: A Microeconomic Analysis based
on the Results of the Households’ Financial and Consumption Survey. In: Financial Stability Report. Banco de Portugal. May.
ECB. 2012. Report on the first two years of the macro-prudential research network.ECB. 2013a. The Eurosystem Household Finance and Consumption Survey: Methodological
Report for the first wave. ECB Statistics Paper Series No 1. April.ECB. 2013b. The Eurosystem Household Finance and Consumption Survey: Results from the first
wave. ECB Statistics Paper Series No 2. April.Enria, A. 2012. Micro-data for micro- and macro-prudential purposes. Paper prepared for the
Sixth ECB Statistics Conference “Central bank statistics as a servant of two separate mandates: price stability and mitigation of systemic risk” on April 17 and 18, 2012.
ESRB. 2014. The ESRB Handbook on Operationalising Macro-prudential Policy in the Banking Sector. European Systemic Risk Board. http://www.esrb.europa.eu/pub/pdf/other/140303_esrb_handbook.pdf?4963d08a4e5963b2d9b6865e0d849c50 (retrieved on March 25, 2014).
Feldkircher, M., G. Fenz, R. Ferstl, G. Krenn, B. Neudorfer, C. Puhr, T. Reininger, S. W. Schmitz, M. Schneider, C. Siebenbrunner, M. Sigmund and R. Spitzer. 2013. ARNIE in Action: The 2013 FSAP Stress Tests for the Austrian Banking System. In: Financial Stability Report 26. 100–118.
Hlaváč, P., P. Jakubík and K. Galuščák. 2013. Household Stress Tests using Microdata. CNB Financial Stability Report 2012/2013. June 18.
Hong Kong Monetary Authority. 2011. Loan-to-value ratio as a macroprudential tool – Hong Kong SAR’s experience and cross-country evidence. BIS Papers No 57.
Lim, C. H., I. Krznar, F. Lipinsky, A. Otani and X. Wu. 2013. The Macroprudential Framework: Policy Responsiveness and Institutional Arrangements. IMF Working Paper 13/166.

Risk-Bearing Capacity of Households – Linking Micro-Level Data to the Macroprudential Toolkit
110 OESTERREICHISCHE NATIONALBANK
IMF. 2014. Austria: Publication of Financial Sector Assessment Program Documentation –Technical Note on Stress Testing the Banking Sector.
Kerbl, S. and M. Sigmund. 2011. What drives Aggregate Credit Risk? In: Financial Stability Report 22. 72–87.
OeNB. 2013. Financial Stability Report 26.Schneider, M. and M. Leibrecht. 2006. AQM-06: The Macroeconomic Model of the OeNB.
Technical Report. OeNB Working Paper 132.Se, O. H. 2013. Loan-to-Value as Macroprudential Policy Tool: Experiences and Lessons of Asian
Emerging Countries. DSF Policy Paper 33.

Annex of Tables

112 OESTERREICHISCHE NATIONALBANK
International Financial Market Indicators Table
Short-Term Interest Rates A1
Long-Term Interest Rates A2
Stock Indices A3
Corporate Bond Spreads A4
Financial Indicators of the Austrian Corporate and Household Sectors
Financial Investment of Households A5
Household Income and Savings A6
Financing of Nonfinancial Corporations A7
Insolvency Indicators A8
Housing Market Indicators A9
Austrian Financial Intermediaries
Total Assets and Off-Balance-Sheet Operations A10
Sectoral Distribution of Domestic Loans A11
Loan Quality A12
Exposure to CESEE A13
Profitability on an Unconsolidated Basis A14
Profitability of Austrian Subsidiaries in CESEE A15
Profitability on a Consolidated Basis A16
Solvency A17
Liquidity Risk A18
Market Risk A19
Market Indicators of Selected Austrian Financial Instruments A20
Key Indicators of Austrian Insurance Companies A21
Assets Held by Austrian Mutual Funds A22
Structure and Profitability of Austrian Fund Management Companies A23
Assets Held by Austrian Pension Funds A24
Assets Held by Austrian Severance Funds A25
Transactions and System Disturbances in Payment and Securities Settlement Systems A26
Cutoff date for data: June 4, 2014
Conventions used in the tables:
x = No data can be indicated for technical reasons
. . = Data not available at the reporting date
Revisions of data published in earlier volumes are not indicated.
Discrepancies may arise from rounding.
Annex of Tables
Annex of Tables
FINANCIAL STABILITY REPORT 27 – JUNE 2014 113
International Financial Market Indicators
Table A1
Short-Term Interest Rates1
2006 2007 2008 2009 2010 2011 2012 2013
Year
Three-month rates, period average, %
Euro area 3.08 4.28 4.63 1.23 0.81 1.39 0.57 0.21U.S.A. 5.19 5.30 2.91 0.69 0.34 0.34 0.43 0.28Japan 0.31 0.73 0.85 0.59 0.39 0.34 0.33 0.26United Kingdom 4.80 5.95 5.49 1.23 0.74 0.88 0.86 0.51Switzerland 1.51 2.55 2.58 0.38 0.19 0.12 0.07 0.02Czech Republic 2.30 3.10 4.04 2.19 1.31 1.19 1.00 0.46Hungary 7.00 7.75 8.87 8.64 5.51 6.19 6.98 4.31Poland 4.21 4.74 6.36 4.42 3.92 4.54 4.91 3.02
Source: Bloomberg, Eurostat, Thomson Reuters.1 Average rate at which a prime bank is willing to lend funds to another prime bank for three months.
Table A2
Long-Term Interest Rates1
2006 2007 2008 2009 2010 2011 2012 2013
Year
Ten-year rates, period average, %
Euro area 3.84 4.32 4.31 3.82 3.62 4.41 3.92 3.00U.S.A. 4.79 4.63 3.65 3.24 3.20 2.77 1.79 2.34Japan 1.73 1.67 1.49 1.34 1.17 1.12 0.85 0.71United Kingdom 4.37 5.06 4.50 3.36 3.36 2.87 1.74 2.03Switzerland 2.52 2.93 2.90 2.20 1.63 1.47 0.65 0.95Austria 3.80 4.30 4.36 3.94 3.23 3.32 2.37 2.01Czech Republic 3.80 4.30 4.63 4.84 3.88 3.71 2.78 2.11Hungary 7.12 6.74 8.24 9.12 7.28 7.64 7.89 5.92Poland 5.23 5.48 6.07 6.12 5.78 5.96 5.00 4.03
Source: ECB, Eurostat, Thomson Reuters, national sources.1 Yields of long-term government bonds.

Annex of Tables
114 OESTERREICHISCHE NATIONALBANK
Table A3
Stock Indices
2006 2007 2008 2009 2010 2011 2012 2013
Year
Annual change in %, period average
Euro area: EURO STOXX 21.6 16.5 –24.7 –25.3 13.4 –3.6 –6.4 17.5U.S.A.: S&P 500 8.5 12.7 –17.3 –22.4 20.2 11.3 8.7 19.1Japan: Nikkei 225 29.8 5.3 –28.5 –23.1 7.2 –5.9 –3.4 48.8United Kingdom: FTSE 100 14.8 8.1 –16.2 –14.9 19.8 3.9 1.0 12.8Switzerland: SMI 25.0 11.4 –22.9 –18.2 14.3 –7.0 4.9 24.1Austria: ATX 31.4 17.3 –27.3 –36.5 19.9 –3.7 –14.8 16.9Czech Republic: PX 50 18.0 20.0 –23.5 –29.2 21.7 –5.1 –14.6 2.5Hungary: BUX 18.6 15.8 –24.3 –18.7 40.1 –8.7 –12.0 3.3Poland: WIG 45.9 36.9 –31.0 –21.3 33.6 4.4 –6.7 16.1
Source: Thomson Reuters.
Table A4
Corporate Bond Spreads1
2006 2007 2008 2009 2010 2011 2012 2013
Year
Percentage points, period average
Euro area
AAA 0.39 0.72 2.04 2.17 1.33 1.90 1.47 0.89BBB 1.29 1.34 3.84 5.23 2.95 3.75 3.56 2.25
U.S.A.
AAA 0.50 0.95 3.03 2.57 1.32 1.68 1.50 1.12BBB 1.02 1.50 4.16 4.51 2.21 2.34 2.59 2.17
Source: Thomson Reuters.1 Spreads of 7- to 10-year corporate bonds against 10-year government bonds (euro area: German government bonds).

Annex of Tables
FINANCIAL STABILITY REPORT 27 – JUNE 2014 115
Financial Indicators of the Austrian Corporate and Household Sectors
Table A7
Financing of Nonfinancial Corporations
2006 2007 2008 2009 2010 2011 2012 2013
EUR billion
Debt securities1,2 2.7 4.6 3.0 5.9 3.8 8.0 5.3 3.1Loans2 8.6 32.4 12.7 –16.8 14.4 13.7 2.0 –1.2Shares and other equity2 11.9 15.7 5.0 2.5 –2.0 16.3 4.1 7.7Other accounts payable 3.7 3.3 –5.1 –5.2 7.6 3.2 1.9 3.1Total external financing 26.9 56.0 15.6 –13.6 23.8 41.2 13.3 12.7
Source: OeNB (financial accounts).1 Including financial derivatives.2 Excluding liabilities of domestic special purpose entities held by nonresidents.
Table A6
Household1 Income and Savings
2006 2007 2008 2009 2010 2011 2012 2013
EUR billion
Net disposable income 155.6 163.4 168.4 169.1 171.3 175.1 181.7 183.7Savings 16.2 19.1 19.4 19.1 15.3 11.8 13.4 12.2Saving ratio in %2 10.4 11.6 11.5 11.2 8.9 6.7 7.4 6.6
Source: Statistics Austria (national accounts broken down by sectors).1 Including nonprofit institutions serving households.2 Saving ratio = savings / (disposable income + increase in accrued occupational pension benefits).
Table A5
Financial Investment of Households1
2006 2007 2008 2009 2010 2011 2012 2013
EUR billion
Currency 0.5 0.6 0.7 0.9 1.0 1.1 0.6 1.2Deposits 8.1 11.4 11.5 8.0 1.7 4.7 3.8 2.1Debt securities2 1.5 3.8 5.4 –0.2 0.9 1.5 0.0 –2.3Shares and other equity3 2.4 0.3 1.3 1.0 1.5 0.7 1.0 –0.2Mutual fund shares 2.1 –0.3 –4.7 0.9 3.0 –1.7 1.0 3.0Insurance technical reserves 5.2 4.0 3.1 4.8 3.9 2.0 2.8 2.4Other accounts receivable 0.8 1.2 1.2 0.3 0.6 0.9 1.6 1.3Total financial investment 20.6 21.0 18.5 15.7 12.6 9.2 10.8 7.5
Source: OeNB (financial accounts).1 Including nonprofit institutions serving households.2 Including financial derivatives.3 Other than mutual fund shares.
Annex of Tables
116 OESTERREICHISCHE NATIONALBANK
Table A8
Insolvency Indicators
2006 2007 2008 2009 2010 2011 2012 2013
Default liabilities (EUR million) 2,569 2,441 2,969 4,035 4,700 2,775 3,206 6,255Defaults (number) 3,084 3,023 3,270 3,741 3,522 3,260 3,505 3,266
Source: Kreditschutzverband von 1870.
Note: Default liabilities for 2013 include one large insolvency.
Table A9
Housing Market Indicators
2006 2007 2008 2009 2010 2011 2012 2013
Annual percentage change of period averages
Residential Property Price Index (2000=100)Vienna 113.4 119.2 125.5 133.5 143.9 156.1 180.7 196.3Austria 109.0 114.1 115.4 119.8 127.3 132.7 149.1 156.0Austria excl. Vienna 107.4 112.3 111.6 114.8 121.2 124.0 137.4 141.1Rent prices1 (2000=100)Vienna: apartments 106.2 114.9 116.8 116.3 117.7 121.0 126.3 129.5Austria excl. Vienna: apartments 111.8 115.9 122.7 144.7 145.9 148.2 144.1 162.5Austria excl. Vienna: single-family homes 101.0 108.5 112.9 101.5 101.7 97.1 94.6 95.5Rents of apartments excl. utilities, according to CPI 89.5 91.2 92.4 96.7 100.0 103.3 107.8 111.2OeNB Fundamental Residential Property Price Indicator2
Vienna –6.4 –4.9 –1.3 –2.3 0.8 6.4 15.6 19.9Austria –9.0 –7.6 –7.2 –12.7 –8.9 –5.3 0.4 –0.6
Source: OeNB, Vienna University of Technology.1 Free and controlled rents.2 Deviation from fundamental price in %.

Annex of Tables
FINANCIAL STABILITY REPORT 27 – JUNE 2014 117
Table A10
Total Assets and Off-Balance-Sheet Operations
2006 2007 2008 2009 2010 2011 2012 2013
End of period, EUR million
Total assets on an unconsolidated basis 797,758 899,542 1,069,100 1,029,043 978,559 1,014,278 982,114 927,973 of which: total domestic assets 504,237 548,515 692,566 691,466 659,561 693,394 678,500 645,275 Total assets on a consolidated basis 927,751 1,073,258 1,175,646 1,139,961 1,130,853 1,166,313 1,163,595 1,089,713 Total assets of CESEE subsidiaries1 158,736 231,742 267,484 254,356 263,810 270,052 276,352 264,998 of which: NMS-20042 92,805 115,377 131,809 126,916 130,530 126,737 136,631 130,478
NMS-20073 26,095 36,776 40,679 40,488 41,275 42,316 40,886 39,764 SEE4 26,303 43,876 46,745 48,667 49,122 51,489 50,976 50,209 CIS5 13,533 35,713 48,251 38,285 42,883 49,510 47,859 44,547
Leverage Ratio (consolidated in %) 4.8 4.6 4.5 5.2 5.8 5.8 6.1 6.5
Source: OeNB.1 Excluding Yapı ve Kredi Bankası (not fully consolidated by parent bank UniCredit Bank Austria).2 New EU Member States since 2004 (NMS-2004): Czech Republic, Estonia, Latvia, Lithuania, Hungary, Poland, Slovakia, Slovenia.3 New EU Member States since 2007 (NMS-2007): Bulgaria, Romania.4 Southeastern Europe (SEE): Albania, Bosnia and Herzegovina, Croatia, Kosovo, Montenegro, former Yugoslav Republic of Macedonia, Serbia, Turkey.5 Commonwealth of Independent States (CIS): Armenia, Azerbaijan, Belarus, Kazakhstan, Kyrgyzstan, Moldova, Russia, Tajikistan, Turkmenistan, Ukraine, Uzbekistan, including Georgia.
Note: Data on off-balance-sheet operations refer to nominal values on an unconsolidated basis.
Austrian Financial Intermediaries1
1 Since 2007, the International Monetary Fund (IMF) has published Financial Soundness Indicators (FSI) for Austria (see also www.imf.org). In contrast to some FSIs that take only domestically-owned banks into account, the Financial Stability Report takes into account all banks operating in Austria. For this reason, some of the figures presented here may deviate from the figures published by the IMF.
Table A11
Sectoral Distribution of Domestic Loans
2006 2007 2008 2009 2010 2011 2012 2013
End of period, EUR million
All currencies combined
Banks 120,131 126,759 208,218 195,737 169,596 184,789 191,921 172,024 Nonbanks 284,971 293,148 314,399 311,794 321,524 330,057 330,378 326,820 of which: nonfinancial corporations 118,272 123,067 134,897 132,346 135,427 138,930 140,383 140,291
households1 116,440 121,543 127,828 128,178 135,215 138,355 139,048 139,052 general government 27,003 24,980 24,056 24,923 26,374 29,015 27,972 26,007 other financial intermediaries 22,876 23,154 27,213 26,063 24,324 23,586 22,806 21,244
Foreign currency
Banks 25,375 24,286 54,977 42,780 25,851 25,288 41,979 19,704 Nonbanks 53,534 47,776 56,797 56,515 58,746 57,301 47,652 40,108 of which: nonfinancial corporations 12,845 10,023 12,441 11,473 12,550 12,181 9,155 6,985
households1 35,452 33,185 39,138 37,064 40,040 38,718 32,904 28,385 general government 1,892 1,630 1,673 1,628 2,627 3,266 2,827 2,477 other financial intermediaries 3,337 2,931 3,514 3,374 3,525 3,133 2,761 2,257
Source: OeNB.1 Including nonprofit institutions serving households.
Note: Figures are based on monetary statistics.

Annex of Tables
118 OESTERREICHISCHE NATIONALBANK
Table A12
Loan Quality
2006 2007 2008 2009 2010 2011 2012 2013
End of period, % of claims on nonbanks
Specific loan loss provisions for loans to nonbanks (unconsolidated) 2.9 2.4 2.2 2.8 3.2 3.2 3.4 3.5 Specific loan loss provisions for loans to nonbanks (consolidated)1 x 2.4 2.4 3.5 4.1 4.3 4.6 4.8 Specific loan loss provisions for loans to nonbanks (Austrian subsidiaries in CESEE) x 2.6 2.9 5.3 6.5 7.3 7.6 8.0
Nonperforming loan ratio (unconsolidated)2 x x 3.0 4.2 4.7 4.5 4.7 4.1 Nonperforming loan ratio (consolidated)2 x x x 6.7 8.0 8.3 8.7 8.6 Nonperforming loan ratio (Austrian subsidiaries in CESEE) x x x 9.6 13.5 15.0 14.8 14.9
Source: OeNB.1 Estimate.2 Estimate for loans to corporates and households (introduced in Financial Stability Report 24 to better indicate the loan quality in retail business; not comparable to former ratios).
Table A13
Exposure to CESEE
2006 2007 2008 2009 2010 2011 2012 2013
End of period, EUR million
Total exposure according to BIS5 x 190,775 199,227 203,975 209,352 216,086 209,818 201,768 of which: NMS-20041 x 96,249 111,064 112,537 116,205 121,145 119,742 115,636 NMS-20072 x 32,608 34,021 33,695 33,905 32,756 30,916 29,404 SEE3 x 38,429 27,728 40,164 39,015 41,105 36,544 34,981 CIS4 x 23,489 26,414 17,579 20,226 21,079 22,617 21,746
Total indirect lending to nonbanks6 91,749 146,654 170,566 160,248 168,721 171,318 171,117 161,439 of which: NMS-20041 53,138 71,143 80,774 79,021 81,740 79,101 82,880 79,481 NMS-20072 14,040 22,173 25,954 25,433 26,009 26,731 25,922 24,024 SEE3 14,805 26,708 30,137 30,441 32,229 34,140 33,290 32,499 CIS4 9,766 26,630 33,701 25,353 28,742 31,346 29,025 25,435
Total direct lending7 x 38,401 49,724 50,665 49,459 52,010 51,539 52,926 of which: NMS-20041 x 18,434 21,646 21,902 22,419 23,207 22,383 20,886 NMS-20072 x 5,766 9,103 9,546 8,484 8,177 7,385 6,752 SEE3 x 11,665 14,592 15,022 14,348 15,139 16,256 18,293 CIS4 x 2,537 4,383 4,195 4,208 5,487 5,515 6,996
Source: OeNB.1 New EU Member States since 2004 (NMS-2004): Czech Republic, Estonia, Latvia, Lithuania, Hungary, Poland, Slovakia, Slovenia.2 New EU Member States since 2007 (NMS-2007): Bulgaria, Romania.3 Southeastern Europe (SEE): Albania, Bosnia and Herzegovina, Croatia, Kosovo, Montenegro, former Yugoslav Republic of Macedonia, Serbia, Turkey.4 Commonwealth of Independent States (CIS): Armenia, Azerbaijan, Belarus, Kazakhstan, Kyrgyzstan, Moldova, Russia, Tajikistan, Turkmenistan, Ukraine, Uzbekistan, including Georgia.5 Total exposure according to BIS includes only domestically-controlled banks. As Hypo Alpe-Adria-Bank AG was included in the fourth quarter of 2009, comparability with earlier values is
limited.6 Lending (net lending after risk provisions) to nonbanks by all fully consolidated subsidiaries in CESEE.7 Direct lending to CESEE according to monetary statistics.
Note: Due to changes in reporting, the comparability of values as from 2008 with earlier values is limited.
Annex of Tables
FINANCIAL STABILITY REPORT 27 – JUNE 2014 119
Table A14
Profitability on an Unconsolidated Basis
2006 2007 2008 2009 2010 2011 2012 2013
End of period, EUR million
Operating income 16,606 17,512 20,557 17,850 19,705 19,227 19,115 18,967of which: net interest income 7,170 7,399 8,248 8,769 9,123 9,622 8,813 8,814
securities and investment earnings 2,878 3,521 7,193 3,328 4,026 3,662 3,670 3,018fees and commission income 4,289 4,710 4,218 3,605 3,950 3,835 3,848 4,073trading income 688 290 –812 486 664 325 631 495other operating income 1,581 1,593 1,710 1,662 1,942 1,784 2,153 2,567
Operating expenses 10,789 10,849 11,416 11,080 11,547 11,714 12,193 12,835of which: staff costs 5,447 5,468 5,776 5,697 5,802 5,998 6,243 6,507
other administrative expenses 3,513 3,703 3,952 3,766 3,940 4,028 4,124 4,301other operating expenses 1,828 1,678 1,689 1,617 1,805 1,688 1,827 2,027
Operating profit/loss 5,817 6,663 9,141 6,770 8,159 7,513 6,922 6,132 Net profit after taxes 3,957 4,787 1,891 43 4,207 1,211 3,214 –935
Return on assets (%)1, 2 0.5 0.6 0.2 0 0.4 0.1 0.3 –0.1Return on equity (%, tier 1 capital)1, 2 10.3 9.6 3 0.1 5.8 1.6 4.3 –1.2Interest income to gross income (%) 43 42 40 49 46 50 46 46Cost-to-income ratio (%) 65 62 56 62 59 61 64 68
Source: OeNB.1 Annual surplus in % of total assets and tier 1 capital, respectively.2 Retrospectively modified due to a change of calculation.
Table A15
Profitability of Austrian Subsidiaries1 in CESEE
2006 2007 2008 2009 2010 2011 2012 2013
End of period, EUR million
Operating income 6,524 10,178 14,102 13,396 13,436 13,622 13,268 13,307of which: net interest income 4,206 6,748 9,231 8,693 9,333 9,402 8,781 8,414
securities and investment earnings x x 103 50 47 70 61 63fee and commission income 1,898 2,847 3,432 2,916 2,954 3,092 2,992 3,164trading income x x 46 1,238 368 426 790 749other income 57 31 1,291 498 735 631 643 917
Operating expenses 3,697 5,495 7,056 6,355 6,779 6,893 7,034 7,054of which: staff costs x x 3,171 2,715 2,841 2,975 2,968 2,908
other administrative expenses x x 3,761 3,529 3,809 3,817 3,958 4,087
Operating profit/loss 2,826 4,683 7,141 7,129 6,757 6,809 6,317 6,298Net profit after taxes 1,730 3,104 4,219 1,775 2,063 1,757 2,093 2,216
Return on assets (%)2 1.2 1.3 1.7 0.7 0.8 0.7 0.8 0.8Return on equity (%, tier 1 capital)2 x 15.9 20.5 8.2 9.2 7.2 8.2 8.2Interest income to gross income (%) 64 66 65 65 69 69 66 63Cost-to-income ratio (%) 57 54 49 47 50 50 52 53
Source: OeNB.1 Excluding Yapi ve Kredi Bankasi (not fully consolidated by parent bank UniCredit Bank Austria).2 End-of-period result expected for the full year after tax as a percentage of average total assets.
Note: Due to changes in reporting, the comparability of values as from 2008 with earlier values is limited. Furthermore, some positions have been available in detail only since 2008.
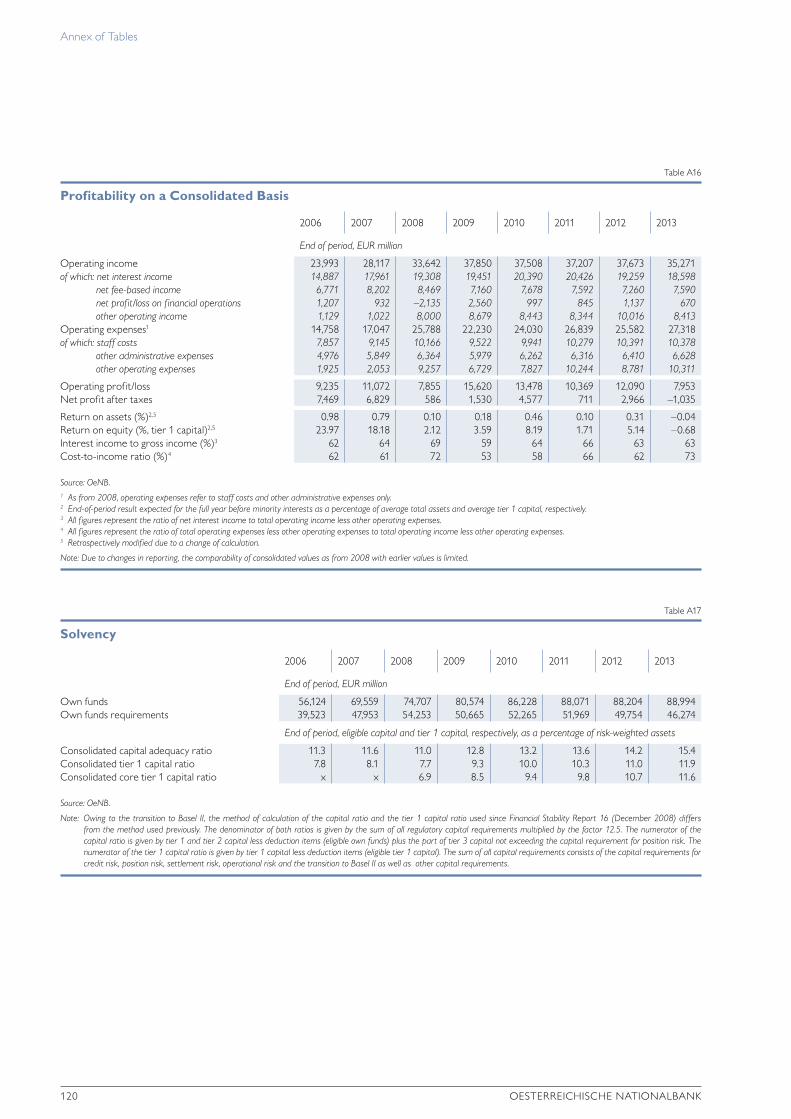
Annex of Tables
120 OESTERREICHISCHE NATIONALBANK
Table A16
Profitability on a Consolidated Basis
2006 2007 2008 2009 2010 2011 2012 2013
End of period, EUR million
Operating income 23,993 28,117 33,642 37,850 37,508 37,207 37,673 35,271 of which: net interest income 14,887 17,961 19,308 19,451 20,390 20,426 19,259 18,598
net fee-based income 6,771 8,202 8,469 7,160 7,678 7,592 7,260 7,590 net profit/loss on financial operations 1,207 932 –2,135 2,560 997 845 1,137 670 other operating income 1,129 1,022 8,000 8,679 8,443 8,344 10,016 8,413
Operating expenses1 14,758 17,047 25,788 22,230 24,030 26,839 25,582 27,318 of which: staff costs 7,857 9,145 10,166 9,522 9,941 10,279 10,391 10,378
other administrative expenses 4,976 5,849 6,364 5,979 6,262 6,316 6,410 6,628 other operating expenses 1,925 2,053 9,257 6,729 7,827 10,244 8,781 10,311
Operating profit/loss 9,235 11,072 7,855 15,620 13,478 10,369 12,090 7,953 Net profit after taxes 7,469 6,829 586 1,530 4,577 711 2,966 –1,035
Return on assets (%)2,5 0.98 0.79 0.10 0.18 0.46 0.10 0.31 –0.04Return on equity (%, tier 1 capital)2,5 23.97 18.18 2.12 3.59 8.19 1.71 5.14 –0.68Interest income to gross income (%)3 62 64 69 59 64 66 63 63Cost-to-income ratio (%)4 62 61 72 53 58 66 62 73
Source: OeNB.1 As from 2008, operating expenses refer to staff costs and other administrative expenses only. 2 End-of-period result expected for the full year before minority interests as a percentage of average total assets and average tier 1 capital, respectively.3 All f igures represent the ratio of net interest income to total operating income less other operating expenses.4 All f igures represent the ratio of total operating expenses less other operating expenses to total operating income less other operating expenses.5 Retrospectively modified due to a change of calculation.
Note: Due to changes in reporting, the comparability of consolidated values as from 2008 with earlier values is limited.
Table A17
Solvency
2006 2007 2008 2009 2010 2011 2012 2013
End of period, EUR million
Own funds 56,124 69,559 74,707 80,574 86,228 88,071 88,204 88,994 Own funds requirements 39,523 47,953 54,253 50,665 52,265 51,969 49,754 46,274
End of period, eligible capital and tier 1 capital, respectively, as a percentage of risk-weighted assets
Consolidated capital adequacy ratio 11.3 11.6 11.0 12.8 13.2 13.6 14.2 15.4 Consolidated tier 1 capital ratio 7.8 8.1 7.7 9.3 10.0 10.3 11.0 11.9 Consolidated core tier 1 capital ratio x x 6.9 8.5 9.4 9.8 10.7 11.6
Source: OeNB.
Note: Owing to the transition to Basel II, the method of calculation of the capital ratio and the tier 1 capital ratio used since Financial Stability Report 16 (December 2008) differs from the method used previously. The denominator of both ratios is given by the sum of all regulatory capital requirements multiplied by the factor 12.5. The numerator of the capital ratio is given by tier 1 and tier 2 capital less deduction items (eligible own funds) plus the part of tier 3 capital not exceeding the capital requirement for position risk. The numerator of the tier 1 capital ratio is given by tier 1 capital less deduction items (eligible tier 1 capital). The sum of all capital requirements consists of the capital requirements for credit risk, position risk, settlement risk, operational risk and the transition to Basel II as well as other capital requirements.

Annex of Tables
FINANCIAL STABILITY REPORT 27 – JUNE 2014 121
Table A19
Market Risk1
2006 2007 2008 2009 2010 2011 2012 2013
End of period, EUR million and %
Interest rate riskBasel ratio for interest rate risk, %2 5.6 4.5 3.9 3.7 3.9 5.0 4.0 3.8 Capital requirement for the position risk of interest rate instruments in the trading book 737.3 1,082.6 953.3 780.9 618.3 625.0 441.9 324.2
Exchange rate riskCapital requirement for open foreign exchange positions 75.2 74.1 110.3 75.2 81.1 92.3 70.8 61.7
Equity price riskCapital requirement for the position risk of equities in the trading book 101.0 180.6 186.9 176.9 197.1 191.3 151.5 107.1
Source: OeNB.1 Based on unconsolidated data. The calculation of capital requirements for market risk combines the standardized approach and internal value-at-risk (VaR) calculations. The latter use
previous day values without taking account of the multiplier. Capital requirements for interest rate instruments and equities are computed by adding up both general and specific position risks.
2 Average of the Basel ratio for interest rate risk (loss of present value following a parallel yield curve shift of all currencies by 200 basis points in relation to regulatory capital) weighted by total assets of all Austrian credit institutions excluding banks that operate branches in Austria under freedom of establishment. For banks with a large securities trading book, interest rate instruments of the trading book are not included in the calculation.
Table A18
Liquidity Risk
2006 2007 2008 2009 2010 2011 2012 2013
End of period, %
Short-term loans to short-term liabilities 66.2 64.0 67.0 72.5 64.2 65.9 66.0 59.0Short-term loans and other liquid assets to short-term liabilities 115.0 109.9 109.0 124.8 118.9 118.1 120.6 109.0Liquid resources of the first degree: 5% quantile of the ratio between available and required liquidity of degree 11 152.4 140.0 149.4 139.9 145.1 152.4 295.4 278.2Liquid resources of the second degree: 5% quantile of the ratio between available and required liquidity of degree 2 111.5 110.2 113.5 110.8 111.3 110.9 112.1 110.1
Source: OeNB.1 Short-term loans and short-term liabilities (up to three months against banks and nonbanks). Liquid assets (quoted stocks and bonds, government bonds and eligible collateral, cash and
liquidity reserves at apex institutions). The liquidity ratio relates liquid assets to the corresponding liabilities. Article 25 of the Austrian Banking Act defines a minimum ratio of 2.5% for liquid resources of the first degree (cash ratio) and of 20% for liquid resources of the second degree (quick ratio). The 5% quantile indicates the ratio between available and required liquidity of liquidity surpassed by 95% of banks on the respective reporting date.

Annex of Tables
122 OESTERREICHISCHE NATIONALBANK
Table A20
Market Indicators of Selected Austrian Financial Instruments
2006 2007 2008 2009 2010 2011 2012 2013
Share prices % of mid-2005 prices
Erste Group Bank 139.5 116.4 38.9 66.4 91.8 35.8 61.2 64.9Raiffeisen Bank International 221.4 198.6 37 75.7 82.5 40.3 60.3 49.1EURO STOXX – Banks 142.9 130.2 47.2 70.3 52.4 32.8 35.9 45.2Uniqa 154.9 129.3 111.8 80.3 90.2 57.8 61.2 60Vienna Insurance Group 119.6 123.7 54.2 81 88.6 71.7 90.8 81.4EURO STOXX – Insurance 145.4 130.8 68.9 75 71 58.8 76.4 101.8
Relative valuation Price-to-book value ratio
Erste Group Bank 2.03 1.74 0.50 0.80 1.30 0.48 0.88 0.93Raiffeisen Bank International 3.05 2.84 0.55 1.12 1.15 0.53 0.83 0.68EURO STOXX – Banks 2.2 1.75 0.57 0.94 0.64 0.36 0.60 0.96Uniqa 2.6 2.18 1.94 1.41 2.25 1.18 1.05 1.03Vienna Insurance Group 2.47 1.79 0.71 1.03 1.21 0.98 1.07 0.96EURO STOXX – Insurance 1.98 1.68 0.84 1.03 0.94 0.69 0.81 0.93
Source: Thomson Reuters, Bloomberg.
Table A21
Key Indicators of Austrian Insurance Companies
2006 2007 2008 2009 2010 2011 2012 2013
End of period, EUR million
Business and profitabilityPremiums x 15,739 16,180 16,381 16,652 16,537 16,341 16,608Expenses for claims and insurance benefits x 10,797 11,608 12,348 11,882 12,826 12,973 13,150Underwriting results x 301 –119 132 373 295 455 592Profit from investments x 4,168 2,370 2,729 3,203 2,964 3,391 3,354Profit from ordinary activities x 1,773 411 744 1,101 1,162 1,395 1,524Acquisition and administrative expenses x 3,259 3,315 3,241 3,382 3,541 3,499 3,528Total assets x 86,951 93,911 99,227 105,099 105,945 108,374 110,391
InvestmentsTotal investments x 81,036 87,698 92,260 98,300 99,776 103,272 105,496of which: debt securities x 32,989 35,209 36,397 38,223 37,813 37,614 39,560
stocks and other equity securities1 x 11,452 12,531 12,811 12,559 12,363 12,505 12,464real estate x 4,818 5,138 5,246 5,703 5,236 5,371 5,689
Investments for unit-linked and index-linked life insurance x 8,894 9,319 12,822 15,325 15,870 18,330 19,127Claims on domestic banks x x 16,079 17,168 16,458 16,405 16,872 16,687Reinsurance receivables x x 1,272 1,218 1,229 1,733 1,933 824
Risk capacity (solvency ratio), % x 300.0 300.0 300.0 356.0 332.0 350.0 368.0
Source: FMA, OeNB.1 Contains shares, share certif icates (listed and not listed) and all equity instruments held by mutual funds.

Annex of Tables
FINANCIAL STABILITY REPORT 27 – JUNE 2014 123
Table A22
Assets Held by Austrian Mutual Funds
2006 2007 2008 2009 2010 2011 2012 2013
End of period, EUR million
Domestic securities 49,593 58,920 48,777 48,765 51,001 50,046 50,963 49,757of which: debt securities 17,632 14,938 14,601 16,013 15,884 16,683 17,527 16,203 stocks and other equity securities 31,961 3,812 1,473 2,863 3,696 2,991 3,637 3,610Foreign securities 109,306 106,726 78,655 89,845 96,684 87,458 96,854 99,647of which: debt securities 70,280 66,473 57,598 61,961 61,744 58,695 63,661 62,972 stocks and other equity securities 39,026 23,723 8,899 12,663 15,540 12,097 14,208 16,278Net asset value 168,860 165,646 127,432 138,610 147,684 137,504 147,817 149,404of which: retail funds 120,402 117,864 82,804 85,537 88,313 78,299 84,158 83,238 institutional funds 48,458 47,782 44,628 53,073 59,372 59,205 63,659 66,167Consolidated net asset value 140,829 137,092 105,620 115,337 123,794 116,747 126,831 128,444
Source: OeNB.
Table A23
Structure and Profitability of Austrian Fund Management Companies
2006 2007 2008 2009 2010 2011 2012 2013
End of period, EUR million
Total assets 537 544 504 642 699 661 644 670 Operating profit 138 178 89 106 142 125 111 131 Net commissions and fees earned 288 354 269 258 302 284 283 310 Administrative expenses1 162 194 196 185 199 195 205 219 Number of fund management companies 27 28 29 30 29 29 29 29Number of reported funds 2,177 2,329 2,308 2,182 2,203 2,171 2,168 2,161
Source: OeNB.1 Administrative expenses are calculated as the sum of personnel and material expenses.

Annex of Tables
124 OESTERREICHISCHE NATIONALBANK
Table A24
Assets Held by Austrian Pension Funds
2006 2007 2008 2009 2010 2011 2012 2013
End of period, EUR million
Total assets 12,496 12,924 11,936 13,734 14,976 14,798 16,335 17,385 of which: direct investment x x x 1,239 968 1,139 1,139 1,640 mutual funds x x x 11,235 13,944 13,626 15,278 17,383 foreign currency (without derivatives) x x x x x x 5,714 5,963 stocks x x x x x x 4,805 5,472 debt x x x x x x 8,464 7,650 real estate x x x x x x 567 582 cash and deposits x x x x 1,181 1,624 1,488 2,033
Source: OeNB, FMA.
Table A25
Assets Held by Austrian Severance Funds
2006 2007 2008 2009 2010 2011 2012 2013
End of period, EUR million
Total direct investment 295.6 598.3 1,062.2 884 1,004 1,393 1,442 1,528 of which: euro-denominated 288.4 579.6 1,043.4 866 985 1,363 1,415 1,507 foreign currency-denominated x 18.7 18.8 17 19 30 27 21 accrued income claims from direct investment 4.2 8.6 16.5 15 16 19 22 55 Total indirect investment 832.5 1,023.8 1,076.4 1,946 2,569 2,891 3,834 4,701 of which: total of euro-denominated investment in
mutual fund shares 781.4 963.8 1,038.7 1,858 2,379 2,741 3,540 4,220 total of foreign currency-denominated
investment in mutual fund shares 51.1 60.0 37.7 88 190 151 294 481 Total assets assigned to investment groups 1,128.1 1,622.1 2,138.6 2,830 3,573 4,284 5,254 6,218
Source: OeNB.
Note: Due to special balance sheet operations, total assets assigned to investment groups deviate from the sum of total indirect investments.

Annex of Tables
FINANCIAL STABILITY REPORT 27 – JUNE 2014 125
Table A26
Transactions and System Disturbances in Payment and Securities Settlement Systems
2006 2007 2008 2009 2010 2011 2012 2013
Number of transactions in million, value of transactions in EUR billion
HOAM.ATNumber x x 3 1 1 1 1 1 Value x x 6,724 9,305 9,447 7,667 9,974 5,906 System disturbances x x 5 5 4 1 1 3 Securities settlement systemsNumber 3 3 2 2 2 2 2 2 Value 449 600 502 365 398 439 418 369 System disturbances 0 0 0 0 0 0 1 5 Retail payment systemsNumber 449 492 528 574 617 666 688 1,005 Value 35 37 42 46 49 50 55 72 System disturbances 58 20 16 19 25 4 4 2 Participation in international payment systemsNumber 17 21 25 31 31 36 41 53 Value 1,469 1,946 1,995 1,225 1,164 1,306 1,820 1,643 System disturbances 4 1 0 0 0 0 0 0
Source: OeNB.
Note: Data refer to the respective 12-month period.


Notes
128 OESTERREICHISCHE NATIONALBANK
The following contributions can be downloaded at www.oenb.at.
Financial Stability Report 26Macroprudential Policy: A Complementing Pillar in Prudential Supervision – The EU and Austrian FrameworksDavid Liebeg, Alexander Trachta
Quantifying Financial Stability in Austria – New Tools for Macroprudential SupervisionJudith Eidenberger, Benjamin Neudorfer, Michael Sigmund, Ingrid Stein
Credit Boom in Russia despite Global Woes – Driving Forces and RisksStephan Barisitz
ARNIE in Action: The 2013 FSAP Stress Tests for the Austrian Banking SystemMartin Feldkircher, Gerhard Fenz, Robert Ferstl, Gerald Krenn, Benjamin Neudorfer, Claus Puhr, Thomas Reininger, Stefan W. Schmitz, Martin Schneider, Christoph Siebenbrunner, Michael Sigmund, Ralph Spitzer
Financial Stability Report 25The Single Supervisory Mechanism within the Banking Union – Novel Features and Implications for Austrian Supervisors and Supervised EntitiesDieter Huber, Elisabeth von Pföstl
Household Vulnerability in Austria – A Microeconomic Analysis Based on the Household Finance and Consumption SurveyNicolás Albacete, Peter Lindner
Stress Test Robustness: Recent Advances and Open ProblemsThomas Breuer, Martin Summer
Macroeconomic, Market and BankSpecific Determinants of the Net Interest Margin in AustriaUlrich Gunter, Gerald Krenn, Michael Sigmund
Measuring Financial (In)Stability in Emerging Europe: A New IndexBased ApproachPetr Jakubík, Tomáš Slacík
Financial Stability Report 24How Do Austrian Banks Fund Their Swiss Franc Exposure?Raphael A. Auer, Sébastien Kraenzlin, David Liebeg
Contagiousness and Vulnerability in the Austrian Interbank MarketClaus Puhr, Reinhardt Seliger, Michael Sigmund
Clustering Austrian Banks’ Business Models and Peer Groups in the European Banking SectorRobert Ferstl, David Seres
List of Special TopicsPublished in the Financial Stability Report Series

FINANCIAL STABILITY REPORT 27 – JUNE 2014 129
Periodical Publications
See www.oenb.at for further details.
Geschäftsbericht (Nachhaltigkeitsbericht) German 1 annuallyAnnual Report (Sustainability Report) English 1 annuallyThis report informs readers about the Eurosystem’s monetary policy and underlying economic conditions as well as about the OeNB’s role in maintaining price stability and financial stability. It also provides a brief account of the key activities of the OeNB’s core business areas. The OeNB’s financial statements are an integral part of the report.http://www.oenb.at/en/Publications/Oesterreichische-Nationalbank/Annual-Report.html
Konjunktur aktuell German 1 seven times a yearThis online publication provides a concise assessment of current cyclical and financial developments in the global economy, the euro area, Central, Eastern and Southeastern European countries, and in Austria. The quarterly releases (March, June, September and December) also include short analyses of economic and monetary policy issues. http://www.oenb.at/Publikationen/Volkswirtschaft/Konjunktur-aktuell.html
Monetary Policy & the Economy English 1 quarterlyThis publication assesses cyclical developments in Austria and presents the OeNB’s regular macroeconomic forecasts for the Austrian economy. It contains economic analyses and studies with a particular relevance for central banking and summarizes findings from macroeconomic workshops and conferences organized by the OeNB.http://www.oenb.at/en/Publications/Economics/Monetary-Policy-and-the-Economy.html
Fakten zu Österreich und seinen Banken German 1 twice a yearFacts on Austria and Its Banks English 1 twice a yearThis online publication provides a snapshot of the Austrian economy based on a range of structural data and indicators for the real economy and the banking sector. Comparative international measures enable readers to put the information into perspective.http://www.oenb.at/en/Publications/Financial-Market/Facts-on-Austria-and-Its-Banks.html
Financial Stability Report English 1 twice a yearThe Reports section of this publication analyzes and assesses the stability of the Austrian financial system as well as developments that are relevant for financial stability in Austria and at the international level. The Special Topics section provides analyses and studies on specific financial stabilityrelated issues.http://www.oenb.at/en/Publications/Financial-Market/Financial-Stability-Report.html
Focus on European Economic Integration English 1 quarterlyThis publication presents economic analyses and outlooks as well as analytical studies on macroeconomic and macrofinancial issues with a regional focus on Central, Eastern and Southeastern Europe.http://www.oenb.at/en/Publications/Economics/Focus-on-European-Economic-Integration.html
Statistiken – Daten & Analysen German 1 quarterlyThis publication contains analyses of the balance sheets of Austrian financial institutions, flowof funds statistics as well as external statistics (English summaries are provided). A set of 14 tables (also available on the OeNB’s website) provides information about key financial and macroeconomic indicators. http://www.oenb.at/Publikationen/Statistik/Statistiken---Daten-und-Analysen.html

Periodical Publicationsof the Oesterreichische Nationalbank
130 OESTERREICHISCHE NATIONALBANK
Statistiken – Daten & Analysen: Sonderhefte German 1 irregularlyStatistiken – Daten & Analysen: Special Issues English 1 irregularlyIn addition to the regular issues of the quarterly statistical series “Statistiken – Daten & Analysen,” the OeNB publishes a number of special issues on selected statistics topics (e.g. sector accounts, foreign direct investment and trade in services).http://www.oenb.at/en/Publications/Statistics/Special-Issues.html
Research Update English 1 quarterlyThis online newsletter informs international readers about selected research findings and activities of the OeNB’s Economic Analysis and Research Department. It offers information about current publications, research priorities, events, conferences, lectures and workshops. Subscribe to the newsletter at: http://www.oenb.at/en/Publications/Economics/Research-Update.html
CESEE Research Update English 1 quarterlyThis online newsletter informs readers about research priorities, publications as well as past and upcoming events with a regional focus on Central, Eastern and Southeastern Europe. Subscribe to the newsletter at:http://www.oenb.at/en/Publications/Economics/CESEE-Research-Update.html
OeNB Workshops Proceedings German, English 1 irregularlyThis series, launched in 2004, documents contributions to OeNB workshops with Austrian and international experts (policymakers, industry experts, academics and media representatives) on monetary and economic policymakingrelated topics.http://www.oenb.at/en/Publications/Economics/Proceedings-of-OeNB-Workshops.html
Working Papers English 1 irregularlyThis online series provides a platform for discussing and disseminating economic papers and research findings. All contributions are subject to international peer review. http://www.oenb.at/en/Publications/Economics/Working-Papers.html
Proceedings of the Economics Conference English 1 annuallyThe OeNB’s annual Economics Conference provides an international platform where central bankers, economic policymakers, financial market agents as well as scholars and academics exchange views and information on monetary, economic and financial policy issues. The proceedings serve to document the conference contributions.http://www.oenb.at/en/Publications/Economics/Economics-Conference.html
Proceedings of the Conference on European Economic Integration English 1 annuallyThe OeNB’s annual Conference on European Economic Integration (CEEI) deals with current issues with a particular relevance for central banking in the context of convergence in Central, Eastern and Southeastern Europe as well as the EU enlargement and integration process. For an overview see:http://www.oenb.at/en/Publications/Economics/Conference-on-European-Economic-Integration-CEEI.htmlThe proceedings have been published with Edward Elgar Publishers, Cheltenham/UK, Northampton/MA, since the CEEI 2001.www.e-elgar.com
Publications on Banking Supervisory Issues German, English 1 irregularlyCurrent publications are available for download; paper copies may be ordered free of charge. See www.oenb.at for further details.http://www.oenb.at/en/Publications/Financial-Market/Publications-of-Banking-Supervision.html

FINANCIAL STABILITY REPORT 27 – JUNE 2014 131
Addresses
Postal address Phone/fax/e-mail
Head OfficeOtto-Wagner-Platz 3 PO Box 61 Phone: (+43-1) 404 20-6666 1090 Vienna, Austria 1011 Vienna, Austria Fax: (+43-1) 404 20-042399 Internet: www.oenb.at E-mail: [email protected]
Branch OfficesNorthern Austria Branch Office Coulinstraße 28 PO Box 346 Phone: (+43-732) 65 26 11-04020 Linz, Austria 4021 Linz, Austria Fax: (+43-732) 65 26 11-046399 E-mail: [email protected]
Southern Austria Branch OfficeBrockmanngasse 84 PO Box 8 Phone: (+43-316) 81 81 81-08010 Graz, Austria 8018 Graz, Austria Fax: (+43-316) 81 81 81-046799 E-mail: [email protected]
Western Austria Branch Office Adamgasse 2 Adamgasse 2 Phone: (+43-512) 908 100-06020 Innsbruck, Austria 6020 Innsbruck, Austria Fax: (+43-512) 908 100-046599 E-mail: [email protected]
Representative OfficesNew York Representative Office Phone: (+1-212) 888-2334 Oesterreichische Nationalbank Fax: (+1-212) 888-2515450 Park Avenue, Suite 1202 10022 New York, U.S.A.
Brussels Representative Office Phone: (+32-2) 285 48-41, 42, 43Oesterreichische Nationalbank Fax: (+32-2) 285 48-48 Permanent Representation of Austria to the EUAvenue de Cortenbergh 30 1040 Brussels, Belgium