financial stability report - bank of mauritius | · 2016-06-29 · that uses this report as a...
TRANSCRIPT

BANK OF MAURITIUS
February 2015
Financial StabilityReport

February 2015
B A N K O F M AU R I T I U SFINANCIAL STABILITY REPORT

All rights reserved. Reproduction for educational and non-commercial purposes is permitted subject to acknowledgement. The Bank of Mauritius would appreciate receiving a copy of any publication that uses this Report as a source. No use may be made of this Report for resale or for any other commercial purpose whatsoever, without prior permission in writing from the Bank of Mauritius.
The Report is available in PDF format on the Bank’s website at https://www.bom.mu under the menu item Research and Publications. The Bank of Mauritius welcomes any comment or suggestion on this publication, which may be sent to [email protected].
Disclaimer
The Bank of Mauritius publishes this Report for general information only, and not to serve as financial or other advice. Whilst we take every precaution to ensure the information in the Report is accurate, the Bank of Mauritius shall not be liable to any person where the information in the Report is incomplete or incorrect, subject to interpretation, nor for any assessment or opinion contained in this Report.
Financial Stability Report February 2015
© Bank of Mauritius 2015
ISSN: 1694-2353

FINANCIAL STABILITY REPORT | AUGUST 2011 SECTION
Preface 1
1. Executive Summary 3
2. Macroeconomic Environment 7
2.1 Global Economy 7
2.2 Global Equity Markets 8
2.3 Domestic Economy 8
2.4 Regional Interconnectedness 14
3. Debt Indicators of Households and Corporations 19
3.1 Households 19
3.2 Corporations 20
4. Banking Sector 274.1 Overview 27
4.2 Financial Soundness Indicators 29
5. Non-Bank Financial Intermediaries 355.1 Non-Bank Deposit-Taking Sector 35
5.2 Insurance Sector 37
5.3 Pensions Industry 38
5.4 Reinsurance 39
6. Payment Systems Infrastructure 41
7. Risk Analysis 45
8. Concluding Remarks 49
Annex 51
List of Charts 52
List of Tables 53
List of Boxes 53
Acronyms 54
Glossary 55
FINANCIAL STABILITY REPORT | FEBRUARY 2015 TABLE OF CONTENTS
Table of Contents

1
PREFACEFINANCIAL STABILITY REPORT | FEBRUARY 2015
Financial stability is the resilience of the financial system to respond to adverse shocks, while continuing to function smoothly and supporting the ability of households and firms to use their financial assets with confidence. A stable financial system contributes towards broader economic growth and rising living standards of all people. The Bank of Mauritius has the mandate to promote the stability and soundness of the financial system of the country. It achieves this objective through delivering on its core functions, notably:
• conducting effective supervision and regulation of banks;
• ensuring the orderly functioning of money and foreign exchange markets; and
• fostering the development of reliable clearing, payment and settlement systems.
The Bank collaborates with several domestic, regional and international bodies with a view to promoting stability of the domestic financial sector.
The Bank publishes the Financial Stability Report twice a year, as required by the Bank of Mauritius Act 2004. The Bank releases the Report in February and August. The Report reviews international and domestic macro-financial developments and assesses potential risks to the stability of the domestic financial system. It focuses on banking and non-banking sector developments, and vulnerabilities that may affect the financial sector’s overall soundness. It also highlights measures taken by the Bank and other regulatory authorities to mitigate financial risks. Through this Report, the Bank seeks to enhance awareness of the soundness of the Mauritian financial system.
Preface

3
FINANCIAL STABILITY REPORT | FEBRUARY 2015 EXECUTIVE SUMMARY
Since 2008, the Bank of Mauritius has been publishing Financial Stability Reports (FSRs) that include assessments of key sectors, including payment systems infrastructure and institutions that are important for financial stability.
The current Report contains an assessment of the stability and resilience of the domestic financial system using available economic and financial data up to the end of December 2014 as per availability of data. The Report reviews the main developments in the global and domestic economies (Section 2), analyses the financial position of debtors and creditors (Sections 3, 4 and 5), sets out the domestic payment systems infrastructure (Section 6), and assesses the main risks to the financial sector (Section 7). Section 8 provides some concluding remarks.
Since the publication of the August 2014 FSR, the global economy has remained under stress, albeit with major differences between countries in terms of output growth and inflation. Except for the US, advanced economies are likely to perform below potential, although the fall in international oil prices may boost growth in consumption in the short-term. Inflation rates, which are below target levels, are a common concern among all central banks in advanced economies, especially the euro area. Leading emerging market economies also report differences in macroeconomic performance that are likely to result in different combinations of fiscal and monetary policies among them, depending on the macroeconomic policy priorities. Among the BRICS countries, Russia possibly faces the most difficult combination in terms of output growth and inflation outlook, due to the drop in oil revenue, a weak currency and economic sanctions.
The domestic economy showed macroeconomic resilience in 2014 and should further benefit from the slump in international oil prices, although the declining trend in private investment warrants monitoring. Output growth and inflation remained within recent trends: real GDP grew by 3.5 per cent, while inflation dropped to a low of 0.2 per cent by the end of December 2014 with a decline in food and energy inflation. For 2015, falling international prices, which are being passed-through to domestic consumers, should support growth in private consumption and consumption-related activities, such as trade and light manufacturing. Yet, the observed declining trend in the ratio of investment to GDP is reducing the economy’s actual and potential growth. Sluggish private investment growth mirrors weak fundamentals of some leading corporations, which are highly leveraged by international standards and show declining ratios of profitability.
The weak external environment is likely to impair on Mauritius’ external position, thus needing strong surveillance of financial flows which fund the current account deficits. External trade and current account deficits have been traditionally financed by income from tourism, from net inflows of foreign direct investment (FDI) and from portfolio investment. While most of the financial flows represent Global Business Companies (GBCs) resources and, therefore, are just in-transit to other jurisdictions, leads and lags between inflows and outflows appear to have provided resources to cover the current account deficit based on the balance of payments compilation and analysis. The net GBC inflows have compensated for net outflows by local banks. Against this background, strong policy coordination is, thus, critical between the Bank of Mauritius, as regulator of banking institutions, and the Financial Services Commission (FSC), as regulator of GBCs.
1. Executive Summary
FINANCIAL STABILITY REPORT | FEBRUARY 2015EXECUTIVE SUMMARY
Household indebtedness and household debt service costs, both as a share of disposable income, are relatively low by international standards, but warrant monitoring, nonetheless. Macroprudential policies and credit limits are now in place on housing lending, thus providing standard conditions for banks in mortgage financing. Case-by-case analysis and monitoring of non-performing loans (NPL) is still needed to secure a proper implementation of the policy measures.
Corporate debt, as a share of GDP, is also relatively low by international standards in Mauritius. However, the high leverage ratio of some leading corporations in the economy remain a concern and may pose a risk to the soundness of banks. Leverage ratios in tourism, construction, real estate, traders and financial services are more than 100 per cent, which are multiples of the ratios found in comparator countries. Financial risks stemming from this situation depend on each sector’s ability to reduce its indebtedness (deleveraging), accompanied by larger equity infusion or higher revenue growth, in a reasonably short period of time. Failure to do so carries a risk of reducing private investment and overall growth of the Mauritian economy.
Banks in Mauritius are adequately capitalised and have increased their loan loss provisions, but face risks stemming from the concentration of corporate credit, thus warranting monitoring and proactive action. Core capital ratios of domestic-owned banks are in line with prudential requirements, while those held by foreign branches and subsidiaries of foreign-owned banks are higher than the prudential requirements. Banks have also increased significantly their provisions against loan losses during last year. However, current trends suggest that capital ratios of a number of domestic-owned banks could be under stress, if credit concentration risks were to materialise due to a shock impairing the financial condition of corporations. Domestic-owned banks’ exposure to highly leveraged corporations operating in the tourism, construction and real estate sectors, thus, warrant surveillance and proactive action. Initiatives in this regard may include timely re-structuring of corporates’ bank debts to address their underlying cash flow problems, increases in banks’ capital allocations, and the implementation of the April 2014 Supervisory Framework for Measuring and Controlling Large Credit Exposures that was issued by the Basel Committee on Banking Supervision (BCBS).
There are also risks stemming from banks’ sizeable foreign claims on frontier African markets and from the slow growth of the domestic economy. Credit and possible exchange rate risks exist in terms of the sizeable amount and currency denomination of banks’ foreign claims (loans and other type of assets) on frontier markets in Africa and in India. This has come at a time when there has been a slowdown in growth of credit extended to households while credit extended to corporations contracted. A prolonged decline in the ratio of corporate credit to GDP is particularly worrisome as this may adversely affect future economic growth.
Risks stemming from non-bank financial intermediaries remain broadly contained. Non-bank deposit-taking institutions (NBDTIs) remain well capitalised and their balance sheets are relatively small for the size of the economy. Insurance companies hold sizeable deposits and equity in domestic banks. While these funds could potentially experience volatility, this has historically not been the case.
Payment systems infrastructure is being upgraded and continues to operate with high levels of availability. Potential risks from failures in payment systems infrastructure have not materialised and have limited probability to happen going forward. However, it is important that the Bank of Mauritius’ current projects should be rapidly implemented for high- and low-value payments in the system, including retail and debit payments.
4

5
EXECUTIVE SUMMARYFINANCIAL STABILITY REPORT | FEBRUARY 2015
2014Q2 2014Q4
Note: Lower vulnerability closer to the center
Global economy risks
Domestic economy risks
Household debt risks
Corporate debt risks
Banking sector risks
Financial Stability Map
Between 2014Q2 and 2014Q4, there were improvements in risks stemming from the global and domestic economies, as well as those from households and the domestic banking sector, while corporate debt risks remained high and unchanged. Improvements in global economic risks reflect the recovery of the US economy, the impact of falling international oil prices and diminished volatility in global equity markets. Domestic economy risks also declined due to improvements in international terms of trade, low inflation and sustained economic growth that more than offset the impact from stagnant domestic private investment and savings. Risks stemming from the household sector debt have moderated as a result of a fall in the ratio of household bank credit to disposable income, while household indebtedness and debt service ratios remained below those recorded in comparator countries. Banking sector risks have improved marginally on account of limited growth of banks’ exposures to frontier markets abroad, while other financial indicators remain challenging, particularly large exposures. Corporate debt risks have remained significant due to high leverage ratios and low returns on equity affecting the performance of leading enterprises in the economy.
Note 1: Lower vulnerability closer to the center.
Note 2: For further information on the methodology used in the financial stability map, see Financial Stability Report February 2014.


7
MACROECONOMIC ENVIRONMENTFINANCIAL STABILITY REPORT | FEBRUARY 2015
2.1 Global Economy
Global economic activity remains weak, with widening differences across the world, despite lower international oil prices. According to the January 2015 IMF’s World Economic Outlook Update, the world economy is projected to grow by 3.5 per cent and 3.7 per cent in 2015 and 2016, respectively, compared with 3.3 per cent in 2014. Global growth would be boosted by lower oil prices, which reflect to a large extent higher supply than before. The US is currently - and likely to be - the best-performing advanced economy in 2015, with annual growth forecasts above 3 per cent. However, the world economy will be held back by weaknesses in the euro area and in Japan, and by slower growth in emerging markets economies. The IMF expects economic growth in China to slow to less than 7 per cent in 2015. Russia’s economy will suffer from declining international oil prices and economic sanctions. Brazil and South Africa face a number of uncertainties that are hampering growth, while India will likely be the best performer among BRICS.
The US economy has been recovering strongly during the last three quarters, with the US dollar strengthening against other major currencies, as markets anticipate an earlier-than-expected normalization of US policy on interest rates. According to the US Fed latest monetary statement, economic growth would be strong in 2015 and 2016, while unemployment would continue to decline. The Fed also expects the decline in oil prices to boost consumers’ demand, as the US is the second largest consumer of energy after China.
Weaknesses in the euro area and Japan remain a drag on global economic growth. Weak German and French manufacturing data, compounded with ensuing negative headline inflation in the Eurozone may continue to hamper growth within the monetary area, although stronger growth in peripheral euro countries may help to promote positive growth in the Eurozone. The decline in international oil prices should support stronger
growth. However, the euro, which just had its worst year since 2005, remains weak, reflecting a stagnant economy and political uncertainty. In Japan, enduring deflation and high real interest rates continue to threaten economic recovery and potential investment.
Economic growth in the UK, although higher than in most major advanced economies, is starting to show signs of cooling off. Concerns are that the UK economy may be affected by the malaise in the euro area and some potential political risks that remain as election time approaches.
Leading emerging markets, particularly the BRICS, also confront diverse economic trends and prospects:
• In China, most indicators show a gradual slowing in growth. Higher exports and policy measures are expected to bring growth slightly below the official target of 7.5 per cent for the year.
• In India, recent data show that growth has picked up, while inflation is falling, though still remaining above target. Falling oil prices are seen as a positive development from an Indian perspective. Yet, the economy continues to struggle with high corporate debt that hinders investment, as well as a relatively large fiscal deficit that puts pressure on interest rates.
• In Brazil, inflation remains above target and growing fiscal imbalances are reportedly impairing business and consumer confidence. The outlook for growth will depend on the economic policies expected to be brought about by the new government team aimed at spurring foreign investment, taming inflation and controlling the widening budget deficit.
• In Russia, the drop in international oil prices, as well as geopolitical tension and sanctions, continue to weigh heavily on economic activity and the exchange rate.
2. Macroeconomic Environment

8
FINANCIAL STABILITY REPORT | FEBRUARY 2015MACROECONOMIC ENVIRONMENT
• In South Africa, inflation has been marginally above target and economic activity has been held back by mining strikes and a drop in international metal prices. However, going forward, private consumption should gradually recover in line with the fall in international oil prices.
2.2 Global Equity Markets
Global equity markets experienced some volatility in late 2014, but accommodative central bank policies kept volatility relatively low throughout the year. The VIX index - measure of stock market volatility - nudged up to around 26 per cent in October 2014 (Chart 2.1). This reflected weaker-than-expected economic data in advanced economies, geopolitical tensions in Russia, and fears that Ebola would spread further. However, the pick-up was short-lived and, by early December, the VIX had already dropped to 12 per cent as investors’ risk appetite recovered and equity markets - in particular in the US - resumed their rally. By the end of the year, better-than-expected US economic data and high corporate earnings helped to calm fears in financial markets.
Markets expect volatility to remain low during 2015, albeit with some possible spikes. As in 2014, volatility will likely remain relatively low but spikes are expected to happen due to:
• uncertainties around the timing of the US Fed interest rate move;
• emerging markets’ vulnerability to falling oil prices; and
• political risk in Europe, particularly in Greece.
2.3 Domestic Economy
During 2014, the Mauritian economy continued to perform relatively well in terms of output growth and inflation and it may benefit from low international oil prices during 2015. Low international oil prices are likely to have beneficial effects on economic growth, inflation, and the balance of payments. To date, the monetary policy stance has remained accommodative with economic growth still below potential and inflation low by historical standards. Fiscal policy was broadly conservative in 2014, with the overall budget deficit - equivalent to around 3.2 per cent of GDP - remaining along past trends.
Output and Inflation
Latest national accounts estimates show that Mauritius registered a commendable annual growth rate of 3.5 per cent in 2014. Economic growth stemmed mainly from the positive contribution to growth by a number of sectors, including, “financial and insurance activities” (0.5 percentage point), “manufacturing” and “wholesale and retail trade” (0.4 percentage point each); and “information and communication”, “public administration”, “human health and social work activities”, and “professional, scientific and technical activities” (0.3 percentage point each). The construction sector, however, contributed negatively to growth for a fourth consecutive year. On the demand side, strong growth of net exports and final consumption expenditure offset a contraction of gross domestic fixed capital formation (GDFCF).
For 2015, Bank of Mauritius staff expects a marginal acceleration of economic growth supported by low international oil prices. Falling international oil prices in 2014 have been passed through to domestic customers and are likely to raise growth in private consumption, commerce and trade-related activities. The contraction of the Source: Thomson Reuters.
Chart 2.1: Volatility Index
Jan-
12
Feb-
12
Mar
-12
Apr
-12
May
-12
Jun-
12
Jul-1
2 A
ug-1
2 Se
p-12
O
ct-1
2 N
ov-1
2 D
ec-1
2 Ja
n-13
Fe
b-13
M
ar-1
3 A
pr-1
3 M
ay-1
3 Ju
n-13
Ju
l-13
Aug
-13
Sep-
13
Oct
-13
Nov
-13
Dec
-13
Jan-
14
Feb-
14
Mar
-14
Apr
-14
May
-14
Jun-
14
Jul-1
4 A
ug-1
4 Se
p-14
O
ct-1
4 N
ov-1
4 D
ec-1
4
VIX (S&P 500) Trend
Index
10
12
14
16
18
28
20
22
24
26

9
MACROECONOMIC ENVIRONMENTFINANCIAL STABILITY REPORT | FEBRUARY 2015
construction sector may also be contained, following a 4-year cumulative retrenchment of more than 20 per cent, although risks remain given the debt overhang confronting leading local corporations that may hamper investment growth.
Y-o-y overall inflation fell by 4.9 percentage points, from 5.1 per cent to 0.2 per cent over the year to December 2014, along with a fall in food and energy inflation. Concurrently, CORE2 inflation, which excludes food, beverages, tobacco,
mortgage interest payments, energy prices and administered prices, fell from 3.4 per cent to 2.1 per cent during the same period. Headline inflation (i.e., a 12-month moving average of overall inflation) was relatively flat throughout 2014, remaining at 3.2 per cent by December 2014.
Small- and medium-size enterprises remained an important source of employment and income to the Mauritian economy during 2014 (Box I).
Box I: Small- and Medium-Size Enterprises in Mauritius
Small- and Medium-Size Enterprises (SMEs) play a crucial role in the economic development of an economy by generating sustainable economic growth through job creation and contributions to the export base; and by enhancing entrepreneurial skills. In Mauritius, a small enterprise has been defined as an enterprise which has an annual turnover of not more than Rs10 million and a medium enterprise as one with annual turnover between Rs10 million and Rs50 million.
In the absence of official data on the SME sector in Mauritius, some indicators are available for Small Establishments (employing less than ten persons) in the Census of Economic Activities 2013 published by Statistics Mauritius. Table 1 shows that value added as a percentage of total GDP increased from 17.6 per cent in 2007 to 22.4 per cent in 2013. It is evidently important to ensure the sustainability of Small Establishments because of the critical role they play in the economy.
Table I: Indicators of Small Establishments, 2007 and 2013
2007 2013Value added to GDP (per cent) 17.6 22.4Employment 211,600 283,000Production Units 92,400 125,500
Source: Statistics Mauritius.
SMEs have strongly contributed to the economic development of Mauritius, yet many face financing problems, by comparison with large enterprises, in obtaining credit from banks as they often have relatively weak financial backing and may lack collateral.
To meet these problems, the Government has developed a number of schemes and facilities in terms of finance, skill enhancement and provision of logistics to promote the SME sector in Mauritius. The problems of both access to and cost of finance has been addressed through collaboration between banks and the Government in the implementation of the SME Financing Scheme in December 2011, in line with a policy set out in the November 2011 Budget. This measure was specifically aimed at addressing the high cost of credit faced by the SME sector that was jeopardising its growth, profitability and competitiveness.

10
MACROECONOMIC ENVIRONMENT FINANCIAL STABILITY REPORT | FEBRUARY 2015
Under this scheme, the domestic banking sector has extended credit facilities to SMEs amounting to Rs3 billion over the period 2012 to 2014 at 3 percentage points above the prevailing Key Repo Rate. The scheme supports new operations and the renewal of existing credit covering both investment and working capital for SMEs. A key feature of the scheme is that it provides a guarantee by the Government to offer risk cover amounting to 35 per cent of every loan and overdraft facility. This concept of risk-sharing reduces the risk to the SMEs themselves. Given the positive response, the scheme has been extended until December 2016 and an additional amount of Rs2 billion is being provided.
In December 2011, the Bank of Mauritius set up the framework through which credit would be granted on favourable terms and conditions through 14 participating commercial banks. By the end of December 2014, credit facilities approved by banks under the scheme totalled Rs4.4 billion, while the outstanding credit amount was Rs1.7 billion. There were over three thousand applications, with 95 per cent of cases duly approved. About 80 per cent of the outstanding credit facilities were provided by four banks (Chart 1). By the end of December 2014, impaired credit as a ratio of outstanding credit stood at 3.8 per cent, slightly down from 3.9 per cent at the end of December 2013. This comparatively low level of default shows how well the scheme is working.
Chart I: Distribution by Banks to credit to the SME sector, end-December 2014
Access to finance constitutes one of the 11 areas of business activity on which the World Bank compiles the ranking for Ease of Doing Business index. Table 2 shows that the ranking of Mauritius has continuously improved from 89th place in the Doing Business 2011 Report to 36th place in the Doing Business 2015 Report. The improvement partly reflects the measures targeted at improving access to finance for the SME sector.
Table II: Access to Finance
Ranking
2011 892012 782013 532014 422015 36
Source: World Bank, Ease of Doing Business Surveys 2011-2015.
The Mauritius Commercial Bank
Limited, 42.4%
SBM Bank (Mauritius) Ltd,
19.2%
Barclays Bank Mauritius Limited,
11.2%
Mauritius Post and Cooperative Bank
Ltd, 6.8%
Other, 20.4%

11
MACROECONOMIC ENVIRONMENTFINANCIAL STABILITY REPORT | FEBRUARY 2015
Investment and Savings
Investment as a share of GDP, continued to decline in 2014 and remained at a historically low level (Table 2.1 and Chart 2.2). The drop in the investment to GDP ratio in recent years mainly reflects sluggish growth in private investment, while public investment has remained broadly stable, at around 5 per cent of GDP. The decline in private investment draws attention, among other factors, to the high level of corporate indebtedness that may be restraining businesses’ ability to invest, and the weak demand for housing and business construction projects. The Incremental Capital Output Ratio (ICOR), measured as the ratio of GDFCF to GDP divided by the GDP growth rate, has increased substantially since 2009. For 2009-14, an estimated median ICOR of 6.5 per cent is higher than the historical median of 5.5 per cent, thus implying that investment is not yielding as much economic growth as in the past.
Mauritius’ recourse to external savings declined in 2014 (Table 2.2). The external current account deficit is estimated to have narrowed from 9.9 per cent of GDP in 2013 to 9.0 per cent of GDP in 2014. The decline in the current account deficit mirrors a lower trade deficit than in 2013, along falling oil and food prices on international markets. The current account deficit was largely financed by net Foreign Direct Investment (FDI) flows and portfolio
investment from GBC financial vehicles. While GBC funds are just in-transit to other jurisdictions, leads and lags with these funds appear to have compensated for net outflows of other investment (i.e. increases in banks’ net foreign asset positions) and helped finance the external current account deficit, based on the Balance of Payments (BoP)compilation and analysis. During 2014, the Bank accumulated gross international reserves of about US$300 million. Reserve import coverage by end of 2014 was equivalent to 6.1 months of imports of goods and services.
Table 2.1: Saving-Investment Balance
2011 2012 2013 2014*
(In per cent of GDP)Investment 26.0 24.8 24.0 20.5 Private (gross fixed capital formation) 18.5 17.5 16.2 14.4 Public 5.5 5.5 5.0 5.0 Change in inventories 2.0 1.7 2.8 1.1
Savings 26.0 24.8 24.0 20.5 External (- Current Account deficit) 13.8 7.3 9.9 9.0 Domestic 12.2 17.5 14.1 11.5 Private 13.4 17.1 15.0 12.1 Public -1.3 0.3 -0.8 -0.6
Memo item: CY GDP (Rs million) 323,011 343,835 366,228 387,281
* Estimates.
Sources: Statistics Mauritius and Bank of Mauritius staff estimates.
Chart 2.2: Mauritius: Gross Fixed CapitalFormation, Investment as %, and ICOR
Per cent Per cent
0.0
2.0
4.0
6.0
8.0
10.0
12.0
14.0
16.0
0
5
10
15
20
25
30
35
1994
1995
1996
1997
1998
1999
2000
2001
2002
2003
2004
2005
2006
2007
2008
2009
2010
2011
2012
2013
2014
ICOR GFCF (RHS) GFCF Investment
Sources: Statistics Mauritius and Bank of Mauritius staff calculations.

12
FINANCIAL STABILITY REPORT | FEBRUARY 2015MACROECONOMIC ENVIRONMENT
1 Valued at the end-of-period exchange rate. Estimated number differs marginally from the Statistical Bulletin number, which includes the reserve position with the IMF.
Source: BoM Statistics Division.
Table 2.2: Balance of Payments, 2010-2014
Actual Prel. Proj.2010 2011 2012 2013 2014
(In millions of US$)Current account -1,006 -1,555 -834 -1,178 -1,146Trade balance -1,893 -2,354 -2,456 -2,266 -2,188 Exports (fob) 2,259 2,563 2,651 2,870 2,984 Imports (fob) -4,152 -4,917 -5,107 -5,135 -5,172Service balance 713 797 960 700 845 o/w Travel credit 1,282 1,488 1,477 1,320 1,499Income balance -9 -118 521 297 101Current transfers 183 121 142 90 97
Capital and Financial account 849 1,365 1,180 1,080 1,090Capital account -5 -2 -8 -4 -5Financial account 854 1,367 1,188 1,084 1,095FDI (net) -421 -1,010 5,664 2,188 2,617Portfolio investment 46 8,951 1,400 1,945 3,894Other investment -17 -6,391 -5,674 -2,510 -4,778Reserve assets -201 -183 -201 -540 -637Errors and omissions net 157 190 -346 98 55
(In per cent of GDP)Current account -10.4 -13.8 -7.3 -9.9 -9.0Trade balance -19.5 -20.9 -21.5 -19.0 -17.1 Exports (fob) 23.2 22.8 23.2 24.1 23.4 Imports (fob) -42.7 -43.7 -44.6 -43.0 -40.5Service balance 7.3 7.1 8.4 5.9 6.6Income balance -0.1 -1.0 4.6 2.5 0.8Current transfers 1.9 1.1 1.2 0.8 0.8
Capital and Financial account 8.7 12.1 10.3 9.1 8.5Capital account 0.0 0.0 -0.1 0.0 0.0Financial account 8.8 12.1 10.4 9.1 8.6 FDI (net) -4.3 -9.0 49.5 18.3 20.5 Portfolio investment 0.5 79.6 12.2 16.3 30.5 Other investment -0.2 -56.8 -49.6 -21.0 -37.4 Reserve assets -2.1 -1.6 -1.8 -4.5 -5.0Errors and omissions net 1.6 1.7 -3.0 0.8 0.4
Memo items:Nominal GDP (millions of US$) 9,717 11,251 11,441 11,931 12,765BOM gross official reserves (millions of US$)1 2,567 2,730 2,995 3,433 3,969Import coverage (in months of goods & services) 5.0 4.6 4.9 5.2 6.2Average exchange rate (Rs/US$) 30.8 28.7 30.1 30.7 30.3End-of-period exchange rate (Rs/US$) 30.4 29.3 30.5 30.1 31.3

13
Domestic private savings, albeit declining as a share of GDP, remained the main funding source of the domestic investment envelope in 2014.
Fiscal Policy
During 2014, the Government continued to adopt a prudent macroeconomic management of its fiscal policies, with the overall fiscal deficit declining over the first three quarters of the year. Information through November 2014, confirms the ongoing decline in the overall deficit. On this path, the overall fiscal deficit is expected to be broadly on target - at 3.2 per cent of GDP - by close of the year. The primary deficit, which excludes interest payments from the overall fiscal deficit, is also expected to maintain a declining trend in the fourth quarter of 2014. The budget deficit is expected to be financed by domestic sources, mostly banks and non-banks, and by foreign sources.
Interest Rate Policy
During 2014, the Monetary Policy Committee kept the Key Repo Rate unchanged at 4.65 per cent against the backdrop of weak global growth and contained domestic inflationary pressures. The protracted period of low interest rates was broadly translated into low deposit and lending nominal interest rates. This led to a relatively low borrowing cost, with a return on bank deposits close to zero or negative in real terms.
Domestic Stock Market
During 2014, the aggregate stock market index (SEMDEX) and that comprising the seven largest companies listed in the stock exchange (SEM-7) remained near historical highs reached in late 2013 (Chart 2.3). During 2013, both indices increased on average by 20 per cent, while in 2014, the SEM-7 declined by 4.4 per cent between end-December 2013 and end-December 2014. The SEMDEX registered some gains (3.3 per cent q-o-q) during the 2014Q3, but ended up the year at relatively the same level as of end-December 2013. The decline in the SEM-7 index happened mainly in the last quarter of 2014, mirroring Moody’s downgrade of MCB and SBM in late October 2014, on account of material declines in their capitalisation following completion
of the group restructuring, in addition to the disappointing financial results of the largest hotelier, New Mauritius Hotels (NMH) as at September 2014.
Foreign investors were net sellers of domestic stocks during 2014, with net outflows of Rs824.5 million compared with net inflows of Rs603.6 million in 2013 (Chart 2.4). As at end-December 2014, the market was trading at a Price Earning (PE) ratio of 9.9 and a dividend yield of 2.99 per cent. Total market capitalisation on the stock market reached Rs230 billion by end-December 2014, representing some 65 per cent of the country’s GDP.
MACROECONOMIC ENVIRONMENTFINANCIAL STABILITY REPORT | FEBRUARY 2015
Chart 2.3: SEMDEX and SEM-7 Indices
85
90
95
100
105
110
115
120
SEMDEX SEM-7
Index (Jan 2012 =100)
Jan-
12
Feb-
12
Mar
-12
Apr
-12
May
-12
Jun-
12
Jul-1
2 A
ug-1
2 Se
p-12
O
ct-1
2 N
ov-1
2 D
ec-1
2 Ja
n-13
Fe
b-13
M
ar-1
3 A
pr-1
3 M
ay-1
3 Ju
n-13
Ju
l-13
Aug
-13
Sep-
13
Oct
-13
Nov
-13
Dec
-13
Jan-
14
Feb-
14
Mar
-14
Apr
-14
May
-14
Jun-
14
Jul-1
4 A
ug-1
4 Se
p-14
O
ct-1
4 N
ov-1
4 D
ec-1
4
Note: As from 02 October 2014, the SEM-7 was replaced by SEM-10.
Source: Stock Exchange of Mauritius.
Chart 2.4: Transactions by Foreign Investorson the SEM
-2,000
-1,500
-1,000
-500
0
500
1,000
1,500
2,000
2,500
2012
Q1
2012
Q2
2012
Q3
2012
Q4
2013
Q1
2013
Q2
2013
Q3
2013
Q4
2014
Q1
2014
Q2
2014
Q3
2014
Q4
Purchases Sales Net Purchases (+)/ Net Sales (-)
Rs million
Source: Stock Exchange of Mauritius.

14
FINANCIAL STABILITY REPORT | FEBRUARY 2015
Exchange Rate
Mauritius’ nominal and real effective exchange rate indices (NEER and REER, respectively) have long been appreciating, while there has been an opposite trend between the Rs/US$ and the Rs/EUR nominal exchange rates in recent months (Charts 2.5 and 2.6). During the year 2014, the NEER remained more or less stable, although it appreciated marginally compared with its 2013 levels, on top of the appreciations registered in previous years. Lowering inflation differential between Mauritius and its key trading partners (particularly India) led to a temporary appreciation of the REER in early 2014; a trend that then was reverted. The currency-
weighted nominal exchange rate indices, as measured by MERI1 and MERI2, remained stable during 2014, but depreciated in January 2015 in response to the strength of the US dollar in international markets.
2.4 Regional Interconnectedness
Regional inter-connectedness amounts basically to claims of Mauritian residents on non-resident economic units. These claims could be assessed, inter alia, using banks’ balance sheet data and/or foreign direct investment cumulative flows. In the case of Other Depository Corporations (ODCs) - which include the consolidated accounts of resident banks and non-banks deposit-taking institutions - claims on non-residents are classified as gross foreign assets in the ODCs’ balance sheets. ODCs hold claims on non-residents in lieu of Global Business Companies (GBCs) deposits and deposits from non-GBCs sources held with them (Box II). Cumulative foreign direct investment flows are measured using the IMF Coordinated Direct Investment Survey (CDIS).
ODCs’ Claims on Non-Residents
By end-September 2014, ODCs held claims on non-residents amounting to about Rs766 billion (some US$25 billion), of which close to 40 per cent was on-lent resources belonging to GBCs and 60 per cent were deposits belonging to non-GBC economic units (Chart 2.7 and Table 2.3). Information on the specific allocation of GBC funds abroad is rather scarce, although the Bank has better information about the country allocation of non-GBC monies placed abroad. Specifically, India, Europe and South Africa received about 58 per cent of non-GBC monies (loans and other type of domestic banks’ foreign assets) placed abroad, while claims on Nigerian and Tanzanian residents sum up to barely 2.5 per cent of those monies. On average, between 2011 and 2014, banks’ foreign claims on non-GBC units were equivalent to US$18 billion, compared with US$9 billion in GBC deposits placed abroad.
MACROECONOMIC ENVIRONMENT
Chart 2.6: Exchange Rate Movements
96
110
112
114
116
Rs/USD Rs/EUR Rs/GBP
Index (Jan 2012=100)
Appreciation
98
100
102
104
106
108
Jan-
12
Feb-
12
Mar
-12
Apr
-12
May
-12
Jun-
12
Jul-1
2 A
ug-1
2 Se
p-12
O
ct-1
2 N
ov-1
2 D
ec-1
2 Ja
n-13
Fe
b-13
M
ar-1
3 A
pr-1
3 M
ay-1
3 Ju
n-13
Ju
l-13
Aug
-13
Sep-
13
Oct
-13
Nov
-13
Dec
-13
Jan-
14
Feb-
14
Mar
-14
Apr
-14
May
-14
Jun-
14
Jul-1
4 A
ug-1
4 Se
p-14
O
ct-1
4 N
ov-1
4 D
ec-1
4
Chart 2.5: Evolution of NEER, REER, MERI1and MERI2 Indices
Index (Aug 2009 = 100)
Aug
-09
Dec
-09
Apr
-10
Aug
-10
Dec
-10
Apr
-11
Aug
-11
Dec
-11
Apr
-12
Aug
-12
Dec
-12
Apr
-13
Aug
-13
Dec
-13
Apr
-14
Aug
-14
Dec
-14
80.0
85.0
90.0
95.0
100.0
105.0
1. An increase indicates a depreciation of the NEER and REER indices.2. The NEER is a trade-weighted index. The MERI1 and MERI2 are based on the currency distribution of merchandise trade and trade merchandise and services, respectively, excluding transactions in rupees.
NEER REER MERI1 MERI2

15
ODCs face credit and possible exchange rate risks on their claims on non-residents. Credit risk depends on the borrower’s ability to pay his/her debt, while exchange rate risk depends on the currency denomination of those foreign claims on non-residents. In this regard, exchange rate risk may have increased in terms of the significant nominal exchange rate depreciations registered in South Africa, India and Tanzania over the past three years. Currencies of leading emerging markets, such as Russia, India, South Africa and Turkey, were particularly hit in mid-2013, as a result of uncertainties surrounding the exit from quantitative easing by the US Fed. The ensuing depreciation of the euro against other major currencies is another potential source of exchange rate risk that needs to be monitored.
CDIS Data
The Bank of Mauritius regularly reports information to the IMF on the CDIS (Table 2.4). The CDIS, which is conducted annually, is a major global statistical undertaking designed to improve the quality of data on direct investment positions, both at aggregate geographic levels and by immediate counterpart
economy, broken down into net equity and net debt positions. These data initiatives support the objective of developing cross border data on inter-country transactions, contributing to a better understanding of financial interconnectedness. Such information helps the IMF in matching foreign claims and liabilities across countries, with a view to achieving global consistency in the compilation of BoP statistics.
MACROECONOMIC ENVIRONMENTFINANCIAL STABILITY REPORT | FEBRUARY 2015
Chart 2.7: Banks: Gross Foreign Assets (As of September of each year)
0
5
10
15
20
25
30
2010 2011 2012 2013 2014
GBC1s foreign assets Other foreign assets
US$ billion
Table 2.3: Other Depository Corporations Composition of Gross Foreign Assets
As of end-September 2014
September 2014 in per cent of Total Memo Items
Currency Units, per US$
Rs million per cent2012 2013 2014
Cummulative depreciation (2012 - 2014)
Gross Foreign Assets 766,360 100.0 GBC1s 291,963 38.1 Other 474,397 61.9 India 237,311 31.0 54.99 61.80 63.03 14.62 Europe 152,137 19.9 0.76 0.73 0.83 8.90 South Africa 53,366 7.0 8.50 10.45 11.57 36.12 Nigeria 9,718 1.3 156.10 159.90 182.90 17.17 Tanzania 7,743 1.0 1580.00 1582.00 1728.00 9.37 Other 14,122 1.8
Sources: Bank of Mauritius and various country’s exchange rate publications.

16
FINANCIAL STABILITY REPORT | FEBRUARY 2015MACROECONOMIC ENVIRONMENT
Box II: Global Business Companies
The Global Business sector was established in Mauritius in 1992 to attract foreign investment to a wide range of banking and non-banking activities. Early 2010, there were around 28,000 Global Business vehicles established in Mauritius, including some 600 funds. Mauritius is an effective offshore jurisdiction and has signed about 36 Double Taxation Agreements (DTAs). Based on the legislation governing its Global Business, Mauritius enables corporate and commercial clients to access the benefits of its DTAs for investment purposes, and, at the same time, is attracting private clients to manage their finances outside the European Union.
Global Business Companies (GBCs)2 offer investors an efficient vehicle for tax structuring and planning. There are two types of GBCs, based on the category of licence - GBC1 and GBC2. A GBC1 is established as a Collective Investment Scheme, Global Fund, Protected Cell Company or an investment holding company. A Trust can also qualify for a GBC1 licence. In addition to the benefits available from the expanding network of DTAs, a GBC1 also offers investors the following advantages:
• Low tax rate• Generous tax credits• No withholding tax on dividends, interest and royalties paid• No capital gains tax• Free repatriation of profits, capital and interest• No estate duty, inheritance, wealth or gift tax• Protection of assets
A GBC1 is considered to be a tax resident in Mauritius and enjoys benefits under the extensive DTA network of Mauritius. Income is taxable at a maximum effective rate of 3 per cent. A GBC1 is generally used when overseas income is predominantly in the form of dividends, royalties, interest and capital gains and when DTA benefits are needed.
A GBC2 can carry out most business activities but only with non-residents and in currencies other than the Mauritian rupee. However, it is not tax resident in Mauritius and therefore cannot benefit from the DTA network. It is completely exempt from paying taxes in Mauritius. A GBC2 enjoys a flexible legal regime. Companies that are engaged in invoicing, marketing and international trading activities will often use a GBC2 structure.
The new Financial Services Act adopted in July 2007 distinguishes between Mauritian companies conducting business in Mauritius and those conducting business outside Mauritius. Consequently,
2 Mauritius: A Guide to Global Business - A joint publication of HSBC Bank (Mauritius) and Kemp Chatteris Deloitte.
At the end of 2013, which is the latest available information, CDIS data identify India as the main recipient of direct investment flows from Mauritius. CDIS data show that India receives some 48 per cent of Mauritius’ cumulative FDI flows. Other important destinations of Mauritian investment include China and Singapore. As in
the case of ODCs, the nominal depreciation of the Indian rupee during the last three years could pose an important exchange rate risk to the extent that claims on Indian residents are denominated in the local currency. Further research in this area is, thus, warranted.

17
MACROECONOMIC ENVIRONMENTFINANCIAL STABILITY REPORT | FEBRUARY 2015
companies which elect to provide a service or to make an investment abroad may opt for the global business licence. GBC1s are managed and controlled in Mauritius and are required to have “substance” here. They are also encouraged to have research and other support services in Mauritius. The reputation of Mauritius rests not only on the tax planning considerations but also on the quality of services, the legal and regulatory framework and the relatively high status of our International Financial Corporations.
On 4 September 2013, the FSC announced amendments to the Guide to Global Business. GBCs are required to satisfy at least one of the following criteria:
• The GBCs have or propose to have office premise(s) in Mauritius.• The GBCs employ or propose to employ, at least one resident on a full time basis, at administrative/
technical level.• The GBCs’ constitution containing a clause whereby all disputes arising out of the constitution shall
be resolved by way of arbitration in Mauritius.• The GBCs hold or are expected to hold within the next 12 months, assets (excluding cash held in
bank account or shares/interests in another corporation holding a Global Business License) which are worth at least US$100,000 in Mauritius.
• The GBCs shares are listed on a securities exchange licensed by the FSC.• The GBCs have or are expected to have a yearly expenditure in Mauritius which can be reasonably
expected from any similar corporation which is controlled and managed from Mauritius.
All GBCs have to comply with these new requirements by 1 January 2015.
Sources
1. The Guide to Global Business Financial Services Commission.2. Mauritius: A Guide to Global Business.3. NS Management Ltd - Your One Stop Shop for Global Business Solutions.
1 The Coordinated Direct Investment Survey includes cross-border position data of GBC1s obtained from the 2013 survey results.
Source: IMF Website. For further information consult http://cdis.imf.org.
Table 2.4: Coordinated Direct Investment Survey1 - Position Data for Mauritius as at end-2013 vis-à-vis Top Ten Counterpart Economies
Inward Direct Investment: Total and from top ten counterpart economies
Outward Direct Investment: Total and to top ten destination economies
Rs million Share (per cent) Rs million Share (per cent)Total Inward Investment 238,002 Total Outward Investment 226,835
United States 54,131 22.7 India 108,074 47.6India 22,879 9.6 China, P.R.: Mainland 18,520 8.2
United Kingdom 20,883 8.8 Singapore 10,807 4.8Cayman Islands 20,547 8.6 United States 9,569 4.2
Singapore 13,457 5.7 United Arab Emirates 5,045 2.2Netherlands 13,449 5.7 Indonesia 4,702 2.1South Africa 10,719 4.5 South Africa 3,580 1.6
China, P.R.: Hong Kong 9,862 4.1 United Kingdom 3,354 1.5Luxembourg 9,188 3.9 Netherlands 2,947 1.3
China, P.R.: Mainland 6,823 2.9 Cayman Islands 2,770 1.2


19
DEBT INDICATORS OF HOUSEHOLDS AND CORPORATIONSFINANCIAL STABILITY REPORT | FEBRUARY 2015
3.1 Households
Growth of household indebtedness, as measured by the growth of bank credit to households, decelerated rapidly during the second half of 2014. Bank credit to households, particularly consumption credit grew at relatively high double-digit growth rates during 2013, before registering a marked slowdown in recent months. Growth rates of consumption credit are about those registered in mid-2012, while those of housing credit are even lower than the growth rates registered during the heights of the global financial crisis (2007/09). Housing credit represents around 60 per cent of total bank credit to households. Consumption loans represent the remaining 40 per cent of total bank credit to households.
Household indebtedness has remained broadly constant as a share of household disposable income over the 12-month period to end-September 2014, although it gradually increased between 2009 and 2012 (Chart 3.2). The recent stability of the household indebtedness ratio is consistent with an average growth rate of disposable income of about 7 per cent during the period, and the reported slowdown in the growth of consumption and housing loans to households.
Broadening the definition of household’s debt to include borrowing from banks and non-bank financial institutions (i.e., insurance companies) does not change the perceived trends in the household debt ratio (Chart 3.3). The broader definition of household debt to disposable income increased marginally from 56.8 per cent as at end-September 2013 to 58.0 per cent as at end-September 2014, while that of the narrow definition of household indebtedness (only bank credit) increased from 53.0 per cent to 54.5 per cent over the same period. Insurance companies generally extend mortgage loans to households.
The ratio of household debt to disposable income in Mauritius is relatively low by international standards. In Mauritius, the referred ratio is significantly lower than in New Zealand, South
3. Debt Indicators of Households and CorporationsChart 3.1: Y-o-y Growth of Housing
and Consumption Credit
0.0 2.5 5.0 7.5
10.0 12.5 15.0 17.5 20.0 22.5 25.0 27.5 30.0 32.5 35.0
Mar
-04
Jun-
04
Sep-
04
Dec
-04
Mar
-05
Jun-
05
Sep-
05
Dec
-05
Mar
-06
Jun-
06
Sep-
06
Dec
-06
Mar
-07
Jun-
07
Sep-
07
Dec
-07
Mar
-08
Jun-
08
Sep-
08
Dec
-08
Mar
-09
Jun-
09
Sep-
09
Dec
-09
Mar
-10
Jun-
10
Sep-
10
Dec
-10
Mar
-11
Jun-
11
Sep-
11
Dec
-11
Mar
-12
Jun-
12
Sep-
12
Dec
-12
Mar
-13
Jun-
13
Sep-
13
Dec
-13
Mar
-14
Jun-
14
Sep-
14
Housing credit Consumption credit
Per cent
Chart 3.2: Household Debt to Disposable Income
0
10
20
30
40
50
60
Q2 Q3 Q4 Q1 Q2 Q3 Q4 Q1 Q2 Q3 Q4 Q1 Q2 Q3 Q4 Q1 Q2 Q3 Q4 Q1 Q2 Q3
2009 2010 2011 2012 2013 2014
Housing credit/disposable income Consumption credit/disposable income
Household debt from banks/disposable income
Per cent
Chart 3.3: Alternative Estimates ofHousehold Indebtedness Ratio
0.0
10.0
20.0
30.0
40.0
50.0
60.0
70.0
Q4 Q1 Q2 Q3 Q4 Q1 Q2 Q3 Q4 Q1 Q2 Q3 Q4 Q1 Q2 Q3
2010 2011 2012 2013 2014
Household debt from banks/disposable income
Household debt from banks and insurance companies/disposable income
Per cent
20
FINANCIAL STABILITY REPORT | FEBRUARY 2015
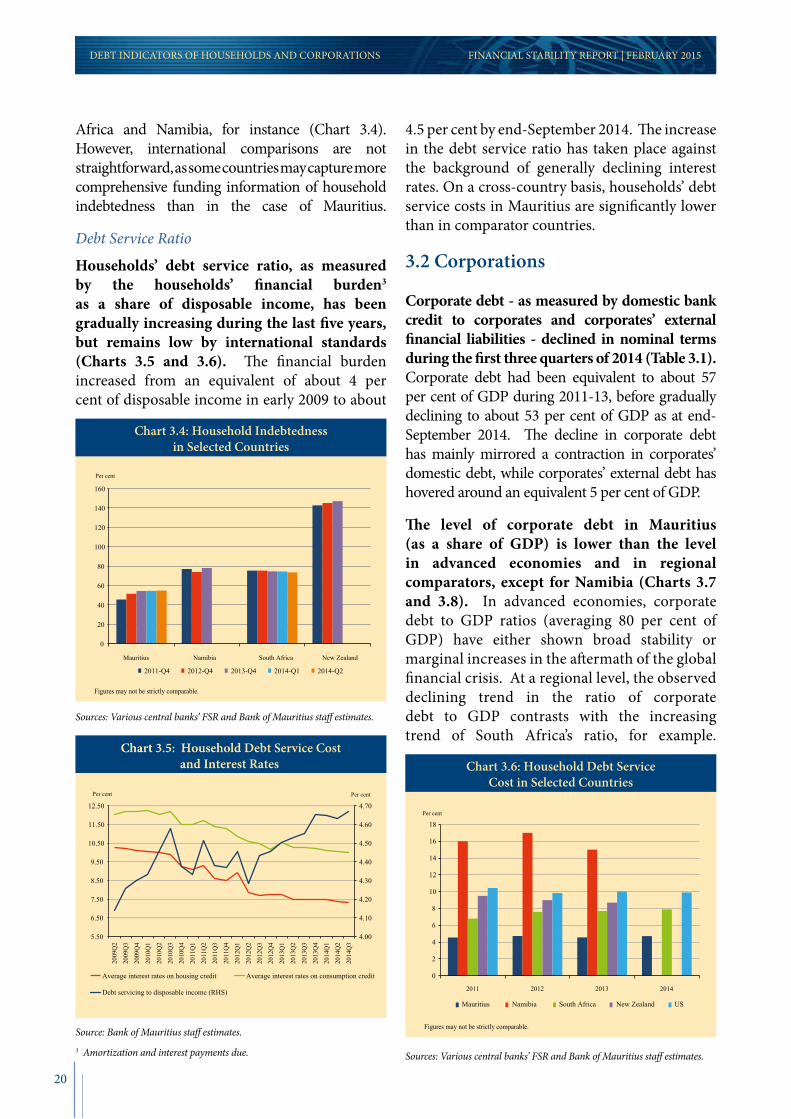
Africa and Namibia, for instance (Chart 3.4). However, international comparisons are not straightforward, as some countries may capture more comprehensive funding information of household indebtedness than in the case of Mauritius.
Debt Service Ratio
Households’ debt service ratio, as measured by the households’ financial burden3 as a share of disposable income, has been gradually increasing during the last five years, but remains low by international standards (Charts 3.5 and 3.6). The financial burden increased from an equivalent of about 4 per cent of disposable income in early 2009 to about
4.5 per cent by end-September 2014. The increase in the debt service ratio has taken place against the background of generally declining interest rates. On a cross-country basis, households’ debt service costs in Mauritius are significantly lower than in comparator countries.
3.2 Corporations
Corporate debt - as measured by domestic bank credit to corporates and corporates’ external financial liabilities - declined in nominal terms during the first three quarters of 2014 (Table 3.1). Corporate debt had been equivalent to about 57 per cent of GDP during 2011-13, before gradually declining to about 53 per cent of GDP as at end-September 2014. The decline in corporate debt has mainly mirrored a contraction in corporates’ domestic debt, while corporates’ external debt has hovered around an equivalent 5 per cent of GDP.
The level of corporate debt in Mauritius (as a share of GDP) is lower than the level in advanced economies and in regional comparators, except for Namibia (Charts 3.7 and 3.8). In advanced economies, corporate debt to GDP ratios (averaging 80 per cent of GDP) have either shown broad stability or marginal increases in the aftermath of the global financial crisis. At a regional level, the observed declining trend in the ratio of corporate debt to GDP contrasts with the increasing trend of South Africa’s ratio, for example.
DEBT INDICATORS OF HOUSEHOLDS AND CORPORATIONS
Chart 3.4: Household Indebtednessin Selected Countries
0
20
40
60
80
100
120
140
160
Mauritius Namibia South Africa New Zealand
2011-Q4 2012-Q4 2013-Q4 2014-Q1 2014-Q2
Per cent
Figures may not be strictly comparable.
Sources: Various central banks’ FSR and Bank of Mauritius staff estimates.
Chart 3.6: Household Debt ServiceCost in Selected Countries
0
2
4
6
8
10
12
14
16
18
2011 2012 2013 2014
Mauritius Namibia South Africa New Zealand US
Per cent
Figures may not be strictly comparable.
Sources: Various central banks’ FSR and Bank of Mauritius staff estimates.
Chart 3.5: Household Debt Service Costand Interest Rates
4.00
4.10
4.20
4.30
4.40
4.50
4.60
4.70
5.50
6.50
7.50
8.50
9.50
10.50
11.50
12.50
2009
Q2
2009
Q3
2009
Q4
2010
Q1
2010
Q2
2010
Q3
2010
Q4
2011
Q1
2011
Q2
2011
Q3
2011
Q4
2012
Q1
2012
Q2
2012
Q3
2012
Q4
2013
Q1
2013
Q2
2013
Q3
2013
Q4
2014
Q1
2014
Q2
2014
Q3
Average interest rates on housing credit Average interest rates on consumption credit
Debt servicing to disposable income (RHS)
Per cent Per cent
Source: Bank of Mauritius staff estimates.3 Amortization and interest payments due.

21
FINANCIAL STABILITY REPORT | FEBRUARY 2015
Chart 3.7: Advanced Economies:Corporate Debt to GDP Ratio
CanadaUKUS Euro area
120
110
100
90
80
70
60
2006 2007 2008 2013 2012 2011 2010 2009
Per cent
Chart 3.8: Other Country Comparators: Corporate Debt to GDP Ratio
0
10
20
30
40
50
60
70
80
Mauritius (Total) Mauritius (Domestic)
South Africa Namibia New Zealand
2011 2012 2013 2014
Per cent of GDP
1. Mauritius (Total) includes credit extended by banks to corporates and corporates' external debt. 2. Mauritius (Domestic) includes credit extended by banks to corporates only. 3. For 2014, data for Mauritius and South Africa relates to the third quarter and second quarter, respectively. 4. Figures may not be strictly comparable.
Table 3.1: Domestic and External Debt of Corporates
2011 2012 2013 20144th
Quarter 4th
Quarter3rd
Quarter4th
Quarter1st
Quarter2nd
Quarter3rd
Quarter*Rs million
Total Corporate Debt 187,640 204,863 207,677 208,477 207,768 205,238 203,028 Corporate External Debt 21,929 21,680 19,389 19,367 18,871 19,475 20,205 Short Term1 3,086 3,534 3,922 4,051 4,080 4,117 4,149 Long Term2 18,843 18,146 15,467 15,315 14,791 15,358 16,056 Corporate Domestic Debt 165,711 183,183 188,288 189,110 188,897 185,763 182,823
Per cent of total corporate debtTotal Corporate Debt 100 100 100 100 100 100 100Corporate External Debt 11.7 10.6 9.3 9.3 9.1 9.5 10.0Short Term1 1.6 1.7 1.9 1.9 2.0 2.0 2.0Long Term2 10.0 8.9 7.4 7.3 7.1 7.5 7.9Corporate Domestic Debt 88.3 89.4 90.7 90.7 90.9 90.5 90.0
Per cent of GDPTotal Corporate Debt 58.1 59.6 57.6 56.9 56.0 54.4 53.2Corporate External Debt 6.8 6.3 5.4 5.3 5.1 5.2 5.3Short Term1 1.0 1.0 1.1 1.1 1.1 1.1 1.1Long Term2 5.8 5.3 4.3 4.2 4.0 4.1 4.2Corporate Domestic Debt 51.3 53.3 52.2 51.6 50.9 49.2 47.9Memo item: GDP (Rs million) 323,010 343,833 360,402 366,228 370,884 377,256 381,464
* Provisional.1. Refers mainly to trade credit as recorded in BoP statistics.2. Excluding loans of Global Business Companies.Sources: Mauritius SDDS country page and Bank of Mauritius.
DEBT INDICATORS OF HOUSEHOLDS AND CORPORATIONS
Sources: International Monetary Fund and Bank for International Settlements. Sources: Various central banks’ FSR and Bank of Mauritius staff estimates.

22
FINANCIAL STABILITY REPORT | FEBRUARY 2015
The decline in corporate domestic debt (as a share of GDP) has been generally broad-based (Table 3.2 and Charts 3.9 & 3.10). All leading sectors in the Mauritian economy namely tourism, construction, manufacturing, traders and financial services registered a decline in their respective credit to GDP ratios, suggesting slack actual and potential growth in economic activity. These sectors, in aggregate, account for a large portion of GDP and total bank credit. Notwithstanding its decline as a share GDP, credit to traders has shown a growth spike in recent months.
The decline in corporate indebtedness signals financial stress in leading financial enterprises,
albeit with some differences across economic sectors (Table 3.3). While all leading sectors remain significantly leveraged, traders and financial services may be fairing marginally better than tourism, construction and real estate sectors. Indeed, tourism, construction and real estate (representing, in total, some 40 per cent of total bank credit to corporates) have witnessed a sharp decline in their return-to-equity (ROE) ratios that was sharper than the decline in the cost of debt between 2005-10 and 2011-13. By contrast, traders have benefitted from an increase in their ROE ratio that further profited from a decline in the cost of debt. Enterprises in the financial services sector registered an increase in ROE that was higher than the increase in the cost of their debt.
Table 3.2: Distribution of Credit to the Private Sector
2005-2011 2012-14 2013-14Per cent of GDP
Total credit to private sector 65.3 73.4 72.8Corporates 47.0 51.6 50.6 Construction 5.0 8.0 8.0 Tourism 11.1 13.0 13.0 Traders 8.5 8.2 8.0 Financial services 7.3 7.3 7.0 Manufacturing 6.4 5.2 5.1 Agriculture & Fishing 4.4 5.1 5.1 Other 4.4 4.8 4.4Households 14.8 20.2 20.8 Consumption credit 6.4 7.9 8.3 Housing 8.4 12.2 12.5
(Average annual growth rates; in per cent)Total credit to private sector 12.0 6.9 4.9Corporates 12.8 4.7 2.7 Construction 26.9 12.8 6.4 Tourism 18.3 6.2 6.9 Traders 9.5 2.6 0.5 Financial services 14.3 1.9 0.5 Manufacturing 3.7 2.2 1.7 Agriculture & Fishing 12.9 9.0 8.0 Other 11.8 -3.0 -9.6Households 14.9 13.7 12.7 Consumption credit 11.4 16.1 16.7 Housing 17.6 12.2 10.2
Source: Bank of Mauritius.
DEBT INDICATORS OF HOUSEHOLDS AND CORPORATIONS

23
FINANCIAL STABILITY REPORT | FEBRUARY 2015
Chart 3.9: Y-o-y Growth of Corporate Credit
-30.0
-20.0
-10.0
0.0
10.0
20.0
30.0
40.0
50.0
Mar
-07
Jun-
07
Sep-
07
Dec
-07
Mar
-08
Jun-
08
Sep-
08
Dec
-08
Mar
-09
Jun-
09
Sep-
09
Dec
-09
Mar
-10
Jun-
10
Sep-
10
Dec
-10
Mar
-11
Jun-
11
Sep-
11
Dec
-11
Mar
-12
Jun-
12
Sep-
12
Dec
-12
Mar
-13
Jun-
13
Sep-
13
Dec
-13
Mar
-14
Jun-
14
Sep-
14
Tourism Per cent
-30.0
-20.0
-10.0
0.0
10.0
20.0
30.0
40.0
50.0
Mar
-07
Jun-
07
Sep-
07
Dec
-07
Mar
-08
Jun-
08
Sep-
08
Dec
-08
Mar
-09
Jun-
09
Sep-
09
Dec
-09
Mar
-10
Jun-
10
Sep-
10
Dec
-10
Mar
-11
Jun-
11
Sep-
11
Dec
-11
Mar
-12
Jun-
12
Sep-
12
Dec
-12
Mar
-13
Jun-
13
Sep-
13
Dec
-13
Mar
-14
Jun-
14
Sep-
14
Financial & business services Per cent
-15.0
-10.0
-5.0
0.0
5.0
10.0
15.0
20.0
25.0
Mar
-07
Jun-
07
Sep-
07
Dec
-07
Mar
-08
Jun-
08
Sep-
08
Dec
-08
Mar
-09
Jun-
09
Sep-
09
Dec
-09
Mar
-10
Jun-
10
Sep-
10
Dec
-10
Mar
-11
Jun-
11
Sep-
11
Dec
-11
Mar
-12
Jun-
12
Sep-
12
Dec
-12
Mar
-13
Jun-
13
Sep-
13
Dec
-13
Mar
-14
Jun-
14
Sep-
14
Manufacturing Per cent
-15.0
-10.0
-5.0
0.0
5.0
10.0
15.0
20.0
25.0
Mar
-07
Jun-
07
Sep-
07
Dec
-07
Mar
-08
Jun-
08
Sep-
08
Dec
-08
Mar
-09
Jun-
09
Sep-
09
Dec
-09
Mar
-10
Jun-
10
Sep-
10
Dec
-10
Mar
-11
Jun-
11
Sep-
11
Dec
-11
Mar
-12
Jun-
12
Sep-
12
Dec
-12
Mar
-13
Jun-
13
Sep-
13
Dec
-13
Mar
-14
Jun-
14
Sep-
14
Traders Per cent
-30.0
-20.0
-10.0
0.0
10.0
20.0
30.0
40.0
50.0
60.0
70.0
80.0
90.0
Mar
-07
Jun-
07
Sep-
07
Dec
-07
Mar
-08
Jun-
08
Sep-
08
Dec
-08
Mar
-09
Jun-
09
Sep-
09
Dec
-09
Mar
-10
Jun-
10
Sep-
10
Dec
-10
Mar
-11
Jun-
11
Sep-
11
Dec
-11
Mar
-12
Jun-
12
Sep-
12
Dec
-12
Mar
-13
Jun-
13
Sep-
13
Dec
-13
Mar
-14
Jun-
14
Sep-
14
Agriculture & fishing Per cent
-30.0
-20.0
-10.0
0.0
10.0
20.0
30.0
40.0
50.0
60.0
70.0
80.0
90.0
Mar
-07
Jun-
07
Sep-
07
Dec
-07
Mar
-08
Jun-
08
Sep-
08
Dec
-08
Mar
-09
Jun-
09
Sep-
09
Dec
-09
Mar
-10
Jun-
10
Sep-
10
Dec
-10
Mar
-11
Jun-
11
Sep-
11
Dec
-11
Mar
-12
Jun-
12
Sep-
12
Dec
-12
Mar
-13
Jun-
13
Sep-
13
Dec
-13
Mar
-14
Jun-
14
Sep-
14
Construction (excl Housing) Per cent
DEBT INDICATORS OF HOUSEHOLDS AND CORPORATIONS

24
FINANCIAL STABILITY REPORT | FEBRUARY 2015DEBT INDICATORS OF HOUSEHOLDS AND CORPORATIONS
High frequency data point to the ongoing deleveraging in the construction sector, while leverage ratios (i.e., the ratio of total assets to equity) in the tourism and traders sectors have remained unchanged or even increased in recent years (Chart 3.11). After a rise in 2011, the leverage ratio of construction sector has gradually declined, possibly related to the
completion of some large projects, although it remains very high by international standards. Yet, according to the national accounts data, investment in construction activity continues to decline, thus suggesting that the sector’s leverage ratios remain a challenge, while there is limited demand for new housing and commercial construction.
Table 3.3: Risk Analysis of Leading Enterprises in Mauritius Listed on the Stock Exchange of Mauritius
2005-2010 (1) 2011-2013 (2) % Change (2)/(1)Construction & Real EstateReturn on Assets 4.44% 3.80% -14.5Return on equity 9.34% 7.23% -22.6Cost of debt 7.78% 6.75% -13.3Leverage (Debt-to-equity) 55.5% 41.1% -25.9Leverage (Total assets-to-equity) 192.8% 163.1% -15.4Debt service capacity 1.34 1.69 26.2
TourismReturn on Assets 4.40% 0.53% -87.8Return on equity 12.92% 1.39% -89.2Cost of debt 6.61% 5.61% -15.2Leverage (Debt-to-equity) 82.3% 129.2% 57.0Leverage (Total assets-to-equity) 213.4% 262.6% 23.1Debt service capacity 1.28 0.60 -53.0
TradersReturn on Assets 3.99% 5.56% 39.6Return on equity 9.36% 10.46% 11.7Cost of debt 9.69% 6.58% -32.1Leverage (Debt-to-equity) 47.3% 47.4% 0.3Leverage (Total assets-to-equity) 176.0% 189.7%Debt service capacity 1.43 1.29 -9.8
Financial servicesReturn on Assets 7.35% 6.13% -16.6Return on equity 9.29% 11.77% 26.7Cost of debt 8.54% 10.08% 18.0Leverage (Debt-to-equity) 108.8% 109.3% 0.4Leverage (Total assets-to-equity) 115.3% 167.0% 44.8Debt service capacity 3.68 2.12 -42.3
Note:1 Cost of debt: interest expense-to-total debt. 2 Debt service capacity: Earnings before interest, taxes, depreciation and amortisation-to-interest expense.Sources: Thomson Reuters and Bank of Mauritius staff calculations.

25
FINANCIAL STABILITY REPORT | FEBRUARY 2015
Chart 3.10: Importance of Selected Sectors in GDPand in Total Corporate Credit (2007-2014)
Construction Tourism Traders Financialservices
Manufacturing Agriculture& Fishing
Other
0
5
10
15
20
25
Share in GDP Sectoral credit as share of corporate credit
Per cent
Chart 3.11: Leverage Ratio of Leading Economic Sectors
121
141
161
181
201
221
241
261
281
Mar
-200
9
Jun-
2009
Sep-
2009
Dec
-200
9
Mar
-201
0
Jun-
2010
Sep-
2010
Dec
-201
0
Mar
-201
1
Jun-
2011
Sep-
2011
Dec
-201
1
Mar
-201
2
Jun-
2012
Sep-
2012
Dec
-201
2
Mar
-201
3
Jun-
2013
Sep-
2013
Dec
-201
3
Mar
-201
4
Jun-
2014
Construction Traders Tourism
Per cent
1 GFSR data for Latin America, Asia, Europe, Middle East and Africa are based on 2013 financial statements.
2 Average for Argentina, Brazil, Chile and Mexico.
3 Average for China, India, Indonesia, Malaysia, Philippines and Thailand.
4 Average for Poland, Russia, South Africa and Turkey.
5 Leverage: debt-to-equity. Sources: Thomson Reuters, IMF GFSR Oct 2014 and Bank of Mauritius staff calculations.
Table 3.4: Fundamentals of Corporates: International Comparison 1
Mauritius Latin America2 Asia3
Europe, Middle East and Africa4
2005-2011 2011-2013Return on Assets Simple average 5.04% 4.01% 3.85% 3.23% 3.30% GDP weighted average 1.79% 1.52%
Return on equity 10.23% 7.71% … … …Cost of debt 8.16% 7.26% … … …Leverage5 73.5% 81.7% 62.75% 37.83% 42.75%Debt service capacity 1.93 1.42 4.48 6.73 5.60
Comparison of financial fundamentals of local corporates with those of corporates in other middle income countries warrants monitoring (Table 3.4). Local enterprises’ fundamentals compare poorly against those of
corporates around the world, especially in terms of leverage ratios and debt service capacity (i.e., earnings before interest, taxes, depreciation and amortisation, as a ratio to interest expense).
DEBT INDICATORS OF HOUSEHOLDS AND CORPORATIONS
Sources: Bank of Mauritius and Statistics Mauritius. Sources: Thomson Reuters and Bank of Mauritius staff calculations.


27
BANKING SECTORFINANCIAL STABILITY REPORT | FEBRUARY 2015
4.1 Overview
Since the publication of the last FSR in August 2014, the banking sector’s balance sheet has grown broadly in line with GDP, while banks’ foreign assets have increased faster than domestic assets (Table 4.1 and Chart 4.1). Banking sector assets grew by 8.5 per cent at end-September 2014 compared with an increase of 10.9 per cent in the corresponding period in 2013, with most of the increase reflecting growth in foreign assets
of subsidiaries of foreign-owned banks and that of domestic-owned banks. Total assets held by branches of foreign-owned banks contracted by 6.2 per cent over the period under review, although their contribution to overall trends was rather small given the size of their balance sheet. The growth in banks’ foreign assets, particularly those of domestically-owned banks, reflects ventures by local banks in India and frontier markets in Africa with concomitant increases in credit and market risk.
4. Banking Sector
Table 4.1: Banks’ Assets by Type of Bank and Asset, 2012-2014
Assets (growth rates; in per cent) Assets (contribution to asset growth; in per cent)I. Period: September 2013 to September 2014
Domestic Foreign banks Domestic Foreign banksbanks Subsidiary Branch Total banks Subsidiary Branch Total
Foreign assets 32.7 10.9 -15.4 13.0 2.8 4.6 -0.4 7.0Domestic assets 9.8 -13.8 2.6 3.3 3.1 -1.6 0.1 1.5Total assets 14.7 5.5 -6.2 8.5 5.9 3.0 -0.4 8.5
II. Period: September 2012 to September 2013Domestic Foreign banks Domestic Foreign banks
banks Subsidiary Branch Total banks Subsidiary Branch TotalForeign assets 24.0 21.8 -66.0 7.7 1.8 8.4 -6.0 4.3Domestic assets 14.1 113.2 -59.3 15.0 4.3 7.0 -4.7 6.7Total assets 16.1 34.4 -62.8 10.9 6.2 15.4 -10.6 10.9
III. Period: September 2011 to September 2012Domestic Foreign banks Domestic Foreign banks
banks Subsidiary Branch Total banks Subsidiary Branch TotalForeign assets 8.0 -1.1 18.3 2.8 0.6 -0.5 1.5 1.6Domestic assets 11.5 1.0 1.3 8.0 3.3 0.1 0.1 3.5Total assets 10.8 -0.8 9.8 5.1 3.9 -0.4 1.6 5.1
Source: Bank of Mauritius staff estimates.

28
FINANCIAL STABILITY REPORT | FEBRUARY 2015BANKING SECTOR
Banks’ role as financial intermediaries in the domestic economy is being curtailed by the trends in growth of households and corporate bank credit (Table 4.2). The growth of banks’ claims on the private sector (including households and corporations) has been declining and may have become negative in recent months. Banks’ net foreign asset positions remain sizeable, while banks’ claims on the Government and the central bank have generally registered positive growth in recent years. Gross foreign asset positions averaged US$25 billion during 2010-14, with a net value of about US$10 billion. Banks’ claims on Government refer mainly to holdings of Government securities, while banks’ claims on the central bank are cash reserve requirements with the monetary authority and holdings of BoM securities.
Chart 4.1: Banking Sector Assets
700
750
800
850
900
950
1,000
1,050
1,100
1,150
0
100
200
300
400
500
600
700
Sep-11 Sep-12 Sep-13 Sep-14
Domestic-owned banks Subsidiaries of foreign-owned banks Branches of foreign-owned banks Total banking sector (RHS)
Rs billion Rs billion
Table 4.2: ODCs’ Balance Sheet, 2011-2014
2011 2012 20132014
March June September NovemberRs million
Net foreign assets 290,654 309,761 292,802 261,334 262,622 319,933 322,356 Claims on non-residents 783,159 802,936 772,471 750,315 708,659 766,360 760,513 Liabilities to non-residents -492,505 -493,175 -479,669 -488,981 -446,038 -446,427 -438,157
Claims on Central Bank (net) 32,226 32,315 47,005 51,655 55,006 52,593 53,849 o/w Bank reserve deposits 23,668 25,340 32,105 35,348 35,563 37,018 36,098 BoM securities held by
ODCs 1 5,540 3,916 10,796 15,184 17,166 13,026 17,057
Domestic Claims 234,148 250,348 273,493 270,622 269,555 275,136 287,535Net Claims on Central Government 38,011 38,215 45,692 49,241 53,416 58,688 62,019Claims on Other Sectors 310,941 364,089 413,243 402,786 391,818 390,192 403,487Other items net -114,803 -151,956 -185,441 -181,405 -175,678 -173,743 -177,971
Broad Money Liabilities 298,110 322,441 340,146 347,973 354,578 355,699 364,739 Transferable Deposits 69,409 74,619 80,380 80,741 84,977 83,780 89,196 Savings Deposits 114,278 123,940 137,029 143,389 145,274 147,442 150,023 Time Deposits 113,435 122,768 121,487 122,557 123,006 123,128 124,154 Securities other than Shares 988 1,114 1,250 1,287 1,321 1,348 1,367
GBC deposits 258,918 269,984 273,155 235,637 232,605 291,963 299,001
1 As reported in the BoM’s balance sheet.

29
BANKING SECTORFINANCIAL STABILITY REPORT | FEBRUARY 2015
Market Concentration
The domestic banking sector is characterised by a high degree of market concentration. The four largest banks held 56.5 per cent of total banking assets while the corresponding Herfindahl-Hirschman Index (HHI) stood at 1073 as at end-September 2014. The degree of concentration in the banking industry is further depicted in the Lorenz Curve (Chart 4.2). Over the past five years ended September 2014, the market share of advances by four banks has increased from 57.0 per cent to 65.0 per cent, which points to a more unequal distribution of bank assets. However, notwithstanding the level of concentration of bank assets, smaller banks have increased their visibility lately through assertive publicity campaigns to attract new customers. This may eventually lead to a decline in market concentration, with increased competition in the banking sector.
4.2 Financial Soundness Indicators
Profitability
The average return on assets (ROA) and return on equity (ROE) show that profitability of the overall banking sector recovered over the 12-month period ended September 2014, although the ROA and ROE of domestic-owned banks declined for the second consecutive year (Table 4.3, Charts 4.3 and 4.4). Banks’ ROA rose to 1.4 per cent at end-September 2014, from 1.0 per cent a year ago, following a recovery of ROA of subsidiaries of foreign-owned banks servicing the Global Business Sector. Over the 12-month period ended September 2014, there was an increase in the operating profit of domestic-owned banks on account of 10.1 per cent growth in net interest income. However, a significant loss by one bank resulted in a decline in the ROA of domestic-owned banks overall, from 2.4 per cent to 2.1 per cent. During the period
Table 4.2: ODCs’ Balance Sheet, 2011-2014 (Continued)
2012 20132014
March June September November (Annual growth rates; in per cent)
Net foreign assets 6.6 -5.5 -12.8 -9.6 13.8 16.5
Claims on Central Bank (net) 0.3 45.5 43.0 34.9 39.0 30.4 o/w Bank reserve deposits 7.1 26.7 31.3 26.4 48.7 27.9 BoM securities held by
ODCs 1 -29.3 175.7 106.5 68.2 11.0 50.6
Net Claims on Central Government 0.5 19.6 21.5 25.4 27.0 35.5Claims on Other Sectors 17.1 13.5 9.0 5.5 -4.8 -0.7Other items net 32.4 22.0 13.0 9.7 -11.0 -4.2
Broad Money Liabilities 8.2 5.5 7.1 8.2 8.8 10.2 Transferable Deposits 7.5 7.7 9.2 14.7 10.2 17.6 Savings Deposits 8.5 10.6 10.1 9.7 10.9 12.9 Time Deposits 8.2 -1.0 2.5 2.5 5.4 2.6 Securities other than Shares 12.8 12.2 12.0 11.8 11.2 10.6
GBC deposits 4.3 1.2 -9.5 -9.6 15.6 18.1
1 As reported in the BoM’s Balance Sheet.

30
under review, banks’ average ROE followed almost a similar pattern to ROA. Average ROE ratios of subsidiaries of foreign-owned banks
increased, while those of domestic-owned banks and branches of foreign-owned banks declined.
FINANCIAL STABILITY REPORT | FEBRUARY 2015BANKING SECTOR
Chart 4.2: Distribution of Banks’ Advances and Assets
0
10
20
30
40
50
60
70
80
90
100
0 10 20 30 40 50 60 70 80 90 100Cumulative percentage of advances
Sep-09 Sep-14
Cumulative percentage of total number of banks
0
10
20
30
40
50
60
70
80
90
100
0 10 20 30 40 50 60 70 80 90 100Cumulative percentage of total assets
Sep-09 Sep-14
Cumulative percentage of total number of banks
Line of perfect equality
Line of perfect e
quality
Table 4.3: Financial Stability Indicators1 of Other Depository Corporations (Banks and NBDTIs2)
Core Set of Financial Soundness Indicators Mar-13 Sep-13 Dec-13 Mar-14 Jun-14 Sep-14Capital-basedRegulatory capital to risk-weighted assets 17.4% 16.9% 17.3% 17.6% 17.8% 17.9%Regulatory Tier 1 capital to risk-weighted assets 15.9% 14.8% 15.1% 15.3% 15.3% 15.5%Non-performing loans net of provisions to capital 11.8% 12.9% 12.7% 12.8% 12.4% 12.6%
Asset QualityNon-performing loans to total gross loans3 3.9% 4.1% 4.2% 4.4% 4.5% 3.8%Sectoral distribution of loans to total loans3
Interbank loans 0.5% 1.1% 0.3% 0.1% 0.2% 0.5% Other financial corporations 1.3% 1.2% 1.2% 1.3% 1.2% 1.6% Non-financial corporations 33.5% 33.5% 34.7% 34.9% 35.3% 34.2% Other domestic sectors 20.5% 21.0% 21.6% 22.0% 20.0% 19.9% Non-residents 44.2% 43.2% 42.2% 41.7% 43.2% 43.7%
Earnings and ProfitabilityReturn on assets 1.2% 1.1% 1.2% 1.3% 1.4% 1.4%Return on equity 15.7% 13.5% 14.1% 15.6% 15.9% 15.7%Interest margin to gross income 69.8% 71.3% 68.6% 68.9% 68.0% 67.5%Non-interest expenses to gross income 41.5% 43.7% 43.9% 42.5% 41.7% 41.6%
LiquidityLiquid assets to total assets 19.1% 17.5% 22.5% 22.6% 19.5% 22.7%Liquid assets to short-term liabilities 27.9% 26.5% 31.0% 30.7% 26.3% 29.1%
Sensitivity to Market Risk Net open position in foreign exchange to capital 2.2% 2.3% 2.1% 3.1% 3.8% 3.8%

31
BANKING SECTORFINANCIAL STABILITY REPORT | FEBRUARY 2015
Table 4.3: Financial Stability Indicators1 of Other Depository Corporations (Banks and NBDTIs2) (Continued)
Encouraged Set of Financial Soundness Indicators Mar-13 Sep-13 Dec-13 Mar-14 Jun-14 Sep-14Capital to assets 8.6% 8.1% 8.8% 9.3% 9.8% 9.3%Value of large exposures to capital 171.7% 186.9% 195.9% 196.5% 197.3% 200.8%Customer deposits to total (non-interbank) loans 134.2% 130.4% 137.0% 134.3% 123.6% 131.5%Residential real estate loans to total loans3 7.1% 8.5% 8.7% 8.9% 8.6% 8.4%Commercial real estate loans to total loans3 7.4% 6.7% 6.9% 7.2% 6.6% 6.4%Trading income to total income 3.1% 4.6% 8.8% 10.2% 10.5% 10.3%Personnel expenses to non-interest expenses 49.3% 51.5% 52.2% 52.0% 51.8% 50.8%
Macroeconomic Indicators Mar-13 Sep-13 Dec-13 Mar-14 Jun-14 Sep-14Headline inflation4 3.6% 3.5% 3.5% 4.0% 4.0% 3.9%Year-on-year inflation4 3.6% 3.3% 4.0% 4.5% 3.3% 2.9%Key Repo Rate (end of period) 4.90% 4.65% 4.65% 4.65% 4.65% 4.65%Total Public Sector Debt/GDP (end of period) 58.1% 59.6% 60.1% 60.5% 60.7% 61.4%Total Public Sector External Debt/GDP (end of period) 13.9% 15.7% 15.8% 16.1% 16.6% 16.3%Import coverage of Gross International Reserves (months of goods & services) 4.9 5.1 5.2 5.6 6.1 6.1Deposits/Broad Money Liabilities5 93.0% 93.0% 92.8% 93.3% 93.4% 93.4%Household Debt/GDP (end of period)6 19.5% 20.3% 20.7% 20.7% 20.8% 20.9%Corporate Debt/GDP (end of period)6 52.5% 52.2% 51.6% 50.9% 49.2% 47.9%
2013Q1 2013Q3 2013Q4 2014Q1 2014Q2 2014Q3Real GDP growth4 3.8% 3.4% 2.7% 2.5% 4.3% 3.5%Unemployment rate 8.6% 8.0% 7.5% 8.0% 7.8% 7.6%Current account deficit/GDP 8.6% 13.2% 9.2% 6.0% 8.5% 11.2%
1 FSIs are calculated on a domestic consolidation basis using the Financial Soundness Indicators Compilation Guide of the International Monetary Fund. Figures may be slightly different from other parts of this Report.
2 NBDTIs refer to Non-Bank Deposit-Taking Institutions. 3 Total loans include advances to non-residents.4 Percentage change over corresponding period of previous year.5 Rupee and foreign currency deposits from domestic banks.6 Debts contracted with banks only. Note: Figures may not add up due to rounding.
Chart 4.3: Return on Assets of the Banking Sector
0.0
0.5
1.0
1.5
2.0
2.5
3.0
3.5
Domestic-owned banks
Subsidiaries of foreign-owned banks
Branches of foreign-owned banks
Total banking Sector
Per cent
Sep-11 Sep-12 Sep-13 Sep-14
Chart 4.4: Return on Equity of the Banking Sector
0
5
10
15
20
25
30
Domestic-owned banks
Subsidiaries of foreign- owned banks
Branches of foreign-owned banks
Total banking Sector
Per cent
Sep-11 Sep-12 Sep-13 Sep-14

32
Capital Adequacy
The banking sector maintained adequate - albeit increasing - capital levels during the period under review, although differences remained among banks in terms of their individual capital adequacy ratio (CAR). The CAR for the banking sector stood at 17.1 per cent as at end-September 2014 compared with 16.4 per cent a year ago. In line with regulatory requirements, banks have duly shifted from Basel II to a phasing-in of Basel III capital framework. Accordingly, changes have been brought in the estimated CARs due to the computation methodology of banks’ capital base, coupled with the implementation of macroprudential measures mainly in terms of revised risk weights applicable to the construction sector. The capital base of the banking sector amounted to Rs111.8 billion as at end-September 2014, with the ratio of Common Equity Tier 1(CET1) capital to total risk weighted assets being computed at 13.7 per cent. From the ownership perspective, branches of foreign-owned banks maintained the highest Tier 1 capital ratio with an average of 23.9 per cent, followed by the subsidiaries of foreign-owned banks, at 16.7 per cent. Domestic-owned banks continued to post lower Tier 1 capital ratio at 13.7 per cent, although an improvement has been noted due to compliance towards meeting the Basel III targets (Chart 4.5).
Asset Quality
During the year ended September 2014, banks’ NPL hovered around Rs25 billion, while
banks increased their loan loss provision significantly (Chart 4.6). Given a contraction of 0.9 per cent in private sector credit over the year, the ratio of NPL to private sector credit edged up by merely 10 basis points to 5.7 per cent. However, the NPL ratio of cross-border credit rose over the quarters and peaked at 4.1 per cent at end-June 2014, before declining to about 2.5 per cent by end-September. The June increase in the NPL ratio was due to impaired loans in the non-resident credit portfolio (i.e., banks’ foreign assets) of one domestic-owned bank and one subsidiary of a foreign-owned bank.
Despite broad stability of overall default rates (as measured by the NPL ratio), banks increased their provision against loss by 30.7 per cent over the year to end-September 2014 (Chart 4.7). The end result was an increase in banks’ coverage ratio for credit extended in Mauritius, from 43.3 per cent to 47.4 per cent, during the referred period. The increase in the coverage ratio shows that banks have increased their buffers against credit default and have hedged against risks from large credit exposures. Concurrently, there are indications that some large corporate bodies are restructuring their debts with banks, as they address recurrent problems of cash flow.
Banks’ Foreign Exchange Open Positions
The foreign exchange exposure for a currency pertains to the net open position in that currency, which is determined by the sum of the net spot
FINANCIAL STABILITY REPORT | FEBRUARY 2015BANKING SECTOR
Chart 4.5: Tier 1 Capital Ratio
13.0
13.4
13.8
14.2
14.6
15.0
15.4
0
5
10
15
20
25
30
Sep-10 Sep-11 Sep-12 Sep-13 Sep-14
Per cent Per cent
Domestic-owned banks Subsidiaries of foreign-owned banks Branches of foreign-owned banks Total banking sector (RHS)
Chart 4.6: Non-Performing Loans of Banks
0
1
2
3
4
5
6
Sep-13 Dec-13 Mar-14 Jun-14 Sep-14
NPL as a percentage of private sector credit
NPL as a percentage of cross-border credit
Total NPL as a percentage of total banking sector credit
Per cent

33
position and the net forward position of the same currency. The overall foreign exchange exposure is arrived at by determining the higher of the sum of all net short positions and the sum of all the net long positions for all currencies. As from January 2011, banks are required to maintain an overall foreign exchange exposure limit of 15 per cent of Tier 1 capital and a single currency exposure limit amounting to 10 per cent of Tier 1 capital. As at end-September 2014, the consolidated overall foreign exchange exposure of banks ranged between negative 1.2 per cent to 12.4 per cent, and averaged 3.2 per cent.
Banks’ Liquidity Positions
By end-September 2014, the ratio of liquid assets to total assets in the banking sector stood at 23.1 per cent, while the ratio of liquid assets to short-term liabilities was 29.7 per cent. The main components of liquid assets comprise
balances with the Bank of Mauritius (legal and excess reserves), holdings of Treasury Bills and Government securities, short-term placements with banks abroad, and holdings of Bank of Mauritius securities (Chart 4.8).
Concentration of Credit
Credit concentration in the banking sector, as measured by the ratio of large exposures to the capital base, has increased to 206.9 per cent at end-September 2014, from 200.3 recorded a year ago (Table 4.4). In terms of conditions imposed by the Bank, credit concentration was much below (about a third of) the aggregate prudential limit of 600 per cent of the capital base of individual banks. However, the proportion of bank credit extended to the ten largest borrowers remained equivalent to around 73 per cent of banks’ capital (Table 4.5). Large exposures, which include the largest 10 borrowers plus other large
BANKING SECTORFINANCIAL STABILITY REPORT | FEBRUARY 2015
Chart 4.7: Non-Performing Loans and Coverage Ratio
35
38
41
44
47
50
0
5
10
15
20
25
Sep-
11
Dec
-11
Mar
-12
Jun-
12
Sep-
12
Dec
-12
Mar
-13
Jun-
13
Sep-
13
Dec
-13
Mar
-14
Jun-
14
Sep-
14
Non-performing loans Coverage ratio (RHS)
Per cent Rs billion
Chart 4.8: Outstanding BOM Securities by Maturity
0
1,000
2,000
3,000
4,000
5,000
6,000
7,000
8,000
9,000
91-Daybills
182-daybills
273-daybills
364-daybills
3Y-Notes 4Y-Notes 5Y-Bonds 15Y-Bonds
Rs million
Dec-13 Mar-14 Jun-14 Sep-14 Dec-14
Table 4.4: Credit Concentration Risk
Percentage of aggregate large exposures to capital base
Percentage of aggregate large exposures to total credit facilities
Sep-13 200.3 28.3Dec-13 209.9 30.5Mar-14 207.4 31.7Jun-14 211.5 31.2Sep-14 206.9 31.0

34
FINANCIAL STABILITY REPORT | FEBRUARY 2015BANKING SECTOR
borrowers, averaged about 209 per cent of banks’ capital base during 2014, up from 200 per cent in December 2013.
Non-bank financial intermediaries in Mauritius include the non-bank deposit-taking sector,
the insurance and reinsurance sectors, and the pensions industry. A brief summary analysis of key financial indicators of those intermediaries is presented in Chapter 5.
Table 4.5: Exposure of Banks to Ten Largest Borrowers
Ten largest borrowers (Rs million)
Ten largest borrowers to total large exposures (Per
cent)
Ten largest borrowers to total capital base
(Per cent)Sep-13 71,271 35.5 71.0Dec-13 72,434 33.5 70.7Mar-14 74,833 33.9 70.3Jun-14 87,122 38.3 81.1Sep-14 82,615 35.4 73.2

35
SECTIONNON-BANK FINANCIAL INTERMEDIARIESFINANCIAL STABILITY REPORT | FEBRUARY 2015
5.1 Non-Bank Deposit-Taking Sector
NBDTIs mainly mobilise deposits and grant leasing and loan facilities to individuals and corporates and, as at end-September 2014, there were eight such institutions in operation.4 The sector has remained stable and sound since the August 2014 FSR and registered steady growth in activities from the previous year. Total assets of NBDTIs represented 5.8 per cent of total banking sector assets as at end-September 2014, slightly up from 5.6 per cent in the corresponding period of 2013.
Balance Sheet Structure
Total assets of NBDTIs went up by 11.7 per cent as at end-September 2014 compared with 13.5 per cent in the corresponding period of 2013, mostly on account of a lower growth in loan facilities than in 2013 (Chart 5.1). The slowdown in the expansion of loan facilities largely reflected a lower rate of growth in credit extended to the personal sector. In contrast, leasing facilities grew by a higher rate of 12.6 per cent compared with 9.2 per cent as at end-September 2013. At 73.6 per cent, loan and leasing facilities represented the most important share of total assets of NBDTIs.
On the liabilities side, deposits made up 60.1 per cent of the total and recorded lower growth of 7.5 per cent as at end-September 2014 compared with 12.0 per cent in the corresponding period in 2013. The slower pace of deposit growth was mainly due to lower source of funds mobilised by three institutions in the sector.
Liquidity
NBDTIs remained relatively liquid during the period under review, with liquidity ratios above the statutory minimum of 10 per cent. The ratio of liquid assets to total assets fell slightly to 12.8 per cent as at end-September 2014, from 12.9 per cent a year ago. However, the liquid assets to total deposits ratio increased to 21.3 per cent, from 20.7 per cent as at end-September 2013, as a result of higher growth in liquid assets relative to the growth in deposits (Chart 5.2).
5. Non-Bank Financial Intermediaries
4 The Mauritius Civil Service Mutual Aid Association Ltd; Mauritius Housing Company Ltd; Mauritian Eagle Leasing Company Limited; SICOM Financial Services Ltd; AXYS Leasing Ltd; Cim Finance Ltd; Finlease Company Limited; and La Prudence Leasing Finance Co. Ltd.
Chart 5.2: Liquidity Indicators of NBDTIs
Per cent Per cent
11.0
11.5
12.0
12.5
13.0
13.5
14.0
14.5
15.0
17
18
19
20
21
22
23
24
25
Sep-
11
Dec
-11
Mar
-12
Jun-
12
Sep-
12
Dec
-12
Mar
-13
Jun-
13
Sep-
13
Dec
-13
Mar
-14
Jun-
14
Sep-
14
Liquid assets/deposits Liquid assets/total assets (RHS)
Chart 5.1: Y-o-y Growth ofTotal Assets and Deposits
-2
0
2
4
6
8
10
12
14
16
Sep-
11
Dec
-11
Mar
-12
Jun-
12
Sep-
12
Dec
-12
Mar
-13
Jun-
13
Sep-
13
Dec
-13
Mar
-14
Jun-
14
Sep-
14
Total assets Total deposits
Per cent
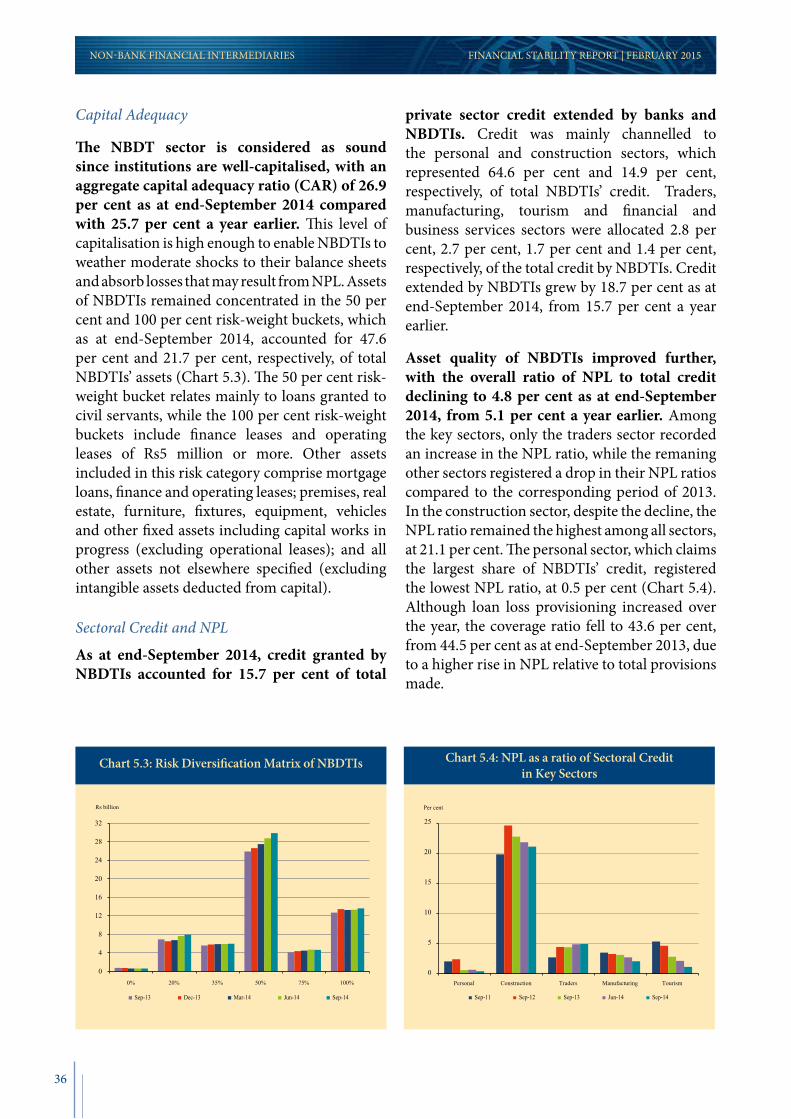
36
Capital Adequacy
The NBDT sector is considered as sound since institutions are well-capitalised, with an aggregate capital adequacy ratio (CAR) of 26.9 per cent as at end-September 2014 compared with 25.7 per cent a year earlier. This level of capitalisation is high enough to enable NBDTIs to weather moderate shocks to their balance sheets and absorb losses that may result from NPL. Assets of NBDTIs remained concentrated in the 50 per cent and 100 per cent risk-weight buckets, which as at end-September 2014, accounted for 47.6 per cent and 21.7 per cent, respectively, of total NBDTIs’ assets (Chart 5.3). The 50 per cent risk-weight bucket relates mainly to loans granted to civil servants, while the 100 per cent risk-weight buckets include finance leases and operating leases of Rs5 million or more. Other assets included in this risk category comprise mortgage loans, finance and operating leases; premises, real estate, furniture, fixtures, equipment, vehicles and other fixed assets including capital works in progress (excluding operational leases); and all other assets not elsewhere specified (excluding intangible assets deducted from capital).
Sectoral Credit and NPL
As at end-September 2014, credit granted by NBDTIs accounted for 15.7 per cent of total
private sector credit extended by banks and NBDTIs. Credit was mainly channelled to the personal and construction sectors, which represented 64.6 per cent and 14.9 per cent, respectively, of total NBDTIs’ credit. Traders, manufacturing, tourism and financial and business services sectors were allocated 2.8 per cent, 2.7 per cent, 1.7 per cent and 1.4 per cent, respectively, of the total credit by NBDTIs. Credit extended by NBDTIs grew by 18.7 per cent as at end-September 2014, from 15.7 per cent a year earlier.
Asset quality of NBDTIs improved further, with the overall ratio of NPL to total credit declining to 4.8 per cent as at end-September 2014, from 5.1 per cent a year earlier. Among the key sectors, only the traders sector recorded an increase in the NPL ratio, while the remaning other sectors registered a drop in their NPL ratios compared to the corresponding period of 2013. In the construction sector, despite the decline, the NPL ratio remained the highest among all sectors, at 21.1 per cent. The personal sector, which claims the largest share of NBDTIs’ credit, registered the lowest NPL ratio, at 0.5 per cent (Chart 5.4). Although loan loss provisioning increased over the year, the coverage ratio fell to 43.6 per cent, from 44.5 per cent as at end-September 2013, due to a higher rise in NPL relative to total provisions made.
FINANCIAL STABILITY REPORT | FEBRUARY 2015NON-BANK FINANCIAL INTERMEDIARIES
Chart 5.3: Risk Diversi�cation Matrix of NBDTIs
0
4
8
12
16
20
24
28
32
0% 20% 35% 50% 75% 100%
Sep-13 Dec-13 Mar-14 Jun-14 Sep-14
Rs billion
Chart 5.4: NPL as a ratio of Sectoral Creditin Key Sectors
0
5
10
15
20
25
Personal Construction Traders Manufacturing Tourism
Sep-11 Sep-12 Sep-13 Jun-14 Sep-14
Per cent

37
5.2 Insurance Sector
Global Trends in Insurance Industry
Across the world, the performance of the insurance sector (i.e., general and long-term insurance) has remained somewhat under stress given global market trends. According to the IAIS Global Insurance Market Report (GIMAR) 20145, in addition to the global economic factors confronting global (re)insurers, such as weak economic growth levels and low interest rates, (re)insurers are also contending with declining premiums and investment yields. Global premium growth was modest in 2013, having been on a declining trend since at least 2007. Underwriting profitability in non-life insurance is stable, being supported by benign claims trends that enable insurers to release loss reserves. For life insurers, low premium growth and low interest rates in particular form a challenging business environment. Concurrently, the (re)insurance sector as a whole experienced declining investment yields.
A potential area of growth for the insurance industry is the exposure to longevity risk. Longevity risk is the risk of paying out pensions and annuities for a longer time period than expected. In the past, life expectancy has often increased by more than expected, challenging holders of longevity risk which include governments, pension funds and some life insurers themselves. Total longevity risk is significant when measured from a financial perspective, with each year of life expectancy adding about 3-4 per cent to the present value of liabilities of a typical benefit pension fund. Estimates of the global amounts of annuity and pension-related risk exposures range from US$15 to US$25 trillion. Hence, risk holders will have to pay over an additional US$450 billion to US$1 trillion in aggregate for each year that longevity is underestimated. The uncertainty of these liabilities has been crystallized in a low interest rate environment, creating financial motivation for risk transfer.
Domestic Insurance Sector: Trends and Outlook
During 2013/14, insurance companies invested most of their funds in local assets and cash holdings. Insurers licensed to carry on general insurance business tend to adopt conservative investment portfolio mainly in cash and near liquid assets due to the short-tailed nature of their business. It is observed that, on average, only 5 per cent of total assets are invested overseas with the insurer having the largest investment overseas standing at 13 per cent. According to Section 7 of the Insurance Regulations 2007, an insurer shall at all times keep at least 50 per cent of its investment in Mauritius, and may invest outside Mauritius an amount not exceeding 50 per cent of its technical provisions relating to insurance business in Mauritius.
In the insurance sector, a main source of credit risk relates to individual company’s exposure to reinsurance. Insurance companies are exposed to possible default of its reinsurers for the latter’s share of insurance liabilities and refunds in respect of claims already paid by the insurers. As at 31 December 2013, receivables from reinsurers stood at 21 per cent of total assets for the general insurance industry but was negligible as a proportion of total assets for the long term insurance industry. Insurers reported that the claims history is closely monitored to identify potential deterioration in refunds being made by reinsurers. Credit risk originating from insurance contract holders outside Mauritius is considered minimal due to the limited volume of non-Mauritian policies issued.
The FSC issued important insurance legislation in 2014 with the view to ensuring proper business accountability and quality control in local insurance businesses (Box III).
There are several ways in which the insurance and banking sectors can be interlinked. In Mauritius, based on latest available statutory returns (for 2013), local insurance companies held Rs10 billion in terms of cash and deposit at banks and have invested Rs5 billion in the equity of local banks. Insurance companies
SECTIONNON-BANK FINANCIAL INTERMEDIARIESFINANCIAL STABILITY REPORT | FEBRUARY 2015
5 http://www.iaisweb.org/News/Global-Insurance-Market-Report-GIMAR-962.

38
had bank overdraft and loans amounting to Rs280 million and Rs613 million, respectively. According to section 20 of the Insurance Act, an insurer shall not, without the approval of the FSC, (a) mortgage, charge or otherwise encumber its assets; (b) directly or indirectly borrow any asset;
(c) by means of any surety, give any security in relation to obligations between other persons except where the security is provided under a guarantee policy which the insurer is authorized to issue under its licence.
5.3 Pensions Industry6
Insured Pension Schemes
The financial performance of Insured Pension Scheme was on the upturn over 2012-13. The Value under Fund Management of Insured Pension Schemes witnessed a 20 per cent increase over 2012-13, reaching Rs29.83 billion in December 2013. A similar upsurge was observed for Employee Contributions increasing from Rs121.70 million to Rs205.79 million, thus rising by 69 per cent. An increase from Employer Contributions was also noted over 2012-13, amounting to Rs574.35 million in December 2013, representing an increase of 37 per cent. A comparable growth of 23
per cent was recorded for Total Pension Turnover in December 2013 reaching Rs1.54 billion.
Superannuation Funds
The value of Funds under Management for Superannuation Funds PSM experienced a 15 per cent increase for the quarter ended December 2012-13. The funds reached Rs7.97 billion whilst those under the management of insurers contracted by 21 per cent, reaching Rs2.98 billion. Employee contributions for PSM rose by 11 per cent reaching Rs35.14 million while that of insurers contracted by 10 per cent, reaching Rs23.93 million. Employer contributions grew by 4 per cent for PSM, reaching Rs128 million, and
FINANCIAL STABILITY REPORT | FEBRUARY 2015NON-BANK FINANCIAL INTERMEDIARIES
Box III: Mauritius - Developments in Insurance Legislation
As part of its Fair Market Conduct programme, the FSC issued the Competency Standards (‘Standards’) on 27 October 2014.
The competence of the licensee, being one of the elements of the fit and proper requirements, is assessed with regard to the licensee’s education and qualifications together with relevant experience.
The Standards focus on the competence element of the fit and proper requirements and formalise the minimum competence in terms of specific technical knowledge and skills that licensees need to have. The Standards provide an indication to the licensees on how to demonstrate and maintain competence.
The Standards aim at ensuring that consumers of financial services benefit from professional conduct on the part of licensees.
The Standards are defined in terms of:
• the minimum technical competencies to demonstrate competence;• the minimum qualifications, training and experience requirements to demonstrate competence;• the minimum Continuous Professional Development requirements to maintain competence.
The Standards have become effective as from 01 January 2015.
6 Source: FSC Mauritius Annual Statistical Bulletin 2014.

39
fell by 13 per cent for insurers to Rs52.84 million. Benefit payments for PSM rose by 11 per cent and stood at Rs59.20 million, while that of insurers rose by 288 per cent to Rs31.4 million.
5.4 Reinsurance7
According to the IAIS Global Insurance Market Report (GIMAR) 2014, global growth of gross written premiums in the reinsurance sector largely follows premium trends in primary insurance. Correspondingly, premium growth in reinsurance declined over the last couple of years. Reinsurance premiums grew by nominal 1.3 per cent in 2013, after 2.6 per cent in 2012, compared to an average 11.1 per cent per year for the years 2000-13. Reinsurance premium growth rates are affected by the weakness of the global economy and soft market conditions, among other things.
Investment returns in the domestic reinsurance industry remain weak. In 2013, the investment yield - that is, ratio of total investment income to total investment - was at an estimated 3.1 per cent, from 3.4 per cent in 2012, compared to an annual average of 4.2 per cent for the years 2000-13. The average ROE of the reinsurance
industry in 2013 was 10.1 per cent compared with 9.3 per cent recorded in 2012. In concurrence with a decline in the combined ratio from 93.9 per cent in 2012 to 91.4 per cent in 2013, investment return remained weak at an estimated rate of 3.1 per cent in 2013 compared to an annual average of 4.2 per cent for the years 2000-13.
In Mauritius, general insurers widely make use of reinsurance business infrastructure (Table 5.1 and Chart 5.5). Over the past 5 years, insurers have reinsured on average 38 per cent of their gross premium, of which the largest share of reinsurance was effected for the two segments Engineering and Property for respective proportions of 83 per cent and 76 per cent of their gross premiums. The status of credit ratings revealed that 78 per cent of the premium reinsured was effected with reinsurers bearing high credit ratings (reinsurers rated 1 or above B+) which contribute to mitigate counterparty risk in the portfolio of insurance companies. Accordingly, 50 per cent and 44 per cent of the premiums were reinsured with A.M. Best and Standard and Poor’s, while the remaining 6 per cent were reinsured with Fitch and other unrated credit rating agencies.
SECTIONNON-BANK FINANCIAL INTERMEDIARIESFINANCIAL STABILITY REPORT | FEBRUARY 2015
7 Source: FSC Statutory Returns.8 Insurance (General Insurance Business Solvency) Rules 2007, http://www.fscmauritius.org/media/80510/insurance__general_insurance_business_
solvency__rules_2007.pdf.
Table 5.1: Reinsurance Statistics in 2013
Rating Range8 No. of Reinsurers % of Market Share
1 493 78%
2 36 6%
3 107 17%
Total 636 100%
Credit Rating Agency Amount Reinsured (Rs million)
% Reinsured
Standard and Poor’s 1,167.0 44%Fitch 84.2 3%AM Best 1,324.8 50%Unrated 90.7 3%Total 2,666.7 100%

40
NON-BANK FINANCIAL INTERMEDIARIES FINANCIAL STABILITY REPORT | FEBRUARY 2015
Chart 5.5: General Insurance - Reinsurance Ceded in Mauritius
6%
41%
83%
62%
76%
59%
66%
63%
38%
94%
59%
17%
38%
24%
41%
34%
37%
62%
0% 20% 40% 60% 80% 100%
Motor
Accident and Health
Engineering
Liability
Property
Transportation
Guarantee
Miscellaneous
TOTAL
% Reinsured % Retained
Source: FSC Mauritius Annual Statistical Bulletin 2014.

41
SECTIONPAYMENT SYSTEMS INFRASTRUCTUREFINANCIAL STABILITY REPORT | FEBRUARY 2015
This section describes ongoing policy initiatives to develop efficient and cost-effective payment systems in Mauritius.
Overview of the National Payment Systems Infrastructure
Mauritius’ payment systems infrastructure is built around a high value interbank payment backbone supporting other clearing and retail payment systems. With a view to ensuring sustained stability of the payment systems infrastructure, the Bank’s prime focus has been at ensuring increased resilience of Mauritius Automated Clearing and Settlement System (MACSS), which operates on the basis of Real Time Gross Settlement (RTGS). During 2014, the two main payment systems infrastructures owned and operated by the Bank of Mauritius, namely, the MACSS and Port Louis Automated Clearing House (PLACH)9 have shown remarkable resilience and have positively contributed towards maintaining the stability of the overall system.
Throughput and Availability of MACSS
During 2014, the volume and value of transactions settled on MACSS have been higher than in 2013 (Chart 6.1).
In 2014, the total value settled through MACSS exceeded Rs2.4 trillion or 6.3 times Mauritius’ GDP. All transactions were settled without delay or loss, thus underscoring the fact the MACSS has remained resilient and it is appropriately sized to handle current volumes. Moreover, MACSS has operated without any downtime in 2014, and it has also provided settlement windows exceeding the statutory requirements by an average of 15 minutes per-day.
Cheque Truncation and Electronic Clearing
Since the implementation of the Bulk Clearing System in 2011, cheques and interbank electronic fund transfers (EFT) have been cleared at the Clearing House and settled immediately on MACSS (Charts 6.2 and 6.3). The main objective for introducing EFT on the clearing system is to remove from MACSS low value non-time sensitive payments. In 2014, about 4.8 million cheques were cleared representing a decline of 3 per cent in volume compared with 2013. Consequently, the total value of cheques cleared, which stood at Rs264 billion, also dropped by 2 per cent in 2014 compared with 2013. A decrease in the number and value of cheques cleared has a positive impact on the financial stability of the system given the risks associated
6. Payment Systems Infrastructure
Chart 6.1: Transactions on MACSS
0
10,000
20,000
30,000
40,000
50,000
60,000
70,000
80,000
0
50
100
150
200
250
300
350
Jan Feb Mar Apr May Jun Jul Aug Sep Oct Nov Dec
Value 2013 Value 2014 Volume 2013 (RHS) Volume 2014 (RHS)
Rs billion
Chart 6.2: Cheques Cleared
0
5
10
15
20
25
30
0
100,000
200,000
300,000
400,000
500,000
600,000
Jan Feb Mar Apr May Jun Jul Aug Sep Oct Nov Dec
Value 2013 (RHS) Value 2014 (RHS) Volume 2013 Volume 2014
Rs billion
9 PLACH is a supporting system of MACSS through which cheques and low-value payments are cleared and settled on a net basis on the MACSS.

42
with cheques. On the other hand, the volume and value of EFTs cleared in 2014 increased by 6 per cent and 7 per cent, respectively, compared with 2013, which indicates an increasing use of this mode of payment.
In early 2015, the Bank will introduce, the Direct Debit system, which will be a system to collect recurrent payments. For the first time, utility and Government bodies will interact directly with the system to receive payments. This will help to enlarge the participants’ base of the Clearing House and goes in line with the CPMI recommended principles for market infrastructures.
National Payment Switch
The Bank is introducing a national payment switch system to cover banking transactions using bank cards, ATMs, mobile phones and other emerging electronic methods such as
wireless processing (Box IV). It will simplify the clearance process, mitigate the risk of systemic failure, and reduce the costs to users.
FINANCIAL STABILITY REPORT | FEBRUARY 2015PAYMENT SYSTEMS INFRASTRUCTURE
Chart 6.3: EFT Cleared
0
50,000
100,000
150,000
200,000
250,000
300,000
350,000
400,000
450,000
0
2
4
6
8
10
12
Jan Feb Mar Apr May Jun Jul Aug Sep Oct Nov Dec
Val 2014 Val 2013 Vol 2014 (RHS) Vol 2013 (RHS)
Rs billion
Box IV: Mauritius - National Payment Switch
Despite the successful initiative of the Bank to modernise retail payments, all card-based payments and those using mobile devices fall outside the services of the Bank. Owing to their size and growth, such payment methods increasingly present systemic risks to the financial system by posing threats to its stability. The current system of card networks is not connected at national level. A payment made with the card of one bank, using the Point of Sale (POS) device provided by another bank, results in a routing outside Mauritius, through the international card providers’ systems. This involves higher costs than would be incurred in a national system.
The implementation of a National Payment Switch for card and mobile banking is, thus, systemically critical and beneficial to users. The National Payment Switch will bring cost effectiveness in the payment value chain, provide a standard system for all transactions that sets all players on a level playing field, and ensure continued protection of consumers. A Payment Switch is a central point for routing all electronic transactions such as those made from ATMs, POS, as well as Mobile devices. This results in lower transactions costs, with the possibility of merchants sharing POS and users accessing the ATMs of any bank without incurring additional costs. The National Switch has the potential to provide value-added services such as electronic wallets, pre-paid cards, and facilitate Government payments such as pensions and social security payments.
Benefits of a National Payment Switch
The National Payment Switch, by way of its design and operation, will fill the gap in the area of retail payments and will provide several benefits to the card business, the merchants and customers.
43
SECTIONPAYMENT SYSTEMS INFRASTRUCTUREFINANCIAL STABILITY REPORT | FEBRUARY 2015
Cost Savings
The current set-up of card-based payments in Mauritius is based on the concept of a one-to-one direct relationship with the payment processors, thus resulting in multiple investments and processing costs. Switches are designed to be payment processor neutral and may therefore interface easily to virtually any payment processor. This processor neutrality, combined with insulation of the POS from payment processor connections, will give merchants and card issuers maximum flexibility when it comes to evaluating their payment processing relationships. Cost savings will therefore be achieved on multiple fronts, namely:
• Switch will allow direct routing of authorization requests and eliminate intermediate arrangements and related processing costs;
• Switch will allow batch settlement of transactions instead of single transaction processing; and
• Switch will have direct connection with credit card associations, thus eliminating per-transaction conveyance fees (estimated at about 10% per total merchant fees) charged by processors to route these transactions.
Revenue Generation Opportunities
Payment switches are typically integrated and certified with multiple processors across numerous tender types and payment products. Merchants can therefore propose a wider range of payment and service options to their customers. This will allow merchants to attract more customers and propose switch-supported payment services such as phone cards and gift card trees. In fact, there is a revenue opportunity cost associated with failing to rapidly adopt such new tender types and payment products.
Administrative Efficiencies
The Switch has a direct impact on the following business areas:
• Centralised Reporting: T he entire settlement process will be centralised, thereby saving merchants from the in-store staff for batch reconciliation and associated reconciliation challenges. The Switch allows merchants to view their payment system from a single reporting and interfacing system.
• Integrated POS: Most merchants in Mauritius still operate payment terminals in a stand-beside scenario, where card information is entered twice at the payment terminal – once via a card swipe and then again through a manually keyed entry into the POS system. A payment switch can help integrate payment terminals with POS systems which eliminate the need to double-enter transactions. It also removes the associated back office burden needed to reconcile transaction record differences between the POS system and payment terminal.
Low Cost Sharing of ATMs
Currently, customers have to pay a fee ranging from Rs35 to Rs80 when cash is withdrawn from the ATM of another bank. This is mainly due to interchange fees that are paid in the process. With the National Switch, ATM sharing fees can be considerably reduced.
National Cards and Store Value
The Switch provides the ideal environment for the issue and use of a ‘National Card’ to further drive down costs of local transactions. National cards can also take the form of Electronic (Social) Benefits Transfer (EBT) cards which are stored-value cards issued by government agencies to distribute pension, money for food, clothing and living expenses to recipients enrolled on special programmes (social security, low-income programmes, etc.).

44
FINANCIAL STABILITY REPORT | FEBRUARY 2015PAYMENT SYSTEMS INFRASTRUCTURE
Internet and Mobile Payment Switching
In a Switch environment, merchant fees relative to payment made over the internet are reduced. The Switch provides virtual terminals to merchants who can effect recurring billing to customers, print and send customised receipts and have round-the-clock access to free reporting.
The options for mobile payments in the market are currently limited and suffer mainly from the issue of inter-operability which the Switch will address. Currently, a person must have an account with a specific service provider which in turn works with a specific bank in order to be able to make use of the service. The Switch will provide a platform for switching payments to and from mobile devices, making mobile payment inter-operable from a provider as well as from a banking perspective.
Wireless Processing
The Switch will enable wireless credit card processing technology. As such, it will offer new flexibility and opportunities for all merchants, help increase sales, reduce operating expenses and will be particularly beneficial for those merchants whose business takes them outside the traditional bricks-and-mortar establishment.
From Payment Switch to Payment Hub
The Bank has also noted that our current banking and payment environment is not conducive for the digital revolution that would benefit operators and consumers. The following imperfections in our current environment are noteworthy:
1. Silo approach to electronic payments and services;
2. High costs to services;
3. High dependence on international service providers such as Visa or MasterCard;
4. Dominance of a few operators;
5. Product-centric approach for banking and payment services; and
6. No level playing field for small operators.
The development of a Payment Hub is, thus, warranted. The Bank proposes to address these issues through the Payment Hub, which is a core component of the Switch, and is expected to become an enterprise payments architecture that will:
1. Integrate and route all types of payments and digital banking services across the country;
2. Allow banks to build their own version of best-in-class banking and payment architecture;
3. Tie together specialised services required to build payment applications, such as data completion, exception handing and settlement;
4. Incorporate a centralised point for AML/CFT/OFAC filtration, risk management, dispute resolution and archiving; and
5. Allow new types of specialized service providers, distinct from banks, to operate.

45
SECTIONRISK ANALYSISFINANCIAL STABILITY REPORT | FEBRUARY 2015
This section presents the Bank’s analysis of the main risks to the stability of the domestic financial system. Consistent with earlier sections of the Report, the analysis identifies risks stemming from: (i) the external and domestic macroeconomic environment; (ii) trends with household and corporate debt, (iii) trends with
the domestic banks’ and non-banks’ financial soundness indicators, including results from stress testing. The graphical presentation below presents a summary of the risks identified in this section, focusing on their likely impact on the financial stability of the country, should they materialise.
7. Risk Analysis
Table 7.1: Risks to Financial Stability for the Upcoming Six Months
RiskProbability
ChangeProbability1
Global EconomyGlobal economic slowdown Unchanged èOil price Down êFood prices Unchanged èVolatitlity (ViX) Down ê
Domestic EconomyEconomic growth Unchanged èInflation Unchanged èTerms of trade Down êDomestic savings Unchanged èInvestment/GDP Unchanged èExchange rate2 Down ê
Household Debt RisksHousehold debt-to-disposable income Unchanged èHousehold debt service-to-disposable income Unchanged è
Corporate Debt RisksCorporate debt-to-GDP Down êReturn on equity Unchanged èLeverage Unchanged è
BankingLarge exposures Unchanged èReturn on equity Unchanged èAsset quality (domestic market) Unchanged èCross-border exposures Unchanged è
Risk analysis keyHigh Medium Low
6 5 4 3 2 1
1 Change between December 2014 and June 2015.2 Down refers to a depreciation of the rupee.Source: Bank of Mauritius staff estimates.

46
Risks Stemming from the Macroeconomic Environment
A small open economy like Mauritius is affected by instability in global trade and finance. While the fall in international oil prices is likely to boost private consumption in the short-term, the registered sustained decline in the ratios of investment to GDP does not augur well for medium-term growth. Further, enduring economic and financial weaknesses in the euro area are likely to reduce income from tourism, which has been an important source of external financing of Mauritius’ large deficits in external trade. Leads and lags in GBC international flows (i.e., net FDI and portfolio investment) have also provided an important source of external funding. Going forward, it will be important to carefully monitor the variations of these large critical financial flows.
Risks Stemming from Household Debt
Household indebtedness (as a share of disposable income) and household debt service costs are relatively low by international standards, but warrant monitoring, nonetheless. Macroprudential policies and credit limits are now in place on housing lending, thus providing standard conditions with banks in mortgage financing. Case-by-case analysis and monitoring of NPL is still needed to secure a proper implementation of the policy measures, and to continuously assess the impact of those measures on the economy as a whole and on financial stability.
Risks Stemming from the Corporate Sector Debt
Corporate indebtedness, as a share of GDP, is also relatively low by international standards, but poses a risk in terms of the high leverage ratios affecting leading corporations in the economy. Leverage ratios in tourism, construction, real estate, traders and financial services are more than 100 per cent, which are multiples of the ratios found in comparator countries. The financial risks stemming from this situation depend on each sector’s ability to reduce its indebtedness (deleveraging), accompanied by greater equity infusion or higher revenue growth, in a reasonably short period of time. Failure to do so carries a risk
of further reducing private investment and overall growth of the Mauritian economy.
Risks Stemming from Implementation of Macroprudential Measures
Macroprudential policies and credit limits appear to have provided useful benchmarks for the extension of banks’ residential and commercial mortgage credit and containment of credit risk (Table 7.1). In particular, the measures have supported standard financial conditions for banks. These policies are also intended to curb a perceived increasing risk appetite by banks regarding commercial mortgage lending, in the face of declining demand. For some banks, however, the credit limits (loan-to-value and debt-to-income ratios) were already in place in line with international practices, and this may not significantly affect existing lending practices.
Following international experience, macroprudential policies and credit limits are likely to have differential effects on small and big borrowers of mortgage finance. This warrants surveillance. Loan-to-value ratios may have distinct effects on credit demand depending on the residential housing market segment. Lower income housing borrowing may benefit from: (i) existing subsidised mortgage financing schemes, such as the Housing Empowerment Scheme, for example, and (ii) aggressive marketing of mortgage financing targeted at first-time house owners. Also, the caps on loan-to-value ratios applicable on the purchase of second and subsequent residential housing may have had stronger effects on credit growth of high-end housing than in other market segments. Furthermore, there may be different impact on the demand for large and small commercial property lending. The demand for loans for major projects, specifically above Rs75 million, may be somewhat sheltered where there are long-term customer relationships between borrowers and lenders, and accompanied by collateral.
Risks Stemming from the Banking Sector
Banks are generally well-capitalised, although declining profitability of domestic-owned banks appears to have triggered some portfolio
FINANCIAL STABILITY REPORT | FEBRUARY 2015RISK ANALYSIS

47
reallocation between domestic and foreign assets, as well as increases in provisioning against NPL. Going forward, however, a number of risks need to be carefully monitored by the regulator:
• Relatively large banks’ net foreign asset positions merit monitoring of underlying credit and possible foreign exchange risk. About 30 per cent of banks’ gross external assets represent lending abroad of GBC funds held with banks, while the differences are mainly loans and other placements in India, Europe, South Africa and other frontier markets in Africa such as Nigeria and Tanzania. While credit risk information on those loans and placements (including trade finance) is not readily available,
several external and idiosyncratic factors are likely to heighten credit risk, if borrowers are unable to pay their loans, together with possible foreign exchange rate risk, depending on the currency denomination of the loans.
• Strong regulatory frameworks of banks’ external positions need to be developed. While guidelines on banks’ currency and country exposures are in place,10 banks’ exposures to frontier markets in Africa warrant surveillance of foreign asset quality and a strengthening of financial group regulations to secure proper securitisation of banks’ foreign assets, if any.
SECTIONRISK ANALYSISFINANCIAL STABILITY REPORT | FEBRUARY 2015
Table 7.2 Mauritius: Credit Limits and Macroprudential Measures (As of January 2015)
Scope Objective Measure
Debt-to-Income ratio (Effective January 1, 2014)
Concern about level of household indebtedness; avoid overleveraged when borrowing for purchase/construction of residential facilities.
Debt service (interest plus amortization) should not exceed 40% of borrower’s monthly gross income below Rs200k (50% for income more than Rs200k).Measure does not apply to borrowers under low cost housing projects promoted by Government; bank employees.
Loan-to-Value Ratio on credit facilities for purchase/construction of residential/commercial properties (Effective January 1, 2014)
Restrict losses in event of default and/or decline in property prices.Discourage speculation, prevent excessive leverage & reduce systemic risk related to rapid expansion of credit to construction sector.
Residential properties: First housing units:90% of property value (V); loans up to Rs5 million80% of V; loans up to Rs12 million70% of V; loans above Rs12 millionSecond or any subsequent property:70% of property valueCommercial properties: 70% of V; loans up to Rs75 million60% of V; loans above Rs75 millionMeasure does not apply to loans granted under SME Financing Scheme (also Small and Micro Financing enterprises); residential property loans granted to bank employees; commercial loans to Public Sector Enterprises (PSEs); and borrowers holding financial guarantee by Government.
Risk-weighted Assets (Effective July 1, 2014)
To address systemic risk due to loans to the construction sector
Bank should risk-weight its fund-based and non-fund-based credit collateralized by residential and commercial properties
Additional Portfolio Provision (Effective July 1, 2014)
Ensure early provisioning against future credit losses due to rising corporate indebtedness & non-performing loans
Additional portfolio provisions effective July 1, 2014 and (July 1, 2015).Housing: 0.5% (0.5%)Construction sector (i.e., commercial, residential and land parceling): 0.5% (1.0%)Tourism & Personal sectors: 0.5% (1.0%)
10 See Guidelines for Calculation and Reporting of Foreign Exchange Exposures of Banks and the Guideline on Country Risk Management issued by the Bank of Mauritius.

48
• Relatively high leverage ratios support the development of strong re-structuring frameworks of corporate bank debt to address companies’ underlying cash problems. Recurrent corporate debt rescheduling may be initially tackled with hikes in bank capital. Yet, over the long run, there may be a need to develop restructuring that would allow companies to service their debt, while investing and growing. As noted above, sectors such as tourism, construction, trade and financial services - all of them highly leveraged - account for a large portion of GDP and total bank credit.
• Concentration of bank credit warrants monitoring. The underlying risks include those stemming from a sudden failure of a relatively large borrower (i.e., counterparty risk) or a group of connected borrowers to service their debt. Contagion risk could be even higher if the counterpart is another bank.
Risks stemming from Non-Bank Financial Intermediaries
Insurance companies hold sizeable deposits and equity with domestic banks. The overall envelope of insurance companies’ claims on the domestic banking sector is about Rs15 billion (compared against total bank deposits of about Rs365 billion). This said, while insurance deposits could potentially experience volatility, this has historically not been the case.
Risk Stemming from Payment Systems Infrastructure
Financial system risks stemming from the payment systems are contained and unchanged from earlier FSRs’ assessments. The Bank remains embarked on a strategy to secure real time settlement of high value interbank transactions and it is advancing with the implementation of cost-effective clearing systems for small value transactions. These developments embrace an improved direct debit system; the implementation of the National Payment Switch for all card-based payments; and the application of these to mobile devices and the internet. These enhancements will be major milestones in further modernising the payment systems for the country and reducing the cost of retail payments.
FINANCIAL STABILITY REPORT | FEBRUARY 2015RISK ANALYSIS

49
SECTIONCONCLUDING REMARKSFINANCIAL STABILITY REPORT | FEBRUARY 2015
This Financial Stability Report has sought to identify systemic risks to the domestic financial system. Systemic risks are those that hold the potential to significantly impact real economic activity. Moreover, the interconnectedness between economic units (borrowers and lenders of financial resources) within and outside the local economy warrants the surveillance of all components of the financial system, as indicated in this Report. In the light of assessments made on the outlook for financial stability of the domestic financial sector, key challenges remain in the areas as identified below:
A. Global and Domestic Macroeconomic Environment
• Mauritius’ relatively large external trade and current account deficits (as a share of GDP) highlight the importance of net capital inflows to finance those imbalances, with GBC net inflows playing a leading role in covering the funding gap. In this context, strong policy coordination is warranted between the Bank (in its capacity of guarding the payment systems and regulator of domestic banks) and the FSC (as regulator of GBC financial vehicles). The ongoing implementation of the existing Memorandum of Understanding between the Bank and the FSC, thus, provides comfort in this regard.
• The declining trend in gross domestic capital formation (as a share of GDP) reduces actual and potential economic growth. As such, efforts to stimulate private and public investment should be pursued, as should efforts to diversify the economy away from traditional sources of foreign exchange earnings, within a competitive framework.
B. Private Debt: Households and Corporates
• Household indebtedness and household debt service (both as a share of disposable income) are relatively low by international standards,
but warrant monitoring nonetheless. Macroprudential measures and credit limits are currently in place to halt any excessive expansion in bank financing of residential and commercial real estate properties. Yet, case-by-case analysis and monitoring of NPL is still needed to secure a proper implementation of the policy measures.
• Corporate indebtedness, as a share of GDP, is also relatively low by international standards in Mauritius. However, the high leverage ratio of some leading corporations in the economy remain a concern and may pose a risk to the soundness of banks. Deleveraging - accompanied by equity infusion and/or higher revenue growth - in an orderly manner is, thus, warranted so as to support future investment and growth of the corporates and economic sectors affected.
C. Performance of the Banking Sector
• To address credit and possible foreign exchange risk resulting from local banks’ exposures to frontier emerging markets (India, South Africa, Nigeria, Tanzania), the Bank encourages banking institutions to buttress their internal credit rating procedures, as needed, while strictly abiding to existing guidelines and regulation on foreign exchange exposures. Banking institutions are also encouraged to conduct regular stress testing and have formal and well-developed contingency funding plans to manage credit, exchange and liquidity risks.
• The deceleration in banks’ domestic credit growth is likely to be interwoven with the high leverage ratios confronting leading corporates in the economy. Recurrent corporate debt rescheduling may be initially tackled with hikes in bank capital. Yet, over the long run, there may be a need to develop restructuring frameworks that would allow companies to service their debt, while investing and growing, as needed. The Bank therefore urges banking
8. Concluding Remarks

50
institutions to develop such restructuring frameworks as soon as possible.
• Credit concentration warrants proactive action by the regulator. In the short-term, one option is to increase bank’s capital allocations, so as to lower concentration ratios across the board. Over the medium-term, there is a need to toughen the restrictions of banks’ exposures to large borrowers and large business groups in line with the recommendations of the April 2014 Supervisory Framework for Measuring and Controlling Large Credit Exposures issued by BCBS. The framework includes a general limit applied to all of a bank’s exposures to a single counterparty, which is
set at 25 per cent of a bank’s Tier 1 capital. This limit also applies to a bank’s exposure to identified groups of connected counterparties (i.e., counterparties that are interdependent and likely to fail simultaneously). A tighter limit will apply to exposures between banks that have been designated as Domestic-Systemically Important Banks. This limit has been set at 15 per cent of Tier 1 capital.
D. Payment Systems Infrastructure
• A number of policy initiatives are currently in place to develop efficient and cost-effective payment systems along internationally accepted principles and good practices.
FINANCIAL STABILITY REPORT | FEBRUARY 2015CONCLUDING REMARKS

51
SECTIONANNEXFINANCIAL STABILITY REPORT | FEBRUARY 2015
Household disposable income has been estimated from the National Accounts Estimates, Statement of Budgetary Central Government Operations and the Balance of Payments using the following equation:
Household disposable income = compensation of employees + budget transfers + inward remittances – personal income tax
Compensation of employees is estimated from the national accounts published by Statistics Mauritius. These data include salaries paid by the public and private sectors. This definition is narrower than the National Accounts definition which includes income of individuals as consumers, entrepreneurs, individual proprietors and partnerships and Non-Profit Institutions Serving Households. Chart I shows the evolution of the estimated household disposable income from 2009Q2 to 2014Q3.
Annex: Estimation of Household Disposable Income
Chart I: Household Disposable Income
Rs million
100,000
105,000
110,000
115,000
120,000
125,000
130,000
135,000
140,000
145,000
150,000
Q2 Q3 Q4 Q1 Q2 Q3 Q4 Q1 Q2 Q3 Q4 Q1 Q2 Q3 Q4 Q1 Q2 Q3 Q4 Q1 Q2 Q3
2009 2010 2011 2012 2013 2014
52
SECTION
2.1 Volatility Index
2.2 Mauritius: Gross Fixed Capital Formation,
Investment as %, and ICOR
2.3 SEMDEX and SEM-7 Indices
2.4 Transactions by Foreign Investors on the SEM
2.5 Evolution of NEER, REER, MERI1 and MERI2
Indices
2.6 Exchange Rate Movements
2.7 Banks: Gross Foreign Assets
3.1 Y-o-y Growth of Housing and Consumption
Credit
3.2 Household Debt to Disposable Income
3.3 Alternative Estimates of Household
Indebtedness Ratio
3.4 Household Indebtedness in Selected Countries
3.5 Household Debt Service Cost and Interest
Rates
3.6 Household Debt Service Cost in Selected
Countries
3.7 Advanced Economies: Corporate Debt to GDP
Ratio
3.8 Other Country Comparators: Corporate Debt
to GDP Ratio
3.9 Y-o-y Growth of Corporate Credit
3.10 Importance of Selected Sectors in GDP and in
Total Corporate Credit
3.11 Leverage Ratio of Leading Economic Sectors
4.1 Banking Sector Assets
4.2 Distribution of Banks’ Advances and Assets
4.3 Return on Assets of the Banking Sector
4.4 Return on Equity of the Banking Sector
4.5 Tier 1 Capital Ratio
4.6 Non-Performing Loans of Banks
4.7 Non-Performing Loans and Coverage Ratio
4.8 Outstanding BoM Securities by Maturity
5.1 Y-o-y Growth of Total Assets and Deposits
5.2 Liquidity Indicators of NBDTIs
5.3 Risk Diversification Matrix of NBDTIs
5.4 NPL as a ratio of Sectoral Credit in Key Sectors
5.5 General Insurance - Reinsurance Ceded in
Mauritius
6.1 Transactions on MACSS
6.2 Cheques Cleared
6.3 EFT Cleared
List of Charts
FINANCIAL STABILITY REPORT | FEBRUARY 2015LIST OF CHARTS

53
2.1 Saving-Investment Balance
2.2 Balance of Payments, 2010-2014
2.3 Other Depository Corporations Composition of
Gross Foreign Assets
2.4 Coordinated Direct Investment Survey - Position
Data for Mauritius as at end-2013 vis-à-vis Top
Ten Counterpart Economies
3.1 Domestic and External Debt of Corporates
3.2 Distribution of Credit to the Private Sector
3.3 Risk Analysis of Leading Enterprises in Mauritius
Listed on the Stock Exchange of Mauritius
3.4 Fundamentals of Corporates: International
Comparison
4.1 Banks’ Assets by Type of Bank and Asset,
2012-2014
4.2 ODCs’ Balance Sheet, 2011-2014
4.3 Financial Stability Indicators of Other Depository
Corporations (Banks and NBDTIs)
4.4 Credit Concentration Risk
4.5 Exposure of Banks to Ten Largest Borrowers
5.1 Reinsurance Statistics in 2013
7.1 Risks to Financial Stability for the Upcoming Six
Months
7.2 Mauritius: Credit Limits and Macroprudential
Measures
Box I Small- and Medium-Size Enterprises in
Mauritius
Box II Global Business Companies
Box III Mauritius - Developments in Insurance
Legislation
Box IV Mauritius - National Payment Switch
List of Tables
List of Boxes
LIST OF TABLES AND BOXESFINANCIAL STABILITY REPORT | FEBRUARY 2015

54
ACRONYMS FINANCIAL STABILITY REPORT | FEBRUARY 2015
AML/CFT Anti-Money Laundering/Combating
the Financing of Terrorism
ATM Automated Teller Machine
BCBS Basel Committee on Banking
Supervision
BoP Balance of Payments
CAR Capital Adequacy Ratio
CET Common Equity Tier
D-SIB Domestic-Systemically Important
Bank
DTA Double Taxation Agreement
DTI Debt-to-Income
EBT Electronic Benefits Transfer
EFT Electronic Fund Transfers
FDI Foreign Direct Investment
US Fed Federal Reserve
FSC Financial Services Commission
FSR Financial Stability Report
GBCs Global Business Companies
GDFCF Gross Domestic Fixed Capital
Formation
GDP Gross Domestic Product
GFCF Gross Fixed Capital Formation
IAIS International Association of Insurance
Supervisors
ICOR Incremental Capital Output Ratio
IMF International Monetary Fund
LTV Loan-to-Value
MACSS Mauritius Automated Clearing and
Settlement System
MERI Mauritius Exchange Rate Index
NBDTIs Non-Bank Deposit-Taking Institutions
NPL Non-Performing Loans
OFAC Office of Foreign Assets Control
PLACH Port Louis Automated Clearing House
POS Point of Sale
PSM Pension Scheme Management
ROA Return on Assets
ROE Return on Equity
RTGS Real Time Gross Settlement
SEM Stock Exchange of Mauritius
WEO World Economic Outlook
Y-o-y Year-on-year
Acronyms

55
Basis point is a unit equal to one hundredth of a percentage point.
Coverage ratio (ratio of provisions to NPL) measures a bank’s ability to absorb losses from its non-performing loans.
Cross-border exposures refer to exposures of banks outside Mauritius.
GBC1s are resident corporations which conduct business outside Mauritius. The law has recently been amended to allow them to transact with residents provided that their activities in Mauritius are ancillary to their core business with non-residents.
Herfindahl–Hirschman Index is a measure of the size of firms in relation to the industry and an indicator of the amount of competition among them. It is a commonly accepted measure of market concentration.
MERI1 is the Mauritius Exchange Rate Index, a nominal effective exchange rate introduced in July 2008, based on the currency distribution of merchandise trade.
MERI2 is the Mauritius Exchange Rate Index, a nominal effective exchange rate introduced in July 2008, based on the currency distribution of merchandise trade and tourist earnings.
ROA is the annualised pre-tax return on assets and is measured by the ratio of pre-tax profit to average assets.
ROE is the annualised pre-tax return on equity and is measured by the ratio of pre-tax profit to average equity.
SEMDEX is an index of prices of all listed shares on the Stock Exchange of Mauritius and each stock is weighted according to its share in the total market capitalisation.
SEM-7 is an index launched by the Stock Exchange of Mauritius on 31 March 1998. It comprises the seven largest eligible shares of the Official Market, measured in terms of average market capitalization, liquidity and investibility criteria.
Tier 1 capital is a term used to qualify eligible capital of a bank and constitute the component having the highest loss-absorbing capacity.
Y-o-y change compares the value of a variable at one period in time compared with the same period the previous year.
Glossary
GLOSSARYFINANCIAL STABILITY REPORT | FEBRUARY 2015

BANK OF MAURITIUS
Address Sir William Newton Street Port Louis Mauritius
Website https://www.bom.mu ISSN: 1694-2353