financial stability report - bot.go.tz · . ... despite the downside risks, ... with ratio of core...
TRANSCRIPT
Financial Stability Report - September 2015
1
financial stability report
september 2015

Financial Stability Report - September 2015
2
Financial Stability Report - September 2015
3
FINANCIAL STABILITY REPORT
September 2015
ISSN 1821-7761
For any enquiries and comments contactDirectorate of Financial Stability
Bank of Tanzania2 Mirambo Street 11884, Dar es Salaam
Tel: +255 22 223 3471/2Fax: +255 223 4076http://www.bot.go.tz

Financial Stability Report - September 2015
4
Financial Stability Report - September 2015
i
table of contents
LIST OF CHARTS, TABLES, BOXES AND FIGURES ...................................................... iiLIST OF ACRONYMS ........................................................................................................... ivFOREWORD ............................................................................................................................ vEXECUTIVE SUMMARY .................................................................................................... vi
1.0 MACRO-ECONOMIC AND FINANCIAL ENVIRONMENT .................................... 11.1 Macroeconomic Environment ........................................................................................... 11.2 Financial Conditions ......................................................................................................... 31.3 Domestic Macroeconomic Environment ......................................................................... 31.4 External Sector Developments ........................................................................................ 5
2.0 NON-FINANCIAL CORPORATE AND HOUSEHOLD SECTORS ........................ 72.1 Non-Financial Corporate Sector Financial Conditions .................................................... 72.2 Household Financial Conditions ........................................................................................ 8
3.0 PERFORMANCE OF THE FINANCIAL SECTOR .................................................. 113.1 Banking Sector .................................................................................................................. 113.2 Non-Banking Financial Sector .......................................................................................... 173.3 Cross-Sector Linkages in the Financial System ............................................................... 25
4.0 FINANCIAL SYSTEM INFRASTRUCTURE AND REGULATORY DEVELOPMENTS ........................................................................... 27 4.1 Payments Systems .................................................................................................... 27 4.2 Regulatory Developments .................................................................................... 28
5.0 FINANCIAL SYSTEM RESILIENCE, OUTLOOK AND RECOMMENDATIONS ................................................................................................ 295.1 Financial System Resilience ............................................................................................. 295.2 Financial Stability Outlook ................................................................................................ 29
6.0 POLICY RECOMMENDATIONS ............................................................................... 31
APPENDICES .......................................................................................................................... 32
Financial Stability Report - September 2015
ii
list of cHarts, tables, boXes anD fiGUres
cHarts
Chart 1.1: World GDP Growth Rate ........................................................................................ 1
Chart 1.2: GDP Growth Rates for Emerging Markets and Developing Economies ............... 2
Chart 1.3: Economic Growth in sub-Saharan Africa, EAC and SADC ................................. 2
Chart 1.4: Zanzibar Inflation Rate Development ..................................................................... 4
Chart 1.5: Government Debt by Maturity .............................................................................. 5
Chart 1.6: Debt Sustainability Indicators ................................................................................. 5
Chart 1.7: Exchange Rates Development of TZS against Selected Currencies (Jan 2010=100) .. 6
Chart 1.8: Monthly Interest Rate Movements; 2012-2015 ...................................................... 6
Chart 2.1: Annual Growth of Bank Credit to Major Activities .............................................. 7
Chart 2.2: Developments in NFC Off-shore Borrowing ( in millions of USD) ...................... 8
Chart 2.3: Household Debt to Disposable income .................................................................. 8
Chart 2.4: Household Debt Servicing Ratio ............................................................................ 9
Chart 3.1: EAC Selected Financial Soundness Indicators ...................................................... 13
Chart 3.2: Credit Distribution and Non-Performing Loans at September 2015 ...................... 14
Chart 3.3: Measures of Risk Diversification ........................................................................... 15
Chart 3.4: Performance of the TZS Interbank Money Market as of September 2015 ............. 17
Chart 3.5: Performance of the Foreign Exchange Interbank Money Market as of
September 2015 ...................................................................................................... 18
Chart 3.6: Performance of the Dar es Salaam Stock Exchange as of September 2015 .......... 19
Chart 3.7: Dar es Salaam Stock Exchange Turnover Ratios and Foreign Investor
Participation as of September 2015 ......................................................................... 19
Chart 3.8: Market Performance for Government Bonds ........................................................ 20
Chart 4.1: Payment System Turnover Value to GDP .............................................................. 27
Chart 4.2: TISS Database and Server Availability .................................................................. 28
Chart 5.1: Stress Testing Results of the Banking System ........................................................ 29
Financial Stability Report - September 2015
iii
tables
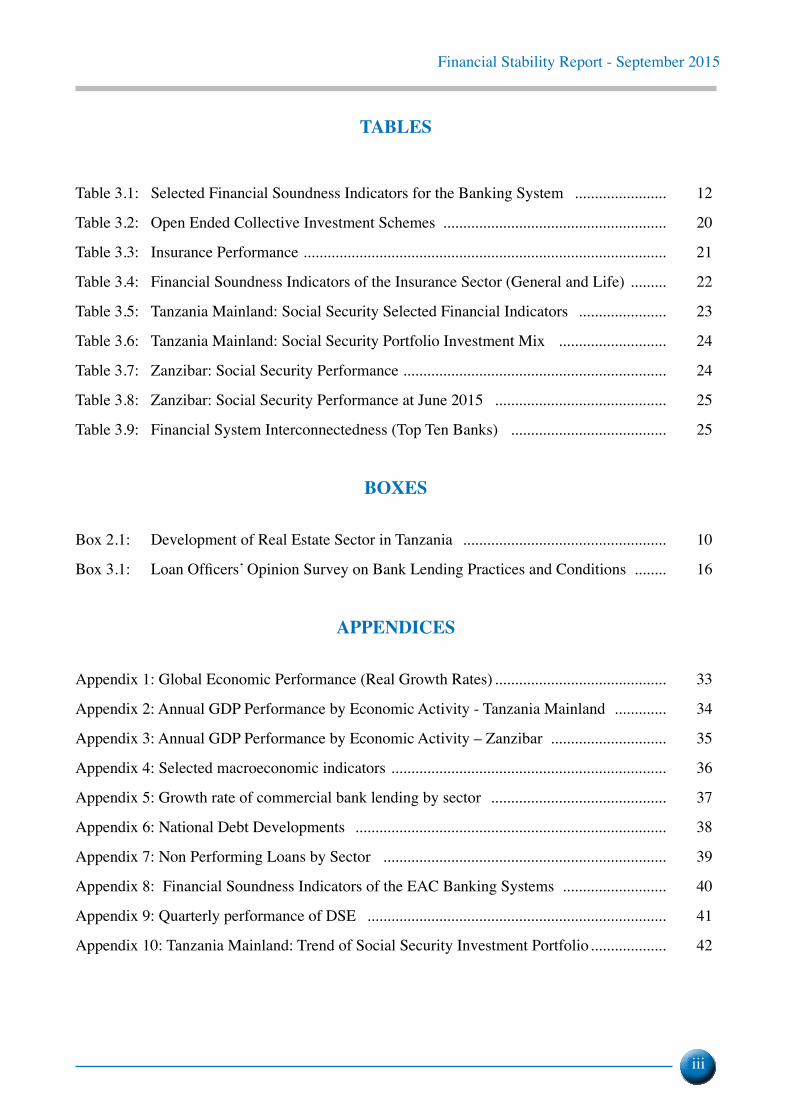
Table 3.1: Selected Financial Soundness Indicators for the Banking System ....................... 12
Table 3.2: Open Ended Collective Investment Schemes ........................................................ 20
Table 3.3: Insurance Performance ........................................................................................... 21
Table 3.4: Financial Soundness Indicators of the Insurance Sector (General and Life) ......... 22
Table 3.5: Tanzania Mainland: Social Security Selected Financial Indicators ...................... 23
Table 3.6: Tanzania Mainland: Social Security Portfolio Investment Mix ........................... 24
Table 3.7: Zanzibar: Social Security Performance .................................................................. 24
Table 3.8: Zanzibar: Social Security Performance at June 2015 ........................................... 25
Table 3.9: Financial System Interconnectedness (Top Ten Banks) ....................................... 25
boXes
Box 2.1: Development of Real Estate Sector in Tanzania ................................................... 10
Box 3.1: Loan Officers’ Opinion Survey on Bank Lending Practices and Conditions ........ 16
appenDices
Appendix 1: Global Economic Performance (Real Growth Rates) ........................................... 33
Appendix 2: Annual GDP Performance by Economic Activity - Tanzania Mainland ............. 34
Appendix 3: Annual GDP Performance by Economic Activity – Zanzibar ............................. 35
Appendix 4: Selected macroeconomic indicators ..................................................................... 36
Appendix 5: Growth rate of commercial bank lending by sector ............................................ 37
Appendix 6: National Debt Developments .............................................................................. 38
Appendix 7: Non Performing Loans by Sector ....................................................................... 39
Appendix 8: Financial Soundness Indicators of the EAC Banking Systems .......................... 40
Appendix 9: Quarterly performance of DSE ........................................................................... 41
Appendix 10: Tanzania Mainland: Trend of Social Security Investment Portfolio ................... 42
Financial Stability Report - September 2015
iv
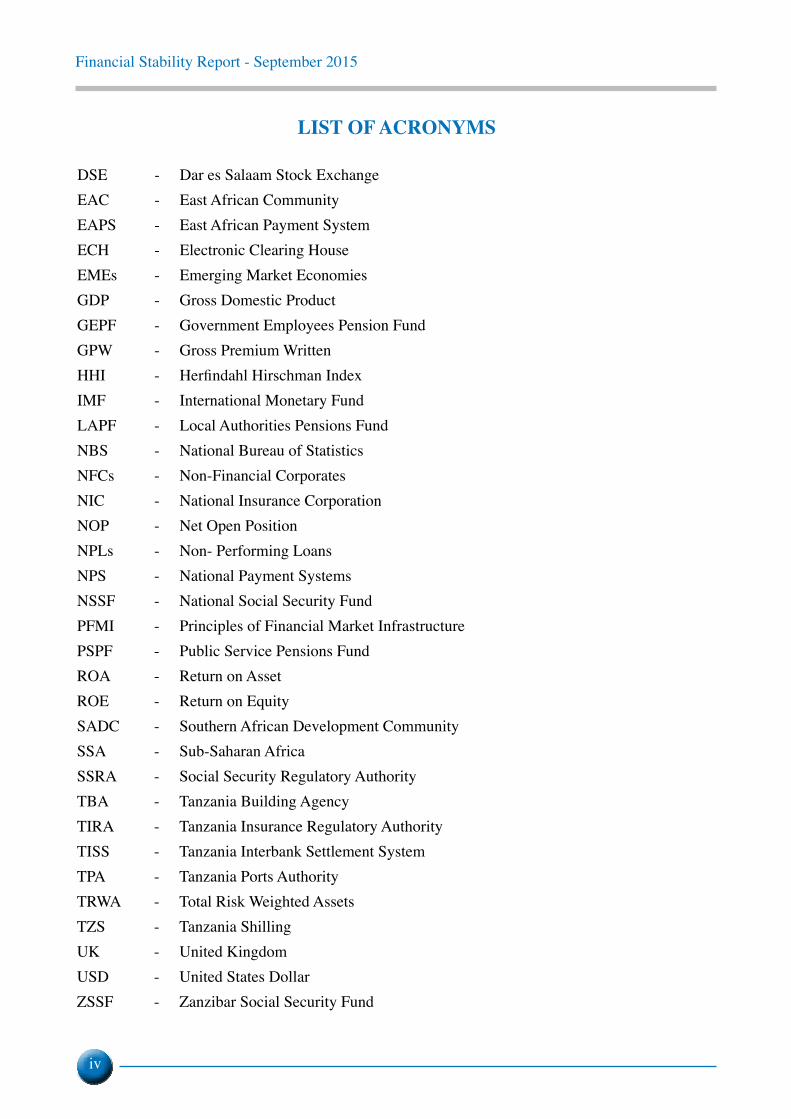
list of acronyMs
DSE - Dar es Salaam Stock ExchangeEAC - East African CommunityEAPS - East African Payment SystemECH - Electronic Clearing HouseEMEs - Emerging Market EconomiesGDP - Gross Domestic ProductGEPF - Government Employees Pension FundGPW - Gross Premium WrittenHHI - Herfindahl Hirschman IndexIMF - International Monetary FundLAPF - Local Authorities Pensions FundNBS - National Bureau of Statistics NFCs - Non-Financial CorporatesNIC - National Insurance CorporationNOP - Net Open PositionNPLs - Non- Performing LoansNPS - National Payment SystemsNSSF - National Social Security Fund PFMI - Principles of Financial Market InfrastructurePSPF - Public Service Pensions FundROA - Return on AssetROE - Return on EquitySADC - Southern African Development CommunitySSA - Sub-Saharan AfricaSSRA - Social Security Regulatory Authority TBA - Tanzania Building AgencyTIRA - Tanzania Insurance Regulatory AuthorityTISS - Tanzania Interbank Settlement SystemTPA - Tanzania Ports Authority TRWA - Total Risk Weighted AssetsTZS - Tanzania ShillingUK - United KingdomUSD - United States DollarZSSF - Zanzibar Social Security Fund
Financial Stability Report - September 2015
v
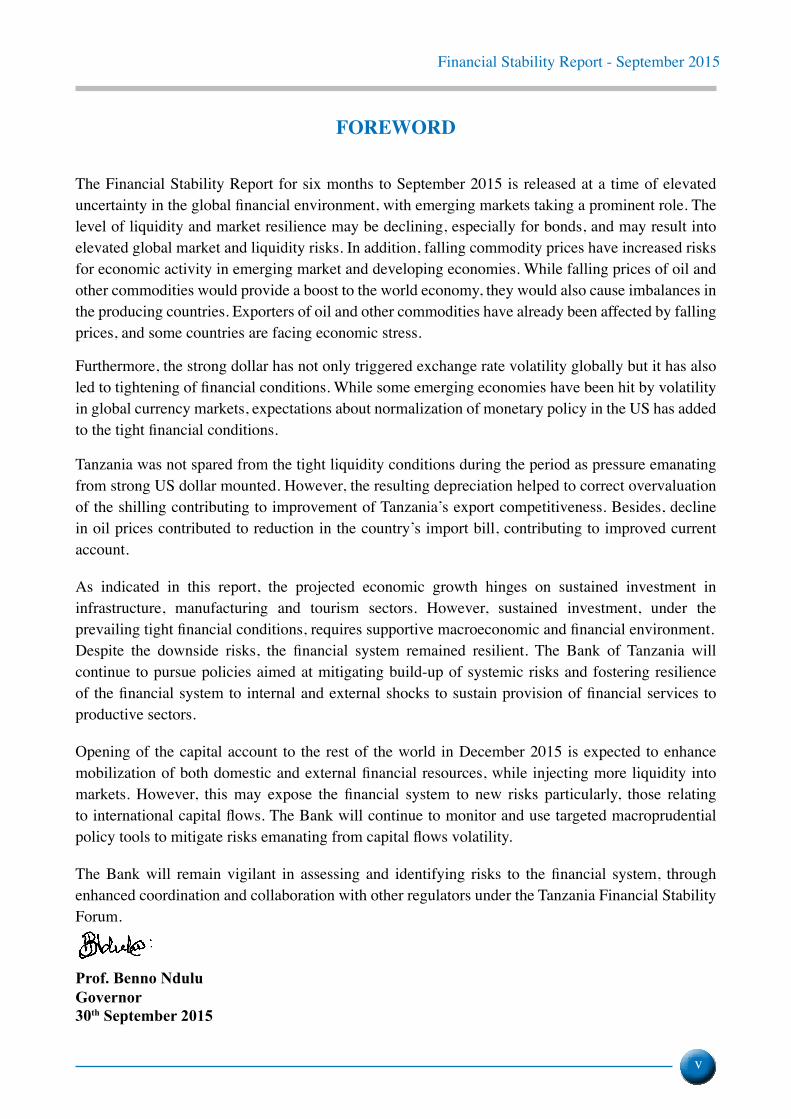
foreWorD
The Financial Stability Report for six months to September 2015 is released at a time of elevated uncertainty in the global financial environment, with emerging markets taking a prominent role. The level of liquidity and market resilience may be declining, especially for bonds, and may result into elevated global market and liquidity risks. In addition, falling commodity prices have increased risks for economic activity in emerging market and developing economies. While falling prices of oil and other commodities would provide a boost to the world economy, they would also cause imbalances in the producing countries. Exporters of oil and other commodities have already been affected by falling prices, and some countries are facing economic stress.
Furthermore, the strong dollar has not only triggered exchange rate volatility globally but it has also led to tightening of financial conditions. While some emerging economies have been hit by volatility in global currency markets, expectations about normalization of monetary policy in the US has added to the tight financial conditions.
Tanzania was not spared from the tight liquidity conditions during the period as pressure emanating from strong US dollar mounted. However, the resulting depreciation helped to correct overvaluation of the shilling contributing to improvement of Tanzania’s export competitiveness. Besides, decline in oil prices contributed to reduction in the country’s import bill, contributing to improved current account.
As indicated in this report, the projected economic growth hinges on sustained investment in infrastructure, manufacturing and tourism sectors. However, sustained investment, under the prevailing tight financial conditions, requires supportive macroeconomic and financial environment. Despite the downside risks, the financial system remained resilient. The Bank of Tanzania will continue to pursue policies aimed at mitigating build-up of systemic risks and fostering resilience of the financial system to internal and external shocks to sustain provision of financial services to productive sectors.
Opening of the capital account to the rest of the world in December 2015 is expected to enhance mobilization of both domestic and external financial resources, while injecting more liquidity into markets. However, this may expose the financial system to new risks particularly, those relating to international capital flows. The Bank will continue to monitor and use targeted macroprudential policy tools to mitigate risks emanating from capital flows volatility.
The Bank will remain vigilant in assessing and identifying risks to the financial system, through enhanced coordination and collaboration with other regulators under the Tanzania Financial Stability Forum.
Prof. Benno NduluGovernor30th September 2015
Financial Stability Report - September 2015
vi
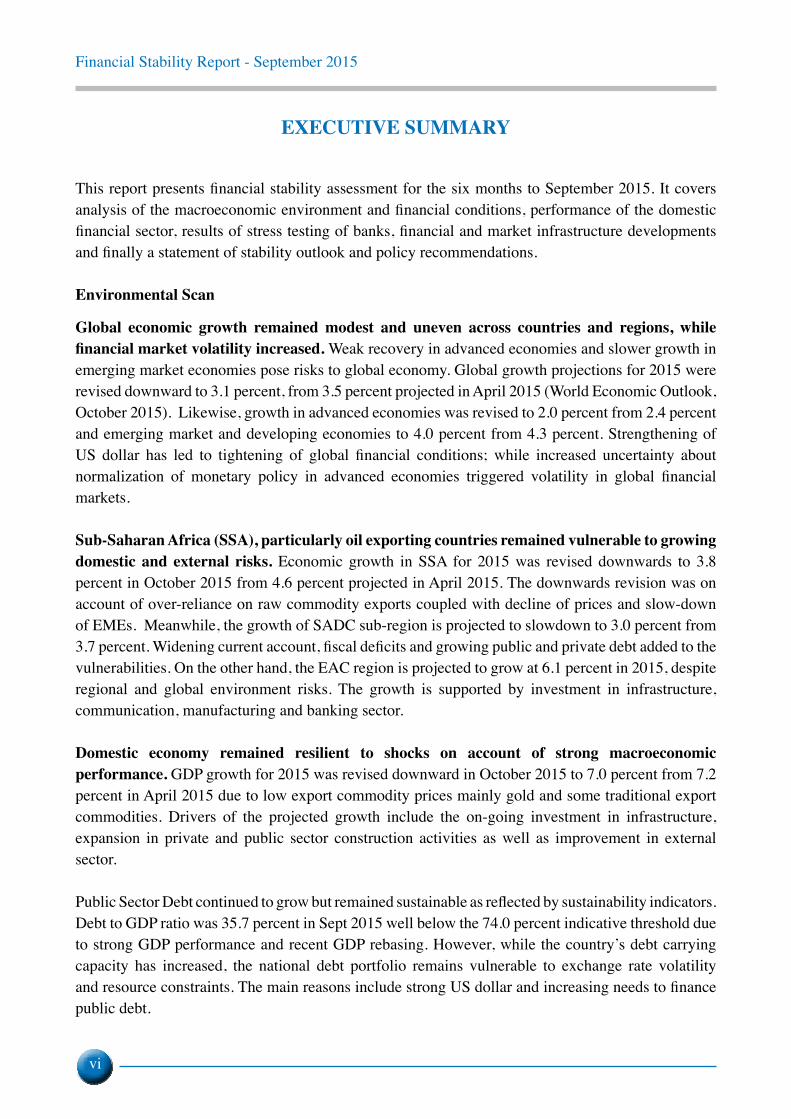
eXecUtiVe sUMMary
This report presents financial stability assessment for the six months to September 2015. It covers analysis of the macroeconomic environment and financial conditions, performance of the domestic financial sector, results of stress testing of banks, financial and market infrastructure developments and finally a statement of stability outlook and policy recommendations.
environmental scan
Global economic growth remained modest and uneven across countries and regions, while financial market volatility increased. Weak recovery in advanced economies and slower growth in emerging market economies pose risks to global economy. Global growth projections for 2015 were revised downward to 3.1 percent, from 3.5 percent projected in April 2015 (World Economic Outlook, October 2015). Likewise, growth in advanced economies was revised to 2.0 percent from 2.4 percent and emerging market and developing economies to 4.0 percent from 4.3 percent. Strengthening of US dollar has led to tightening of global financial conditions; while increased uncertainty about normalization of monetary policy in advanced economies triggered volatility in global financial markets.
Sub-Saharan Africa (SSA), particularly oil exporting countries remained vulnerable to growing domestic and external risks. Economic growth in SSA for 2015 was revised downwards to 3.8 percent in October 2015 from 4.6 percent projected in April 2015. The downwards revision was on account of over-reliance on raw commodity exports coupled with decline of prices and slow-down of EMEs. Meanwhile, the growth of SADC sub-region is projected to slowdown to 3.0 percent from 3.7 percent. Widening current account, fiscal deficits and growing public and private debt added to the vulnerabilities. On the other hand, the EAC region is projected to grow at 6.1 percent in 2015, despite regional and global environment risks. The growth is supported by investment in infrastructure, communication, manufacturing and banking sector.
Domestic economy remained resilient to shocks on account of strong macroeconomic performance. GDP growth for 2015 was revised downward in October 2015 to 7.0 percent from 7.2 percent in April 2015 due to low export commodity prices mainly gold and some traditional export commodities. Drivers of the projected growth include the on-going investment in infrastructure, expansion in private and public sector construction activities as well as improvement in external sector.
Public Sector Debt continued to grow but remained sustainable as reflected by sustainability indicators. Debt to GDP ratio was 35.7 percent in Sept 2015 well below the 74.0 percent indicative threshold due to strong GDP performance and recent GDP rebasing. However, while the country’s debt carrying capacity has increased, the national debt portfolio remains vulnerable to exchange rate volatility and resource constraints. The main reasons include strong US dollar and increasing needs to finance public debt.
Financial Stability Report - September 2015
vii
Corporate sector reduced offshore borrowing as the US dollar strengthened, commodity prices declined and expectations of tighter global financial conditions. Household debt edged upwards on account of increased access to credit and growing housing mortgage loans. However, household debt servicing cost as a proportion of gross income remained broadly unchanged at around 19.0 percent.
financial sector performance
Banking sector continued to grow in terms of deposits and assets, supported by favourable macroeconomic environment, and remained resilient to internal and external shocks. Total assets grew by 12.4 percent during the year to September 2015, while deposits grew by 6.7 percent. The sector was adequately capitalized, with ratio of core capital to total risk weighted assets of 16.7 percent well above the regulatory requirement of 12.5 percent. The credit portfolio was fairly diversified as measured by ratio of aggregate large exposures to core capital of 126.8 percent in September 2015 from 137.0 percent recorded in March 2015. The levels were within the regulatory limit of 800.0 percent. Stress testing results revealed that, in aggregate terms, the sector was resilient to interest, credit and exchange rate shocks.
Financial markets experienced tight liquidity conditions owing to strengthening of the US dollar and policy actions to mitigate exchange rate volatility. The Shilling depreciated by 20.6 percent to TZS/USD 2,135.4 in September 2015 from TZS/USD 1,771.0 in March 2015. As foreign exchange volatility increased, money markets experienced tight liquidity which was accompanied by rising cost of funds, with overnight interbank quarterly weighted average rate in September 2015 doubled to 14.3 percent from March 2015. On the other hand, capital markets experienced slowdown as reflected by a decline in total market capitalization by 1.8 percent to TZS 22,166.4 billion on account of depreciation of share prices of some domestic and cross listed companies.
Insurance sector recorded growth in terms of assets and premiums with favourable financial soundness indicators. Total assets grew by 11.8 percent mainly driven by investment in bank deposits and government securities. Gross premium underwritten increased by 12.6 percent with general insurance contributing most of the growth. Liquidity risk improved on account of capital enhancement and improvement in collection of receivables for general insurance. General and Life insurers’ liquidity ratios increased to 106.7 percent and 57.4 percent in June 2015, respectively from 63.2 percent and 43.5 percent in that order recorded in December, 2014. The sector was adequately capitalized at end June 2015 as measured by solvency ratios of both General Insurance and Life Assurance of 63.0 percent and 28.8 percent, respectively, above the minimum requirement of 25.0 percent and 8.0 percent in that order. The sector continued to operate profitably as reflected by growth in return on investment at 6.7 percent and 3.2 percent for general and life insurers, respectively, during the year to June 2015 from 4.0 percent and 2.6 percent in that order.
Social security sector recorded growth in terms of contributions and assets, amid declining Return on Assets. The sector complied with the 2015 Investment Guidelines except for lending to Government which was above the 10.0 percent threshold. Government strategy to fund the liabilities through issuance of non- cash bond will reduce the non-compliance. Return on Assets declined to 2.3 percent in September 2015 from 3.4 percent in March 2015 on account of increase in administrative expenses.
Financial Stability Report - September 2015
viii
Financial and Market Infrastructure
During the six months to September 2015, regulatory oversight was enhanced by enacting new statutes, issuing new regulations, rules and guidelines. These include:
• The Banking and Financial Institutions (Mortgage Finance) Regulations, (2015) to promote sustainable mortgage financing industry and The Foreign Exchange (Bureau de Change) Regulations, (2015) to strengthen monitoring of foreign exchange market.
• The Commodity Exchange Act, 2015 to promote and facilitate development of an orderly, fair and efficient market for commodities and foster price discovery.
• The Social Security Schemes (Investment guidelines), 2015 as revised in September 2015 to broaden the scope of investment and provide improvement in risk management.
• The National Payment Systems Act, 2015 to provide a legal basis for regulatory and supervisory oversight.
Financial Stability Outlook and Policy Recommendations
Tanzania’s financial system is expected to remain resilient in the next six months in light of positive macroeconomic outlook and improvement in regulatory oversight. However, the system is vulnerable to increased downside risks arising from unfolding global macroeconomic and financial environment. It is recommended to address the remaining challenges to financial stability as follows:
• To implement countercyclical fiscal policy with a view to sustaining investment in infrastructure and human capital development while monetary policy focuses at maintaining macroeconomic stability through mitigating exchange rate volatility and inflationary pressures.
• To focus on regional integration as a strategy to diversify export markets while increasing value addition in export products in view of projected decline in import demand in EMEs and continued fall in commodity prices.
• To enhance focus on cross-border risks to financial stability in Tanzania through strengthening and broadening of regulatory and supervisory oversight both internally and across borders in light of the growing interconnectedness among banks and other financial institutions and opening up of capital markets in the SSA region.
• To promote development of domestic debt and equity markets as the global environment transits from cheap funding to more expensive source. This entails deepening and broadening of the domestic capital markets though expanding securitization to foster issuance of appropriate securities such as infrastructure bonds and other instruments to attract institutional and other investors.
Financial Stability Report - September 2015
1
1.0 MACRO-ECONOMIC AND FINANCIAL ENVIRONMENT
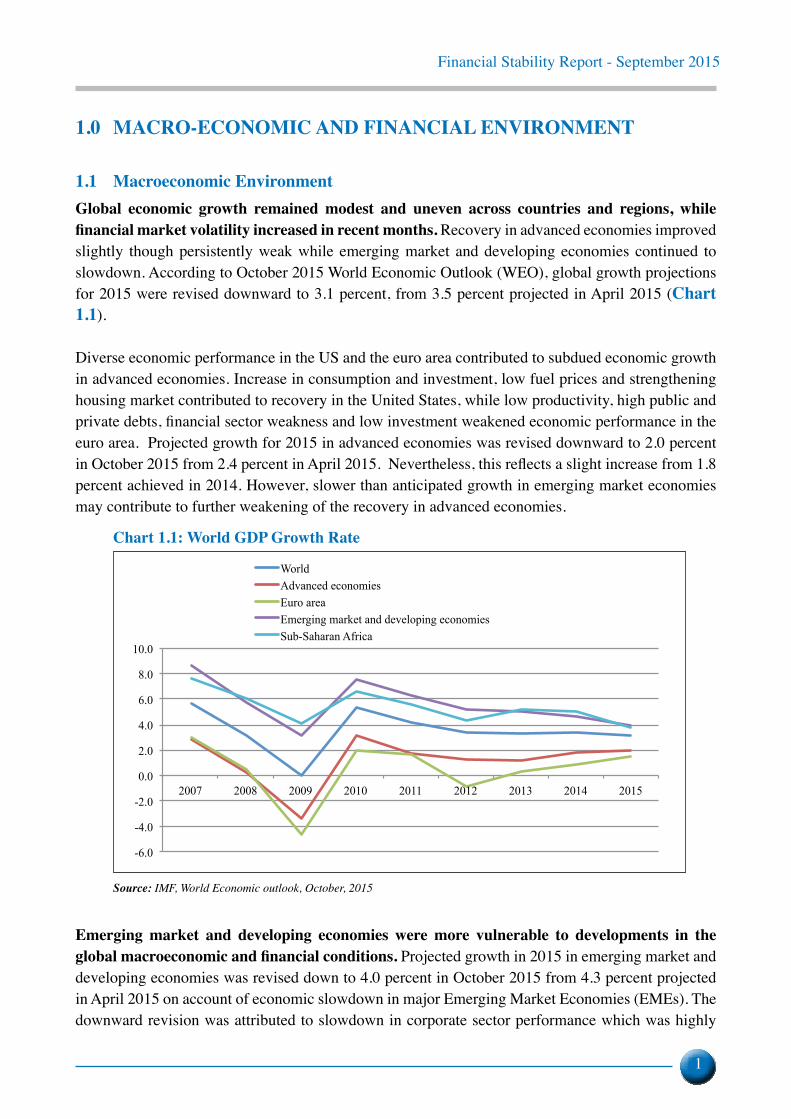
1.1 Macroeconomic EnvironmentGlobal economic growth remained modest and uneven across countries and regions, while financial market volatility increased in recent months. Recovery in advanced economies improved slightly though persistently weak while emerging market and developing economies continued to slowdown. According to October 2015 World Economic Outlook (WEO), global growth projections for 2015 were revised downward to 3.1 percent, from 3.5 percent projected in April 2015 (chart 1.1).
Diverse economic performance in the US and the euro area contributed to subdued economic growth in advanced economies. Increase in consumption and investment, low fuel prices and strengthening housing market contributed to recovery in the United States, while low productivity, high public and private debts, financial sector weakness and low investment weakened economic performance in the euro area. Projected growth for 2015 in advanced economies was revised downward to 2.0 percent in October 2015 from 2.4 percent in April 2015. Nevertheless, this reflects a slight increase from 1.8 percent achieved in 2014. However, slower than anticipated growth in emerging market economies may contribute to further weakening of the recovery in advanced economies.
Chart 1.1: World GDP Growth Rate
-6.0
-4.0
-2.0
0.0
2.0
4.0
6.0
8.0
10.0
2007 2008 2009 2010 2011 2012 2013 2014 2015
World Advanced economies Euro area Emerging market and developing economies Sub-Saharan Africa
Source: IMF, World Economic outlook, October, 2015
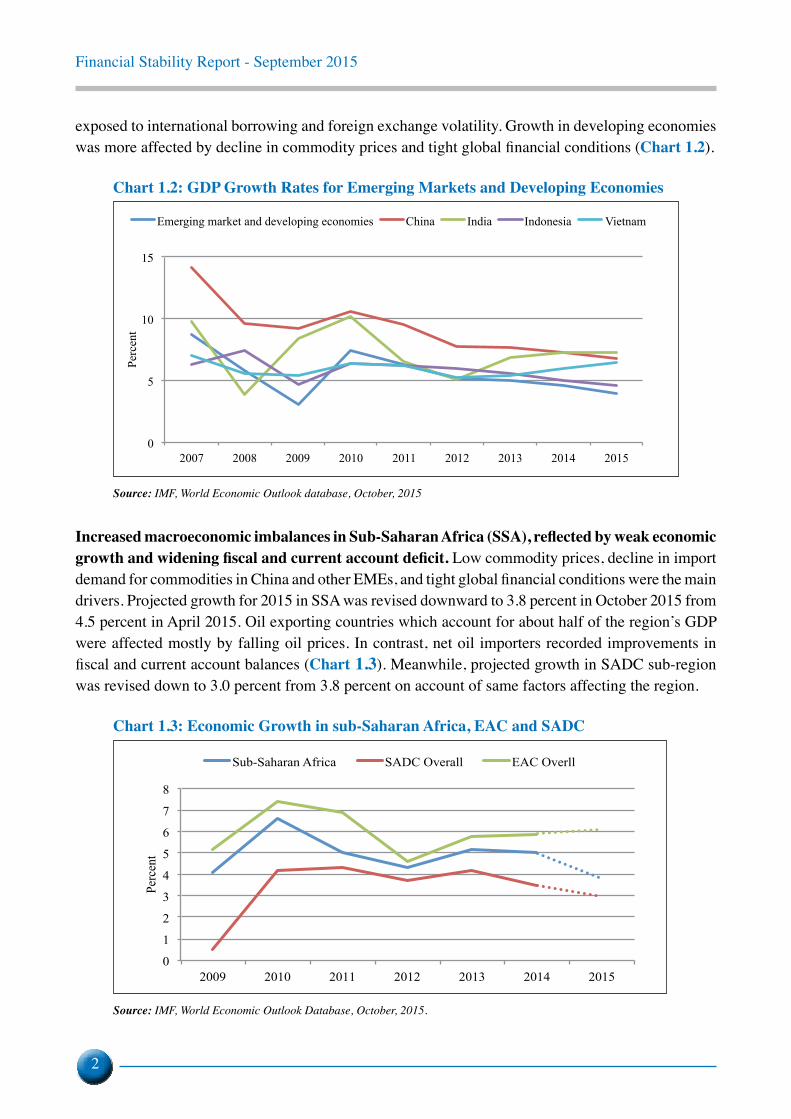
Emerging market and developing economies were more vulnerable to developments in the global macroeconomic and financial conditions. Projected growth in 2015 in emerging market and developing economies was revised down to 4.0 percent in October 2015 from 4.3 percent projected in April 2015 on account of economic slowdown in major Emerging Market Economies (EMEs). The downward revision was attributed to slowdown in corporate sector performance which was highly
Financial Stability Report - September 2015
2
exposed to international borrowing and foreign exchange volatility. Growth in developing economies was more affected by decline in commodity prices and tight global financial conditions (Chart 1.2).
Chart 1.2: GDP Growth Rates for Emerging Markets and Developing Economies
0
5
10
15
2007 2008 2009 2010 2011 2012 2013 2014 2015
Perc
ent
Emerging market and developing economies China India Indonesia Vietnam
Source: IMF, World Economic Outlook database, October, 2015
Increased macroeconomic imbalances in Sub-Saharan Africa (SSA), reflected by weak economic growth and widening fiscal and current account deficit. Low commodity prices, decline in import demand for commodities in China and other EMEs, and tight global financial conditions were the main drivers. Projected growth for 2015 in SSA was revised downward to 3.8 percent in October 2015 from 4.5 percent in April 2015. Oil exporting countries which account for about half of the region’s GDP were affected mostly by falling oil prices. In contrast, net oil importers recorded improvements in fiscal and current account balances (chart 1.3). Meanwhile, projected growth in SADC sub-region was revised down to 3.0 percent from 3.8 percent on account of same factors affecting the region.
Chart 1.3: Economic Growth in sub-Saharan Africa, EAC and SADC
0
1
2
3
4
5
6
7
8
2009 2010 2011 2012 2013 2014 2015
Perc
ent
Sub-Saharan Africa SADC Overall EAC Overll
Source: IMF, World Economic Outlook Database, October, 2015.
Financial Stability Report - September 2015
3
Economic performance in the EAC remained above SSA average. Economic growth in the EAC was driven by investments in natural resources and infrastructure. GDP growth projection for 2015 was revised downwards to 6.1 percent in October 2015 from 6.6 percent in April 2015 on account of the same factors affecting the region. Nevertheless, the revision reflects acceleration from 5.9 percent in 2014 while SSA average reflects deceleration to 3.8 percent from 5.0 percent in 2014. Being net importers of oil, the EAC continues to benefit from low oil prices thus contributing to improvement in current account and fiscal balances.
1.2 Financial ConditionsRisks to global financial conditions increased with diverse trends across countries and regions. Improved macroeconomic prospects in the US point to early normalization of monetary policy while persistent low growth in the euro area led to prolonged monetary policy accommodation. On other hand, greater exposure of emerging market economies to global financial markets impacted the corporate sector negatively through capital flows and exchange rate volatility.
financial conditions in sub-saharan africa tightened owing to strong Us dollar and its spillover effects. Financial market volatility coupled with sharp depreciation of local currencies against US dollar kept currencies under pressure, and increased the private and public external debt burden. Monetary policy actions to mitigate exchange rate volatility further tightened the conditions. The region remained vulnerable to growing domestic and external risks arising from continued decline in commodity prices; widening fiscal deficit and growing public and private debts.
The EAC sub-region was not spared from the impact of the strong dollar and its spillover effects. Monetary policy interventions to protect local currencies varied across countries with differing results. Countries which applied macro-prudential policy tools experienced gradual but sustained stability, while countries that intervened through running down reserves triggered speculative tendencies that heightened volatility.
1.3 Domestic Macroeconomic Environmenttanzania’s economic growth remained vulnerable to spillover-effects from slowdown in emerging market economies and tight financial conditions. GDP growth for 2015 was revised downward in October 2015 to 7.0 percent from 7.2 percent in April 2015 due to low export commodity prices mainly gold and some traditional export commodities. Despite the downward revision, GDP growth remains strong driven by the on-going investment in infrastructure, expansion in private and public sector construction activities as well as improvement in external sector.
The six-month period average annual inflation to September, 2015 increased to 5.8 percent from 4.8 percent, in the previous six-months to March 2015. Inflation is expected to remain in single digit on account of prudent monetary policy, reliable power supply, and low food and oil prices.
Slowdown in GDP growth and widening current account deficit pose downside risk to Zanzibar’s macroeconomic environment. GDP is projected to slowdown to 6.8 percent in 2015 compared to
Financial Stability Report - September 2015
4
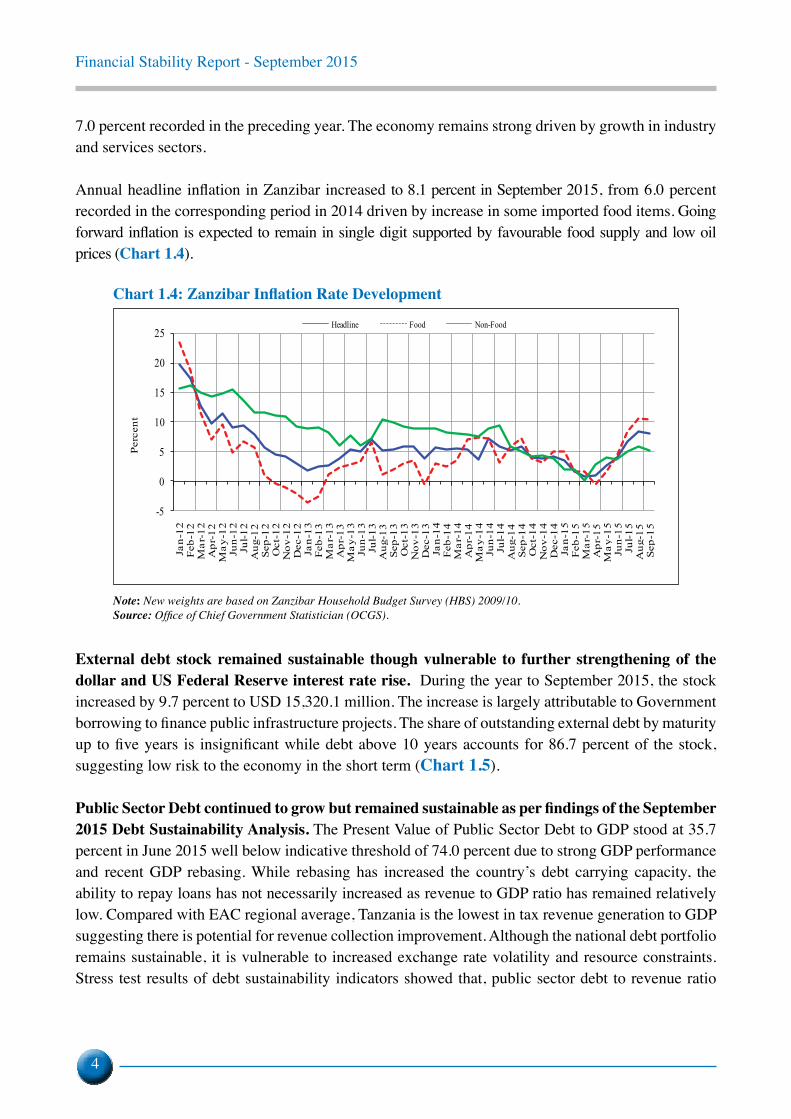
7.0 percent recorded in the preceding year. The economy remains strong driven by growth in industry and services sectors.
Annual headline inflation in Zanzibar increased to 8.1 percent in September 2015, from 6.0 percent recorded in the corresponding period in 2014 driven by increase in some imported food items. Going forward inflation is expected to remain in single digit supported by favourable food supply and low oil prices (Chart 1.4).
Chart 1.4: Zanzibar Inflation Rate Development
-5
0
5
10
15
20
25
Jan-
12Fe
b-12
Mar
-12
Apr
-12
May
-12
Jun -
12Ju
l- 12
Aug
-12
Sep-
12O
ct-1
2N
ov-1
2D
ec-1
2Ja
n -13
Feb-
13M
ar-1
3A
pr-1
3M
ay-1
3Ju
n -13
Jul- 1
3A
ug-1
3Se
p-13
Oct
-13
Nov
-13
Dec
-13
Jan-
14Fe
b-14
Mar
-14
Apr
-14
May
-14
Jun-
14Ju
l-14
Aug
-14
Sep-
14O
ct- 1
4N
ov-1
4D
ec-1
4Ja
n -15
Feb-
15M
ar-1
5A
pr-1
5M
ay-1
5Ju
n-15
Jul- 1
5A
ug-1
5Se
p-15
Perc
ent
Headline Food Non-Food
Note: New weights are based on Zanzibar Household Budget Survey (HBS) 2009/10.Source: Office of Chief Government Statistician (OCGS).
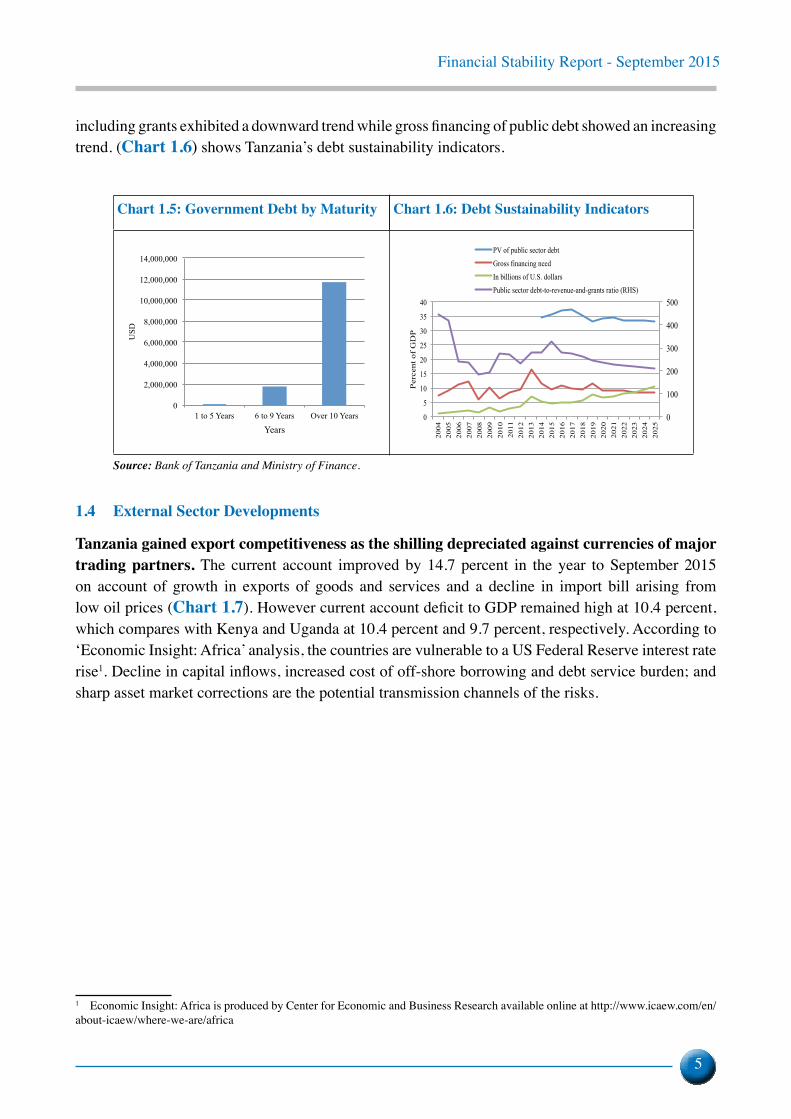
External debt stock remained sustainable though vulnerable to further strengthening of the dollar and US Federal Reserve interest rate rise. During the year to September 2015, the stock increased by 9.7 percent to USD 15,320.1 million. The increase is largely attributable to Government borrowing to finance public infrastructure projects. The share of outstanding external debt by maturity up to five years is insignificant while debt above 10 years accounts for 86.7 percent of the stock, suggesting low risk to the economy in the short term (Chart 1.5).
Public Sector Debt continued to grow but remained sustainable as per findings of the September 2015 Debt Sustainability Analysis. The Present Value of Public Sector Debt to GDP stood at 35.7 percent in June 2015 well below indicative threshold of 74.0 percent due to strong GDP performance and recent GDP rebasing. While rebasing has increased the country’s debt carrying capacity, the ability to repay loans has not necessarily increased as revenue to GDP ratio has remained relatively low. Compared with EAC regional average, Tanzania is the lowest in tax revenue generation to GDP suggesting there is potential for revenue collection improvement. Although the national debt portfolio remains sustainable, it is vulnerable to increased exchange rate volatility and resource constraints. Stress test results of debt sustainability indicators showed that, public sector debt to revenue ratio
Financial Stability Report - September 2015
5
including grants exhibited a downward trend while gross financing of public debt showed an increasing trend. (Chart 1.6) shows Tanzania’s debt sustainability indicators.
Chart 1.5: Government Debt by Maturity Chart 1.6: Debt Sustainability Indicators
0
2,000,000
4,000,000
6,000,000
8,000,000
10,000,000
12,000,000
14,000,000
1 to 5 Years 6 to 9 Years Over 10 Years
USD
Years
0
100
200
300
400
500
0
5
10
15
20
25
30
35
40
2004
20
05
2006
20
07
2008
20
09
2010
20
11
2012
20
13
2014
20
15
2016
20
17
2018
20
19
2020
20
21
2022
20
23
2024
20
25
Perc
ent o
f GD
P
PV of public sector debt Gross financing need In billions of U.S. dollars Public sector debt-to-revenue-and-grants ratio (RHS)
Source: Bank of Tanzania and Ministry of Finance.
1.4 External Sector Developments
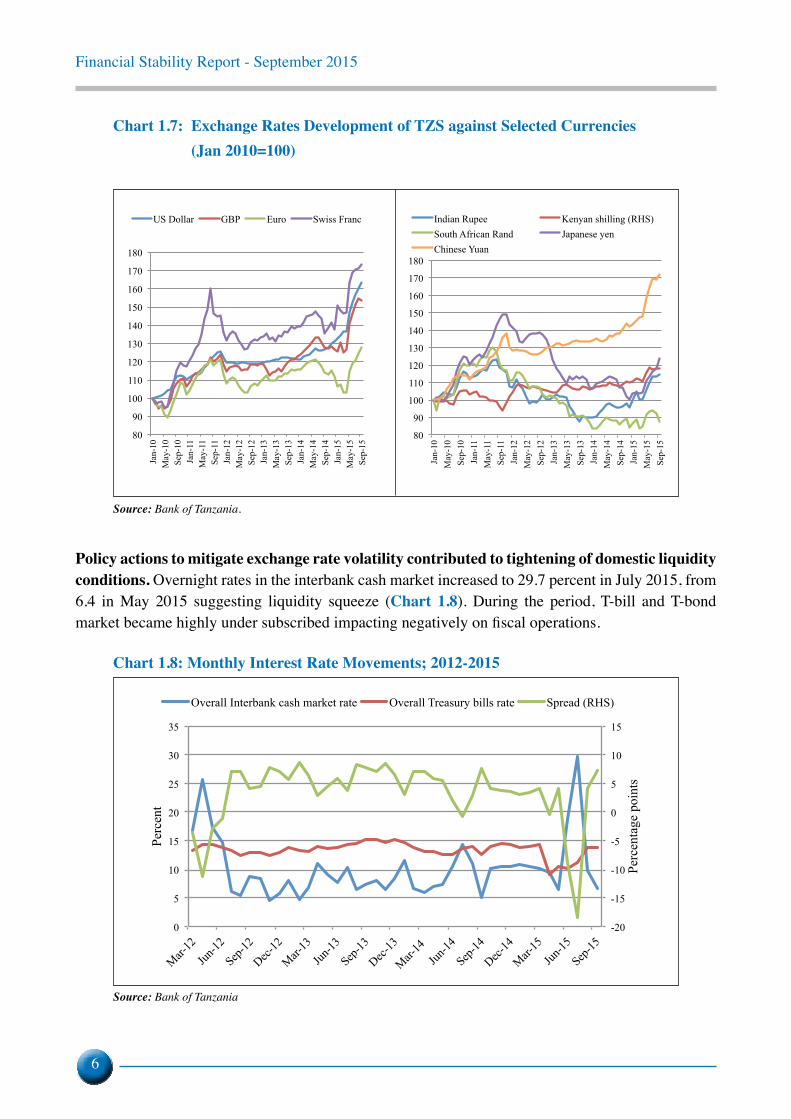
Tanzania gained export competitiveness as the shilling depreciated against currencies of major trading partners. The current account improved by 14.7 percent in the year to September 2015 on account of growth in exports of goods and services and a decline in import bill arising from low oil prices (Chart 1.7). However current account deficit to GDP remained high at 10.4 percent, which compares with Kenya and Uganda at 10.4 percent and 9.7 percent, respectively. According to ‘Economic Insight: Africa’ analysis, the countries are vulnerable to a US Federal Reserve interest rate rise1. Decline in capital inflows, increased cost of off-shore borrowing and debt service burden; and sharp asset market corrections are the potential transmission channels of the risks.
1 Economic Insight: Africa is produced by Center for Economic and Business Research available online at http://www.icaew.com/en/about-icaew/where-we-are/africa
0
2,000,000
4,000,000
6,000,000
8,000,000
10,000,000
12,000,000
14,000,000
1 to 5 Years 6 to 9 Years Over 10 Years
US
D
Years
0
100
200
300
400
500
0
5
10
15
20
25
30
35
40
2004
20
05
2006
20
07
2008
20
09
2010
20
11
2012
20
13
2014
20
15
2016
20
17
2018
20
19
2020
20
21
2022
20
23
2024
20
25
Per
cent
of
GD
P
PV of public sector debt Gross financing need In billions of U.S. dollars Public sector debt-to-revenue-and-grants ratio (RHS)
Financial Stability Report - September 2015
6
Chart 1.7: Exchange Rates Development of TZS against Selected Currencies (Jan 2010=100)
Source: Bank of Tanzania.
Policy actions to mitigate exchange rate volatility contributed to tightening of domestic liquidity conditions. Overnight rates in the interbank cash market increased to 29.7 percent in July 2015, from 6.4 in May 2015 suggesting liquidity squeeze (Chart 1.8). During the period, T-bill and T-bond market became highly under subscribed impacting negatively on fiscal operations.
Chart 1.8: Monthly Interest Rate Movements; 2012-2015
-20
-15
-10
-5
0
5
10
15
0
5
10
15
20
25
30
35
Mar-12
Jun-12
Sep-12
Dec-12
Mar-13
Jun-13
Sep-13
Dec-13
Mar-14
Jun-14
Sep-14
Dec-14
Mar-15
Jun-15
Sep-15
Perc
enta
ge p
oint
s
Perc
ent
Overall Interbank cash market rate Overall Treasury bills rate Spread (RHS)
Source: Bank of Tanzania
80
90
100
110
120
130
140
150
160
170
180
Jan-
10
May
-10
Sep-
10
Jan-
11
May
-11
Sep-
11
Jan-
12
May
-12
Sep-
12
Jan-
13
May
-13
Sep-
13
Jan-
14
May
-14
Sep-
14
Jan-
15
May
-15
Sep-
15
Indian Rupee Kenyan shilling (RHS) South African Rand Japanese yen Chinese Yuan
80
90
100
110
120
130
140
150
160
170
180
Jan-
10
May
-10
Sep-
10
Jan-
11
May
-11
Sep-
11
Jan-
12
May
-12
Sep-
12
Jan-
13
May
-13
Sep-
13
Jan-
14
May
-14
Sep-
14
Jan-
15
May
-15
Sep-
15
US Dollar GBP Euro Swiss Franc
Financial Stability Report - September 2015
7
2.0 NON-FINANCIAL CORPORATE AND HOUSEHOLD SECTORS
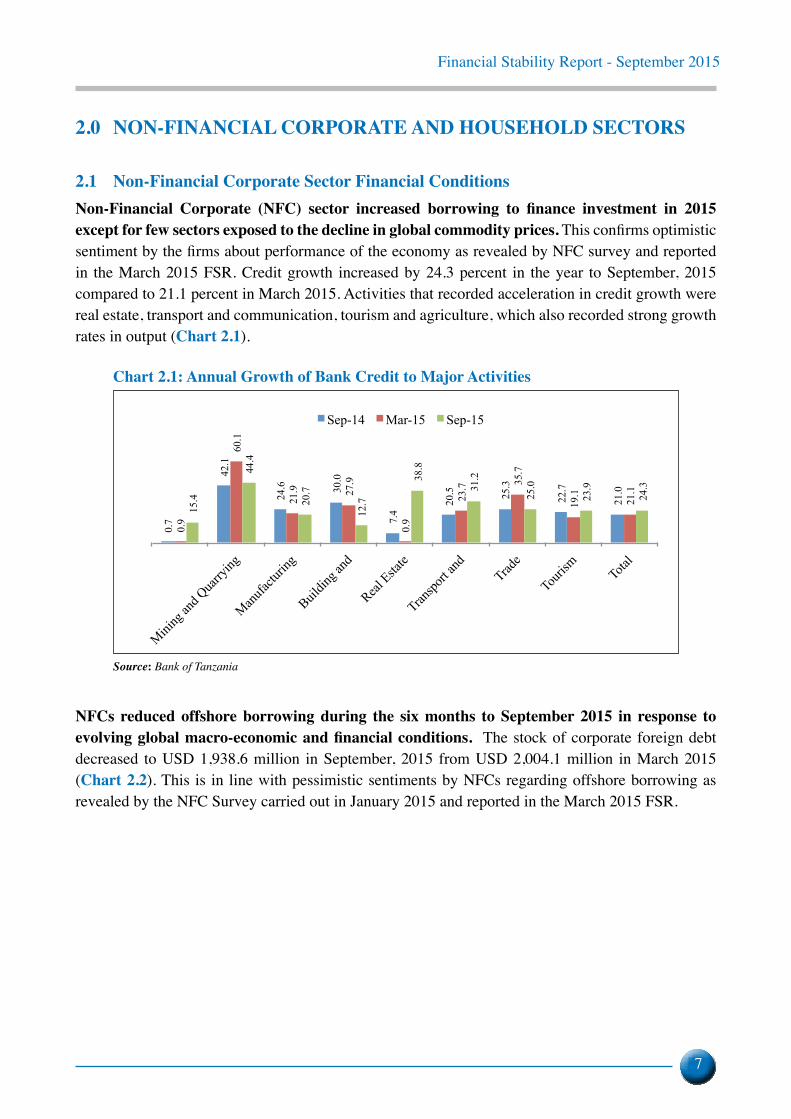
2.1 Non-Financial Corporate Sector Financial ConditionsNon-Financial Corporate (NFC) sector increased borrowing to finance investment in 2015 except for few sectors exposed to the decline in global commodity prices. This confirms optimistic sentiment by the firms about performance of the economy as revealed by NFC survey and reported in the March 2015 FSR. Credit growth increased by 24.3 percent in the year to September, 2015 compared to 21.1 percent in March 2015. Activities that recorded acceleration in credit growth were real estate, transport and communication, tourism and agriculture, which also recorded strong growth rates in output (Chart 2.1).
Chart 2.1: Annual Growth of Bank Credit to Major Activities
0.7
42.1
24.6
30.0
7.4
20.5
25.3
22.7
21.0
0.9
60.1
21.9
27.9
0.9
23.7
35.7
19.1
21.1
15.4
44.4
20.7
12.7
38.8
31.2
25.0
23.9
24.3
Agricu
lture
Mining
and Q
uarry
ing
Manufa
cturin
g
Buildin
g and
Real Esta
te
Transpo
rt and
Trad
e
Touris
m Tota
l
Sep-14 Mar-15 Sep-15
Source: Bank of Tanzania
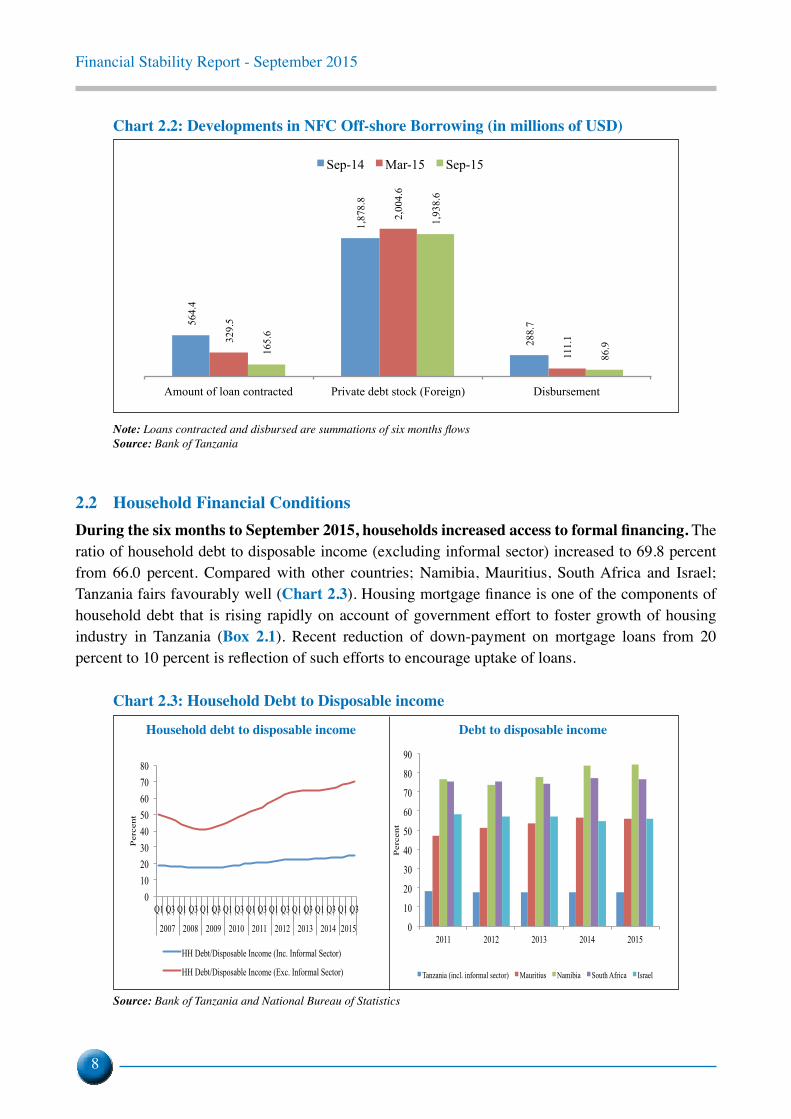
NFCs reduced offshore borrowing during the six months to September 2015 in response to evolving global macro-economic and financial conditions. The stock of corporate foreign debt decreased to USD 1,938.6 million in September, 2015 from USD 2,004.1 million in March 2015 (Chart 2.2). This is in line with pessimistic sentiments by NFCs regarding offshore borrowing as revealed by the NFC Survey carried out in January 2015 and reported in the March 2015 FSR.
Financial Stability Report - September 2015
8
Chart 2.2: Developments in NFC Off-shore Borrowing (in millions of USD)
564.
4
1,87
8.8
288.
7
329.
5
2,00
4.6
111.
1
165.
6
1,93
8.6
86.9
Amount of loan contracted Private debt stock (Foreign) Disbursement
Sep-14 Mar-15 Sep-15
Note: Loans contracted and disbursed are summations of six months flowsSource: Bank of Tanzania
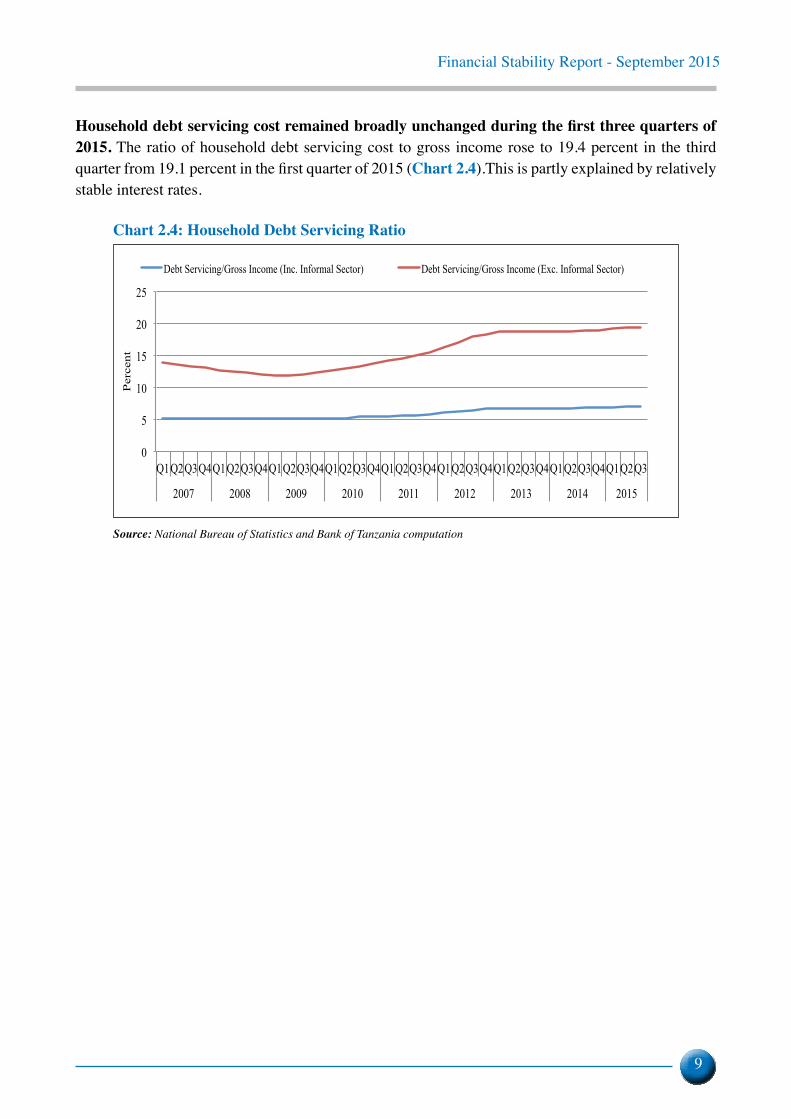
2.2 Household Financial ConditionsDuring the six months to September 2015, households increased access to formal financing. The ratio of household debt to disposable income (excluding informal sector) increased to 69.8 percent from 66.0 percent. Compared with other countries; Namibia, Mauritius, South Africa and Israel; Tanzania fairs favourably well (Chart 2.3). Housing mortgage finance is one of the components of household debt that is rising rapidly on account of government effort to foster growth of housing industry in Tanzania (Box 2.1). Recent reduction of down-payment on mortgage loans from 20 percent to 10 percent is reflection of such efforts to encourage uptake of loans.
Chart 2.3: Household Debt to Disposable income
0 10 20 30 40 50 60 70 80
Q1 Q3 Q1 Q3 Q1 Q3 Q1 Q3 Q1 Q3 Q1 Q3 Q1 Q3 Q1 Q3 Q1 Q3
2007 2008 2009 2010 2011 2012 2013 2014 2015
Per
cent
HH Debt/Disposable Income (Inc. Informal Sector)
HH Debt/Disposable Income (Exc. Informal Sector)
0
10
20
30
40
50
60
70
80
90
2011 2012 2013 2014 2015
Per
cent
Tanzania (incl. informal sector) Mauritius Namibia South Africa Israel
Source: Bank of Tanzania and National Bureau of Statistics
Household debt to disposable income Debt to disposable income
Financial Stability Report - September 2015
9
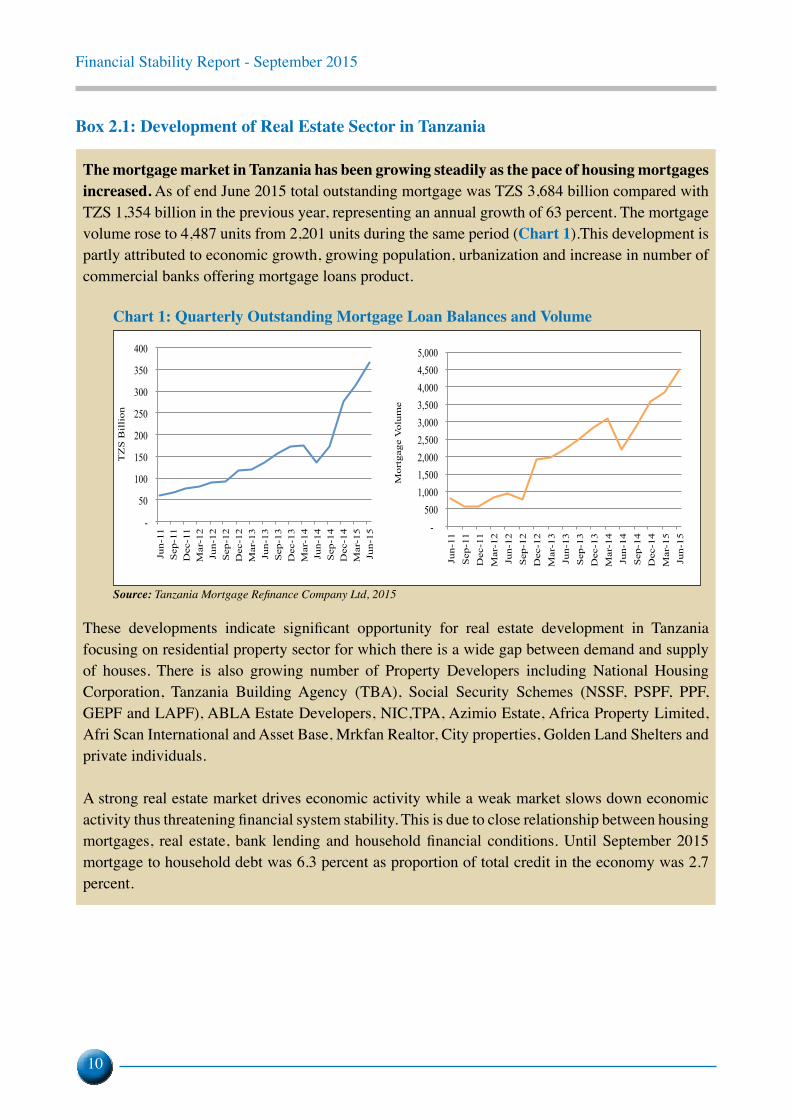
Household debt servicing cost remained broadly unchanged during the first three quarters of 2015. The ratio of household debt servicing cost to gross income rose to 19.4 percent in the third quarter from 19.1 percent in the first quarter of 2015 (Chart 2.4).This is partly explained by relatively stable interest rates.
Chart 2.4: Household Debt Servicing Ratio
0
5
10
15
20
25
Q1 Q2 Q3 Q4 Q1 Q2 Q3 Q4 Q1 Q2 Q3 Q4 Q1 Q2 Q3 Q4 Q1 Q2 Q3 Q4 Q1 Q2 Q3 Q4 Q1 Q2 Q3 Q4 Q1 Q2 Q3 Q4 Q1 Q2 Q3
2007 2008 2009 2010 2011 2012 2013 2014 2015
Per
cent
Debt Servicing/Gross Income (Inc. Informal Sector) Debt Servicing/Gross Income (Exc. Informal Sector)
Source: National Bureau of Statistics and Bank of Tanzania computation
Financial Stability Report - September 2015
10
Box 2.1: Development of Real Estate Sector in Tanzania
The mortgage market in Tanzania has been growing steadily as the pace of housing mortgages increased. As of end June 2015 total outstanding mortgage was TZS 3,684 billion compared with TZS 1,354 billion in the previous year, representing an annual growth of 63 percent. The mortgage volume rose to 4,487 units from 2,201 units during the same period (chart 1).This development is partly attributed to economic growth, growing population, urbanization and increase in number of commercial banks offering mortgage loans product.
Chart 1: Quarterly Outstanding Mortgage Loan Balances and Volume
-
50
100
150
200
250
300
350
400
Jun-
11
Sep
-11
Dec
-11
Mar
-12
Jun-
12
Sep
-12
Dec
-12
Mar
-13
Jun-
13
Sep
-13
Dec
-13
Mar
-14
Jun-
14
Sep
-14
Dec
-14
Mar
-15
Jun-
15
TZ
S B
illi
on
- 500
1,000 1,500 2,000 2,500 3,000 3,500 4,000 4,500 5,000
Jun-
11
Sep
-11
Dec
-11
Mar
-12
Jun-
12
Sep
-12
Dec
-12
Mar
-13
Jun-
13
Sep
-13
Dec
-13
Mar
-14
Jun-
14
Sep
-14
Dec
-14
Mar
-15
Jun-
15
Mor
tgag
e V
olum
e
Source: Tanzania Mortgage Refinance Company Ltd, 2015
These developments indicate significant opportunity for real estate development in Tanzania focusing on residential property sector for which there is a wide gap between demand and supply of houses. There is also growing number of Property Developers including National Housing Corporation, Tanzania Building Agency (TBA), Social Security Schemes (NSSF, PSPF, PPF, GEPF and LAPF), ABLA Estate Developers, NIC,TPA, Azimio Estate, Africa Property Limited, Afri Scan International and Asset Base, Mrkfan Realtor, City properties, Golden Land Shelters and private individuals.
A strong real estate market drives economic activity while a weak market slows down economic activity thus threatening financial system stability. This is due to close relationship between housing mortgages, real estate, bank lending and household financial conditions. Until September 2015 mortgage to household debt was 6.3 percent as proportion of total credit in the economy was 2.7 percent.
Financial Stability Report - September 2015
11
3.0 PERFORMANCE OF THE FINANCIAL SECTORThe financial sector continued to deepen as measured by proportion of financial sector assets to GDP. The ratio increased to 43.3 percent in September 2015 from 40.0 percent recorded in March 2015. The banking sector continued to dominate the financial system accounting for 70.8 percent of total assets as at end September 2015, compared to 71.0 percent in March this year. Pension funds and insurance companies on the other hand, accounted for 26.7 percent and 1.9 percent respectively, while collective investment schemes accounted for 0.6 percent.
3.1 Banking Sector During the six months to September 2015, the banking sector continued to grow in terms of assets, supported by favourable macro-economic environment. Total assets grew by 12.4 percent to TZS 26,352.1 billion. The growth of assets was mainly attributable to increase in deposits, which increased by 6.7 percent to TZS 19,081.7 billion at end September 2015. Deposits is the major source of funding in the banking sector, comprising 72.4 percent of total asset. The growth in deposits mobilisation was driven by introduction of new financial products and leveraging of technological innovations.
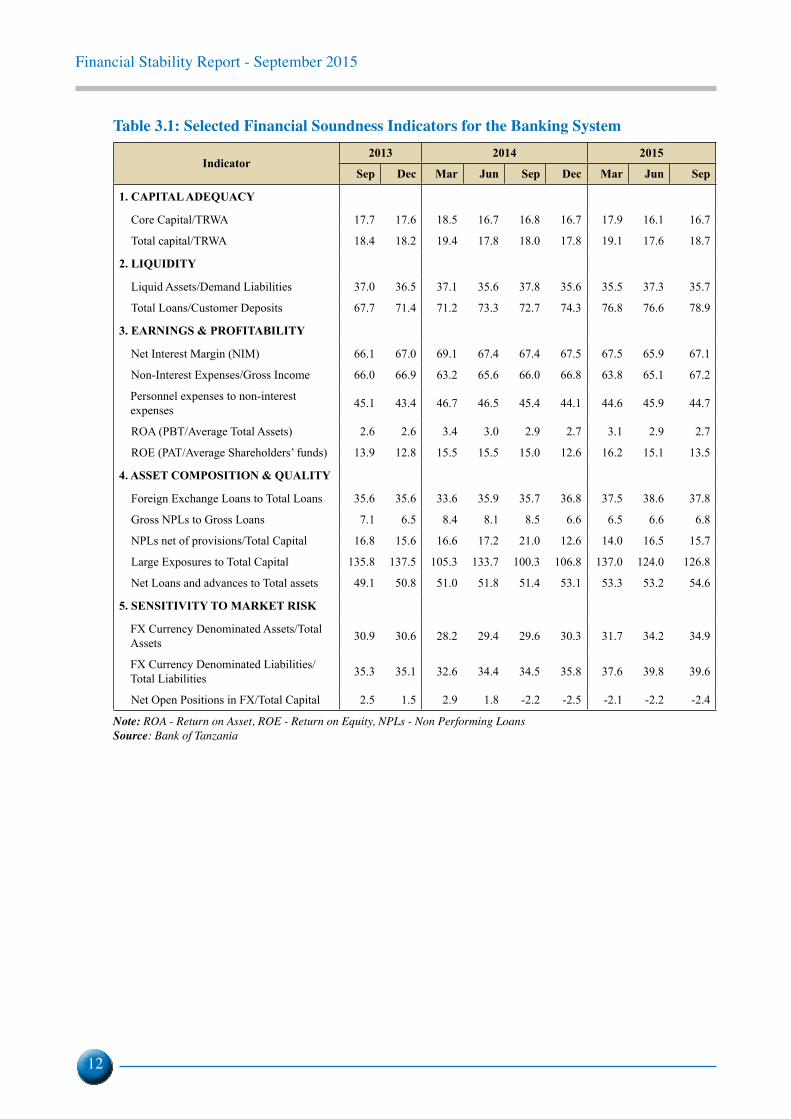
The condition of the banking sector was assessed using selected Financial Soundness Indicators (FSIs), concentration and diversification measures. During the period, the sector remained sound as reflected by levels of capital, liquidity, profitability and asset quality (Table 3.1).
Financial Stability Report - September 2015
12
Table 3.1: Selected Financial Soundness Indicators for the Banking System
Indicator2013 2014 2015
Sep Dec Mar Jun Sep Dec Mar Jun Sep
1. CAPITAL ADEQUACY
Core Capital/TRWA 17.7 17.6 18.5 16.7 16.8 16.7 17.9 16.1 16.7
Total capital/TRWA 18.4 18.2 19.4 17.8 18.0 17.8 19.1 17.6 18.7
2. LIQUIDITY
Liquid Assets/Demand Liabilities 37.0 36.5 37.1 35.6 37.8 35.6 35.5 37.3 35.7
Total Loans/Customer Deposits 67.7 71.4 71.2 73.3 72.7 74.3 76.8 76.6 78.9
3. EARNINGS & PROFITABILITY
Net Interest Margin (NIM) 66.1 67.0 69.1 67.4 67.4 67.5 67.5 65.9 67.1
Non-Interest Expenses/Gross Income 66.0 66.9 63.2 65.6 66.0 66.8 63.8 65.1 67.2
Personnel expenses to non-interest expenses 45.1 43.4 46.7 46.5 45.4 44.1 44.6 45.9 44.7
ROA (PBT/Average Total Assets) 2.6 2.6 3.4 3.0 2.9 2.7 3.1 2.9 2.7
ROE (PAT/Average Shareholders’ funds) 13.9 12.8 15.5 15.5 15.0 12.6 16.2 15.1 13.5
4. ASSET COMPOSITION & QUALITY
Foreign Exchange Loans to Total Loans 35.6 35.6 33.6 35.9 35.7 36.8 37.5 38.6 37.8
Gross NPLs to Gross Loans 7.1 6.5 8.4 8.1 8.5 6.6 6.5 6.6 6.8
NPLs net of provisions/Total Capital 16.8 15.6 16.6 17.2 21.0 12.6 14.0 16.5 15.7
Large Exposures to Total Capital 135.8 137.5 105.3 133.7 100.3 106.8 137.0 124.0 126.8
Net Loans and advances to Total assets 49.1 50.8 51.0 51.8 51.4 53.1 53.3 53.2 54.6
5. SENSITIVITY TO MARKET RISK
FX Currency Denominated Assets/Total Assets 30.9 30.6 28.2 29.4 29.6 30.3 31.7 34.2 34.9
FX Currency Denominated Liabilities/Total Liabilities 35.3 35.1 32.6 34.4 34.5 35.8 37.6 39.8 39.6
Net Open Positions in FX/Total Capital 2.5 1.5 2.9 1.8 -2.2 -2.5 -2.1 -2.2 -2.4
Note: ROA - Return on Asset, ROE - Return on Equity, NPLs - Non Performing LoansSource: Bank of Tanzania
Financial Stability Report - September 2015
13
Chart 3.1: EAC Selected Financial Soundness Indicators Percent
0
5
10
15
Sep-12 Sep-13 Sep-14 Jun-15
NPLs to Gross Loans
Tanzania Kenya Rwanda Uganda Burundi
0
5
10
15
20
25
30
Sep-12 Sep-13 Sep-14 Jun-15
Capital to risk weighted assets
Tanzania Kenya Rwanda Uganda Burundi
0
10
20
30
40
Sep-12 Sep-13 Sep-14 Jun-15
Liquid Assets to Total Assets
Tanzania Kenya Rwanda Uganda Burundi
0
2
4
6
8
10
Sep-12 Sep-13 Sep-14 Jun-15
Return on Assets
Tanzania Kenya Rwanda Uganda Burundi
Source: Tanzania Authorities
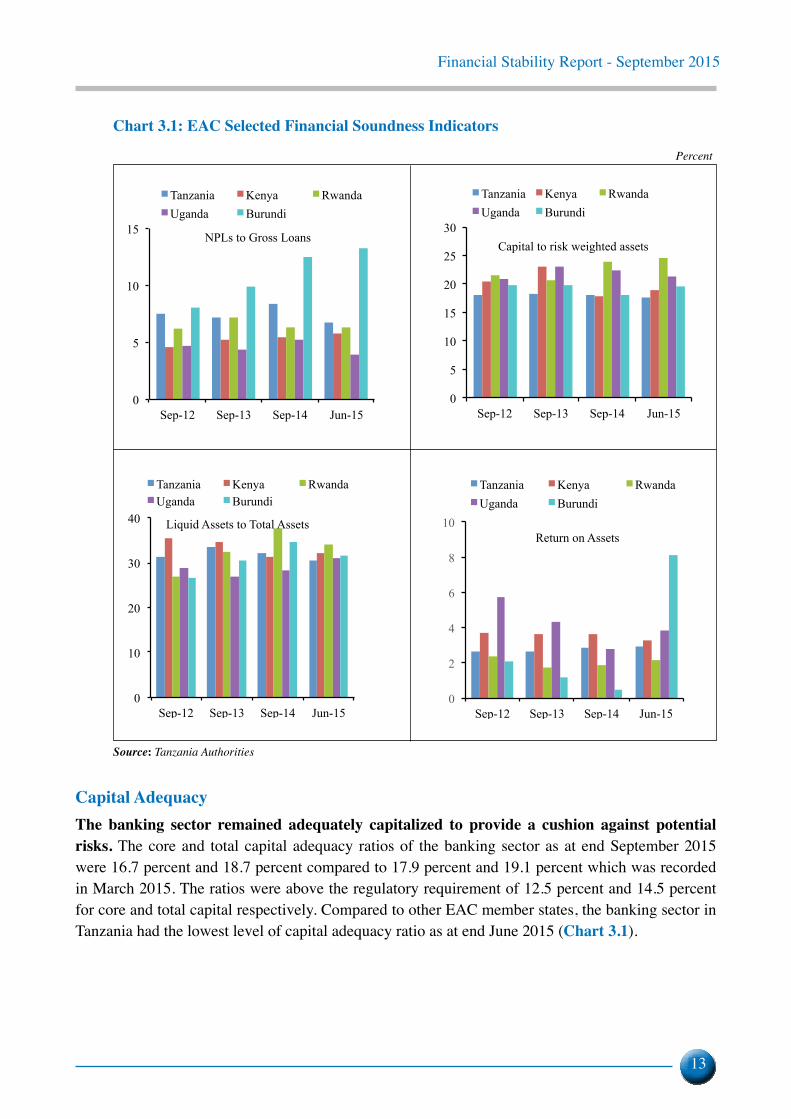
Capital AdequacyThe banking sector remained adequately capitalized to provide a cushion against potential risks. The core and total capital adequacy ratios of the banking sector as at end September 2015 were 16.7 percent and 18.7 percent compared to 17.9 percent and 19.1 percent which was recorded in March 2015. The ratios were above the regulatory requirement of 12.5 percent and 14.5 percent for core and total capital respectively. Compared to other EAC member states, the banking sector in Tanzania had the lowest level of capital adequacy ratio as at end June 2015 (Chart 3.1).
Financial Stability Report - September 2015
14
Earnings and ProfitabilityThe banking sector remained profitable during the six months to September 2015, despite a slight decline roa. The ratio stood at 2.7 percent in September 2015, compared to 3.1 percent in March 2015. The growing cost of funds reflected by decline in Net Interest Margin (NIM) contributed to the decrease in profitability.
LiquidityThe banking sector liquidity levels remained high during the six months to September 2015. The ratio of liquid assets to demand liabilities was 35.7 percent at end September 2015 way above the regulatory requirement of 20.0 percent. Investment in liquid assets such as risk free government securities owing to high returns and off-shore placements owing to depreciation of the shilling, contributed to the high liquidity levels.
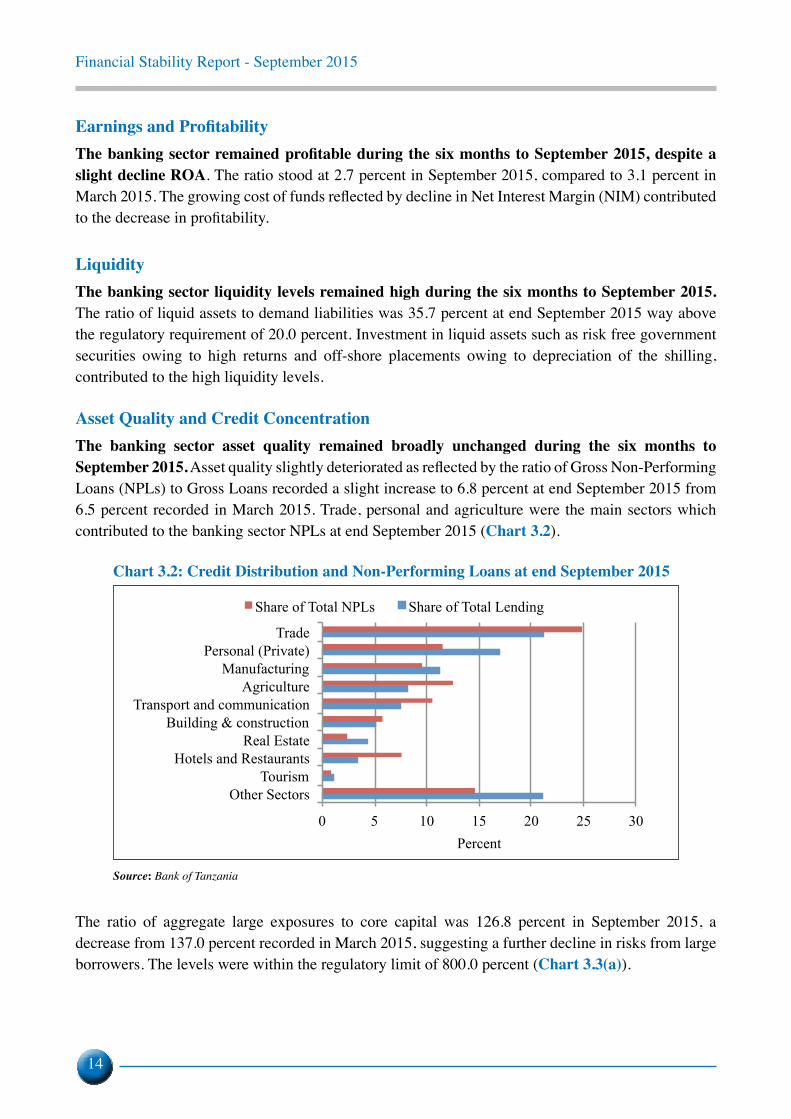
Asset Quality and Credit ConcentrationThe banking sector asset quality remained broadly unchanged during the six months to September 2015. Asset quality slightly deteriorated as reflected by the ratio of Gross Non-Performing Loans (NPLs) to Gross Loans recorded a slight increase to 6.8 percent at end September 2015 from 6.5 percent recorded in March 2015. Trade, personal and agriculture were the main sectors which contributed to the banking sector NPLs at end September 2015 (Chart 3.2).
Chart 3.2: Credit Distribution and Non-Performing Loans at end September 2015
0 5 10 15 20 25 30
Other Sectors Tourism
Hotels and Restaurants Real Estate
Building & construction Transport and communication
Agriculture Manufacturing
Personal (Private) Trade
Percent
Share of Total NPLs Share of Total Lending
Source: Bank of Tanzania
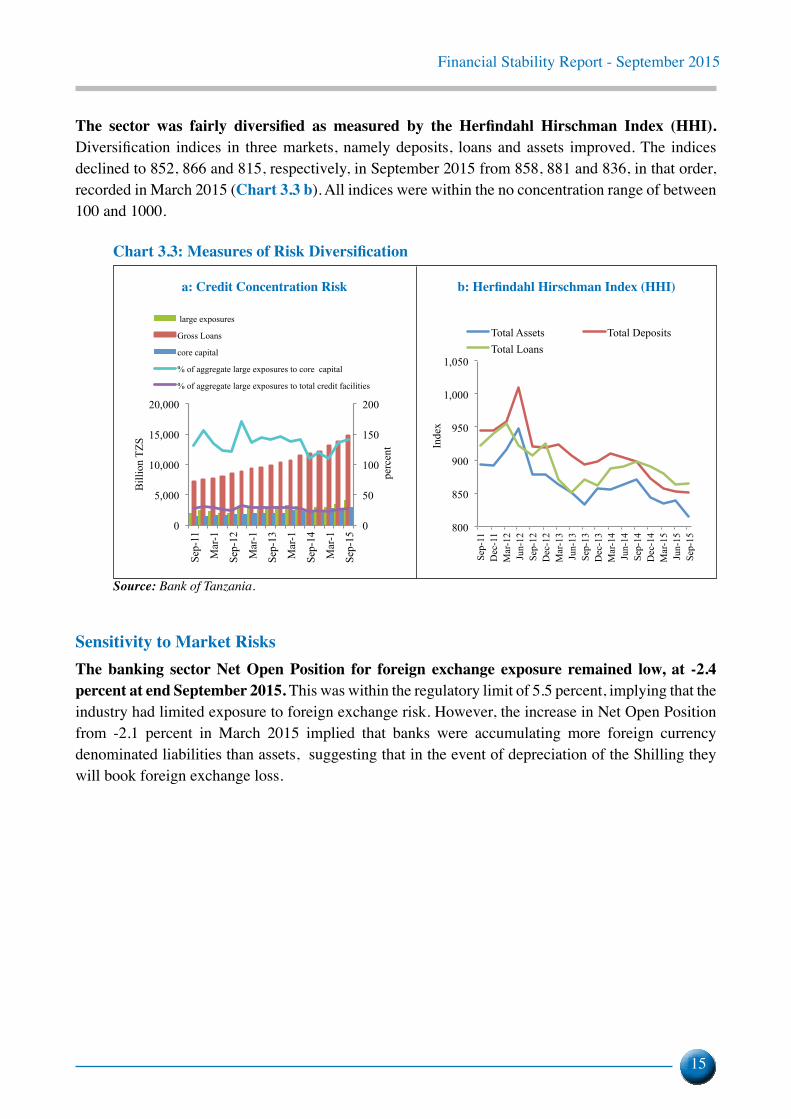
The ratio of aggregate large exposures to core capital was 126.8 percent in September 2015, a decrease from 137.0 percent recorded in March 2015, suggesting a further decline in risks from large borrowers. The levels were within the regulatory limit of 800.0 percent (Chart 3.3(a)).
Financial Stability Report - September 2015
15
The sector was fairly diversified as measured by the Herfindahl Hirschman Index (HHI). Diversification indices in three markets, namely deposits, loans and assets improved. The indices declined to 852, 866 and 815, respectively, in September 2015 from 858, 881 and 836, in that order, recorded in March 2015 (Chart 3.3 b). All indices were within the no concentration range of between 100 and 1000.
Chart 3.3: Measures of Risk Diversification
0
50
100
150
200
0
5,000
10,000
15,000
20,000
Sep-
11
Mar
-1
Sep-
12
Mar
-1
Sep-
13
Mar
-1
Sep-
14
Mar
-1
Sep-
15
per
cent
Bill
ion
TZS
large exposures
Gross Loans
core capital
% of aggregate large exposures to core capital
% of aggregate large exposures to total credit facilities
800
850
900
950
1,000
1,050
Sep-
11
Dec
-11
Mar
-12
Jun-
12
Sep-
12
Dec
-12
Mar
-13
Jun-
13
Sep-
13
Dec
-13
Mar
-14
Jun-
14
Sep-
14
Dec
-14
Mar
-15
Jun-
15
Sep-
15
Inde
x
Total Assets Total Deposits Total Loans
Source: Bank of Tanzania.
Sensitivity to Market RisksThe banking sector Net Open Position for foreign exchange exposure remained low, at -2.4 percent at end September 2015. This was within the regulatory limit of 5.5 percent, implying that the industry had limited exposure to foreign exchange risk. However, the increase in Net Open Position from -2.1 percent in March 2015 implied that banks were accumulating more foreign currency denominated liabilities than assets, suggesting that in the event of depreciation of the Shilling they will book foreign exchange loss.
a: Credit Concentration Risk b: Herfindahl Hirschman Index (HHI)
Financial Stability Report - September 2015
16
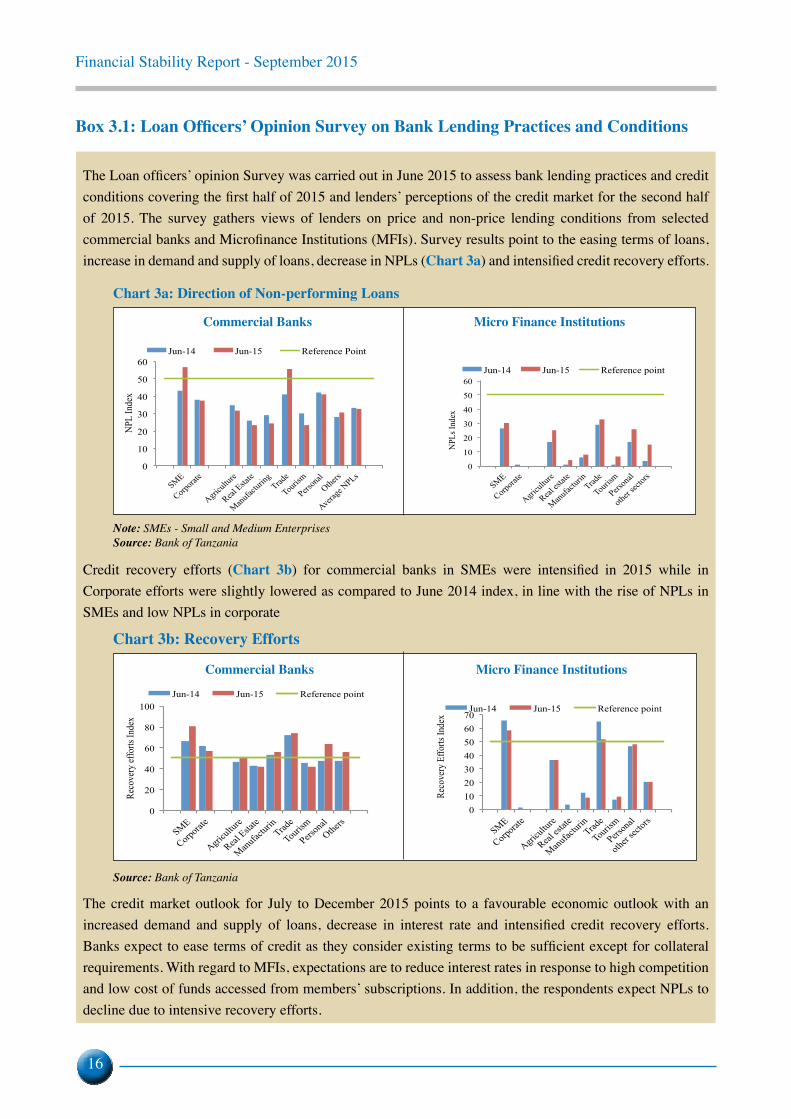
Box 3.1: Loan Officers’ Opinion Survey on Bank Lending Practices and Conditions
The Loan officers’ opinion Survey was carried out in June 2015 to assess bank lending practices and credit conditions covering the first half of 2015 and lenders’ perceptions of the credit market for the second half of 2015. The survey gathers views of lenders on price and non-price lending conditions from selected commercial banks and Microfinance Institutions (MFIs). Survey results point to the easing terms of loans, increase in demand and supply of loans, decrease in NPLs (Chart 3a) and intensified credit recovery efforts.
Chart 3a: Direction of Non-performing Loans
0
10
20
30
40
50
60
SME
Corpora
te
Agricul
ture
Real Esta
te
Manufac
turing
Trad
e
Touris
m
Person
al
Others
Average
NPLs
NPL
Inde
x
Jun-14 Jun-15 Reference Point
0
10
20
30
40
50
60
SME
Corpora
te
Agricul
ture
Real es
tate
Manufac
turin
Trade
Touris
m
Person
al
other
sector
s
NPLs
Inde
x
Jun-14 Jun-15 Reference point
Note: SMEs - Small and Medium EnterprisesSource: Bank of Tanzania
Credit recovery efforts (Chart 3b) for commercial banks in SMEs were intensified in 2015 while in Corporate efforts were slightly lowered as compared to June 2014 index, in line with the rise of NPLs in SMEs and low NPLs in corporate
Chart 3b: Recovery Efforts
0
20
40
60
80
100
SME
Corpora
te
Agricul
ture
Real Esta
te
Manufac
turin
Trade
Touris
m
Person
al
Others
Reco
very
effo
rts In
dex
Jun-14 Jun-15 Reference point
0 10 20 30 40 50 60 70
SME
Corpora
te
Agricul
ture
Real es
tate
Manufac
turin
Trade
Touris
m
Person
al
other
sector
s
Reco
very
Effo
rts In
dex
Jun-14 Jun-15 Reference point
Source: Bank of Tanzania
The credit market outlook for July to December 2015 points to a favourable economic outlook with an increased demand and supply of loans, decrease in interest rate and intensified credit recovery efforts. Banks expect to ease terms of credit as they consider existing terms to be sufficient except for collateral requirements. With regard to MFIs, expectations are to reduce interest rates in response to high competition and low cost of funds accessed from members’ subscriptions. In addition, the respondents expect NPLs to decline due to intensive recovery efforts.
Commercial Banks Micro finance institutions
Commercial Banks Micro finance institutions
Financial Stability Report - September 2015
17
3.2 Non-Banking Financial Sector
3.2.1 Financial Markets
During the six months ending September 2015, financial markets experienced tight conditions. The strengthening of the US dollar and policy actions to mitigate exchange rate volatility contributed to liquidity tightening in the money markets. Liquidity risk increased as reflected by widening spreads, and rising cost of funds as interest rates surged. Capital markets experienced slowdown in trading activity as reflected by decline in market capitalization and share price indices.
Money Markets
Interbank Cash Market
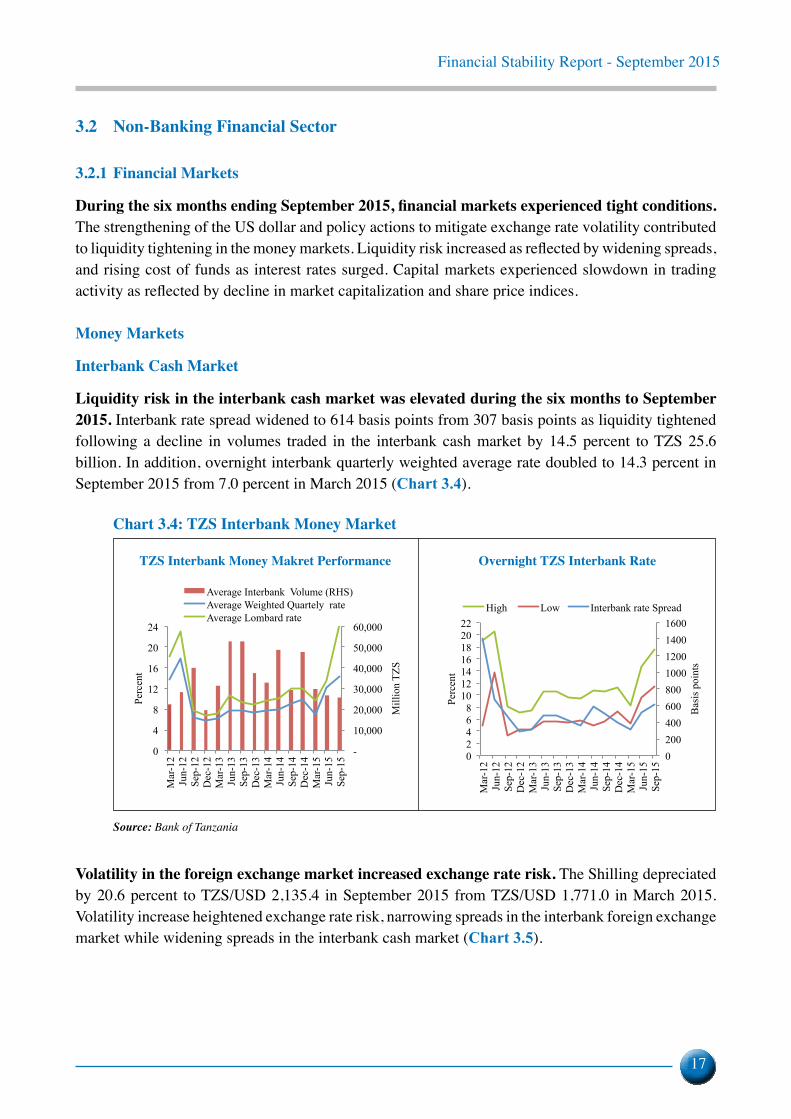
Liquidity risk in the interbank cash market was elevated during the six months to September 2015. Interbank rate spread widened to 614 basis points from 307 basis points as liquidity tightened following a decline in volumes traded in the interbank cash market by 14.5 percent to TZS 25.6 billion. In addition, overnight interbank quarterly weighted average rate doubled to 14.3 percent in September 2015 from 7.0 percent in March 2015 (Chart 3.4).
Chart 3.4: TZS Interbank Money Market
-
10,000
20,000
30,000
40,000
50,000
60,000
0
4
8
12
16
20
24
Mar
-12
Jun-
12
Sep-
12
Dec
-12
Mar
-13
Jun-
13
Sep-
13
Dec
-13
Mar
-14
Jun-
14
Sep-
14
Dec
-14
Mar
-15
Jun-
15
Sep-
15
Mill
ion
TZS
Perc
ent
Average Interbank Volume (RHS) Average Weighted Quartely rate Average Lombard rate
0 200 400 600 800 1000 1200 1400 1600
0 2 4 6 8
10 12 14 16 18 20 22
Mar
-12
Jun-
12
Sep-
12
Dec
-12
Mar
-13
Jun-
13
Sep-
13
Dec
-13
Mar
-14
Jun-
14
Sep-
14
Dec
-14
Mar
-15
Jun-
15
Sep-
15
Bas
is p
oint
s
Perc
ent
High Low Interbank rate Spread
Source: Bank of Tanzania
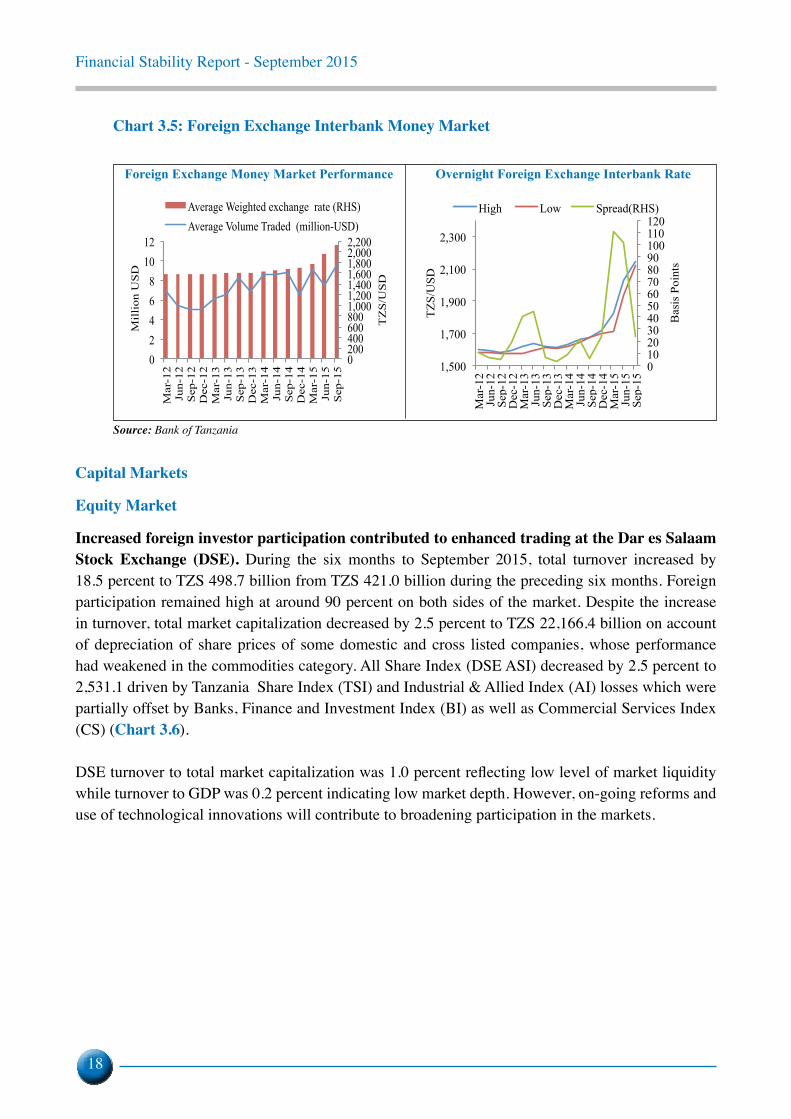
Volatility in the foreign exchange market increased exchange rate risk. The Shilling depreciated by 20.6 percent to TZS/USD 2,135.4 in September 2015 from TZS/USD 1,771.0 in March 2015. Volatility increase heightened exchange rate risk, narrowing spreads in the interbank foreign exchange market while widening spreads in the interbank cash market (Chart 3.5).
TZS Interbank Money Makret performance Overnight TZS Interbank rate
Financial Stability Report - September 2015
18
Chart 3.5: Foreign Exchange Interbank Money Market
0 200 400 600 800 1,000 1,200 1,400 1,600 1,800 2,000 2,200
0 2 4 6 8
10 12
Mar
-12
Jun-
12
Sep
-12
Dec
-12
Mar
-13
Jun-
13
Sep
-13
Dec
-13
Mar
-14
Jun-
14
Sep
-14
Dec
-14
Mar
-15
Jun-
15
Sep
-15
TZ
S/U
SD
Mil
lion
US
D
Average Weighted exchange rate (RHS) Average Volume Traded (million-USD)
0 10 20 30 40 50 60 70 80 90 100 110 120
1,500
1,700
1,900
2,100
2,300
Mar
-12
Jun-
12
Sep-
12
Dec
-12
Mar
-13
Jun-
13
Sep-
13
Dec
-13
Mar
-14
Jun-
14
Sep-
14
Dec
-14
Mar
-15
Jun-
15
Sep-
15
Bas
is P
oint
s
TZS/
USD
High Low Spread(RHS)
Source: Bank of Tanzania
Capital Markets
Equity Market
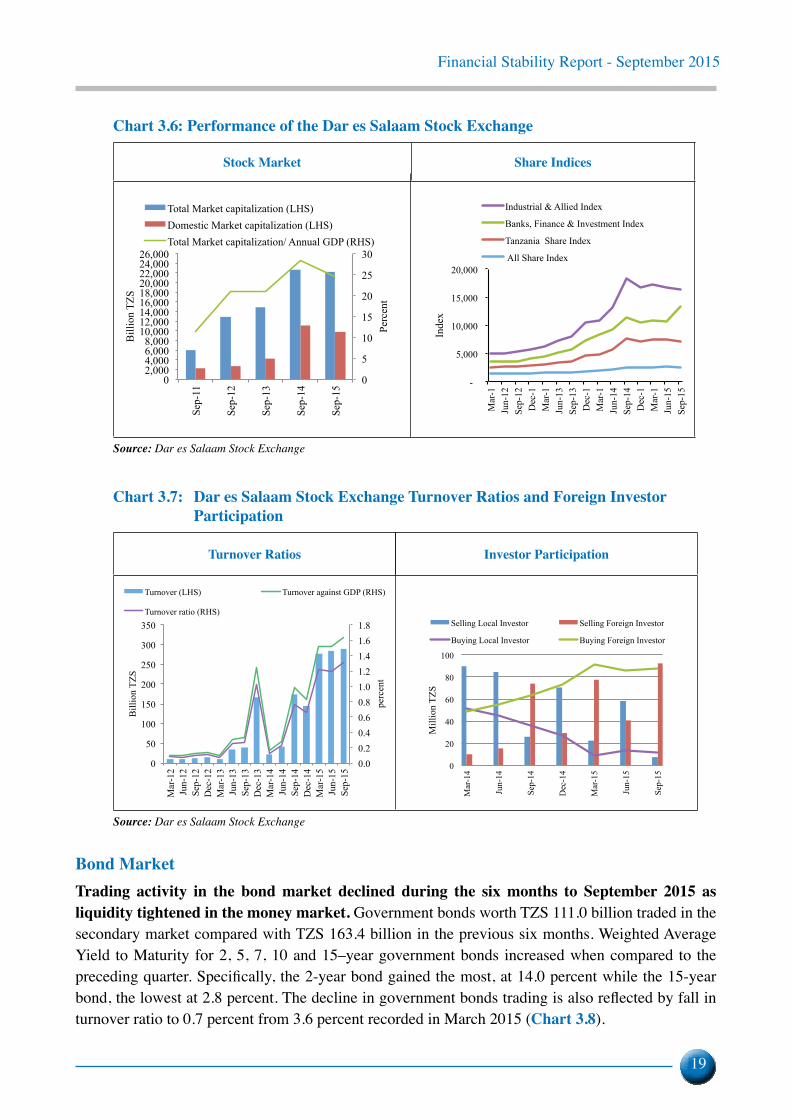
increased foreign investor participation contributed to enhanced trading at the Dar es salaam Stock Exchange (DSE). During the six months to September 2015, total turnover increased by 18.5 percent to TZS 498.7 billion from TZS 421.0 billion during the preceding six months. Foreign participation remained high at around 90 percent on both sides of the market. Despite the increase in turnover, total market capitalization decreased by 2.5 percent to TZS 22,166.4 billion on account of depreciation of share prices of some domestic and cross listed companies, whose performance had weakened in the commodities category. All Share Index (DSE ASI) decreased by 2.5 percent to 2,531.1 driven by Tanzania Share Index (TSI) and Industrial & Allied Index (AI) losses which were partially offset by Banks, Finance and Investment Index (BI) as well as Commercial Services Index (CS) (Chart 3.6).
DSE turnover to total market capitalization was 1.0 percent reflecting low level of market liquidity while turnover to GDP was 0.2 percent indicating low market depth. However, on-going reforms and use of technological innovations will contribute to broadening participation in the markets.
Overnight Foreign Exchange Interbank RateForeign Exchange Money Market Performance
Financial Stability Report - September 2015
19
Chart 3.6: Performance of the Dar es Salaam Stock Exchange
Stock Market share indices
0
5
10
15
20
25
30
0 2,000 4,000 6,000 8,000
10,000 12,000 14,000 16,000 18,000 20,000 22,000 24,000 26,000
Sep-
11
Sep-
12
Sep-
13
Sep-
14
Sep-
15
Perc
ent
Bill
ion
TZS
Total Market capitalization (LHS) Domestic Market capitalization (LHS) Total Market capitalization/ Annual GDP (RHS)
-
5,000
10,000
15,000
20,000
Mar
-1Ju
n-12
Se
p-12
D
ec-1
Mar
-1Ju
n-13
Se
p-13
D
ec-1
Mar
-1Ju
n-14
Se
p-14
D
ec-1
Mar
-1Ju
n-15
Se
p-15
Inde
x
Industrial & Allied Index
Banks, Finance & Investment Index
Tanzania Share Index
All Share Index
Source: Dar es Salaam Stock Exchange
Chart 3.7: Dar es Salaam Stock Exchange Turnover Ratios and Foreign Investor participation
turnover ratios investor participation
0
20
40
60
80
100
Mar
-14
Jun-
14
Sep-
14
Dec
-14
Mar
-15
Jun-
15
Sep-
15
Mill
ion
TZS
Selling Local Investor Selling Foreign Investor
Buying Local Investor Buying Foreign Investor
0.0 0.2 0.4 0.6 0.8 1.0 1.2 1.4 1.6 1.8
0
50
100
150
200
250
300
350
Mar
-12
Jun-
12
Sep-
12
Dec
-12
Mar
-13
Jun-
13
Sep-
13
Dec
-13
Mar
-14
Jun-
14
Sep-
14
Dec
-14
Mar
-15
Jun-
15
Sep-
15
perc
ent
Bill
ion
TZS
Turnover (LHS) Turnover against GDP (RHS)
Turnover ratio (RHS)
Source: Dar es Salaam Stock Exchange
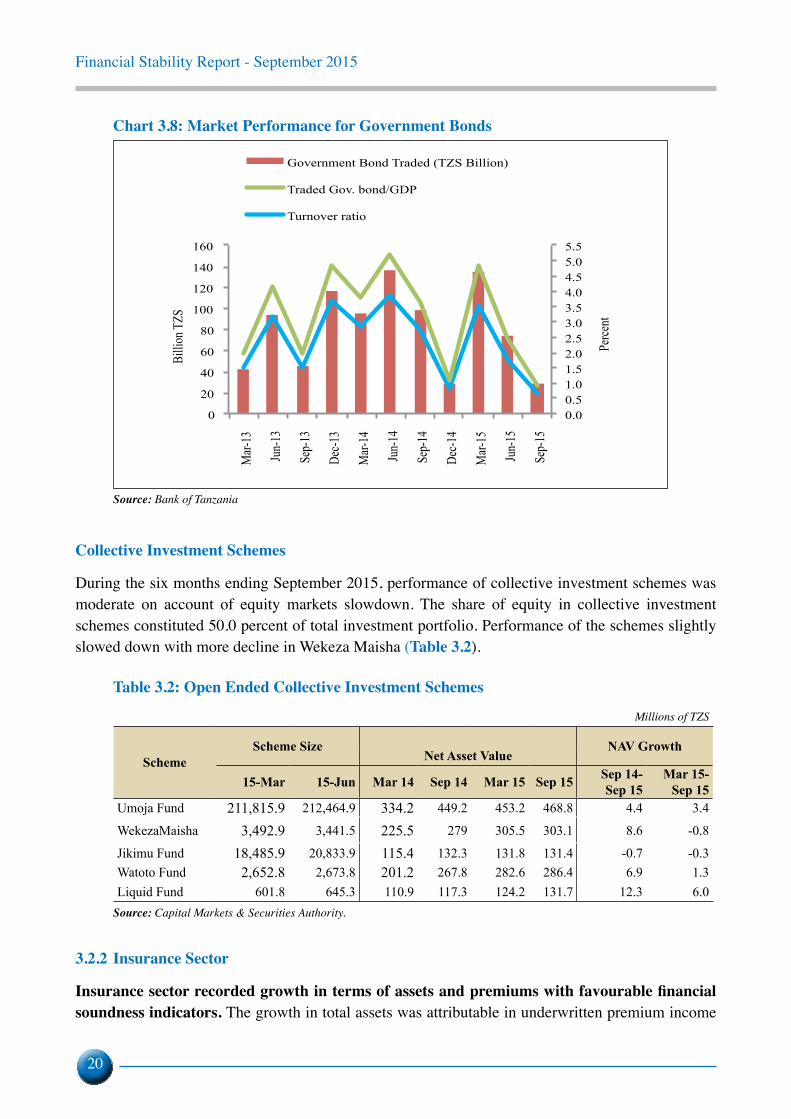
Bond MarketTrading activity in the bond market declined during the six months to September 2015 as liquidity tightened in the money market. Government bonds worth TZS 111.0 billion traded in the secondary market compared with TZS 163.4 billion in the previous six months. Weighted Average Yield to Maturity for 2, 5, 7, 10 and 15–year government bonds increased when compared to the preceding quarter. Specifically, the 2-year bond gained the most, at 14.0 percent while the 15-year bond, the lowest at 2.8 percent. The decline in government bonds trading is also reflected by fall in turnover ratio to 0.7 percent from 3.6 percent recorded in March 2015 (Chart 3.8).
Financial Stability Report - September 2015
20
Chart 3.8: Market Performance for Government Bonds
0.0 0.5 1.0 1.5 2.0 2.5 3.0 3.5 4.0 4.5 5.0 5.5
0
20
40
60
80
100
120
140
160 M
ar-13
Jun-
13
Sep-
13
Dec-1
3
Mar-
14
Jun-
14
Sep-
14
Dec-1
4
Mar-
15
Jun-
15
Sep-
15
Perce
nt
Billi
on T
ZS
Government Bond Traded (TZS Billion)
Traded Gov. bond/GDP
Turnover ratio
Source: Bank of Tanzania
collective investment schemes
During the six months ending September 2015, performance of collective investment schemes was moderate on account of equity markets slowdown. The share of equity in collective investment schemes constituted 50.0 percent of total investment portfolio. Performance of the schemes slightly slowed down with more decline in Wekeza Maisha (Table 3.2).
Table 3.2: Open Ended Collective Investment Schemes Millions of TZS
SchemeScheme Size
NAV Growth
Net Asset Value
15-Mar 15-Jun Mar 14 Sep 14 Mar 15 Sep 15 Sep 14-Sep 15
Mar 15- Sep 15
Umoja Fund 211,815.9 212,464.9 334.2 449.2 453.2 468.8 4.4 3.4
WekezaMaisha 3,492.9 3,441.5 225.5 279 305.5 303.1 8.6 -0.8
Jikimu Fund 18,485.9 20,833.9 115.4 132.3 131.8 131.4 -0.7 -0.3Watoto Fund 2,652.8 2,673.8 201.2 267.8 282.6 286.4 6.9 1.3Liquid Fund 601.8 645.3 110.9 117.3 124.2 131.7 12.3 6.0
Source: Capital Markets & Securities Authority.
3.2.2 Insurance Sector
Insurance sector recorded growth in terms of assets and premiums with favourable financial soundness indicators. The growth in total assets was attributable in underwritten premium income
Financial Stability Report - September 2015
21
and investment returns. General insurer’s retention rates during the year ending June 2015 were 57.9 percent of total Gross Premium Written (GPW). The retention rates were consistent with the prudential retention ratio of between 30.0 percent and 70.0 percent of GPW (Table 3.3).
Table 3.3: Insurance Performance Billion TZS
Particular Jun-14 Jun-15 % Change Jun14 - Jun 15
Total Assets 590.5 692.9 17.3Total Liabilities 373 451.3 21.0Total Net Worth 217.5 241.6 11.1Total Investments 362.1 429.6 18.6Gross Premium Written
General Insurance 250 288.1 15.2Life Assurance 33 33.5 1.5Total 283 321.6 13.6
Source: Tanzania Insurance Regulatory Authority
Exposure to liquidity risk declined on account of enhanced capital. General and Life insurers’ liquidity ratios rose to 106.7 percent and 57.4 percent in June 2015, respectively from 63.2 percent and 43.5 percent in the same order reported in March 2015. Both ratios were above the minimum prudential requirements of 95.0 percent and 50.0 percent, respectively.
Insurance sector investment portfolio remained relatively diversified. The insurers’ investment assets comprised of term deposits 51.6 percent, real estate investments 17.4 percent, shares 15.8 percent, and government securities 12.0 percent, Investments in Related Parties 2.1 percent and Other Financial Investments 1.1 percent. However, investment in real estate was slightly above the regulatory threshold.
Financial Stability Report - September 2015
22
Table 3.4: Financial Soundness Indicators of the Insurance Sector (General and Life)
IndicatorStatutory
Requirement
Jun 14 Jun-15
General Life General Life
1. Capital Ratios Solvency Ratio General ≥ 25; Life ≥ 8 59.0 36.0 63.0 28.8
Change in Capital and Reserves 9.0 44.0 12.9 -0.6
2. Asset Quality Ratios
Rate of Return on Investment 4.0 2.6 6.7 3.2
Investment Mix:
Investment in government securities 16.0 12.5 13.8 7.8
Investment in bank deposits Min 30 57.0 47.7 60.2 32
Investment in real estate General Max 15, Life Max 30 10.0 17.8 10.2 34
3. Reinsurance Ratios
Retention RatioGeneral 30<RR<70;
56.0 85.0 57.9 83.1Life 50<RR<90
4. Actuarial Liabilities (General) Actuarial Provisions to Capital Ratio Max 250 37.3 n/a 37.4 n/a
5. Earnings Ratios (General)
Return on Equity 10.0 31.0 7.2 n/a6. Liquidity Ratios
Liquidity Ratio General ≥ 95; Life ≥ 50 64.0 40.0 106.7 57.4Total Receivables as % of Capital & Reserves Max 100 90.0 26.0 86.0 32.5
7. Loss Ratio (Claims Ratio) 54.8 36.9 55.3 40.7
Source: Tanzania Insurance Regulatory Authority
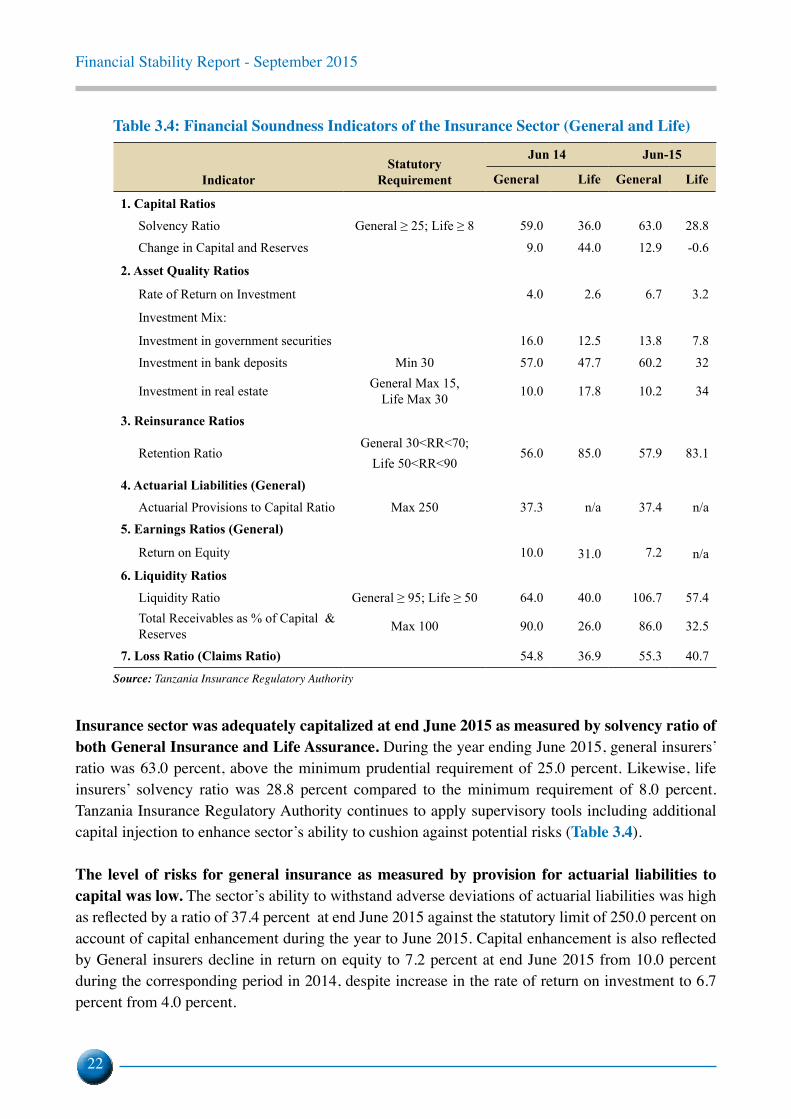
Insurance sector was adequately capitalized at end June 2015 as measured by solvency ratio of both General Insurance and Life Assurance. During the year ending June 2015, general insurers’ ratio was 63.0 percent, above the minimum prudential requirement of 25.0 percent. Likewise, life insurers’ solvency ratio was 28.8 percent compared to the minimum requirement of 8.0 percent. Tanzania Insurance Regulatory Authority continues to apply supervisory tools including additional capital injection to enhance sector’s ability to cushion against potential risks (Table 3.4).
The level of risks for general insurance as measured by provision for actuarial liabilities to capital was low. The sector’s ability to withstand adverse deviations of actuarial liabilities was high as reflected by a ratio of 37.4 percent at end June 2015 against the statutory limit of 250.0 percent on account of capital enhancement during the year to June 2015. Capital enhancement is also reflected by General insurers decline in return on equity to 7.2 percent at end June 2015 from 10.0 percent during the corresponding period in 2014, despite increase in the rate of return on investment to 6.7 percent from 4.0 percent.
Financial Stability Report - September 2015
23
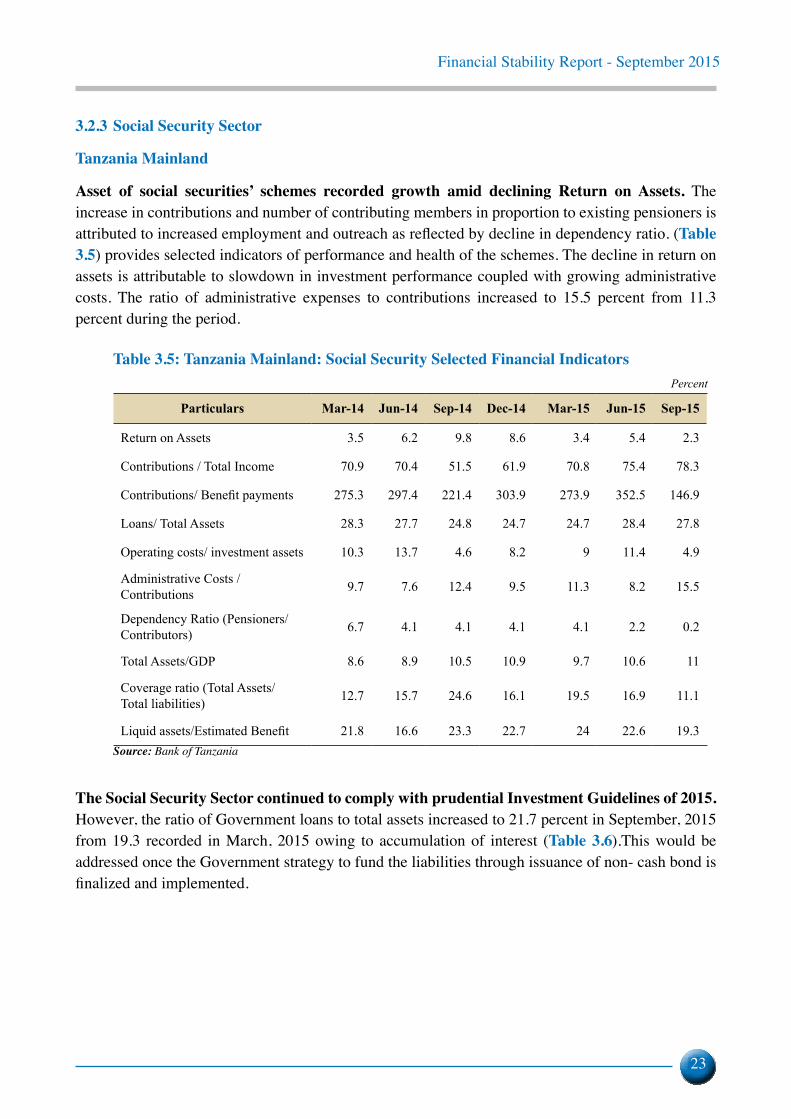
3.2.3 Social Security Sector
tanzania Mainland
Asset of social securities’ schemes recorded growth amid declining Return on Assets. The increase in contributions and number of contributing members in proportion to existing pensioners is attributed to increased employment and outreach as reflected by decline in dependency ratio. (table 3.5) provides selected indicators of performance and health of the schemes. The decline in return on assets is attributable to slowdown in investment performance coupled with growing administrative costs. The ratio of administrative expenses to contributions increased to 15.5 percent from 11.3 percent during the period.
Table 3.5: Tanzania Mainland: Social Security Selected Financial Indicators Percent
Particulars Mar-14 Jun-14 Sep-14 Dec-14 Mar-15 Jun-15 Sep-15
Return on Assets 3.5 6.2 9.8 8.6 3.4 5.4 2.3
Contributions / Total Income 70.9 70.4 51.5 61.9 70.8 75.4 78.3
Contributions/ Benefit payments 275.3 297.4 221.4 303.9 273.9 352.5 146.9
Loans/ Total Assets 28.3 27.7 24.8 24.7 24.7 28.4 27.8
Operating costs/ investment assets 10.3 13.7 4.6 8.2 9 11.4 4.9
Administrative Costs / Contributions 9.7 7.6 12.4 9.5 11.3 8.2 15.5
Dependency Ratio (Pensioners/Contributors) 6.7 4.1 4.1 4.1 4.1 2.2 0.2
Total Assets/GDP 8.6 8.9 10.5 10.9 9.7 10.6 11
Coverage ratio (Total Assets/ Total liabilities) 12.7 15.7 24.6 16.1 19.5 16.9 11.1
Liquid assets/Estimated Benefit 21.8 16.6 23.3 22.7 24 22.6 19.3Source: Bank of Tanzania
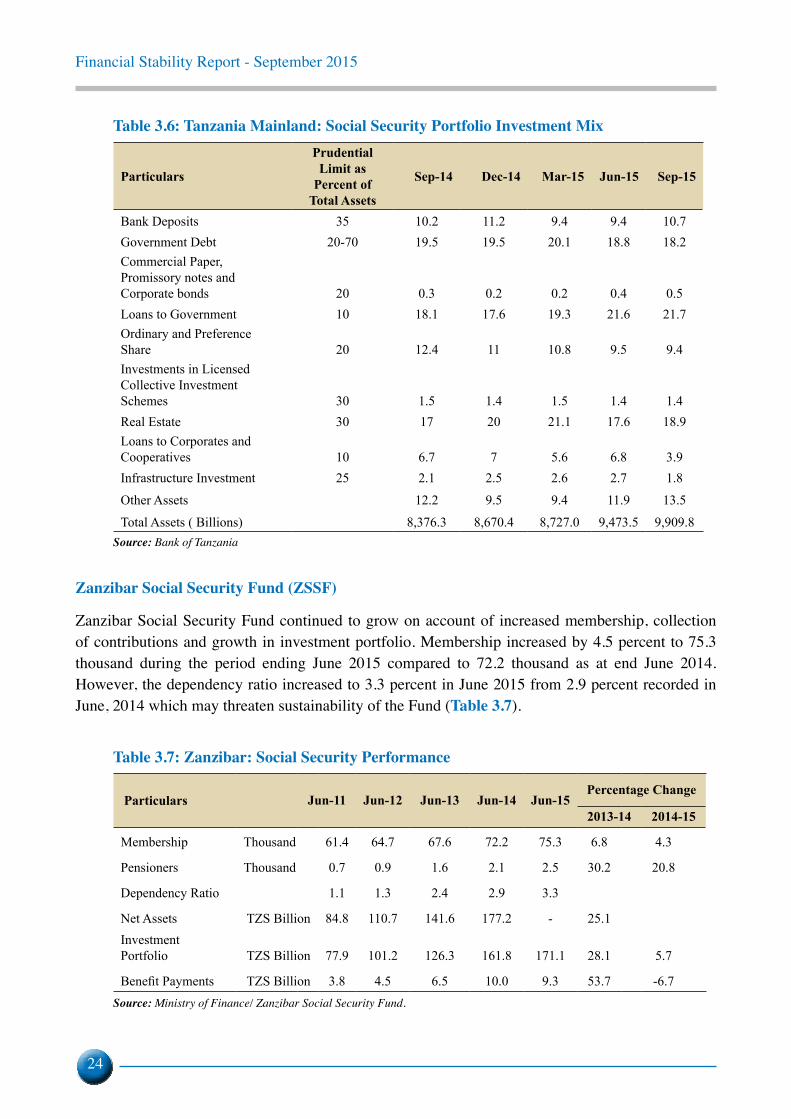
The Social Security Sector continued to comply with prudential Investment Guidelines of 2015. However, the ratio of Government loans to total assets increased to 21.7 percent in September, 2015 from 19.3 recorded in March, 2015 owing to accumulation of interest (Table 3.6).This would be addressed once the Government strategy to fund the liabilities through issuance of non- cash bond is finalized and implemented.
Financial Stability Report - September 2015
24
Table 3.6: Tanzania Mainland: Social Security Portfolio Investment Mix
Particulars
Prudential Limit as
Percent of Total Assets
Sep-14 Dec-14 Mar-15 Jun-15 Sep-15
Bank Deposits 35 10.2 11.2 9.4 9.4 10.7Government Debt 20-70 19.5 19.5 20.1 18.8 18.2Commercial Paper, Promissory notes and Corporate bonds 20 0.3 0.2 0.2 0.4 0.5Loans to Government 10 18.1 17.6 19.3 21.6 21.7Ordinary and Preference Share 20 12.4 11 10.8 9.5 9.4Investments in Licensed Collective Investment Schemes 30 1.5 1.4 1.5 1.4 1.4Real Estate 30 17 20 21.1 17.6 18.9Loans to Corporates and Cooperatives 10 6.7 7 5.6 6.8 3.9Infrastructure Investment 25 2.1 2.5 2.6 2.7 1.8
Other Assets 12.2 9.5 9.4 11.9 13.5
Total Assets ( Billions) 8,376.3 8,670.4 8,727.0 9,473.5 9,909.8Source: Bank of Tanzania
Zanzibar Social Security Fund (ZSSF)
Zanzibar Social Security Fund continued to grow on account of increased membership, collection of contributions and growth in investment portfolio. Membership increased by 4.5 percent to 75.3 thousand during the period ending June 2015 compared to 72.2 thousand as at end June 2014. However, the dependency ratio increased to 3.3 percent in June 2015 from 2.9 percent recorded in June, 2014 which may threaten sustainability of the Fund (Table 3.7).
Table 3.7: Zanzibar: Social Security Performance
Particulars
Jun-11 Jun-12 Jun-13 Jun-14 Jun-15Percentage Change
2013-14 2014-15
Membership Thousand 61.4 64.7 67.6 72.2 75.3 6.8 4.3
Pensioners Thousand 0.7 0.9 1.6 2.1 2.5 30.2 20.8
Dependency Ratio 1.1 1.3 2.4 2.9 3.3
Net Assets TZS Billion 84.8 110.7 141.6 177.2 - 25.1Investment Portfolio TZS Billion 77.9 101.2 126.3 161.8 171.1 28.1 5.7
Benefit Payments TZS Billion 3.8 4.5 6.5 10.0 9.3 53.7 -6.7Source: Ministry of Finance/ Zanzibar Social Security Fund.

Financial Stability Report - September 2015
25
The Fund continues to implement the investment management policy as stipulated under section 5 (d) of the ZSSF Act. No. 2 of 2005.
Table 3.8: Zanzibar: Social Security Performance at June 2015
Investment Value (billions) Share of Total (Percent)
Fixed deposit 44.5 22.8
Treasury Bond 65.2 33.4
Equity Investment 8.3 4.3
Government stock 20 10.3
Loan 10.6 5.4
Real Estate 46.5 23.8
Total 195.1 100.0
Source: Ministry of Finance/ Zanzibar Social Security Fund.
3.3 Cross-Sector Linkages in the Financial System
Inter-linkages among financial institutions, markets and markets infrastructure and the real economy continue to deepen, heightening contagion and other risks.(Table 3.9) outlines interconnectedness between the banking sector with other financial sub-sector.
Table 3.9: Financial System Interconnectedness (Top Ten Banks) Billions TZS
Items Jun-14 Sep-14 Dec-14 Mar-15 Jun-15 Sep-15 % change Mar - Sep 15
Placements with Banks Abroad 715.1 657.9 626.8 598.8 751.0 1125.6 88.0
Placements with Domestic Banks 350.9 381.8 418.3 412.5 441.5 405.3 -1.7
Deposits from Pension Funds 290.7 288.0 268.5 236.1 286.7 314.7 33.3
Deposits from Insurance Companies 159.3 188.6 184.4 156.7 213.4 143.0 -8.7
Borrowings from Domestic Banks 277.8 341.1 297.7 373.2 243.3 428.9 14.9
Deposits from Foreign Banks 218.4 214.9 228.5 107.6 108.2 198.4 84.4
Inter-bank Contingent Claims to Foreign Banks 333.3 305.2 252.8 235.9 262.4 225.1 -4.6
Deposits from Mobile Network Operators 332.9 362.1 451.0 452.0 451.8 532.8 17.9
Source: Bank of Tanzania
Financial Stability Report - September 2015
26
Banks placement abroad recorded a rapid increase during the six months to September 2015. Placements increased by 88.0 percent to TZS 1,125.6 billion from TZS 598.8 billion. The increase was mainly driven by exchange rate volatility as a push factor and tight liquidity and market volatility in global financial system as pull factors.
Non-Bank Financial Institutions deposits with the banking sector exhibited mixed performance. Insurance sector deposits in the top 10 banks declined by 24.2 percent to TZS 143.0 billion2 while social security sector deposits grew by 9.3 percent to TZS 314.7 billion during the year ending September, 2015. The decline in Insurance sector deposits is partly explained by a shift in investment mix to take into account changes in returns.
2 This differs from observed increase in the aggregate insurance sector investment mix, Table 3.4, suggesting large proportions of insurance deposit held with banks other than the top ten banks.
Financial Stability Report - September 2015
27
4.0 FINANCIAL SYSTEM INFRASTRUCTURE AND REGULATORY DeVelopMents
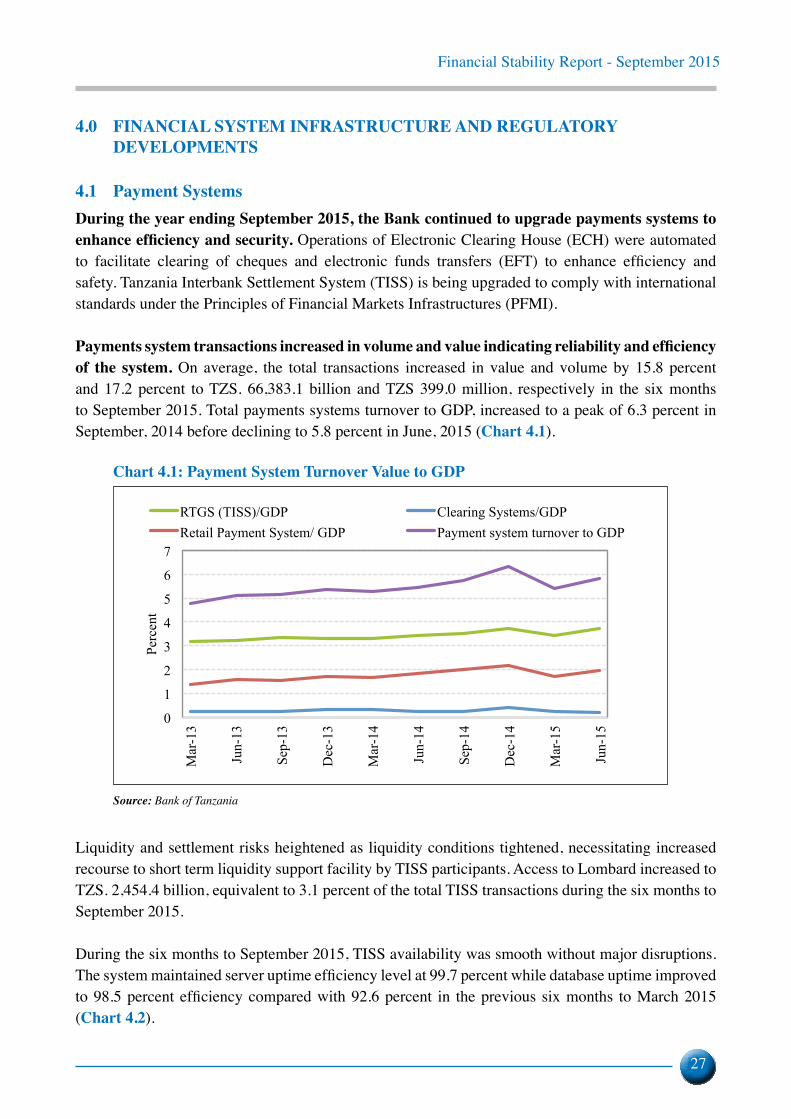
4.1 Payment SystemsDuring the year ending September 2015, the Bank continued to upgrade payments systems to enhance efficiency and security. Operations of Electronic Clearing House (ECH) were automated to facilitate clearing of cheques and electronic funds transfers (EFT) to enhance efficiency and safety. Tanzania Interbank Settlement System (TISS) is being upgraded to comply with international standards under the Principles of Financial Markets Infrastructures (PFMI).
Payments system transactions increased in volume and value indicating reliability and efficiency of the system. On average, the total transactions increased in value and volume by 15.8 percent and 17.2 percent to TZS. 66,383.1 billion and TZS 399.0 million, respectively in the six months to September 2015. Total payments systems turnover to GDP, increased to a peak of 6.3 percent in September, 2014 before declining to 5.8 percent in June, 2015 (Chart 4.1).
Chart 4.1: Payment System Turnover Value to GDP
0
1
2
3
4
5
6
7
Mar
-13
Jun-
13
Sep-
13
Dec
-13
Mar
-14
Jun-
14
Sep-
14
Dec
-14
Mar
-15
Jun-
15
Perc
ent
RTGS (TISS)/GDP Clearing Systems/GDP Retail Payment System/ GDP Payment system turnover to GDP
Source: Bank of Tanzania
Liquidity and settlement risks heightened as liquidity conditions tightened, necessitating increased recourse to short term liquidity support facility by TISS participants. Access to Lombard increased to TZS. 2,454.4 billion, equivalent to 3.1 percent of the total TISS transactions during the six months to September 2015.
During the six months to September 2015, TISS availability was smooth without major disruptions. The system maintained server uptime efficiency level at 99.7 percent while database uptime improved to 98.5 percent efficiency compared with 92.6 percent in the previous six months to March 2015 (Chart 4.2).

Financial Stability Report - September 2015
28
Chart 4.2: TISS Database and Server Availability
80
85
90
95
100
105
Sep-
14
Oct
-14
Nov
-14
Dec
-14
Jan-
15
Feb-
15
Mar
-15
Apr
-15
May
-15
Jun-
15
Jul-1
5
Aug
-15
Sep-
15
Perc
ent
Target Line (99.99) Actual Server Availability Actual Database Availability Acceptable line (97.00)
Source: Bank of Tanzania
4.2 Regulatory Developments
4.2.1 Banking Sector
During the period under review, the Bank issued ‘The Banking and Financial Institutions (Mortgage Finance) Regulations, (2015)’ and ‘The Foreign Exchange (Bureau De Change) Regulation, (2015)’. The former aims at promoting sustainable mortgage financing industry. The latter aims at monitoring of the foreign exchange market and to mitigate against associated inherent risks.
4.2.2 Capital Markets
The Commodity Exchange Act, 2015 was enacted in June 2015. The Act promotes and facilitates development of an orderly, fair and efficient market for commodities and foster price discovery. Operationalization of the market will be under the oversight of Capital Markets and Securities Authority.
4.2.3 Social Security Sector
The Social Security Schemes (Investment guidelines), 2015 was revised in September 2015 with the objective of improving risk management in the sector. The revised guidelines have set new permissible investment limits and allow investment within EAC region following the liberalization of capital account in the region.
4.2.4 National Payment System
The National Payment Systems Act, 2015 was enacted in June 2015 with objective of providing a legal basis for regulatory oversight and supervision of the payments systems. It also covers market conduct oversight in the payments systems. In addition payments services providers have been directed to adopt “chip and PIN” compliant cards.
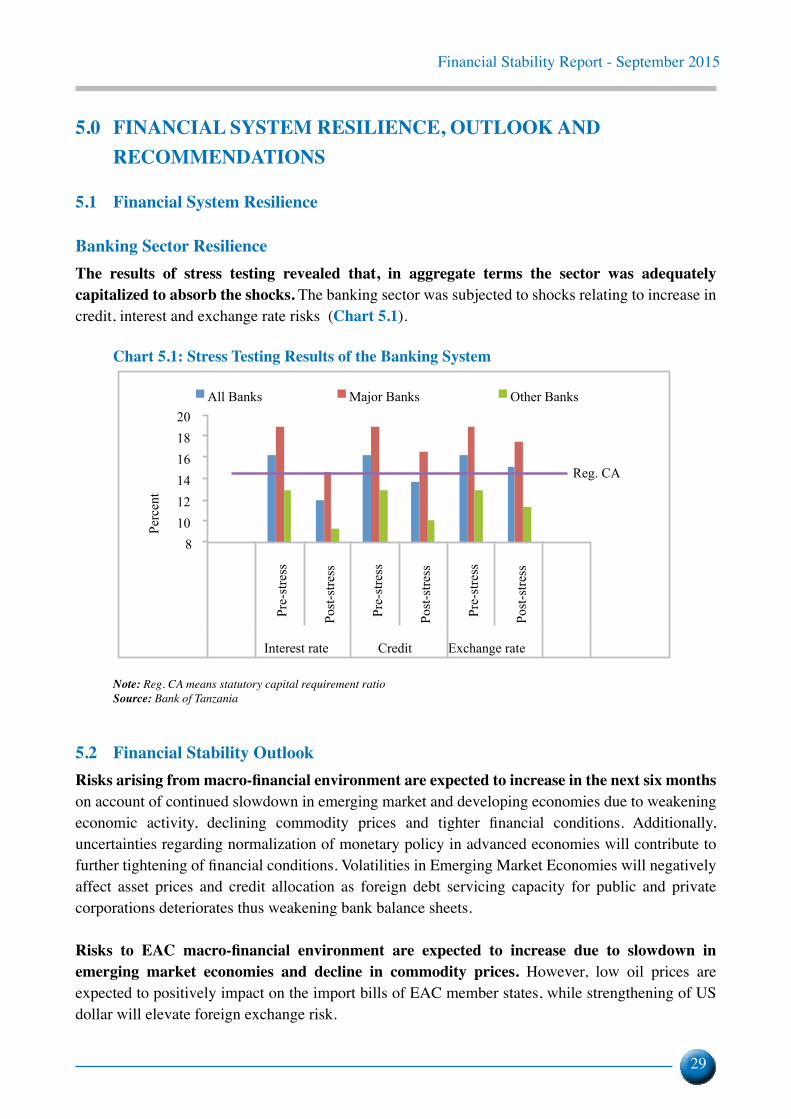
Financial Stability Report - September 2015
29
5.0 FINANCIAL SYSTEM RESILIENCE, OUTLOOK AND recoMMenDations
5.1 Financial System Resilience
Banking Sector ResilienceThe results of stress testing revealed that, in aggregate terms the sector was adequately capitalized to absorb the shocks. The banking sector was subjected to shocks relating to increase in credit, interest and exchange rate risks (Chart 5.1).
Chart 5.1: Stress Testing Results of the Banking System
8 10 12 14 16 18 20
Pre-
stre
ss
Post
-stre
ss
Pre-
stre
ss
Post
-stre
ss
Pre-
stre
ss
Post
-stre
ss
Interest rate Credit Exchange rate
Per
cent
All Banks Major Banks Other Banks
Reg. CA
Note: Reg. CA means statutory capital requirement ratioSource: Bank of Tanzania
5.2 Financial Stability OutlookRisks arising from macro-financial environment are expected to increase in the next six months on account of continued slowdown in emerging market and developing economies due to weakening economic activity, declining commodity prices and tighter financial conditions. Additionally, uncertainties regarding normalization of monetary policy in advanced economies will contribute to further tightening of financial conditions. Volatilities in Emerging Market Economies will negatively affect asset prices and credit allocation as foreign debt servicing capacity for public and private corporations deteriorates thus weakening bank balance sheets.
Risks to EAC macro-financial environment are expected to increase due to slowdown in emerging market economies and decline in commodity prices. However, low oil prices are expected to positively impact on the import bills of EAC member states, while strengthening of US dollar will elevate foreign exchange risk.
Financial Stability Report - September 2015
30
The slowdown of emerging market economies, low commodity prices and tight global and domestic financial conditions pose downside risks to sustained growth of Tanzania’s economy. Despite the potential risks the economy is expected to grow at 6.9 percent in 2015 and 7.0 percent in 2016 supported by increased investment in infrastructure, manufacturing and tourism sectors.
Risks arising from corporate sector are expected to increase in the next six months on account of exchange rate volatility and weak demand for export commodities stemming from slow growth in the Emerging Market Economies.
Household debt is projected to grow in the next six months on account of government initiative to encourage mortgage lending. Down payment for housing purchases was reduced from 20 percent to 10 percent to encourage uptake of housing mortgage.
Banking sector risks are expected to remain low except for foreign exchange risks stemming from further strengthening of US dollar in the event of US normalization of monetary policy and increase in interest rates.
Risks arising from Non-bank Financial Sector are expected to increase in the next six months. Uncertainties regarding monetary policy normalization in advanced economies may trigger volatility in the domestic financial markets. Risks arising from insurance sector are expected to remain low on account of improved performance. Risks in Social Security Sector are also expected to remain low on account of implementations of reform programs.
Financial Stability Report - September 2015
31
6.0 POLICY RECOMMENDATIONS Tanzania’s financial system is expected to remain resilient in the next six months in light of positive macroeconomic outlook and improvement in regulatory oversight. However, the system is vulnerable to increased downside risks from slowdown in economic activity and spillovers from increased financial market volatility. Furthermore, market uncertainties about impact of US policy rate normalisation coupled with adverse implications of divergent monetary policy between the US and the rest of the world add to the risks. In light of the unfolding global macroeconomic and financial environment, it is recommended to address the remaining challenges to financial stability as follows:
• To implement countercyclical fiscal policy with a view to sustaining investment in infrastructure and human capital development while monetary policy focuses at maintaining macroeconomic stability through mitigating exchange rate volatility and inflationary pressures.
• Tanzania to focus on regional integration as a strategy to diversify export markets while increasing value addition in export products in view of projected decline in import demand in EMEs and continued fall in commodity prices.
• To enhance focus on cross-border risks to financial stability in Tanzania through strengthening and broadening of regulatory and supervisory oversight both internally and across borders in light of the growing interconnectedness among banks and other financial institutions and opening up of capital markets in the SSA region.
• To promote development of domestic debt and equity markets as the global environment transits from cheap funding to more expensive source. This entails deepening and broadening of the domestic capital markets though expanding securitization to foster issuance of appropriate securities such as infrastructure bonds and other instruments to attract institutional and other investors.
Financial Stability Report - September 2015
32
appenDices
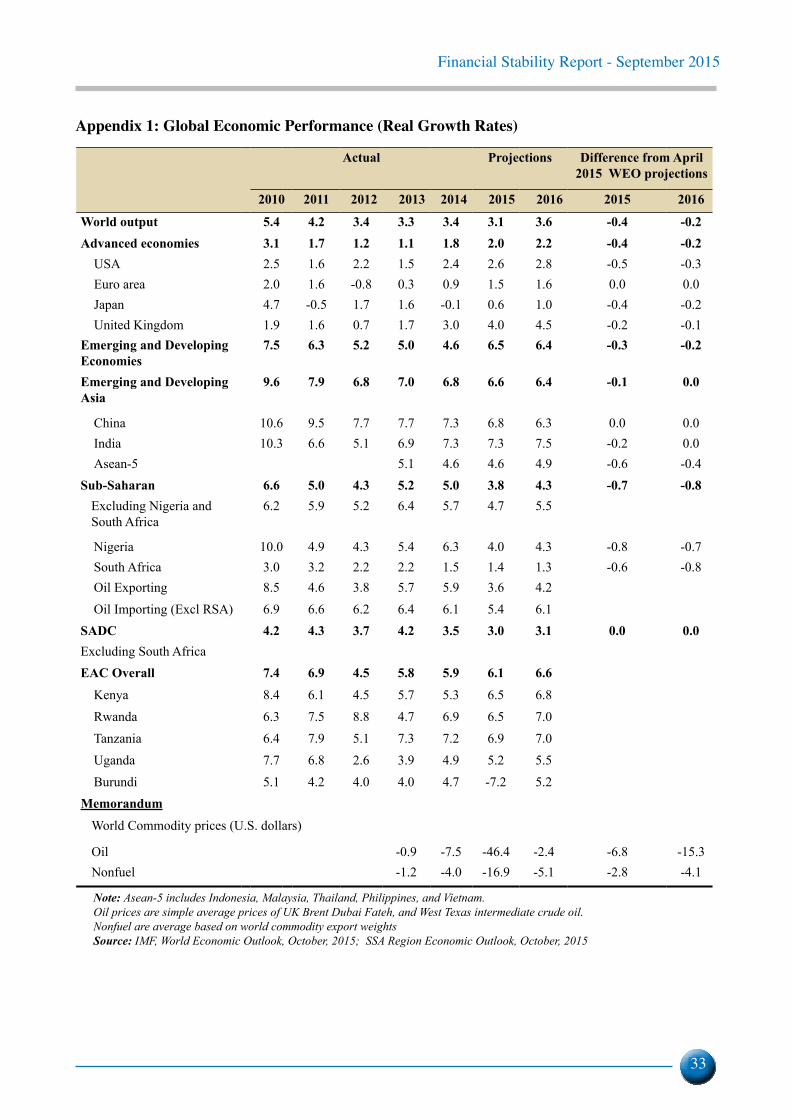
Financial Stability Report - September 2015
33
Appendix 1: Global Economic Performance (Real Growth Rates)
Actual Projections Difference from April 2015 WEO projections
2010 2011 2012 2013 2014 2015 2016 2015 2016
World output 5.4 4.2 3.4 3.3 3.4 3.1 3.6 -0.4 -0.2Advanced economies 3.1 1.7 1.2 1.1 1.8 2.0 2.2 -0.4 -0.2
USA 2.5 1.6 2.2 1.5 2.4 2.6 2.8 -0.5 -0.3Euro area 2.0 1.6 -0.8 0.3 0.9 1.5 1.6 0.0 0.0Japan 4.7 -0.5 1.7 1.6 -0.1 0.6 1.0 -0.4 -0.2United Kingdom 1.9 1.6 0.7 1.7 3.0 4.0 4.5 -0.2 -0.1
Emerging and Developing Economies
7.5 6.3 5.2 5.0 4.6 6.5 6.4 -0.3 -0.2
Emerging and Developing Asia
9.6 7.9 6.8 7.0 6.8 6.6 6.4 -0.1 0.0
China 10.6 9.5 7.7 7.7 7.3 6.8 6.3 0.0 0.0India 10.3 6.6 5.1 6.9 7.3 7.3 7.5 -0.2 0.0Asean-5 5.1 4.6 4.6 4.9 -0.6 -0.4
Sub-Saharan 6.6 5.0 4.3 5.2 5.0 3.8 4.3 -0.7 -0.8Excluding Nigeria and South Africa
6.2 5.9 5.2 6.4 5.7 4.7 5.5
Nigeria 10.0 4.9 4.3 5.4 6.3 4.0 4.3 -0.8 -0.7South Africa 3.0 3.2 2.2 2.2 1.5 1.4 1.3 -0.6 -0.8Oil Exporting 8.5 4.6 3.8 5.7 5.9 3.6 4.2Oil Importing (Excl RSA) 6.9 6.6 6.2 6.4 6.1 5.4 6.1
SADC 4.2 4.3 3.7 4.2 3.5 3.0 3.1 0.0 0.0Excluding South AfricaEAC Overall 7.4 6.9 4.5 5.8 5.9 6.1 6.6
Kenya 8.4 6.1 4.5 5.7 5.3 6.5 6.8Rwanda 6.3 7.5 8.8 4.7 6.9 6.5 7.0Tanzania 6.4 7.9 5.1 7.3 7.2 6.9 7.0Uganda 7.7 6.8 2.6 3.9 4.9 5.2 5.5Burundi 5.1 4.2 4.0 4.0 4.7 -7.2 5.2
MemorandumWorld Commodity prices (U.S. dollars)
Oil -0.9 -7.5 -46.4 -2.4 -6.8 -15.3Nonfuel -1.2 -4.0 -16.9 -5.1 -2.8 -4.1
Note: Asean-5 includes Indonesia, Malaysia, Thailand, Philippines, and Vietnam.Oil prices are simple average prices of UK Brent Dubai Fateh, and West Texas intermediate crude oil.Nonfuel are average based on world commodity export weightsSource: IMF, World Economic Outlook, October, 2015; SSA Region Economic Outlook, October, 2015
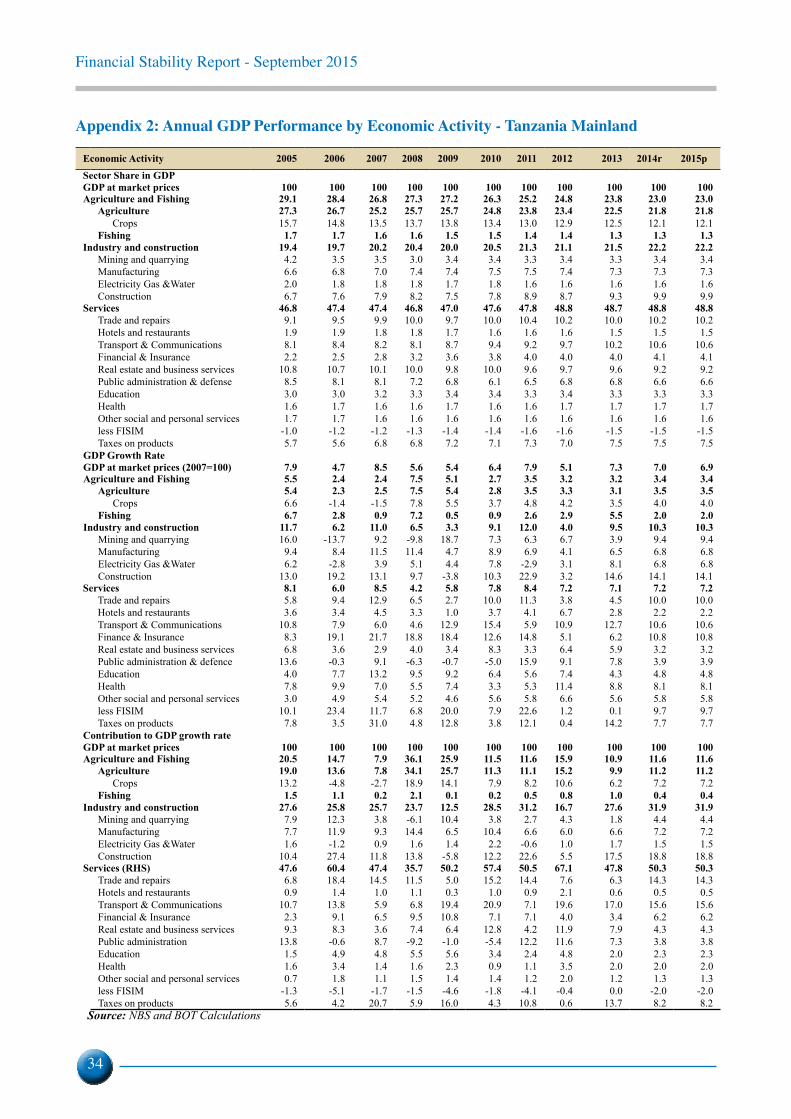
Financial Stability Report - September 2015
34
Appendix 2: Annual GDP Performance by Economic Activity - Tanzania Mainland
Economic Activity 2005 2006 2007 2008 2009 2010 2011 2012 2013 2014r 2015pSector Share in GDP GDP at market prices 100 100 100 100 100 100 100 100 100 100 100Agriculture and Fishing 29.1 28.4 26.8 27.3 27.2 26.3 25.2 24.8 23.8 23.0 23.0
Agriculture 27.3 26.7 25.2 25.7 25.7 24.8 23.8 23.4 22.5 21.8 21.8Crops 15.7 14.8 13.5 13.7 13.8 13.4 13.0 12.9 12.5 12.1 12.1
Fishing 1.7 1.7 1.6 1.6 1.5 1.5 1.4 1.4 1.3 1.3 1.3Industry and construction 19.4 19.7 20.2 20.4 20.0 20.5 21.3 21.1 21.5 22.2 22.2
Mining and quarrying 4.2 3.5 3.5 3.0 3.4 3.4 3.3 3.4 3.3 3.4 3.4Manufacturing 6.6 6.8 7.0 7.4 7.4 7.5 7.5 7.4 7.3 7.3 7.3Electricity Gas &Water 2.0 1.8 1.8 1.8 1.7 1.8 1.6 1.6 1.6 1.6 1.6Construction 6.7 7.6 7.9 8.2 7.5 7.8 8.9 8.7 9.3 9.9 9.9
Services 46.8 47.4 47.4 46.8 47.0 47.6 47.8 48.8 48.7 48.8 48.8Trade and repairs 9.1 9.5 9.9 10.0 9.7 10.0 10.4 10.2 10.0 10.2 10.2Hotels and restaurants 1.9 1.9 1.8 1.8 1.7 1.6 1.6 1.6 1.5 1.5 1.5Transport & Communications 8.1 8.4 8.2 8.1 8.7 9.4 9.2 9.7 10.2 10.6 10.6Financial & Insurance 2.2 2.5 2.8 3.2 3.6 3.8 4.0 4.0 4.0 4.1 4.1Real estate and business services 10.8 10.7 10.1 10.0 9.8 10.0 9.6 9.7 9.6 9.2 9.2Public administration & defense 8.5 8.1 8.1 7.2 6.8 6.1 6.5 6.8 6.8 6.6 6.6Education 3.0 3.0 3.2 3.3 3.4 3.4 3.3 3.4 3.3 3.3 3.3Health 1.6 1.7 1.6 1.6 1.7 1.6 1.6 1.7 1.7 1.7 1.7Other social and personal services 1.7 1.7 1.6 1.6 1.6 1.6 1.6 1.6 1.6 1.6 1.6less FISIM -1.0 -1.2 -1.2 -1.3 -1.4 -1.4 -1.6 -1.6 -1.5 -1.5 -1.5Taxes on products 5.7 5.6 6.8 6.8 7.2 7.1 7.3 7.0 7.5 7.5 7.5
GDP Growth RateGDP at market prices (2007=100) 7.9 4.7 8.5 5.6 5.4 6.4 7.9 5.1 7.3 7.0 6.9Agriculture and Fishing 5.5 2.4 2.4 7.5 5.1 2.7 3.5 3.2 3.2 3.4 3.4
Agriculture 5.4 2.3 2.5 7.5 5.4 2.8 3.5 3.3 3.1 3.5 3.5Crops 6.6 -1.4 -1.5 7.8 5.5 3.7 4.8 4.2 3.5 4.0 4.0
Fishing 6.7 2.8 0.9 7.2 0.5 0.9 2.6 2.9 5.5 2.0 2.0Industry and construction 11.7 6.2 11.0 6.5 3.3 9.1 12.0 4.0 9.5 10.3 10.3
Mining and quarrying 16.0 -13.7 9.2 -9.8 18.7 7.3 6.3 6.7 3.9 9.4 9.4Manufacturing 9.4 8.4 11.5 11.4 4.7 8.9 6.9 4.1 6.5 6.8 6.8Electricity Gas &Water 6.2 -2.8 3.9 5.1 4.4 7.8 -2.9 3.1 8.1 6.8 6.8Construction 13.0 19.2 13.1 9.7 -3.8 10.3 22.9 3.2 14.6 14.1 14.1
Services 8.1 6.0 8.5 4.2 5.8 7.8 8.4 7.2 7.1 7.2 7.2Trade and repairs 5.8 9.4 12.9 6.5 2.7 10.0 11.3 3.8 4.5 10.0 10.0Hotels and restaurants 3.6 3.4 4.5 3.3 1.0 3.7 4.1 6.7 2.8 2.2 2.2Transport & Communications 10.8 7.9 6.0 4.6 12.9 15.4 5.9 10.9 12.7 10.6 10.6Finance & Insurance 8.3 19.1 21.7 18.8 18.4 12.6 14.8 5.1 6.2 10.8 10.8Real estate and business services 6.8 3.6 2.9 4.0 3.4 8.3 3.3 6.4 5.9 3.2 3.2Public administration & defence 13.6 -0.3 9.1 -6.3 -0.7 -5.0 15.9 9.1 7.8 3.9 3.9Education 4.0 7.7 13.2 9.5 9.2 6.4 5.6 7.4 4.3 4.8 4.8Health 7.8 9.9 7.0 5.5 7.4 3.3 5.3 11.4 8.8 8.1 8.1Other social and personal services 3.0 4.9 5.4 5.2 4.6 5.6 5.8 6.6 5.6 5.8 5.8less FISIM 10.1 23.4 11.7 6.8 20.0 7.9 22.6 1.2 0.1 9.7 9.7Taxes on products 7.8 3.5 31.0 4.8 12.8 3.8 12.1 0.4 14.2 7.7 7.7
Contribution to GDP growth rateGDP at market prices 100 100 100 100 100 100 100 100 100 100 100Agriculture and Fishing 20.5 14.7 7.9 36.1 25.9 11.5 11.6 15.9 10.9 11.6 11.6
Agriculture 19.0 13.6 7.8 34.1 25.7 11.3 11.1 15.2 9.9 11.2 11.2Crops 13.2 -4.8 -2.7 18.9 14.1 7.9 8.2 10.6 6.2 7.2 7.2
Fishing 1.5 1.1 0.2 2.1 0.1 0.2 0.5 0.8 1.0 0.4 0.4Industry and construction 27.6 25.8 25.7 23.7 12.5 28.5 31.2 16.7 27.6 31.9 31.9
Mining and quarrying 7.9 12.3 3.8 -6.1 10.4 3.8 2.7 4.3 1.8 4.4 4.4Manufacturing 7.7 11.9 9.3 14.4 6.5 10.4 6.6 6.0 6.6 7.2 7.2Electricity Gas &Water 1.6 -1.2 0.9 1.6 1.4 2.2 -0.6 1.0 1.7 1.5 1.5Construction 10.4 27.4 11.8 13.8 -5.8 12.2 22.6 5.5 17.5 18.8 18.8
Services (RHS) 47.6 60.4 47.4 35.7 50.2 57.4 50.5 67.1 47.8 50.3 50.3Trade and repairs 6.8 18.4 14.5 11.5 5.0 15.2 14.4 7.6 6.3 14.3 14.3Hotels and restaurants 0.9 1.4 1.0 1.1 0.3 1.0 0.9 2.1 0.6 0.5 0.5Transport & Communications 10.7 13.8 5.9 6.8 19.4 20.9 7.1 19.6 17.0 15.6 15.6Financial & Insurance 2.3 9.1 6.5 9.5 10.8 7.1 7.1 4.0 3.4 6.2 6.2Real estate and business services 9.3 8.3 3.6 7.4 6.4 12.8 4.2 11.9 7.9 4.3 4.3Public administration 13.8 -0.6 8.7 -9.2 -1.0 -5.4 12.2 11.6 7.3 3.8 3.8Education 1.5 4.9 4.8 5.5 5.6 3.4 2.4 4.8 2.0 2.3 2.3Health 1.6 3.4 1.4 1.6 2.3 0.9 1.1 3.5 2.0 2.0 2.0Other social and personal services 0.7 1.8 1.1 1.5 1.4 1.4 1.2 2.0 1.2 1.3 1.3less FISIM -1.3 -5.1 -1.7 -1.5 -4.6 -1.8 -4.1 -0.4 0.0 -2.0 -2.0Taxes on products 5.6 4.2 20.7 5.9 16.0 4.3 10.8 0.6 13.7 8.2 8.2
Source: NBS and BOT Calculations
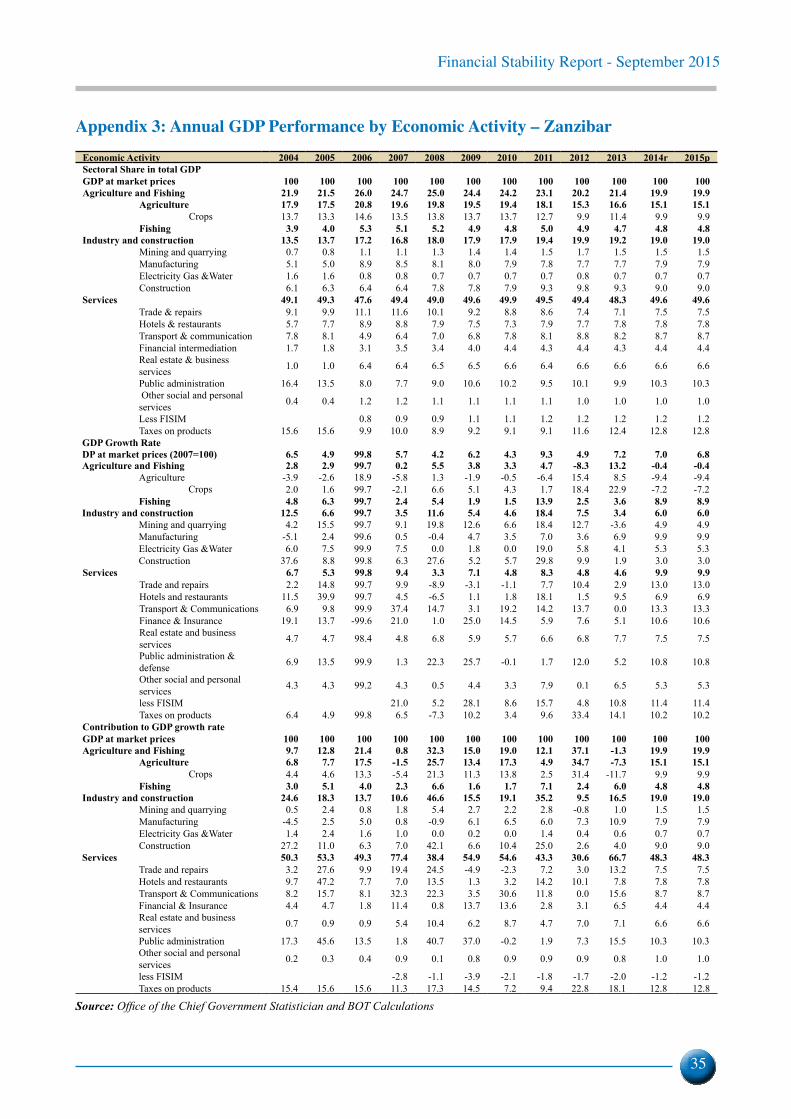
Financial Stability Report - September 2015
35
Appendix 3: Annual GDP Performance by Economic Activity – ZanzibarEconomic Activity 2004 2005 2006 2007 2008 2009 2010 2011 2012 2013 2014r 2015pSectoral Share in total GDP GDP at market prices 100 100 100 100 100 100 100 100 100 100 100 100Agriculture and Fishing 21.9 21.5 26.0 24.7 25.0 24.4 24.2 23.1 20.2 21.4 19.9 19.9
Agriculture 17.9 17.5 20.8 19.6 19.8 19.5 19.4 18.1 15.3 16.6 15.1 15.1Crops 13.7 13.3 14.6 13.5 13.8 13.7 13.7 12.7 9.9 11.4 9.9 9.9
Fishing 3.9 4.0 5.3 5.1 5.2 4.9 4.8 5.0 4.9 4.7 4.8 4.8Industry and construction 13.5 13.7 17.2 16.8 18.0 17.9 17.9 19.4 19.9 19.2 19.0 19.0
Mining and quarrying 0.7 0.8 1.1 1.1 1.3 1.4 1.4 1.5 1.7 1.5 1.5 1.5Manufacturing 5.1 5.0 8.9 8.5 8.1 8.0 7.9 7.8 7.7 7.7 7.9 7.9Electricity Gas &Water 1.6 1.6 0.8 0.8 0.7 0.7 0.7 0.7 0.8 0.7 0.7 0.7Construction 6.1 6.3 6.4 6.4 7.8 7.8 7.9 9.3 9.8 9.3 9.0 9.0
Services 49.1 49.3 47.6 49.4 49.0 49.6 49.9 49.5 49.4 48.3 49.6 49.6Trade & repairs 9.1 9.9 11.1 11.6 10.1 9.2 8.8 8.6 7.4 7.1 7.5 7.5Hotels & restaurants 5.7 7.7 8.9 8.8 7.9 7.5 7.3 7.9 7.7 7.8 7.8 7.8Transport & communication 7.8 8.1 4.9 6.4 7.0 6.8 7.8 8.1 8.8 8.2 8.7 8.7Financial intermediation 1.7 1.8 3.1 3.5 3.4 4.0 4.4 4.3 4.4 4.3 4.4 4.4Real estate & business services 1.0 1.0 6.4 6.4 6.5 6.5 6.6 6.4 6.6 6.6 6.6 6.6
Public administration 16.4 13.5 8.0 7.7 9.0 10.6 10.2 9.5 10.1 9.9 10.3 10.3 Other social and personal services 0.4 0.4 1.2 1.2 1.1 1.1 1.1 1.1 1.0 1.0 1.0 1.0
Less FISIM 0.8 0.9 0.9 1.1 1.1 1.2 1.2 1.2 1.2 1.2Taxes on products 15.6 15.6 9.9 10.0 8.9 9.2 9.1 9.1 11.6 12.4 12.8 12.8
GDP Growth RateDP at market prices (2007=100) 6.5 4.9 99.8 5.7 4.2 6.2 4.3 9.3 4.9 7.2 7.0 6.8Agriculture and Fishing 2.8 2.9 99.7 0.2 5.5 3.8 3.3 4.7 -8.3 13.2 -0.4 -0.4
Agriculture -3.9 -2.6 18.9 -5.8 1.3 -1.9 -0.5 -6.4 15.4 8.5 -9.4 -9.4Crops 2.0 1.6 99.7 -2.1 6.6 5.1 4.3 1.7 18.4 22.9 -7.2 -7.2
Fishing 4.8 6.3 99.7 2.4 5.4 1.9 1.5 13.9 2.5 3.6 8.9 8.9Industry and construction 12.5 6.6 99.7 3.5 11.6 5.4 4.6 18.4 7.5 3.4 6.0 6.0
Mining and quarrying 4.2 15.5 99.7 9.1 19.8 12.6 6.6 18.4 12.7 -3.6 4.9 4.9Manufacturing -5.1 2.4 99.6 0.5 -0.4 4.7 3.5 7.0 3.6 6.9 9.9 9.9Electricity Gas &Water 6.0 7.5 99.9 7.5 0.0 1.8 0.0 19.0 5.8 4.1 5.3 5.3Construction 37.6 8.8 99.8 6.3 27.6 5.2 5.7 29.8 9.9 1.9 3.0 3.0
Services 6.7 5.3 99.8 9.4 3.3 7.1 4.8 8.3 4.8 4.6 9.9 9.9Trade and repairs 2.2 14.8 99.7 9.9 -8.9 -3.1 -1.1 7.7 10.4 2.9 13.0 13.0Hotels and restaurants 11.5 39.9 99.7 4.5 -6.5 1.1 1.8 18.1 1.5 9.5 6.9 6.9Transport & Communications 6.9 9.8 99.9 37.4 14.7 3.1 19.2 14.2 13.7 0.0 13.3 13.3Finance & Insurance 19.1 13.7 -99.6 21.0 1.0 25.0 14.5 5.9 7.6 5.1 10.6 10.6Real estate and business services 4.7 4.7 98.4 4.8 6.8 5.9 5.7 6.6 6.8 7.7 7.5 7.5
Public administration & defense 6.9 13.5 99.9 1.3 22.3 25.7 -0.1 1.7 12.0 5.2 10.8 10.8
Other social and personal services 4.3 4.3 99.2 4.3 0.5 4.4 3.3 7.9 0.1 6.5 5.3 5.3
less FISIM 21.0 5.2 28.1 8.6 15.7 4.8 10.8 11.4 11.4Taxes on products 6.4 4.9 99.8 6.5 -7.3 10.2 3.4 9.6 33.4 14.1 10.2 10.2
Contribution to GDP growth rateGDP at market prices 100 100 100 100 100 100 100 100 100 100 100 100Agriculture and Fishing 9.7 12.8 21.4 0.8 32.3 15.0 19.0 12.1 37.1 -1.3 19.9 19.9
Agriculture 6.8 7.7 17.5 -1.5 25.7 13.4 17.3 4.9 34.7 -7.3 15.1 15.1Crops 4.4 4.6 13.3 -5.4 21.3 11.3 13.8 2.5 31.4 -11.7 9.9 9.9
Fishing 3.0 5.1 4.0 2.3 6.6 1.6 1.7 7.1 2.4 6.0 4.8 4.8Industry and construction 24.6 18.3 13.7 10.6 46.6 15.5 19.1 35.2 9.5 16.5 19.0 19.0
Mining and quarrying 0.5 2.4 0.8 1.8 5.4 2.7 2.2 2.8 -0.8 1.0 1.5 1.5Manufacturing -4.5 2.5 5.0 0.8 -0.9 6.1 6.5 6.0 7.3 10.9 7.9 7.9Electricity Gas &Water 1.4 2.4 1.6 1.0 0.0 0.2 0.0 1.4 0.4 0.6 0.7 0.7Construction 27.2 11.0 6.3 7.0 42.1 6.6 10.4 25.0 2.6 4.0 9.0 9.0
Services 50.3 53.3 49.3 77.4 38.4 54.9 54.6 43.3 30.6 66.7 48.3 48.3Trade and repairs 3.2 27.6 9.9 19.4 24.5 -4.9 -2.3 7.2 3.0 13.2 7.5 7.5Hotels and restaurants 9.7 47.2 7.7 7.0 13.5 1.3 3.2 14.2 10.1 7.8 7.8 7.8Transport & Communications 8.2 15.7 8.1 32.3 22.3 3.5 30.6 11.8 0.0 15.6 8.7 8.7Financial & Insurance 4.4 4.7 1.8 11.4 0.8 13.7 13.6 2.8 3.1 6.5 4.4 4.4Real estate and business services 0.7 0.9 0.9 5.4 10.4 6.2 8.7 4.7 7.0 7.1 6.6 6.6
Public administration 17.3 45.6 13.5 1.8 40.7 37.0 -0.2 1.9 7.3 15.5 10.3 10.3Other social and personal services 0.2 0.3 0.4 0.9 0.1 0.8 0.9 0.9 0.9 0.8 1.0 1.0
less FISIM -2.8 -1.1 -3.9 -2.1 -1.8 -1.7 -2.0 -1.2 -1.2Taxes on products 15.4 15.6 15.6 11.3 17.3 14.5 7.2 9.4 22.8 18.1 12.8 12.8
Source: Office of the Chief Government Statistician and BOT Calculations
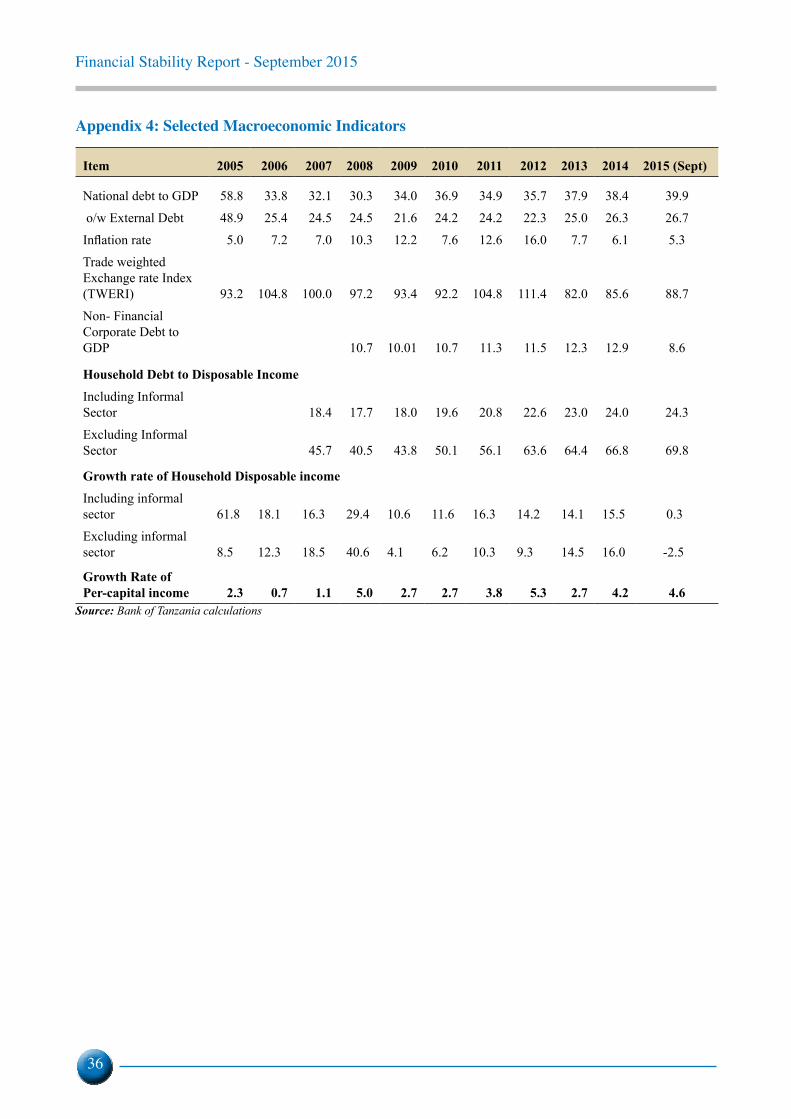
Financial Stability Report - September 2015
36
Appendix 4: Selected Macroeconomic Indicators
Item 2005 2006 2007 2008 2009 2010 2011 2012 2013 2014 2015 (Sept)
National debt to GDP 58.8 33.8 32.1 30.3 34.0 36.9 34.9 35.7 37.9 38.4 39.9
o/w External Debt 48.9 25.4 24.5 24.5 21.6 24.2 24.2 22.3 25.0 26.3 26.7
Inflation rate 5.0 7.2 7.0 10.3 12.2 7.6 12.6 16.0 7.7 6.1 5.3
Trade weighted Exchange rate Index (TWERI) 93.2 104.8 100.0 97.2 93.4 92.2 104.8 111.4 82.0 85.6 88.7
Non- Financial Corporate Debt to GDP 10.7 10.01 10.7 11.3 11.5 12.3 12.9 8.6
Household Debt to Disposable Income
Including Informal Sector 18.4 17.7 18.0 19.6 20.8 22.6 23.0 24.0 24.3
Excluding Informal Sector 45.7 40.5 43.8 50.1 56.1 63.6 64.4 66.8 69.8
Growth rate of Household Disposable income
Including informal sector 61.8 18.1 16.3 29.4 10.6 11.6 16.3 14.2 14.1 15.5 0.3
Excluding informal sector 8.5 12.3 18.5 40.6 4.1 6.2 10.3 9.3 14.5 16.0 -2.5
Growth Rate of Per-capital income 2.3 0.7 1.1 5.0 2.7 2.7 3.8 5.3 2.7 4.2 4.6
Source: Bank of Tanzania calculations
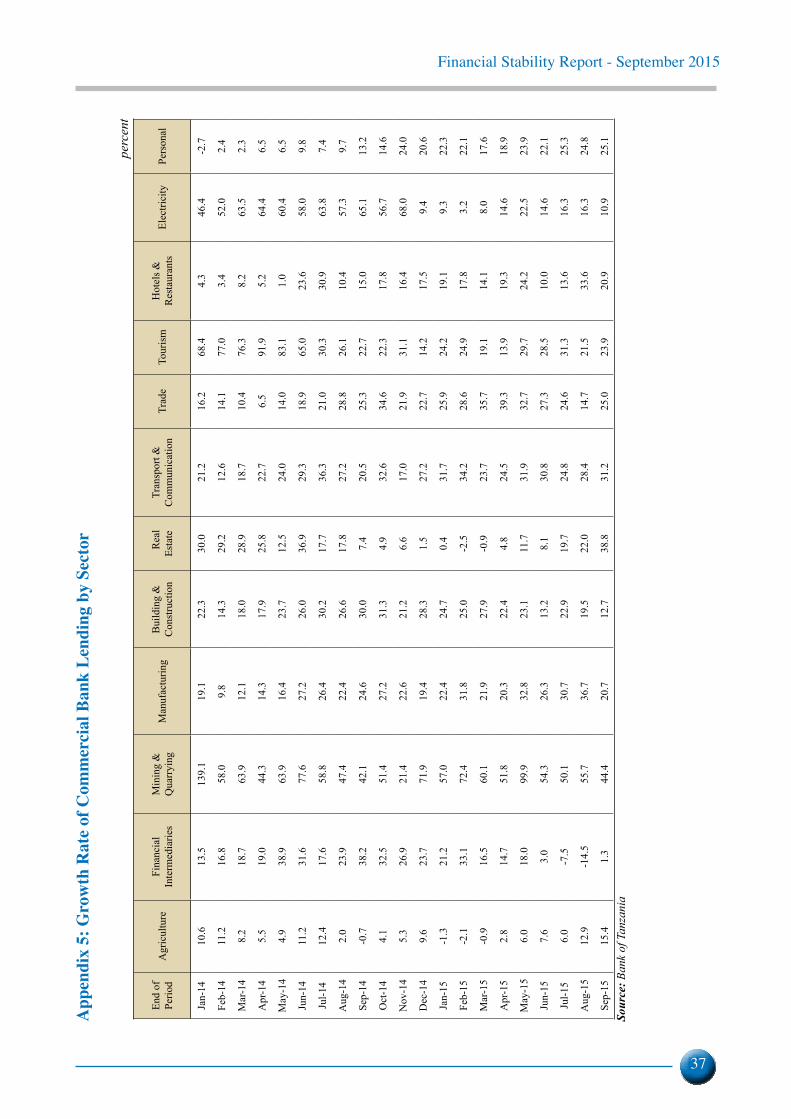
Financial Stability Report - September 2015
37
App
endi
x 5:
Gro
wth
Rat
e of
Com
mer
cial
Ban
k Le
ndin
g by
Sec
tor
perc
ent
End
of
Perio
dA
gric
ultu
reFi
nanc
ial
Inte
rmed
iarie
sM
inin
g &
Q
uarr
ying
Man
ufac
turin
gB
uild
ing
&
Con
stru
ctio
n
Rea
l Es
tate
Tr
ansp
ort &
C
omm
unic
atio
nTr
ade
Tour
ism
Hot
els &
R
esta
uran
tsEl
ectri
city
Pe
rson
al
Jan-
1410
.613
.513
9.1
19.1
22.3
30.0
21.2
16.2
68.4
4.3
46.4
-2.7
Feb-
1411
.216
.858
.09.
814
.329
.212
.614
.177
.03.
452
.02.
4
Mar
-14
8.2
18.7
63.9
12.1
18.0
28.9
18.7
10.4
76.3
8.2
63.5
2.3
Apr
-14
5.5
19.0
44.3
14.3
17.9
25.8
22.7
6.5
91.9
5.2
64.4
6.5
May
-14
4.9
38.9
63.9
16.4
23.7
12.5
24.0
14.0
83.1
1.0
60.4
6.5
Jun-
1411
.231
.677
.627
.226
.036
.929
.318
.965
.023
.658
.09.
8
Jul-1
412
.417
.658
.826
.430
.217
.736
.321
.030
.330
.963
.87.
4
Aug
-14
2.0
23.9
47.4
22.4
26.6
17.8
27.2
28.8
26.1
10.4
57.3
9.7
Sep-
14-0
.738
.242
.124
.630
.07.
420
.525
.322
.715
.065
.113
.2
Oct
-14
4.1
32.5
51.4
27.2
31.3
4.9
32.6
34.6
22.3
17.8
56.7
14.6
Nov
-14
5.3
26.9
21.4
22.6
21.2
6.6
17.0
21.9
31.1
16.4
68.0
24.0
Dec
-14
9.6
23.7
71.9
19.4
28.3
1.5
27.2
22.7
14.2
17.5
9.4
20.6
Jan-
15-1
.321
.257
.022
.424
.70.
431
.725
.924
.219
.19.
322
.3
Feb-
15-2
.133
.172
.431
.825
.0-2
.534
.228
.624
.917
.83.
222
.1
Mar
-15
-0.9
16.5
60.1
21.9
27.9
-0.9
23.7
35.7
19.1
14.1
8.0
17.6
Apr
-15
2.8
14.7
51.8
20.3
22.4
4.8
24.5
39.3
13.9
19.3
14.6
18.9
May
-15
6.0
18.0
99.9
32.8
23.1
11.7
31.9
32.7
29.7
24.2
22.5
23.9
Jun-
157.
63.
054
.326
.313
.28.
130
.827
.328
.510
.014
.622
.1
Jul-1
56.
0-7
.550
.130
.722
.919
.724
.824
.631
.313
.616
.325
.3
Aug
-15
12.9
-14.
555
.736
.719
.522
.028
.414
.721
.533
.616
.324
.8
Sep-
1515
.41.
344
.420
.712
.738
.831
.225
.023
.920
.910
.925
.1So
urce
: Ban
k of
Tan
zani
a
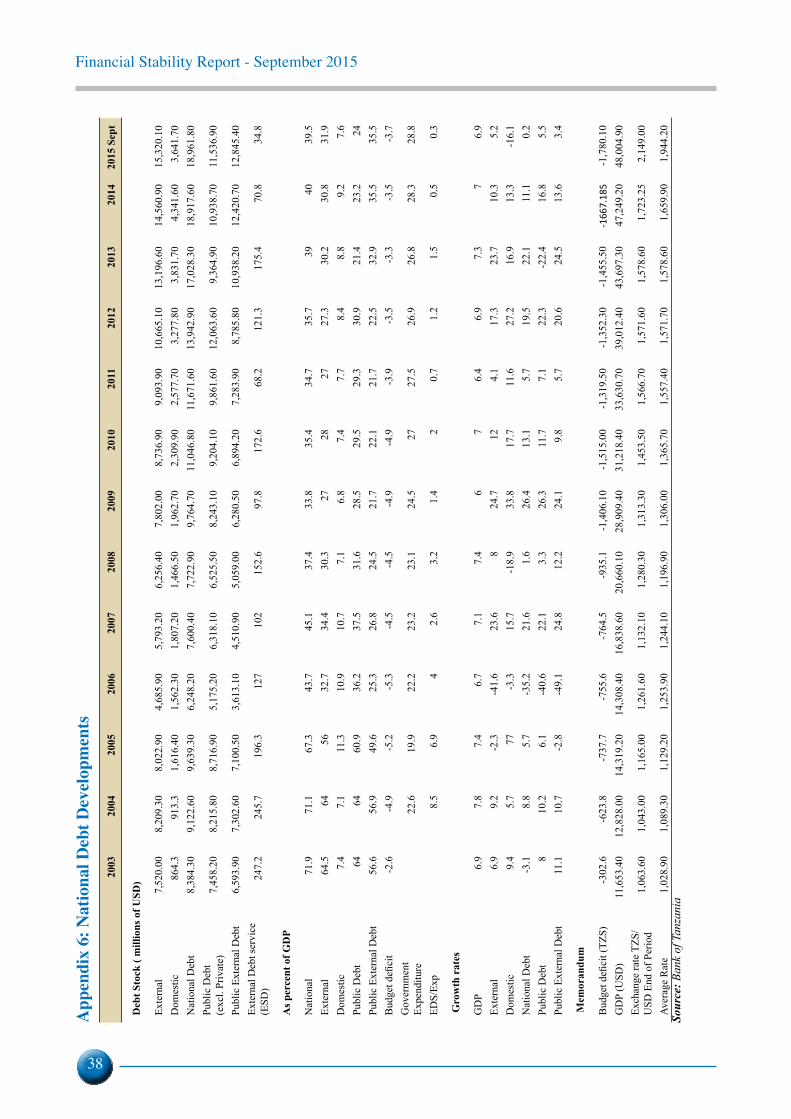
Financial Stability Report - September 2015
38
App
endi
x 6:
Nat
iona
l Deb
t Dev
elop
men
ts
20
0320
0420
0520
0620
0720
0820
0920
1020
1120
1220
1320
1420
15 S
ept
Deb
t Sto
ck (
mill
ions
of U
SD)
Exte
rnal
7,
520.
008,
209.
308,
022.
904,
685.
905,
793.
206,
256.
407,
802.
008,
736.
909,
093.
9010
,665
.10
13,1
96.6
014
,560
.90
15,3
20.1
0D
omes
tic86
4.3
913.
31,
616.
401,
562.
301,
807.
201,
466.
501,
962.
702,
309.
902,
577.
703,
277.
803,
831.
704,
341.
603,
641.
70N
atio
nal D
ebt
8,38
4.30
9,12
2.60
9,63
9.30
6,24
8.20
7,60
0.40
7,72
2.90
9,76
4.70
11,0
46.8
011
,671
.60
13,9
42.9
017
,028
.30
18,9
17.6
018
,961
.80
Publ
ic D
ebt
(exc
l. Pr
ivat
e)7,
458.
208,
215.
808,
716.
905,
175.
206,
318.
106,
525.
508,
243.
109,
204.
109,
861.
6012
,063
.60
9,36
4.90
10,9
38.7
011
,536
.90
Publ
ic E
xter
nal D
ebt
6,59
3.90
7,30
2.60
7,10
0.50
3,61
3.10
4,51
0.90
5,05
9.00
6,28
0.50
6,89
4.20
7,28
3.90
8,78
5.80
10,9
38.2
012
,420
.70
12,8
45.4
0Ex
tern
al D
ebt s
ervi
ce
(ESD
)24
7.2
245.
719
6.3
127
102
152.
697
.817
2.6
68.2
121.
317
5.4
70.8
34.8
As p
erce
nt o
f GD
P
Nat
iona
l 71
.971
.167
.343
.745
.137
.433
.835
.434
.735
.739
4039
.5Ex
tern
al
64.5
6456
32.7
34.4
30.3
2728
2727
.330
.230
.831
.9D
omes
tic7.
47.
111
.310
.910
.77.
16.
87.
47.
78.
48.
89.
27.
6Pu
blic
Deb
t64
6460
.936
.237
.531
.628
.529
.529
.330
.921
.423
.224
Publ
ic E
xter
nal D
ebt
56.6
56.9
49.6
25.3
26.8
24.5
21.7
22.1
21.7
22.5
32.9
35.5
35.5
Bud
get d
efici
t -2
.6-4
.9-5
.2-5
.3-4
.5-4
.5-4
.9-4
.9-3
.9-3
.5-3
.3-3
.5-3
.7G
over
nmen
t Ex
pend
iture
22
.619
.922
.223
.223
.124
.527
27.5
26.9
26.8
28.3
28.8
EDS/
Exp
8.
56.
94
2.6
3.2
1.4
20.
71.
21.
50.
50.
3
Gro
wth
rat
es
GD
P 6.
97.
87.
46.
77.
17.
46
76.
46.
97.
37
6.9
Exte
rnal
6.
99.
2-2
.3-4
1.6
23.6
824
.712
4.1
17.3
23.7
10.3
5.2
Dom
estic
9.4
5.7
77-3
.315
.7-1
8.9
33.8
17.7
11.6
27.2
16.9
13.3
-16.
1N
atio
nal D
ebt
-3.1
8.8
5.7
-35.
221
.61.
626
.413
.15.
719
.522
.111
.10.
2Pu
blic
Deb
t8
10.2
6.1
-40.
622
.13.
326
.311
.77.
122
.3-2
2.4
16.8
5.5
Publ
ic E
xter
nal D
ebt
11.1
10.7
-2.8
-49.
124
.812
.224
.19.
85.
720
.624
.513
.63.
4
Mem
oran
dum
Bud
get d
efici
t (TZ
S)-3
02.6
-623
.8-7
37.7
-755
.6-7
64.5
-935
.1-1
,406
.10
-1,5
15.0
0-1
,319
.50
-1,3
52.3
0-1
,455
.50
-166
7.18
5-1
,780
.10
GD
P (U
SD)
11,6
53.4
012
,828
.00
14,3
19.2
014
,308
.40
16,8
38.6
020
,660
.10
28,9
09.4
031
,218
.40
33,6
30.7
039
,012
.40
43,6
97.3
047
,249
.20
48,0
04.9
0Ex
chan
ge ra
te T
ZS/
USD
End
of P
erio
d 1,
063.
601,
043.
001,
165.
001,
261.
601,
132.
101,
280.
301,
313.
301,
453.
501,
566.
701,
571.
601,
578.
601,
723.
252,
149.
00
Aver
age
Rat
e 1,
028.
901,
089.
301,
129.
201,
253.
901,
244.
101,
196.
901,
306.
001,
365.
701,
557.
401,
571.
701,
578.
601,
659.
901,
944.
20So
urce
: Ban
k of
Tan
zani
a
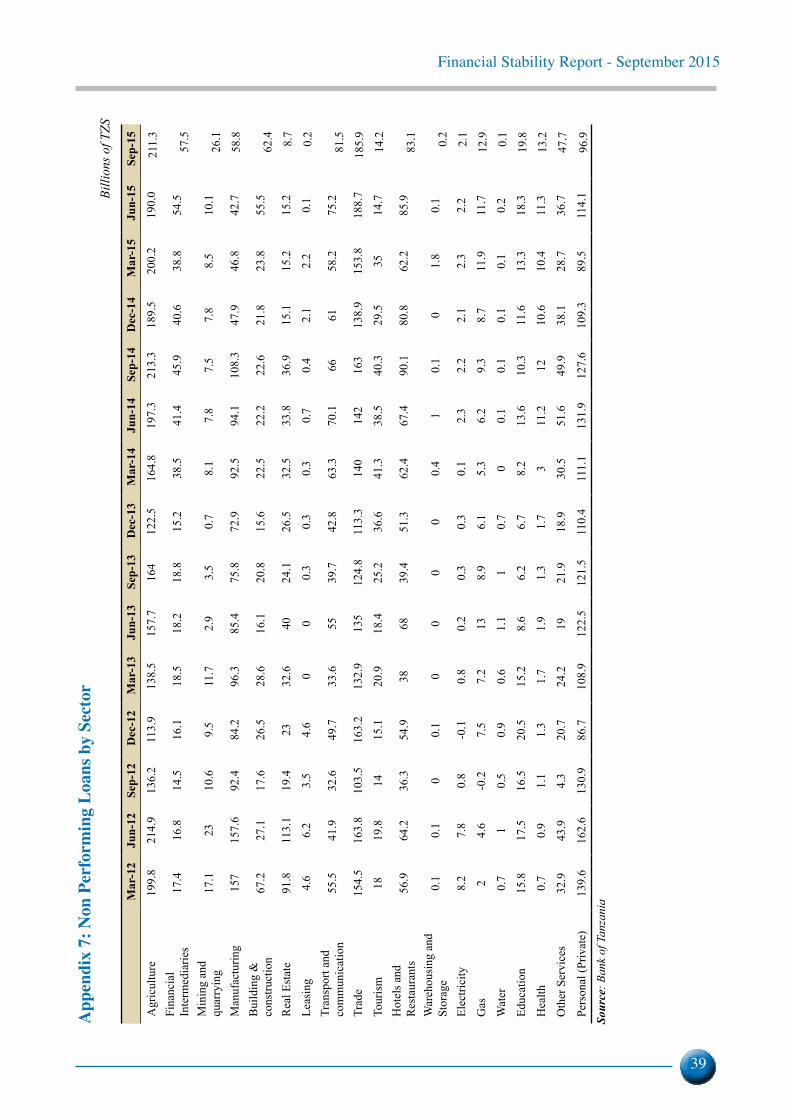
Financial Stability Report - September 2015
39
App
endi
x 7:
Non
Per
form
ing
Loan
s by
Sect
or
B
illio
ns o
f TZS
M
ar-1
2Ju
n-12
Sep-
12D
ec-1
2M
ar-1
3Ju
n-13
Sep-
13D
ec-1
3M
ar-1
4Ju
n-14
Sep-
14D
ec-1
4M
ar-1
5Ju
n-15
Sep-
15
Agr
icul
ture
199.
821
4.9
136.
211
3.9
138.
515
7.7
164
122.
516
4.8
197.
321
3.3
189.
520
0.2
190.
021
1.3
Fina
ncia
l In
term
edia
ries
17.4
16.8
14.5
16.1
18.5
18.2
18.8
15.2
38.5
41.4
45.9
40.6
38.8
54.5
57.5
Min
ing
and
quar
ryin
g17
.123
10.6
9.5
11.7
2.9
3.5
0.7
8.1
7.8
7.5
7.8
8.5
10.1
26.1
Man
ufac
turin
g15
715
7.6
92.4
84.2
96.3
85.4
75.8
72.9
92.5
94.1
108.
347
.946
.842
.758
.8B
uild
ing
&
cons
truct
ion
67.2
27.1
17.6
26.5
28.6
16.1
20.8
15.6
22.5
22.2
22.6
21.8
23.8
55.5
62.4
Rea
l Est
ate
91.8
113.
119
.423
32.6
4024
.126
.532
.533
.836
.915
.115
.215
.28.
7Le
asin
g4.
66.
23.
54.
60
00.
30.
30.
30.
70.
42.
12.
20.
10.
2Tr
ansp
ort a
nd
com
mun
icat
ion
55.5
41.9
32.6
49.7
33.6
5539
.742
.863
.370
.166
6158
.275
.281
.5Tr
ade
154.
516
3.8
103.
516
3.2
132.
913
512
4.8
113.
314
014
216
313
8.9
153.
818
8.7
185.
9To
uris
m18
19.8
1415
.120
.918
.425
.236
.641
.338
.540
.329
.535
14.7
14.2
Hot
els a
nd
Res
taur
ants
56.9
64.2
36.3
54.9
3868
39.4
51.3
62.4
67.4
90.1
80.8
62.2
85.9
83.1
War
ehou
sing
and
St
orag
e0.
10.
10
0.1
00
00
0.4
10.
10
1.8
0.1
0.2
Elec
trici
ty8.
27.
80.
8-0
.10.
80.
20.
30.
30.
12.
32.
22.
12.
32.
22.
1G
as2
4.6
-0.2
7.5
7.2
138.
96.
15.
36.
29.
38.
711
.911
.712
.9W
ater
0.7
10.
50.
90.
61.
11
0.7
00.
10.
10.
10.
10.
20.
1Ed
ucat
ion
15.8
17.5
16.5
20.5
15.2
8.6
6.2
6.7
8.2
13.6
10.3
11.6
13.3
18.3
19.8
Hea
lth0.
70.
91.
11.
31.
71.
91.
31.
73
11.2
1210
.610
.411
.313
.2O
ther
Ser
vice
s32
.943
.94.
320
.724
.219
21.9
18.9
30.5
51.6
49.9
38.1
28.7
36.7
47.7
Pers
onal
(Priv
ate)
139.
616
2.6
130.
986
.710
8.9
122.
512
1.5
110.
411
1.1
131.
912
7.6
109.
389
.511
4.1
96.9
Sour
ce: B
ank
of T
anza
nia
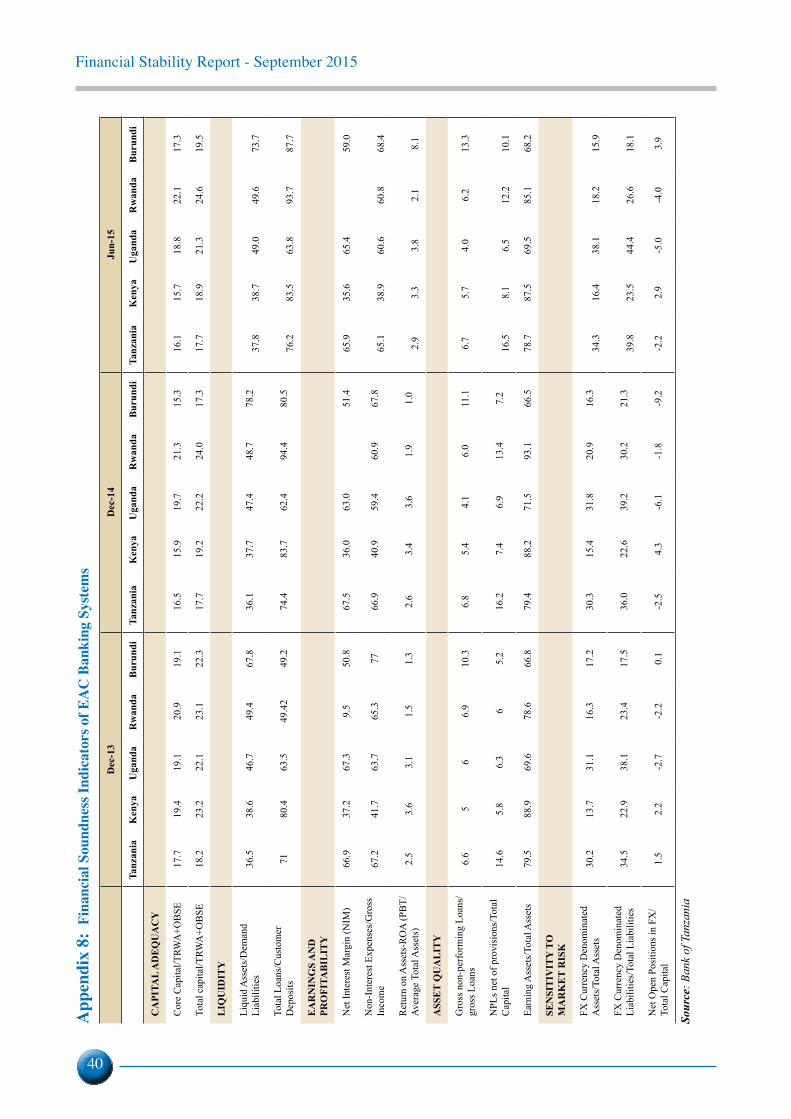
Financial Stability Report - September 2015
40
App
endi
x 8:
Fin
anci
al S
ound
ness
Indi
cato
rs o
f EA
C B
anki
ng S
yste
ms
D
ec-1
3D
ec-1
4Ju
n-15
Ta
nzan
iaK
enya
Uga
nda
Rw
anda
Bur
undi
Tanz
ania
Ken
yaU
gand
aR
wan
daB
urun
diTa
nzan
iaK
enya
Uga
nda
Rw
anda
Bur
undi
CA
PITA
L A
DE
QU
AC
Y
Cor
e C
apita
l/TRW
A+O
BSE
17.7
19.4
19.1
20.9
19.1
16.5
15.9
19.7
21.3
15.3
16.1
15.7
18.8
22.1
17.3
Tota
l cap
ital/T
RWA
+OB
SE18
.223
.222
.123
.122
.317
.719
.222
.224
.017
.317
.718
.921
.324
.619
.5
LIQ
UID
ITY
Liqu
id A
sset
s/D
eman
d Li
abili
ties
36.5
38.6
46.7
49.4
67.8
36.1
37.7
47.4
48.7
78.2
37.8
38.7
49.0
49.6
73.7
Tota
l Loa
ns/C
usto
mer
D
epos
its71
80.4
63.5
49.4
249
.274
.483
.762
.494
.480
.576
.283
.563
.893
.787
.7
EA
RN
ING
S A
ND
PR
OFI
TAB
ILIT
Y
Net
Inte
rest
Mar
gin
(NIM
)66
.937
.267
.39.
550
.867
.536
.063
.051
.465
.935
.665
.459
.0
Non
-Int
eres
t Exp
ense
s/G
ross
In
com
e67
.241
.763
.765
.377
66.9
40.9
59.4
60.9
67.8
65.1
38.9
60.6
60.8
68.4
Ret
urn
on A
sset
s-R
OA
(PB
T/Av
erag
e To
tal A
sset
s)2.
53.
63.
11.
51.
32.
63.
43.
61.
91.
02.
93.
33.
82.
18.
1
ASS
ET
QU
AL
ITY
Gro
ss n
on-p
erfo
rmin
g Lo
ans/
gros
s Loa
ns
6.6
56
6.9
10.3
6.8
5.4
4.1
6.0
11.1
6.7
5.7
4.0
6.2
13.3
NPL
s net
of p
rovi
sion
s/To
tal
Cap
ital
14.6
5.8
6.3
65.
216
.27.
46.
913
.47.
216
.58.
16.
512
.210
.1
Earn
ing
Ass
ets/
Tota
l Ass
ets
79.5
88.9
69.6
78.6
66.8
79.4
88.2
71.5
93.1
66.5
78.7
87.5
69.5
85.1
68.2
SEN
SIT
IVIT
Y T
O
MA
RK
ET
RIS
K
FX C
urre
ncy
Den
omin
ated
A
sset
s/To
tal A
sset
s 30
.213
.731
.116
.317
.230
.315
.431
.820
.916
.334
.316
.438
.118
.215
.9
FX C
urre
ncy
Den
omin
ated
Li
abili
ties/
Tota
l Lia
bilit
ies
34.5
22.9
38.1
23.4
17.5
36.0
22.6
39.2
30.2
21.3
39.8
23.5
44.4
26.6
18.1
Net
Ope
n Po
sitio
ns in
FX
/To
tal C
apita
l 1.
52.
2-2
.7-2
.20.
1-2
.54.
3-6
.1-1
.8-9
.2-2
.22.
9-5
.0-4
.03.
9
Sour
ce: B
ank
of T
anza
nia
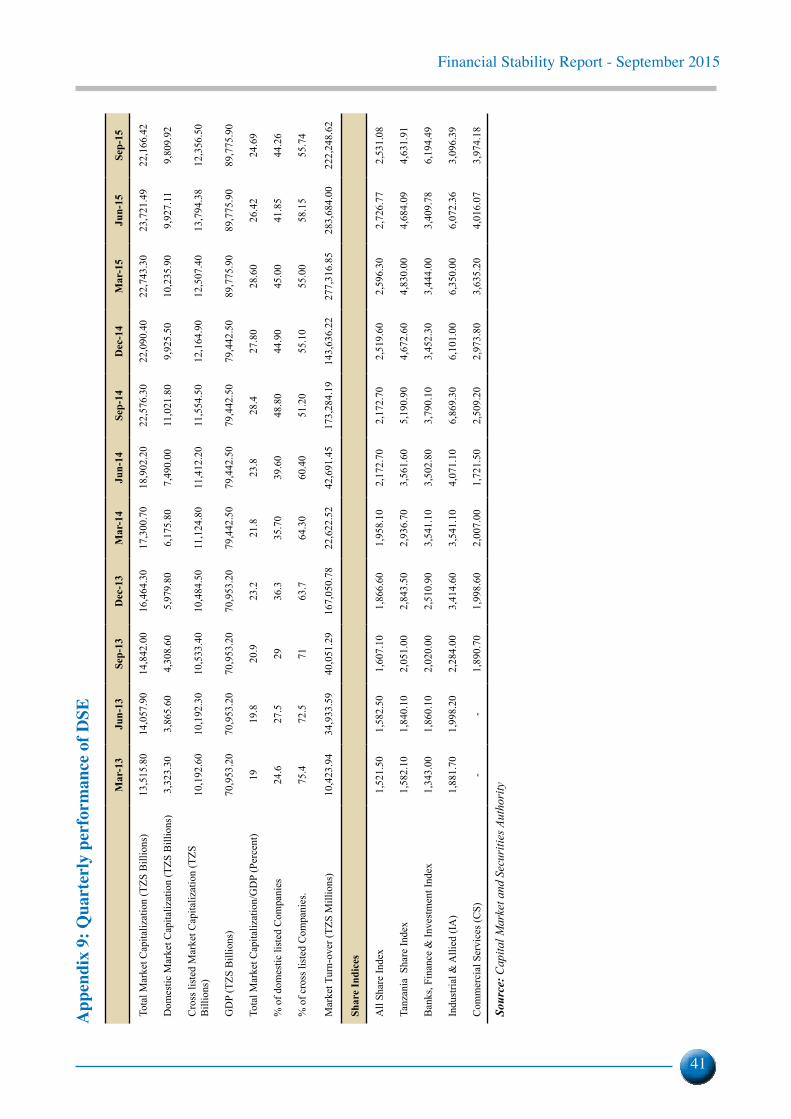
Financial Stability Report - September 2015
41
App
endi
x 9:
Qua
rter
ly p
erfo
rman
ce o
f DSE
M
ar-1
3Ju
n-13
Sep-
13D
ec-1
3M
ar-1
4Ju
n-14
Sep-
14D
ec-1
4M
ar-1
5Ju
n-15
Sep-
15
Tota
l Mar
ket C
apita
lizat
ion
(TZS
Bill
ions
)13
,515
.80
14,0
57.9
014
,842
.00
16,4
64.3
017
,300
.70
18,9
02.2
022
,576
.30
22,0
90.4
022
,743
.30
23,7
21.4
922
,166
.42
Dom
estic
Mar
ket C
apita
lizat
ion
(TZS
Bill
ions
)3,
323.
303,
865.
604,
308.
605,
979.
806,
175.
807,
490.
0011
,021
.80
9,92
5.50
10,2
35.9
09,
927.
119,
809.
92
Cro
ss li
sted
Mar
ket C
apita
lizat
ion
(TZS
B
illio
ns)
10,1
92.6
010
,192
.30
10,5
33.4
010
,484
.50
11,1
24.8
011
,412
.20
11,5
54.5
012
,164
.90
12,5
07.4
013
,794
.38
12,3
56.5
0
GD
P (T
ZS B
illio
ns)
70,9
53.2
070
,953
.20
70,9
53.2
070
,953
.20
79,4
42.5
079
,442
.50
79,4
42.5
079
,442
.50
89,7
75.9
089
,775
.90
89,7
75.9
0
Tota
l Mar
ket C
apita
lizat
ion/
GD
P (P
erce
nt)
1919
.820
.923
.221
.823
.828
.427
.80
28.6
026
.42
24.6
9
% o
f dom
estic
list
ed C
ompa
nies
24
.627
.529
36.3
35.7
039
.60
48.8
044
.90
45.0
041
.85
44.2
6
% o
f cro
ss li
sted
Com
pani
es.
75.4
72.5
7163
.764
.30
60.4
051
.20
55.1
055
.00
58.1
555
.74
Mar
ket T
urn-
over
(TZS
Mill
ions
)10
,423
.94
34,9
33.5
940
,051
.29
167,
050.
7822
,622
.52
42,6
91.4
517
3,28
4.19
143,
636.
2227
7,31
6.85
283,
684.
0022
2,24
8.62
Shar
e In
dice
s
All
Shar
e In
dex
1,52
1.50
1,58
2.50
1,60
7.10
1,86
6.60
1,95
8.10
2,17
2.70
2,17
2.70
2,51
9.60
2,59
6.30
2,72
6.77
2,53
1.08
Tanz
ania
Sha
re In
dex
1,58
2.10
1,84
0.10
2,05
1.00
2,84
3.50
2,93
6.70
3,56
1.60
5,19
0.90
4,67
2.60
4,83
0.00
4,68
4.09
4,63
1.91
Ban
ks, F
inan
ce &
Inve
stm
ent I
ndex
1,
343.
001,
860.
102,
020.
002,
510.
903,
541.
103,
502.
803,
790.
103,
452.
303,
444.
003,
409.
786,
194.
49
Indu
stria
l & A
llied
(IA
)1,
881.
701,
998.
202,
284.
003,
414.
603,
541.
104,
071.
106,
869.
306,
101.
006,
350.
006,
072.
363,
096.
39
Com
mer
cial
Ser
vice
s (C
S)
--
1,89
0.70
1,99
8.60
2,00
7.00
1,72
1.50
2,50
9.20
2,97
3.80
3,63
5.20
4,01
6.07
3,97
4.18
Sour
ce: C
apita
l Mar
ket a
nd S
ecur
ities
Aut
hori
ty
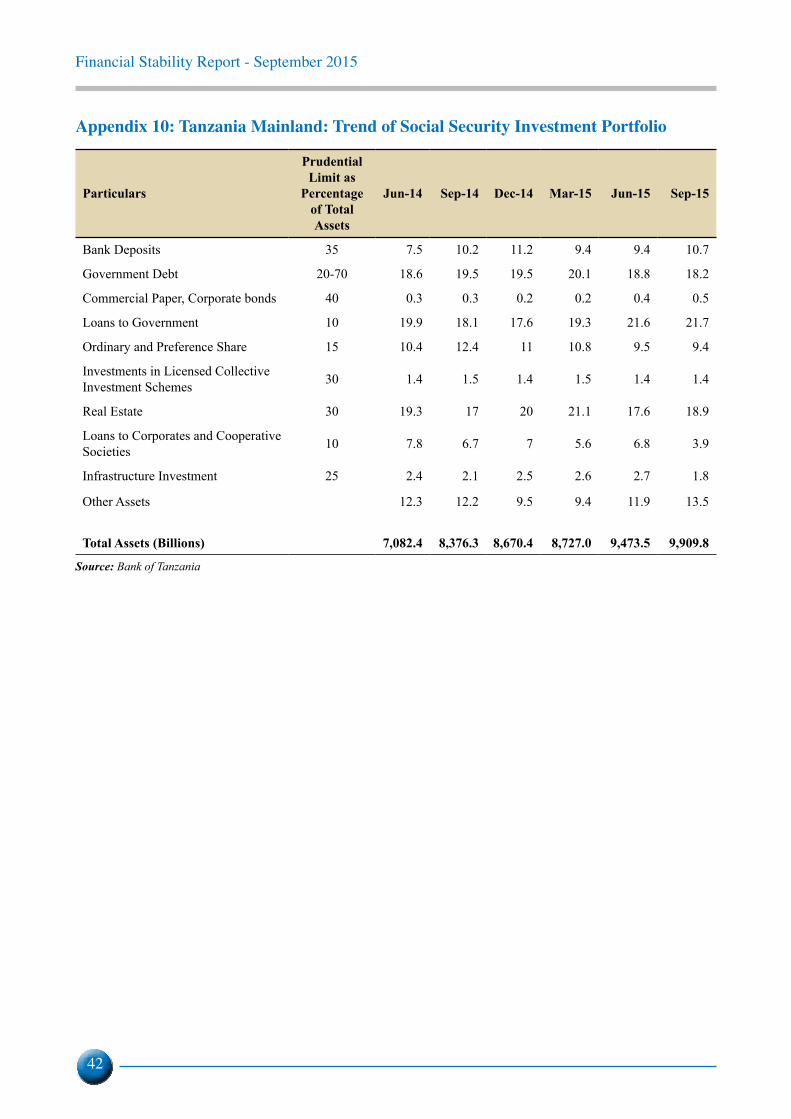
Financial Stability Report - September 2015
42
Appendix 10: Tanzania Mainland: Trend of Social Security Investment Portfolio
Particulars
Prudential Limit as
Percentage of Total Assets
Jun-14 Sep-14 Dec-14 Mar-15 Jun-15 Sep-15
Bank Deposits 35 7.5 10.2 11.2 9.4 9.4 10.7
Government Debt 20-70 18.6 19.5 19.5 20.1 18.8 18.2
Commercial Paper, Corporate bonds 40 0.3 0.3 0.2 0.2 0.4 0.5
Loans to Government 10 19.9 18.1 17.6 19.3 21.6 21.7
Ordinary and Preference Share 15 10.4 12.4 11 10.8 9.5 9.4
Investments in Licensed Collective Investment Schemes 30 1.4 1.5 1.4 1.5 1.4 1.4
Real Estate 30 19.3 17 20 21.1 17.6 18.9
Loans to Corporates and Cooperative Societies 10 7.8 6.7 7 5.6 6.8 3.9
Infrastructure Investment 25 2.4 2.1 2.5 2.6 2.7 1.8
Other Assets 12.3 12.2 9.5 9.4 11.9 13.5
Total Assets (Billions) 7,082.4
8,376.3
8,670.4
8,727.0
9,473.5
9,909.8
Source: Bank of Tanzania

Financial Stability Report - September 2015
43

Financial Stability Report - September 2015
44

Financial Stability Report - September 2015
45
For any enquiries and comments contactDirectorate of Financial Stability Bank of Tanzania2 Mirambo Street 11884, Dar es SalaamTel: +255 22 223 3471/2Fax: +255 223 4076http://www.bot.go.tz