financial staemments geoscience australia 9 · pdf fileother provisions 8b 1,189 1,221 ......
TRANSCRIPT

250 ITR Annual Report 2005–06

251
9
Geoscience Australia Financial Statements
Geoscience Australia
Financial Staemm
ents

252 ITR Annual Report 2005–06

253
9
Geoscience Australia Financial Statements
Geoscience Australia
Financial Staemm
ents
GEOSCIENCE AUSTRALIAINCOME STATEMENTfor the year ended 30 June 2006
2006 2005Notes $'000 $'000
INCOMERevenues
Revenues from Government 4A 107,440 100,923Goods and services 4B 20,623 14,873Other revenues 4C 1,549 1,487
Total revenue 129,612 117,283
GainsForeign exchange gain 4D 21 32Other gains 4D 147 117
Total gains 168 149TOTAL INCOME 129,780 117,432
EXPENSESEmployees 5A 53,199 49,589Suppliers 5B 66,437 62,902Depreciation and amortisation 5C 5,889 5,502Finance costs 5D - 179Write-down of assets 5E 997 2Net losses from disposal of assets 5F 392 216
TOTAL EXPENSES 126,914 118,390
OPERATING RESULT 2,866 (958)
The above statement should be read in conjunction with the accompanying notes.

254 ITR Annual Report 2005–06
GEOSCIENCE AUSTRALIABALANCE SHEETas at 30 June 2006
2006 2005ASSETS Notes $'000 $'000Financial Assets
Cash 6A 2,170 3,469Receivables 6B 25,824 15,548Accrued revenue 6C 2,461 1,432
Total Financial Assets 30,455 20,449
Non-Financial assetsLand and buildings 7A,C 6,256 6,384Infrastructure, plant and equipment 7B,C 20,689 20,723Intangibles 7D 1,878 1,788Inventories 7E 320 320Other non-financial assets 7F 3,125 2,431
Total Non-Financial assets 32,268 31,646
TOTAL ASSETS 62,723 52,095
LIABILITIESProvisions
Employee provisions 8A 18,300 17,354Other provisions 8B 1,189 1,221
Total Provisions 19,489 18,575
PayablesSuppliers 9A 5 74Other payables 9B 10,068 7,372
Total Payables 10,073 7,446
TOTAL LIABILITIES 29,562 26,021
NET ASSETS 33,161 26,074
EQUITYContributed equity 7,401 3,180Reserves 26 26Retained surpluses 25,734 22,868
TOTAL EQUITY 33,161 26,074
Current Assets 33,813 23,200Non-current Assets 28,910 28,895Current Liabilities 26,445 23,310Non-current Liabilities 3,117 2,711
The above statement should be read in conjunction with the accompanying notes.

255
9
Geoscience Australia Financial Statements
Geoscience Australia
Financial Staemm
ents
GEOSCIENCE AUSTRALIASTATEMENT OF CASH FLOWSfor the year ended 30 June 2006
2006 2005Notes $'000 $'000
OPERATING ACTIVITIESCash received
Goods and services 23,150 16,893Appropriations 97,440 102,056Net GST received from Australian Tax Office 3,980 4,506
Total cash received 124,570 123,455
Cash usedEmployees (52,252) (48,714)Suppliers (70,638) (68,585)
Total cash used (122,890) (117,299)
Net cash from or (used by) operating activities 10 1,680 6,156
INVESTING ACTIVITIESCash received
Proceeds from sales of infrastructure, plant and equipment 162 66Total cash received 162 66
Cash usedPurchase of Infrastructure, plant and equipment (6,422) (3,720)Purchase of Intangibles (940) (748)
Total cash used (7,362) (4,468)
Net cash from or (used by) investing activities (7,200) (4,402)
FINANCING ACTIVITIESCash received
Capital use charge received - -Total cash received - -
Cash usedCapital injection 4,221 -
Total cash used 4,221 -
Net cash from or (used by) financing activities 4,221 -
Net increase or (decrease) in cash held (1,299) 1,754Cash at the beginning of the reporting period 3,469 1,715
Cash at the end of the reporting period 6A 2,170 3,469
The above statement should be read in conjunction with the accompanying notes.

256 ITR Annual Report 2005–06
GEOSCIENCE AUSTRALIASTATEMENT of CHANGES in EQUITYfor the year ended 30 June 2006
Accumulated Results TOTAL EQUITY
2006 $'000
2005 $'000
2006 $'000
2005 $'000
2006 $'000
2005 $'000
2006 $'000
2005 $'000
Opening balance 22,868 23,826 26 26 3,180 3,180 26,074 27,032Adjustment for errors - - - - - - - -Adjustment for changes in accounting policies - - - - - - - -
Adjusted Opening Balance 22,868 23,826 26 26 3,180 3,180 26,074 27,032
Income and Expense
Subtotal income and expenses recognised directly in equity - - - - - - - -
Net operating result 2,866 (958) - - - - 2,866 (958)
Total income and expenses recognised directly in equity - - - - - - - -
Transactions with owners
Contributions by owners - - - - - - - -
Restructuring - - - - - - - -
Appropriations (equity injections) - - - - 4,221 - 4,221 -
Sub-total transactions with owners - - - - 4,221 - 4,221 -
Transfers between equity components - - - - - - - -
Closing balance at 30 June 25,734 22,868 26 26 7,401 3,180 33,161 26,074
The above statement should be read in conjunction with the accompanying notes.
Asset Revaluation Reserve
Contributed Equity/Capital

257
9
Geoscience Australia Financial Statements
Geoscience Australia
Financial Staemm
ents
GEOSCIENCE AUSTRALIASCHEDULE OF COMMITMENTSas at 30 June 2006
2006 2005$'000 $'000
BY TYPE
Capital CommitmentsInfrastructure, plant and equipment1 1,248 -
Total Capital Commitments 1,248 -
Other CommitmentsOperating leases2 283,818 300,906Other commitments 45,005 50,223
Total Other Commitments 328,823 351,129
Commitments Receivable (28,299) (28,780)Net Commitments by Type 301,772 322,349
BY MATURITY
Capital CommitmentsOne year or less 1,248 -From one to five years - -Over five years - -
Total Capital Commitments 1,248 -
Operating Lease CommitmentsOne year or less 18,029 17,527From one to five years 83,519 79,419Over five years 182,270 203,960
Total Operating Lease Commitments 283,818 300,906
Other CommitmentsOne year or less 25,896 18,980From one to five years 19,109 31,243Over five years - -
Total Other Commitments 45,005 50,223
Commitments Receivable (28,299) (28,780)Net Commitments by Maturity 301,772 322,349
NB: Commitments are GST inclusive where relevant.
1 Plant and equipment commitments are contracts for remote sensing equipment.2 Operating leases included are effectively non-cancellable and comprise:

258 ITR Annual Report 2005–06
GEOSCIENCE AUSTRALIASCHEDULE OF COMMITMENTS (continued)as at 30 June 2006
Nature of leaseLeases for office accomodation.
Leases of land.
Agreements for the provision of motor vehicles to senior executive officers & divisions.
The above schedule should be read in conjunction with the accompanying notes.
* No contingent rentals exist; there are no purchase options available to Geoscience Australia.
* Lease payments for the premises at Symonston are subject to annual increase in accordance with the greater of upwards movements in the Consumer Price Index or 3% per annum. Geoscience has 13 years remaining of the original 20 year lease.
General description of leasing arrangement
* Lease payments for the premises at Bruce are subject to annual increase in accordance with an annual review to market conditions. Geoscience has 5 years remaining of the original 10 year lease.
* Lease payments for the land at Mount Stromlo are subject to annual increase in accordance with an annual review to market conditions. Geoscience has 8 years remaining of the original 10 year lease.
* Lease payments for the premises at Fyshwick are subject to annual increase in accordance with an annual review to market conditions. Geoscience has 5 years remaining of the original 10 year lease.

259
9
Geoscience Australia Financial Statements
Geoscience Australia
Financial Staemm
ents
GEOSCIENCE AUSTRALIASCHEDULE OF CONTINGENCIESas at 30 June 2006
Geoscience Australia had no contingent liabilities or assets at reporting date (2004-05: nil).
The above statement should be read in conjunction with the accompanying notes.

260 ITR Annual Report 2005–06
GEOSCIENCE AUSTRALIASCHEDULE OF ADMINISTERED ITEMS
2006 2005Notes $'000 $'000
Expenses Administered on Behalf of Governmentfor the year-ended 30 June 2006
Grants 15 20 20Total Expenses Administered on Behalf of Government 20 20
This schedule should be read in conjunction with the accompanying notes.

261
9
Geoscience Australia Financial Statements
Geoscience Australia
Financial Staemm
ents
GEOSCIENCE AUSTRALIASCHEDULE OF ADMINISTERED ITEMS (continued)
2006 2005Notes $'000 $'000
Assets Administered on behalf of Governmentas at 30 June 2006
Financial AssetsCash 16 661 710
Total Assets Administered on Behalf of Government 661 710
Liabilities Administered on behalf of Governmentas at 30 June 2006
PayablesOther payables 17 661 710
Total Liabilities Administered on Behalf of Government 661 710
Net Assets Administered on Behalf of Government - -
Current Assets 661 710Non-current Assets - -Current Liabilities 661 710Non-current Liabilities - -
This schedule should be read in conjunction with the accompanying notes.

262 ITR Annual Report 2005–06
GEOSCIENCE AUSTRALIASCHEDULE OF ADMINISTERED ITEMS (continued)
2006 2005Notes $'000 $'000
Administered Cash Flows for the year-ended 30 June 2006
Operating ActivitiesCash used
Grant payments 20 20GST paid to Australian Tax Office 2 2
Total Cash Used 22 22
Net cash used in Operating Activities (22) (22)
Net decrease in cash held (22) (22)Cash at the beginning of reporting period 710 685Cash from Official Public Account for: - Appropriations 22 22 - Special Accounts 518 620
540 642Cash to Official Public Account for: - Special Accounts (567) (595)
Cash at end of the reporting period 16 661 710
Statement of Activities Administered on Behalf of Government
This schedule should be read in conjunction with the accompanying notes.

263
9
Geoscience Australia Financial Statements
Geoscience Australia
Financial Staemm
ents
GEOSCIENCE AUSTRALIANOTES TO AND FORMING PART OF THE FINANCIAL STATEMENTSfor the period ended 30 June 2006
Note Description1 Summary of Significant Accounting Policies
2 The impact of the transition to AEIFRS from previous AGAAP
3 Events after the Balance Sheet Date4 Income5 Operating Expenses6 Financial Assets7 Non-Financial Assets8 Provisions & Entitlements9 Payables
10 Cash Flow Reconciliation11 Executive Remuneration12 Remuneration of Auditors13 Average Staffing Levels14 Financial Instruments15 Expenses Administered on Behalf of Government16 Assets Administered on Behalf of Government17 Liabilities Administered on Behalf of Government18 Administered Reconciliation Table19 Administered Financial Instruments20 Appropriations21 Special Accounts22 Comcare Account23 Compensation and Debt Relief24 Reporting of Outcomes25 Joint Ventures

264 ITR Annual Report 2005–06
Notes to and forming part of the Financial Statements
Note 1: Summary of Significant Accounting Policies
1.1 Objectives of Geoscience Australia
Geoscience Australia is an Australian Public Service organisation. The objective of Geoscience Australia is to produce first class geoscientific information and knowledge.
Geoscience Australia is structured to meet one outcome: to achieve enhanced potential for the Australian community to obtain economic, social and environmental benefits through the application of first class geoscientific research and information.
Geoscience Australia’s activities contributing toward this outcome are classified as either departmental or administered. Departmental activities involve the use of assets, liabilities, revenues and expenses controlled or incurred by Geoscience Australia in its own right. Administered activities involve the management or oversight by Geoscience Australia, on behalf of the Government, of items controlled or incurred by the Government.
The continued existence of Geoscience Australia in its present form and with its present programs is dependent on Government policy and on continuing appropriations by Parliament for Geoscience Australia’s administration and programs.
1.2 Basis of Preparation of the Financial Statements
The financial statements are required by section 49 of the Financial Management and Accountability Act 1997 and are a general purpose financial report.
The statements have been prepared in accordance with: Finance Minister’s Orders (or FMOs, being the Financial Management and Accountability Orders (Financial Statements for reporting periods ending on or after 1 July 2005));Australian Accounting Standards issued by Australian Accounting Standards Board (AASB) that apply for the reporting period; and Interpretations issued by the AASB and Urgent Issues Group (UIG) that apply for the reporting period.
This is the first financial report to be prepared under Australian Equivalents to International Financial Reporting Standards (AEIFRS). The impacts of adopting AEIFRS are disclosed in Note 2.
The Income Statement and Balance Sheet have been prepared on an accrual basis and are in accordance with historical cost convention, except for certain assets, which as noted, are at fair value or amortised cost. Except where stated, no allowance is made for the effect of changing prices on the results or the financial position.
The financial report is presented in Australian dollars and values are rounded to the nearest thousand dollars unless disclosure of the full amount is specifically required.

265
9
Geoscience Australia Financial Statements
Geoscience Australia
Financial Staemm
ents
Notes to and forming part of the Financial Statements
Unless alternative treatment is specifically required by an accounting standard, assets and liabilities are recognised in the Balance Sheet when and only when it is probable that future economic benefits will flow and the amounts of the assets or liabilities can be reliably measured. However, assets and liabilities arising under agreementsequally proportionately unperformed are not recognised unless required by an Accounting Standard. Liabilities and assets that are unrecognised are reported in theSchedule of Commitments and the Schedule of Contingencies (other thanunquantifiable or remote contingencies).
Unless alternative treatment is specifically required by an accounting standard, revenues and expenses are recognised in the Income Statement when and only when the flow or consumption or loss of economic benefits has occurred and can be reliably measured.
1.3 Changes in Accounting Policy
The accounting policies used in the preparation of these with those used in 2002-03.
Administered revenues, expenses, assets and liabilities and cash flows reported in the Schedule of Administered Items and related notes are accounted for on thesame basis and using the same policies as for Departmental items, except where otherwise stated at Note 1.24.
1.3 Statement of Compliance
The financial report complies with Australian Accounting Standards, which include Australian Equivalents to the International Financial Reporting Standards (AEIFRS).
Australian Accounting Standards require Geoscience Australia to disclose AustralianAccounting Standards that have not been applied, for standards that have been issuedbut are not yet effective.
The AASB has issued amendments to existing standards, these amendments aredenoted by year and then number, for example 2005-1 indicates amendment 1 issued in 2005.
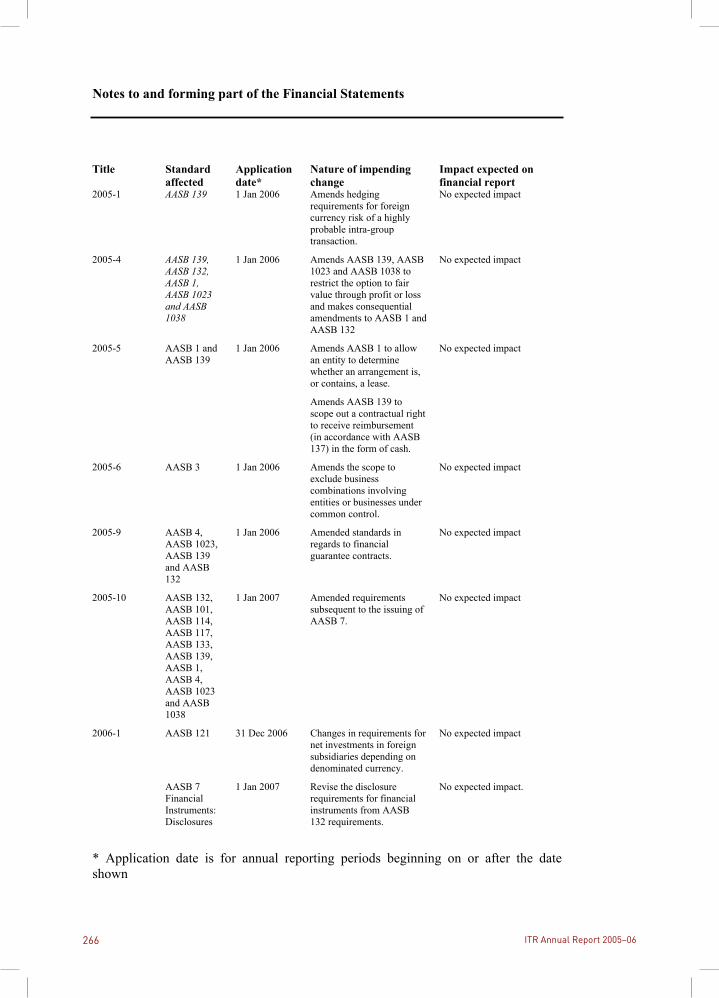
The table below illustrates standards and amendments that will become effective forGeoscience Australia in the future. The nature of the impending change within thetable has been out of necessity abbreviated and users should consult the full version available on the AASB’s website to identify the full impact of the change. The expected impact on the financial report of adoption of these standards is based on Geoscience Australia’s initial assessment at this date, but may change. GeoscienceAustralia intends to adopt all standards upon their application date.
266 ITR Annual Report 2005–06
Notes to and forming part of the Financial Statements
Title Standardaffected
Applicationdate*
Nature of impending change
Impact expected on financial report
2005-1 AASB 139 1 Jan 2006 Amends hedging requirements for foreign currency risk of a highly probable intra-group transaction.
No expected impact
2005-4 AASB 139, AASB 132, AASB 1, AASB 1023 and AASB 1038
1 Jan 2006 Amends AASB 139, AASB 1023 and AASB 1038 to restrict the option to fair value through profit or loss and makes consequential amendments to AASB 1 and AASB 132
No expected impact
2005-5 AASB 1 and AASB 139
1 Jan 2006 Amends AASB 1 to allow an entity to determine whether an arrangement is, or contains, a lease.
Amends AASB 139 to scope out a contractual right to receive reimbursement (in accordance with AASB 137) in the form of cash.
No expected impact
2005-6 AASB 3 1 Jan 2006 Amends the scope to exclude business combinations involving entities or businesses under common control.
No expected impact
2005-9 AASB 4, AASB 1023, AASB 139 and AASB 132
1 Jan 2006 Amended standards in regards to financial guarantee contracts.
No expected impact
2005-10 AASB 132, AASB 101, AASB 114, AASB 117, AASB 133, AASB 139, AASB 1, AASB 4, AASB 1023 and AASB 1038
1 Jan 2007 Amended requirements subsequent to the issuing of AASB 7.
No expected impact
2006-1 AASB 121 31 Dec 2006 Changes in requirements for net investments in foreign subsidiaries depending on denominated currency.
No expected impact
AASB 7FinancialInstruments:Disclosures
1 Jan 2007 Revise the disclosure requirements for financial instruments from AASB 132 requirements.
No expected impact.
* Application date is for annual reporting periods beginning on or after the date shown

267
9
Geoscience Australia Financial Statements
Geoscience Australia
Financial Staemm
ents
Notes to and forming part of the Financial Statements
1.4 Revenue
Revenues from Government
Amounts appropriated for Departmental outputs appropriations for the year (adjusted for any formal additions and reductions) are recognised as revenue, except for certain amounts that relate to activities that are reciprocal in nature, in which case revenue is recognised only when it has been earned.
Appropriations receivable are recognised at their nominal amounts.
Other Revenue
Revenue from the sale of goods is recognised when: The risks and rewards of ownership have been transferred to the buyer; The seller retains no managerial involvement nor effective control over the goods;The revenue and transaction costs incurred for the transaction can be reliably measured; and It is probable that the economic benefits associated with the transaction will flow to the entity.
Revenue from rendering of services is recognised by reference to the stage of completion of contracts at the reporting date. The revenue is recognised when:
The amount of revenue, stage of completion and transaction costs incurred can be reliably measured; and The probable economic benefits with the transaction will flow to the entity.
The stage of completion of contracts at the reporting date is determined by reference to the proportion that costs incurred to date bear to the estimated total costs of the transaction.
Receivables for goods and services, which have 30 day terms, are recognised at the nominal amounts due less any provision for bad and doubtful debts. Collectability of debts is reviewed at balance date. Provisions are made when collectability of the debt is no longer probable.
Interest revenue is recognised using the effective interest method as set out in AASB 139.

268 ITR Annual Report 2005–06
Notes to and forming part of the Financial Statements
1.5 Gains
Resources Received Free of Charge
Services received free of charge are recognised as revenue when and only when a fair value can be reliably determined and the services would have been purchased if they had not been donated. Use of those resources is recognised as an expense.
Contributions of assets at no cost of acquisition or for nominal consideration are recognised as revenue at their fair value when the asset qualifies for recognition, unless received from another government agency as a consequence of a restructuring of administrative arrangements (Refer to Note 1.6).
Other Gains
Gains from disposal of non-current assets are recognised when control of the asset has passed to the buyer.
1.6 Transactions with the Government as Owner
Equity injections
Amounts appropriated which are designated as ‘equity injections’ for a year (less any savings offered up in the Portfolio Additional Estimates Statements) are recognised directly in Contributed Equity in that year.
Restructuring of Administrative Arrangements
Net assets received from or relinquished to another Commonwealth agency or authority under a restructuring of administrative arrangements are adjusted at their book value directly against contributed equity. There have been no restructuring transactions in 2005-06.
Other distributions to owners
The FMOs require that distributions to owners be debited to contributed equity unless in the nature of a dividend. There have been no distributions to owners in 2005-06.

269
9
Geoscience Australia Financial Statements
Geoscience Australia
Financial Staemm
ents
Notes to and forming part of the Financial Statements
1.7 Employee Benefits
As required by the Finance Minister’s Orders, Geoscience Australia has early adopted AASB 119 Employee Benefits as issued in December 2004.
Liabilities for services rendered by employees are recognised at the reporting date to the extent that they have not been settled.
Liabilities for ‘short-term employee benefits’ (as defined in AASB 119) and termination benefits due within twelve months of balance date are measured at their nominal amounts.
The nominal amount is calculated with regard to the rates expected to be paid on settlement of the liability.
All other employee benefit liabilities are measured as the present value of the estimated future cash outflows to be made in respect of services provided by employees up to the reporting date.
Leave
The liability for employee benefits includes provision for annual leave and long service leave. No provision has been made for sick leave as all sick leave is non-vesting and the average sick leave taken in future years by employees of Geoscience Australia is estimated to be less than the annual entitlement for sick leave.
The leave liabilities are calculated on the basis of employees’ remuneration, including Geoscience Australia’s employer superannuation contribution rates to the extent that the leave is likely to be taken during service rather than paid out on termination.
The liability for long service leave is recognised and measured at the present value of the estimated future cash flows to be made in respect of all employees at 30 June 2006. In determining the present value of the liability, Geoscience Australia has taken into account attrition rates and pay increases through promotion and inflation.
Separation and Redundancy
No provision is required for separation and redundancy of employees.
Superannuation
Staff of Geoscience Australia are members of the Commonwealth Superannuation Scheme (CSS), the Public Sector Superannuation Scheme (PSS) or the PSS accumulation plan (PSSap).
The CSS and PSS are defined contributions schemes for the Commonwealth. The PSSap is a defined contribution scheme.

270 ITR Annual Report 2005–06
Notes to and forming part of the Financial Statements
The liability for defined benefits is recognised in the financial statements of the Australian Government and is settled by the Australian Government in due course.
Geoscience Australia makes employer contributions to the Australian Government at rates determined by an actuary to be sufficient to meet the cost to the Government of the superannuation entitlements of Geoscience Australia’s employees.
From 1 July 2005, new employees are eligible to join the PSSap scheme.
The liability for superannuation recognised as at 30 June represents outstanding contributions for the final fortnight of the year.
1.8 Leases
A distinction is made between finance leases and operating leases. Finance leases effectively transfer from the lessor to the lessee substantially all the risks and rewards incidental to ownership of leased non-current assets. An operating lease is a lease that is not a finance lease. In operating leases, the lessor effectively retains substantially all such risks and benefits.
Geoscience Australia has no finance leases.
Operating lease payments are expensed on a straight-line basis which is representative of the pattern of benefits derived from the leased assets. The net present value of future net outlays in respect of surplus space under non-cancellable lease agreements is expensed in the period in which the space becomes surplus.
In the case of Geoscience Australia’s non-cancellable lease in relation to Fern Hill Park, the premises have been sub-let from 1 May 2004 for a period of 3 years with options to extend the lease. Lease incentives in the form of an ‘incentive rebate’ are recognised as liabilities in accordance with UIG 115. These liabilities are reduced by allocating lease payments between rental expense and reduction of the liability.
1.9 Borrowing costs
All borrowing costs expensed as incurred.

271
9
Geoscience Australia Financial Statements
Geoscience Australia
Financial Staemm
ents
Notes to and forming part of the Financial Statements
1.10 Cash
Cash means notes and coins held and any deposits held at call with a bank or financial institution. Cash is recognised at its nominal amount.
1.11 Financial Risk Management
Geoscience Australia’s activities expose it to normal commercial financial risk. As a result of the nature of Geoscience Australia’s business and internal and Australian Government policies, dealing with the management of financial risk, Geoscience Australia’s exposure to market, credit, liquidity and cash flow and fair value interest rate risk is considered to be low.
1.12 Trade Creditors
Trade creditors and accruals are recognised at their nominal amounts, being the amounts at which the liabilities will be settled. Liabilities are recognised to the extent that the goods or services have been received (and irrespective of having been invoiced).
1.13 Contingent Liabilities and Contingent Assets
Contingent liabilities and assets are not recognised in the Balance Sheet but are disclosed in the relevant schedules and notes. They may arise from uncertainty as to the existence of a liability or asset, or represent an existing liability or asset in respect of which settlement is not probable or the amount cannot be reliably measured. Remote contingencies are part of this disclosure. Where settlement becomes probable, a liability or asset is recognised. A liability or asset is recognised when its existence is confirmed by a future event, settlement becomes probable (virtually certain for assets) or reliable measurement becomes possible.
Geoscience Australia had no contingent liabilities or assets at reporting date.
1.14 Acquisition of Assets
Assets are recorded at cost on acquisition except as stated below. The cost of acquisition includes the fair value of assets transferred in exchange and liabilities undertaken. Financial assets are initially measured at their fair values plus transaction costs where appropriate.
Assets acquired at no cost, or for nominal consideration, are initially recognised as assets and revenues at their fair value at the date of acquisition, unless acquired as a consequence of restructuring of administrative arrangements. In the latter case, assets are initially recognised as contributions by owners at the amounts at which they were recognised in the transferor agency’s accounts immediately prior to the restructuring.

272 ITR Annual Report 2005–06
Notes to and forming part of the Financial Statements
1.15 Property, Plant and Equipment (PP&E)
Asset Recognition Threshold
Purchases of infrastructure, plant and equipment are recognised initially at cost in the Balance Sheet, except for purchases costing less than $2,500, which are expensed in the year of acquisition (other than where they form part of a group of similar items which are significant in total).
The initial cost of an asset includes an estimate of the cost of dismantling and removing the item and restoring the site on which it is located. This is particularly relevant to ‘makegood’ provisions in property leases taken up by Geoscience Australia where there exists an obligation to restore the property to its original condition. These costs are included in the value of Geoscience Australia’s leasehold improvements with a corresponding provision for the ‘makegood’ taken up.
Revaluations
Basis
Land, buildings, plant and equipment are carried at valuation, being revalued with sufficient frequency such that the carrying amount of each asset class is not materially different, at reporting date, from its fair value. Valuations undertaken in each year are as at 30 June.
Fair values for each class are determined as shown below.
Asset class Fair value measured at: Land Market selling price
Buildings Market selling priceLeasehold improvements Depreciated replacement cost Infrastructure, plant and equipment
Market selling price except specialised assets which are valued at depreciated replacement cost.
Following initial recognition at cost, valuations are conducted with sufficient frequency to ensure that the carrying amounts of assets do not differ materially with the assets’ fair values as at the reporting date. The regularity of independent valuations depends upon the volatility of movements in market values for the relevant assets.
Revaluation adjustments are made on a class basis. Any revaluation increment is credited to equity under the heading of asset revaluation reserve except to the extent that it reverses a previous revaluation decrement of the same asset class that was previously recognised through profit and loss.

273
9
Geoscience Australia Financial Statements
Geoscience Australia
Financial Staemm
ents
Notes to and forming part of the Financial Statements
Revaluation decrements for a class of assets are recognised directly through profit and loss except to the extent that they reverse a previous revaluation increment for that class.
Any accumulated depreciation as at the revaluation date is eliminated against the gross carrying amount of the asset and the asset restated to the revalued amount.
Land, buildings, plant and equipment are subject to a formal valuation every five years. Formal valuations are carried out by an independent qualified valuer.
Depreciation
Depreciable infrastructure, plant and equipment assets are written-off to their estimated residual values over their estimated useful lives to Geoscience Australia using, in all cases, the straight-line method of depreciation. Leasehold improvements are amortised on a straight-line basis over the lesser of the estimated useful life of the improvements or the unexpired period of the lease.
Depreciation rates (useful lives), residual values and methods are reviewed at each reporting date and necessary adjustments are recognised in the current, or current and future reporting periods, as appropriate.
Depreciation rates applying to each class of depreciable asset are based on the following useful lives:
2006 2005Buildings on freehold land 18 to 40 years 18 to 40 years Leasehold improvements 7 years or lease term 7 years or lease term Plant and equipment 4 to 15 years 4 to 15 years
The aggregate amount of depreciation allocated for each class of asset during the reporting period is disclosed in Note 5C.
Impairment
All assets were assessed for impairment at 30 June 2006. Where indications of impairment exist, the asset’s recoverable amount is estimated and an impairment adjustment made if the asset’s recoverable amount is less than its carrying amount.
The recoverable amount of an asset is the higher of its fair value less costs to sell and its value in use. Value in use is the present value of future cash flows expected to be derived from the asset. Where the future economic benefit of an asset is not primarily dependent on the asset’s ability to generate future cash flows, and the asset would be replaced if Geoscience Australia were deprived of the asset, its value in use is taken to be its depreciated replacement cost.
No indicators of impairment were found for assets at fair value.

274 ITR Annual Report 2005–06
Notes to and forming part of the Financial Statements
1.16 Intangibles
Geoscience Australia’s intangibles comprise purchased software. These assets are carried at cost.
Software is amortised on a straight-line basis over their anticipated useful life. The useful lives of Geoscience Australia’s software are 2 to 6 years (2004-05: 2-6 years).
All software assets are assessed for indications of impairment as at 30 June 2006. None were found to be impaired.
1.17 Inventories
Inventories held for resale are valued at the lower of cost and net realisable value.
Costs incurred in bringing each item of inventory to its present location and condition are assigned as follows:
finished goods – cost of direct materials and labour plus attributable costs that are capable of being allocated on a reasonable basis.
Inventories acquired at no cost or nominal consideration are measured at current replacement cost at the date of acquisition.
1.18 Taxation
Geoscience Australia is exempt from all forms of taxation except fringe benefits tax and the goods and services tax (GST).
Revenues, expenses and assets are recognised net of GST:
except where the amount of GST incurred is not recoverable from the Australian Taxation Office; and except for receivables and payables.
1.19 Foreign Currency
Transactions denominated in a foreign currency are converted at the exchange rate at the date of the transaction. Foreign currency receivables and payables are translated at the exchange rates current as at balance date. Associated currency gains and losses are not material.

275
9
Geoscience Australia Financial Statements
Geoscience Australia
Financial Staemm
ents
Notes to and forming part of the Financial Statements
1.20 Insurance
Geoscience Australia has insured for risks through the Government’s insurable risk managed fund, called ‘Comcover’. Workers compensation is insured through the Government’s Comcare Australia.
1.21 Joint Ventures
The economic entity’s share of the assets, liabilities, revenue and expenses of joint venture operations are included in the appropriate items of the Income Statement and Balance Sheet. Details of Geoscience Australia’s interests are shown in note 25.
1.22 Comparative Figures
Comparative figures have been adjusted to conform to changes in presentation in these financial statements where required.
1.23 Rounding
Amounts have been rounded to the nearest $1,000 except in relation to the following:
remuneration of executives; remuneration of auditors; and appropriation note disclosures.

276 ITR Annual Report 2005–06
Notes to and forming part of the Financial Statements
1.24 Reporting of Administered Activities
Administered revenues, expenses, assets, liabilities and cash flows are disclosed in the Schedule of Administered Items and related Notes.
Administered Cash Transfers to and from the Official Public Account
Revenue collected by Geoscience Australia for use by the Government rather than Geoscience Australia is Administered Revenue. Collections are transferred to the Official Public Account (OPA) maintained by the Department of Finance andAdministration. Conversely, cash is drawn from the OPA to make payments under Parliamentary appropriation on behalf of Government. These transfers to and from the OPA are adjustments to the administered cash held by Geoscience Australia on behalf of the Government and reported as such in the Statement of Cash Flows in the Scheduleof Administered Items and in the Administered Reconciliation Table in Note 18. Thus the Schedule of Administered Items largely reflects the Government’s transactions, through Geoscience Australia, with parties outside the Government.
Revenue
All administered revenues are revenues relating to the core operating activitiesperformed by Geoscience Australia on behalf of the Australian Government.
Grants
Geoscience Australia administers one grant scheme on behalf of the Government.
Grant liabilities are recognised to the extent that (i) the services required to be performed by the grantee have been performed or (ii) the grant eligibility criteria havebeen satisfied, but payments due have not been made. A commitment is recorded when the Government enters into an agreement to make these grants but services have not been performed or criteria satisfied. Where grants moneys are paid in advance of performance or eligibility, a prepayment is recognised.
Administered Special Account
Geoscience Australia administers one Administered Special Account, Australia New Zealand Land Information Special Account (ANZLISA), as included at Note 21. The balance of the Special Account represents an amount of appropriation available for thespecific purpose of the Special Account. Receipts to the Special Account do not represent a revenue to the Government and as such an administered liability is recognised until such time that a payment in accordance with the specified purposeneeds to be made. Funds relating to the Special Account are maintained in a separate bank account which is reported as part of administered cash.
The major financial activity is to provide UN Grants-In-Aid to support Australian involvement in IGCP projects.
Commitments and Contingencies
There are no administered commitment and contingencies in either the current orprevious reporting period.

277
9
Geoscience Australia Financial Statements
Geoscience Australia
Financial Staemm
ents
Notes to and forming part of the Financial Statements
2005 2004$’000 $’000
Note 2: The impact of the transition to AEIFRS from previous AGAAP
AGAAP to that under AEIFRSTotal equity under previous AGAAP 26,757 27,497Adjustments to retained earnings:
Depreciation expense1 (202) (163)
Borrowing cost expense - unwinding of discount2 (279) (218)
Borrowing cost expense - decrease in discount rate2 (206) (88)Decrease in employee benefits liability from discounting non-current portion of annual leave3
4 4
Total equity translated to AEIFRS 26,074 27,032
Total Departmental operating result under AGAAP (740)Adjustments:
Depreciation expense1 (39)
Borrowing cost expense2 (179)Prior year profit translated to AEIFRS (958)
The cash flow statement presented under previous AGAAP is equivalent to that prepared unders AEIFRS.
1 Depreciation on 'makegood' assets has been taken into account as required by AEIFRS.
2 AEIFRS requires the recording of assets reflecting future estimated restoration costs. Amounts for 'makegood' provisions in existing accomodation leases (operating) have been taken up accordingly.
3 AEIFRS requires that non current portion of annual leave be reflected at present value costs.
Geoscience Australia has not restated comparatives for financial instruments. The adjustments betweenAEIFRS and the previous AGAAP have been taken up at 1 July 2005.
Reconciliation of profit or loss as presented under previous AGAAP to AEIFRS
Reconciliation of total equity as presented under previous

278 ITR Annual Report 2005–06
Notes to and forming part of the Financial Statements
Note 3: Events Occurring after Reporting Date
There are no events occurring after reporting date that materially affect the financial statements.

279
9
Geoscience Australia Financial Statements
Geoscience Australia
Financial Staemm
ents
Notes to and forming part of the Financial Statements
2006 2005$'000 $'000
Note 4: Income
RevenuesNote 4A: Revenues from GovernmentAppropriations for outputs 107,440 100,923Total revenues from government 107,440 100,923
Note 4B: Goods and ServicesGoods 1,926 3,951Services 18,697 10,922Total sales of goods and services 20,623 14,873
Provision of goods to:Related entities 374 1,002External entities 1,552 2,949
Total sales of goods 1,926 3,951
Rendering of services to:Related entities 9,034 3,029External entities 9,663 7,893
Total rendering of services 18,697 10,922
Cost of sales of goods 227 219
Note 4C : Other RevenuesOther revenues 1,549 1,487
1,549 1,487
Note 4D : Other GainsForeign exchange gain 21 32Finance costs 32 -Resources received free of charge 115 117Total other gains 168 149

280 ITR Annual Report 2005–06
Notes to and forming part of the Financial Statements
2006 2005$'000 $'000
Note 5: Operating Expenses
Note 5A: Employee ExpensesWages and salaries 39,977 37,091Superannuation 7,120 6,561Leave and other entitlements 6,102 5,881Separation and redundancies - 56Total employee expenses 53,199 49,589
Note 5B: Suppliers ExpensesGoods from related entities - 16Goods from external entities 4,012 2,927Services from related entities 3,640 1,689Services from external entities 40,331 40,962Operating lease rentals1 18,289 17,167Workers compensation premiums 165 141Total supplier expenses 66,437 62,9021 These comprise minimum lease payments only.
Note 5C: Depreciation and Amortisation
Depreciation
Other infrastructure, plant and equipment 4,300 4,083Buildings 127 132Total depreciation 4,427 4,215
AmortisationLeasehold improvements 596 574Intangibles - Computer software 866 713Total amortisation 1,462 1,287
Total depreciation and amortisation 5,889 5,502

281
9
Geoscience Australia Financial Statements
Geoscience Australia
Financial Staemm
ents
Notes to and forming part of the Financial Statements
2006 2005$'000 $'000
Buildings on freehold land 127 132Leasehold improvements 596 574Plant and equipment 4,300 4,083Intangibles - Computer software 866 713Total depreciation and amortisation 5,889 5,502
Note 5D: Finance CostsUnwinding of finance discount - 179Total finance costs expense - 179
Note 5E: Write down and impairment of assetsFinancial assetsBad and doubtful debts expense 7 2Non-financial assetsInfrastructure, plant and equipment - write down* 990 -Total write-down of assets 997 2
*The asset recognition threshold was raised from $2,000 to $2,500 during the year.
Note 5F: Net Losses from Disposal of AssetsInfrastructure, plant and equipment:
Proceeds from disposal 162 66Net book value of assets disposed (554) (282)Selling expenses - -
Net (loss) from disposal of infrastructure, plant and equipment (392) (216)
The aggregate amounts of depreciation or amortisation expensed during the reporting period for each class of depreciable asset are as follows:

282 ITR Annual Report 2005–06
Notes to and forming part of the Financial Statements
2006 2005$'000 $'000
Note 6: Financial Assets
Note 6A: Cash and cash equivalentsDepartmental 2,170 3,469
Total cash and cash equivalents 2,170 3,469
Note 6B: ReceivablesGoods and services 3,042 2,728Less: Allowance for doubtful debts (7) -
3,035 2,728GST receivable from the Australian Taxation Office 521 552Approprations receivable:
- for existing outputs 22,268 12,268Total receivables (net) 25,824 15,548
All receivables are current assets.
Receivables (gross) are aged as follows:Current 24,219 13,444Overdue by:
Less than 30 days 1,064 1,68330 to 60 days 392 16360 to 90 days 5 153More than 90 days 151 105
1,612 2,104Total receivables (gross) 25,831 15,548
The allowance for doubtful debts is aged as follows:Current - -Overdue by:
Less than 30 days - -30 to 60 days - -60 to 90 days - -More than 90 days (7) -
Total allowance for doubtful debts (7) -
Note 6C: Accrued RevenueAccrued Revenue 2,461 1,432Total accrued revenues 2,461 1,432
All accrued revenues are current assets.
All receivables are with entities external to Geoscience Australia. Credit terms are net 30 days (2005: 30 days).
283
9
Geoscience Australia Financial Statements
Geoscience Australia
Financial Staemm
ents
Notes to and forming part of the Financial Statements2006 2005
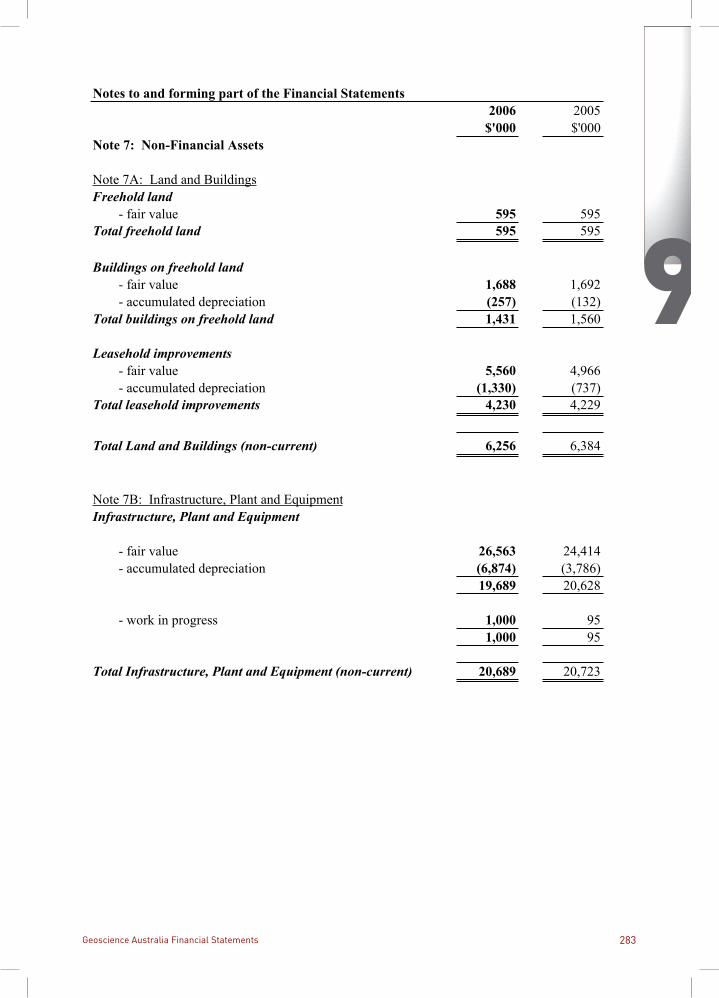
$'000 $'000Note 7: Non-Financial Assets
Note 7A: Land and BuildingsFreehold land
- fair value 595 595Total freehold land 595 595
Buildings on freehold land - fair value 1,688 1,692- accumulated depreciation (257) (132)
Total buildings on freehold land 1,431 1,560
Leasehold improvements - fair value 5,560 4,966- accumulated depreciation (1,330) (737)
Total leasehold improvements 4,230 4,229
Total Land and Buildings (non-current) 6,256 6,384
Note 7B: Infrastructure, Plant and EquipmentInfrastructure, Plant and Equipment
- fair value 26,563 24,414- accumulated depreciation (6,874) (3,786)
19,689 20,628
- work in progress 1,000 951,000 95
Total Infrastructure, Plant and Equipment (non-current) 20,689 20,723

284 ITR Annual Report 2005–06
Not
es to
and
form
ing
part
of t
he F
inan
cial
Sta
tem
ents
Not
e 7C
: A
naly
sis o
f Pro
perty
, Pla
nt a
nd E
quip
men
t
TA
BL
E A
- R
econ
cilia
tion
of th
e O
peni
ng a
nd C
losi
ng B
alan
ces o
f Pro
pert
y, P
lant
and
Equ
ipm
ent
Item
Lan
dB
uild
ings
on
Free
hold
Lan
dB
uild
ings
- L
ease
hold
Impr
ovem
ents
Bui
ldin
gs -
Tot
alL
and
and
Bui
ldin
gsT
otal
Oth
er IP
&E
$'00
0$'
000
$'00
0$'
000
$'00
0$'
000
As a
t 1 J
uly
2005
G
ross
boo
k va
lue
595
1,69
24,
966
6,65
87,
253
24,5
09
Acc
umul
ated
dep
reci
atio
n/am
ortis
atio
nn/
a(1
32)
(737
)(8
69)
(869
)(3
,786
)O
peni
ng n
et b
ook
valu
e59
51,
560
4,22
95,
789
6,38
420
,723
Add
ition
s:
by p
urch
ase
--
606
606
606
5,81
6
Net
reva
luat
ion
incr
emen
t/(de
crem
ent)
--
--
--
Ass
ets r
ecla
ssifi
ed-
--
--
(31)
Dep
reci
atio
n/am
ortis
atio
n ex
pens
en/
a(1
27)
(596
)(7
23)
(723
)(4
,300
)R
ecov
erab
le a
mou
nt w
rite-
dow
ns-
--
--
(990
)
Dis
posa
ls:
othe
r dis
posa
ls-
(2)
(9)
(11)
(11)
(528
)
As a
t 30
June
200
6 G
ross
boo
k va
lue
595
1,68
85,
560
7,24
87,
843
27,5
63 A
ccum
ulat
ed d
epre
ciat
ion/
amor
tisat
ion
n/a
(257
)(1
,330
)(1
,587
)(1
,587
)(6
,874
)C
losi
ng n
et b
ook
valu
e 59
51,
431
4,23
05,
661
6,25
620
,689

285
9
Geoscience Australia Financial Statements
Geoscience Australia
Financial Staemm
ents
Notes to and forming part of the Financial Statements
Note 7C: Analysis of Infrastructure, Plant and Equipment (continued)
TABLE B - Infrastructure, Plant, Equipment under Construction
Item Other IP&E
$'000Carrying amount at 30 June 2006 1,000
Carrying amount at 30 June 2005 95

286 ITR Annual Report 2005–06
Notes to and forming part of the Financial Statements
2006 2005$'000 $'000
Note 7D: IntangiblesComputer software:
Purchased - in use 9,261 8,347Accumulated amortisation (7,383) (6,559)
1,878 1,788
Total intangibles (non-current) 1,878 1,788
TABLE A - Reconciliation of the opening and closing balances of intangibles
2006 2005$'000 $'000
Note 7E: InventoriesFinished goods 320 320Total inventories 320 320
All departmental inventories are current assets.
Note 7F: Other Non-Financial AssetsPrepayments 3,125 2,431
Current 3,038 2,431Non-current 87 -Total prepayments 3,125 2,431
Depreciation/amortisation
Item
As at 1 July 2005 Gross book value Accumulated depreciation/amortisation
Reclassifications
1,788
940
other disposals
Opening net book value
Additions: by purchase
Computer software purchased
$'000
8,347(6,559)
(866)
31
Closing net book value 1,878
(15)
As at 30 June 2006 Gross book value Accumulated depreciation/amortisation
Disposals:
9,261(7,383)

287
9
Geoscience Australia Financial Statements
Geoscience Australia
Financial Staemm
ents
Notes to and forming part of the Financial Statements
2006 2005$'000 $'000
Note 8: Provisions & Entitlements
Note 8A: Employee Entitlement LiabilitiesSalaries and wages 383 169Leave 16,249 15,787Superannuation 1,668 1,398
Current 16,372 15,864Non-current 1,928 1,490Total employee entitlement liabilities 18,300 17,354
Note 8B: Other ProvisionsProvision for 'Makegood' 1,189 1,221Total other provisions 1,189 1,221
Provision for Makegood
$'000
Carrying amount at beginning of period 1,221Unwinding of discounted amount arising from the passage of time (32)
Amount owing at end of period 1,189
Geoscience Australia currently has two agreements for the leasing of premises which have provisionsrequiring Geoscience Australia to restore premises to their original condition at the conclusion of thelease. Geoscience Australia has made a provision to reflect the present value of this obligation.
17,35418,300Total employee entitlement liabilities

288 ITR Annual Report 2005–06
Notes to and forming part of the Financial Statements
2006 2005$'000 $'000
Note 9: Payables
Note 9A: SuppliersTrade creditors 5 74Total supplier payables 5 74
All supplier payables are current liabilities.
Settlement is usually made net 30 days. (2004-05 - 30 days)
Note 9B: Other PayablesUnearned income 1,455 977Lease incentive liability 99 119Other payables 97 -Accrued expenses 8,417 6,276Total other payables 10,068 7,372
All Other Payables are current liabilities.

289
9
Geoscience Australia Financial Statements
Geoscience Australia
Financial Staemm
ents
Notes to and forming part of the Financial Statements
Note 10: Cash Flow Reconciliation
2006 2005$'000 $'000
Reconciliation of Cash per BalanceSheet to Statement of Cash FlowsCash at year end per Statement of Cash Flows 2,170 3,469Balance Sheet items comprising abovecash: 'Financial Asset - Cash' 2,170 3,469
Reconciliation of net surplus to net cash fromoperating activitiesOperating result 2,866 (958)Depreciation / amortisation 5,889 5,502Net write down of non-financial assets 990 -Loss on disposal of assets 392 216(Increase) / decrease in net receivables (10,275) (116)(Increase) / decrease in accrued revenues (1,029) (554)(Increase) / decrease in inventories - (28)(Increase) / decrease in prepayments (694) 98Increase / (decrease) in employee provisions 946 1,016Increase / (decrease) in other provisions (32) 179Increase / (decrease) in supplier payables (69) 593Increase / (decrease) in other payables 2,696 208Net cash from / (used by) operating activities 1,680 6,156

290 ITR Annual Report 2005–06
Notes to and forming part of the Financial Statements
Note 11: Executive Remuneration
The number of executives who received or were dueto receive total remuneration of $130,000 or more:
2006 2005
$145 000 to $159 999 - 1$160 000 to $174 999 - 1$175 000 to $189 999 3 1$190 000 to $204 999 1 4$205 000 to $219 999 2 -$220 000 to $234 999 1 4$235 000 to $249 999 3 -$250 000 to $264 999 - 1Total 10 12
The aggregate amount of total remuneration of executives shown above. $2,112,545 $2,466,484
Note 12: Remuneration of Auditors2006 2005
$ $Financial statement audit services are provided free of charge to Geoscience Australia. The fair value of these services is recognised. 115,000 110,000In addition to the amount disclosed above, there are additional amounts of auditor remuneration relating to the 2005/06 financial statement audit, arising from work done on the opening balance sheet to be prepared under Australian Equivalents to International Financial Reporting Standards. - 6,500
115,000 116,500
No other services were provided by the Auditor General.
Note 13: Average Staffing Levels 2006 2005
641 628The average staffing levels for Geoscience Australia during the year were:

291
9
Geoscience Australia Financial Statements
Geoscience Australia
Financial Staemm
ents
Not
es to
and
form
ing
part
of t
he F
inan
cial
Sta
tem
ents
Not
e 14
: Fi
nanc
ial I
nstr
umen
ts
Not
e 14
A:
Inte
rest
Rat
e R
isk
Fina
ncia
lN
otes
Inst
rum
ent
Mat
urin
g In
2006
2005
2006
2005
2006
2005
2006
2005
2006
2005
2006
2005
2006
2005
$'00
0$'
000
$'00
0$'
000
$'00
0$'
000
$'00
0$'
000
$'00
0$'
000
$'00
0$'
000
%%
Fina
ncia
l Ass
ets
Cas
h at
Ban
k 6A
--
--
--
--
2,17
03,
469
2,17
03,
469
n/a
n/a
Rec
eiva
bles
for g
oods
an
d se
rvic
es (g
ross
)6B
--
--
--
--
3,04
22,
728
3,04
22,
728
n/a
n/a
App
ropr
iatio
nsre
ceiv
able
6B-
--
--
--
-22
,268
12,2
6822
,268
12,2
68n/
an/
aA
ccru
ed R
even
ue6C
--
--
--
--
2,46
11,
432
2,46
11,
432
n/a
n/a
Tota
l-
--
--
--
-29
,941
19,8
9729
,941
19,8
97
Tota
l Ass
ets
62,7
2352
,095
Fina
ncia
l Lia
bilit
ies
Trad
e cr
edito
rs9A
--
--
--
--
574
574
n/a
n/a
Acc
rued
exp
ense
s9B
--
--
--
--
8,41
76,
276
8,41
76,
276
n/a
n/a
Tota
l-
--
--
--
-8,
422
6,35
08,
422
6,35
0To
tal L
iabi
litie
s29
,562
26,0
21
Floa
ting
Inte
rest
R
ate
Fixe
d In
tere
st R
ate
1 ye
ar o
r le
ss1
to 5
yea
rs>
5 ye
ars
Eff
ectiv
eIn
tere
st R
ate
Non
-In
tere
st B
eari
ngT
otal
Wei
ghte
dA
vera
ge

292 ITR Annual Report 2005–06
Notes to and forming part of the Financial Statements
Note 14: Financial Instruments (continued)
Note 14B: Fair Values of Financial Assets and Liabilities
Notes Total CarryingAmount
AggregateFair Value
TotalCarryingAmount
AggregateFair Value
$'000 $'000 $'000 $'000Departmental
Financial AssetsCash at Bank 6A 2,170 2,170 3,469 3,469Receivables for goods and services (net) 6B 3,035 3,035 2,728 2,728Appropriations receivable 6B 22,268 22,268 12,268 12,268Accrued Revenue 6C 2,461 2,461 1,432 1,432Total Financial Assets 29,934 29,934 19,897 19,897
Financial Liabilities (Recognised)Trade creditors 9A 5 5 74 74Accrued expenses 9B 8,417 8,417 6,276 6,276Total Financial Liabilities (Recognised)
8,422 8,422 6,350 6,350
2006 2005

293
9
Geoscience Australia Financial Statements
Geoscience Australia
Financial Staemm
ents
Notes to and forming part of the Financial Statements
Note 14: Financial Instruments (continued)
Note 14C: Credit Risk Exposures
Geoscience Australia has no significant exposures to any concentrations of credit risk.
All figures for credit risk referred to do not take into account the value of any collateral or other security.
Geoscience Australia's maximum exposures to credit risk at reporting date in relation to each class of recognised financial assets is the carrying amount of those assets as indicated in the Balance Sheet.

294 ITR Annual Report 2005–06
Notes to and forming part of the Financial Statements
2006 2005$'000 $'000
Note 15: Expenses Administered on Behalf of Government
Note 15A: Grants
GrantsOverseas 20 20Total Grants 20 20
The nature of grants are as follows:UN Grants in Aid to individuals 20 20
Total Expenses Administered on Behalf of Government 20 20

295
9
Geoscience Australia Financial Statements
Geoscience Australia
Financial Staemm
ents
Notes to and forming part of the Financial Statements
2006 2005$'000 $'000
Note 16: Assets Administered on Behalf of GovernmentNotes
Financial Assets
Note 16A: Cash and Cash equivalents
- Australia New Zealand Land Information Special Account 21 661 710
Total Assets Administered on Behalf of Government 661 710

296 ITR Annual Report 2005–06
Notes to and forming part of the Financial Statements
2006 2005$'000 $'000
Note 17: Liabilities Administered on Behalf of Government
Payables
Note 17A: Other payables
Special accounts 661 710
Total Liabilities Administered on Behalf of Government 661 710
297
9
Geoscience Australia Financial Statements
Geoscience Australia
Financial Staemm
ents
Notes to and forming part of the Financial Statements
2006 2005$'000 $'000
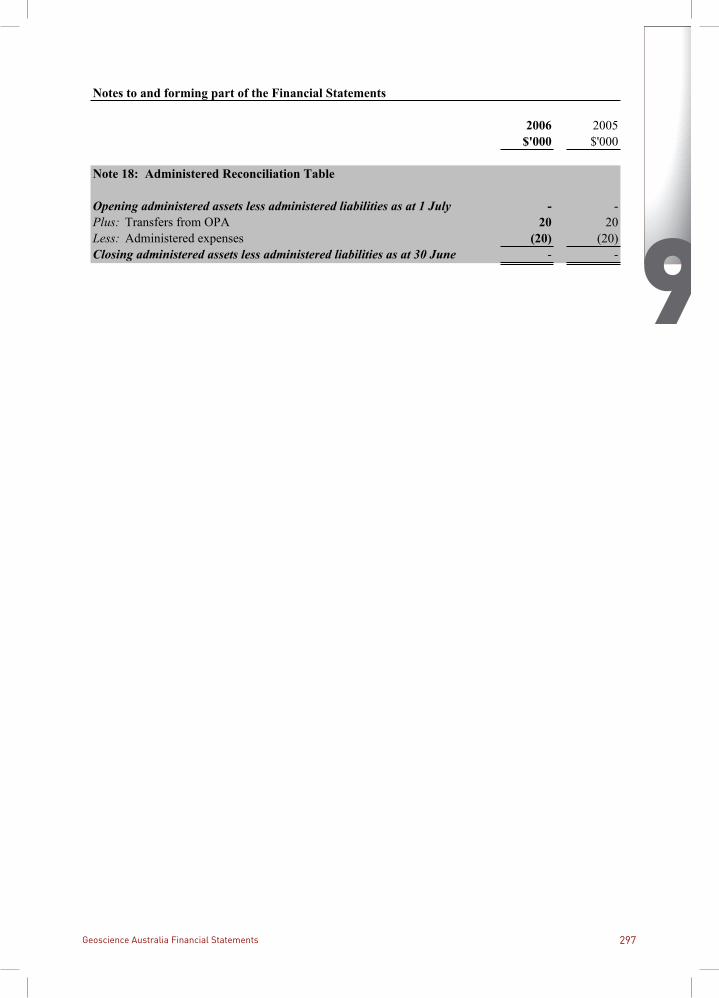
Note 18: Administered Reconciliation Table
Opening administered assets less administered liabilities as at 1 July - -Plus: Transfers from OPA 20 20Less: Administered expenses (20) (20)Closing administered assets less administered liabilities as at 30 June - -
298 ITR Annual Report 2005–06
Not
es to
and
form
ing
part
of t
he F
inan
cial
Sta
tem
ents
Not
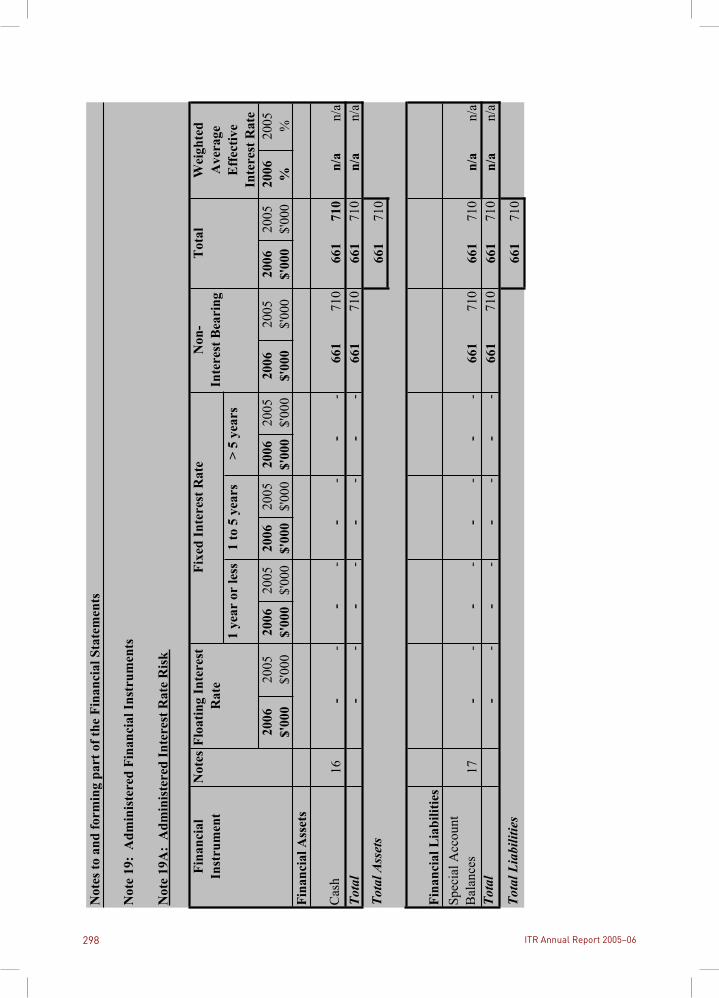
e 19
: A
dmin
iste
red
Fina
ncia
l Ins
trum
ents
Not
e 19
A:
Adm
inis
tere
d In
tere
st R
ate
Ris
k
Fina
ncia
lN
otes
Inst
rum
ent
2006
2005
2006
2005
2006
2005
2006
2005
2006
2005
2006
2005
2006
2005
$'00
0$'
000
$'00
0$'
000
$'00
0$'
000
$'00
0$'
000
$'00
0$'
000
$'00
0$'
000
%%
Fina
ncia
l Ass
ets
Cas
h16
--
--
--
--
661
710
661
710
n/a
n/a
Tota
l-
--
--
--
-66
171
066
171
0n/
an/
a
Tota
l Ass
ets
661
710
Fina
ncia
l Lia
bilit
ies
Spec
ial A
ccou
nt
Bal
ance
s17
--
--
--
--
661
710
661
710
n/a
n/a
Tota
l-
--
--
--
-66
171
066
171
0n/
an/
a
Tota
l Lia
bilit
ies
661
710
Eff
ectiv
eIn
tere
st R
ate
Non
-In
tere
st B
eari
ngT
otal
Wei
ghte
dA
vera
geFl
oatin
g In
tere
st
Rat
eFi
xed
Inte
rest
Rat
e
1 ye
ar o
r le
ss1
to 5
yea
rs>
5 ye
ars

299
9
Geoscience Australia Financial Statements
Geoscience Australia
Financial Staemm
ents
Notes to and forming part of the Financial Statements
Note 19: Administered Financial Instruments (continued)
Note 19B: Net Fair Values of Administered Financial Assets and Liabilities
Financial Assets
Financial Liabilities
Note 19C: Credit Risk Exposures
Geoscience Australia has no significant exposures to any concentrations of credit risk.
Geoscience Australia's maximum exposures to credit risk at reporting date in relation to each class of recognised financial assets is the carrying amount of those assets as indicated in the Administered Balance Sheet.
The net fair values of cash and non-interest-bearing monetary financial assets approximate their carrying amounts.
The net fair values for other payables are approximated by their carrying amounts.

300 ITR Annual Report 2005–06
Not
es to
and
form
ing
part
of t
he F
inan
cial
Sta
tem
ents
Not
e 20
: A
ppro
pria
tions
Not
e 20
A:
Acq
uitt
al o
f Aut
hori
ty to
Dra
w C
ash
from
the
Con
solid
ated
Rev
enue
Fun
d fo
r O
rdin
ary
Ann
ual S
ervi
ces A
ppro
pria
tions
Part
icul
ars
2006
2005
2006
2005
2006
2005
$$
$$
$$
Bal
ance
car
ried
from
pre
viou
s yea
r-
-
16
,529
,659
15
,591
,951
16,5
29,6
59
15
,591
,951
A
djus
tmen
t2-
-
(2
40,8
96)
-
-
-
Red
uctio
n of
app
ropr
iatio
ns (p
rior y
ears
)1-
-
-
-
-
-
Adj
uste
d B
alan
ce c
arri
ed fo
r pre
viou
s per
iod
-
-
16,2
88,7
63
15,5
91,9
51
16,2
88,7
63
15,5
91,9
51
App
ropr
iatio
n A
ct (N
o.1)
-
20,0
00
107,
440,
000
101,
055,
000
10
7,44
0,00
0
101,
075,
000
App
ropr
iatio
n A
ct (N
o.2)
-
-
4,
221,
000
-
4,22
1,00
0
-
D
epar
tmen
tal a
djus
tmen
ts b
y th
e Fi
nanc
e M
inis
ter (
App
ropr
iatio
n A
cts)
n/a
n/a
-
(1
32,0
00)
-
(1
32,0
00)
Adv
ance
to th
e Fi
nanc
e M
inis
ter
-
-
-
-
-
-
A
djus
tmen
t of a
ppro
pria
tions
on
chan
ge o
f ent
ity fu
nctio
n (F
MA
s32)
-
-
-
-
-
-
R
efun
ds c
redi
ted
(FM
A s3
0)-
-
-
-
-
-
App
ropr
iatio
n re
duce
d by
sect
ion
9 de
term
inat
ions
(cur
rent
yea
r )1-
-
-
-
-
-
Sub-
tota
l Ann
ual A
ppro
pria
tion
-
20
,000
12
7,94
9,76
3 11
6,51
4,95
1 12
7,94
9,76
3 11
6,53
4,95
1 A
ppro
pria
tions
to ta
ke a
ccou
nt o
f rec
over
able
GST
(FM
A s3
0A)
-
2,
000
3,94
9,13
7 6,
564,
965
3,94
9,13
7 6,
566,
965
Ann
otat
ions
to 'n
et a
ppro
pria
tions
' (FM
A s3
1)-
23,3
12,1
63
15,2
17,0
42
23,3
12,1
63
15,2
17,0
42
Tota
l app
ropr
iatio
ns a
vaila
ble
for p
aym
ents
-
22
,000
15
5,21
1,06
3 13
8,29
6,95
8 15
5,21
1,06
3 13
8,31
8,95
8 C
ash
paym
ents
mad
e du
ring
the
year
(GST
incl
usiv
e)-
22,0
00
130,
252,
091
121,
767,
300
130,
252,
091
121,
789,
300
App
ropr
iatio
ns c
redi
ted
to S
peci
al A
ccou
nts (
excl
udin
g G
ST)
-
-
-
-
-
-
B
alan
ce o
f Aut
hori
ty to
Dra
w C
ash
from
the
CR
F fo
r Ord
inar
y A
nnua
l Se
rvic
es A
ppro
pria
tions
-
-
24,9
58,9
72
16
,529
,658
24
,958
,972
16
,529
,658
Rep
rese
nted
by:
Cas
h at
ban
k an
d on
han
d-
-
2,
169,
848
3,
468,
839
2,16
9,84
8
3,
468,
839
U
ndra
wn,
unl
apse
d ap
prop
riatio
ns-
-
22
,268
,001
12,2
68,0
01
22
,268
,001
12,2
68,0
01
Rec
eiva
bles
- G
ST re
ceiv
able
from
cus
tom
ers
-
-
-
24
7,65
0
-
24
7,65
0
O
ther
rece
ivab
les -
Net
GST
rece
ivab
le fr
om th
e A
TO-
-
52
1,12
3
55
1,92
3
521,
123
55
1,92
3
O
ther
pay
able
s - N
et G
ST p
ayab
le to
the
ATO
-
-
-
-
-
-
Pa
yabl
e - S
uppl
iers
- G
ST p
ortio
n-
-
-
(6,7
54)
-
(6
,754
)Sa
ving
s in
Portf
olio
Add
ition
al E
stim
ates
Sta
tem
ent
-
-
-
-
-
-
To
tal
-
-
24,9
58,9
72
16
,529
,659
24,9
58,9
72
16
,529
,659
2 Adj
ustm
ent f
or p
rior y
ear G
ST d
iscl
osur
e.
1 The
Fin
ance
Min
iste
r may
det
erm
ine
amou
nts o
f adm
inis
tere
d ap
prop
riatio
ns to
be
laps
ed, h
avin
g re
gard
to e
xpen
ses i
ncur
red.
In
prio
r yea
rs, G
eosc
ienc
e A
ustra
lia h
as e
stim
ated
the
amou
nt o
f cur
rent
yea
r ap
prop
riatio
ns to
be
laps
ed b
ased
on
expe
nses
incu
rred
.
Adm
inis
tere
d E
xpen
ses
Out
com
e 1
Dep
artm
enta
l Out
puts
Tot
al

301
9
Geoscience Australia Financial Statements
Geoscience Australia
Financial Staemm
ents
Notes to and forming part of the Financial Statements
Note 21: Special Accounts
2006 2005$ $
Australian Geological Survey Account (Administered)
Legal authority/Appropriation: Financial Management and Accountability Act, 1997; s20Purpose: for expenditure on agreed research projects and other program activities performed in conjunction with, or for private or other entities.
This account is non-interest bearingBalance carried from previous year 218,269 179,597Other receipts 263,615 217,431Available for payments 481,884 397,028Payments made to suppliers 271,269 178,759Balance carried to next year 210,615 218,269
Represented by:Cash on call held in the OPA 210,615 218,269Net GST payable to the Australian Tax Office - - Total 210,615 218,269
Australia New Zealand Land Information Special Account (Administered)
Legal authority/Appropriation: Financial Management and Accountability Act, 1997; s20Purpose: for the expenditure of moneys to meet the financial and administrativeoperation of the National Office of ANZLISA.
This account is non-interest bearingBalance carried from previous year 674,576 651,935Other receipts 415,902 489,703GST credits (FMA s30A) 90,361 127,679Available for payments 1,180,839 1,269,317Payments made 540,782 594,741Balance carried to next year 640,057 674,576
Represented by:Cash on call held in the OPA 661,234 710,064Net GST payable to the Australian Tax Office (21,177) (35,488)Total 640,057 674,576
The AGSO Account comprise funds from the United States Air Force (USAF). The funds are used to pay operating costs of the Joint Geology and Geophysics Station (JGGRS) at Alice Springs. This account is not included in the Schedule of Administered Items as Geoscience Australia only has custody and access to the funds to arrange disbursement in its capacity of providing administrative support. Geoscience Australia has no discretion over any of the funds contributed by USAF.

302 ITR Annual Report 2005–06
Notes to and forming part of the Financial Statements
Note 22: Comcare Account
This account holds monies advanced to Geoscience Australia by Comcare for the purpose of distributingcompensation payments made in accordance with the Safety Rehabilitation and Compensation Act 1998.Where Geoscience Australia makes payments against accrued sick leave entitlements pending determinationof an employee's claim, permission is obtained in writing from each individual to allow Geoecience Australiato recover the payments from the monies in the account.
2006 2005$'000 $'000
Balance carried forward from previous year - -Receipts during the year 92 86Available for payments 92 86Payments made 92 86Balance carried forward to next year by the entity - -

303
9
Geoscience Australia Financial Statements
Geoscience Australia
Financial Staemm
ents
Notes to and forming part of the Financial Statements
Note 23: Compensation and Debt Relief
No 'Act of Grace' payments were made during the reporting period, and there were no amounts owing as atyear end (2005: No payments made).
No waivers of amounts to the Commonwealth were made pursuant to subsection 34(1) of theFinancial Management and Accountability Act 1997 (2005: No waivers made).
No ex-gratia payments were provided for during the reporting period (2005: No payments made).

304 ITR Annual Report 2005–06
Notes to and forming part of the Financial Statements
Note 24: Reporting of Outcomes
Note 24A: Net Cost of Outcome Delivery
Expenses2006 2005 2006 2005
$'000 $'000 $'000 $'000Administered 20 20 20 20Departmental 126,914 118,390 126,914 118,390Total expenses 126,934 118,410 126,934 118,410Costs recovered from provision of goods and services tothe non-government sectorAdministered - - - -Departmental 11,215 10,842 11,215 10,842Total costs recovered 11,215 10,842 11,215 10,842Other external revenuesAdministeredDepartmental Other 1,717 1,636 1,717 1,636 Goods and Services Revenue from Related Entities 9,408 4,031 9,408 4,031Total Departmental 11,125 5,667 11,125 5,667Total other external revenues 11,125 5,667 11,125 5,667Net cost of outcome 104,594 101,901 104,594 101,901
Outcome 1 is described in Note 1.1. Net costs include intra-government costs that are eliminated in calculating the actual Budget Outcome.
Outcome 1 Total

305
9
Geoscience Australia Financial Statements
Geoscience Australia
Financial Staemm
ents
Notes to and forming part of the Financial Statements
Note 24: Reporting of Outcomes (continued)
Note 24B : Major Classes of Departmental Revenues and Expenses by Output Groups and Outputs
Outcome 1
2006 2005 2006 2005$'000 $'000 $'000 $'000
Departmental expensesEmployees 53,199 49,589 53,199 49,589Suppliers 66,437 62,902 66,437 62,902Depreciation and amortisation 5,889 5,502 5,889 5,502Other expenses 1,389 397 1,389 397Total departmental expenses 126,914 118,390 126,914 118,390Funded by:Revenues from government 107,440 100,923 107,440 100,923Sale of goods and services 20,623 14,873 20,623 14,873Other revenues 1,549 1,487 1,549 1,487Other gains 168 149 168 149Total departmental revenues 129,780 117,432 129,780 117,432
Outcome 1 is described in Note 1.1.
Net costs shown include intra-government costs that are eliminated in calculating the actual Budget outcome.
Note 24C: Major Classes of Administered Revenues and Expenses by Outcome
2006 2005 2006 2005$'000 $'000 $'000 $'000
Administered ExpensesGrants 20 20 20 20Total administered expenses 20 20 20 20
Output Group 1 Outcome 1 Total
Output 1.1
Outcome 1 Total

306 ITR Annual Report 2005–06
Notes to and forming part of the Financial Statements
Note 25: Joint venture operations
Geoscience Australia was a party to eight joint ventures as at 30 June 2006. These are accounted for in accordance with AAS131 “Interest in Joint Ventures”.
Six of the joint ventures are Cooperative Research Centres (CRCs) and have been classified and accounted for as joint venture operations. Geoscience Australia is also a party to the Tasmania Earth Resources Satellite Station (TERSS) and the Australian National Seismic Imaging Resource (ANSIR) joint venture operations.
Cooperative Research Centres
The Cooperative Research Centres Program was launched in 1990 by the Commonwealth Government. It was established to assist two or more collaborators to carry out research contributing to the development of internationally competitive industry sectors. The Program supports long term high quality research, improved links between research and application, and stimulation of education and training.
Geoscience Australia’s interest in the output of each CRC is determined by the individual CRC agreement. These are:
Name of CRC 2006 2005 Interest (%) Interest (%)
Coastal zone, estuary and waterway management 10 9Landscape environments and mineral exploration 22 22 Predictive mineral discoveries 30 30 Cooperative Research Centre for Spacial Information 8 8 Great Barrier Reef World Heritage Area 2 2 Greenhouse Gas Technologies 13 7
During the financial year, Geoscience Australia’s total cash and “in-kind” contributions to CRCs from its own resources was $8.438m (2004-05: $11.270m). Contributions and expenses are included in the Income Statement. Geoscience Australia’s total contributions for the life of the CRCs listed above amount to $65.694m (2004-05: $62.457m).
Geoscience Australia had no assets or liabilities employed in any CRC at 30 June 2006.
Tasmania Earth Resources Satellite Station (TERSS)
Geoscience Australia has a 19% (2004-05: 18%) interest in the TERSS joint venture which maintains and operates a satellite station for the purposes of receiving and managing Earth observation satellite data and encouraging research and development in the field of Earth observation science and engineering.
Geoscience Australia interest in the assets employed in the joint venture are included in the Balance Sheet, in accordance with the accounting policy described in note 1, under the following classifications:

307
9
Geoscience Australia Financial Statements
Geoscience Australia
Financial Staemm
ents
Notes to and forming part of the Financial Statements
2005-06 2004-05$’000 $’000
Current assetsCash 21 4
21 4Non current assets Infrastructure, plant and equipment 472 438Less: accumulated depreciation 105 48
367 390
Share of assets employed in Joint Venture 388 394
The Australian National Seismic Imaging Resource (ANSIR)
Geoscience Australia has a 90% interest in the output of ANSIR joint venture with the Australian National University. The work undertaken by this joint venture is in relation to the development of seismic imaging through improved data acquisition and interpretation methods. Geoscience Australia had no assets employed in the ANSIR joint venture at 30 June 2006.