financial statement analysis of a cement company
TRANSCRIPT

**Financial Statement Analysis of Lucky Cement **
Presented to:* X
Presented By:* Y & Z

Lucky CementFinancial Statement Analysis : It is the process of identifying financial strengths and weaknesses of the firm by properly establishing relationship b/w the balance sheet & P/L Account.

Tools & techniques of Financial statement Analysis
• Horizontal Analysis
• Vertical Analysis
• Ratio Analysis

Ratio AnalysisTypes of Ratios & their Purposes
• Profitability ratios .Measures the profitability of the business organization.
• Liquidity ratios measures whether a company is able to pay its short term obligations.
• Leverage ratios show how a company’s operations are financed. Or Ability to pay Long term obligations.
• Activity ratios: It measure that how efficiently the resources have been utilized.

Profitability Ratios
• Gross Profit Ratio
• Net Profit Ratio• Operating Profit Ratio• Admin Expense Ratio• Return on Investment ratio/Net worth
• Return on Equity Ratio
• Return on Asset Ratio

1. Gross Profit ratio = Gross profit/Net Sales * 100
For 2008: 4357173 / 1695787 *100 = 25.6 %
For 2009: 9811266/26330404 *100 = 37.2%
For 2010: 7978861/24508793 *100 = 32.5%
Interpretation: In 2008 cost of sales is 74% which is more than the 2009 & 2010 (62.74% & 67.44%).

2. Net Profit Ratio = Net Profit after tax / net sales *100
• Interpretation: In 2010 our operating expenses are more than the previous years due to which our profit margin reduce.
For 2008: = 2677670 / 16957879 *100 = 15.7%
For 2009 = 4596549 / 26330404*100 = 17.45%
For 2010 = 3137457 / 24508793*100 = 12.8%

3. Return on Investment ratio/ Net worth = Net income after tax *100 . Total Liabilities + Owners Equity
• Interpretation: In 2010 our return on investment is less than the 2009 because In 2010 our profit margin reduce
For 2008 2677670 / 3423907 *100 = 7.8%
For 2009 4596549/ 38392362*100 =11.97%
For 2010 3137457 / 38310244*100 = 8.18%

4. Return on equity = Net profit after tax *100 Shareholder fund
• Interpretation: 2009 is more favourable as compare to other 2 years because return on shareholder investment is increased.
For 2008 2677670 / 18655423*100 = 14.3%
For 2009 4596549 / 23251972*100 = 19.76%
For 2010 3137457 / 25092929*100 = 12.5%

5. Return on Asset Ratio = Net Income after tax * 100 Total Assets
For 2008 2677670 / 34239077 *100 = 7.8%
For 2009 4596549 / 38392362*100 = 11.9%
For 2010 3137457 / 38310244*100 = 8.2%

6. Admin Expense ratio= Admin. Expense/ Net Sales*100
• Interpretation: 2009 is more favourable
For 2008 125752 / 16957879*100 = 0.74%
For 2009 165936/26330404*100 = 0.63%
For 2010 303244/2450879*100 = 1.2%

7 Operating Profit Ratio =Operating Profit / Net Sales*100
• For 2008 3076367 /16957879 *100= 18%• For 2009 7217793/26330404*100=27%• For 2010 4242570/24508793*100=17%

Liquidity Ratios The Ability of a company to Pay short term obligations
1. Current Ratio
2. Quick or Acid test or Liquid Ratio
3. Absolute Liquid Ratio

1. Current Ratio = Current Assets / Current Liabilities
• For 2008 8,355,524 / 7,686,897 = 1.08 :1• For 2009 7,857,942 / 9098678 = 0.86 :1• For 2010 6,871,464 / 9,641,691 = 0.70 :1
• Interpretation: In 2008 as we see that , to pay off the liability of Rs1 Lucky cement have assets of Rs. 1.08.But in 2009 and 2010 it is declined to 0.86 & 0.70 and it is very difficult for lucky cement to pay off its liability because assets are less than the liabilities.

2. Liquid Ratio = Liquid Assets / Current Liabilities
Liquid Assets = current assets - Inventories (stock in trade)
• For 2008 7646152 / 7686897 = 1 :1• For 2009 6661334 / 9098678 = 0.73 :1
• For 2010 6262651/9641691 = 0.65 : 1
• Interpretation :Here the liquid ratio of the year 2010 is declining because company is holding huge amount of inventory as compared previous year .
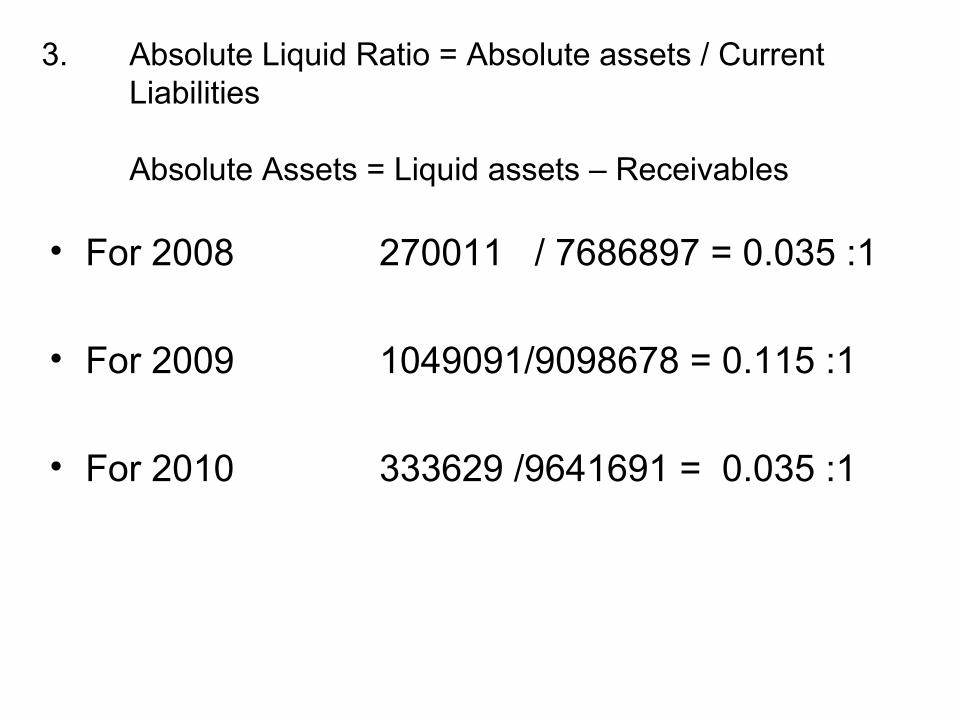
3. Absolute Liquid Ratio = Absolute assets / Current Liabilities
Absolute Assets = Liquid assets – Receivables
• For 2008 270011 / 7686897 = 0.035 :1
• For 2009 1049091/9098678 = 0.115 :1
• For 2010 333629 /9641691 = 0.035 :1

Activity/ Efficiency RatiosMeasures how efficient the resources have been utilized.
1. Inventory/Stock turnover ratio
2. Debtor/ Receivable turnover ratio
3. Creditor/ Payable turnover ratio
4. Working capital ratio
5. Fixed Asset turnover ratio

Inventory turnover ratio= CGS / Average Inventory
• For 2008 12600706 / (709372)/1 = 18 times• For 2009 16519138 /(709372+1196608)/2 = 17 times• For 2010 16529732 /(1196608+608813)/2 = 19 times
• Interpretation: Inventory turnover ratio indicates the effectiveness of the inventory management practices of the firm. The inventory turnover ratio in 2010 is increasing as compared to the previous years, this shows that 19 times in a year the inventory of the firm is converted in to receivables or cash.

Average Conversion Period= No of working days / ITR
• For 2008 360 / 17.76 = 20.2 or 20 days • Fro 2009 360/ 17.33 = 20.77 or 21 days• For 2010 360/ 18.31= 19 days
• Interpretation : Lower the conversion period better for the Org.
The Average collection period in year 2008 was 20 days which means that the firm is able to collect its receivables within 20 days. However in 2009 it increased to 21 days which means that company is able to collect their receivables in a period of 21 days. However in 2010 it is 19 days. This is because of the efficiency of the management that the lucky cement is collecting fast as compare to the previous year.

Working Capital turnover ratio= CGS / Net Working Capital
• Net Working Capital = Current Assets – Current Liabilities
• For 2008 12600706/18655423 = 0.67 or 67%• For 2009 16519138 /23251972 = 0.71 or 71 %
• For 2010 16529932/25095929 = 0.65 or 65%
• Interpretation: The working Capital ratio measures the efficiency with which the working capital is being used by a firm. A high ratio indicates efficient utilization of working capital and a low ratio indicates otherwise.

Debtor turnover ratio = Net sales / Average A/R
For 2008: = 16957879 / 720314 = 24 times
For 2009: = 26330404 /993781 = 27 times
For 2010: = 24508793/ 922289 = 26 times
In 2009 27 times , receivables is received from the govt, so we can say that company is working efficiently in 2009.

Average Collection Period = No of working days / DTR
• For 2008 360 /24 = 15 days
• For 2009 360/27 = 13 days
• For 2010 360/26 = 14 days

Creditor turnover ratio = Net credit purchases/ Average A/P
Purchases= CGS + closing inventory – Opening inventory
• For 2008 13310178 / 3549543 = 3.74 times• For 2009 17006374/ 3113449.5 =5.46 times• For 2010 15942137/ 2860338 =5.57 times

Average payment period = No of working days/ CTR
• For 2008 360/4.95 = 96.25 or 72 days
• For 2009 360/5.46 = 65.93 or 66 days
• For 2010 360/5.57 = 64.63 or 65 days

Leverage / solvency Ratios Ability to pay Long term obligations
1. Debt Equity Ratio
2. Proprietary Ratio/ Equity Ratio
3. Debt Service/ Interest coverage ratio
4. Capital Gearing Ratio

Debt Equity Ratio =Long term debt/ Long term Funds
• Long term funds = Long term debt + Share Holder Funds
• For 2008 7896754 / 7896794+18655723 = 0.30 • For 2009 6041712 / 6041712 +23251972= 0.21
• For 2010 3572624/ 3572624 + 25092929 = 0.12
• Interpretation: As we see that debt equity ratio in 2010 is decreasing as compared to previous years which means that shareholders are investing more as compared to previous years to pay off long term obligations.

Proprietary Ratio = Shareholders funds / Total Assets
• For 2008 18655423 /34239072 = 0.54 or 54%• For 2009 23251972/38392362 = 0.61 or 61 %• For 2010 25092929/38310392 =0.65 or 65 %
• Interpretation = This means that out of every 1 Rs employed in the business ,Sharholders contribution is about 54 % in 2008 ….Accordingly the creditors contribution would be the remaining 36 %.