financial statement analysis of mondi Świecie s.a. agata kocia, ph.d., mba based on presentation of...
Post on 22-Dec-2015
216 views
TRANSCRIPT

Financial statement analysis of Mondi Świecie S.A.
Agata Kocia, Ph.D., MBAbased on presentation of Piotr Sokołowski

Company’s history • 1991 – Pulp and Paper Plant in Świeć wholly transformed
into sole proprietorship State Treasury company • 1997 – introduced 15% of the shares onto the Warsaw
Stock Exchange and sold majority stake in the Framondi NV company
• Since 2008 - Mondi Świecie SA

Ownership structure
Pozostali16,29%
Aviva OFE Aviva BZ WBK
7,31%
ING OFE10,4%
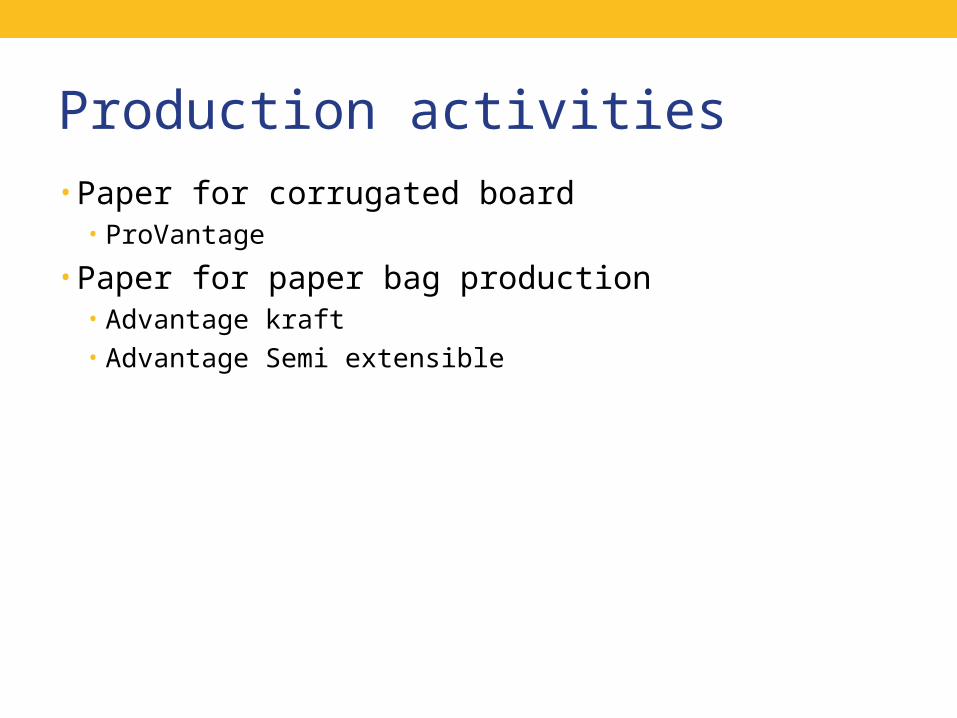
Production activities • Paper for corrugated board
• ProVantage
• Paper for paper bag production• Advantage kraft• Advantage Semi extensible
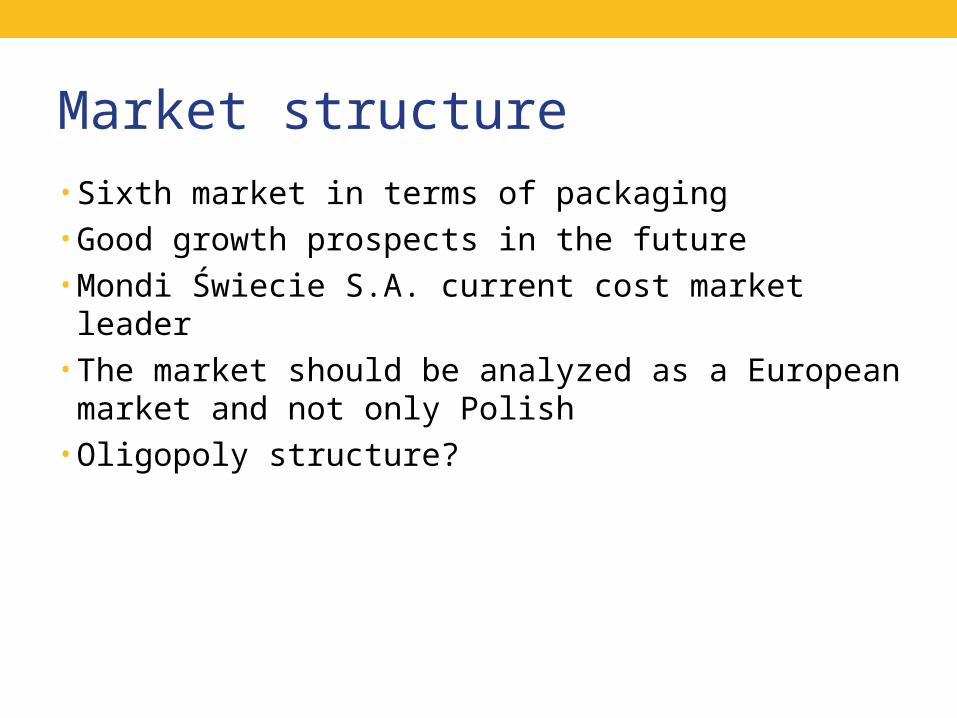
Market structure• Sixth market in terms of packaging• Good growth prospects in the future• Mondi Świecie S.A. current cost market leader• The market should be analyzed as a European market
and not only Polish• Oligopoly structure?

Competition (1)• Smurfit Kappa Ireland – is part of an international
corporation Smurfit Kappa Group, a leading packaging supplier in Europe with a strong position in Latin America
• European leader in the production of solid board, corrugated and graphics as well as cardboard packaging
• sales of around € 7 billion, approximately 400 locations and 40 000 employees
• Stora Enso Oyj – Finnish pulp and paper manufacturer• headquarters in Helsinki, has approximately 29 000 employees• in 2002 was the fifth largest producer of pulp and paper
in terms of revenues • in 2005 the world's largest pulp and paper producer in terms of
production capacity

Competition (2)• DS. Smith• VPK• Model• Dunapack

Plans and growth perspectives • Improve quality • Maintain cost market leader position
• reduce energy costs• reduce costs associated with the purchase of wood• reduce costs associated with the use of chemicals

Balance sheet analysis – Assets (1) 2008 2009 2010
PLN in 1 000
ASSETS
Long-term assets 1,473,832 1,836,757 1,726,446
Fixed (tangible) assets 1,445,308 1,820,461 1,707,746
Intangible assets 5,938 5,115 2,904
Investments available for sale 516 516 516
Other financial assets - - -
Long-term deferred taxes 22,070 10,665 15,280
Short-term assets 432,340 469,379 619,319
Inventory 140,702 174,438 227,596
Trade receivables 225,830 233,542 337,408
Derivative contracts 13,468 1,018 1,410
Cash and cash equivalents 45,141 60,381 52,905
Short-term deferred taxes 7,199 - -
Total assets 1,906,172 2,306,136 2,345,765

Balance sheet analysis – Assets (2) 2008 2009 2010
%
ASSETS
Long-term assets 77.32% 79.65% 73.60%
Fixed (tangible) assets 98.06% 99.11% 98.92%
Intangible assets 0.40% 0.35% 0.17%
Investments available for sale 0.04% 0.03% 0.03%
Other financial assets 0.00% 0.00% 0.00%
Long-term deferred taxes 1.50% 0.58% 0.89%
Short-term assets 22.68% 20.35% 26.40%
Inventory 32.54% 37.16% 36.75%
Trade receivables 52.23% 49.76% 54.48%
Derivative contracts 3.12% 0.22% 0.23%
Cash and cash equivalents 10.44% 12.86% 8.54%
Short-term deferred taxes 1.67% 0.00% 0.00%
Total assets 100.00% 100.00% 100.00%

Balance sheet analysis – Assets (3) 2008/2009 2009/2010
% change
ASSETS
Long-term assets 24.62% -6.01%
Fixed (tangible) assets 25.96% -6.19%
Intangible assets -13.86% -43.23%
Investments available for sale 0.00% 0.00%
Other financial assets - -
Long-term deferred taxes -51.68% 43.27%
Short-term assets 8.57% 31.94%
Inventory 23.98% 30.47%
Trade receivables 3.41% 44.47%
Derivative contracts -92.44% 38.51%
Cash and cash equivalents 33.76% -12.38%
Short-term deferred taxes -100.00% -
Total assets 20.98% 1.72%

Balance sheet analysis – Liabilities and equity (1)
2008 2009 2010
PLN in 1 000
LIABILITIES AND STOCKHOLDERS EQUITY
Stockholders equity 1,065,433 1,182,382 1,432,554
Share capital 333,734 333,734 333,734
Paid-in capital 635,279 778,471 848,648
Profit (loss) from current year 143,192 70,177 250,172
Retained earnings - - -
Revaluation capital - 46,772 - -
Liabilities 840,739 1,123,754 913,211
Long-term liabilities 276,177 745,203 477,316
Long-term interest bearing loans 196,000 674,348 416,366
Reserves 4,082 3,796 4,048
Reserves for deferred taxes 76,095 67,059 56,902
Short-term liabilities 564,562 378,551 435,895
Trade payables 370,536 337,944 319,626
Current installment of interest-bearning loans 109,807 32,813 100,349
Derivative contracts 73,109 2,401 199
Tax liability - 847 3,851
Short-term reserves 11,110 4,546 11,870
Total liabilities and stockholders equity 1,906,172 2,306,136 2,345,765

Balance sheet analysis – Liabilities and equity (2)
2008 2009 2010
%
LIABILITIES AND STOCKHOLDERS EQUITY
Stockholders equity 55.89% 51.27% 61.07%
Share capital 31.32% 28.23% 23.30%
Paid-in capital 59.63% 65.84% 59.24%
Profit (loss) from current year 13.44% 5.94% 17.46%
Retained earnings 0.00% 0.00% 0.00%
Revaluation capital -4.39% 0.00% 0.00%
Liabilities 44.11% 48.73% 38.93%
Long-term liabilities 32.85% 66.31% 52.27%
Long-term interest bearing loans 70.97% 90.49% 87.23%
Reserves 1.48% 0.51% 0.85%
Reserves for deferred taxes 27.55% 9.00% 11.92%
Short-term liabilities 67.15% 33.69% 47.73%
Trade payables 65.63% 89.27% 73.33%
Current installment of interest-bearning loans 19.45% 8.67% 23.02%
Derivative contracts 12.95% 0.63% 0.05%
Tax liability 0.00% 0.22% 0.88%
Short-term reserves 1.97% 1.20% 2.72%
Total liabilities and stockholders equity 100.00% 100.00% 100.00%

Balance sheet analysis – Liabilities and equity (3)
2008/2009 2009/2010
% change
LIABILITIES AND STOCKHOLDERS EQUITY
Stockholders equity 10.98% 21.16%
Share capital 0.00% 0.00%
Paid-in capital 22.54% 9.01%
Profit (loss) from current year -50.99% 256.49%
Retained earnings - -
Revaluation capital -100.00% -
Liabilities 33.66% -18.74%
Long-term liabilities 169.83% -35.95%
Long-term interest bearing loans 244.06% -38.26%
Reserves -7.01% 6.64%
Reserves for deferred taxes -11.87% -15.15%
Short-term liabilities -32.95% 15.15%
Trade payables -8.80% -5.42%
Current installment of interest-bearning loans -70.12% 205.82%
Derivative contracts -96.72% -91.71%
Tax liability - 354.66%
Short-term reserves -59.08% 161.11%
Total liabilities and stockholders equity 20.98% 1.72%

Balance sheet analysis – ratios (1)
2008 2009 2010
% of fixed assets to total assets 77.32% 79.65% 73.60%
% of current assets to total assets 22.68% 20.35% 26.40%
fixed assets to current assets 3.41 3.91 2.79
2008 2009 2010
% stockholders equity to total liabilities and stockholders equity 55.89% 51.27% 61.07%
% liabilities to total liabilities and stockholders equity 44.11% 48.73% 38.93%
stockholders equity to liabilities 1.27 1.05 1.57
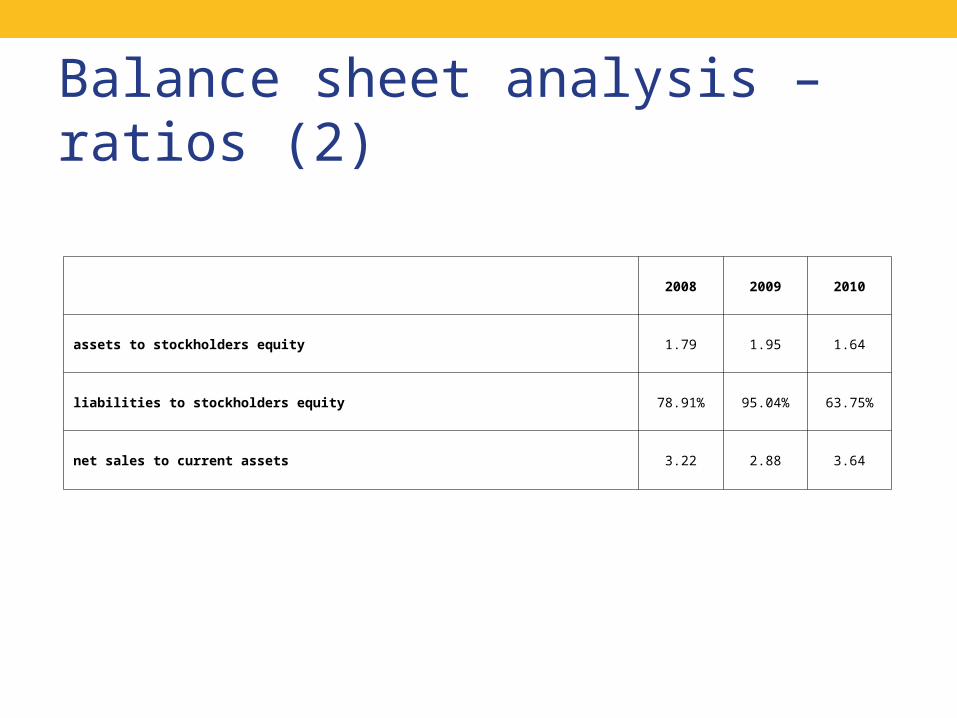
Balance sheet analysis – ratios (2)
2008 2009 2010
assets to stockholders equity 1.79 1.95 1.64
liabilities to stockholders equity 78.91% 95.04% 63.75%
net sales to current assets 3.22 2.88 3.64

Revenues
-
500
1,000
1,500
2,000
2,500
2008 2009 2010
Millions
S ales revenue (from products )
S ales revenue (from goods ands ervices )
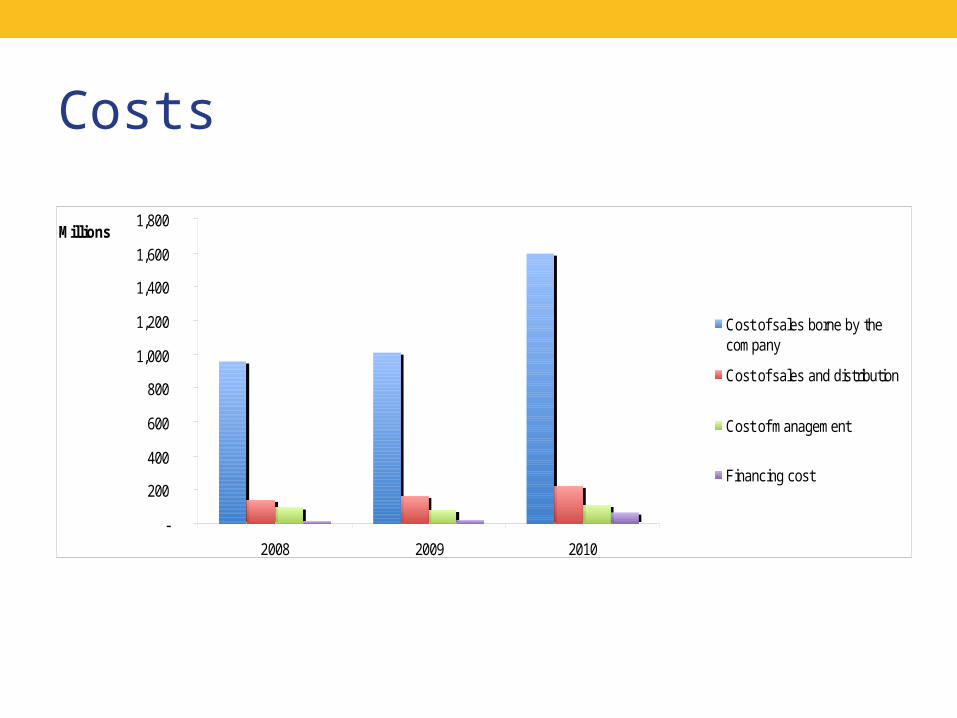
Costs
-
200
400
600
800
1,000
1,200
1,400
1,600
1,800
2008 2009 2010
Millions
Cos t of s ales borne by thecompany
C os t of s ales and dis tribution
C os t of management
F inanc ing cos t
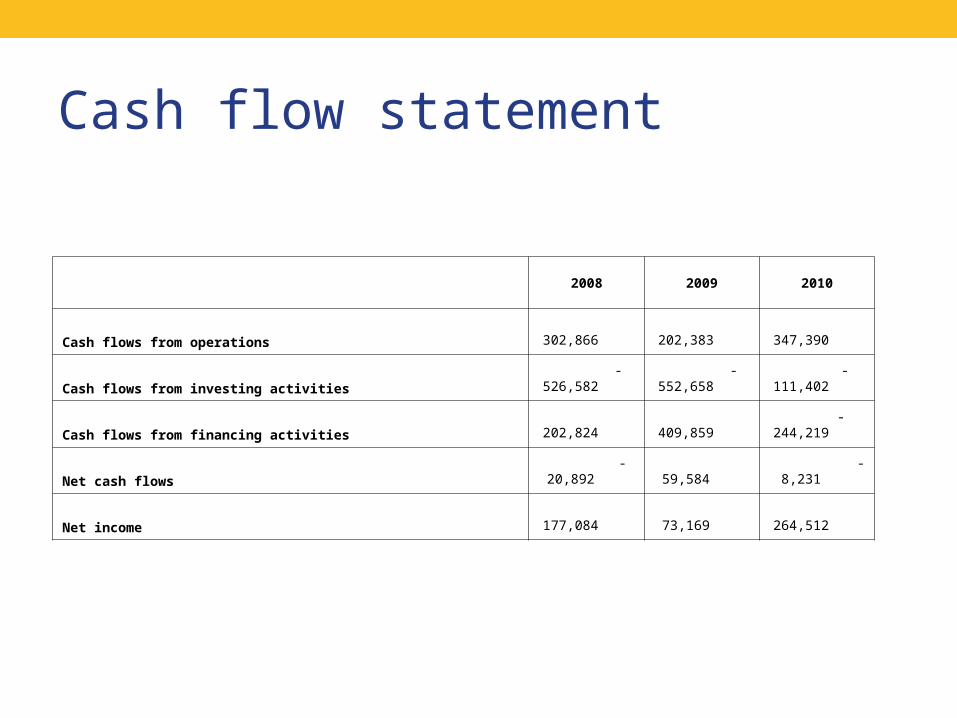
Cash flow statement
2008 2009 2010
Cash flows from operations 302,866 202,383 347,390
Cash flows from investing activities - 526,582 - 552,658 - 111,402
Cash flows from financing activities 202,824 409,859 - 244,219
Net cash flows - 20,892 59,584 - 8,231
Net income 177,084 73,169 264,512
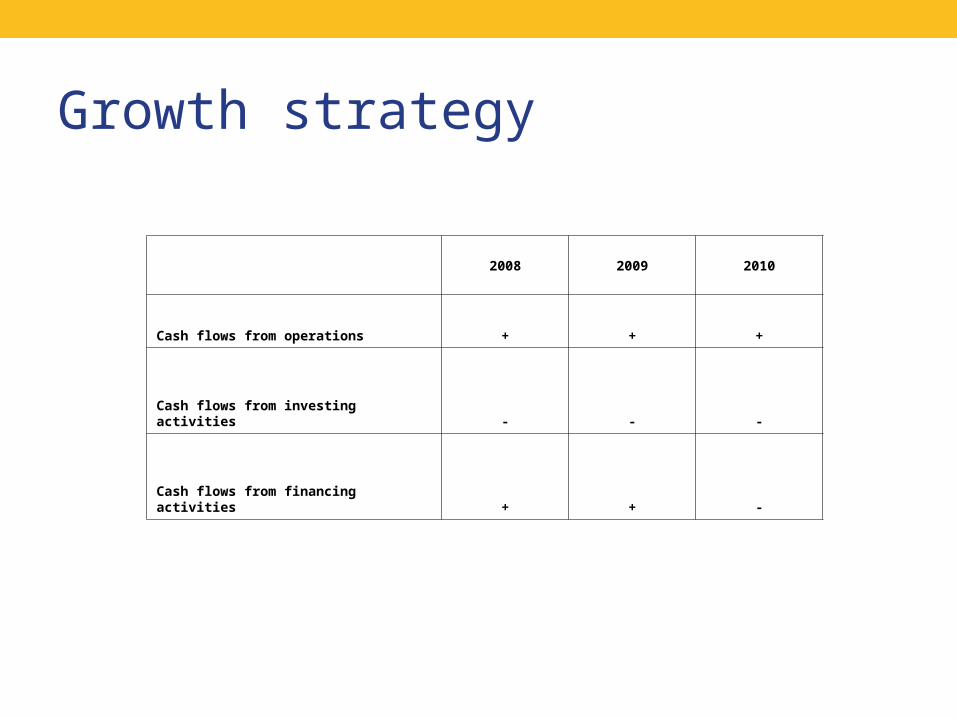
Growth strategy
2008 2009 2010
Cash flows from operations + + +
Cash flows from investing activities - - -
Cash flows from financing activities + + -
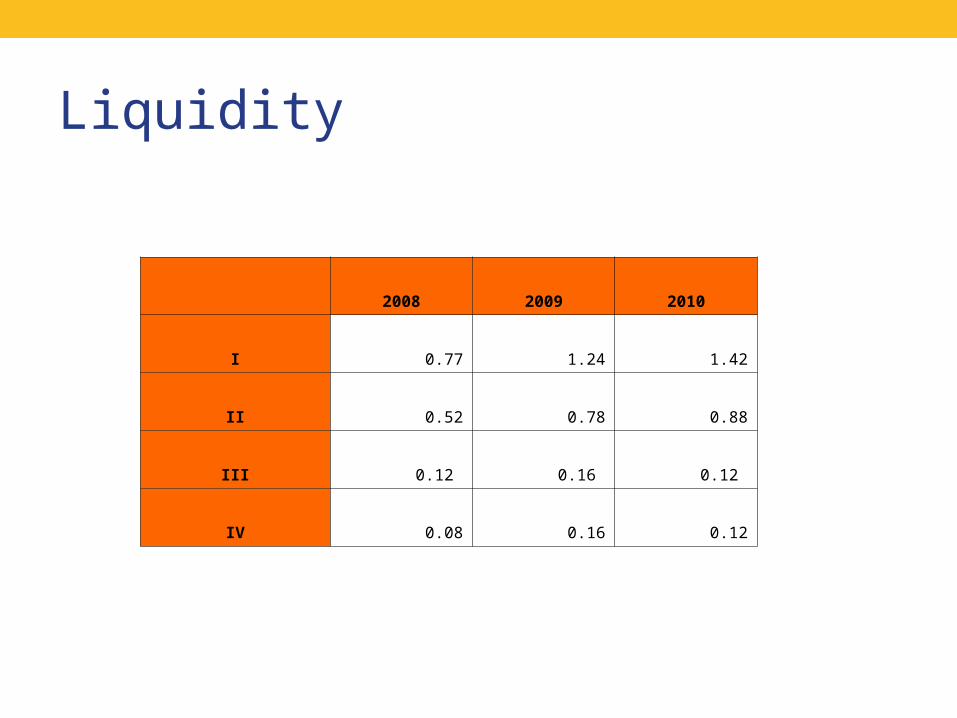
Liquidity
2008 2009 2010
I 0.77 1.24 1.42
II 0.52 0.78 0.88
III 0.12 0.16 0.12
IV 0.08 0.16 0.12

Kapitał obrotowy
2008 2009 2010
working capital to sales revenue -0.09 0.07 0.08
working capital to total assets -0.07 0.04 0.08
working capital to current assets -0.31 0.19 0.30
working capital to inventory and receivables -0.36 0.22 0.32

Turnover
2008 2009 2010
total asset turnover 0.73 0.59 0.97
fixed asset turover 0.95 0.74 1.31
current asset turnove 3.23 2.90 3.66

Profit margin
2008 2009 2010
Gross profit margin
12.68% 5.37% 11.68%
Net profit margin
10.25% 5.15% 11.05%

ROA
2008 2009 2010
ROA
7.5% 3.0% 10.7%
Interest %
6.4% 6.3% 8.3%

ROE
2008 2009 2010
ROE
13.4% 6.0% 17.5%
liabilities to stockholders equity and liabilities
44.1% 48.7% 39.0%
stockholders equity to stockholders equity and liabilities
55.9% 51.3% 61.0%
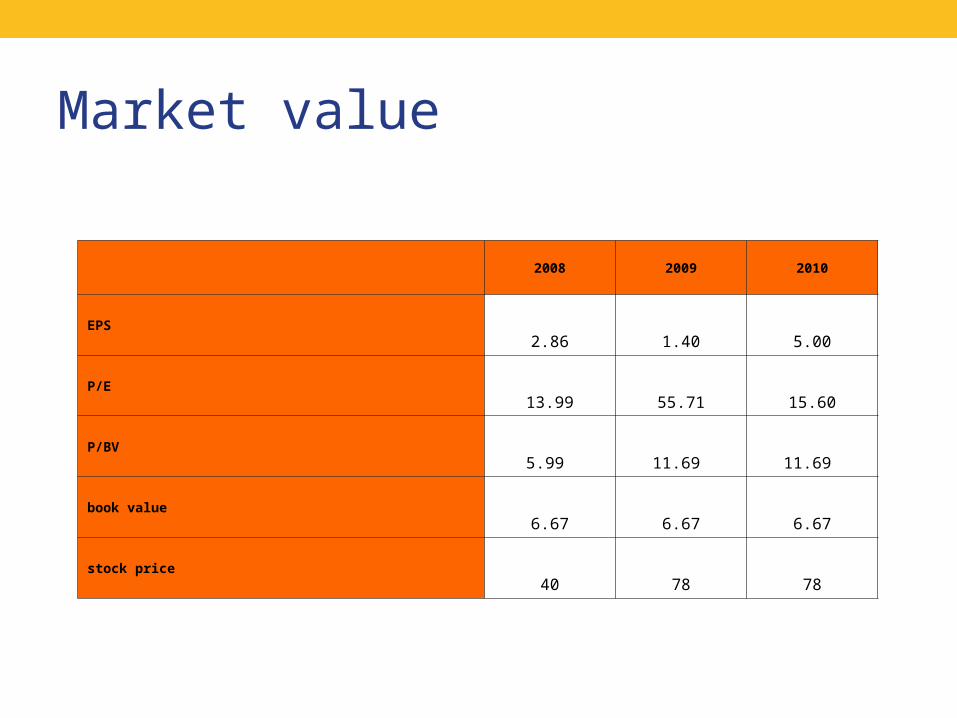
Market value
2008 2009 2010
EPS2.86 1.40 5.00
P/E13.99 55.71 15.60
P/BV5.99 11.69 11.69
book value6.67 6.67 6.67
stock price40 78 78

Thank you for your attention