financial statements 2014 bluewater holding b.v. · consolidated financial statements ... the fpso...
TRANSCRIPT

Financial statements 2014 Bluewater Holding B.V.
2
Contents
Page
Director’s report 3
Report by the Financial Accounting Supervision Committee 6
Consolidated financial statements
Consolidated statement of profit or loss and other comprehensive income 7
Consolidated statement of financial position 8
Consolidated statement of changes in equity 9
Consolidated statement of cash flows 11
Notes to the consolidated financial statements 12
Company financial statements
Company income statement 39
Company balance sheet 39
Notes to the company financial statements 40
Other information 42

3
Director’s report
Bluewater Holding B.V. is the holding company of a group of companies (‘the Bluewater group’ or ‘the
Company’), primarily engaged in the supply of services and products to the oil industry. Bluewater designs,
develops, owns and operates floating production storage and offloading units (‘‘FPSOs’’), provides auxiliary
equipment and services to FPSOs and designs, develops and manages the construction of single point mooring
systems (‘‘SPMs’’). The Company has an FPSO fleet consisting of 5 high specification FPSOs that are or will be
operated under medium- to long-term service agreements or bareboat charter agreements w ith reputable oil
companies. Currently the Company has FPSOs in operation on the UK Continental Shelf and offshore East
Timor.
Business performance
The net loss after tax for 2014 was U.S.$143.4 million compared to U.S.$98.6 million loss in 2013. EBITDA in
2014 was U.S.$180.1 million compared to U.S.$216.0 million in 2013. The 2014 financial results were mainly
impacted by the follow ing:
EBITDA for the SPM division amounted to U.S.$36.7 million in 2014 compared to U.S.$38.1 million in 2013.
During the fourth quarter, some SPM projects reached final stages of completion, resulting in a significant
contribution to EBITDA. Other SPM projects reached significant progress and w ill continue to contribute to
EBITDA during 2014.
The 2014 EBITDA for the FPSO division was U.S.$150.1 million, compared to U.S.$189.5 million for the year
2013. The U.S.$39.4 million decrease in EBITDA compared to the year ended December 30, 2013 was mainly
caused by a U.S.$22.7 million decrease in EBITDA of the FPSO Haewene Brim. This difference in EBITDA
largely relates to a U.S.$25.7 million cost reimbursement for mooring leg repairs that were executed in 2012.
The cost reimbursement was recorded as benefit in 2013 and was fully collected from our insurers and client
during 2014. The remaining movement in EBITDA for the FPSO Haewene Brim was due to amortization of
deferred revenue related to the Brynhild project, largely offset by increased maintenance costs and reduced
income during the latter period of the Brynhild project. EBITDA for the FPSO Glas Dowr reduced by U.S.$5.8
million compared to the previous year, due to higher operational expenditures and downtime penalties, mainly
resulting from equipment failures during the year, which have now been resolved. Additionally, EBITDA of the
FPSO Aoka Mizu decreased by U.S.$2.7 million due to declining field production and repair costs related to the
water injection swivel. Furthermore, EBITDA of the FPSO Bleo Holm decreased by U.S.$7.0 million due to a
decreased day rate as per the contract amendment that became effective August 1, 2014, combined w ith low
tariff income as a result of low production in August and November and nil production in September and
October. Finally the FPSO tender costs in 2014 increased by U.S.$1.2 million, mainly due to the tender activities
in relation to the Pemex project for the FPSO Munin.
Modification and life time extension work on the FPSO Haewene Brim to prepare the vessel for tie-in and
production of the Brynhild field was completed in November 2014 and the FPSO resumed production on the
Pierce field on December 12, 2014. The costs related to the modification and life time extension work are fully
reimbursed by the Brynhild field owners. During the year ended December 30, 2014, such costs, amounting to
US$89.9 million, have been capitalized and related revenues have been deferred, resulting in nil impact on
EBITDA. From December 2014, the total capitalized costs related to the Brynhild project amounting to
U.S.$310.8 million are being depreciated and related deferred revenues are amortized and are thus recognized
as income in the consolidated statement of profit or loss and other comprehensive income. Consequently, an
amount of U.S.$6.1 million revenue is included in EBITDA in the fourth quarter, which is offset by an equal
amount of depreciation, with nil net effect on profit and loss.
Overhead costs for the year 2014 were U.S.$6.6 million versus U.S.$11.6 million for the year 2013. The
decrease in overhead costs was largely driven by an increased recovery on overhead costs as a result of a
higher workload of the engineering organization compared to the year 2013. Additionally, Euro denominated
costs decreased as a result of the decreasing Euro ---- Dollar exchange rate during the last quarter.
4
Depreciation expenditure decreased by U.S.$7.8 million, at U.S.$83.9 million for the year 2014, compared to
U.S.$91.7 million for the year 2013. The decrease was driven by one of the assets being fully depreciated, partly
offset by an increase in the depreciation charge of FPSO Haewene Brim following completion of the Brynhild
project.
Finance expenses for the year 2014 are U.S.$4.1 million higher compared to the previous year, at U.S.$212.5
million versus U.S.$208.4 million in 2013. Interest costs are mainly driven by the subordinated loan due to
parent company carrying 9.75% interest per year. The finance expense on this loan increased from U.S.$132.9
million in 2013 to U.S.$145.9 million in 2014. The interest expense related to this loan is accrued to the loan and
has therefore no cash impact. Furthermore, finance expense for the year 2013 included U.S.$14.5 million of
non-recurring costs in relation to the refinancing of the Glas Dowr project financing, amendments of the
corporate facility and refinancing of the U.S.$360 million unsecured bond, compared to only U.S.$0.4 million of
non-recurring costs in relation to the cancellation of the interest rate swap on the U.S.$360 million unsecured
bond loan for the year 2014. Finance expense for the bond loan increased by U.S.$12.6 million, from U.S.$28.8
million for the year 2013 to U.S.$41.4 million for the year 2014. The year 2014 includes U.S.$40.0 million
interest on the new U.S.$400 million bond loan and U.S.$1.4 million interest in relation to the U.S.$360 million
unsecured bond loan that was repaid on January 27, 2014, compared to U.S.$26.5 million interest on the
U.S.$360 million unsecured bond and U.S.$2.3 million accrued interest on the new U.S.$400 million bond loan
in the year 2013. Other interest costs decreased by U.S.$7.4 million during the year 2014 compared to the year
2013. This decrease resulted from further reduction in net debt, resulting from steady operating cash flow.
Currency exchange results were U.S.$19.4 million negative in the year 2014 compared to U.S.$3.1 million
positive in the year 2013. The currency exchange results relate mainly to the negative fair value of Euro
denominated forward currency contracts that were entered into to hedge the currency exposure on SPM
projects.
Income tax expense for the year 2014 was U.S.$7.8 million versus U.S.$17.7 million for the year 2013. The
income tax expense in the year 2014 relates to U.S.$6.7 million w ithholding tax incurred in relation to the Glas
Dowr revenues, U.S.$1.4 million corporate taxes in other jurisdictions and U.S.$0.3 million increase of the
deferred tax asset. The U.S.$17.7 million income tax expense in the year 2013 included a U.S.$7.9 million
reduction of the deferred tax asset, U.S.$6.8 million w ithholding tax incurred in relation to the Glas Dowr
revenues and U.S.$3.0 million of other foreign taxes.
Other developments
On May 26, 2014, a major SPM contract was awarded for the engineering and related procurement and
construction of two turret and swivel systems, with total revenues amounting to circa U.S.$300 million. This
project is expected to start contributing to EBITDA early 2015.
On June 30, 2014, a legal dispute that arose from the ordinary course of business several years ago, w ith
Bluewater as claimant, was resolved in Bluewater’s favour resulting in a preliminary claim award of U.S.$6.4
million. On September 30, 2014, final settlement was reached, resulting in an additional claim award of U.S.$4.3
million. The total claim award of U.S.$10.7 million is included in the SPM result for 2014 and has been fully
collected.
On November 5, 2014, a contract extension option for the FPSO Bleo Holm was exercised by our client, with
retrospective effect from August 1, 2014. The bareboat charter agreement has been extended with a firm 3-year
period until August 1, 2017, with annual extension options thereafter, and the charter hire rate and production
tariff have been adjusted from this date.
On November 17, 2014, Bluewater has relocated its head office to an entirely new building not far from its former
premises. It has been designed in accordance w ith the latest principles on sustainability and w ill provide a modern
and healthy work environment that enhances cooperation and communication.
5
Outlook
The outlook for our FPSO activities remains positive. The FPSO Glas Dowr, the FPSO Haewene Brim, the FPSO
Bleo Holm and the FPSO Aoka Mizu are currently operating under medium to long-term service agreements
with potential for further extensions. The FPSO Munin is currently laid up in Batam, Indonesia, and contract
discussions about redeployment of the vessel are currently in an advanced stage. To prepare the vessel for
redeployment, a significant investment w ill be made, which will be partially funded w ith new stand-alone project
financing. Margins in the SPM segment are stable and our SPM order portfolio is expected to continue
contributing significantly to EBITDA. The order book for our SPM business, combined with modification and life
time extension work to be performed on our FPSOs is expected to keep the level of utilization of the
organisation relatively high. Considering the SPM order portfolio and FPSO contracts, long term cash flow
stability of the Company is expected to be positive.
Our policy is to maintain qualified engineering staff that is experienced in the design and development of both
FPSOs and SPM systems. To ensure flexibility and manage costs, we allocate staff members between our
FPSO and SPM business in response to market conditions and specific project demands. To protect itself from
fluctuations in the level of activities, the Company uses the services of contractors in addition to its permanent
staff.
Corporate governance
Under Dutch law, the Company has been considered a Public Interest Entity in 2013 and as such is required to
have an audit committee or a similar body. The Company has a Financial Accounting and Supervision
Committee, which performs the duties of an audit committee, consisting of two members, of which at least
one member is independent within the meaning of the Dutch Corporate Governance Code. The sole statutory
director of the Company is Mr H.J. Heerema. As of January 27, 2014 the Company is listed on the Nordic ABM
and as such no longer classifies as a Public Interest Entity as of this date.
Financial instruments
With most of its revenue in US dollars the Company is exposed to currency exchange fluctuations. In addition,
the Company is exposed to the risk of fluctuations of the value of financial instruments due to changes in the
market rate of interest. The Company uses (in the normal course of business) various types of financial
instruments w ith the objective to minimize these currency and interest rate risks. Procedures and policies are in
place to control risks related to financial instruments, including a clear segregation of duties between operating,
settlement, accounting and controlling of all financial instruments used. The Company’s management is
involved in the risk management process. The Company attempts to minimize the counterparty credit risk
associated w ith the financial instruments used by selecting counterparties that it believes to be creditworthy.
Research and development
The Company focuses its research and development activities on technology that is integral to our FPSO and
SPM businesses. We have an in-house design and engineering team consisting of engineers trained in a
number of disciplines. We also access new sources of information or technology by entering into strategic
alliances w ith equipment manufacturers, oil and gas companies, universities or by participating in joint industry
programs. While the market for our products and services is subject to continuous technological changes,
development cycles from initial conception through introduction can extend over several years. Our efforts have
resulted in the development of a number of inventions, new processes and techniques, many of which have
been incorporated as improvements to our product lines. Our research and development activity has led to a
number of patents or patent applications, principally in the area of SPM systems. During 2014 and 2013, our
research and development expenditures were USD 2.7 million and USD 3.4 million, respectively. We expect to
expend similar amounts on research and development in future periods.
Hoofddorp, March 26, 2015
President and CEO:
H.J. Heerema

6
Report by the Financial Accounting Supervision Committee
Under Dutch law, the Company was considered a Public Interest Entity until 2013 and as such was required to
have an audit committee or a similar body. The Company has a Financial Accounting Supervision Committee
(‘‘FASC’’), which performs the duties of an audit committee, consisting of two members, of which at least one
member is independent w ithin the meaning of the Dutch Corporate Governance Code. As of January 27, 2014
the Company is listed on the Nordic ABM of the Oslo Stock Exchange which is a non EU regulated exchange
and as such the company no longer classifies as a Public Interest Entity as of this date.
Activities
FASC was involved in performing reviews focused on risk management, internal controls and financial reporting.
Particular attention was paid to the Company’s risks in relation to large contracts and projects, including project
management and the involvement of agents. Other activities of the year included ICT and Enterprise Risk
Management, the Company’s policies w ith regard to anti-bribery and corruption (ABC policy) and compliance in
general with rules and regulations. FASC also exchanged information about its activities and findings with
Deloitte, the Company’s external auditors and had separate meetings w ith the auditors, w ithout the Company’s
management presence, in order to facilitate free and open discussions. Furthermore, FASC attended meetings
in which the audit plan, management letter and final audit findings were discussed. Specific accounting issues
and tax positions of the Company were on the agenda.
Governance and risks
The Company has an Enterprise Risk Management system in place to ensure adequate monitoring of her
performance and risks. One of the main risks is not being compliant w ith rules and regulations and the ABC
policy. During 2014 this has been a key-area of attention. Management believes that measures taken are
adequate to ensure compliance with applicable laws and regulations in the countries in which the Company
operates. The FASC is actively involved in monitoring the adherence to the ABC policy as well as in evaluating
the risk assessment process in general and in setting priorities.
Future developments
FASC will continue to critically assess the Company’s risks and controls in order to continue strengthening risk
management. Additionally FASC will continue to closely monitor the Company’s efforts in enhancing control
activities around project management, compliance with rules and regulations and compliance w ith ABC
legislation. FASC encourages management in its efforts to strengthen the governance structure of the Company
and to implement new activities, such as the introduction of external independent audits on foreign agents, to
further mitigate industry specific risks.
Hoofddorp, March 26, 2015
Financial Accounting Supervision Committee
7
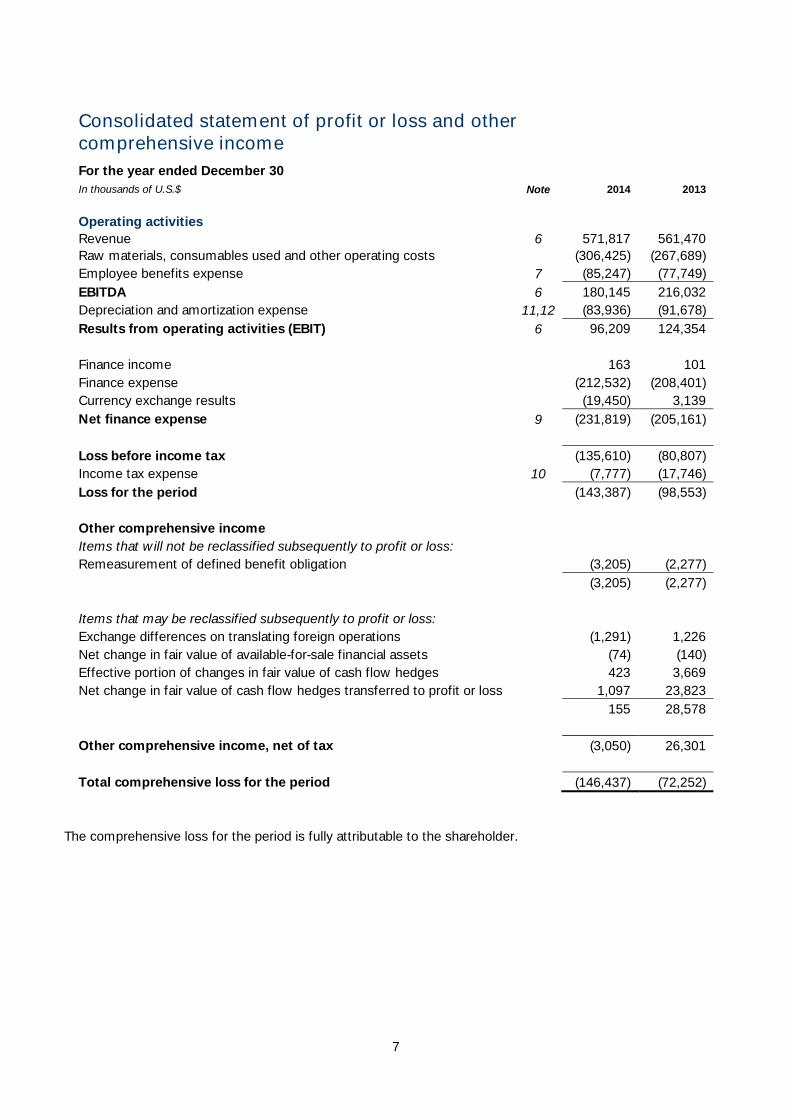
Consolidated statement of profit or loss and other
comprehensive income
For the year ended December 30
In thousands of U.S.$ Note 2014 2013
Operating activities
Revenue 6 571,817 561,470
Raw materials, consumables used and other operating costs (306,425) (267,689)
Employee benefits expense 7 (85,247) (77,749)
EBITDA 6 180,145 216,032
Depreciation and amortization expense 11,12 (83,936) (91,678)
Results from operating activities (EBIT) 6 96,209 124,354
Finance income 163 101
Finance expense (212,532) (208,401)
Currency exchange results (19,450) 3,139
Net finance expense 9 (231,819) (205,161)
Loss before income tax (135,610) (80,807)
Income tax expense 10 (7,777) (17,746)
Loss for the period (143,387) (98,553)
Other comprehensive income
Items that w ill not be reclassified subsequently to profit or loss:
Remeasurement of defined benefit obligation (3,205) (2,277)
(3,205) (2,277)
Items that may be reclassified subsequently to profit or loss:
Exchange differences on translating foreign operations (1,291) 1,226
Net change in fair value of available-for-sale financial assets (74) (140)
Effective portion of changes in fair value of cash flow hedges 423 3,669
Net change in fair value of cash flow hedges transferred to profit or loss 1,097 23,823
155 28,578
Other comprehensive income, net of tax (3,050) 26,301
Total comprehensive loss for the period (146,437) (72,252)
The comprehensive loss for the period is fully attributable to the shareholder.

8
Consolidated statement of financial position
As at December 30
In thousands of U.S.$ Note 2014 2013
Assets
Property, plant and equipment 11 1,104,156 1,083,059
Intangible assets 12 15,941 12.925
Other financial investments, including derivatives 13 24,330 24,108
Deferred tax assets 14 56,025 55,706
Total non-current assets 1,200,452 1,175,798
Inventories 15 1,639 1,293
Trade and other receivables 16 108,433 119,716
Construction contracts 17 12,538 38,273
Prepayments for current assets 3,267 3,875
Cash and cash equivalents 18 153,695 122,188
Total current assets 279,572 285,345
Total assets 6 1,480,024 1,461,143
Equity
Share capital 122 138
Share premium 1,195,244 1,195,244
Accumulated deficit (2,522,746) (2,379,359)
Other reserves (20,089) (17,055)
Total equity attributable to equity holders of the Company (1,347,469) (1,201,032)
Liabilities
Loans and borrowings, including derivatives 19 2,224,112 2,215,309
Deferred income 22 231,583 220,877
Employee benefits 20 8,951 6,038
Total non-current liabilities 2,464,646 2,442,224
Loans and borrowings 19 74,972 68,391
Trade and other payables, including derivatives 21 95,920 120,277
Deferred income 22 191,955 31,283
Total current liabilities 362,847 219,951
Total liabilities 2,827,493 2,662,175
`̀ 1,480,024 1,461,143
9
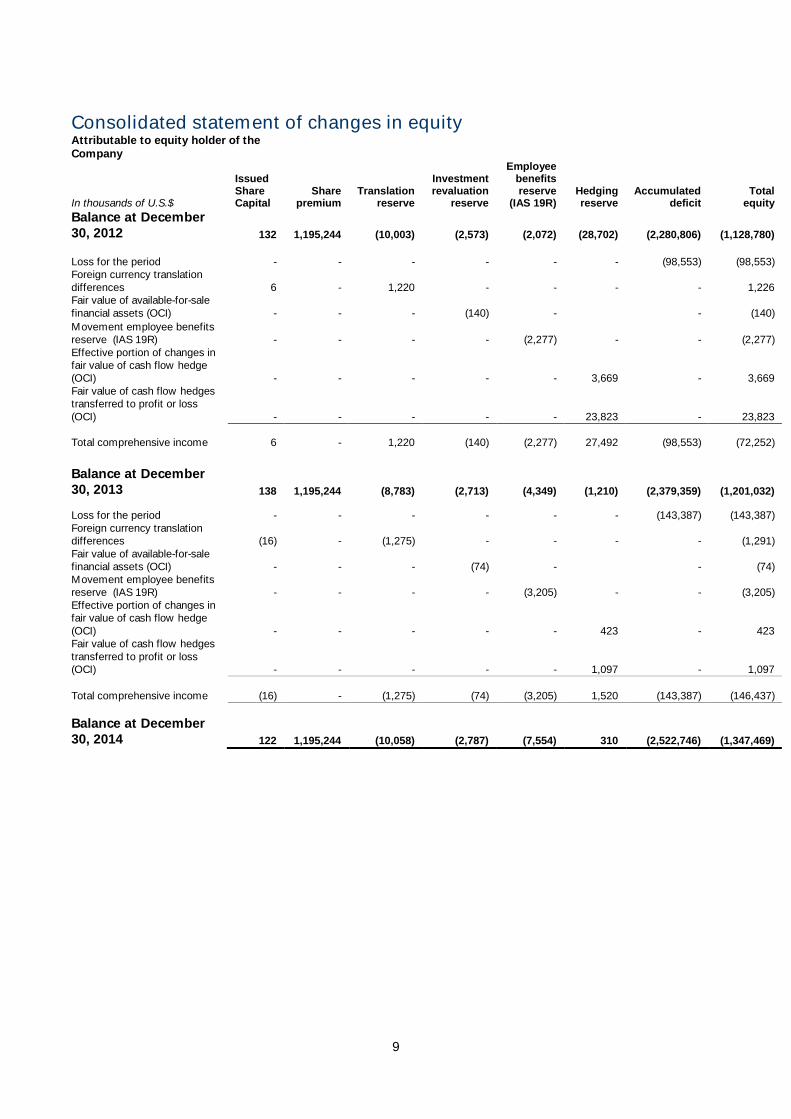
Consolidated statement of changes in equity
Attributable to equity holder of the
Company
In thousands of U.S.$
Issued Share Capital
Share premium
Translation reserve
Investment revaluation
reserve
Employee benefits reserve
(IAS 19R) Hedging reserve
Accumulated deficit
Total equity
Balance at December
30, 2012 132 1,195,244 (10,003) (2,573) (2,072) (28,702) (2,280,806) (1,128,780)
Loss for the period - - - - - - (98,553) (98,553)
Foreign currency translation
differences 6 - 1,220 - - - - 1,226
Fair value of available-for-sale
financial assets (OCI) - - - (140) - - (140)
Movement employee benefits
reserve (IAS 19R) - - - - (2,277) - - (2,277)
Effective portion of changes in
fair value of cash flow hedge
(OCI) - - - - - 3,669 - 3,669
Fair value of cash flow hedges
transferred to profit or loss
(OCI) - - - - - 23,823 - 23,823
Total comprehensive income 6 - 1,220 (140) (2,277) 27,492 (98,553) (72,252)
Balance at December
30, 2013 138 1,195,244 (8,783) (2,713) (4,349) (1,210) (2,379,359) (1,201,032)
Loss for the period - - - - - - (143,387) (143,387)
Foreign currency translation
differences (16) - (1,275) - - - - (1,291)
Fair value of available-for-sale
financial assets (OCI) - - - (74) - - (74)
Movement employee benefits
reserve (IAS 19R) - - - - (3,205) - - (3,205)
Effective portion of changes in
fair value of cash flow hedge
(OCI) - - - - - 423 - 423
Fair value of cash flow hedges
transferred to profit or loss
(OCI) - - - - - 1,097 - 1,097
Total comprehensive income (16) - (1,275) (74) (3,205) 1,520 (143,387) (146,437)
Balance at December
30, 2014 122 1,195,244 (10,058) (2,787) (7,554) 310 (2,522,746) (1,347,469)
10
Share capital
The authorized share capital consists of 500,000 ordinary shares, of which 100,001 shares are issued,
outstanding and fully paid as at December 30, 2014. The shares have a par value of EUR 1 each (approximately
U.S.$1.2153). The holders of the shares are entitled to receive dividends as declared and are entitled to voting
rights.
Dividends
The terms and conditions of the current corporate facility prohibit the payment of dividends. In 2014 and 2013
no dividends have been declared or paid.
Translation reserve
The translation reserve comprises all foreign currency differences arising from the translation of the financial
statements of foreign operations.
Investment revaluation reserve
The investment revaluation reserve comprises the cumulative change in the fair value of available-for-sale
financial assets.
Employee benefits reserve (IAS 19R)
The employee benefits reserve reflects the cumulative change in the defined benefit obligation and plan assets
resulting from the Company’s defined benefit pension plan. Such cumulative changes mainly result from
actuarial gains and losses.
Hedging reserve
The hedging reserve comprises the effective portion of the cumulative net change in the fair value of cash flow
hedging instruments related to hedged transactions that have not yet occurred.

11
Consolidated statement of cash flows
In thousands of U.S.$
Note 2014 2013
Cash flows from operating activities
Loss for the year (143,387) (98,553)
Adjustments for:
Depreciation of property, plant and equipment 81,927 90,407
Amortization of intangible assets 2,009 1,271
Finance expense recognized 212,532 208,287
Income tax expense recognized 7,777 17,746
Change in employee benefits 2,913 2,564
Change in deferred income taxes (319) 7,897
Change in net realizable value current assets 264 2,093
Change in other investments, including derivatives (222) 150
Change in inventories (346) 759
Change in trade and other receivables 10,856 (62,407)
Change in work in progress 25,735 9,846
Change in prepayments for current assets 608 (1,936)
Change in trade and other payables, including derivatives 864 (24,969)
Change in deferred income 22 171,378 232,416
Interest paid (69,885) (67,802)
Income tax (paid)/received (1,341) (1,907)
Net cash from operating activities 301,363 315,862
Cash flows used in investing activities
Payments for property, plant and equipment (133,378) (177,239)
Interest received 163 101
Payments for intangible assets (5,025) (2,215)
Net cash (used in)/generated by investing activities (138,240) (179,353)
Cash flows from financing activities
Proceeds from loans and borrowings 8,720 848,061
Redemption of loans and borrowings (127,946) (916,834)
Payments from unwinding swap transactions (7,239) -
Debt arrangement fees - (24,061)
Net cash (used in)/from financing activities (126,465) (92,834)
Translation effect on cash (5,151) 1,892
Net increase in available cash and cash equivalents 31,507 45,567
Cash and cash equivalents at the beginning of the year 122,188 76,621
Cash and cash equivalents at the end of the year 18 153,695 122,188
12
Notes to the consolidated financial statements
1. General information
Reporting entity
Bluewater Holding B.V. (‘‘the Company’’) is domiciled in the Netherlands. The address of the Company’s
registered office is Taurusavenue 46, 2132 LS Hoofddorp. The consolidated financial statements of the
Company as at and for the year ended December 30, 2014 comprise the Company and its subsidiaries (together
referred to as the ‘‘Group’’ or ‘‘Bluewater’’ and individually as ‘‘Group entities’’) and the Group’s interest in jointly
controlled entities. The Group is primarily engaged in the supply of services and products to the oil industry. The
Company’s immediate parent is Bluewater Offshore Production Systems Ltd. The Company’s next most senior
parent that issues consolidated financial statements is Aurelia Energy N.V., Willemstad (Curaçao). The Company
is ultimately wholly owned by Aurelia Holding N.V., Willemstad (Curaçao), of which all shares are ultimately held
by the Jacaranda Trust, an irrevocable discretionary trust constituted under the laws of Jersey. The beneficiaries
of the Jacaranda Trust are Mr. H. Heerema and certain members of his immediate family. The trustees of the
Jacaranda Trust are prohibited from exercising their power in a manner that would result in Mr. H. Heerema
being dismissed or replaced as Bluewater Holding B.V.’s sole managing director without his prior written
consent.
Activities
Bluewater is a specialized service provider to, and operator in, the offshore oil industry. Bluewater designs,
develops, owns and operates floating production storage and offloading units (‘‘FPSOs’’), provides auxiliary
equipment and services to FPSOs and designs, develops and performs project management and constructs
single point mooring systems (‘‘SPMs’’).
An FPSO is a type of floating production unit used by oil companies to produce, process, store and offload
hydrocarbons from offshore fields. FPSOs are either newly built or converted tankers upon which production
equipment is mounted. The fluids (oil, gas and water) are processed on board the FPSO vessel, and the treated
crude oil is stored before being exported to an off take system utilizing shuttle tankers. Bluewater’s fleet of
FPSOs is involved in the production, rather than the exploration or drilling phase of oil field development. The
FPSOs are leased to oil companies under medium- and long-term service contracts or bareboat contracts.
SPMs are used to transfer fluids to and from a floating production unit, an offshore storage vessel or shuttle
tanker while securing the unit, vessel or tanker to the ocean floor. Most SPMs consist of an anchoring system
that is connected to the ocean floor and a fluid transfer system that permits the transfer of fluids between fixed
and rotating parts of the mooring system. SPMs are generally developed and constructed for oil companies and
contractors.
Revenues are earned from day rates consisting of a fixed facility fee and a compensation for operating the
FPSO pursuant to leases w ith oil companies, supplemented from time to time with fees based on volumes of
produced barrels of oil. Additionally, revenues are earned on a lump-sum or reimbursable basis from the design,
engineering, procurement and management services that are provided in the various FPSO and SPM projects
being managed.
FPSO and SPM projects are being managed from the initial design and engineering phase to final installation.
Further, Bluewater engages subcontractors in the fabrication of FPSOs, SPMs and auxiliary equipment.
Statement of compliance
The consolidated financial statements have been prepared in accordance with Internat ional Financial Reporting
Standards (IFRSs) and interpretations adopted and endorsed by the European Union.
The financial statements were approved by the Board of Directors on March 26, 2015.
13
2. Basis of preparation
These consolidated financial statements are presented in thousands of US dollars, which is the Company’s
functional currency. All financial information presented has been rounded to the nearest thousand. The
consolidated financial statements have been prepared on the historical cost basis except for certain financial
instruments that are stated at fair value.
The preparation of financial statements in conformity w ith IFRSs requires management to make judgements,
estimates and assumptions that affect the application of accounting policies and the reported amounts of
assets, liabilities, income and expenses. Actual results may differ from these estimates. Estimates and
underlying assumptions are reviewed on an ongoing basis. Revisions to accounting estimates are recognized in
the period in which the estimates are revised and in any future periods affected.
In particular, significant areas of estimation uncertainty and critical judgements in applying accounting policies
that have the most significant effect on the amounts recognized in the financial statements are:
Revenue recognition on construction contracts based on the percentage of completion method;
Estimation of the anticipated useful life and future revenues earned with the leased facilities;
Estimation of the realizable amount of tax losses carried forward;
Potential impact of claims and litigation.
The consolidated financial statements have been prepared on the going concern basis of accounting. The parent
company Aurelia Energy N.V. has furthermore confirmed that it continues its financial support to the Company
to enable it to operate as a going concern and to meet at least its financial obligations for a period of at least 12
months from the date of approval of Bluewater Holding B.V.’s financial statements for the period ended
December 30, 2014.
3. Significant accounting policies
The accounting policies set out below have been applied consistently to all periods presented in these
consolidated financial statements, and have been applied consistently by Group entities.
(a) Basis of consolidation
The financial information relating to Bluewater Holding B.V. is presented in the consolidated financial
statements. In accordance with article 2:402 of the Dutch Civil Code, the company financial statements only
contain an abridged income statement.
(i) (i) Subsidiaries
Subsidiaries are entities controlled by the Group. Control exists when the Group has the power to govern the
financial and operating policies of an entity so as to obtain benefits from its activities. In assessing control,
potential voting rights that currently are exercisable are taken into account. The financial statements of
subsidiaries are included in the consolidated financial statements from the date that control commences until
the date that control ceases. The accounting policies of subsidiaries have been changed when necessary to
align them with the policies adopted by the Group.
(ii) Joint ventures
Joint ventures are those entities over whose activities the Group has joint control, established by contractual
agreement and requiring unanimous consent for strategic, financial and operating decisions. The consolidated
financial statements include the Group’s proportionate share of the joint venture’s assets, liabilities, revenue
and expenses, with items of a similar nature on a line basis, from the date that joint control commences until
the date that joint control ceases.
14
(iii) Transactions eliminated on consolidation
Intra-group balances and transactions, and any unrealized income and expenses arising from intra-group
transactions, are eliminated in preparing the consolidated financial statements.
(b) Foreign currency
(i) Foreign currency transactions and balances
Transactions in foreign currencies are translated into the respective functional currencies of Group entities at
exchange rates at the dates of the transactions. Monetary assets and liabilities denominated in foreign
currencies at the reporting date are translated into the functional currency at the exchange rate at that date. The
resulting exchange gains and losses are recorded under financial income and expense in the consolidated
statement of profit or loss and other comprehensive income, except where hedge accounting is applied.
(ii) Foreign operations
The assets and liabilities of foreign operations are translated into US dollars at exchange rates at the reporting
date. The income and expenses of foreign operations are translated into US dollars at exchange rates at the
dates of the transactions. Gains and losses resulting from the translation are recorded in shareholder’s equity,
as translation reserve. When a foreign operation is disposed of, in part or in full, the relevant amount in the
translation reserve is transferred to profit or loss.
Foreign exchange gains and losses arising from a monetary item receivable from or payable to a foreign
operation, the settlement of which is neither planned nor likely in the foreseeable future, are considered to form
part of a net investment in a foreign operation and are recognized directly in other comprehensive income and
accumulated in the translation reserve.
(c) Financial instruments
(i) Non-derivative financial instruments
Non-derivative financial instruments comprise investments in equity securities, trade and other receivables,
cash and cash equivalents, loans and borrowings, and trade and other payables.
Non-derivative financial instruments are recognized initially at fair value plus, for instruments not at fair value
through profit or loss, any directly attributable transaction costs. Subsequent to initial recognition non-derivative
financial instruments are measured as described below.
Cash and cash equivalents comprise cash balances and call deposits. Bank overdrafts that are repayable on
demand and form an integral part of the Group’s cash management are included as a component of cash and
cash equivalents for the purpose of the statement of cash flows.
Available-for-sale financial assets
The Group’s investments in equity securities are classified as available-for-sale financial assets. Listed equity
investments are stated at fair value. Since there is no way of reliably measuring the fair value using valuation
techniques for some of these investments that are unlisted, these unlisted investments are stated at historical
cost less any identified impairment losses. Changes in the fair value of the equity investments are recognized in
other comprehensive income and accumulated in the investment revaluation reserve. When an investment is
disposed of or is determined to be impaired, the cumulative gain or loss accumulated in the investment
revaluation reserve is reclassified to profit or loss.
Other
Other non-derivative financial instruments are measured at amortized cost using the effective interest method,
less any impairment losses.
15
(ii) Derivative financial instruments
Financial instruments at fair value through profit or loss
The Company uses derivative financial instruments such as forward contracts, interest rate swaps and interest
rate caps to hedge its risks associated w ith foreign currency and interest rate fluctuations. Such financial
instruments are initially recorded in the consolidated statement of financial position as either an asset or a
liability measured at fair value. Changes in the derivative instrument’s fair value are recognized in profit or loss,
unless specific hedge accounting criteria are met. All derivative financial instrument valuations are determined in
part by reference to published price quotations in an active market. These quotations consist of currency
exchange rates, interest rates, and discount rates. Attributable transaction costs are recognized in profit or loss
when incurred.
Cash flow hedges
Changes in the fair value of the derivative hedging instrument designated as a cash flow hedge are recognized
directly in other comprehensive income and accumulated in the hedging reserve to the extent that the hedge is
effective. To the extent that the hedge is ineffective, changes in fair value are recognized in profit or loss.
If the hedging instrument no longer meets the criteria for hedge accounting, expires or is sold, terminated or
exercised, then hedge accounting is discontinued prospectively. The cumulative gain or loss previously
recognized in equity remains there until the forecasted transaction occurs. When the hedged item is a non-
financial asset, the amount recognized in equity is transferred to the carrying amount of the asset when it is
recognized. In other cases the amount recognized in equity is transferred to profit or loss in the same period
that the hedged item affects profit or loss.
(iii) Share capital
Ordinary shares
Ordinary shares are classified as equity. Incremental costs directly attributable to the issue of ordinary shares
and share options are recognized as a deduction from equity, net of any tax effects.
(d) Property, plant and equipment
Items of property, plant and equipment are measured at cost less accumulated depreciation and accumulated
impairment losses. Cost includes expenditure that is directly attributable to the acquisition of the asset. The
cost of self-constructed assets includes the cost of materials and direct labour, any other costs directly
attributable to bringing the asset to a working condition for its intended use, borrowing costs paid during
construction and attributable overhead.
The cost of replacing part of an item of property, plant and equipment is recognized in the carrying amount of
the item only if it is probable that future economic benefits embodied w ithin the part will flow to the Group and
its cost can be measured reliably. The carrying amount of the replaced part is derecognized. The costs of the
day-to-day servicing of property, plant and equipment are recognized in profit or loss as incurred.
When parts of an item of property, plant and equipment have different useful lives, they are accounted for as
separate items (major components) of property, plant and equipment. Depreciation is recognized in profit or loss
on a straight-line basis over the estimated useful lives of each part of an item of property, plant and equipment,
taking into account its residual value. Depreciation of assets starts when they are available for their intended
use.
16
The estimated useful lives for the categories of property, plant and equipment are as follows:
hulls, including cost of vessel conversion 20-25 years
sw ivel stack 15 years
machinery and process equipment 3-10 years
(In case of long-term contracts greater than 10 years, these items are fully depreciated over the contract
duration. For shorter term contracts, a decision is made as to the applicable useful life).
office equipment 4 years
other 4-10 years
Depreciation methods, useful lives and residual values are reviewed at each reporting date.
Gains and losses on disposal of an item of property, plant and equipment are determined by comparing the
proceeds from disposal with the carrying amount of property, plant and equipment and are recognized net
within profit or loss.
(e) Intangible assets
(i) Research and development
Expenditure on research activities, undertaken w ith the prospect of gaining new scientific or technical
knowledge and understanding, is recognized in profit or loss when incurred.
Development expenditure is capitalized only if development costs can be measured reliably, the product or
process is technically and commercially feasible, future economic benefits are probable, and the Group intends
to and has sufficient resources to complete development and to use or sell the asset. The expenditure
capitalised includes the cost of materials and direct labour, borrowing costs paid during development and
attributable overhead costs.
Capitalized development expenditure is measured at cost less accumulated amortization and accumulated
impairment losses. Amortization is recognized in profit or loss on a straight-line basis from the date they are
available for use, over the estimated useful lives of intangible assets not exceeding 20 years.
(ii) Oil production licences and field development costs
Capitalized expenditures related to the acquisition of oil production licenses and field developments are
measured at cost less accumulated amortization and accumulated impairment losses. Amortization is
recognized in profit or loss from the date the field starts production as the related oil and gas reserves are
produced under the unit of production method. Field development costs are capitalized in accordance with IFRS
6.
(iii) Software costs
Capitalized expenditures related to the acquisition and development of software are measured at cost less
accumulated amortisation and accumulated impairment losses. Amortisation is recognized in profit or loss from
the date the software is available for use, over the estimated useful lives of the software of 5 years.
(f) Inventories
Inventories are measured at the lower of cost and net realizable value. The cost of inventories is based on the
first-in first-out principle, and includes expenditure incurred in acquiring the inventories, production or conversion
costs and other costs incurred in bringing them to their existing location and condit ion. In the case of
manufactured inventories and work in progress, cost includes an appropriate share of production overheads
based on normal operating capacity.
Net realisable value is the estimated selling price in the ordinary course of business, less the estimated costs of
17
completion and selling expenses.
(g) Construction contracts
Construction contracts are measured at cost plus profit recognized to date less progress billings and recognized
losses. Cost includes all expenditure related directly to specific projects and an allocation of fixed and variable
overheads incurred in the Group’s contract activities based on normal operating capacity.
If payments received from customers exceed the income recognized, then the difference is presented under
deferred income in the consolidated statement of financial position.
(h) Impairment
The carrying amounts of financial assets and assets that are subject to amortization or depreciation are
reviewed at each reporting date to determine whether there is any indication of impairment. If any such
indication exists, then the asset’s recoverable amount is estimated. For intangible assets that have indefinite
lives or that are not yet available for use, the recoverable amount is estimated at each reporting date.
The recoverable amount of an asset or cash-generating unit is the greater of its value in use and its fair value
less costs to sell. For the purpose of impairment testing, assets are grouped together at the lowest level for
which there are separately identifiable cash flows (the ‘‘cash-generating unit’’).
An impairment loss is recognized if the carrying amount of an asset or its cash-generating unit exceeds its
estimated recoverable amount. Impairment losses are recognized in profit or loss. Impairment losses
recognized in prior periods are reversed if there has been a change in the estimates used to determine the
recoverable amount, except for assets w ith indefinite useful lives.
(i) Employee benefits
(i) Defined contribution plans
Obligations for contributions to defined contribution pension plans are recognized as an employee benefit
expense in profit or loss when they are due. Prepaid contributions are recognized as an asset to the extent that
a cash refund or a reduction in future payments is available.
(ii) Defined benefit plans
Provisions for pension obligations are established for benefits payable in the form of retirement and surviving
dependant pensions. The funds are valued every year by professionally qualified independent actuaries. The
obligations and costs of pension benefits are determined using the projected unit credit method. The projected
unit credit method considers each period of service as giving rise to an additional unit of benefit entitlement and
measures each unit separately to build up the final obligation.
The pension obligation is measured at the present value of estimated future cash flows using a discount rate
that is similar to the interest rate of Dutch government bonds, where the currency and terms of the government
bond are consistent w ith the currency and estimated terms of the defined benefit obligation.
The liability recognized in the consolidated statement of financial position in respect of defined benefit pension
plans is the present value of the defined benefit obligation at the balance sheet date less the fair value of the
plan assets.
Re-measurement, comprising actuarial gains and losses, the effect of the changes to the asset ceiling
and the return on plan assets (excluding interest), is reflected immediately in the consolidated
statement of financial position w ith a charge or credit recognised in employee benefits reserve in
other comprehensive income in the period in which they occur. Re-measurement recognised in other
18
comprehensive income is reflected immediately in retained earnings and w ill not be reclassified to
profit or loss.
(j) Provisions
. A provision is recognized if, as a result of a past event, the Group has a present legal or constructive obligation
that can be estimated reliably, and it is probable that an outflow of economic benefits will be required to settle
the obligation. Provisions are determined by discounting the expected future cash flows at a pre-tax rate that
reflects current market assessments of the time value of money and the risks specific to the liability. No
provision for the costs of demobilization of FPSOs at the end of the lease period is accounted for, if the lease
contract provides for reimbursement of such costs by the lessee.
(k) Revenue
(i) Service agreements and/or operating lease arrangements for FPSOs
Revenues under service agreements and/or lease arrangements are recognized when the FPSO is made
available to the lessee and the fee is due in accordance with the lease contract. Income under the lease
agreements for the FPSOs comprises, depending on the vessel, the following:
A facility fee representing a prescribed fee for the lease period. This fee may be increased or decreased
based on actual availability of the FPSO, including an allowance for planned maintenance downtime ver-
sus pre-determined thresholds.
A fee for operating the FPSO.
Where applicable, lease revenues are recognized on a straight-line basis over the minimal non-cancellable lease
term.
(ii) Construction contracts
Contract revenue from construction (design, engineering and project management) of SPMs and auxiliary
equipment includes the initial amount agreed in the contract plus any variations in contract work, claims and
incentive payments to the extent that it is probable that they w ill result in revenue and can be measured reliably.
As soon as the outcome of a construction contract can be estimated reliably, contract revenue and expenses
are recognized in profit or loss in proportion to the stage of completion of the contract.
The stage of completion is measured by the labour and material cost incurred as a percentage of total estimated
labour and material cost for each contract, unless the physical progress significantly differs. When the outcome
of a construction contract cannot be estimated reliably, contract revenue is recognized only to the extent of
contract costs incurred that are likely to be recoverable. An expected loss on a contract is recognized
immediately in profit or loss.
(l) Government grants
Government grants that compensate the Company for expenses incurred are recognized in profit or loss on a
systematic basis in the same periods in which the expenses are recognized, provided there is reasonable
assurance that the Company w ill comply w ith the conditions attached to the grant and the grants w ill be
received.
(m) Finance income and expenses
Finance income comprises interest income on funds invested, changes in the fair value of financial assets at fair
value through profit or loss and gains on hedging instruments that are recognized in profit or loss. Interest
income is recognized as it accrues in profit or loss, using the effective interest method.
Finance expenses comprise interest expense on borrowings, unwinding of the discount on provisions, changes
in the fair value of financial assets at fair value through profit or loss, impairment losses recognized on financial
assets and losses on hedging instruments that are recognized in profit or loss. Borrowing costs are recognized
in profit or loss using the effective interest method, except for borrowing costs that qualify for capitalization.
19
Foreign currency gains and losses are reported on a net basis.
(n) Income tax
The income tax charge is based on the tax regime applicable to the various group companies in the countries in
which they are legally seated. These tax regimes charge income taxes based on operating profits or on the
basis of other criteria as agreed upon by the Group in specific tax rulings. Deferred taxation is considered in
accounting for the income tax charge for the year.
Deferred income taxes are accounted for using the balance sheet method. Deferred income taxes are provided
for temporary differences between the tax bases of assets or liabilities and their reported amounts in the
consolidated financial statements. Future tax benefits attributable to these differences, if any, are recognized to
the extent that realization of such benefits is probable.
Current tax is the expected tax payable on the taxable income for the year, using tax rates enacted or
substantively enacted at the reporting date, and any adjustment to tax payable in respect of previous years.
(o) New standards and interpretations
The follow ing new standards, amendments to standards and interpretations have been adopted in 2014:
IFRS 10, Consolidated Financial Statements, IFRS 11, Joint Arrangements and IFRS 12, Disclosure of Interests
in Other Entities, IAS 27 (as revised in 2011) Separate Financial Statements and IAS 28 (as revised in 2011)
Investments in Associates and Joint Ventures have become effective from January 1, 2014. The adoption of
these standards has not had an impact on our consolidated financial statements. The Company has full control
over the joint ventures in which it currently participates and consequently these joint ventures are fully
consolidated as disclosed in note 26.
A number of new standards, amendments to standards and interpretations are not yet effective for the year
ended December 30, 2014, and have not been applied in preparing these consolidated financial statements.
4. Financial risk management
In the normal course of business the Company uses various types of financial instruments based on financial
policies and procedures as agreed by the Company’s management. Financial instruments, other than
derivatives, comprise accounts receivable, cash, deposits, long-term and short-term loans and accounts payable.
The Company also uses derivative transactions; including principally forward rate currency contracts, interest
rate swaps and interest rate caps, with the purpose to manage the interest and currency risk arising from the
Company’s operations and sources of finance.
The Company has procedures and policies in place to control risks related to financial instruments. These
policies and procedures include a clear segregation of duties between operating, settlement, accounting and
controlling of all financial instruments used. The spread of the Company’s activities limits the exposure to
concentrations of credit or market risk. The Company’s management is involved in the risk management
process. The Company attempts to minimize the counterparty credit risk associated with the financial
instruments used by selecting counterparties that it believes to be creditworthy.
Credit risk
The Group’s exposure to credit risk is influenced mainly by the individual characteristics of each customer. The
Company attempts to minimize its credit risk as much as possible by thoroughly reviewing risks associated with
contracts and negotiating bank or parent company guarantees from customers. Additionally, milestone
payments are negotiated on lump-sum contracts and outstanding receivables are actively managed in order to
minimize the number of days outstanding.
20
Liquidity risk
The Company has organized its liquidity management centrally, in order to ensure, as far as possible, that it will
always have sufficient liquidity to meet its liabilities when due, under both normal and stressed conditions,
without incurring unacceptable losses or risking damage to the Group’s reputation.
Currency risk
The Company is exposed to currency risk on sales and purchases that are denominated in a currency other than
the respective functional currencies of Group entities. The Company uses forward exchange contracts to hedge
its currency risk. When necessary, forward exchange contracts are rolled over at maturity.
Interest rate risk
The Company’s exposure to changes in interest rates on borrowings is mitigated by entering into interest rate
swaps and interest rate caps.
Capital risk management
The Group manages its capital to ensure that entities in the Group will be able to continue as a going concern
while maximizing the return to stakeholders through the optimisation of the debt and equity balance.
The capital structure of the Group consists of debt, which includes the borrowings disclosed in note 18, cash
and cash equivalents and equity attributable to the shareholder of the Company. The Group’s goal is to maintain
a strong capital base so as to maintain investor, creditor and market confidence and to sustain future
development of the business. Management monitors the capital structure and return on capital, including the
cost of capital and the associated risks. The Group’s overall approach to capital management remained
unchanged during the year.
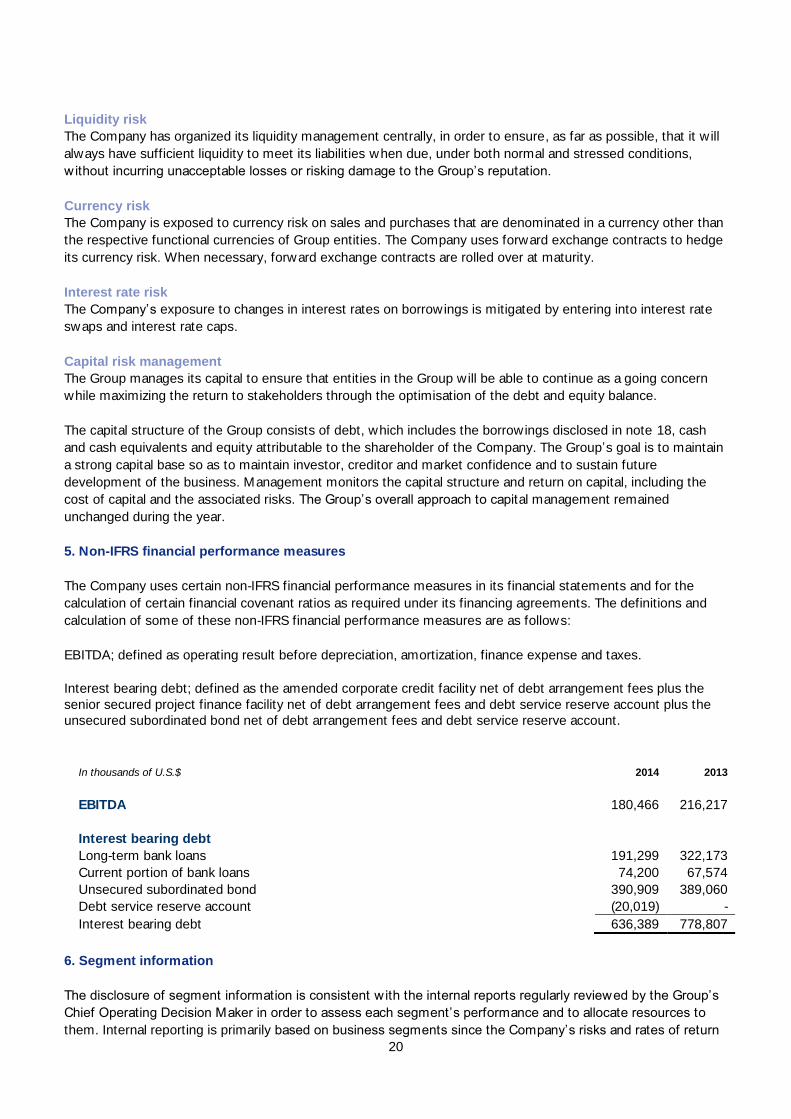
5. Non-IFRS financial performance measures
The Company uses certain non-IFRS financial performance measures in its financial statements and for the
calculation of certain financial covenant ratios as required under its financing agreements. The definitions and
calculation of some of these non-IFRS financial performance measures are as follows:
EBITDA; defined as operating result before depreciation, amortization, finance expense and taxes.
Interest bearing debt; defined as the amended corporate credit facility net of debt arrangement fees plus the
senior secured project finance facility net of debt arrangement fees and debt service reserve account plus the
unsecured subordinated bond net of debt arrangement fees and debt service reserve account.
In thousands of U.S.$ 2014 2013
EBITDA 180,466 216,217
Interest bearing debt
Long-term bank loans 191,299 322,173
Current portion of bank loans 74,200 67,574
Unsecured subordinated bond 390,909 389,060
Debt service reserve account (20,019) -
Interest bearing debt 636,389 778,807
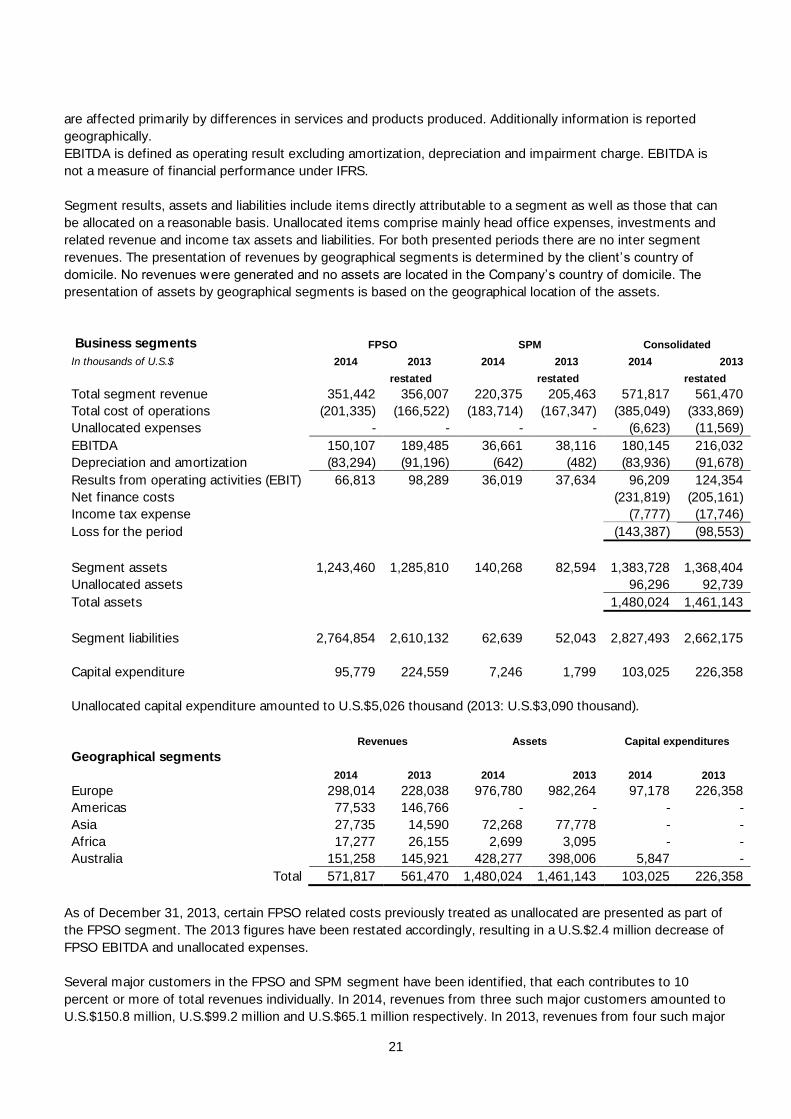
6. Segment information
The disclosure of segment information is consistent with the internal reports regularly reviewed by the Group’s
Chief Operating Decision Maker in order to assess each segment’s performance and to allocate resources to
them. Internal reporting is primarily based on business segments since the Company’s risks and rates of return
21
are affected primarily by differences in services and products produced. Additionally information is reported
geographically.
EBITDA is defined as operating result excluding amortizat ion, depreciation and impairment charge. EBITDA is
not a measure of financial performance under IFRS.
Segment results, assets and liabilities include items directly attributable to a segment as well as those that can
be allocated on a reasonable basis. Unallocated items comprise mainly head office expenses, investments and
related revenue and income tax assets and liabilities. For both presented periods there are no inter segment
revenues. The presentation of revenues by geographical segments is determined by the client’s country of
domicile. No revenues were generated and no assets are located in the Company’s country of domicile. The
presentation of assets by geographical segments is based on the geographical location of the assets.
FPSO SPM Consolidated Business segments
In thousands of U.S.$ 2014 2013 2014 2013 2014 2013
restated restated restated
Total segment revenue 351,442 356,007 220,375 205,463 571,817 561,470
Total cost of operations (201,335) (166,522) (183,714) (167,347) (385,049) (333,869)
Unallocated expenses - - - - (6,623) (11,569)
EBITDA 150,107 189,485 36,661 38,116 180,145 216,032
Depreciation and amortization (83,294) (91,196) (642) (482) (83,936) (91,678)
Results from operating activities (EBIT) 66,813 98,289 36,019 37,634 96,209 124,354
Net finance costs (231,819) (205,161)
Income tax expense (7,777) (17,746)
Loss for the period (143,387) (98,553)
Segment assets 1,243,460 1,285,810 140,268 82,594 1,383,728 1,368,404
Unallocated assets 96,296 92,739
Total assets 1,480,024 1,461,143
Segment liabilities 2,764,854 2,610,132 62,639 52,043 2,827,493 2,662,175
Capital expenditure 95,779 224,559 7,246 1,799 103,025 226,358
Unallocated capital expenditure amounted to U.S.$5,026 thousand (2013: U.S.$3,090 thousand).
Revenues Assets Capital expenditures
Geographical segments
2014 2013 2014 2013 2014 2013
Europe 298,014 228,038 976,780 982,264 97,178 226,358
Americas 77,533 146,766 - - - -
Asia 27,735 14,590 72,268 77,778 - -
Africa 17,277 26,155 2,699 3,095 - -
Australia 151,258 145,921 428,277 398,006 5,847 -
Total 571,817 561,470 1,480,024 1,461,143 103,025 226,358
As of December 31, 2013, certain FPSO related costs previously treated as unallocated are presented as part of
the FPSO segment. The 2013 figures have been restated accordingly, resulting in a U.S.$2.4 million decrease of
FPSO EBITDA and unallocated expenses.
Several major customers in the FPSO and SPM segment have been identified, that each contributes to 10
percent or more of total revenues individually. In 2014, revenues from three such major customers amounted to
U.S.$150.8 million, U.S.$99.2 million and U.S.$65.1 million respectively. In 2013, revenues from four such major
22
customers amounted to U.S.$145.6 million, U.S.$97.6 million, U.S.$73.6 million and U.S.$65.8 million
respectively.
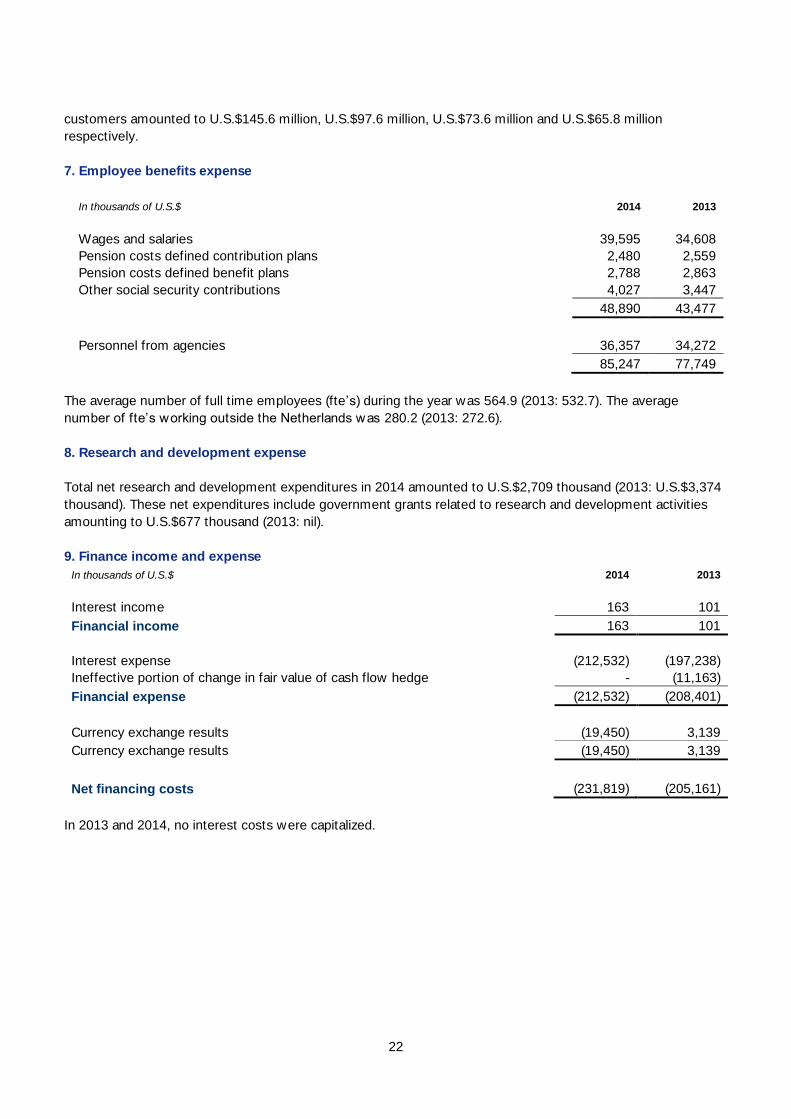
7. Employee benefits expense
In thousands of U.S.$ 2014 2013
Wages and salaries 39,595 34,608
Pension costs defined contribution plans 2,480 2,559
Pension costs defined benefit plans 2,788 2,863
Other social security contributions 4,027 3,447
48,890 43,477
Personnel from agencies 36,357 34,272
85,247 77,749
The average number of full time employees (fte’s) during the year was 564.9 (2013: 532.7). The average
number of fte’s working outside the Netherlands was 280.2 (2013: 272.6).
8. Research and development expense
Total net research and development expenditures in 2014 amounted to U.S.$2,709 thousand (2013: U.S.$3,374
thousand). These net expenditures include government grants related to research and development activities
amounting to U.S.$677 thousand (2013: nil).
9. Finance income and expense
In thousands of U.S.$ 2014 2013
Interest income 163 101
Financial income 163 101
Interest expense (212,532) (197,238)
Ineffective portion of change in fair value of cash flow hedge - (11,163)
Financial expense (212,532) (208,401)
Currency exchange results (19,450) 3,139
Currency exchange results (19,450) 3,139
Net financing costs (231,819) (205,161)
In 2013 and 2014, no interest costs were capitalized.

23
10. Income tax expense
The breakdown of income tax (expense)/benefit is as follows:
In thousands of U.S.$ 2014 2013
Current period taxes (7,459) (9,848)
Prior period adjustment (637) -
Change in deferred tax asset, net of valuation allowance 319 (7,898)
Total (expense)/ benefit (7,777) (17,746)
Current period taxes relate primarily to withholding tax incurred on the Glas Dowr contract.
The reconciliation of the income tax (expense)/benefit at statutory tax rates to the effective income tax is as
follows:
In thousands of U.S.$ 2014 2013
Loss before income taxes (135,610) (80,807)
Income tax using the Company’s domestic tax rate 25% 33,903 25% 20,202
Effect non-taxable income and expenses (15,494) (24,673)
Foreign losses not tax effected (6,434) 4,471
Other foreign taxes (7,459) (9,848)
Prior period adjustment (637) -
Deductions in foreign jurisdictions 1,216 -
Movement valuation allowance loss carry forward (12,872) (7,898)
Income tax (7,777) (17,746)
The effective tax rate for financial statement purposes differs from the statutory tax rate, mainly because the
Company is subject to taxation in various countries w ith different statutory tax rates and taxable results vary in
the various countries involved. Additionally, some group companies have significant tax losses carried forward,
for which no (full) deferred tax asset is recognized. Consequently, the Company’s taxable result may differ from
the operating result.
24
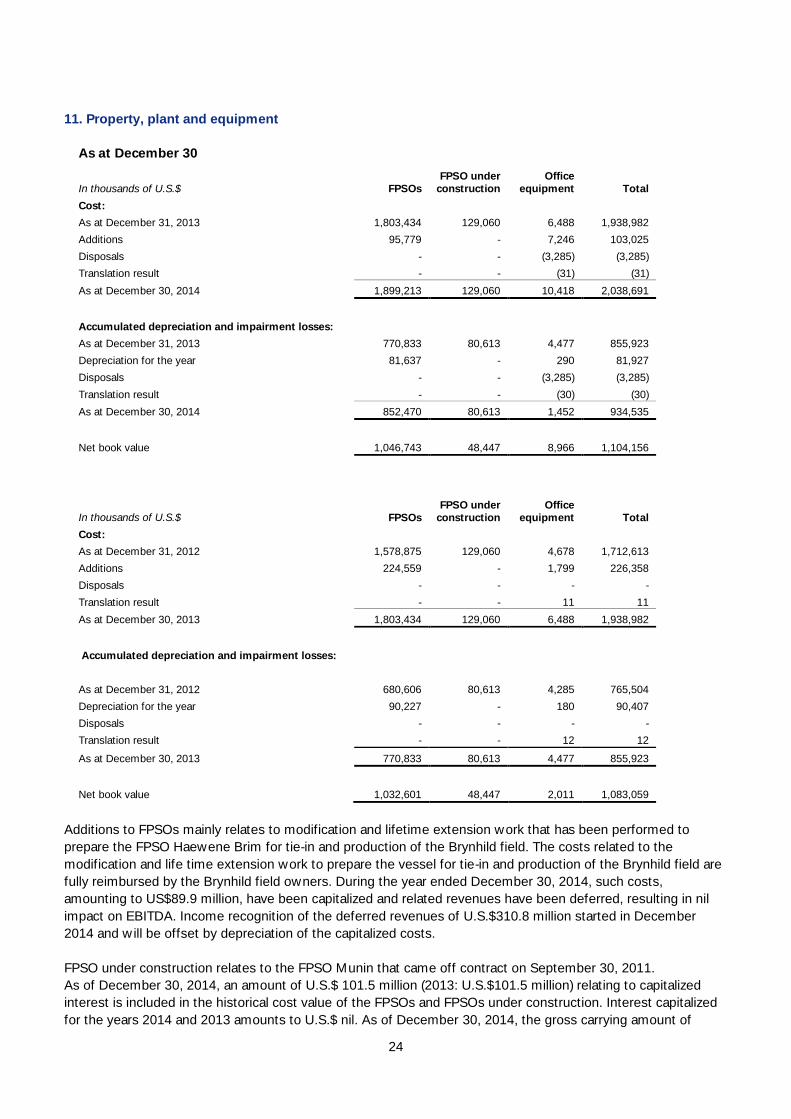
11. Property, plant and equipment
As at December 30
FPSOs
FPSO under
construction
Office
equipment Total
In thousands of U.S.$
Cost:
As at December 31, 2013 1,803,434 129,060 6,488 1,938,982
Additions 95,779 - 7,246 103,025
Disposals - - (3,285) (3,285)
Translation result - - (31) (31)
As at December 30, 2014 1,899,213 129,060 10,418 2,038,691
Accumulated depreciation and impairment losses:
As at December 31, 2013 770,833 80,613 4,477 855,923
Depreciation for the year 81,637 - 290 81,927
Disposals - - (3,285) (3,285)
Translation result - - (30) (30)
As at December 30, 2014 852,470 80,613 1,452 934,535
Net book value 1,046,743 48,447 8,966 1,104,156
FPSOs
FPSO under
construction
Office
equipment Total
In thousands of U.S.$
Cost:
As at December 31, 2012 1,578,875 129,060 4,678 1,712,613
Additions 224,559 - 1,799 226,358
Disposals - - - -
Translation result - - 11 11
As at December 30, 2013 1,803,434 129,060 6,488 1,938,982
Accumulated depreciation and impairment losses:
As at December 31, 2012 680,606 80,613 4,285 765,504
Depreciation for the year 90,227 - 180 90,407
Disposals - - - -
Translation result - - 12 12
As at December 30, 2013 770,833 80,613 4,477 855,923
Net book value 1,032,601 48,447 2,011 1,083,059
Additions to FPSOs mainly relates to modification and lifetime extension work that has been performed to
prepare the FPSO Haewene Brim for tie-in and production of the Brynhild field. The costs related to the
modification and life time extension work to prepare the vessel for tie-in and production of the Brynhild field are
fully reimbursed by the Brynhild field owners. During the year ended December 30, 2014, such costs,
amounting to US$89.9 million, have been capitalized and related revenues have been deferred, resulting in nil
impact on EBITDA. Income recognition of the deferred revenues of U.S.$310.8 million started in December
2014 and w ill be offset by depreciation of the capitalized costs.
FPSO under construction relates to the FPSO Munin that came off contract on September 30, 2011.
As of December 30, 2014, an amount of U.S.$ 101.5 million (2013: U.S.$101.5 million) relating to capitalized
interest is included in the historical cost value of the FPSOs and FPSOs under construction. Interest capitalized
for the years 2014 and 2013 amounts to U.S.$ nil. As of December 30, 2014, the gross carrying amount of
25
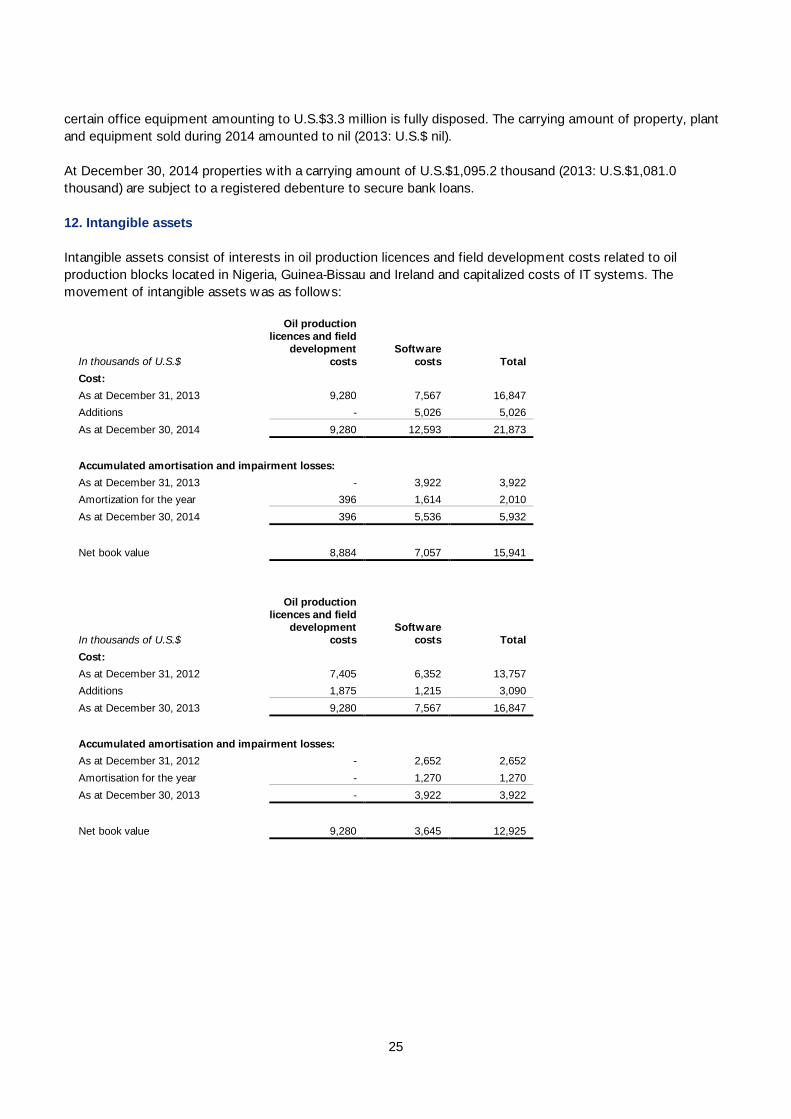
certain office equipment amounting to U.S.$3.3 million is fully disposed. The carrying amount of property, plant
and equipment sold during 2014 amounted to nil (2013: U.S.$ nil).
At December 30, 2014 properties w ith a carrying amount of U.S.$1,095.2 thousand (2013: U.S.$1,081.0
thousand) are subject to a registered debenture to secure bank loans.
12. Intangible assets
Intangible assets consist of interests in oil production licences and field development costs related to oil
production blocks located in Nigeria, Guinea-Bissau and Ireland and capitalized costs of IT systems. The
movement of intangible assets was as follows:
Oil production
licences and field
development
costs
Software
costs Total
In thousands of U.S.$
Cost:
As at December 31, 2013 9,280 7,567 16,847
Additions - 5,026 5,026
As at December 30, 2014 9,280 12,593 21,873
Accumulated amortisation and impairment losses:
As at December 31, 2013 - 3,922 3,922
Amortization for the year 396 1,614 2,010
As at December 30, 2014 396 5,536 5,932
Net book value 8,884 7,057 15,941
Oil production
licences and field
development
costs
Software
costs Total
In thousands of U.S.$
Cost:
As at December 31, 2012 7,405 6,352 13,757
Additions 1,875 1,215 3,090
As at December 30, 2013 9,280 7,567 16,847
Accumulated amortisation and impairment losses:
As at December 31, 2012 - 2,652 2,652
Amortisation for the year - 1,270 1,270
As at December 30, 2013 - 3,922 3,922
Net book value 9,280 3,645 12,925

26
13. Other financial assets, including derivatives
In thousands of U.S.$ 2014 2013
Non-current investments
Equity securities 24,030 24,108
Derivatives used for hedging 300 -
24,330 24,108
The equity securities consist of a 11.1% equity investment in Emerald Energy Resources Ltd, a Nigerian
indigenous oil company, a 11.1% equity investment in Amni Oil and Gas Ltd, a Nigerian company and an equity
investment in San Leon Energy Plc. (former Island Oil & Gas Plc). The equity investment in San Leon Energy is
stated at fair value. For the other investments, which are unlisted, there is no way of reliably measuring the fair
value using valuation techniques, therefore these investments are stated at historic cost.
14. Deferred tax assets
At December 30, 2013 and 2012, the tax effects of temporary differences and carry forwards that gave rise to
the Company’s deferred income tax assets are as follows:
In thousands of U.S.$ 2014 2013
Tax loss carry-forwards 53,787 54,196
Pensions 2,238 1,510
Deferred tax assets 56,025 55,706
The deferred tax assets relate to the group companies in the Netherlands. The tax loss carry-forwards in the
Netherlands result primarily from the amortization of goodwill and interest expense on intercompany debt which
resulted from an internal restructuring that was previously entered into w ith effect from January 1, 2000.
Additionally, the tax loss carry-forward increased due to operational losses in prior years. It is anticipated that
the tax loss carry-forwards will be largely realized in 2015, due to expected tax profits resulting from a planned
transfer of assets to newly established group entities. This anticipated transfer of assets w ill result in an
increased tax value of these assets. The Company has analysed the future realization of the remaining losses
carried forward as well as the temporary difference in book value, considering the Company’s history of
earnings, projected earnings based on current contracts as well as future contracts, the applicable tax rate, the
new rules regarding limitation of deductibility of interest and the maximum carry forward period of the tax
losses. Based on this analysis, the Company concluded that it is probable that an estimated amount resulting
from temporary differences resulting in a deferred tax asset of U.S.$56.0 million will be fully realized.
At December 30, 2014 the Company has loss carry forwards in the Netherlands of a total nominal amount of
U.S.$658.8 million expiring between 2016 and 2020. The following table specifies the years in which the
Company’s loss carry forwards w ill expire:
In thousands of U.S.$ 2016 2017 2018 2019 2020
2021
and
Beyond Total
Loss carry forwards
in the Netherlands 83,066 103,901 130,002 296,820 - 44,987 658,776
At December 30, 2014 the Company has loss carry forwards in the United Kingdom that do not expire of a total
nominal amount of U.S.$ 125.6 million, resulting primarily from operational losses incurred. Based on the history
27
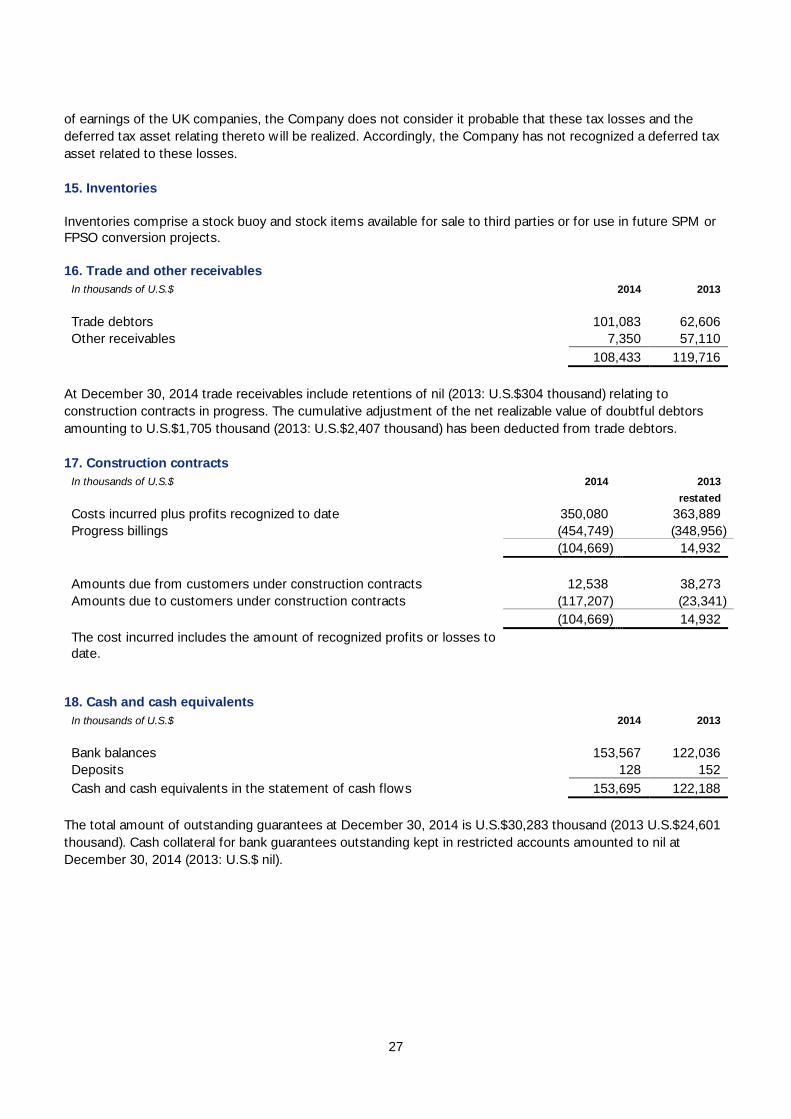
of earnings of the UK companies, the Company does not consider it probable that these tax losses and the
deferred tax asset relating thereto w ill be realized. Accordingly, the Company has not recognized a deferred tax
asset related to these losses.
15. Inventories
Inventories comprise a stock buoy and stock items available for sale to third parties or for use in future SPM or
FPSO conversion projects.
16. Trade and other receivables
In thousands of U.S.$ 2014 2013
Trade debtors 101,083 62,606
Other receivables 7,350 57,110
108,433 119,716
At December 30, 2014 trade receivables include retentions of nil (2013: U.S.$304 thousand) relating to
construction contracts in progress. The cumulative adjustment of the net realizable value of doubtful debtors
amounting to U.S.$1,705 thousand (2013: U.S.$2,407 thousand) has been deducted from trade debtors.
17. Construction contracts
In thousands of U.S.$ 2014 2013
restated
Costs incurred plus profits recognized to date 350,080 363,889
Progress billings (454,749) (348,956)
(104,669) 14,932
Amounts due from customers under construction contracts 12,538 38,273
Amounts due to customers under construction contracts (117,207) (23,341)
(104,669) 14,932
The cost incurred includes the amount of recognized profits or losses to
date.
18. Cash and cash equivalents
In thousands of U.S.$ 2014 2013
Bank balances 153,567 122,036
Deposits 128 152
Cash and cash equivalents in the statement of cash flows 153,695 122,188
The total amount of outstanding guarantees at December 30, 2014 is U.S.$30,283 thousand (2013 U.S.$24,601
thousand). Cash collateral for bank guarantees outstanding kept in restricted accounts amounted to nil at
December 30, 2014 (2013: U.S.$ nil).
28
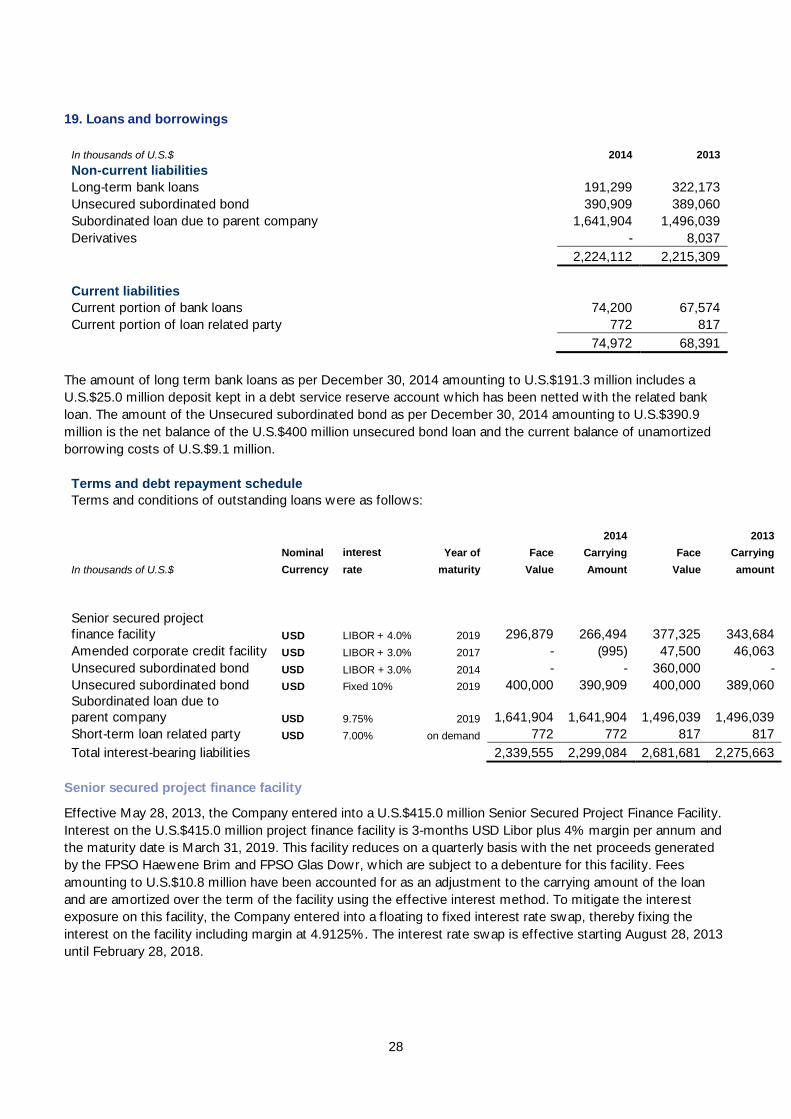
19. Loans and borrowings
In thousands of U.S.$ 2014 2013
Non-current liabilities
Long-term bank loans 191,299 322,173
Unsecured subordinated bond 390,909 389,060
Subordinated loan due to parent company 1,641,904 1,496,039
Derivatives - 8,037
2,224,112 2,215,309
Current liabilities
Current portion of bank loans 74,200 67,574
Current portion of loan related party 772 817
74,972 68,391
The amount of long term bank loans as per December 30, 2014 amounting to U.S.$191.3 million includes a
U.S.$25.0 million deposit kept in a debt service reserve account which has been netted w ith the related bank
loan. The amount of the Unsecured subordinated bond as per December 30, 2014 amounting to U.S.$390.9
million is the net balance of the U.S.$400 million unsecured bond loan and the current balance of unamortized
borrowing costs of U.S.$9.1 million.
Terms and debt repayment schedule
Terms and conditions of outstanding loans were as follows:
2014 2013
Nominal interest Year of Face Carrying Face Carrying
In thousands of U.S.$ Currency rate maturity Value Amount Value amount
Senior secured project
finance facility USD LIBOR + 4.0% 2019 296,879 266,494 377,325 343,684
Amended corporate credit facility USD LIBOR + 3.0% 2017 - (995) 47,500 46,063
Unsecured subordinated bond USD LIBOR + 3.0% 2014 - - 360,000 -
Unsecured subordinated bond USD Fixed 10% 2019 400,000 390,909 400,000 389,060
Subordinated loan due to
parent company USD 9.75% 2019 1,641,904 1,641,904 1,496,039 1,496,039
Short-term loan related party USD 7.00% on demand 772 772 817 817
Total interest-bearing liabilities 2,339,555 2,299,084 2,681,681 2,275,663
Senior secured project finance facility
Effective May 28, 2013, the Company entered into a U.S.$415.0 million Senior Secured Project Finance Facility.
Interest on the U.S.$415.0 million project finance facility is 3-months USD Libor plus 4% margin per annum and
the maturity date is March 31, 2019. This facility reduces on a quarterly basis with the net proceeds generated
by the FPSO Haewene Brim and FPSO Glas Dowr, which are subject to a debenture for this facility. Fees
amounting to U.S.$10.8 million have been accounted for as an adjustment to the carrying amount of the loan
and are amortized over the term of the facility using the effective interest method. To mitigate the interest
exposure on this facility, the Company entered into a floating to fixed interest rate swap, thereby fixing the
interest on the facility including margin at 4.9125%. The interest rate swap is effective starting August 28, 2013
until February 28, 2018.
29
Amended corporate credit facility
Effective May 28, 2013, the Company entered into a U.S.$102.5 million Amended corporate credit facility,
consisting of a U.S.$52.5 million term loan and a U.S.$50.0 million working capital facility. Effective December
10, 2013, the Company has entered into a further amendment of the Amended corporate credit facility. This
further amendment includes an increased facility amount of U.S.$120 million and interest at 3-months USD
Libor plus 3% margin per annum with final repayment ultimately on March 31, 2017. Total fees in relation to the
revisions of the Revolving Credit Facility amounting to U.S.$2.1 million have been accounted for as an
adjustment to the carrying amount of the loan and are amortized over the term of the facility. The terms and
conditions of the current corporate credit facility prohibit the payment of dividends. The outstanding amount as
per December 30, 2014 is nil.
Unsecured subordinated bond
Effective December 10, 2013, the Company issued a U.S.$400 million unsecured subordinated bond with a
fixed interest rate of 10% per year and a maturity date of December 10, 2019. On the same date the existing
U.S.$360 million unsecured bond loan was called and redemption of this loan took place on January 27, 2014.
Interest on this U.S.$360 million unsecured bond was fixed by means of an interest rate swap at 7.24%
including margin. The redemption costs on the U.S.$360.0 million unsecured bond loan, amount ing to U.S.$3.6
million, have been recorded as interest expense. As per December 30, 2013, an amount of U.S.$389.5 million,
being the net proceeds of the U.S.$400 million unsecured bond and the issue fees of U.S.$10.5 million, was
placed on a debt service reserve account. The total fees amounting to U.S.$10.9 million have been accounted
for as an adjustment to the carrying amount of the loan and are amortized over the term of the facility. The
amount of the unsecured subordinated bond as per December 30, 2013 amounting to U.S.$389.1 million is the
net balance of the U.S.$400 million unsecured new bond loan and the borrowing costs of U.S.$10.9 million. The
U.S.$360 million unsecured bond loan and redemption costs have been netted against the U.S.$389.5 million
kept in an escrow account for the purpose of repayment of the U.S.$360 million unsecured bond, and the
surplus amount in the escrow account is presented under cash and cash equivalents. The amount of the
unsecured subordinated bond as per December 30, 2014 amounting to U.S.$390.9 million is the net balance of
the U.S.$400 million unsecured bond loan and the current balance of unamortized borrowing costs of U.S.$9.1
million.
Subordinated loan parent company
The subordinated loan from Aurelia Energy N.V., the ultimate parent company, carries 9.75% interest per year,
which is accrued to the loan. The loan is subordinated to any and all other obligations of the Company.
Short-term loan related party
This loan from Aurelia Energy N.V., the ultimate parent company, carries a fixed interest rate of 7.0% and is
repayable upon demand. No guarantees have been provided for this loan.
20. Employee benefits
The group companies in the Netherlands provide defined benefit pension plans for all its employees. Under the
plan, which ended December 31, 2014, the employees are entitled to post-retirement yearly instalments
amounting to 1.75% of final salary in excess of a deductible of EUR13.5 thousand and up to a maximum of
EUR51.4 thousand, for each year of service until retirement age of 67. The liabilities and expenses arising from
these plans are as follows:
In thousands of U.S.$ 2014 2013
Present value of funded obligations (76,328) (53,702)
Fair value of plan assets 67,377 47,664
Net liability arising from defined benefit obligation (8,951) (6,038)
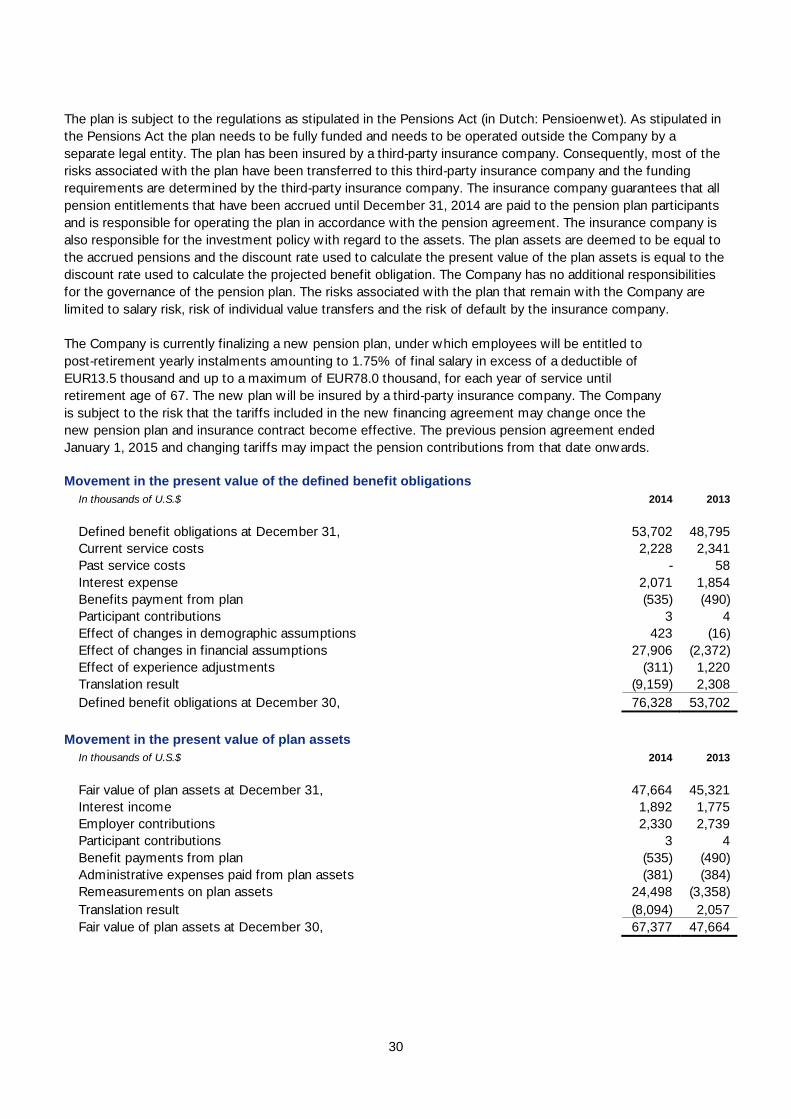
30
The plan is subject to the regulations as stipulated in the Pensions Act (in Dutch: Pensioenwet). As stipulated in
the Pensions Act the plan needs to be fully funded and needs to be operated outside the Company by a
separate legal entity. The plan has been insured by a third-party insurance company. Consequently, most of the
risks associated with the plan have been transferred to this third-party insurance company and the funding
requirements are determined by the third-party insurance company. The insurance company guarantees that all
pension entitlements that have been accrued until December 31, 2014 are paid to the pension plan participants
and is responsible for operating the plan in accordance with the pension agreement. The insurance company is
also responsible for the investment policy w ith regard to the assets. The plan assets are deemed to be equal to
the accrued pensions and the discount rate used to calculate the present value of the plan assets is equal to the
discount rate used to calculate the projected benefit obligation. The Company has no additional responsibilities
for the governance of the pension plan. The risks associated with the plan that remain w ith the Company are
limited to salary risk, risk of individual value transfers and the risk of default by the insurance company.
The Company is currently finalizing a new pension plan, under which employees will be entitled to
post-retirement yearly instalments amounting to 1.75% of final salary in excess of a deductible of
EUR13.5 thousand and up to a maximum of EUR78.0 thousand, for each year of service until
retirement age of 67. The new plan w ill be insured by a third-party insurance company. The Company
is subject to the risk that the tariffs included in the new financing agreement may change once the
new pension plan and insurance contract become effective. The previous pension agreement ended
January 1, 2015 and changing tariffs may impact the pension contributions from that date onwards.
Movement in the present value of the defined benefit obligations
In thousands of U.S.$ 2014 2013
Defined benefit obligations at December 31, 53,702 48,795
Current service costs 2,228 2,341
Past service costs - 58
Interest expense 2,071 1,854
Benefits payment from plan (535) (490)
Participant contributions 3 4
Effect of changes in demographic assumptions 423 (16)
Effect of changes in financial assumptions 27,906 (2,372)
Effect of experience adjustments (311) 1,220
Translation result (9,159) 2,308
Defined benefit obligations at December 30, 76,328 53,702
Movement in the present value of plan assets
In thousands of U.S.$ 2014 2013
Fair value of plan assets at December 31, 47,664 45,321
Interest income 1,892 1,775
Employer contributions 2,330 2,739
Participant contributions 3 4
Benefit payments from plan (535) (490)
Administrative expenses paid from plan assets (381) (384)
Remeasurements on plan assets 24,498 (3,358)
Translation result (8,094) 2,057
Fair value of plan assets at December 30, 67,377 47,664
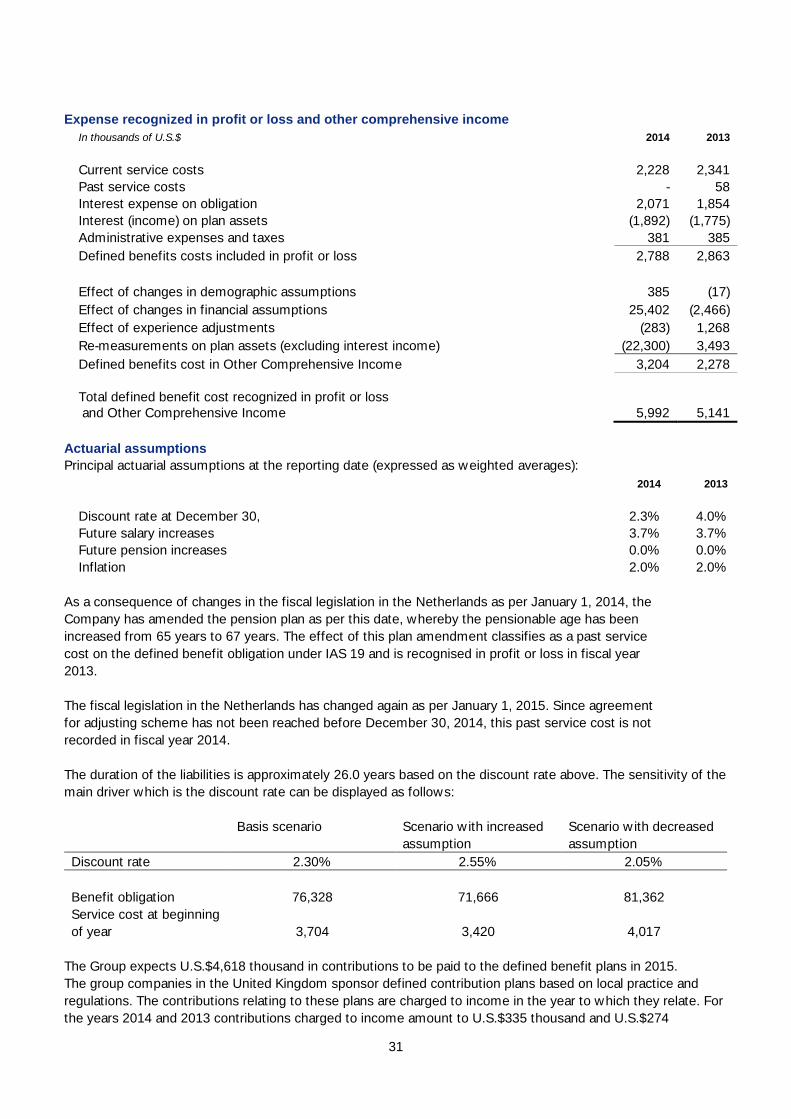
31
Expense recognized in profit or loss and other comprehensive income
In thousands of U.S.$ 2014 2013
Current service costs 2,228 2,341
Past service costs - 58
Interest expense on obligation 2,071 1,854
Interest (income) on plan assets (1,892) (1,775)
Administrative expenses and taxes 381 385
Defined benefits costs included in profit or loss 2,788 2,863
Effect of changes in demographic assumptions 385 (17)
Effect of changes in financial assumptions 25,402 (2,466)
Effect of experience adjustments (283) 1,268
Re-measurements on plan assets (excluding interest income) (22,300) 3,493
Defined benefits cost in Other Comprehensive Income 3,204 2,278
Total defined benefit cost recognized in profit or loss
and Other Comprehensive Income 5,992 5,141
Actuarial assumptions
Principal actuarial assumptions at the reporting date (expressed as weighted averages):
2014 2013
Discount rate at December 30, 2.3% 4.0%
Future salary increases 3.7% 3.7%
Future pension increases 0.0% 0.0%
Inflation 2.0% 2.0%
As a consequence of changes in the fiscal legislation in the Netherlands as per January 1, 2014, the
Company has amended the pension plan as per this date, whereby the pensionable age has been
increased from 65 years to 67 years. The effect of this plan amendment classifies as a past service
cost on the defined benefit obligation under IAS 19 and is recognised in profit or loss in fiscal year
2013.
The fiscal legislation in the Netherlands has changed again as per January 1, 2015. Since agreement
for adjusting scheme has not been reached before December 30, 2014, this past service cost is not
recorded in fiscal year 2014.
The duration of the liabilities is approximately 26.0 years based on the discount rate above. The sensitivity of the
main driver which is the discount rate can be displayed as follows:
Basis scenario Scenario w ith increased
assumption
Scenario w ith decreased
assumption
Discount rate 2.30% 2.55% 2.05%
Benefit obligation
76,328
71,666
81,362
Service cost at beginning
of year
3,704
3,420
4,017
The Group expects U.S.$4,618 thousand in contributions to be paid to the defined benefit plans in 2015.
The group companies in the United Kingdom sponsor defined contribution plans based on local practice and
regulations. The contributions relating to these plans are charged to income in the year to which they relate. For
the years 2014 and 2013 contributions charged to income amount to U.S.$335 thousand and U.S.$274
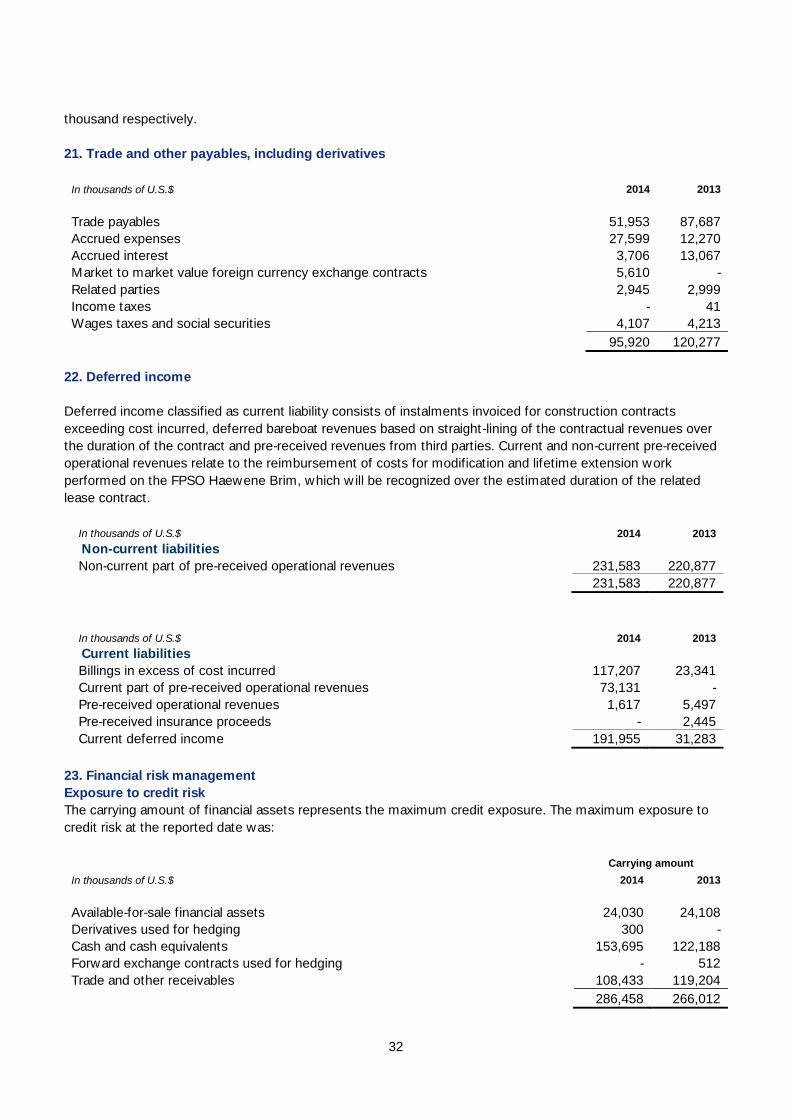
32
thousand respectively.
21. Trade and other payables, including derivatives
In thousands of U.S.$ 2014 2013
Trade payables 51,953 87,687
Accrued expenses 27,599 12,270
Accrued interest 3,706 13,067
Market to market value foreign currency exchange contracts 5,610 -
Related parties 2,945 2,999
Income taxes - 41
Wages taxes and social securities 4,107 4,213
95,920 120,277
22. Deferred income
Deferred income classified as current liability consists of instalments invoiced for construction contracts
exceeding cost incurred, deferred bareboat revenues based on straight-lining of the contractual revenues over
the duration of the contract and pre-received revenues from third parties. Current and non-current pre-received
operational revenues relate to the reimbursement of costs for modification and lifetime extension work
performed on the FPSO Haewene Brim, which w ill be recognized over the estimated duration of the related
lease contract.
In thousands of U.S.$ 2014 2013
Non-current liabilities
Non-current part of pre-received operational revenues 231,583 220,877
231,583 220,877
In thousands of U.S.$ 2014 2013
Current liabilities
Billings in excess of cost incurred 117,207 23,341
Current part of pre-received operational revenues 73,131 -
Pre-received operational revenues 1,617 5,497
Pre-received insurance proceeds - 2,445
Current deferred income 191,955 31,283
23. Financial risk management
Exposure to credit risk
The carrying amount of financial assets represents the maximum credit exposure. The maximum exposure to
credit risk at the reported date was:
Carrying amount
In thousands of U.S.$ 2014 2013
Available-for-sale financial assets 24,030 24,108
Derivatives used for hedging 300 -
Cash and cash equivalents 153,695 122,188
Forward exchange contracts used for hedging - 512
Trade and other receivables 108,433 119,204
286,458 266,012
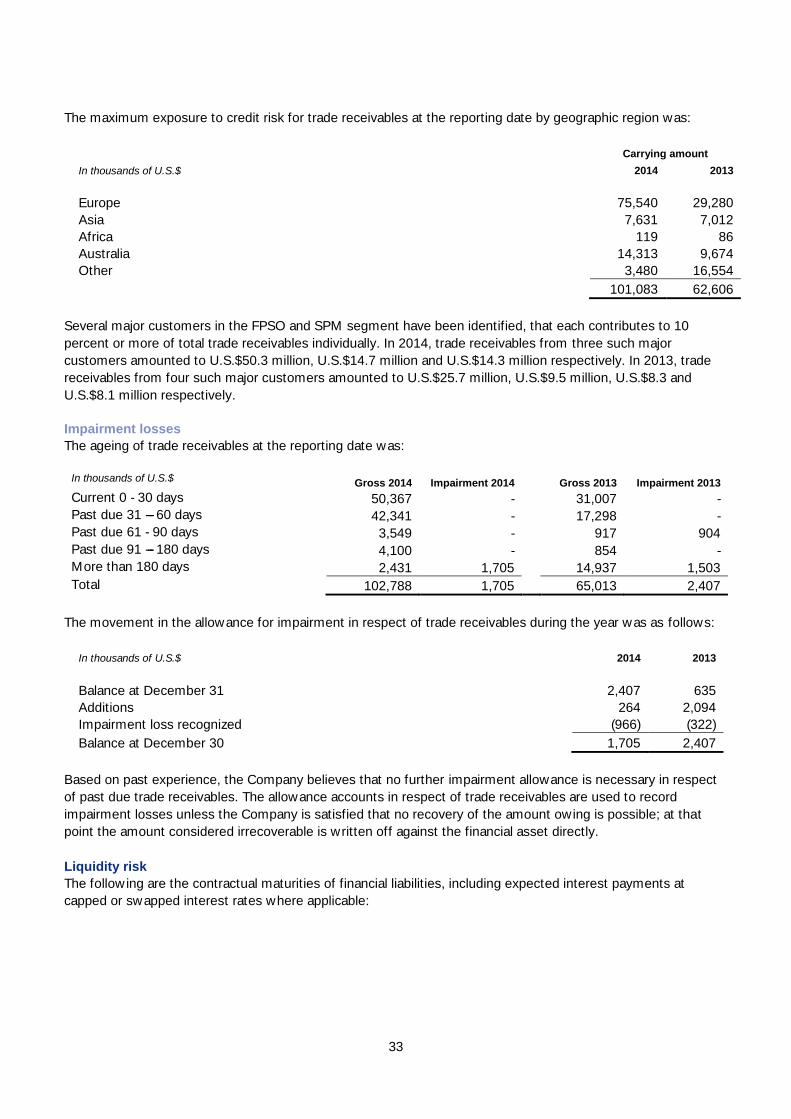
33
The maximum exposure to credit risk for trade receivables at the reporting date by geographic region was:
Carrying amount
In thousands of U.S.$ 2014 2013
Europe 75,540 29,280
Asia 7,631 7,012
Africa 119 86
Australia 14,313 9,674
Other 3,480 16,554
101,083 62,606
Several major customers in the FPSO and SPM segment have been identified, that each contributes to 10
percent or more of total trade receivables individually. In 2014, trade receivables from three such major
customers amounted to U.S.$50.3 million, U.S.$14.7 million and U.S.$14.3 million respectively. In 2013, trade
receivables from four such major customers amounted to U.S.$25.7 million, U.S.$9.5 million, U.S.$8.3 and
U.S.$8.1 million respectively.
Impairment losses
The ageing of trade receivables at the reporting date was:
In thousands of U.S.$ Gross 2014 Impairment 2014 Gross 2013 Impairment 2013
Current 0 - 30 days 50,367 - 31,007 -
Past due 31 ---- 60 days 42,341 - 17,298 -
Past due 61 - 90 days 3,549 - 917 904
Past due 91 ---- 180 days 4,100 - 854 -
More than 180 days 2,431 1,705 14,937 1,503
Total 102,788 1,705 65,013 2,407
The movement in the allowance for impairment in respect of trade receivables during the year was as follows:
In thousands of U.S.$ 2014 2013
Balance at December 31 2,407 635
Additions 264 2,094
Impairment loss recognized (966) (322)
Balance at December 30 1,705 2,407
Based on past experience, the Company believes that no further impairment allowance is necessary in respect
of past due trade receivables. The allowance accounts in respect of trade receivables are used to record
impairment losses unless the Company is satisfied that no recovery of the amount owing is possible; at that
point the amount considered irrecoverable is written off against the financial asset directly.
Liquidity risk
The follow ing are the contractual maturities of financial liabilities, including expected interest payments at
capped or swapped interest rates where applicable:
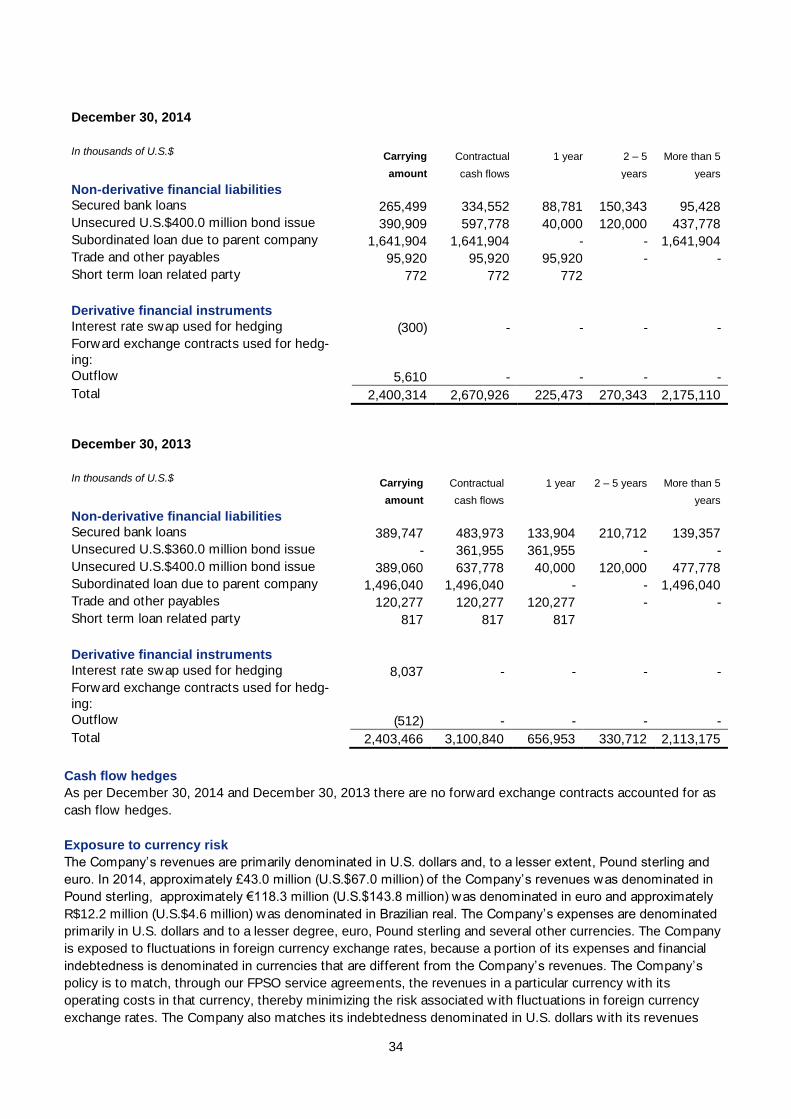
34
December 30, 2014
In thousands of U.S.$ Carrying
amount
Contractual
cash flows
1 year 2 – 5
years
More than 5
years
Non-derivative financial liabilities Secured bank loans 265,499 334,552 88,781 150,343 95,428
Unsecured U.S.$400.0 million bond issue 390,909 597,778 40,000 120,000 437,778
Subordinated loan due to parent company 1,641,904 1,641,904 - - 1,641,904
Trade and other payables 95,920 95,920 95,920 - -
Short term loan related party 772 772 772
Derivative financial instruments
Interest rate swap used for hedging (300) - - - -
Forward exchange contracts used for hedg-
ing:
Outflow 5,610 - - - -
Total 2,400,314 2,670,926 225,473 270,343 2,175,110
December 30, 2013
In thousands of U.S.$ Carrying
amount
Contractual
cash flows
1 year 2 – 5 years More than 5
years
Non-derivative financial liabilities Secured bank loans 389,747 483,973 133,904 210,712 139,357
Unsecured U.S.$360.0 million bond issue - 361,955 361,955 - -
Unsecured U.S.$400.0 million bond issue 389,060 637,778 40,000 120,000 477,778
Subordinated loan due to parent company 1,496,040 1,496,040 - - 1,496,040
Trade and other payables 120,277 120,277 120,277 - -
Short term loan related party 817 817 817
Derivative financial instruments
Interest rate swap used for hedging 8,037 - - - -
Forward exchange contracts used for hedg-
ing:
Outflow (512) - - - -
Total 2,403,466 3,100,840 656,953 330,712 2,113,175
Cash flow hedges
As per December 30, 2014 and December 30, 2013 there are no forward exchange contracts accounted for as
cash flow hedges.
Exposure to currency risk
The Company’s revenues are primarily denominated in U.S. dollars and, to a lesser extent, Pound sterling and
euro. In 2014, approximately £43.0 million (U.S.$67.0 million) of the Company’s revenues was denominated in
Pound sterling, approximately €118.3 million (U.S.$143.8 million) was denominated in euro and approximately
R$12.2 million (U.S.$4.6 million) was denominated in Brazilian real. The Company’s expenses are denominated
primarily in U.S. dollars and to a lesser degree, euro, Pound sterling and several other currencies. The Company
is exposed to fluctuations in foreign currency exchange rates, because a portion of its expenses and financial
indebtedness is denominated in currencies that are different from the Company’s revenues. The Company’s
policy is to match, through our FPSO service agreements, the revenues in a particular currency w ith its
operating costs in that currency, thereby minimizing the risk associated w ith fluctuations in foreign currency
exchange rates. The Company also matches its indebtedness denominated in U.S. dollars with its revenues
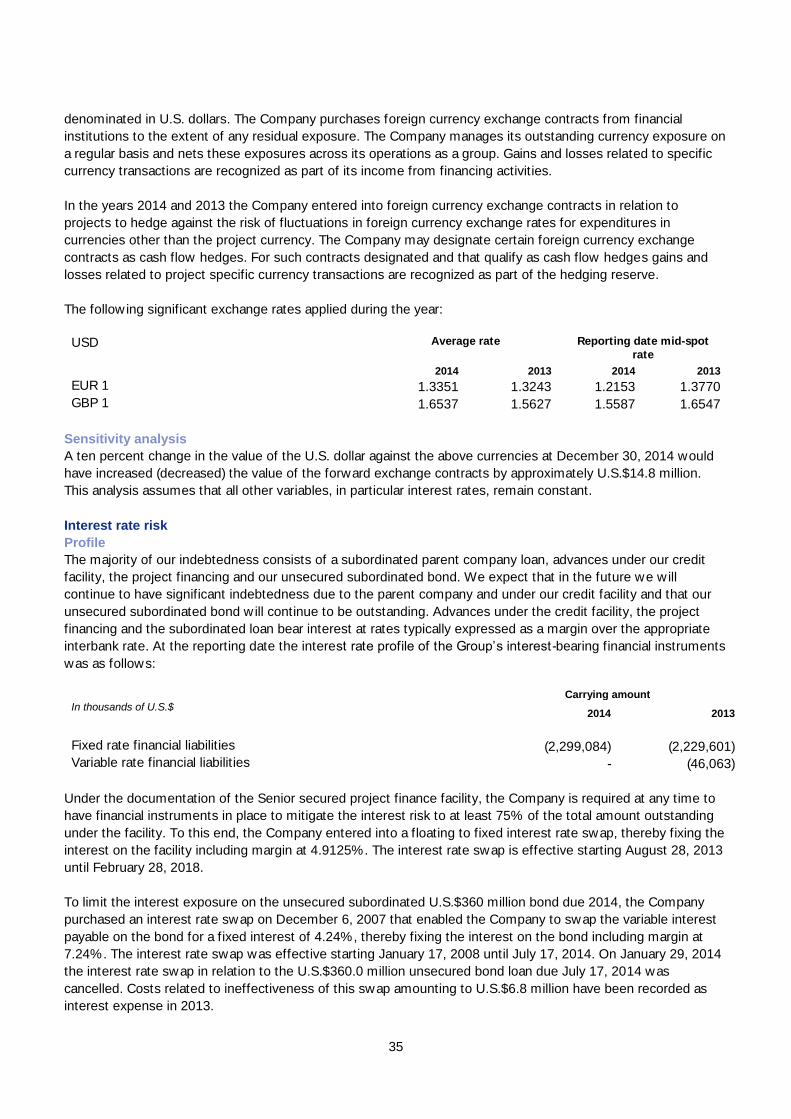
35
denominated in U.S. dollars. The Company purchases foreign currency exchange contracts from financial
institutions to the extent of any residual exposure. The Company manages its outstanding currency exposure on
a regular basis and nets these exposures across its operations as a group. Gains and losses related to specific
currency transactions are recognized as part of its income from financing activities.
In the years 2014 and 2013 the Company entered into foreign currency exchange contracts in relation to
projects to hedge against the risk of fluctuations in foreign currency exchange rates for expenditures in
currencies other than the project currency. The Company may designate certain foreign currency exchange
contracts as cash flow hedges. For such contracts designated and that qualify as cash flow hedges gains and
losses related to project specific currency transactions are recognized as part of the hedging reserve.
The follow ing significant exchange rates applied during the year:
USD Average rate Reporting date mid-spot
rate 2014 2013 2014 2013
EUR 1 1.3351 1.3243 1.2153 1.3770
GBP 1 1.6537 1.5627 1.5587 1.6547
Sensitivity analysis
A ten percent change in the value of the U.S. dollar against the above currencies at December 30, 2014 would
have increased (decreased) the value of the forward exchange contracts by approximately U.S.$14.8 million.
This analysis assumes that all other variables, in particular interest rates, remain constant.
Interest rate risk
Profile
The majority of our indebtedness consists of a subordinated parent company loan, advances under our credit
facility, the project financing and our unsecured subordinated bond. We expect that in the future we will
continue to have significant indebtedness due to the parent company and under our credit facility and that our
unsecured subordinated bond w ill continue to be outstanding. Advances under the credit facility, the project
financing and the subordinated loan bear interest at rates typically expressed as a margin over the appropriate
interbank rate. At the reporting date the interest rate profile of the Group’s interest-bearing financial instruments
was as follows:
Carrying amount In thousands of U.S.$
2014 2013
Fixed rate financial liabilities (2,299,084) (2,229,601)
Variable rate financial liabilities - (46,063)
Under the documentation of the Senior secured project finance facility, the Company is required at any time to
have financial instruments in place to mitigate the interest risk to at least 75% of the total amount outstanding
under the facility. To this end, the Company entered into a floating to fixed interest rate swap, thereby fixing the
interest on the facility including margin at 4.9125%. The interest rate swap is effective starting August 28, 2013
until February 28, 2018.
To limit the interest exposure on the unsecured subordinated U.S.$360 million bond due 2014, the Company
purchased an interest rate swap on December 6, 2007 that enabled the Company to swap the variable interest
payable on the bond for a fixed interest of 4.24%, thereby fixing the interest on the bond including margin at
7.24%. The interest rate swap was effective starting January 17, 2008 until July 17, 2014. On January 29, 2014
the interest rate swap in relation to the U.S.$360.0 million unsecured bond loan due July 17, 2014 was
cancelled. Costs related to ineffectiveness of this swap amounting to U.S.$6.8 million have been recorded as
interest expense in 2013.
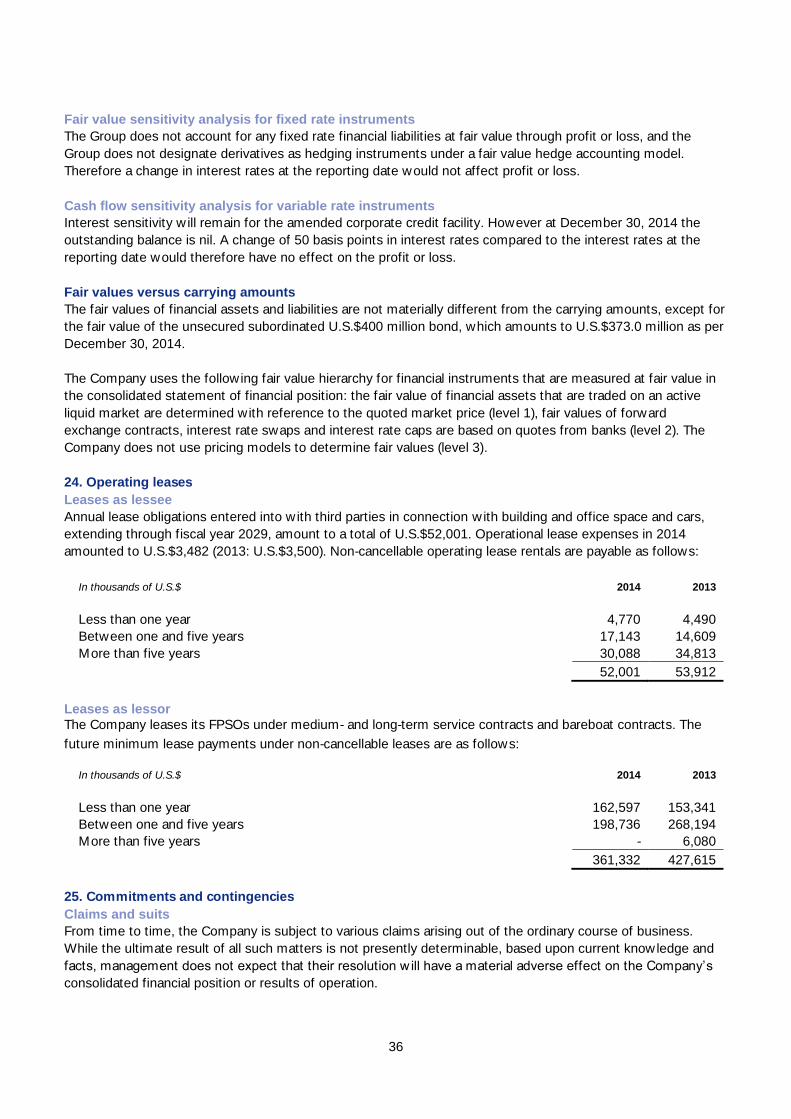
36
Fair value sensitivity analysis for fixed rate instruments
The Group does not account for any fixed rate financial liabilities at fair value through profit or loss, and the
Group does not designate derivatives as hedging instruments under a fair value hedge accounting model.
Therefore a change in interest rates at the reporting date would not affect profit or loss.
Cash flow sensitivity analysis for variable rate instruments
Interest sensitivity w ill remain for the amended corporate credit facility. However at December 30, 2014 the
outstanding balance is nil. A change of 50 basis points in interest rates compared to the interest rates at the
reporting date would therefore have no effect on the profit or loss.
Fair values versus carrying amounts
The fair values of financial assets and liabilities are not materially different from the carrying amounts, except for
the fair value of the unsecured subordinated U.S.$400 million bond, which amounts to U.S.$373.0 million as per
December 30, 2014.
The Company uses the following fair value hierarchy for financial instruments that are measured at fair value in
the consolidated statement of financial position: the fair value of financial assets that are traded on an active
liquid market are determined with reference to the quoted market price (level 1), fair values of forward
exchange contracts, interest rate swaps and interest rate caps are based on quotes from banks (level 2). The
Company does not use pricing models to determine fair values (level 3).
24. Operating leases
Leases as lessee
Annual lease obligations entered into w ith third parties in connection w ith building and office space and cars,
extending through fiscal year 2029, amount to a total of U.S.$52,001. Operational lease expenses in 2014
amounted to U.S.$3,482 (2013: U.S.$3,500). Non-cancellable operating lease rentals are payable as follows:
In thousands of U.S.$ 2014 2013
Less than one year 4,770 4,490
Between one and five years 17,143 14,609
More than five years 30,088 34,813
52,001 53,912
Leases as lessor
The Company leases its FPSOs under medium- and long-term service contracts and bareboat contracts. The
future minimum lease payments under non-cancellable leases are as follows:
In thousands of U.S.$ 2014 2013
Less than one year 162,597 153,341
Between one and five years 198,736 268,194
More than five years - 6,080
361,332 427,615
25. Commitments and contingencies
Claims and suits
From time to time, the Company is subject to various claims arising out of the ordinary course of business.
While the ultimate result of all such matters is not presently determinable, based upon current knowledge and
facts, management does not expect that their resolution w ill have a material adverse effect on the Company’s
consolidated financial position or results of operation.
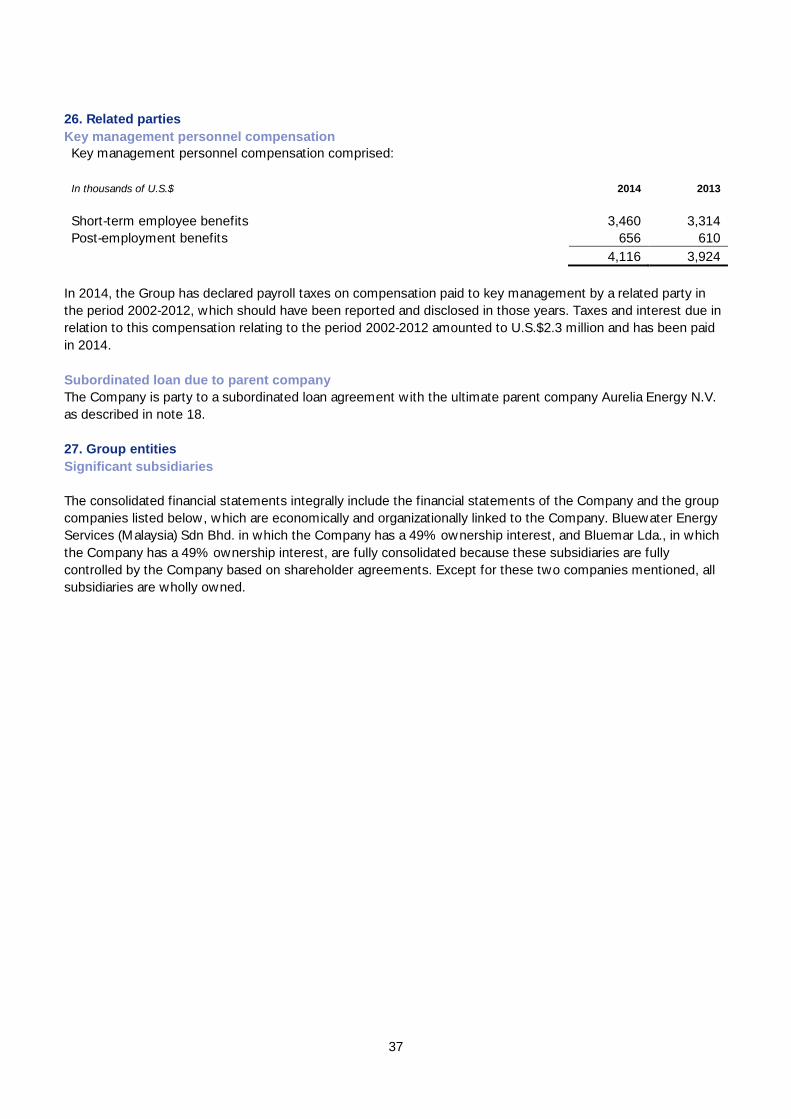
37
26. Related parties
Key management personnel compensation
Key management personnel compensation comprised:
In thousands of U.S.$ 2014 2013
Short-term employee benefits 3,460 3,314
Post-employment benefits 656 610
4,116 3,924
In 2014, the Group has declared payroll taxes on compensation paid to key management by a related party in
the period 2002-2012, which should have been reported and disclosed in those years. Taxes and interest due in
relation to this compensation relating to the period 2002-2012 amounted to U.S.$2.3 million and has been paid
in 2014.
Subordinated loan due to parent company
The Company is party to a subordinated loan agreement with the ultimate parent company Aurelia Energy N.V.
as described in note 18.
27. Group entities
Significant subsidiaries
The consolidated financial statements integrally include the financial statements of the Company and the group
companies listed below, which are economically and organizationally linked to the Company. Bluewater Energy
Services (Malaysia) Sdn Bhd. in which the Company has a 49% ownership interest, and Bluemar Lda., in which
the Company has a 49% ownership interest, are fully consolidated because these subsidiaries are fully
controlled by the Company based on shareholder agreements. Except for these two companies mentioned, all
subsidiaries are wholly owned.

38
Name Legal seat
Bluemar Lda. Luanda, Angola
Bluewater (Aoka Mizu) B.V. Hoofddorp, the Netherlands
Bluewater (Aoka Mizu) N.V. Willemstad, Curaçao
Bluewater Australia Pty Ltd. Melbourne, Victoria
Bluewater (Bleo Holm) B.V. Hoofddorp, the Netherlands
Bluewater (Bleo Holm) N.V. Willemstad, Curaçao
Bluewater China Offshore Equipment Production Co Ltd Tianjin, China
Bluewater (Dili) Unipessoal, Ltda. Dili, Timor Leste
Bluewater do Brasil Serviços de Energia Ltda. Rio de Janeiro, Brasil
Bluewater Energy Contractors B.V. Hoofddorp, the Netherlands
Bluewater Energy Services B.V. Haarlemmermeer, the Netherlands
Bluewater Energy Services (Malaysia) Sdn Bhd Kuala Lumpur, Malaysia
Bluewater Ettrick Production (UK) Ltd. London, United Kingdom
Bluewater Floating Production B.V. Hoofddorp, the Netherlands
Bluewater (Floating Production) Ltd. London, United Kingdom
Bluewater (Glas Dowr) B.V. Hoofddorp, the Netherlands
Bluewater (Glas Dowr) N.V. Willemstad, Curaçao
Bluewater (Haewene Brim) B.V. Hoofddorp, the Netherlands
Bluewater (Haewene Brim) N.V. Willemstad, Curaçao
Bluewater Holding B.V. Hoofddorp, the Netherlands
Bluewater International B.V. Hoofddorp, the Netherlands
Bluewater International Holdings B.V. Hoofddorp, the Netherlands
Bluewater Manning Services Ltd. London, United Kingdom
Bluewater (Munin) B.V. Hoofddorp, the Netherlands
Bluewater (Munin) N.V. Willemstad, Curaçao
Bluewater (Norway) ANS Oslo, Norway
Bluewater Offshore Productions Systems Nigeria Ltd. Lagos, Nigeria
Bluewater Offshore Production Systems N.V. Willemstad, Curaçao
Bluewater Oil & Gas Investments Ltd. Lagos, Nigeria
Bluewater Operations (UK) Ltd. London, United Kingdom
Bluewater Services International Private Ltd. Singapore
Bluewater Services (UK) Ltd. London, United Kingdom
Bluewater Technical Support N.V. Willemstad, Curaçao
Bluewater Tidal Energy Ltd. London, United Kingdom
Bluewater Terminal Systems N.V. Willemstad, Curaçao
Bluewater (UK) Ltd. London, United Kingdom
Lufeng Development Company ANS Oslo, Norway
Pierce Production Company Ltd. London, United Kingdom
Supernova Energy B.V. Hoofddorp, the Netherlands
Supernova Ireland Resources B.V. Hoofddorp, the Netherlands
Bluewater Manning Services Limited (Company Number 05144206) is exempt from the audit requirements of
the UK Companies Act 2006 by virtue of s479A of that UK Act. Bluewater Offshore Productions Systems (USA)
Inc. has been dissolved as per May 21, 2014.
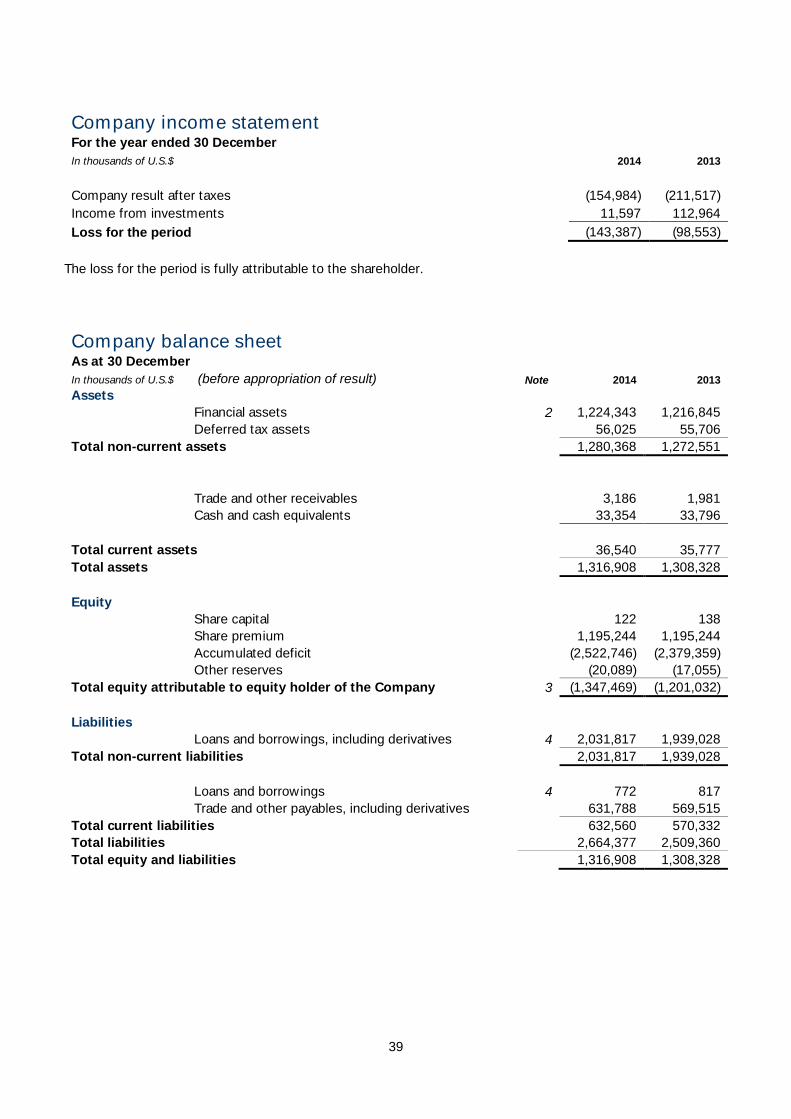
39
Company income statement
For the year ended 30 December
In thousands of U.S.$ 2014 2013
Company result after taxes (154,984) (211,517)
Income from investments 11,597 112,964
Loss for the period (143,387) (98,553)
The loss for the period is fully attributable to the shareholder.
Company balance sheet
As at 30 December
In thousands of U.S.$ (before appropriation of result) Note 2014 2013
Assets
Financial assets 2 1,224,343 1,216,845
Deferred tax assets 56,025 55,706
Total non-current assets 1,280,368 1,272,551
Trade and other receivables 3,186 1,981
Cash and cash equivalents 33,354 33,796
Total current assets 36,540 35,777
Total assets 1,316,908 1,308,328
Equity
Share capital 122 138
Share premium 1,195,244 1,195,244
Accumulated deficit (2,522,746) (2,379,359)
Other reserves (20,089) (17,055)
Total equity attributable to equity holder of the Company 3 (1,347,469) (1,201,032)
Liabilities
Loans and borrowings, including derivatives 4 2,031,817 1,939,028
Total non-current liabilities 2,031,817 1,939,028
Loans and borrowings 4 772 817
Trade and other payables, including derivatives 631,788 569,515
Total current liabilities 632,560 570,332
Total liabilities 2,664,377 2,509,360
Total equity and liabilities 1,316,908 1,308,328
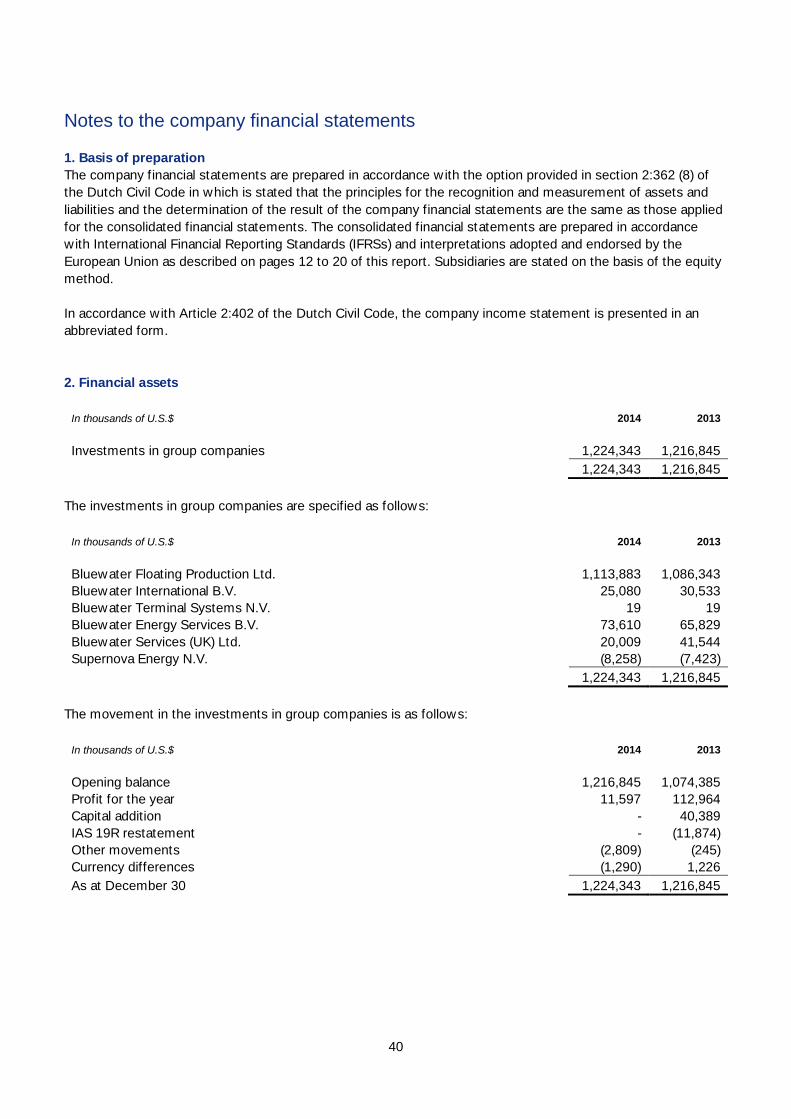
40
Notes to the company financial statements
1. Basis of preparation
The company financial statements are prepared in accordance w ith the option provided in section 2:362 (8) of
the Dutch Civil Code in which is stated that the principles for the recognition and measurement of assets and
liabilities and the determination of the result of the company financial statements are the same as those applied
for the consolidated financial statements. The consolidated financial statements are prepared in accordance
with International Financial Reporting Standards (IFRSs) and interpretations adopted and endorsed by the
European Union as described on pages 12 to 20 of this report. Subsidiaries are stated on the basis of the equity
method.
In accordance with Article 2:402 of the Dutch Civil Code, the company income statement is presented in an
abbreviated form.
2. Financial assets
In thousands of U.S.$ 2014 2013
Investments in group companies 1,224,343 1,216,845
1,224,343 1,216,845
The investments in group companies are specified as follows:
In thousands of U.S.$ 2014 2013
Bluewater Floating Production Ltd. 1,113,883 1,086,343
Bluewater International B.V. 25,080 30,533
Bluewater Terminal Systems N.V. 19 19
Bluewater Energy Services B.V. 73,610 65,829
Bluewater Services (UK) Ltd. 20,009 41,544
Supernova Energy N.V. (8,258) (7,423)
1,224,343 1,216,845
The movement in the investments in group companies is as follows:
In thousands of U.S.$ 2014 2013
Opening balance 1,216,845 1,074,385
Profit for the year 11,597 112,964
Capital addition - 40,389
IAS 19R restatement - (11,874)
Other movements (2,809) (245)
Currency differences (1,290) 1,226
As at December 30 1,224,343 1,216,845
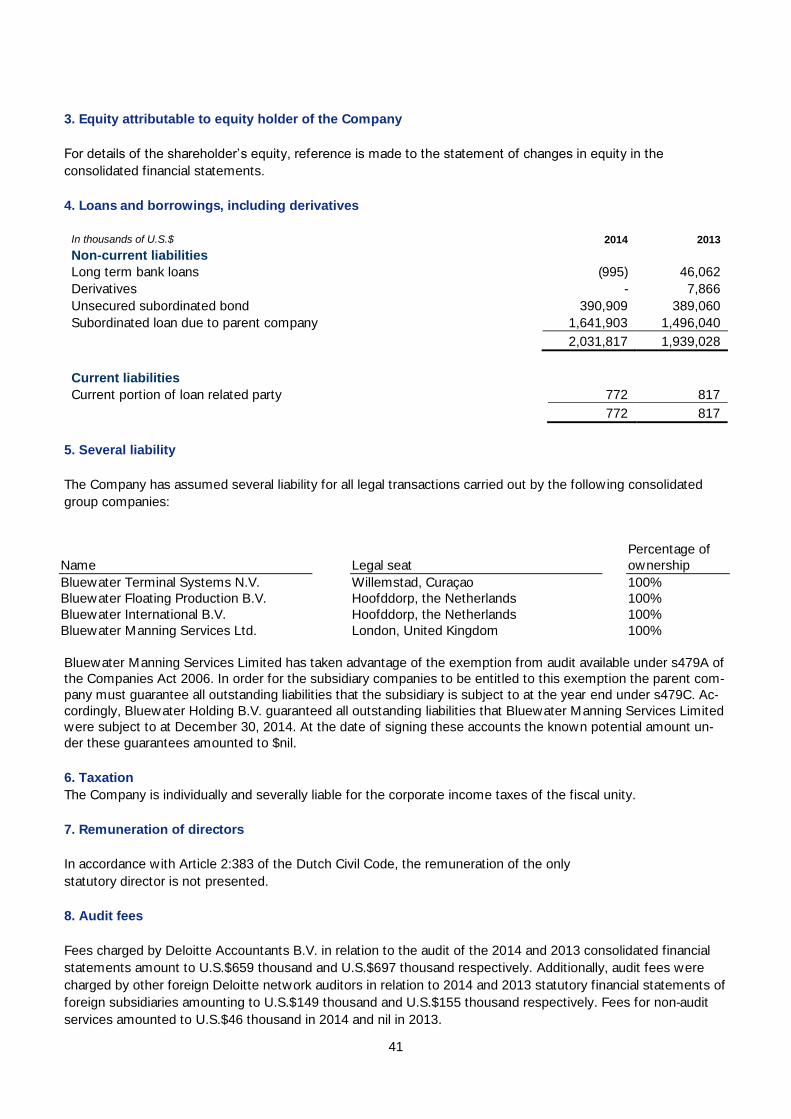
41
3. Equity attributable to equity holder of the Company
For details of the shareholder’s equity, reference is made to the statement of changes in equity in the
consolidated financial statements.
4. Loans and borrowings, including derivatives
In thousands of U.S.$ 2014 2013
Non-current liabilities
Long term bank loans (995) 46,062
Derivatives - 7,866
Unsecured subordinated bond 390,909 389,060
Subordinated loan due to parent company 1,641,903 1,496,040
2,031,817 1,939,028
Current liabilities
Current portion of loan related party 772 817
772 817
5. Several liability
The Company has assumed several liability for all legal transactions carried out by the following consolidated
group companies:
Name
Legal seat
Percentage of
ownership
Bluewater Terminal Systems N.V. Willemstad, Curaçao 100%
Bluewater Floating Production B.V. Hoofddorp, the Netherlands 100%
Bluewater International B.V. Hoofddorp, the Netherlands 100%
Bluewater Manning Services Ltd. London, United Kingdom 100%
Bluewater Manning Services Limited has taken advantage of the exemption from audit available under s479A of
the Companies Act 2006. In order for the subsidiary companies to be entitled to this exemption the parent com-
pany must guarantee all outstanding liabilities that the subsidiary is subject to at the year end under s479C. Ac-
cordingly, Bluewater Holding B.V. guaranteed all outstanding liabilities that Bluewater Manning Services Limited
were subject to at December 30, 2014. At the date of signing these accounts the known potential amount un-
der these guarantees amounted to $nil.
6. Taxation
The Company is individually and severally liable for the corporate income taxes of the fiscal unity.
7. Remuneration of directors
In accordance with Article 2:383 of the Dutch Civil Code, the remuneration of the only
statutory director is not presented.
8. Audit fees
Fees charged by Deloitte Accountants B.V. in relation to the audit of the 2014 and 2013 consolidated financial
statements amount to U.S.$659 thousand and U.S.$697 thousand respectively. Additionally, audit fees were
charged by other foreign Deloitte network auditors in relation to 2014 and 2013 statutory financial statements of
foreign subsidiaries amounting to U.S.$149 thousand and U.S.$155 thousand respectively. Fees for non-audit
services amounted to U.S.$46 thousand in 2014 and nil in 2013.

42
Other information Independent auditor's report
The independent auditor's report is included on the next page.
Statutory rules concerning appropriation of the result
The Articles of Incorporation provide that the result for the year is subject to the disposition to be
decided upon at the annual General Meeting of Shareholders.
Proposed appropriation of the result for the year 2014
Management proposes to add the net loss for the year to the accumulated deficit. This proposal
has been reflected in the accompanying financial statements.
43
Independent auditor’s report
To: the Shareholder and Management Board of Bluewater Holding B.V.
Report on the financial statements
We have audited the accompanying financial statements 2014 of Bluewater Holding B.V., Hoofddorp. The
financial statements include the consolidated financial statements and the company financial statements. The
consolidated financial statements comprise the consolidated statement of financial position as per December
30, 2014, the consolidated statement of profit or loss and other comprehensive income, changes in equity and
cash flows for the year then ended, and notes, comprising a summary of the significant accounting policies and
other explanatory information. The company financial statements comprise the company balance sheet as per
December 30, 2014 the company income statement for the year then ended and the notes, comprising a
summary of the accounting policies and other explanatory information.
Management's responsibility
Management is responsible for the preparation and fair presentation of these financial statements in accordance
with International Financial Reporting Standards as adopted by the European Union and w ith Part 9 of Book 2 of
the Dutch Civil Code, and for the preparation of the Director’s report in accordance with Part 9 of Book 2 of the
Dutch Civil Code. Furthermore management is responsible for such internal control as it determines is
necessary to enable the preparation of the financial statements that are free from material misstatement,
whether due to fraud or error.
Auditor's responsibility
Our responsibility is to express an opinion on these financial statements based on our audit. We conducted our
audit in accordance with Dutch law, including the Dutch Standards on Auditing. This requires that we comply
with ethical requirements and plan and perform the audit to obtain reasonable assurance about whether the
financial statements are free from material misstatement.
An audit involves performing procedures to obtain audit evidence about the amounts and disclosures in the
financial statements. The procedures selected depend on the auditor's judgment, including the assessment of
the risks of material misstatement of the financial statements, whether due to fraud or error.
In making those risk assessments, the auditor considers internal control relevant to the entity's preparation and
fair presentation of the financial statements in order to design audit procedures that are appropriate in the
circumstances, but not for the purpose of expressing an opinion on the effectiveness of the entity's internal
control. An audit also includes evaluating the appropriateness of accounting policies used and the
reasonableness of accounting estimates made by management, as well as evaluating the overall presentation of
the financial statements.
We believe that the audit evidence we have obtained is sufficient and appropriate to provide a basis for our
audit opinion.
Opinion with respect to the consolidated financial statements
In our opinion, the consolidated financial statements give a true and fair view of the financial position of
Bluewater Holding B.V. as per December 30, 2014 and of its result and its cash flows for the year then ended in
accordance w ith International Financial Reporting Standards as adopted by the European Union and with Part 9
of Book 2 of the Dutch Civil Code.
Opinion with respect to the company financial statements
In our opinion, the company financial statements give a true and fair view of the financial position of Bluewater
Holding B.V. as per December 30, 2014 and of its result for the year then ended in accordance with Part 9 of
Book 2 of the Dutch Civil Code.

44
Report on other legal and regulatory requirements
Pursuant to the legal requirement under Section 2:393 sub 5 at e and f of the Dutch Civil Code, we have no
deficiencies to report as a result of our examination whether the Director’s report, to the extent we can assess,
has been prepared in accordance with Part 9 of Book 2 of this Code, and whether the information as required
under Section 2:392 sub 1 at b-h has been annexed. Further we report that the Director’s report, to the extent
we can assess, is consistent with the financial statements as required by Section 2:391 sub 4 of the Dutch Civil
Code.
Amsterdam, March 26, 2015
Deloitte Accountants B.V.
Already signed: B. E. Savert