financial statements analysis
DESCRIPTION
Week 10 lecture notes, Financial Accounting, Wharton School of Business, University of Pennsylvania.TRANSCRIPT

KNOWLEDGE FOR ACTION
Financial Statement Analysis – Roadmap
• What is the company’s business, strategy, and competitive environment?
• Is the company growing?• What was the company’s performance this year?• Is the company investing for the future?• What are its debt obligations?• Are there significant “off balance sheet” items?

KNOWLEDGE FOR ACTION
Analyzing Growth
• Why does growth matter for Vulcan?– Market share in competitive market– Scale economies; covering fixed costs– Investors’ growth expectations affect stock prices
• Measuring growth– Growth is commonly measured using revenue
– Growth = (Current Year - Prior Year) / Prior Year
• Identifying sources of growth– Segment analysis– Unit vs. Sales price growth – Organic vs. Acquisitions

KNOWLEDGE FOR ACTION
Growth in Selected Items
• Vulcan made large acquisitions in 1999 and 2007• Subprime crisis started in 2006
(Source: Supplemental pages 4-5)
2010 2009 2008 2007 2006 2005 2004 2003 2002 2001 2000 1999Net Sales 2,405.9$ 2,543.7$ 3,453.1$ 3,090.1$ 3,041.1$ 2,615.0$ 2,213.2$ 2,086.9$ 1,980.6$ 2,113.6$ 1,885.9$ 1,810.6$
Gross Profit 300.7$ 446.0$ 749.7$ 950.9$ 932.0$ 708.8$ 584.4$ 555.7$ 538.3$ 579.5$ 499.0$ 486.9$ Net Earnings From Continuing Ops (102.4)$ 18.7$ 3.3$ 463.1$ 480.2$ 344.1$ 262.4$ 237.5$ 233.2$ 231.5$ 224.1$ 217.5$
Total Assets 8,337.9$ 8,525.1$ 8,914.1$ 8,936.4$ 3,427.8$ 3,590.4$ 3,667.5$ 3,636.9$ 3,448.2$ 3,413.3$ 3,250.4$ 2,839.5$ Total Liabilities 4,372.9$ 4,487.6$ 5,391.4$ 5,176.8$ 1,416.9$ 1,456.8$ 1,646.7$ 1,834.1$ 1,751.2$ 1,809.0$ 1,778.9$ 1,515.8$ Shareholders' Equity 3,965.0$ 4,037.2$ 3,522.7$ 3,759.6$ 2,010.9$ 2,133.6$ 2,020.8$ 1,802.8$ 1,697.0$ 1,604.3$ 1,471.5$ 1,323.7$
Growth Rates2010 2009 2008 2007 2006 2005 2004 2003 2002 2001 2000 1999
Net Sales -5.4% -26.3% 11.7% 1.6% 16.3% 18.2% 6.1% 5.4% -6.3% 12.1% 4.2% 56.3%Gross Profit -32.6% -40.5% -21.2% 2.0% 31.5% 21.3% 5.2% 3.2% -7.1% 16.1% 2.5% 24.7%Net Earnings From Continuing Ops -647.6% 466.7% -99.3% -3.6% 39.6% 31.1% 10.5% 1.8% 0.7% 3.3% 3.0% 5.1%
Total Assets -2.2% -4.4% -0.2% 160.7% -4.5% -2.1% 0.8% 5.5% 1.0% 5.0% 14.5% 71.2%Total Liabilities -2.6% -16.8% 4.1% 265.4% -2.7% -11.5% -10.2% 4.7% -3.2% 1.7% 17.4% 200.2%Shareholders' Equity -1.8% 14.6% -6.3% 87.0% -5.8% 5.6% 12.1% 6.2% 5.8% 9.0% 11.2% 14.7%
KNOWLEDGE FOR ACTION
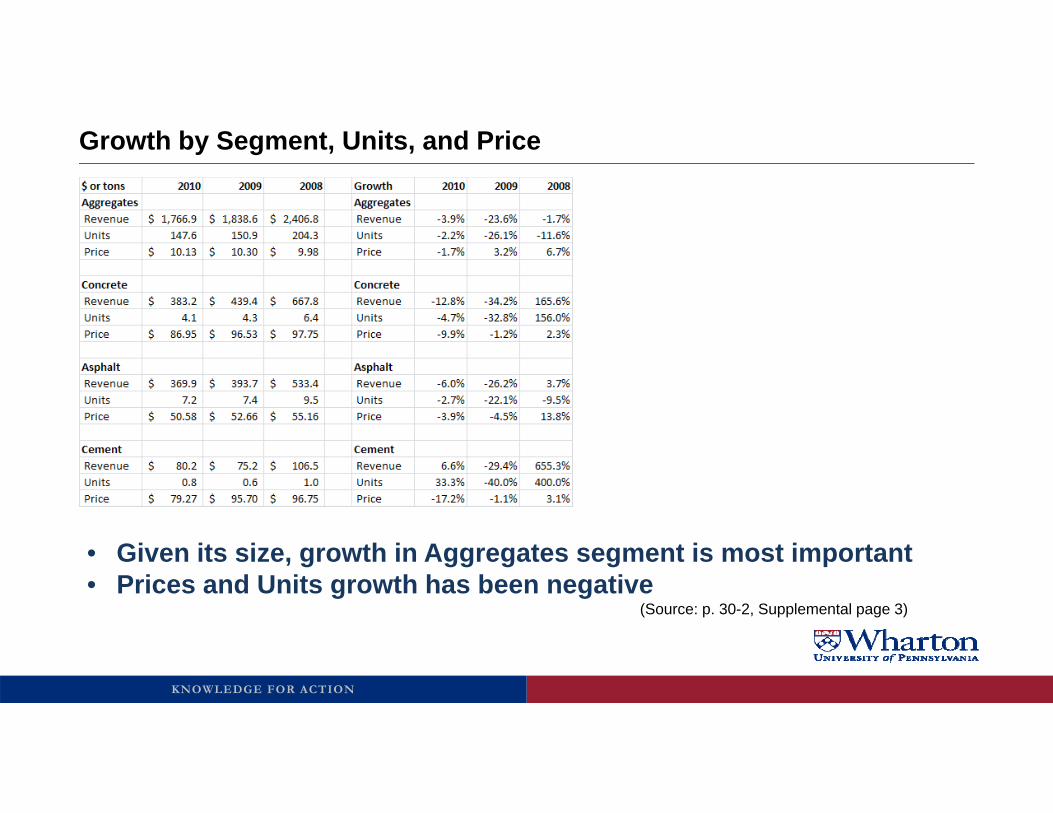
Growth by Segment, Units, and Price
• Given its size, growth in Aggregates segment is most important• Prices and Units growth has been negative
(Source: p. 30-2, Supplemental page 3)
KNOWLEDGE FOR ACTION
Financial Statement Analysis – Roadmap
• What is the company’s business, strategy, and competitive environment?
• Is the company growing?• What was the company’s performance this year?• Is the company investing for the future?• What are its debt obligations?• Are there significant “off balance sheet” items?

KNOWLEDGE FOR ACTION
Analyzing Current Performance
• Earnings– Operating income, Net Income, EBITDA– Line items: Revenue, Margins– One-time items vs. persistent changes
• Cash flow– Operating, Free Cash Flow
• DuPont analysis– Sources of advantages or problems

KNOWLEDGE FOR ACTION
Measures of Earnings
• Operating Earnings– Revenues – expenses from core business
• Earnings – continuing ops– Above – net interest expense +/- gains or losses
from non-core items• Net Earnings
– Above – earnings from discontinued operations• Diluted EPS
– Net Earnings / Shares outstanding (adjusted for potential dilution)
• Non-GAAP earnings (EBITDA)(Source: p. 27-8)

KNOWLEDGE FOR ACTION
Margin Analysis
• Common-size income statement– Divide everything by revenue
• Removes growth to allow time-series comparisons• Reveals your cost structure
– COGS vs. SG&A vs. Other• Useful in forecasting financial statements for future periods
KNOWLEDGE FOR ACTION
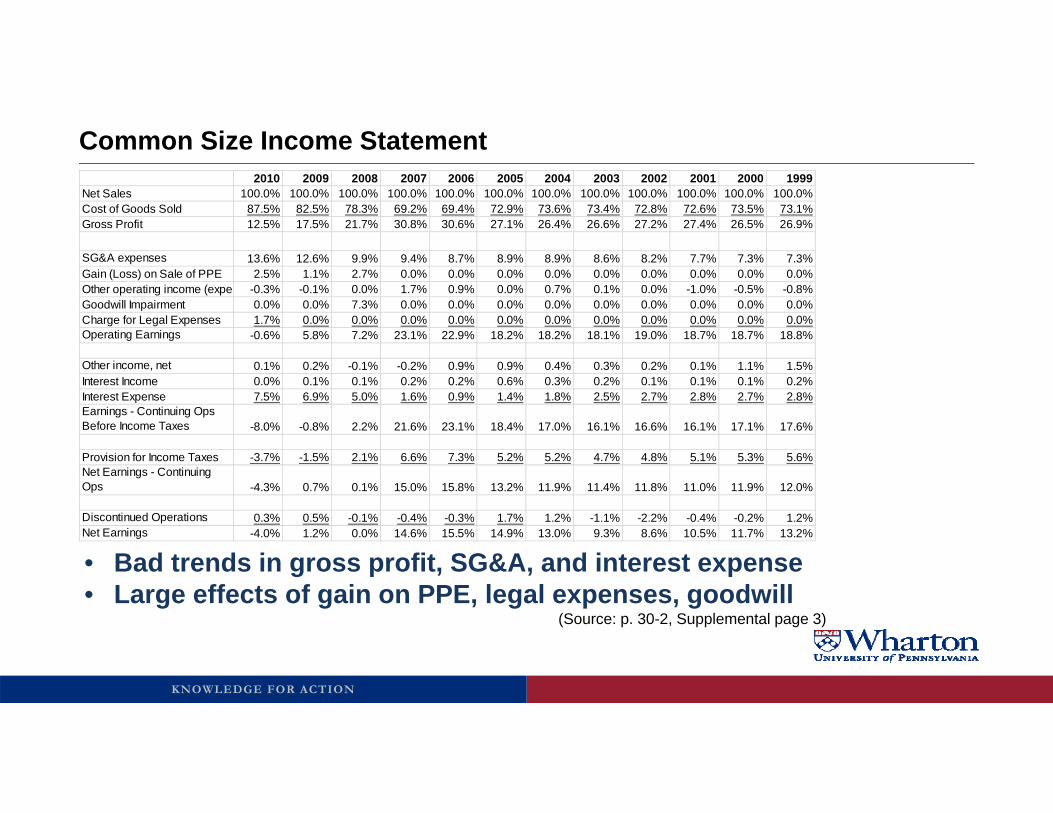
Common Size Income Statement
• Bad trends in gross profit, SG&A, and interest expense• Large effects of gain on PPE, legal expenses, goodwill
(Source: p. 30-2, Supplemental page 3)
2010 2009 2008 2007 2006 2005 2004 2003 2002 2001 2000 1999Net Sales 100.0% 100.0% 100.0% 100.0% 100.0% 100.0% 100.0% 100.0% 100.0% 100.0% 100.0% 100.0%Cost of Goods Sold 87.5% 82.5% 78.3% 69.2% 69.4% 72.9% 73.6% 73.4% 72.8% 72.6% 73.5% 73.1%Gross Profit 12.5% 17.5% 21.7% 30.8% 30.6% 27.1% 26.4% 26.6% 27.2% 27.4% 26.5% 26.9%
SG&A expenses 13.6% 12.6% 9.9% 9.4% 8.7% 8.9% 8.9% 8.6% 8.2% 7.7% 7.3% 7.3%Gain (Loss) on Sale of PPE 2.5% 1.1% 2.7% 0.0% 0.0% 0.0% 0.0% 0.0% 0.0% 0.0% 0.0% 0.0%Other operating income (expe -0.3% -0.1% 0.0% 1.7% 0.9% 0.0% 0.7% 0.1% 0.0% -1.0% -0.5% -0.8%Goodwill Impairment 0.0% 0.0% 7.3% 0.0% 0.0% 0.0% 0.0% 0.0% 0.0% 0.0% 0.0% 0.0%Charge for Legal Expenses 1.7% 0.0% 0.0% 0.0% 0.0% 0.0% 0.0% 0.0% 0.0% 0.0% 0.0% 0.0%Operating Earnings -0.6% 5.8% 7.2% 23.1% 22.9% 18.2% 18.2% 18.1% 19.0% 18.7% 18.7% 18.8%
Other income, net 0.1% 0.2% -0.1% -0.2% 0.9% 0.9% 0.4% 0.3% 0.2% 0.1% 1.1% 1.5%Interest Income 0.0% 0.1% 0.1% 0.2% 0.2% 0.6% 0.3% 0.2% 0.1% 0.1% 0.1% 0.2%Interest Expense 7.5% 6.9% 5.0% 1.6% 0.9% 1.4% 1.8% 2.5% 2.7% 2.8% 2.7% 2.8%Earnings - Continuing Ops Before Income Taxes -8.0% -0.8% 2.2% 21.6% 23.1% 18.4% 17.0% 16.1% 16.6% 16.1% 17.1% 17.6%
Provision for Income Taxes -3.7% -1.5% 2.1% 6.6% 7.3% 5.2% 5.2% 4.7% 4.8% 5.1% 5.3% 5.6%Net Earnings - Continuing Ops -4.3% 0.7% 0.1% 15.0% 15.8% 13.2% 11.9% 11.4% 11.8% 11.0% 11.9% 12.0%
Discontinued Operations 0.3% 0.5% -0.1% -0.4% -0.3% 1.7% 1.2% -1.1% -2.2% -0.4% -0.2% 1.2%Net Earnings -4.0% 1.2% 0.0% 14.6% 15.5% 14.9% 13.0% 9.3% 8.6% 10.5% 11.7% 13.2%

KNOWLEDGE FOR ACTION
Earnings Persistence
• Which items/margins will persist into next year?– See MD&A, p. 28-34
• COGS & SG&A– Adjust for any unusual items this year
• Gain on PPE, Other expense, Impairment– Generally don’t persist
• Interest Expense– Any changes in borrowing/rates?
KNOWLEDGE FOR ACTION
Financial Statement Analysis – Roadmap
• What is the company’s business, strategy, and competitive environment?
• Is the company growing?• What was the company’s performance this year? (continued)• Is the company investing for the future?• What are its debt obligations?• Are there significant “off balance sheet” items?
KNOWLEDGE FOR ACTION
Cash Flow from Operations
• How did Vulcan do in generating cash from operating the business?• What are major differences between earnings and cash flows?
– What are their interpretations? (MD&A, p. 37)– Will these differences persist?

KNOWLEDGE FOR ACTION
Cash From Operations
• Earnings has large noncash and PPE items (backed out of CFO)• A/R and Other assets were big cash drain in 2010
(Source: p. 54)

KNOWLEDGE FOR ACTION
Issues with Interpreting Cash Flows
• Cash flow statement is completely backwards looking– Susceptible to timing issues – No estimates of future activities (unlike earnings)
• Cash from operations has no deduction for costs associated with capital investment– Cash required for fixed assets shows up in cash from investing activities (but
mismatch in timing)– Need to look at Free Cash Flow (p. 27)

KNOWLEDGE FOR ACTION
Earnings vs. Cash Flows
• Earnings– Did the company earn enough revenue to cover all costs of running the
business?• Cash from Operations
– Did the company collect more cash than it paid out during the period?• Both numbers are useful
– Earnings are a better predictor of future cash flows – Cash flows are more objective measure of activity
• Vulcan good at managing cash position this year, but there won’t be any cash to manage in the future unless they become profitable soon

KNOWLEDGE FOR ACTION
DuPont Ratio Analysis Framework
ROE = Net Income/Sales x Sales/Assets x Assets/Equity= Profitability x Efficiency x Leverage
Return on Equity (ROE)
Return on Assets (ROA) Financial Leverage
Return on Sales (ROS) Asset Turnover
X
X

KNOWLEDGE FOR ACTION
DuPont Analysis
• ROE down due to lower ROA from both lower ROS and ATO• Trade cycle up due to DI up, DP down (DR steady)
2010 2009 2008 2007 2006 2005 2004 2003 2002 2001 2000 1999(NI) Net Income (96.3) 30.4 0.9 450.9 470.2 389.1 288.6 195.0 169.9 222.7 219.9 239.7 (I) Interest Expense 181.6 175.3 172.8 48.2 26.3 37.1 40.3 53.2 53.7 59.7 51.8 50.8 (t) Tax Rate 35% 35% 35% 35% 35% 35% 35% 35% 35% 35% 35% 35%(DNI) De-levered Net Income [NI (1-t)*I] 21.7 144.3 113.2 482.2 487.3 413.2 314.8 229.6 204.8 261.5 253.6 272.7 (NS) Net Sales 2,405.9 2,543.7 3,453.1 3,090.1 3,041.1 2,615.0 2,213.2 2,086.9 1,980.6 2,113.6 1,885.9 1,810.6 (ASE) Stockholders' Equity - Avg 4,001.1 3,780.0 3,641.2 2,885.3 2,072.3 2,077.2 1,911.8 1,749.9 1,650.6 1,537.9 1,397.6 1,238.7 (ATA) Total Assets - Avg. 8,431.5 8,719.6 8,925.3 6,182.1 3,509.1 3,629.0 3,652.2 3,542.6 3,430.8 3,331.9 3,045.0 2,249.1
Return on Equity [NI/ASE] -2.4% 0.8% 0.0% 15.6% 22.7% 18.7% 15.1% 11.1% 10.3% 14.5% 15.7% 19.4%
Return on Assets [DNI/ATA] 0.3% 1.7% 1.3% 7.8% 13.9% 11.4% 8.6% 6.5% 6.0% 7.8% 8.3% 12.1%Financial Leverage [ATA/ASE] 2.11 2.31 2.45 2.14 1.69 1.75 1.91 2.02 2.08 2.17 2.18 1.82
Return on Sales [DNI/NS] 0.9% 5.7% 3.3% 15.6% 16.0% 15.8% 14.2% 11.0% 10.3% 12.4% 13.4% 15.1%Asset Turnover [NS/ATA] 0.29 0.29 0.39 0.50 0.87 0.72 0.61 0.59 0.58 0.63 0.62 0.81
Gross Margin 12.5% 17.5% 21.7% 30.8% 30.6% 27.1% 26.4% 26.6% 27.2% 27.4% 26.5% 26.9%SG&A / Sales 13.6% 12.6% 9.9% 9.4% 8.7% 8.9% 8.9% 8.6% 8.2% 7.7% 7.3% 7.3%Operating Margin -0.6% 5.8% 7.2% 23.1% 22.9% 18.2% 18.2% 18.1% 19.0% 18.7% 18.7% 18.8%
Days Receivables 40.3 42.9 38.3 43.5 40.9 42.4 51.8 58.5 61.0 63.7 70.7 57.3Days Inventory 55.9 60.0 48.6 51.2 38.2 35.9 44.4 54.7 59.2 50.8 49.7 44.4Days Payable 19.3 22.9 24.8 33.7 26.2 23.0 24.5 29.6 35.2 40.6 42.4 34.5Trade Cycle 76.9 80.0 62.1 61.0 52.8 55.3 71.7 83.6 85.1 73.9 78.0 67.2
KNOWLEDGE FOR ACTION
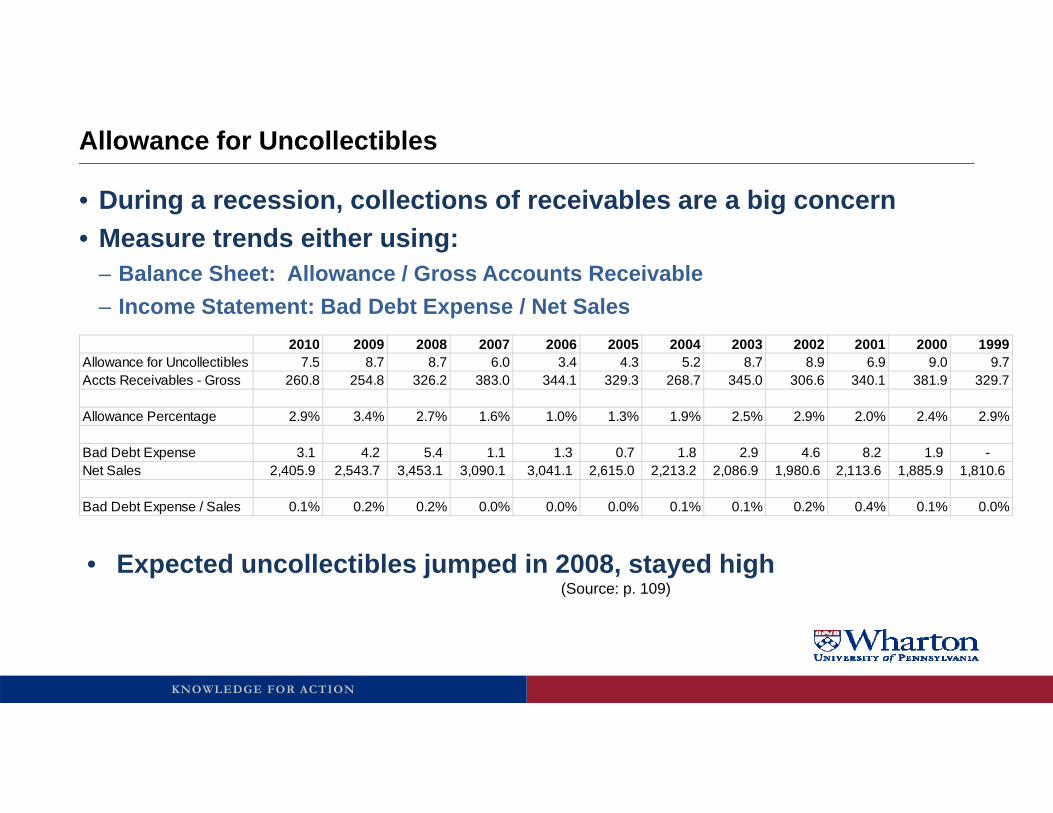
Allowance for Uncollectibles
• During a recession, collections of receivables are a big concern• Measure trends either using:
– Balance Sheet: Allowance / Gross Accounts Receivable– Income Statement: Bad Debt Expense / Net Sales
• Expected uncollectibles jumped in 2008, stayed high (Source: p. 109)
2010 2009 2008 2007 2006 2005 2004 2003 2002 2001 2000 1999Allowance for Uncollectibles 7.5 8.7 8.7 6.0 3.4 4.3 5.2 8.7 8.9 6.9 9.0 9.7Accts Receivables - Gross 260.8 254.8 326.2 383.0 344.1 329.3 268.7 345.0 306.6 340.1 381.9 329.7
Allowance Percentage 2.9% 3.4% 2.7% 1.6% 1.0% 1.3% 1.9% 2.5% 2.9% 2.0% 2.4% 2.9%
Bad Debt Expense 3.1 4.2 5.4 1.1 1.3 0.7 1.8 2.9 4.6 8.2 1.9 - Net Sales 2,405.9 2,543.7 3,453.1 3,090.1 3,041.1 2,615.0 2,213.2 2,086.9 1,980.6 2,113.6 1,885.9 1,810.6
Bad Debt Expense / Sales 0.1% 0.2% 0.2% 0.0% 0.0% 0.0% 0.1% 0.1% 0.2% 0.4% 0.1% 0.0%

KNOWLEDGE FOR ACTION
Financial Statement Analysis – Roadmap
• What is the company’s business, strategy, and competitive environment?
• Is the company growing?• What was the company’s performance this year?• Is the company investing for the future?• What are its debt obligations?• Are there significant “off balance sheet” items?

KNOWLEDGE FOR ACTION
Analyzing Investment
• Common Size Balance Sheet– Express all numbers as a percent of Total Assets– Removes effect of growth in the balance sheet
• What is the mix of working capital and long-term assets?– What are the trends in investment?
• Cash flows from Investing Activities– Trend in recent investment
• Are there large intangible assets that are not on the balance sheet?
KNOWLEDGE FOR ACTION
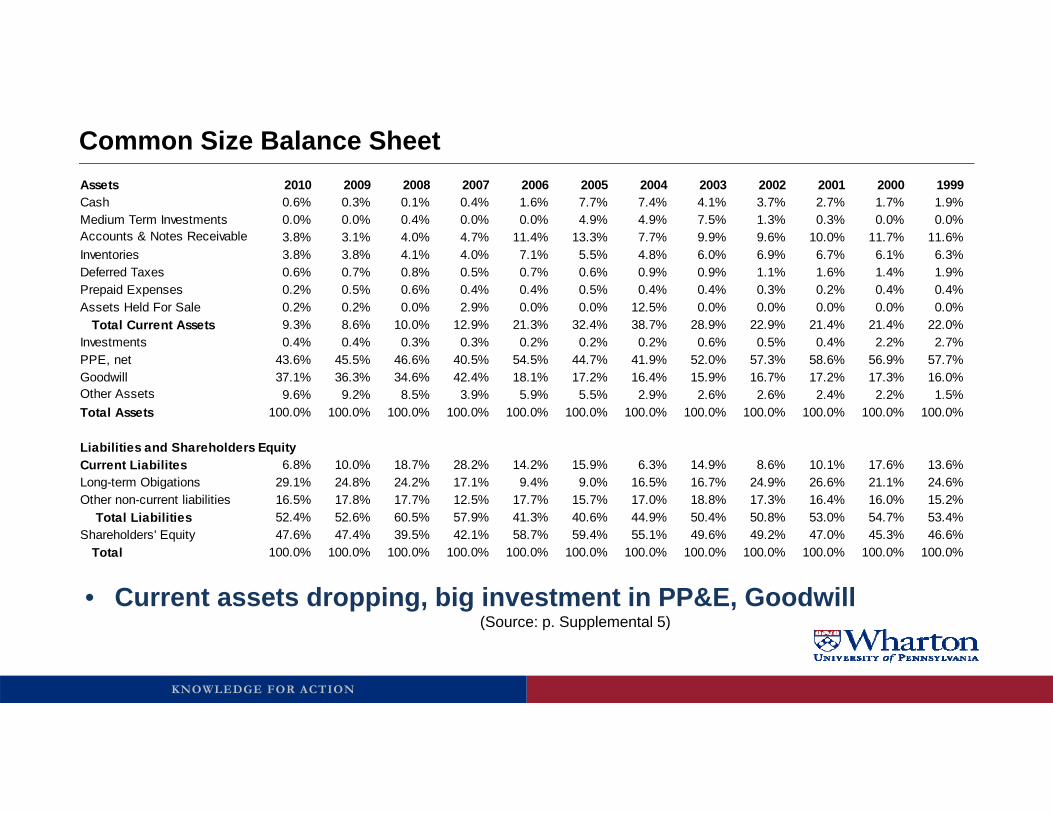
Common Size Balance Sheet
• Current assets dropping, big investment in PP&E, Goodwill(Source: p. Supplemental 5)
Assets 2010 2009 2008 2007 2006 2005 2004 2003 2002 2001 2000 1999Cash 0.6% 0.3% 0.1% 0.4% 1.6% 7.7% 7.4% 4.1% 3.7% 2.7% 1.7% 1.9%Medium Term Investments 0.0% 0.0% 0.4% 0.0% 0.0% 4.9% 4.9% 7.5% 1.3% 0.3% 0.0% 0.0%Accounts & Notes Receivable 3.8% 3.1% 4.0% 4.7% 11.4% 13.3% 7.7% 9.9% 9.6% 10.0% 11.7% 11.6%Inventories 3.8% 3.8% 4.1% 4.0% 7.1% 5.5% 4.8% 6.0% 6.9% 6.7% 6.1% 6.3%Deferred Taxes 0.6% 0.7% 0.8% 0.5% 0.7% 0.6% 0.9% 0.9% 1.1% 1.6% 1.4% 1.9%Prepaid Expenses 0.2% 0.5% 0.6% 0.4% 0.4% 0.5% 0.4% 0.4% 0.3% 0.2% 0.4% 0.4%Assets Held For Sale 0.2% 0.2% 0.0% 2.9% 0.0% 0.0% 12.5% 0.0% 0.0% 0.0% 0.0% 0.0% Total Current Assets 9.3% 8.6% 10.0% 12.9% 21.3% 32.4% 38.7% 28.9% 22.9% 21.4% 21.4% 22.0%Investments 0.4% 0.4% 0.3% 0.3% 0.2% 0.2% 0.2% 0.6% 0.5% 0.4% 2.2% 2.7%PPE, net 43.6% 45.5% 46.6% 40.5% 54.5% 44.7% 41.9% 52.0% 57.3% 58.6% 56.9% 57.7%Goodwill 37.1% 36.3% 34.6% 42.4% 18.1% 17.2% 16.4% 15.9% 16.7% 17.2% 17.3% 16.0%Other Assets 9.6% 9.2% 8.5% 3.9% 5.9% 5.5% 2.9% 2.6% 2.6% 2.4% 2.2% 1.5%Total Assets 100.0% 100.0% 100.0% 100.0% 100.0% 100.0% 100.0% 100.0% 100.0% 100.0% 100.0% 100.0%
Liabilities and Shareholders EquityCurrent Liabilites 6.8% 10.0% 18.7% 28.2% 14.2% 15.9% 6.3% 14.9% 8.6% 10.1% 17.6% 13.6%Long-term Obigations 29.1% 24.8% 24.2% 17.1% 9.4% 9.0% 16.5% 16.7% 24.9% 26.6% 21.1% 24.6%Other non-current liabilities 16.5% 17.8% 17.7% 12.5% 17.7% 15.7% 17.0% 18.8% 17.3% 16.4% 16.0% 15.2% Total Liabilities 52.4% 52.6% 60.5% 57.9% 41.3% 40.6% 44.9% 50.4% 50.8% 53.0% 54.7% 53.4%Shareholders' Equity 47.6% 47.4% 39.5% 42.1% 58.7% 59.4% 55.1% 49.6% 49.2% 47.0% 45.3% 46.6% Total 100.0% 100.0% 100.0% 100.0% 100.0% 100.0% 100.0% 100.0% 100.0% 100.0% 100.0% 100.0%

KNOWLEDGE FOR ACTION
Cash flow from Investing Activities
• Capital expenditures (Purchases of PPE) dropping– Much less than Depreciation of 382,093
• Acquisitions stable (big ones in 1999 and 2007)• Research and Development
– About $1.5 million / year (p. 12)(Source: p. 54)

KNOWLEDGE FOR ACTION
Financial Statement Analysis – Roadmap
• What is the company’s business, strategy, and competitive environment?
• Is the company growing?• What was the company’s performance this year?• Is the company investing for the future?• What are its debt obligations?• Are there significant “off balance sheet” items?
KNOWLEDGE FOR ACTION
Analyzing Debt
• Cash flow from Financing Activities– Trend in issuances and repayments
• Debt Ratios– Short-term liquidity– Long-term leverage
• Future debt servicing requirements– Debt ratings– Upcoming principal and interest payments– Interest coverage ratios

KNOWLEDGE FOR ACTION
Cash from Financing Activities
• What is Vulcan doing with excess free cash flow?– Big dividends!– New debt issued to replace old debt
KNOWLEDGE FOR ACTION
Short Term Liquidity Ratios
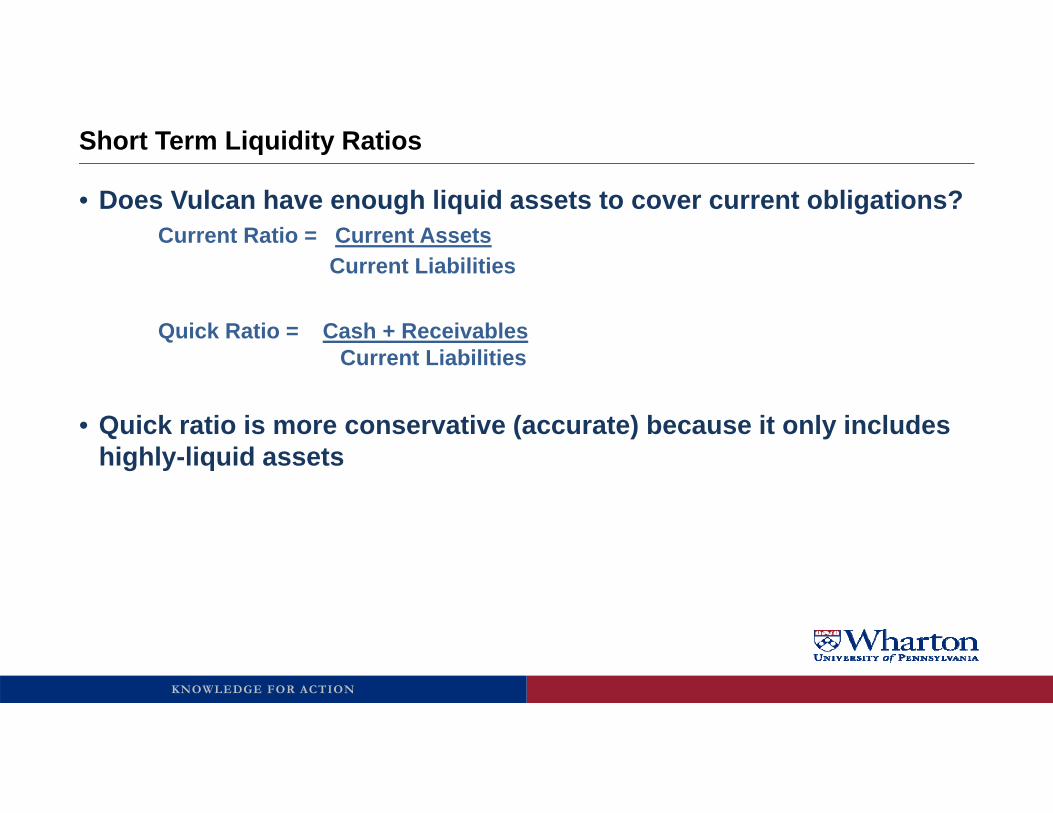
• Does Vulcan have enough liquid assets to cover current obligations?Current Ratio = Current Assets
Current Liabilities
Quick Ratio = Cash + ReceivablesCurrent Liabilities
• Quick ratio is more conservative (accurate) because it only includes highly-liquid assets
KNOWLEDGE FOR ACTION
Long Term Debt Ratios
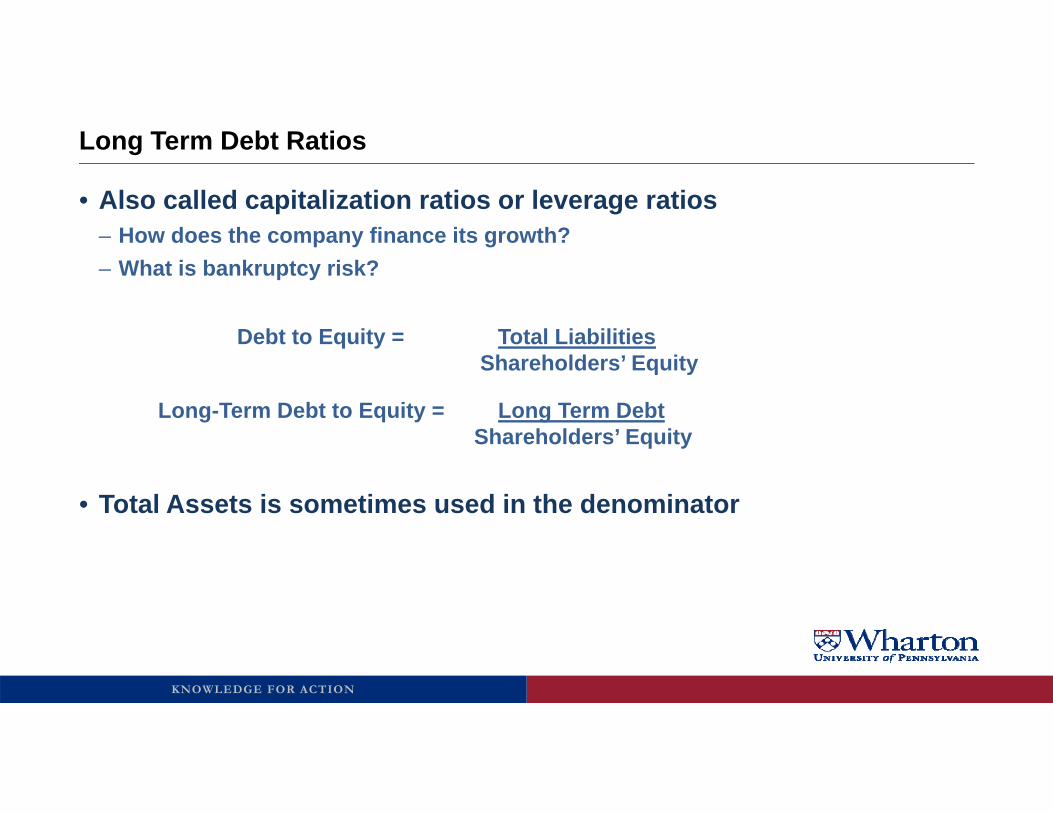
• Also called capitalization ratios or leverage ratios– How does the company finance its growth?– What is bankruptcy risk?
Debt to Equity = Total LiabilitiesShareholders’ Equity
Long-Term Debt to Equity = Long Term DebtShareholders’ Equity
• Total Assets is sometimes used in the denominator

KNOWLEDGE FOR ACTION
Vulcan Liquidity and Leverage
• Short-term liquidity has been improving– Vulcan has been replacing ST debt with LT debt
• Vulcan made large acquisitions in 1999 and 2007– Long-term debt up substantially in 2007
2010 2009 2008 2007 2006 2005 2004 2003 2002 2001 2000 1999Short Term Liquidity MeasuresCash + Receivables 365.9 294.5 403.9 456.8 446.7 926.6 732.3 781.7 502.8 440.9 437.2 382.5Total Current Assets 772.1 733 893.8 1157.2 731.2 1164.6 1418 1050.2 789.6 730 694.5 624.7Current Liabilites 565.7 856.7 1663.1 2521.9 487.5 570.7 231.3 543 297.7 344.5 572.2 386.6
Quick Ratio 0.65 0.34 0.24 0.18 0.92 1.62 3.17 1.44 1.69 1.28 0.76 0.99Current Ratio 1.36 0.86 0.54 0.46 1.50 2.04 6.13 1.93 2.65 2.12 1.21 1.62
Leverage MeasuresLong-Term Debt 2,428 2,116 2,154 1,530 322 323 605 608 858 906 685 699 Total Liabilities 4,373 4,488 5,391 5,177 1,417 1,457 1,647 1,834 1,751 1,809 1,779 1,516 Shareholders' Equity 3,965 4,037 3,523 3,760 2,011 2,134 2,021 1,803 1,697 1,604 1,472 1,324 Total Assets 8,338 8,525 8,914 8,936 3,428 3,590 3,668 3,637 3,448 3,413 3,250 2,840
Long-Term Debt / Equity 0.61 0.52 0.61 0.41 0.16 0.15 0.30 0.34 0.51 0.56 0.47 0.53Liabilities / Equity 1.10 1.11 1.53 1.38 0.70 0.68 0.81 1.02 1.03 1.13 1.21 1.15
Long-Term Debt / Assets 0.29 0.25 0.24 0.17 0.09 0.09 0.16 0.17 0.25 0.27 0.21 0.25Liabilities / Assets 0.52 0.53 0.60 0.58 0.41 0.41 0.45 0.50 0.51 0.53 0.55 0.53
KNOWLEDGE FOR ACTION
Other Debt Information
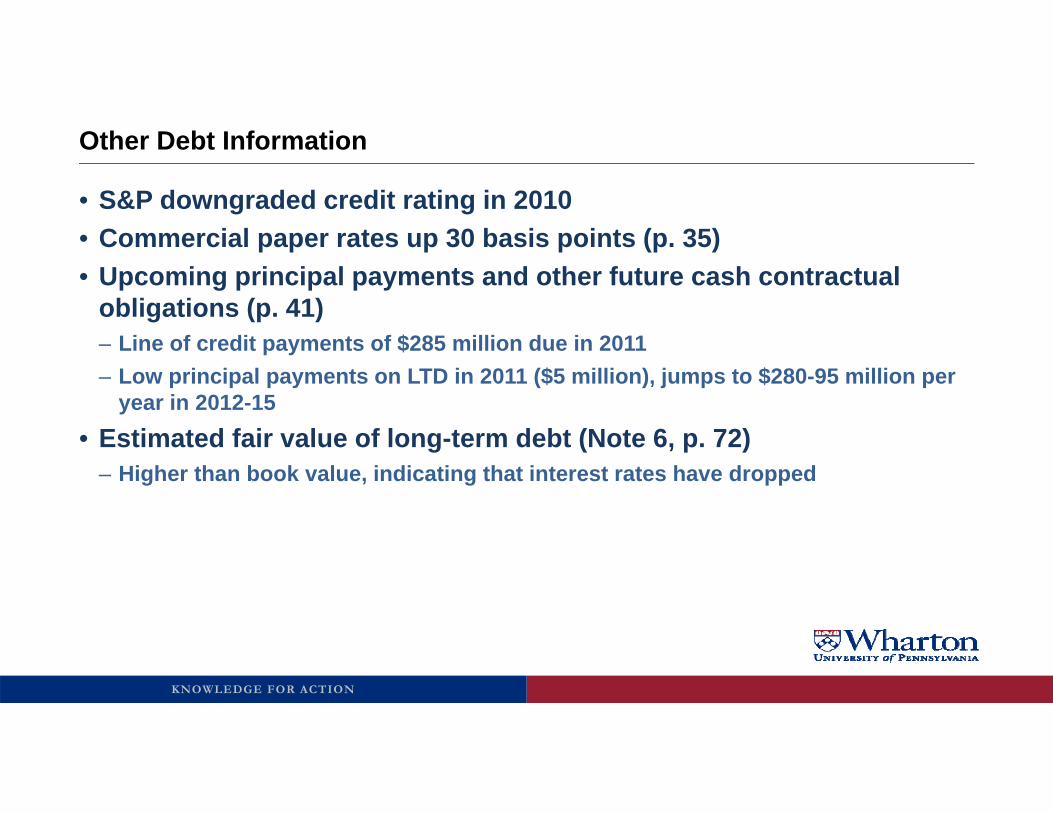
• S&P downgraded credit rating in 2010• Commercial paper rates up 30 basis points (p. 35)• Upcoming principal payments and other future cash contractual
obligations (p. 41)– Line of credit payments of $285 million due in 2011– Low principal payments on LTD in 2011 ($5 million), jumps to $280-95 million per
year in 2012-15 • Estimated fair value of long-term debt (Note 6, p. 72)
– Higher than book value, indicating that interest rates have dropped

KNOWLEDGE FOR ACTION
Interest Coverage
• Interest Coverage Ratio Interest Coverage = Operating Earnings
Interest Expense
• Could also calculate this as:– Operating Cash Flow over Interest Payments
2010 2009 2008 2007 2006 2005 2004 2003 2002 2001 2000 1999Operating Earnings -14.5 148.5 249 714.4 695.1 476.8 403.6 378.3 375.6 395.6 352.2 340Interest Expense 181.6 175.3 172.8 48.2 26.3 37.1 40.3 53.2 53.7 59.7 51.8 50.8
Interest Coverage Ratio N/A 0.8 1.4 14.8 26.4 12.9 10.0 7.1 7.0 6.6 6.8 6.7
KNOWLEDGE FOR ACTION
Financial Statement Analysis – Roadmap
• What is the company’s business, strategy, and competitive environment?
• Is the company growing?• What was the company’s performance this year?• Is the company investing for the future?• What are its debt obligations?• Are there significant “off balance sheet” items?

KNOWLEDGE FOR ACTION
Off-Balance Sheet Items
• Operating Leases (Note 7, p. 74)• Pension Plans (Note 10, p. 79-87)• Contingent Liabilities (Note 12, p. 90-3)
– Commitments– Lawsuits– Guarantees
• Variable Interest Entities (p. 40)– No “off balance sheet arrangements”
KNOWLEDGE FOR ACTION
Conclusions
• Vulcan’s business is largely driven by large construction projects– Need recovery of public and private sector spending
• Acquisition of Florida Rock in 2007 greatly increased the scale of the company, but Vulcan hasn’t grown into the new scale yet– Need more aggregates shipments to cover fixed costs
• Managing short-term cash position well despite recession• Looming issue with debt principal payments
– Big dividend is a drain on cash flow, keeping borrowing high