financial statements and board of directors’ report 1.5.-31.12 · board of directors’ report 1...
TRANSCRIPT

Financial Statements and
Board of Directors’ Report
1.5.-31.12.2019
1
VAPO GROUP 1 MAY–31 DECEMBER 2019 INTERIM REPORT AND FULL-YEAR FINANCIAL STATEMENTS September–December 2019
− Group turnover in September–December 2019 was EUR 163.6 million (EUR 134.1 million in September–December 2018)
− The operating margin (EBITDA) was EUR 18.6 million (EUR 24.9 million), or 11.4% (18.5%) of turnover
− The operating result (EBIT) was EUR -35.1 million (EUR 14.7 million), or -21.5% (11%) of turnover, including EUR -41 million (EUR 0.2 million) in non-recurring items related mainly to write-downs
− Earnings per share were EUR -1,074 (EUR 424)
− Free cash flow before taxes was EUR 10.4 million (EUR -9.9 million).
− Investments amounted to EUR 31.5 million (EUR 15.1 million).
− The comparison figures for the previous year are significantly affected by the acquisition of the Dutch company BVB Substrates effective from the beginning of 2019.
The financial year was exceptionally only 8 months long (the comparison figures are for the corresponding 8-month period in the previous financial year) May–December 2019
− Group turnover in May–December 2019 was EUR 297.7 million (EUR 224.9 million in May–December 2018)
− The operating margin (EBITDA) was EUR 37.0 million (EUR 32.1 million), or 12.4% (14.3%) of turnover
− The operating result (EBIT) was EUR -40.4 million (EUR 4.1 million), or -13.6% (1.8%) of turnover, including EUR -36.7 million (EUR 1.5 million) in non-recurring items related mainly to write-downs
− Earnings per share were EUR -1,320 (EUR 138)
− The pre-tax return on invested capital (pre-tax ROIC) was -1.7% (5.1%)
− Free cash flow before taxes was EUR 21 million (EUR -12.4 million).
− Investments amounted to EUR 42.8 million (EUR 27.5 million).
− The equity ratio on 31 December 2019 was 42.9% (49.5%)
− Interest-bearing net debt on 31 December 2019 was EUR 315.2 million (EUR 260.9 million)
− The ratio of interest-bearing net debt to operating margin (net debt/EBITDA) on 31 December 2019 was 4.0 (3.8)
2
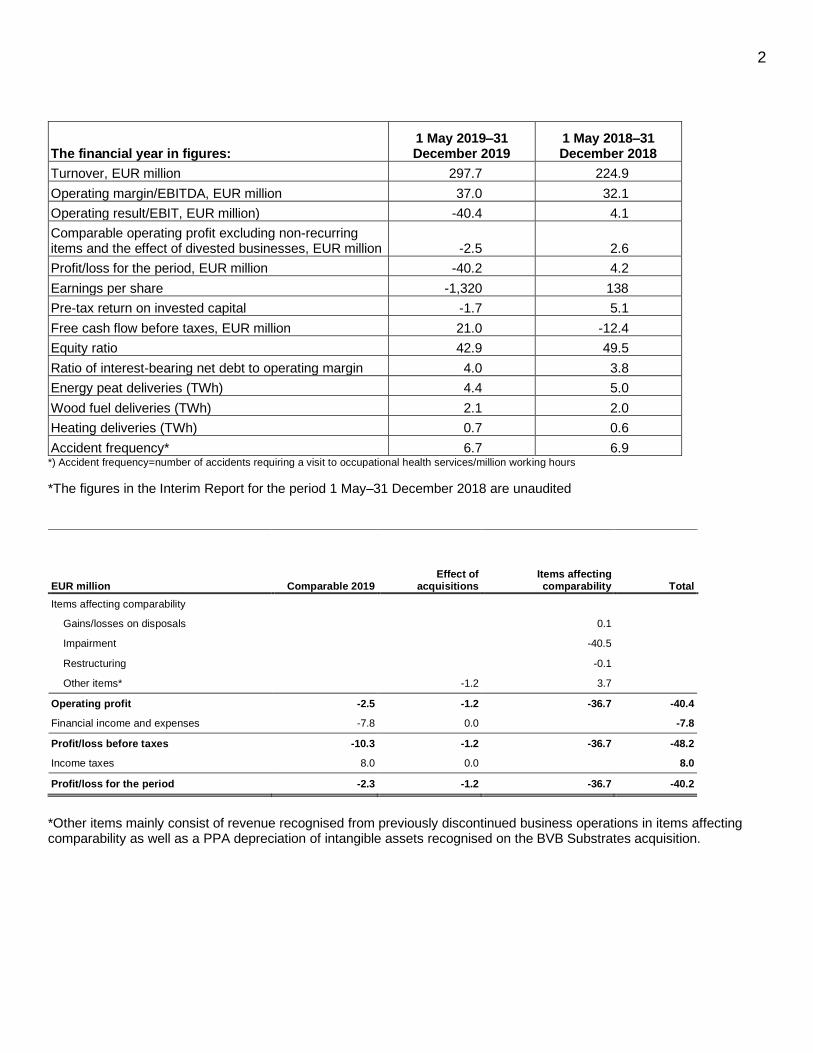
The financial year in figures: 1 May 2019–31 December 2019
1 May 2018–31 December 2018
Turnover, EUR million 297.7 224.9
Operating margin/EBITDA, EUR million 37.0 32.1
Operating result/EBIT, EUR million) -40.4 4.1
Comparable operating profit excluding non-recurring items and the effect of divested businesses, EUR million -2.5 2.6
Profit/loss for the period, EUR million -40.2 4.2
Earnings per share -1,320 138
Pre-tax return on invested capital -1.7 5.1
Free cash flow before taxes, EUR million 21.0 -12.4
Equity ratio 42.9 49.5
Ratio of interest-bearing net debt to operating margin 4.0 3.8
Energy peat deliveries (TWh) 4.4 5.0
Wood fuel deliveries (TWh) 2.1 2.0
Heating deliveries (TWh) 0.7 0.6
Accident frequency* 6.7 6.9 *) Accident frequency=number of accidents requiring a visit to occupational health services/million working hours
*The figures in the Interim Report for the period 1 May–31 December 2018 are unaudited
EUR million Comparable 2019 Effect of
acquisitions Items affecting comparability Total
Items affecting comparability
Gains/losses on disposals 0.1
Impairment -40.5
Restructuring -0.1
Other items* -1.2 3.7
Operating profit -2.5 -1.2 -36.7 -40.4
Financial income and expenses -7.8 0.0 -7.8
Profit/loss before taxes -10.3 -1.2 -36.7 -48.2
Income taxes 8.0 0.0 8.0
Profit/loss for the period -2.3 -1.2 -36.7 -40.2
*Other items mainly consist of revenue recognised from previously discontinued business operations in items affecting comparability as well as a PPA depreciation of intangible assets recognised on the BVB Substrates acquisition.

3
VAPO IN BRIEF
Vapo is an international conglomerate whose businesses promote clean, local and water-conserving food production, supply local fuels and provide heating and steam production solutions. Vapo Group also develops new products for the purification of contaminated environments and creates well-being by providing jobs, recycling and by creating comfortable living environments. Vapo is a leading bioenergy company in Finland, Sweden and Estonia. The product and service selection developed for Vapo’s energy customers consists of local fuels, such as peat, pellets and forest fuels as well as added value services related to energy production. The company also owns seven combined heat and power (CHP) plants and approximately 150 heating plants producing local energy. Vapo is an important part of the local energy infrastructure in all of its markets. Vapo Group also includes the growing media group Kekkilä-BVB, which is the European market leader in growing media products. The company produces garden soils, mulches and fertilisers for professional growers, consumers and landscapers in Finland under the Kekkilä brand, in Sweden under the Hasselfors Garden brand and in the Netherlands under the BVB Substrates brand. Vapo Group’s New Businesses division develops new business solutions based on the strengths of the Group companies. The Group’s latest higher added value business is Active Carbons, which aims to make a quick entry into the growing international market for peat-based technical carbons. The new higher added value businesses currently in development by the Group also include Vapo Refinery, which focuses on separating other useful minerals from peat before its use in agricultural peat and activated carbon products. Vapo Group had an average of 1,050 employees during the financial year. At the end of the financial year, Vapo Group had 1,009 employees. The company also employs hundreds of local contractors in the fuel production and supply chain. As part of the acquisition of the Dutch company BVB Substrates, the Group welcomed 310 new employees at the beginning of the calendar year 2019. More information about the company: www.vapo.com. Vesa Tempakka
A strategically positive but financially challenging year
Vapo is in the midst of the biggest and fastest change in its entire history. During the past eight-month
financial year, the company began implementing three very significant changes. In October 2018,
Vapo Oy subsidiary Kekkilä Oy and the Netherlands-based BVB Substrates B.V. announced a
transaction that led to the formation of Europe’s leading growing media company Kekkilä-BVB Oy.
Tens of integration projects were carried out during the year and the company is now ready to seek
growth in the expanding global growing media market. The harmonisation of the companies’
operations took up a lot of resources from the operational management and the organisation as a
whole, which is why the financial targets set for Kekkilä-BVB were not fully achieved in its first
financial year after the merger. Nevertheless, the integration process itself has gone even better than
expected. Kekkilä-BVB’s goal for the new financial year is profitable growth.

4
Energy peat now represents less than a quarter of the Group’s total turnover, while the volumes of
the wood and pellet business are growing and Kekkilä-BVB accounts for approximately half of the
Group’s turnover. Kekkilä-BVB’s business is less cyclical than the energy peat business. Under these
circumstances, it makes sense to change the Group’s financial year to be the calendar year. Due to
this transition, the recently concluded financial year exceptionally covers only the period from 1 May
2019 to 31 December 2019.
For several years now, Vapo has engaged in research and product development to produce activated
carbon from peat. Vapo made a decision regarding this second project of high strategic significance
in December 2018. The Group decided to build the first activated carbon production facility in
Ilomantsi. The facility will be modern and very eco-friendly. Construction of the production facility
began with earth-moving operations in June, the foundation stone was laid in October and the aim is
to have the facility ready for the start of production in autumn 2020, with full capacity to be reached at
the beginning of 2021.
This investment also supports Vapo’s strategy of reducing its dependence on energy peat. The
project to build the production facility in Ilomantsi will tie up approximately EUR 20 million in
investments during the current financial year without contributing to any increase in sales.
In our communications regarding the Ilomantsi production facility, we have earlier referred to it as our
first such facility. However it may well be the first of many. Once the plant meets our quality
expectations and barring any significant changes in the market, we are prepared to start planning the
expansion of the Ilomantsi production facility immediately as well as begin preparations for at least
one new production facility either elsewhere in Finland or in Estonia or Sweden.
The third significant strategic renewal measure we took during the financial year was to bring our
energy infrastructure under the newly established company Nevel in Finland, Sweden and Estonia.
Our goal in this business area is to achieve growth in the Finnish market as well as Sweden, in
particular. Nevel generates its turnover of approximately EUR 100 million by operating some 150
boiler plants of various sizes as well as district heating networks. Nevel’s growth strategy is based on
taking advantage of the digital transformation and modern technology, scalable international
operations based on the company’s special expertise and a cost-effective operating model.
We are committed to ensuring the reliable availability of fuel for our energy peat customers far into
the future and, at the same time, we seek growth in wood-based fuels.
A year ago, we estimated that the demand for energy peat would be halved over a time horizon of
about ten years. We are now prepared for demand to be reduced by half in just five years. In light of
this assessment, we decided in December 2019 to discontinue energy peat production at about 90
production sites. This also meant a write-down of approximately EUR 28 million on our peat assets.
While the write-down meant that our result showed a loss for the financial year, it did not significantly
endanger our solvency or influence our future investment plans.
Overall, the year was financially satisfactory. Our businesses did not quite reach the overall targets
set for them, but efficiency improvement measures taken in the Group’s shared functions improved
the comparable operating margin already in the abbreviated financial year.
5
The current situation is nevertheless challenging, as the new year has been exceptionally warm,
which has reduced the sales of energy and fuels during the season that is usually the coldest period
of the year.
Board of Directors’ report 1 May–31 December 2019
Operating environment
The carbon dioxide emissions from the energy use of fuels declined compared to the previous year. The consumption of all fuels used in heating and electricity production declined from the previous year. The decline in CO2 emissions from the energy use of fuels was mainly attributable to the lower consumption of peat and coal. The decline was the sharpest for energy peat at 20 per cent. After increasing in the previous year, the consumption of energy peat began to decrease again and fell to the level seen in 2017. The use of energy peat was reduced by tax decisions as well as the increased price of emission rights, which have led to higher operating costs for energy peat at heat and power plants. The share of renewables in energy production continues to grow and is now approaching 50 per cent of the end consumption of energy. Challenges related to the sourcing of solid wood fuels are limiting growth. At the same time, the use of fossil fuels and energy peat is declining, and the CO2 emissions of energy production are decreasing as a result. The Finnish government has set a goal of making Finland carbon neutral by 2035. The target stated in Finland’s national energy and climate strategy is to increase the share of renewable and emission-free energy to more than 50 per cent by 2030. Another key target is to increase the rate of self-sufficiency in energy to 55 per cent. The use of coal will be phased out by 2029 and the use of energy peat will be halved by 2030. According to the current forecasts, the use of peat primarily as an energy source will be discontinued during the 2030s as the cost of emission allowances increases, although it will remain in use to ensure the security of supply. The overhaul of energy taxation will include an assessment of the necessary changes to the taxation of energy peat to enable the achievement of the energy peat target set for 2030. It is important to ensure that timber material does not end up incinerated. The government will establish a broad-based peat industry working group to explore ways to direct the use of peat away from incineration and increase its use in innovative, high added-value products. The working group will present means to ensure that the change occurs in a way that is fair at the regional and social levels and that does not jeopardise the security of electricity and heat in Finland. The annual growth of the European growing media industry is currently in the range of 2–3 per cent. The successful peat production summers in 2018 and 2019 have ensured the good availability of peat and kept market prices stable. Especially in Europe, the signs suggest that there is a need for more renewable and recyclable raw materials alongside peat. Moss has been well received by the markets and the growth in the use of wood fibres and coconut fibres is currently faster than the market’s overall growth. The demand for

6
raw materials that are complementary to peat is particularly influenced by the retail trade, which creates pressure on farmers to use more renewable growing media. While it has been scientifically proven that using peat in farming provides the best crop yields and strengthens plants against diseases, the market needs for other alternatives cannot be ignored. Outside Europe, cultivation is moving from open fields to growing media, and peat enjoys continuously growing demand in China, for example. The market growth outside Europe is substantially faster than in Europe. To ensure a favourable operating environment, it is essential to provide transparent information on the environmental impacts of the use of peat and for the industry to actively produce and share objective information and emphasise peat’s significance in greenhouse farming and global food production. The active promotion of recycling solutions and responsible peat production methods as well as the restoration of peat production areas play a very important role in the general acceptability of the use of peat.
Vapo Group’s financial result
Turnover grew by 32% year-on-year to EUR 297.7 million (EUR 224.9 million). The increase in turnover was mainly due to the acquisition of BVB Substrates into the Grow&Care business effective from the beginning of 2019.
The Group’s operating result was EUR -40.4 million. The comparable operating result declined to EUR -2.6 million. The previous financial year’s comparable operating result excluding non-recurring items was EUR 2.6 million. The weaker comparable result was mainly attributable to the warm weather conditions in the early part of the winter, which reduced heating and fuel deliveries, and Kekkilä-BVB’s peak sales season falling in the previous financial year in spring 2019.
The Group’s result for the financial year 1 May–31 December 2019 declined substantially year-on-year and amounted to EUR -40.2 million (EUR 4.2 million). The result for the financial year was weighed down by significant non-recurring items consisting mainly of write-downs related to the energy peat business (approx. EUR 30 million) and energy infrastructure (approx. EUR 10 million). The primary reasons for the write-downs were the declining demand for energy peat, the anticipated future decrease in energy peat production volumes, related decisions to discontinue production activities at certain sites ahead of schedule and the expiration of an individual energy delivery agreement.
The measures taken to increase the efficiency of working capital were reflected in a substantial improvement in operating cash flow (free cash flow before financial items and taxes), which amounted to EUR 21.0 million (EUR -12.4 million) for the financial year.
The Group’s key financial figures weakened during the financial year due to write-downs recognised on significant energy peat assets and other assets primarily related to the energy segment as well as

7
lease liabilities arising from the adoption of IFRS 16. The Group’s equity ratio stood at 42.9 per cent (49.5%) at the end of the financial year, while the ratio of net debt to operating margin was 4.0 (3.8).
The comparison figures from the interim report for 5–12/2018 have not been audited.
8
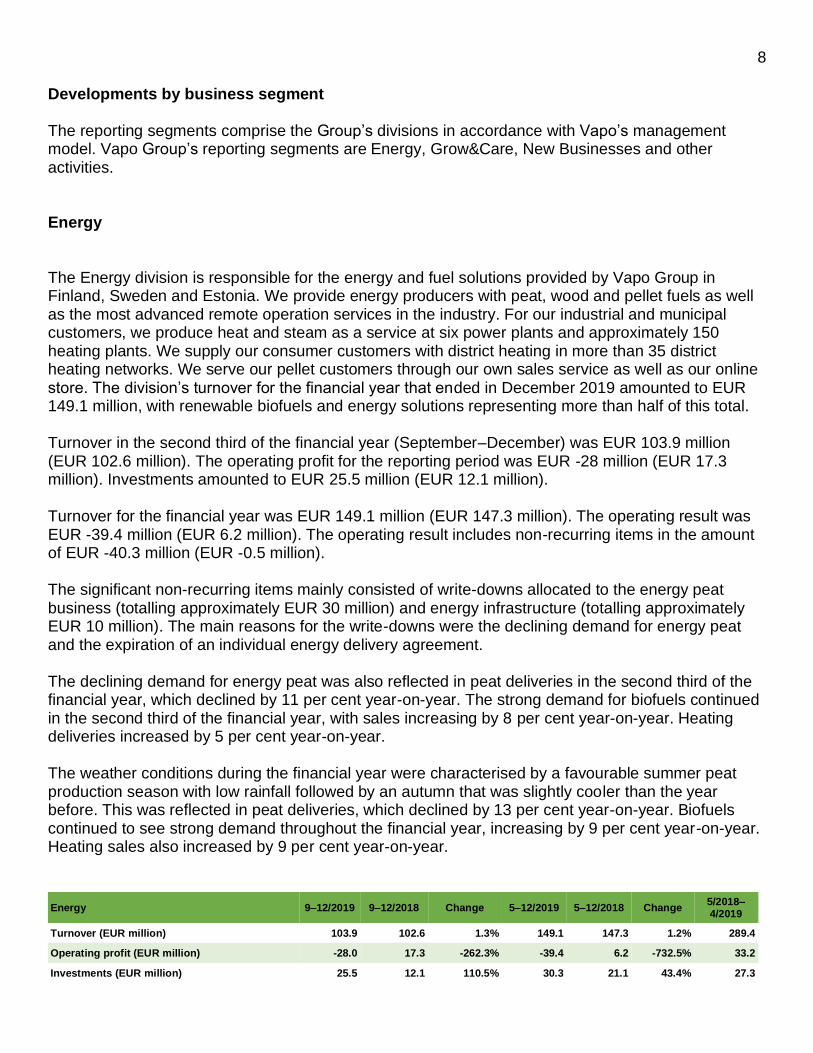
Developments by business segment The reporting segments comprise the Group’s divisions in accordance with Vapo’s management model. Vapo Group’s reporting segments are Energy, Grow&Care, New Businesses and other activities. Energy The Energy division is responsible for the energy and fuel solutions provided by Vapo Group in Finland, Sweden and Estonia. We provide energy producers with peat, wood and pellet fuels as well as the most advanced remote operation services in the industry. For our industrial and municipal customers, we produce heat and steam as a service at six power plants and approximately 150 heating plants. We supply our consumer customers with district heating in more than 35 district heating networks. We serve our pellet customers through our own sales service as well as our online store. The division’s turnover for the financial year that ended in December 2019 amounted to EUR 149.1 million, with renewable biofuels and energy solutions representing more than half of this total. Turnover in the second third of the financial year (September–December) was EUR 103.9 million (EUR 102.6 million). The operating profit for the reporting period was EUR -28 million (EUR 17.3 million). Investments amounted to EUR 25.5 million (EUR 12.1 million). Turnover for the financial year was EUR 149.1 million (EUR 147.3 million). The operating result was EUR -39.4 million (EUR 6.2 million). The operating result includes non-recurring items in the amount of EUR -40.3 million (EUR -0.5 million). The significant non-recurring items mainly consisted of write-downs allocated to the energy peat business (totalling approximately EUR 30 million) and energy infrastructure (totalling approximately EUR 10 million). The main reasons for the write-downs were the declining demand for energy peat and the expiration of an individual energy delivery agreement. The declining demand for energy peat was also reflected in peat deliveries in the second third of the financial year, which declined by 11 per cent year-on-year. The strong demand for biofuels continued in the second third of the financial year, with sales increasing by 8 per cent year-on-year. Heating deliveries increased by 5 per cent year-on-year. The weather conditions during the financial year were characterised by a favourable summer peat production season with low rainfall followed by an autumn that was slightly cooler than the year before. This was reflected in peat deliveries, which declined by 13 per cent year-on-year. Biofuels continued to see strong demand throughout the financial year, increasing by 9 per cent year-on-year. Heating sales also increased by 9 per cent year-on-year.
Energy 9–12/2019 9–12/2018 Change 5–12/2019 5–12/2018 Change 5/2018–4/2019
Turnover (EUR million) 103.9 102.6 1.3% 149.1 147.3 1.2% 289.4
Operating profit (EUR million) -28.0 17.3 -262.3% -39.4 6.2 -732.5% 33.2
Investments (EUR million) 25.5 12.1 110.5% 30.3 21.1 43.4% 27.3

9
Number of employees 351 347 1.2% 366 375 -2.4% 370
Energy sales, peat (GWh) 3,098 3,478 -10.9% 4,360 4,987 -12.6% 9,708
Energy sales, other fuels (GWh) 1,472 1,360 8.2% 2,126 1,960 8.5% 3,691
Heat and steam sales (GWh) 459 439 4.6% 668 614 8.9% 1,187
Grow&Care The Grow&Care division’s Kekkilä-BVB is Europe’s leading and most versatile growing media operator in the professional grower, landscaping and consumer segments. We specialise in the development, production and marketing of high-quality growing media, mulches and fertilisers for landscapers, professional growers, distributors and home gardeners. Peat is also supplied as bedding peat to horse farms, cattle farms, pig farms and poultry producers. As the world’s largest producer of agricultural peat, we supply agricultural peat as a raw material for further processing around the world, and responsibility is an integral part of everything we do. The division’s well-known brands, Kekkilä Garden and Hasselfors Garden, offer products to home gardeners and landscapers in the Nordic countries and Estonia. The merger with BVB Substrates has expanded the product range with private label products as well as the Jardino and Florentus brands sold in the Central European markets by significant retail and wholesale chains. In the professional growing media business, the BVB Substrates and Kekkilä Professional brands are focused not only on the home markets but also the global markets with exports to more than 100 countries. Turnover in the second third of the financial year (September–December) was EUR 60.1 million (EUR 31.8 million). The significant year-on-year growth in turnover was mainly attributable to the Kekkilä-BVB merger. The operating result was EUR -4.7 million (EUR 0.6 million). The result for the reporting period included non-recurring costs in the amount of EUR -1.5 million (EUR -0.1 million) and IFRS acquisition cost amortisation on the BVB Substrates acquisition amounting to EUR -0.6 million (EUR 0 million). The operating result was also weighed down by additional costs arising from integration, higher logistics prices and the Swedish peat production season being less successful than in the previous year. The division’s gross investments were EUR 8.5 million (EUR 1.1 million) Turnover for the full financial year was EUR 150.1 million (EUR 78.6 million). The operating result was EUR -0.5 million (EUR 5.4 million). The result for the financial year included non-recurring costs in the amount of EUR -1.5 million (EUR 0 million) and IFRS acquisition cost amortisation on the BVB Substrates acquisition amounting to EUR -1.2 million (EUR 0 million). The division’s investments totalled EUR 11.2 million (EUR 2.1 million) The Grow&Care division’s operating result declined year-on-year. At comparable figures, the growth of export sales slowed down, but the future sales outlook remained favourable. In the consumer business, the sales season falls on both sides of the turn of the financial year, which means that changes in weather patterns have a significant impact on sales in the different hirds of the year. At comparable figures, sales have increased and the outlook for the upcoming sales season remains positive. The negative profit performance was mainly attributable to higher logistics costs, integration efforts and peat production in Sweden falling short of production targets. The agricultural peat inventories are nevertheless sufficient before the new production year.
10
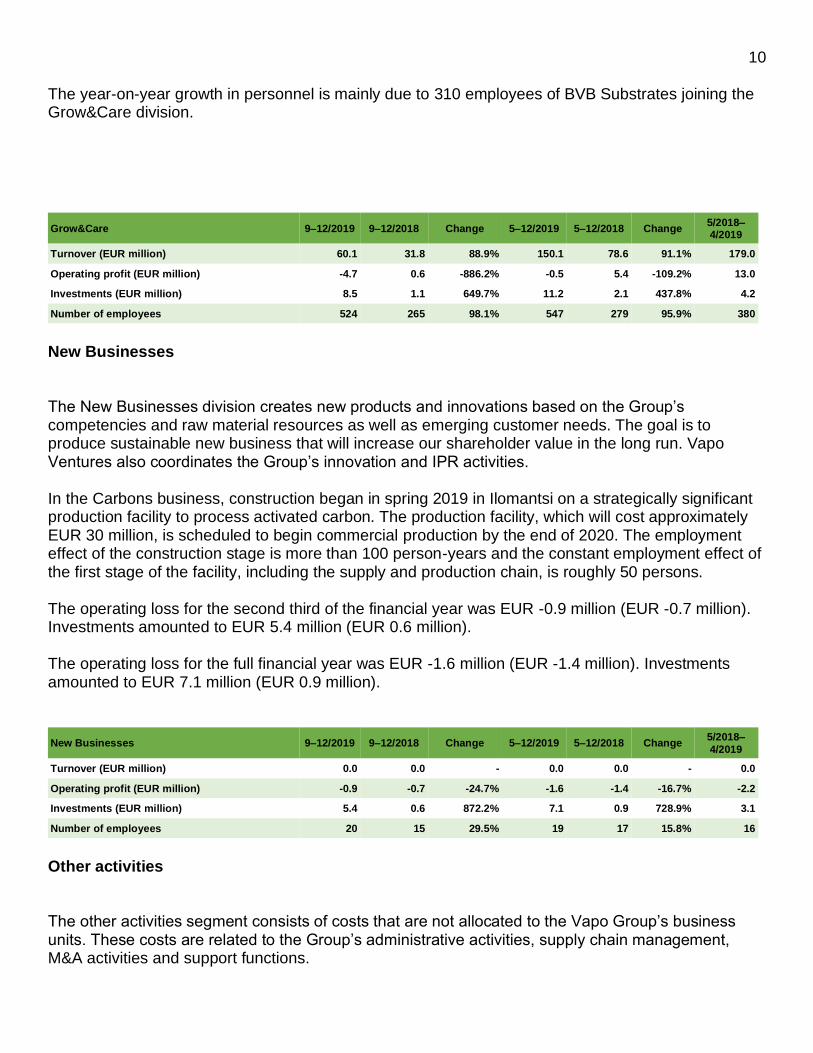
The year-on-year growth in personnel is mainly due to 310 employees of BVB Substrates joining the Grow&Care division.
Grow&Care 9–12/2019 9–12/2018 Change 5–12/2019 5–12/2018 Change 5/2018–4/2019
Turnover (EUR million) 60.1 31.8 88.9% 150.1 78.6 91.1% 179.0
Operating profit (EUR million) -4.7 0.6 -886.2% -0.5 5.4 -109.2% 13.0
Investments (EUR million) 8.5 1.1 649.7% 11.2 2.1 437.8% 4.2
Number of employees 524 265 98.1% 547 279 95.9% 380
New Businesses The New Businesses division creates new products and innovations based on the Group’s competencies and raw material resources as well as emerging customer needs. The goal is to produce sustainable new business that will increase our shareholder value in the long run. Vapo Ventures also coordinates the Group’s innovation and IPR activities. In the Carbons business, construction began in spring 2019 in Ilomantsi on a strategically significant production facility to process activated carbon. The production facility, which will cost approximately EUR 30 million, is scheduled to begin commercial production by the end of 2020. The employment effect of the construction stage is more than 100 person-years and the constant employment effect of the first stage of the facility, including the supply and production chain, is roughly 50 persons. The operating loss for the second third of the financial year was EUR -0.9 million (EUR -0.7 million). Investments amounted to EUR 5.4 million (EUR 0.6 million). The operating loss for the full financial year was EUR -1.6 million (EUR -1.4 million). Investments amounted to EUR 7.1 million (EUR 0.9 million).
New Businesses 9–12/2019 9–12/2018 Change 5–12/2019 5–12/2018 Change 5/2018–
4/2019
Turnover (EUR million) 0.0 0.0 - 0.0 0.0 - 0.0
Operating profit (EUR million) -0.9 -0.7 -24.7% -1.6 -1.4 -16.7% -2.2
Investments (EUR million) 5.4 0.6 872.2% 7.1 0.9 728.9% 3.1
Number of employees 20 15 29.5% 19 17 15.8% 16
Other activities The other activities segment consists of costs that are not allocated to the Vapo Group’s business units. These costs are related to the Group’s administrative activities, supply chain management, M&A activities and support functions.

11
The other activities segment’s effect on the operating result in September–December was EUR -1.8 million (EUR -2.6 million). The other activities segment’s effect on the operating result for the full financial year was EUR 0.9 million (EUR -6.2 million). This was significantly affected by the recognition of non-recurring revenue of EUR 4.9 million in August 2019 related to discontinued business operations.
Other 9–12/2019 9–12/2018 Change 5–12/2019 5–12/2018 Change 5/2018–4/2019
Turnover (EUR million) 0.0 0.1 -67.2% 0.1 0.2 -57.3% 0.2
Operating profit (EUR million) -1.8 -2.6 29.4% 0.9 -6.2 115.0% -4.2
Number of employees 115 112 2.0% 117 102 15.1% 103
Geographical information
EUR 1,000 Turnover by
country Long-term
assets Investments
Finland 156,877 422,713 27,550
The Netherlands 42,064 43,315 7,187
Sweden 39,963 44,990 5,207
Germany 11,367 - 44
Estonia 6,799 29,165 2,774
Other Nordic countries 2,972 - -
Other European countries 23,710 678 -
North and South America 5,641 - -
Other countries 8,356 - -
Group total 297,748 540,860 42,761
Cash flow, investments and financing The Group’s free cash flow before taxes for the financial year 1 May–31 December 2019 was EUR 21 million (May 2018–April 2019: EUR -22.3 million). Free cash flow was significantly improved by measures to increase the efficiency of working capital as well as lower investments. The change in working capital affected cash flow by EUR 10.3 million (EUR -45.7 million). Gross investments in the financial year were EUR 42.8 million (EUR 62.7 million), or 111 per cent of the amount of depreciation (151.0%). Investments in the Carbons business began to a significant degree during the financial year. Investments were also allocated to capacity expansion, energy efficiency investments and reducing the use of fossil fuels in the heat and power business as well as

12
environmental protection and field maintenance in the peat production business. Net investments (gross investments – asset sales) totalled EUR 26.3 million (EUR 50.7 million). On 30 September 2019, Vapo Oy issued a senior unsecured bond in the aggregate nominal amount of EUR 100 million. The bond matures in October 2024 and it bears interest at a fixed rate of 2.125 per cent per annum. The net proceeds of the issuance will be used for growth investments, refinancing and the Group’s general financing needs. Interest-bearing net debt at the end of the financial year amounted to EUR 315.2 million (EUR 265.6 million). The ratio of interest-bearing net debt to operating margin (net debt/EBITDA) on 31 December 2019 was 4.0 (3.6). Excluding the debt arising from the adoption of IFRS 16, net debt/EBITDA was 3.5 (3.6). Short-term interest-bearing debt amounted to EUR 45.7 million (EUR 78.2 million). Of Vapo’s long-term interest-bearing debt, 13 per cent is covered by a covenant related to the company’s equity ratio. The terms of the covenant were met at the end of the review period. Bonds include a change of control clause but they do not include a financial covenant. The equity ratio at the end of the financial year was 42.9 per cent (51.3%) and the gearing ratio was 90.4 per cent (65.8%). The consolidated balance sheet total was EUR 828.5 million (EUR 805.8 million). The Group’s net financing items were EUR -7.8 million (EUR -2.8 million). Net financing items were -2.6 per cent (-0.6%) of turnover. In accordance with its hedging policy, the Group hedges the majority of its predicted net foreign currency exposure for the next 12 months. The hedging instruments used are primarily forward exchange agreements and currency swaps. The most important hedged currency is the Swedish krona. Natural seasonal fluctuation in activities The Group’s business is cyclical to a significant extent due to seasonal variation in the demand for heating. The temperatures during the September–December heating season in the financial year were substantially warmer than average, which reduced the sales of heating and fuels. In the May–August third of the year, the focus was on fuel production and acquisition. The Grow&Care division’s growing media business is also sensitive to seasonal fluctuations, with demand peaking from late spring to early summer. Peat production plays a key role in the Grow&Care division in May–August, and the company achieved its production target during the past season, which enabled the improvement of profitability. Notable risks and uncertainty factors Regulation The government programme of Prime Minister Marin’s government states the following with regard to energy peat (p. 37): “According to the current forecasts, the use of peat primarily as an energy source will be discontinued during the 2030s as the cost of the emissions allowance rises, although it will remain in use to ensure the security of supply. We will decrease the use of peat for energy by at least half by 2030. As part of the overhaul of energy taxation, we will assess the necessary changes to the
13
taxation of peat so that we can achieve our 2030 peat targets. We must ensure that timber material does not end up incinerated.” According to the consumption forecasts of Vapo’s fuel customers, the demand for energy peat will fall to half of the current level by 2025. The reasons for this are the price of emission rights and the current energy tax of EUR 3 applied to peat (in heating). Accordingly, in reference to the government programme, Vapo has proposed that the use of energy peat should not be further impeded by tax increases. Without energy peat, Vapo’s customers would have to rely on commercial timber and light fuel oil as the only fuel to ensure the security of supply in the event of problems associated with the availability of fuel wood. The use of coal will be banned starting from 1 May 2029. Following the announcement of the ban on coal being brought forward, there have been calls in public discussion for a ban on energy peat as well as higher taxes on energy peat. The computational tax subsidies for energy peat have been used as the justification for these views. The fact of the matter is that the state does not subsidise energy peat and the tax structure of energy peat as an output of domestic primary production — with the related wage taxes, value added taxes and taxes on liquid fuels used in production activities — differs significantly from the tax structure of imported fuels, which practically consists only of energy tax. The price of emission rights, EUR 25 per tonne of CO2, has increased the costs of energy peat users by EUR 7–9 per MWh. At this price level, the electricity production subsidy for wood chips is no longer paid and the various wood fractions (wood chips vs forest industry by-products), including commercial timber, are in the same competitive position from the perspective of energy production. The price level of wood energy has increased, nearly reaching the price of pulpwood. The entry of pulpwood into the energy market would further complicate the market situation for energy peat. The energy tax refund for energy-intensive industry is likely to be gradually eliminated. This will reduce the use of energy peat in the forest industry. Depending on the schedule of discontinuing the energy tax refund, the forest industry’s use of energy peat will be reduced by 1–2 TWh. In the 2020s, the need to replace coal and the sharp decline in the use of energy peat will lead to rapid growth in the demand for wood energy. The heating up of the energy wood market, combined with wetter winters that hinder wood harvesting, will lead to fluctuating raw material prices for wood fuels as well as problems associated with the quality and delivery of fuels. The interpretation of the Water Framework Directive is set to become stricter. This may lead to more stringent provisions in the Finnish Water Act, which in turn may make it more difficult to obtain environmental permits for peat production. The risk of the conditions of environmental permits becoming increasingly strict applies to all of Vapo’s peat-related businesses. With respect to energy peat, tighter permit conditions would also present a risk to Finland’s self-sufficiency in energy. The elimination of forest management subsidies in the 2020s may compromise the availability of wood fuels The subsidies based on the Finnish Act on the Financing of Sustainable Forestry are known as Kemera subsidies. The subsidies are intended to support the management of young forests and they

14
also help supply the market with fuel wood. The Kemera subsidy system will be subject to reforms after 2020. According to the Bioenergy Association of Finland, discontinuing the current system for small-diameter wood would have a negative impact on forest development in circumstances where forest management areas are declining. The Bioenergy Association of Finland and Vapo Oy as one of its members support a subsidy system that promotes the sustainable growth of forests and aims to ensure good health for forests. This improves felling opportunities and the carbon binding capacity of forests. The incentive system should promote the market for small-diameter wood from young forests and support young forests’ growth in value. Discontinuing the Kemera system would risk creating a situation where the market availability of forest energy falls short of growth targets. Risks related to horticultural peat With respect to horticultural peat, there are signs of political moves in Europe towards tighter regulation. The most significant threats to the horticultural peat business include restrictions on the use of peat, unexpected changes in legislation concerning peat and more negative attitudes towards the use of peat in the retail sector. To manage these risks, t is essential to provide transparent information on the environmental impacts of the use of peat and for the industry to actively produce and share objective information and emphasise peat’s role in greenhouse farming and global food production. The active promotion of recycling solutions and responsible peat production methods as well as the restoration of peat production areas play a very important role in the general acceptability of the use of peat. Risks related to new businesses New businesses like Carbons include also the risk for restrictions on the use of peat for higher value adding products. To mitigate the risk Vapo aims to act as described in the chapter above. Market risks Vapo's energy business is subject to significant market risks related to end product demand as well as the prices and availability of wood-based fuels and their raw materials. In the international market, the demand for wood fuels has increased as energy companies seek alternatives to fossil fuels. The higher demand has led to increased pellet production in Europe. Imports from outside of Europe have also increased. As the market grows, the availability of appropriately priced raw material in relation to the price of the end product plays a key role in ensuring competitiveness. The pellet market may be affected by Brexit and the potential subsequent reshaping of the UK’s energy and climate policy as well as changes and disturbances in international trade.

15
The Heat and Power business is influenced by the development of the heating, industrial steam and electricity markets as well as fuel markets and the markets for competing energy solutions. Competing energy solutions based on new technology constitute a growing threat to energy produced from domestic fuels. New forms of heating, combinations of different forms of heating, and energy conservation are key considerations in the development of the district heating business.
Weather risks Weather is a risk that has extensive effects on Vapo’s business. In winter, temperature influences the fuel needs of external and internal customers and the utilisation rates of the Group’s own heat and power plants. In spring, the weather conditions also determine the timing of the peak season in the gardening trade, which affects the profit performance for the full year. During summer, the effects of weather concern the production volumes and quality of wood fuels and environmental products. In summer 2019, peat production went as planned in Finland, Sweden and Estonia.
Damage risks Damage risks include occupational safety risk, property risk, interruption risk and environmental risk. Vapo aims to prevent damage risks through proactive risk management measures and by reacting quickly to any observed hazards. Risks that cannot be managed by the company’s own actions are insured where possible. The goal is to continuously promote a positive culture of occupational safety and asset protection throughout the organisation. Extensive investments in changing the organisation’s safety culture are already being reflected in a reduced number of accidents and lower accident frequency as well as an increase in safety observations and related improvement measures throughout Vapo Group. Financing and commodity risks The company manages its financing risk and maintains liquidity by balancing the proportional share of short-term and long-term loans and the repayment schedules of long-term loans. In addition, the risk related to the availability and price of financing is managed by diversifying fundraising between different banks and financial instruments. The company’s main financial risks are currency risk, interest rate risk and liquidity risk. The Group treasury, guided by the financial policy ratified by the Board of Directors, is responsible for identifying and managing financial risks. The Group’s risk management tools include currency derivatives and options, currency swaps, foreign currency loans, interest rate swaps and commodity derivatives. With regard to commodity risks, Vapo purchases hedging services related to the purchase and sale of electricity. Electricity trading represents a minor share of Vapo’s business.

16
Research and development
The Group’s research and development investments during the financial year 1 May–31 December
2019 amounted to EUR 10.7 million (EUR 6.4 million), which corresponds to 3.5 per cent of turnover
(1.4%). Research and development activities were focused on supporting the company’s strategic
renewal in all of the Vapo Group companies.
The New Businesses division develops and commercialises Vapo’s new businesses based on the company’s strengths, emerging customer needs, raw material resources, competencies and networks. The aim is to find solutions based on the sustainable use of natural resources to increase the refining rate and produce new products and services. One example is Vapo Carbons, an initiative focused on activated carbon products that has already progressed to the business stage. The division is also responsible for the Group’s innovation and IPR management.
The Vapo Refinery 2030 vision launched during the financial year aims to accumulate international turnover through the use of peatland biomass. High value-added products made of peat and moss carry enormous future potential because of the worldwide need for new ways to promote sustainable food production and water and air purification as well as to replace harmful chemicals, oil-based products and plastics. In the Vapo Refinery vision, raw materials and side stream products are comprehensively utilised in accordance with the circular economy principle. The Group’s innovation and IPR strategy was revised during the financial year and it supports Vapo’s objective of creating new business as well as managing and protecting the tangible assets and intellectual property developed by the company. The key elements are developing the competence of the personnel, fostering a culture of innovation and taking proactive measures to protect intellectual property. The goal is to identify intellectual property rights at the early stages of projects and customer relationships and protect them using either the company’s internal operating models or international patents.
Environmental responsibility
Vapo is committed to continuously improving its operations and developing its environmental efforts. We want to be recognised as a responsible and sustainable company wherever we operate. Vapo Group’s long-term sustainability targets and environmental strategy were updated and approved in 2019: we will reduce our emissions to waterways as well as our climate emissions, use natural resources sustainably, improve material efficiency, reduce waste and ensure that our offices are environmentally friendly. Each of Vapo’s businesses has an environmental programme in accordance with the environmental strategy. The environmental programmes specify the most significant aspects of environmental responsibility along with annual environmental targets. We offered an online course on the management of environmental matters to all employees. Last year, we developed a responsibility concept for peat, especially aimed at new businesses, and agreed on a plan for the certification of responsibly produced peat to meet the needs of Kekkilä-BVB. We created a net impact assessment model for the Group’s businesses and will use the results of the model in the sustainability work carried out at Kekkilä-BVB, Nevel and Carbons in 2020.

17
We continued to carry out self-initiated environmental impact inspections at peat production areas. Contractors in Vapo’s Finnish peat production operations inspected water treatment structures in four-week intervals during the production season. In addition, 17 environmental inspectors recruited for the summer season inspected water treatment methods and other aspects related to environmental permit conditions at all production areas. In 2019, Centres for Economic Development, Transport and the Environment made 120 inspection visits to Vapo’s peat production sites in Finland. Vapo decided to discontinue the Clean Water project in 2019 after several years of substantial research investments. To verify the Clean Water commitment, Vapo engaged in preliminary monitoring activities at more than 100 areas assigned for potential peat production to determine their initial environmental discharge levels. The commitment also included a strong focus on the development of water treatment methods in peat production. Nearly all new methods that had even theoretical potential were investigated and piloted in internal and external research projects. In addition, the water treatment methods used in peat production have been continuously developed. Nevertheless, a feasible solution for fulfilling the commitment was not identified for water treatment in peat production or the purification of waters discharged from other forms of land use. In natural conditions, hydrological fluctuations, geographical distances and the adequate availability of electricity from the grid pose substantial challenges to the use of new and more advanced water treatment methods. Overland flow areas still represent the best available technique for water treatment in peat production. Under the prevailing conditions, achieving the commitment’s goal of reducing the load to a level below the initial level identified in advance monitoring proved to be uncertain and challenging under all conditions. As one of the goals of our updated environmental strategy is to reduce the load on watercourses, Vapo will continue to take a responsible approach to waterways by developing and improving water treatment structures and their effectiveness. Vapo Group’s (Finland, Sweden, Estonia) environmental investments in peat production areas during the financial year amounted to EUR 0.6 million (EUR 3.0 million) and were primarily related to improving and building water treatment structures at peat production sites. Excluding Vapo’s own personnel’s input, environmental protection costs for the financial year amounted to EUR 11.9 million (EUR 19.2 million). The costs primarily consisted of the maintenance of water treatment structures in peat production and impact monitoring. In accordance with its environmental permit application principles, Vapo only applies for new production permits for ditched peatlands. In 2019, 89 (305) hectares in newly approved production sites were obtained through environmental permit applications for peat production in Finland. The EIA process was completed for areas totalling 916 (485) hectares. Vapo Group’s active peat production areas (Finland, Sweden, Estonia) in summer 2019 totalled approximately 40,600 (42,300) hectares, with Finland accounting for 33,500 (35,400) hectares of the total. A total of 454 (139) hectares of new peatlands became ready for production in Finland and 5,289 (2,001) hectares were released from production by the end of the financial year. In Sweden, 76 hectares of peat production areas were released from production. A total of 453 (1,086) hectares were transferred to other land use methods from peat production operations in Finland during the financial year. A total of 356 (339) hectares were assigned for forestation and 97 (195) hectares for building wetlands. In addition, a significant amount of land was sold, with the new owner deciding on the subsequent use. Areas released from peat production and returned to land owners totalled 1,145 (551) hectares. The company prepares for the subsequent maintenance of cutaway areas by means of an environmental provision that covers the costs

18
associated with post-production obligations. During the financial year, Vapo continued negotiations on the sale of peatlands with significant nature value for protection purposes. In 2019, Vapo Group continued its own power and heating plants’ multi-year development programme aimed at reducing oil consumption and improving energy efficiency. Renewable fuels currently account for more than half of all fuels used: 46% in Finland, 95% in Sweden and 7% in Estonia. Nevel Oy is committed to increasing the share of renewable fuels to more than 75% by the end of 2021. The use of domestic fuels remained unchanged from the previous year at Nevel Oy’s energy production plants in Finland. Fuel oil is used primarily as a reserve fuel and its use declined to approximately 3% thanks to the reduced duration of service shutdowns. The coefficient of efficiency of the plants was improved thanks to the enhanced control of the residual oxygen levels of boilers. During the reporting period, the company invested in energy efficiency and increasing its capacity of using biofuels in all of its operating countries.
General Meetings
Vapo Oy’s Annual General Meeting was held in Helsinki on 5 September 2019. The AGM adopted the financial statements and consolidated financial statements for the financial year 1 May 2018–30 April 2019 and discharged the members of the Supervisory Board, the Board of Directors and the CEO from liability. The AGM resolved to distribute a dividend for the financial year ended 30 April 2019 amounting to EUR 410 per share, or EUR 12.3 million in total. The dividend payment date was 9 September 2019.
The AGM of 5 September 2019 confirmed that the Supervisory Board will continue with its composition unchanged. Tuomas Hyyryläinen, M.Sc. (Econ.); Juhani Järvelä, M.Sc. (Eng.); Risto Kantola, M.Sc. (Eng.); Jan Lång, M.Sc. (Econ.); Kirsi Puntila, M.Sc. (Econ.); Minna Smedsten, M.Sc. (Econ.); and Markus Tykkyläinen, M.Sc. (Econ.) were re-elected to Vapo Oy’s Board of Directors. Senior Financial Counsellor Maija Strandberg, M.Sc. (Econ.), from the Government Ownership Steering Department of the Prime Minister’s Office was elected to the Board of Directors as a new member. Jan Lång continues as Chairman of the Board of Directors, with Markus Tykkyläinen as Vice Chairman.
The audit firm KPMG Oy was elected as auditor, with Ari Eskelinen, M.Sc. (Econ.), Authorised Public Accountant, appointed the principal auditor.
In October, Vapo Oy’s Extraordinary General Meeting appointed a new Supervisory Board. The
following were appointed as members of the Supervisory Board: Antti Häkkänen, Heikki Miilumäki,
Eero Kubin, Esko Kurvinen, Tommi Luntila, Mauri Peltokangas, Jenni Pitko, Antti Rantakangas, Piritta
Rantanen and Tiina Snicker.
Antti Rantakangas, Member of Parliament, was appointed as the Chairman of the Supervisory Board
and Heikki Miilumäki, D.Sc. (Tech.), as the Vice Chairman.

19
Number of employees The Group employed an average of 1,009 (739) persons in the final third of the financial year. The average number of employees for the full financial year was 1,050 (869).
Employees by segment, average
5–12/2019 5/2018–4/2019
Energy 366 370
Grow&Care 547 380
New Businesses 19 16
Other 117 103
Total 1,050 869
The codetermination committees of Vapo Oy and Kekkilä Oy met twice, as planned, during the financial year to discuss current topics. Employees are also represented on Vapo’s Supervisory Board. The Supervisory Board met three times during the financial year. Occupational safety Vapo Group has a strong continuous focus on occupational safety and well-being and the starting point for all of our operations is workplace safety and developing a proactive and caring safety culture. In 2019, Vapo Group’s accident frequency (LTA1f: lost-time accidents per million working hours) decreased slightly compared to the previous year and was 6.7 (6.9). A significant improvement was achieved in LTA1 accidents in Finland, with only one accident leading to lost time occurring in Finland (8). The accident frequency in 2019 was the highest in Kekkilä-BVB’s units in the Netherlands, where 9 LTA1 accidents occurred. MTR accidents (requiring an evaluation visit to occupational health services) were more evenly spread in the Group.
20
In the field of safety, we created an online course for our personnel, which existing and new employees alike are required to complete. In 2019, we expanded our safety monitoring activities to also cover our subcontractors and the Group’s number of safety observations continued the significant rise it began in the previous year and amounted to 4,856 (4,058). Vapo Group has zero tolerance for inappropriate conduct and discrimination, and all reported incidents were reviewed without delay.

21
Executive appointments in Vapo Group Pasi Koivisto was appointed as the Director of the business consisting of the sale of renewable energy and fuels and a member of the Group Management Team effective from 1 November 2019.
Changes in organisational structure
The new company Neova Värme AB was established on 2 July 2019 and subsequently renamed as Nevel AB on 13 December 2019. Salon Energiantuotanto Oy owns 100% of the company. The new company Vapo LS Oy was established on 3 July 2019 and subsequently renamed as Nevel Oy on 20 November 2019. Vapo Oy owns 100% of the company. Nevel Eesti OÜ was established on 11 December 2019. Vapo Oy owns 100% of the company. Forest BTL Oy was dissolved on 17 October 2019.
Board of Directors’ proposal for the distribution of profits
The Board of Directors proposes to the General Meeting to be convened on 19 March 2020 that Vapo Oy’s result for the financial year, EUR -39,188,539.78, be recorded as a change in retained earnings, after which the distributable funds available to the General Meeting amount to EUR 144,108,435.91. There have been no substantial changes in the company’s financial position after the end of the
financial year. The Board of Directors proposes to the General Meeting that EUR 3.99 million, or EUR
133.00 per share, be paid as dividend for the financial year 1 May–31 December 2019.
Events after the review period
Vapo Clean Waters Oy, a fully-owned subsidiary of Vapo Oy, the merge with the parent company
was registered on 14 January 2020.
On 28 January 2020, Vapo Oy’s Extraordinary General Meeting elected Member of Parliament Juha
Sipilä as a new member of Vapo Oy’s Supervisory Board and as Chairman of the Supervisory Board,
replacing the previous Chairman Antti Rantakangas who passed away suddenly.

22
Future outlook Vapo Group is one of the world’s largest producers of energy peat and peat for growing media. The company holds an important role in ensuring Finland’s self-sufficiency in energy and the security of supply. Nevertheless, political decisions have a material impact on the profitability of nearly all of the company’s businesses and therefore affect the company’s ability to invest in higher-added-value production. Vapo will continue to implement measures in line with its strategy to increase the competence of its personnel and achieve market-leading customer service in the local energy value chain. This includes the development of new services and comprehensive solutions for our energy customers. At the same time, the company will continue to increase the efficiency of its business processes in order to improve profitability. The demand for fossil fuels is expected to continue to decline, while the demand for bioenergy is expected to grow. In the new financial year, the Kekkilä-BVB Group will invest in developing its product selection and the profitable growth of its international sales in the professional, consumer grower and landscaping businesses. Vapo will continue the commercialisation of new business operations in the Carbons business as well as the researching of further new business initiatives in the Vapo Refinery business area. The construction of Carbons’ first production facility for manufacturing technical carbons is progressing as planned in Ilomantsi and it is expected to become operational in the final third of the current financial year.

23
Consolidated key figures
MEUR 9–12/2019 9–12/2018 5–12/2019
5/2018–
4/2019
5/2017–
4/2018
Turnover 163.6 134.1 297.7 460.8 419.8
Operating profit (EBIT) -35.1 14.7 -40.4 33.3 26.3
% of turnover -21.5 11.0 -13.6 7.2 6.3
Operating profit (EBIT) before impairments 3.8 14.7 -1.5 33.5 27.2
% of turnover 2.3 11.0 -0.5 7.3 6.5
Profit/loss for the reporting period -32.2 12.7 -40.2 25.2 17.6
Operating margin (EBITDA) 18.6 24.9 37.0 74.1 61.1
+/- Change in working capital 10.3 -25.2 10.3 -45.7 37.6
- Net investments -18.6 -9.5 -26.3 -50.7 -25.0
Free cash flow before taxes 10.4 -9.9 21.0 -22.3 73.6
Gross investments -31.5 -15.1 -42.8 -62.7 -31.3
Return on invested capital % * -1.7 5.4 4.3
Return on invested capital % before impairment * 4.1 5.4 4.4
Return on equity % * -5.1 7.0 5.2
Balance sheet total 828.5 805.8 697.5
Shareholders’ equity 348.5 404.0 347.9
Interest-bearing net debt 315.2 265.6 206.2
Equity ratio %** 42.9 51.3 51.2
Interest-bearing net debt/operating margin 4.0 3.6 3.4
Gearing % 90.4 65.8 59.3
Average number of employees 1,050 869 758
*) Previous 12 months
**) In calculating the equity ratio, the capital loan on the balance sheet was calculated as shareholders’ equity
24
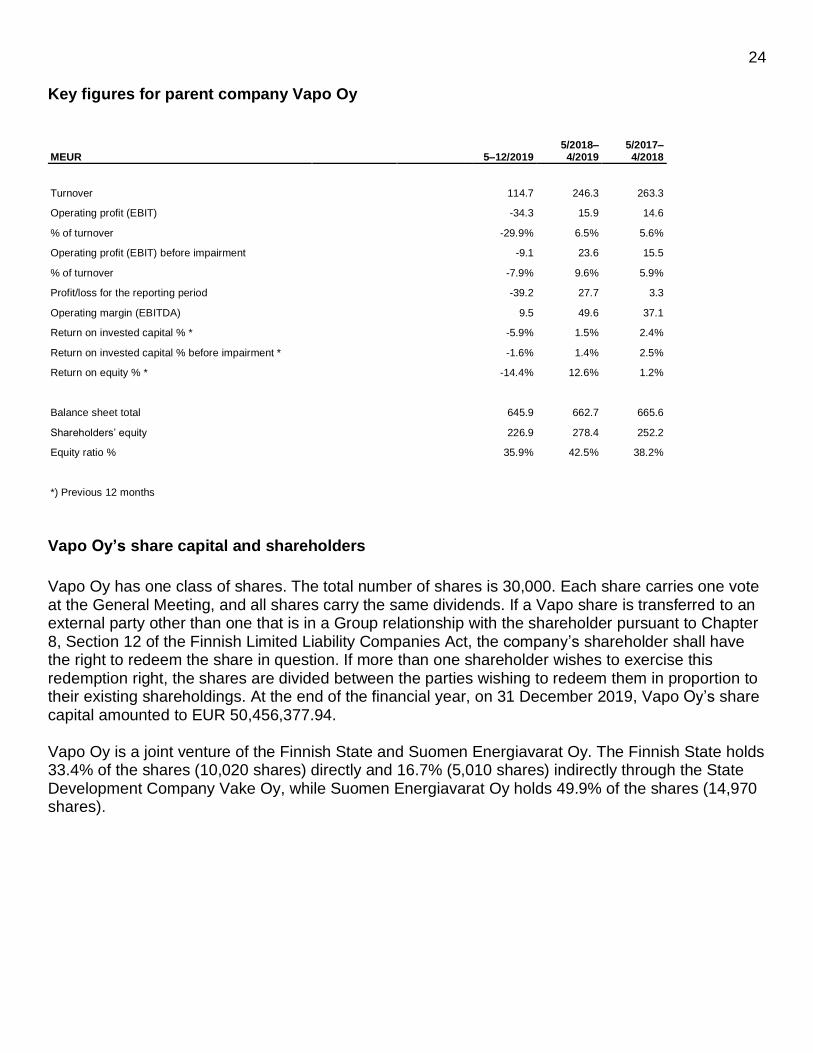
Key figures for parent company Vapo Oy
MEUR 5–12/2019 5/2018–4/2019
5/2017–4/2018
Turnover 114.7 246.3 263.3
Operating profit (EBIT) -34.3 15.9 14.6
% of turnover -29.9% 6.5% 5.6%
Operating profit (EBIT) before impairment -9.1 23.6 15.5
% of turnover -7.9% 9.6% 5.9%
Profit/loss for the reporting period -39.2 27.7 3.3
Operating margin (EBITDA) 9.5 49.6 37.1
Return on invested capital % * -5.9% 1.5% 2.4%
Return on invested capital % before impairment * -1.6% 1.4% 2.5%
Return on equity % * -14.4% 12.6% 1.2%
Balance sheet total 645.9 662.7 665.6
Shareholders’ equity 226.9 278.4 252.2
Equity ratio % 35.9% 42.5% 38.2%
*) Previous 12 months
Vapo Oy’s share capital and shareholders
Vapo Oy has one class of shares. The total number of shares is 30,000. Each share carries one vote at the General Meeting, and all shares carry the same dividends. If a Vapo share is transferred to an external party other than one that is in a Group relationship with the shareholder pursuant to Chapter 8, Section 12 of the Finnish Limited Liability Companies Act, the company’s shareholder shall have the right to redeem the share in question. If more than one shareholder wishes to exercise this redemption right, the shares are divided between the parties wishing to redeem them in proportion to their existing shareholdings. At the end of the financial year, on 31 December 2019, Vapo Oy’s share capital amounted to EUR 50,456,377.94. Vapo Oy is a joint venture of the Finnish State and Suomen Energiavarat Oy. The Finnish State holds 33.4% of the shares (10,020 shares) directly and 16.7% (5,010 shares) indirectly through the State Development Company Vake Oy, while Suomen Energiavarat Oy holds 49.9% of the shares (14,970 shares).
25
Consolidated Financial Statements, IFRS
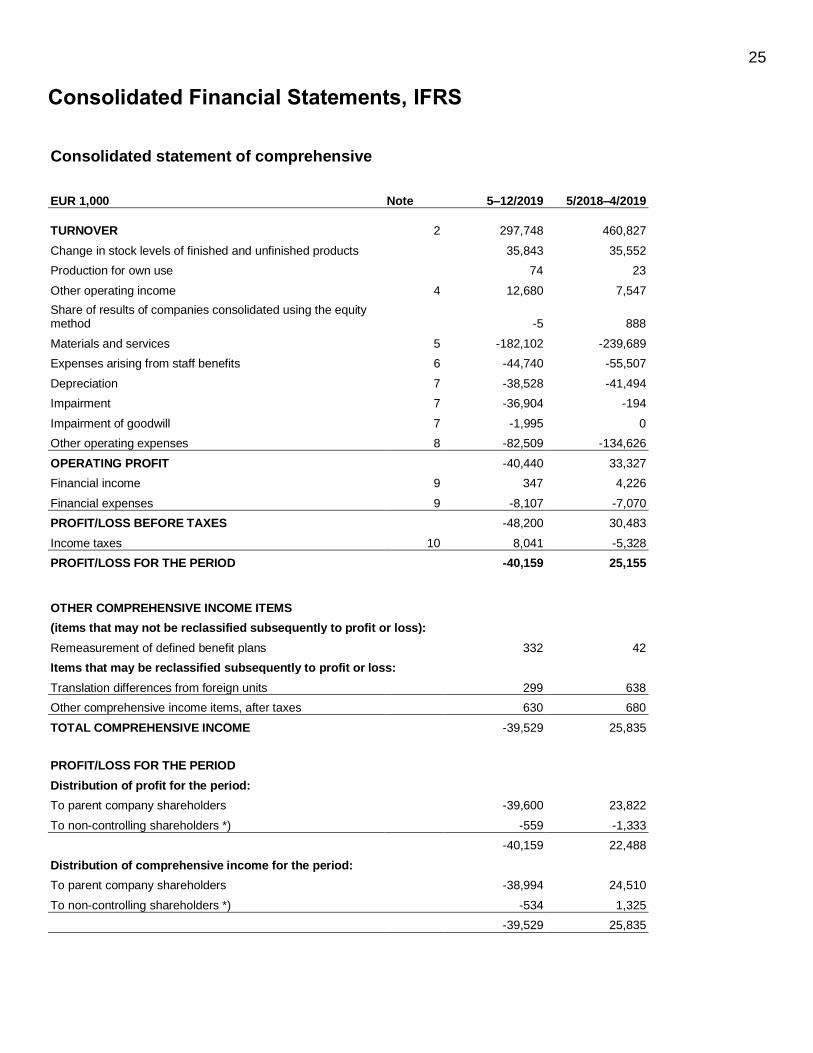
Consolidated statement of comprehensive income
EUR 1,000 Note 5–12/2019 5/2018–4/2019
TURNOVER 2 297,748 460,827
Change in stock levels of finished and unfinished products 35,843 35,552
Production for own use 74 23
Other operating income 4 12,680 7,547
Share of results of companies consolidated using the equity method -5 888
Materials and services 5 -182,102 -239,689
Expenses arising from staff benefits 6 -44,740 -55,507
Depreciation 7 -38,528 -41,494
Impairment 7 -36,904 -194
Impairment of goodwill 7 -1,995 0
Other operating expenses 8 -82,509 -134,626
OPERATING PROFIT -40,440 33,327
Financial income 9 347 4,226
Financial expenses 9 -8,107 -7,070
PROFIT/LOSS BEFORE TAXES -48,200 30,483
Income taxes 10 8,041 -5,328
PROFIT/LOSS FOR THE PERIOD -40,159 25,155
OTHER COMPREHENSIVE INCOME ITEMS
(items that may not be reclassified subsequently to profit or loss):
Remeasurement of defined benefit plans 332 42
Items that may be reclassified subsequently to profit or loss:
Translation differences from foreign units 299 638
Other comprehensive income items, after taxes 630 680
TOTAL COMPREHENSIVE INCOME -39,529 25,835
PROFIT/LOSS FOR THE PERIOD
Distribution of profit for the period:
To parent company shareholders -39,600 23,822
To non-controlling shareholders *) -559 -1,333
-40,159 22,488
Distribution of comprehensive income for the period:
To parent company shareholders -38,994 24,510
To non-controlling shareholders *) -534 1,325
-39,529 25,835

26
Earnings per share calculated from profits due to parent company shareholders
Earnings/share, EUR -1,320 794
Average number of shares 30,000 30,000
* the minority share of non-controlling shareholders has been restated in the figures for the comparison period

27
Consolidated balance sheet
EUR 1,000 Note 31 Dec. 2019 30 Apr. 2019
ASSETS
Long-term assets
Intangible assets 11 35,912 37,343
Goodwill 11 24,323 26,562
Land and water areas 12 46,129 37,061
Buildings and structures 12 65,584 39,507
Machinery and equipment 12 129,561 135,097
Other tangible assets 12 188,616 221,013
Prepayments and unfinished acquisitions 12 24,743 23,618
Shares in entities consolidated using the equity method 13 21,637 19,946
Other long-term financial assets 14 726 808
Long-term sales and other receivables 15 3,321 3,225
Deferred tax asset 17 367 0
Long-term assets total 540,919 544,182
Current assets
Inventories 18 190,291 145,994
Sales and other receivables 19 86,902 107,236
Income tax receivables 4,071 401
Cash and cash equivalents 20 6,326 7,962
Current assets total 287,590 261,593
ASSETS TOTAL 828,509 805,775
SHAREHOLDERS’ EQUITY AND LIABILITIES
Shareholders’ equity
Share capital 50,456 50,456
Fair value fund and other funds 28,924 30,481
Translation differences -4,215 -4,467
Retained earnings 182,676 236,696
Hybrid bond 27 50,000 50,000
Parent company shareholders’ share of shareholders’ equity 307,841 363,166
Non-controlling shareholders *) 40,640 40,815
Shareholders’ equity total 21 348,481 403,980
Long-term liabilities
Deferred tax liability 17 10,490 11,655
Long-term interest-bearing liabilities 22 278,429 198,820
Long-term non-interest-bearing liabilities 23 8,155 7,887
Long-term provisions 24 7,654 7,530
Pension liabilities 25 5,004 4,806
Long-term liabilities total 309,732 230,699

28
Current liabilities
Current interest-bearing liabilities 22 46,453 78,161
Current non-interest-bearing liabilities 26 122,011 85,309
Current provisions 1,831 7,625
Current liabilities total 170,296 171,096 SHAREHOLDERS’ EQUITY AND LIABILITIES 828,509 805,775
* the minority share of non-controlling shareholders has been restated in the figures for the comparison period
29
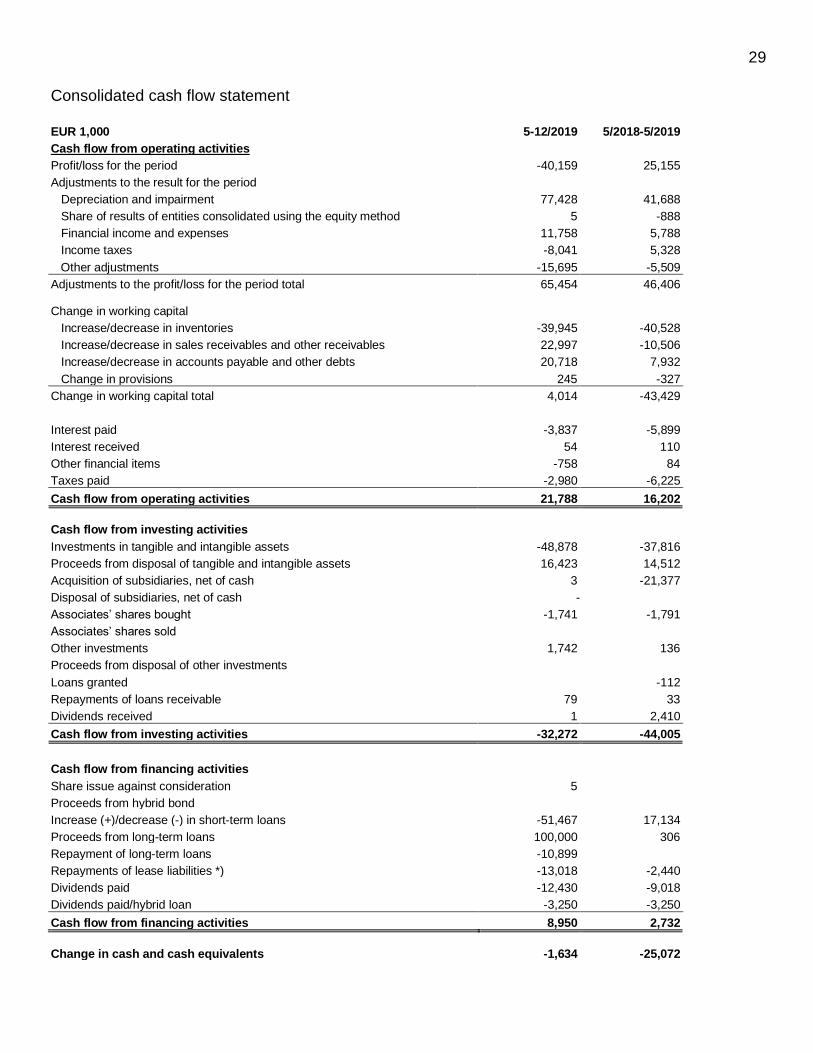
Consolidated cash flow statement
EUR 1,000 5-12/2019 5/2018-5/2019
Cash flow from operating activities
Profit/loss for the period -40,159 25,155
Adjustments to the result for the period
Depreciation and impairment 77,428 41,688
Share of results of entities consolidated using the equity method 5 -888
Financial income and expenses 11,758 5,788
Income taxes -8,041 5,328
Other adjustments -15,695 -5,509
Adjustments to the profit/loss for the period total 65,454 46,406
Change in working capital
Increase/decrease in inventories -39,945 -40,528
Increase/decrease in sales receivables and other receivables 22,997 -10,506
Increase/decrease in accounts payable and other debts 20,718 7,932
Change in provisions 245 -327
Change in working capital total 4,014 -43,429
Interest paid -3,837 -5,899
Interest received 54 110
Other financial items -758 84
Taxes paid -2,980 -6,225
Cash flow from operating activities 21,788 16,202
Cash flow from investing activities
Investments in tangible and intangible assets -48,878 -37,816
Proceeds from disposal of tangible and intangible assets 16,423 14,512
Acquisition of subsidiaries, net of cash 3 -21,377
Disposal of subsidiaries, net of cash -
Associates’ shares bought -1,741 -1,791
Associates’ shares sold
Other investments 1,742 136
Proceeds from disposal of other investments
Loans granted -112
Repayments of loans receivable 79 33
Dividends received 1 2,410
Cash flow from investing activities -32,272 -44,005
Cash flow from financing activities
Share issue against consideration 5
Proceeds from hybrid bond
Increase (+)/decrease (-) in short-term loans -51,467 17,134
Proceeds from long-term loans 100,000 306
Repayment of long-term loans -10,899
Repayments of lease liabilities *) -13,018 -2,440
Dividends paid -12,430 -9,018
Dividends paid/hybrid loan -3,250 -3,250
Cash flow from financing activities 8,950 2,732
Change in cash and cash equivalents -1,634 -25,072
30
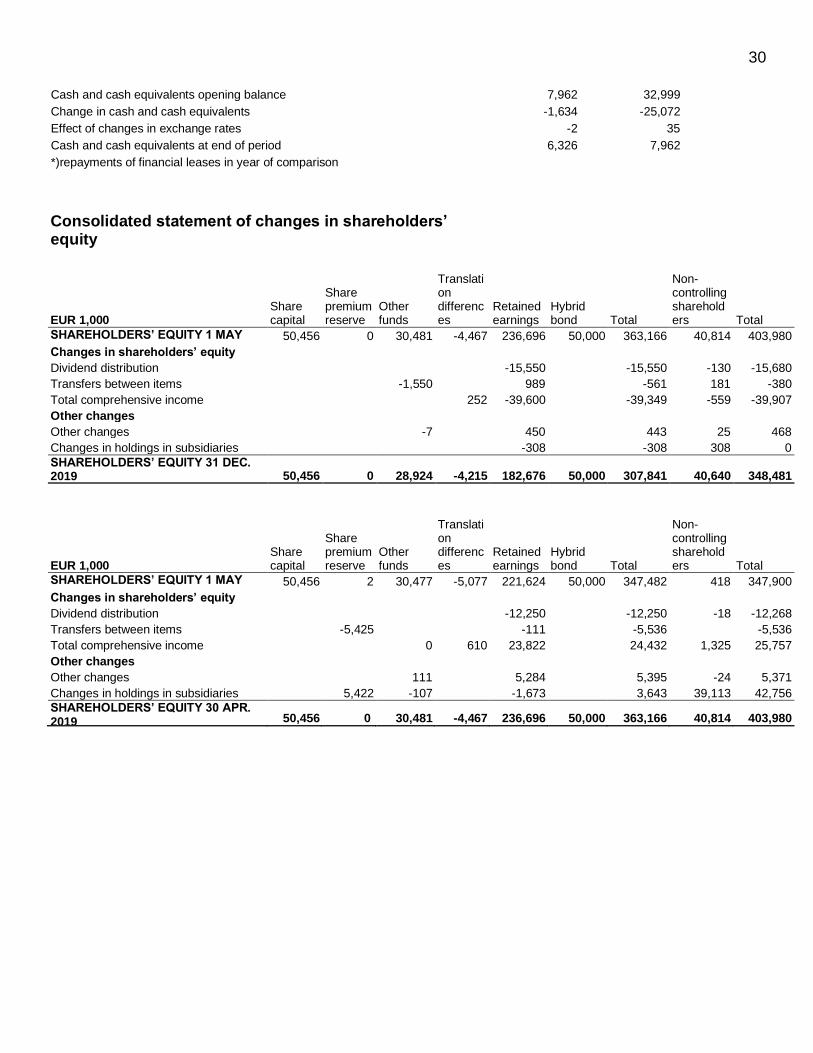
Cash and cash equivalents opening balance 7,962 32,999
Change in cash and cash equivalents -1,634 -25,072
Effect of changes in exchange rates -2 35
Cash and cash equivalents at end of period 6,326 7,962
*)repayments of financial leases in year of comparison
Consolidated statement of changes in shareholders’ equity
EUR 1,000 Share capital
Share premium reserve
Other funds
Translation differences
Retained earnings
Hybrid bond Total
Non-controlling shareholders Total
SHAREHOLDERS’ EQUITY 1 MAY 2019
50,456 0 30,481 -4,467 236,696 50,000 363,166 40,814 403,980
Changes in shareholders’ equity
Dividend distribution -15,550 -15,550 -130 -15,680
Transfers between items -1,550 989 -561 181 -380
Total comprehensive income 252 -39,600 -39,349 -559 -39,907
Other changes
Other changes -7 450 443 25 468
Changes in holdings in subsidiaries -308 -308 308 0
SHAREHOLDERS’ EQUITY 31 DEC. 2019 50,456 0 28,924 -4,215 182,676 50,000 307,841 40,640 348,481
EUR 1,000 Share capital
Share premium reserve
Other funds
Translation differences
Retained earnings
Hybrid bond Total
Non-controlling shareholders Total
SHAREHOLDERS’ EQUITY 1 MAY 2018
50,456 2 30,477 -5,077 221,624 50,000 347,482 418 347,900
Changes in shareholders’ equity
Dividend distribution -12,250 -12,250 -18 -12,268
Transfers between items -5,425 -111 -5,536 -5,536
Total comprehensive income 0 610 23,822 24,432 1,325 25,757
Other changes
Other changes 111 5,284 5,395 -24 5,371
Changes in holdings in subsidiaries 5,422 -107 -1,673 3,643 39,113 42,756
SHAREHOLDERS’ EQUITY 30 APR. 2019 50,456 0 30,481 -4,467 236,696 50,000 363,166 40,814 403,980
31
Notes to the consolidated financial statements, IFRS
Company
Vapo is an international conglomerate whose businesses promote clean, local and water-conserving food production, supply local fuels and provide heating and steam production solutions. Vapo Group also develops new products for the purification of contaminated environments and creates well-being by providing jobs, recycling and by creating comfortable living environments. Vapo is a leading bioenergy company in Finland, Sweden and Estonia. The product and service selection developed for Vapo’s energy customers consists of local fuels, such as peat, pellets and forest fuels as well as added value services related to energy production. The company also owns seven combined heat and power (CHP) plants and approximately 150 heating plants producing local energy. Vapo is an important part of the local energy infrastructure in all of its markets. Vapo Group also includes the growing media group Kekkilä-BVB, which is the European market leader in growing media products. The company produces garden soils, mulches and fertilisers for professional growers, consumers and landscapers in Finland under the Kekkilä brand, in Sweden under the Hasselfors Garden brand and in the Netherlands under the BVB Substrates brand. Vapo Group consist of three divisions — Energy, Grow&Care and New Businesses — and the Group’s other functions. Vapo has subsidiaries in Finland and other countries. The parent company, Vapo Oy, is a Finnish company established in compliance with Finnish laws, domiciled in Jyväskylä at the registered address Vapo Oy, Yrjönkatu 42, PO Box 22, 40101 Jyväskylä, Finland. The company website is at www.vapo.com. The Board of Directors of Vapo Oy approved these financial statements for publication at its meeting on 27 February 2020. According to the Finnish Companies Act, shareholders are entitled to either approve or dismiss the financial statements at the General Meeting of Shareholders following their publication. The General Meeting is also entitled to vote on a revision of the financial statements. A copy of the consolidated financial statements is available at www.vapo.com or from the head office of the parent company.
32
1. Accounting policies for the consolidated financial statements
1.1 General Vapo Oy’s consolidated financial statements have been compiled in accordance with the International Financial Reporting Standards (IFRS), which have been approved for use in the EU, and in accordance with the IAS and IFRS standards in force on 31 December 2019 as well as the SIC and IFRIC standing interpretations. International accounting standards refer to standards and their interpretations approved to be used in the EU according to the Finnish Accounting Act and regulations based on it in accordance with the procedures set in EU regulation (EC) No. 1606/2002. The notes to the consolidated financial statements also comply with the requirements of the Finnish accounting and company acts which complement the IFRS regulations. The profit and loss statement figures are presented in thousands of euros and are based on the original acquisition costs, unless stated otherwise in the accounting policies. For presentation purposes, individual figures and totals have been rounded up to the nearest thousand, resulting in rounding differences in the totals. The figures for the period presented in the financial statements are not comparable because the comparison period was longer than the reporting period. The reporting period is 8 months, while the comparison period was 12 months. This is due to a change in Vapo’s financial year. Going forward, Vapo’s financial year is the calendar year, 1 January–31 December. Two of the Group’s financial years ended during the same calendar year, 2019, which is why the maximum amortisation for the tax year (20 months) has been accounted for in these financial statements. New standards applied during the financial year According to IFRS 16 Leases, all leases are presented in the lessee’s balance sheet. The lessee recognises a right-of-use asset in the balance sheet based on the lessee’s right to use the asset in question and a lease liability based on the obligation to make lease payments. As a rule, the right-of-use asset is depreciated over the lease term or over its useful life, depending on which is shorter. The interest expense on the lease liability is presented in financial expenses.
Vapo adopted the new IFRS 16 standard effective from 1 May 2019 using the retrospective transition method, which means that the comparison figures for the financial year 2018 have not been adjusted.
Accordingly, the classification changes and adjustments arising from the new accounting standard have been recognised in the opening balance sheet of 1 May 2019. IFRS 16 permits two recognition exemptions concerning short-term leases and leases for which the underlying asset is of low value. Short-term leases are leases with a term of 12 months at most. Assets of low value are defined as assets whose value is not significant to the Group. Vapo applies these two recognition exemptions and therefore does not apply IFRS 16 to short-term leases and leases for which the underlying asset is of low value.

33
In connection with the adoption of IFRS 16, the Group recognised lease liabilities on leases classified as “operating leases” in accordance with IAS 17. The liabilities were measured at the present value of the remaining lease payments. The discount rate applied in the calculation was the lessee’s incremental borrowing rate on 1 May 2019. The lessee’s weighted average incremental borrowing rate applied to the lease liabilities on 1 May 2019 was 3.5%.
Reconciliation of the lease obligations on 30 April 2019 and the lease liabilities in the opening balance sheet of 1 May 2019:
Liabilities related to lease obligations on 30 April 2019 21,746
Leases added during the financial year 36,867
Total lease obligations on 30 April 2019 58,613
Finance leases treated in accordance with IAS 17 41,704
Leases for which the underlying asset is of low value, not recognised as liabilities -458
Adjustments arising from the different treatment of extension or termination options on leases for land -6,638
Undiscounted lease liability on 1 May 2019 93,221
Effect of discounting -6,790
Lease liability recognised on 1 May 2019 86,431
Other new narrow-scope amendments to IFRS standards applicable from the start of the financial year and the IFRIC 23 Uncertainty over Income Tax Treatments interpretation have not had an impact on Vapo’s consolidated financial statements. 1.2. Consolidation principles The consolidated financial statements cover the parent company, Vapo Oy, and all subsidiaries in which the parent company holds over 50% of the votes carried by shares, or which are otherwise controlled by the parent company. Piipsan Turve Oy, in which Vapo’s holding is 48%, has been consolidated as a subsidiary in the consolidated profit and loss statements. Associates in which Vapo controls 20–50% of the share votes, and in which Vapo has considerable influence but no absolute control, have been consolidated using the capital share method. When the Group’s share of the associate’s result exceeds the book value, the investment is recognised in the balance sheet at zero value and the exceeding losses are not recognised unless the Group has incurred obligations or made payments on behalf of the associate. Acquired subsidiaries have been consolidated in the consolidated financial statements from the date on which the Group acquired control until this control ceases. Group companies’ mutual share ownerships have been eliminated using the acquisition cost method. The acquisition cost has been allocated to the acquired company’s assets and debts at their fair value at the time of the acquisition, where a reliable figure could be determined. For these allocations, imputed taxes have been estimated at the current tax rate and the remainder has been entered in the balance sheet as goodwill.
34
The Group’s internal business transactions, receivables, debts, unrealised margins and internal distribution of profit are not included in the consolidated financial statements. Total comprehensive income is allocated to the owners of the parent company, even if this means that the non-controlling shareholders’ share becomes negative. The share of non-controlling shareholders is also presented as a separate item as part of shareholders’ equity. The changes in the share of ownership of the subsidiary by the parent company, which do not lead to loss of control, shall be treated as business operations regarding shareholders’ equity. 1.3. Summary of key accounting principles Compilation principles requiring management judgement and key uncertainties related to estimates When compiling financial statements, it is necessary to make estimates and assumptions about the future. The actual outcome can be different from the estimates and assumptions made. In addition, it is necessary to exercise judgement when applying the financial statement compilation principles. The Group management makes decisions based on discretion concerning the choice and application of the financial statement compilation principles. This particularly concerns cases where the IFRS norms have alternative entry, valuation and presentation methods. The estimates and assumptions are based on the previous experience of the Group’s management and other factors. They also include reasonable expectations concerning future events. The estimates and assumptions used are continuously reviewed. The Group monitors changes in estimates and assumptions and the factors influencing estimates and assumptions by using several internal and external sources of information. Potential changes to estimates and assumptions are taken into account in the financial periods during which the estimate or assumption changes. The most significant components for which management discretion has been applied concern the amounts of reserves, compiling the impairment testing and the assumptions used therein, determining the terms of leases as well as determining the fair values of the financial assets and debts. Revenue recognition principles Revenue is recognised in an amount that reflects the consideration to which the Group expects to be entitled in exchange for those goods or services. The Group’s performance obligations consist of the delivery of local fuels, such as peat, pellets and forest fuels as well as added value services related to energy production. The Group also supplies heat and electricity and provides plant operation services for customers. For the customers of gardening products, the Group sells growing media, mulches and fertilisers. The recognition of revenue from product sales is based on delivery and the transfer of control to the customer, i.e. when the customer has the ability to direct the use of the product and obtain the benefit associated with it. Revenue from services is recognised over time as the customer receives the benefit from the service as it is produced. Revenue from short-term services is recognised when the service has been completed. The amount of consideration recognised as revenue takes into account all variable consideration, such as discounts.

35
Interest income is entered according to the effective interest method and dividend income when there is a right to the dividend. Transactions denominated in foreign currency Figures concerning the result and financial status of the Group’s units are defined in the currency that is the currency in each unit’s main operational environment (hereinafter referred to as the “functional currency”). The consolidated financial statements are presented in euros, which is the parent company’s functional and presentation currency. Transactions in foreign currencies are translated into the functional currency using the foreign exchange rate prevailing on the transaction date. Monetary items are translated into functional currency using the exchange rates prevailing on the balance sheet date. Profits and losses arising from transactions denominated in foreign currency and translation of monetary items have been treated through the profit and loss account. The exchange rate gains and losses of business operations are included in financial income and expenses. Conversion of foreign Group company financial statements The income and expense items on the comprehensive income statements and separate income statements of foreign subsidiaries are converted to euros using the average exchange rate for the period and the balance sheets are converted using the exchange rate on the closing date. The average exchange rate difference arising from the different exchange rates used for the income statement, comprehensive income statement and balance sheet creates a translation difference recognised in equity. The change in the translation difference is recognised in other comprehensive income. Translation differences arising from the elimination of the acquisition cost of foreign subsidiaries and the translation of equity items accrued after the acquisition are recognised in other comprehensive income. When a subsidiary is sold as a whole or in part, the conversion differences gained are transferred through profit and loss as a part of gains or losses on sale. Research and development expenditure Research expenses are entered as expenditure for the accounting period in which they are incurred. Development expenses from the design of new or significantly improved products are capitalised as intangible assets on the balance sheet once the expenses of the development phase can be calculated reliably, once the product can be utilised technically and commercially, once the Group expects the product to generate a likely future financial benefit, and once the Group has both the intention and resources to complete the development work. Goodwill Goodwill arising from the acquisition of a company is the difference between the acquisition cost and the acquired, individualised net assets measured at fair value. Goodwill is assigned to cash flow generating units and is tested annually for impairment. In the case of associates, goodwill is incorporated into the value of the associate investment. If the said goodwill can be seen to be associated with the funds or other intangible rights of the acquired associate, it is depreciated over its useful life. Goodwill is valued at the original acquisition cost less impairment. Other intangible assets An intangible asset is entered on the balance sheet at the original acquisition cost if it can be reliably defined, and it is likely that the corresponding economic benefit expected will profit the Group. Other intangible assets include patents, copyright, trademarks, software licences and customer

36
relationships. They are valued at the original acquisition cost and depreciated using straight line depreciation over their estimated economic life, which can vary from 5 to 25 years. Tangible fixed assets Tangible fixed assets acquired by Group companies are measured at the original acquisition cost. The tangible fixed assets of acquired subsidiaries are measured at the fair value at the time of acquisition. Tangible fixed assets are presented on the balance sheet at the acquisition cost less accumulated depreciation and impairment losses. If a fixed asset consists of a number of parts with differing economic lives, the parts are treated as separate assets. Depreciation is based on the following expected economic lives: Buildings and structures 15–40 years Machinery and equipment 3–25 years Other tangible assets 5–30 years No depreciation is recorded on land areas; peat assets are depreciated by substance depreciation over their estimated economic life. Ordinary repair and maintenance expenses are entered as expenditure during the accounting period in which they are incurred. Expenses for significant renewal and improvement projects are entered on the balance sheet if it is likely that they will increase the economic benefit accrued by the company. Profits and losses arising from the sale and disposal of tangible fixed assets are calculated as the difference between the net income received and the carrying amounts. Gains and losses on sales are included in the profit and loss statement under operating profit. When a fixed asset is classified as held for sale according to IFRS 5 Non-current Assets Held for Sale and Discontinued Operations, depreciation is no longer recorded. Peat assets The peat assets relating to Vapo’s peat division are included under tangible assets on the balance sheet. Depreciation of peat assets is applied according to use. With regard to the acquisition of new production areas, a portion of the total purchase price that corresponds to the estimated volume of the peat assets is entered as an increase in peat assets. Costs arising from preparing peat production areas for production are treated as an addition to the acquisition cost of peat assets. The volume (m3) of peat assets in the Group’s production areas is monitored by measurement. Measurement results do not lead to changes in the carrying amounts, but the depreciation plan, which is based on volumes of planned use and remaining peat, is revised as necessary. Subsidies received Subsidies received from states or other organisations are entered as income in the profit and loss statement. Entries are made systematically, which means that subsidies are entered under the expenses which they are intended to cover. Subsidies granted for the acquisition of fixed assets are entered as deductions to the book values of fixed assets when it is reasonably certain that the subsidies will be received and the Group satisfies the conditions for eligibility for the subsidy. Subsidies are recognised as income according to the economic life of the asset. Impairments Carrying amounts of assets are assessed at the end of each reporting period in order to determine impairment. Key financial figures, official decisions, energy market changes and regulations as well

37
as the actions of competitors are monitored as factors which may suggest a need to adjust the value of assets. The impairment is examined at the level of cash flow generating units, i.e. at the lowest unit level, since this is largely independent of other units and the cash flows can be separated. The impairment is calculated by comparing the carrying amount of the item with the recoverable value of the corresponding assets. As a rule, the recoverable value is based on the future discounted net cash flow obtainable with the aid of the corresponding asset. In order to determine a possible impairment of peat production areas, Vapo Group monitors factors affecting the income-generating capacity of these areas. These include the volume of peat and its thermal content, the logistical location of the peatland, its geographical conditions, the environmental permit process, the acquisition price, the preparation cost and the stage of the life cycle. Pension liabilities Pension plans are classified as defined benefit and defined contribution plans. Contributions to
defined contribution plans are recognised in the income statement in the financial period to which
they relate to. The statutory pension security of the Group’s Finnish companies is arranged with
Finnish pension insurance companies. The statutory employment security is a defined contribution
plan.
Defined benefit plans are based on defining the pension benefit the employee will receive upon
retirement. The size of the benefit depends on factors such as age, years of employment and pay.
Current service cost is the present value of the post-employment benefit, which is earned by the
employees during the financial year and recognised in personnel expenses. The liability recognised in
the balance sheet in respect of defined benefit pension plans is the present value of the defined
benefit obligation at the end of the reporting period less the fair value of plan assets. The discount
rate used in the calculation of the present value of the obligation is based on the average interest
rates of long-term government bonds in the euro zone.
The Group’s Estonian subsidiary AS Tootsi Turvas has defined contribution pension plans as well as
a defined benefit pension plan under which the company is obligated to pay a fixed pension to 17
employees under pre-specified conditions. The average gross monthly wage in Estonia in 2001 is the
basis of the benefit. This sum is adjusted annually in accordance with the change in the cost-of-living
index and factors related to the person’s employment relationship. The liability to pay the pension
benefit arises when the employee entitled to the benefit turns 65. The liability is discounted on the
basis of the estimate that the liability will continue until 2042, considering the statistical life
expectancy. Of the provision, EUR 0.3 million has been transferred to Nevel OÜ.
Inventories Inventories have been valued at the lower of acquisition cost and net realisable value. The net realisable value is the estimated selling price obtainable in ordinary business activities less estimated expenses arising from the preparation and implementation of the transaction. The value of inventories has been determined using the FIFO method and it includes all expenses arising from the acquisition as well as other indirect allocable expenses. The acquisition cost of manufactured inventories includes not only the cost of purchasing materials, direct labour and other direct costs, but also the share of general costs corresponding to the normal production level, excluding the costs of general administration, sales and financing. Peat production inventories include the sales stock of peat, i.e. the volume of peat extracted in the summer. The exception to the use of FIFO valuation is peat

38
produced in stacks, which is valued at the average price per stack. The value of inventories has been depreciated with respect to non-marketable assets. Cash assets Cash assets consist of cash funds, short-term bank deposits and other short-term highly liquid money market investments which have a maximum maturity of three months. Financial assets Financial assets are classified in the following groups in accordance with IFRS 9: financial assets recognised at amortised cost and financial assets recognised at fair value through profit or loss. The classification is based on the target of the business model and the contractual cash flows of investments or by applying the fair value option at the time of initial acquisition. Transaction expenses are included in the original book value of the financial assets for items that are not measured at fair value through profit or loss. All purchases and sales of financial assets are entered on the day of the sale, which is the day on which the Group commits to purchasing or selling the financial instrument. Derecognition of a financial asset from the balance sheet takes place when the Group has lost the contractual right to cash flow or when it has transferred a significant part of the risks and profits outside the Group. Financial assets recognised at amortised cost include financial assets for which the target of the business model is to hold the financial assets until maturity to collect contractual cash flows. The cash flows of such assets consist solely of the principal and the interest on the remaining principal. The Group’s financial assets recognised at amortised cost include trade receivables and other receivables that are assets not classified as derivatives. The carrying amount of current trade receivables and other receivables is considered to be equal to their fair value. Trade receivables and other receivables are presented on the balance sheet as current assets if they are expected to be realised within 12 months of the end of the reporting period. After initial measurement, the value of these financial assets is measured at amortised cost using the effective interest method and deducting impairment, if any. The Group recognises a loss allowance for expected credit losses on financial assets recognised at amortised cost. Expected credit losses are presented in the income statement under other expenses. Impairment losses are also recognised in other expenses in the income statement. For trade receivables, expected credit losses are estimated using the simplified approach described in IFRS 9, which means that the credit losses are recognised at an amount equal to lifetime expected credit losses. Expected credit losses are estimated based on historical data on previous credit losses and the model also takes into account the information on future economic circumstances available at the time of the assessment. The Group records a credit loss on trade receivables when there is objective evidence that the receivable will not be collected in full. A debtor being in significant financial difficulties, probable bankruptcy, delinquent payments, or payments that are more than 90 days overdue constitute evidence of probable credit loss.

39
Financial assets measured at fair value through profit or loss consist of financial assets acquired to be held for trading or classified upon initial recognition as being measured at fair value through profit or loss. Financial assets held for trading are acquired primarily for the purpose of earning a profit in the short or long term and they are presented in either long-term financial assets or current financial assets. Realised and unrealised gains and losses from fair value changes are recognised through profit or loss. If there are no quoted prices for the investments, the Group applies various valuation methods in their measurement. On the financial statements date, the Group had no financial assets measured at fair value through profit or loss. Financial liabilities Financial liabilities are initially recorded at fair value. Transaction costs related to financial liabilities are recorded as expenses. Financial liabilities, excluding derivative liabilities, are subsequently measured at amortised cost. Financial liabilities are included in non-current and current liabilities. Financial liabilities are classified as current if the Group does not have an absolute right to postpone the repayment of the debt at a minimum of 12 months after the closing date of the reporting period. Derivative instruments and hedge accounting All derivatives are measured and recorded at fair value on the transaction and closing date. Fair value measurement is based on quoted market prices. The Group does not apply hedge accounting. Realised and unrealised gains and losses from derivative instruments are recorded in the financial items of the statement of income. Emission rights The principles of emission right calculation are based on valid IFRS standards. Emission rights are intangible rights measured at cost. Emission rights received without consideration are measured at nominal value, meaning that their value is nil. A provision for fulfilling the obligation to return the emission rights is recorded if the emission rights received without consideration are not sufficient to cover the actual amount of emissions. Therefore, the possible impact on the result is the difference between actual emissions and emission rights received. Provisions and contingent liabilities A provision is entered on the balance sheet if the Group has a legal or factual obligation as a result of a previous event and it is probable that fulfilling the obligation requires payment or results in an economic loss and the amount of the liability can be reliably estimated. The amount of provisions is adjusted at each closing date, and their amounts are adjusted to reflect the best estimate at the time of review. Adjustments to provisions are recognised in the same item of the income statement in which they were initially recognised. Provisions may be related to restructuring of functions, loss-making agreements as well as environmental and pension liabilities. Provision for environmental liabilities A provision for environmental liabilities is recognised whenever the Group has an obligation based on environmental legislation and the Group’s principles of environmental liability that is related to the decommissioning of a production plant, clean-up of environmental damage or transfer of equipment from one place to another. Starting peat production in a mire area requires an environmental permit. The permit specifies, among other things, the clean-up measures in the area after the end of peat production. In order to prepare for the clean-up measures, Vapo Group accumulates provisions varying annually on the basis of the production volume; for leased land areas it is recognised in the

40
income statement as an expense, and the amount of the provision on the balance sheet is accumulated at the same time. The corresponding provision for company-owned land is recognised in fixed assets as an acquisition cost of other tangible assets. For leased land areas, the provision is cancelled by recognising it as an expense in the income statement annually on the basis of the actual costs incurred from clean-up measures and, for company-owned land, the cancellation of the provision is recorded as depreciation. Other provisions Other provisions include the liability to compensate for permanent health damage recognised in AS Tootsi Turvas as well as the provision recognised in AS Tootsi Turvas for the costs of closing down the briquette plant. Lease agreements Accounting policy applied to leases during the reporting period The Group leases land and buildings as well as machinery and equipment. At the commencement date, the Group assesses whether a contract is, or contains, a lease. A lease is a contract, or a component of a contract, that conveys the right to use an asset for a period of time in exchange for consideration. At the commencement date, the Group separates a contract’s lease component and non-lease component. The lessee recognises the lease on the balance sheet at the commencement date as a right-of-use asset and a corresponding lease liability. The right-of-use asset is initially measured at cost. The cost comprises the amount of the initial measurement of the lease liability adjusted by any lease payments made at or before the commencement date, any lease incentives received, any initial direct costs incurred by the lessee and an estimate of costs to be incurred by the lessee from restoring the underlying asset to the condition required by the terms and conditions of the lease. The right-of-use asset is depreciated over the lease term. The lease liability is initially measured at the present value of the lease payments that are not paid at that date, discounted using the interest rate implicit in the lease or, if that rate cannot be readily determined, using the lessee’s incremental borrowing rate. The lease liability is measured at amortised cost using the effective interest method. The lease payments included in the lease liability are fixed or variable payments that depend on an index or rate. Options to extend leases are included in the lease term if it is reasonably certain that they will be exercised.
The Group applies two recognition exemptions permitted by the standard: leases with a lease term of 12 months or less and leases for which the underlying asset is of low value are not recognised in the balance sheet. The lease payments associated with such leases are recognised as an expense on a straight-line basis over the lease term.
Accounting policy applied to leases during the comparison period Lease agreements concerning property, plant and equipment in which an essential part of the risks and benefits of ownership is transferred to the Group are classified as financial leases. An asset obtained through a financial lease is recognised as an asset in the balance sheet at the beginning of

41
the lease period at the lower of the fair value of the object of the lease or current value of minimum rents. Assets leased through financial leases are amortised over the shorter of economic useful life or duration of the lease. Paid leasing rents are divided into financial expenses and repayment of debt. The corresponding leasing rent liabilities are recognised in interest-bearing liabilities as current and non-current liabilities. Lease agreements concerning property, plant and equipment in which an essential part of the risks and benefits of ownership remain with the lessor are classified as other leases. Rents determined on the basis of other leases are recognised as expenses in the income statement. Taxes and deferred taxes based on the taxable income for the period Tax expenses comprise taxes based on the taxable income for the period and deferred tax. Taxes are recognised through profit or loss, except if they are related to items recognised in shareholders’ equity or other items of comprehensive income. In this case, the tax is also recognised under these items. The tax based on the taxable income for the period is calculated on the basis of taxable income in accordance with the tax rate valid in each country. Deferred taxes are calculated on all temporary differences between accounting and taxation using the tax rates in force at the closing date. Deferred tax is recognised in the case of investments in subsidiaries or associates, except if the Group is able to determine the time the temporary difference will be eliminated and the temporary difference will probably not be eliminated during the foreseeable future. The most substantial temporary differences arise from appropriations, measurement of the net assets of acquisitions at fair value through profit or loss, measurement of financial assets at fair value through profit or loss, unused tax losses and internal margins. Deferred tax receivables are recognised up to the probable amount of taxable income in the future against which the temporary difference can be utilised. The conditions for recognising a deferred tax liability are estimated in this respect on each closing date of a reporting period. The Group offsets deferred tax assets and liabilities if they are related to the same taxpayer and the same tax collector and the deferred tax liabilities are higher than the deferred tax assets. Non-current assets held for sale and discontinued operations A non-current asset (or a disposal group) as well as assets and liabilities associated with a discontinued operation are classified as held for sale if their carrying amount will be recovered principally through a sale transaction rather than through continuing use. The recognition criteria are regarded to be met when: a sale is highly probable, the asset (or a disposal group) is available for immediate sale in its present condition subject only to terms that are usual and customary, the management is committed to the plan to sell the asset and the sale is expected to take place within one year from the date of classification. Immediately before the initial classification of the asset or disposal group as held for sale, the assets and liabilities will be measured in accordance with applicable IFRS standards. After classification as held for sale, assets (or disposal groups) are measured at the lower of the carrying amount or fair value less selling costs. Depreciation of these assets will be discontinued upon classification. Assets included in disposal groups that do not fall within the scope of application of the measurement rules of IFRS 5 and liabilities are measured in accordance with the applicable IFRSs also after classification. Operating profit
IAS 1 Presentation of Financial Statements does not give a definition for operating profit. The Group has specified it as follows: operating profit is the net of turnover and other operating income,

42
acquisition costs adjusted for change in inventories of finished goods and work in progress and costs of production for own use, employee benefit expense, depreciation and any impairment losses and other operating expenses. All income statement items other than the above are presented below operating profit. Application of upcoming IFRS standards and IFRIC interpretations
New or revised standards are not estimated to have an impact on Vapo Group’s financial statements.
Updating the calculation practices concerning substance depreciation in peat production
The Group depreciates the acquisition cost of peatland peat mass and production preparations using the substance depreciation method. The Group updated its calculation practices concerning substance depreciation effective from 1 May 2019 to better take into account the amount of commercially available peat. The adoption of the new calculation practices is estimated to increase annual depreciation by approximately EUR 3–3.5 million. The estimated effect of change to this accounting period 1.5.-31.12.2019 is EUR 3.8 million.The change has not been retrospectively applied to the comparison period because the change in the calculation practices represents a change in estimates.
Measurement of the non-controlling interest Any non-controlling interest in an acquiree is measured either at fair value or at the non-controlling interest’s proportionate share of the acquiree’s identifiable net assets. The measurement principle is determined separately for each acquisition.
2. Segment information
The Group’s operating segments consist of the business divisions in accordance with Vapo’s management model. Energy The Energy division is responsible for the energy and fuel solutions provided by the Group in Finland, Sweden and Estonia. The Group provides energy producers with peat, wood and pellet fuels as well as the most advanced remote operation services in the industry. For industrial and municipal customers, the Group produces heat and steam as a service at six power plants and approximately 150 heating plants. Consumer customers are supplied with with district heating in more than 35 district heating networks. Pellets are also sold via an online shop. Approximately half of the division’s turnover came from renewable biofuels and energy solutions.
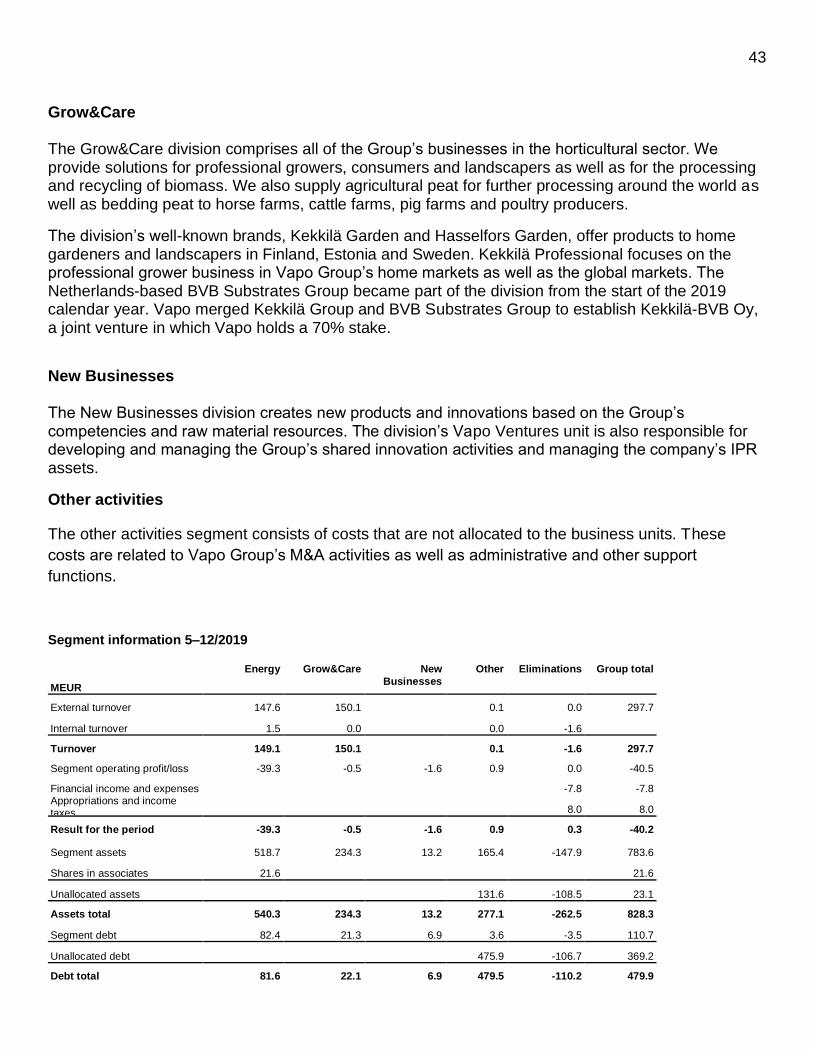
43
Grow&Care The Grow&Care division comprises all of the Group’s businesses in the horticultural sector. We provide solutions for professional growers, consumers and landscapers as well as for the processing and recycling of biomass. We also supply agricultural peat for further processing around the world as well as bedding peat to horse farms, cattle farms, pig farms and poultry producers.
The division’s well-known brands, Kekkilä Garden and Hasselfors Garden, offer products to home gardeners and landscapers in Finland, Estonia and Sweden. Kekkilä Professional focuses on the professional grower business in Vapo Group’s home markets as well as the global markets. The Netherlands-based BVB Substrates Group became part of the division from the start of the 2019 calendar year. Vapo merged Kekkilä Group and BVB Substrates Group to establish Kekkilä-BVB Oy, a joint venture in which Vapo holds a 70% stake.
New Businesses The New Businesses division creates new products and innovations based on the Group’s competencies and raw material resources. The division’s Vapo Ventures unit is also responsible for developing and managing the Group’s shared innovation activities and managing the company’s IPR assets.
Other activities
The other activities segment consists of costs that are not allocated to the business units. These
costs are related to Vapo Group’s M&A activities as well as administrative and other support
functions.
Segment information 5–12/2019
MEUR
Energy Grow&Care New
Businesses
Other Eliminations Group total
External turnover 147.6 150.1 0.1 0.0 297.7
Internal turnover 1.5 0.0 0.0 -1.6
Turnover 149.1 150.1 0.1 -1.6 297.7
Segment operating profit/loss -39.3 -0.5 -1.6 0.9 0.0 -40.5
Financial income and expenses -7.8 -7.8 Appropriations and income taxes 8.0 8.0
Result for the period -39.3 -0.5 -1.6 0.9 0.3 -40.2 Segment assets 518.7 234.3 13.2 165.4 -147.9 783.6
Shares in associates 21.6 21.6
Unallocated assets 131.6 -108.5 23.1
Assets total 540.3 234.3 13.2 277.1 -262.5 828.3
Segment debt 82.4 21.3 6.9 3.6 -3.5 110.7
Unallocated debt 475.9 -106.7 369.2
Debt total 81.6 22.1 6.9 479.5 -110.2 479.9

44
Investments 25.2 11.3 7.1 1.7 -2.5 42.8
Depreciation 25.1 11.9 0.0 1.5 0.0 38.5
Segment information 5/2018–4/2019
MEUR Energy Grow&Care New
Businesses
Other Eliminations Group total
External turnover 281.7 178.9 0.2 0.0 460.8
Internal turnover 7.6 0.1 0.0 -7.8
Turnover 289.4 179.0 0.2 -7.8 460.8
Segment operating profit/loss 33.2 13.0 -2.2 -4.2 -6.5 33.3
Financial income and expenses -2.8 -2.8 Appropriations and income taxes -5.3 -5.3
Result for the period 33.2 13.0 -2.2 -4.2 -14.7 25.1 Segment assets 526.7 257.4 6.1 142.3 -164.5 768.1
Shares in associates 19.4 0.4 19.8
Unallocated assets 47.9 -30.0 17.9
Assets total 546.1 257.8 6.1 190.2 -194.5 805.8
Segment debt 41.0 28.7 1.7 2.2 -1.4 72.2
Unallocated debt 371.1 -41.7 329.4
Debt total 41.0 28.7 1.7 373.3 -43.0 401.6 Investments 27.3 4.8 3.1 129.4 -101.9 62.7
Depreciation 31.7 8.9 0.0 0.6 -0.0 41.2
Geographical information
EUR 1,000 Turnover by
country Long-term
assets Investments
Finland 156,890 422,713 27,550
The Netherlands 42,064 43,315 7,187
Sweden 39,963 44,990 5,207
Germany 11,367 - 44
Estonia 6,799 29,165 2,774
Other Nordic countries 2,960 - -
Other European countries 23,710 678 -

45
North and South America 5,641 - -
Other countries 8,356 - -
Group total 297,748 540,860 42,761
Turnover consists almost entirely of the sale of goods. Service sales are minor in amount.
3. Acquisitions
No acquisitions were made during the financial year 1 May 2019–31 December 2019.
The transaction announced in October 2018 with the Netherlands-based BVB Substrates was finalised during the comparison period 1 May 2018–30 April 2019. The company created by the merger, Kekkilä-BVB Oy, is the European leader in professional growing media and amateur gardening products, and it exports products to more than 80 countries. As a result of the acquisition, the Grow&Care division’s turnover will represent nearly half of Vapo Group’s total turnover in the future. Kekkilä-BVB Oy is included in the consolidated financial statements effective from 1 January 2019.
Vapo Oy acquired 70% of Kekkilä-BVB Oy’s shares and transferred as consideration a non-controlling interest of 30% to Nielson Belegging en Beheer B.V. The combination was carried out by establishing a new company, Kekkilä-BVB Oy, to which Vapo Oy transferred all Kekkilä Oy shares and the Dutch company Nielson Belegging en Beheer B.B. all BVB Substrates B.V. shares. Vapo has control over the joint venture through its direct 70% ownership and by holding the majority of the votes.
Recorded values
EUR 1,000 5/2018–4/2019
Tangible fixed assets 12,578
Trademarks 6,036
Customer contracts and related customer relationships 19,801
Other intangible fixed assets 46
Shares in entities consolidated using the equity method 30
Other long-term financial assets 112
Inventories 15,277
Sales and other receivables 15,596
Cash and cash equivalents 1,747
Assets total 71,223
Deferred tax liability 6,689
Pension liabilities
Financial liabilities 13,587
Contingent liabilities 9,821
Other liabilities 1,452

46
Debt total 31,549
Net assets 39,674
Acquisition cost 42,711
Attributable to non-controlling interests 18,034
Net assets acquired 39,674
Goodwill 21,071
The acquisition price was EUR 42.1 million and it was paid by transferring Kekkilä Oy shares valued at EUR 18.7 million, a cash consideration of EUR 23.1 million and by writing off a mutual receivable of EUR 0.2 million. Kekkilä BVB Oy’s fair value was measured using revenue-based and market-based methods in accordance with IFRS 13 Fair Value Measurement. The measurement of fair value was largely based on inputs that are not available from observable markets (level 3). The non-controlling interest is measured in accordance with IFRS at a market price (=NCI fair value) of EUR 18 million. This resulted in goodwill of EUR 21.1 million. This choice of IFRS measurement will have an impact on the recognition of potential subsequent ownership arrangements related to the acquisition. The goodwill of EUR 21.1 million created by the acquisition consists of the combination of business operations, synergies and new market area opportunities. The goodwill recognised on the acquisition is not tax-deductible. The costs associated with the acquisition totalled EUR 1.8 million and they are recognised as other expenses in the income statement.
4. Other operating income
EUR 1,000 5–12/2019 5/2018–4/2019
Rental revenue 388 396
Grants and public subsidies -11 135
Other non-recurring income 3
Other operating income 8,582 2,140
Gains on the sale of tangible assets 3,720 4,872
Other operating income 12,680 7,547
5. Materials and services

47
EUR 1,000 5–12/2019 5/2018–4/2019
Purchases during the period -106,287 -145,618
Increase/decrease in inventories 6,793 5,083
External services -82,608 -99,154
Materials and services -182,102 -239,689
6. Expenses arising from staff benefits
EUR 1,000 5–12/2019 5/2018–4/2019
Salaries and fees -34,913 -42,954
Pension expenses, defined contribution -5,244 -6,471
Voluntary pensions -510 -632
Pension expenses -5,754 -7,103
Other fixed personnel expenses -4,074 -5,449
Expenses arising from staff benefits -44,740 -55,507
Management salaries and fees
Salaries and other short-term employment benefits 1,316 1,392
Total 1,316 1,392
Salaries and fees
CEO 394 414
Members of the Board of Directors 167 250
Members of the Supervisory Board 12 19
Management salaries, fees and fringe benefits total 574 683
The company publishes a separate corporate governance statement and remuneration statement annually. The reports
are available on the company’s website at www.vapo.com.
Employees, average
5–12/2019 5/2018–4/2019
Energy 366 370
Grow&Care 547 380
New Businesses 19 16
Other 117 103
Total 1,050 869

48
7. Depreciation and impairment
Depreciation
EUR 1,000 5–12/2019 5/2018–4/2019
Intangible rights -2,463 -2,746
Other intangible assets -230 -350
Goodwill 0 0
Land areas -999 0
Buildings and structures -5,624 -4,036
Machinery and equipment -21,438 -18,677
Other tangible assets -7,775 -15,519
Total -38,528 -41,327
Impairment
EUR 1,000 5–12/2019 5/2018–4/2019
Goodwill -1,995
Intangible rights -75
Other intangible assets -33
Buildings -13
Machinery and equipment -4,816 -18
Other tangible assets -29,972 -175
Total -36,904 -193
Depreciation and impairment total -75,432 -41,687
8. Other operating expenses and auditor’s fees
EUR 1,000 5–12/2019 5/2018–4/2019
Rents -1,760 -10,421
Cost of sales freight -38,253 -53,807
Losses on the sale and scrapping of tangible assets -973 -1,175
Change in credit loss provision -196 -208
Auditor’s fees: actual audit -355 -225
Auditor’s fees: attestations and statements -27 -9
Auditor’s fees: other expert services -71 -80
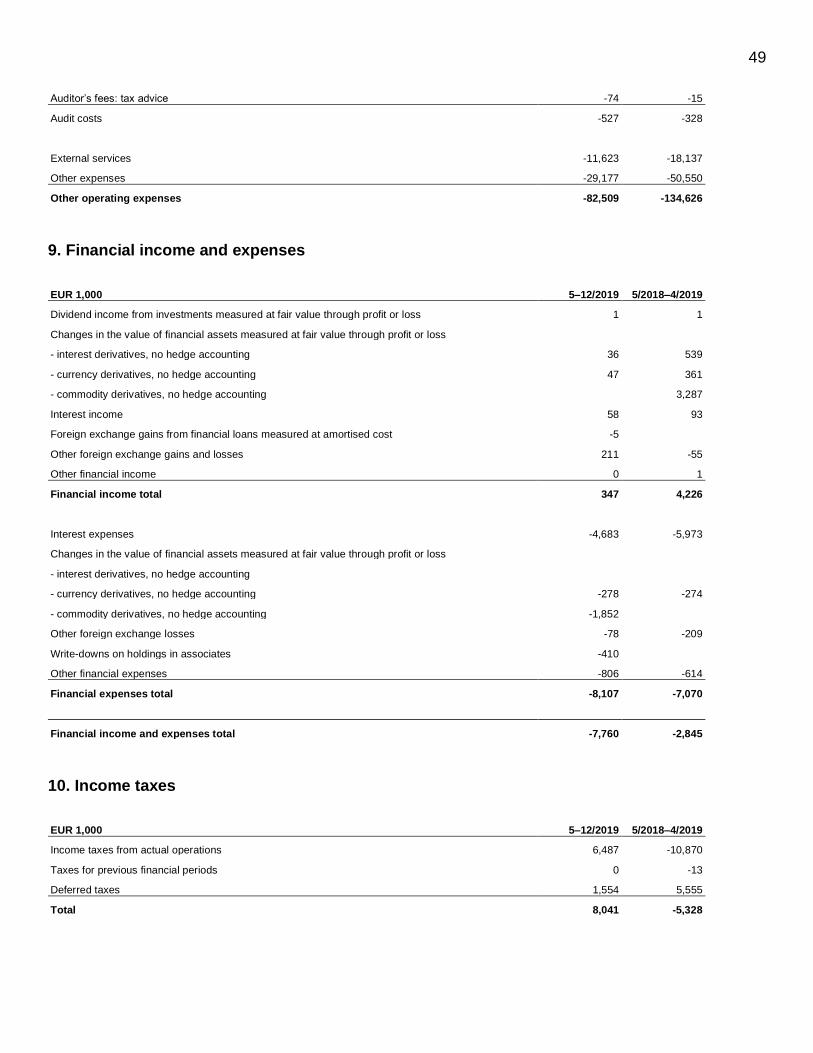
49
Auditor’s fees: tax advice -74 -15
Audit costs -527 -328
External services -11,623 -18,137
Other expenses -29,177 -50,550
Other operating expenses -82,509 -134,626
9. Financial income and expenses
EUR 1,000 5–12/2019 5/2018–4/2019
Dividend income from investments measured at fair value through profit or loss 1 1
Changes in the value of financial assets measured at fair value through profit or loss
- interest derivatives, no hedge accounting 36 539
- currency derivatives, no hedge accounting 47 361
- commodity derivatives, no hedge accounting 3,287
Interest income 58 93
Foreign exchange gains from financial loans measured at amortised cost -5
Other foreign exchange gains and losses 211 -55
Other financial income 0 1
Financial income total 347 4,226
Interest expenses -4,683 -5,973
Changes in the value of financial assets measured at fair value through profit or loss
- interest derivatives, no hedge accounting
- currency derivatives, no hedge accounting -278 -274
- commodity derivatives, no hedge accounting -1,852
Other foreign exchange losses -78 -209
Write-downs on holdings in associates -410
Other financial expenses -806 -614
Financial expenses total -8,107 -7,070
Financial income and expenses total -7,760 -2,845
10. Income taxes
EUR 1,000 5–12/2019 5/2018–4/2019
Income taxes from actual operations 6,487 -10,870
Taxes for previous financial periods 0 -13
Deferred taxes 1,554 5,555
Total 8,041 -5,328

50
Reconciliation of taxes
EUR 1,000 5–12/2019 5/2018–4/2019
Profit/loss before taxes -48,283 30,483
Deferred tax, parent company rate of 20% 9,657 -6,097
Effect of the different tax rates used in foreign subsidiaries 657 1,009
Effect of non-deductible items with the unit’s tax rate 9,095 2,039
Effect of non-deductible items with the unit’s tax rate -2,413 -2,255
Taxes for previous financial periods -8,955 -13
Unbooked deferred tax for losses of the financial period 0 -11
Total tax expense in the income statement 8,041 -5,328
On 31 December 2019, Vapo A/S had confirmed losses totalling EUR 7.2 million that have not been taken into account in
these financial statements. Vapo A/S was merged with Vapo Oy on 30 April 2019. The potential transfer of the losses to
Vapo Oy is pending a decision by the Administrative Court.
11. Intangible assets
EUR 1,000 Goodwill Intellectual
property rights
Other
intangible assets Prepayments Total
Cost 1 May 2019 31,326 58,265 8,353 3,674 101,618
Translation differences (+/-) 7 10 1 0 18
Acquisitions
Increase 648 47 1,097 1,791
Decrease -182 -252 -26 -334 -793
Transfers between items 1,049 -3 -1,037 8
Cost 31 December 2019 31,151 59,720 8,371 3,400 102,642
Accumulated depreciation and impairment 1 May
2019 -4,729 -27,959 -4,989 -37,677
Translation differences (+/-) -0 -8 -0 -8
Accumulated depreciation on acquisitions
Accumulated depreciation on decrease and transfers 62 11 73
Depreciation for the financial period -2,462 -230 -2,692
Impairment -1,995 -75 -33 -2,104
Accumulated depreciation and impairment 31
December 2019 -6,663 -30,493 -5,252 -42,408
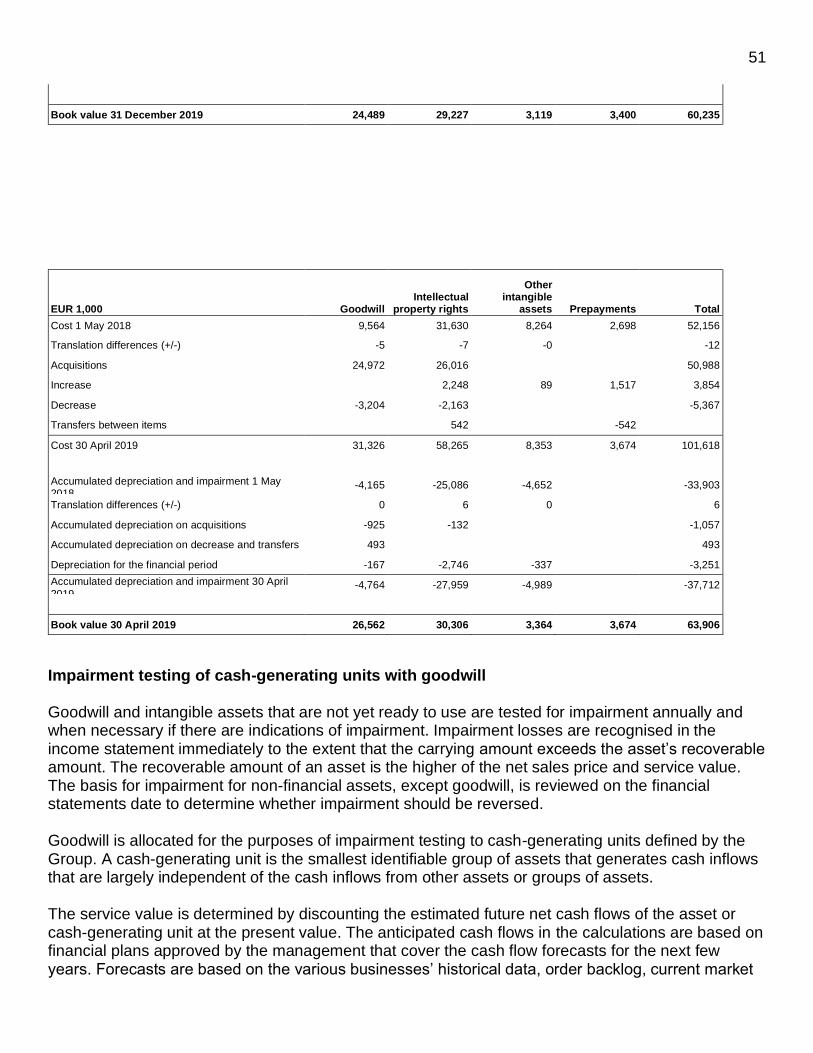
51
Book value 31 December 2019 24,489 29,227 3,119 3,400 60,235
EUR 1,000 Goodwill Intellectual
property rights
Other intangible
assets Prepayments Total
Cost 1 May 2018 9,564 31,630 8,264 2,698 52,156
Translation differences (+/-) -5 -7 -0 -12
Acquisitions 24,972 26,016 50,988
Increase 2,248 89 1,517 3,854
Decrease -3,204 -2,163 -5,367
Transfers between items 542 -542
Cost 30 April 2019 31,326 58,265 8,353 3,674 101,618
Accumulated depreciation and impairment 1 May 2018
-4,165 -25,086 -4,652 -33,903
Translation differences (+/-) 0 6 0 6
Accumulated depreciation on acquisitions -925 -132 -1,057
Accumulated depreciation on decrease and transfers 493 493
Depreciation for the financial period -167 -2,746 -337 -3,251
Accumulated depreciation and impairment 30 April
2019 -4,764 -27,959 -4,989 -37,712
Book value 30 April 2019 26,562 30,306 3,364 3,674 63,906
Impairment testing of cash-generating units with goodwill Goodwill and intangible assets that are not yet ready to use are tested for impairment annually and when necessary if there are indications of impairment. Impairment losses are recognised in the income statement immediately to the extent that the carrying amount exceeds the asset’s recoverable amount. The recoverable amount of an asset is the higher of the net sales price and service value. The basis for impairment for non-financial assets, except goodwill, is reviewed on the financial statements date to determine whether impairment should be reversed. Goodwill is allocated for the purposes of impairment testing to cash-generating units defined by the Group. A cash-generating unit is the smallest identifiable group of assets that generates cash inflows that are largely independent of the cash inflows from other assets or groups of assets. The service value is determined by discounting the estimated future net cash flows of the asset or cash-generating unit at the present value. The anticipated cash flows in the calculations are based on financial plans approved by the management that cover the cash flow forecasts for the next few years. Forecasts are based on the various businesses’ historical data, order backlog, current market

52
situation and information on the industry’s future growth prospects. The cash flows of the explicit forecast period correspond with the management’s views of the development of the profitability of different businesses and the effect of inflation on cash flows. Cash flows are expected to continue to follow the same trend after the explicit forecast period. As a rule, the calculation period for anticipated cash flow is five years. Cash flows after the calculation period are estimated according to a growth forecast of no more than 1 per cent, taking into account the country-specific differences of the business functions. The terminal growth rate applied for all cash-generating units is a maximum of one (1) per cent. The discount rate used by the Group is the business-specific weighted average cost of capital (WACC) after taxes, adjusted by the tax effect in connection with testing. The calculation components for the weighted average cost of capital are the risk-free return, market risk premium, industry-specific beta, the target capital structure, the cost of borrowed capital and other risks. Key assumptions applied in impairment testing and sensitivity analysis Preparing cash flow forecasts requires management estimates of future cash flows. The estimates and assumptions are based on the previous experience of the Group’s management and other factors. They also include reasonable expectations concerning future events. The nature of the estimates depends on the business area the assets being tested are part of. The estimates and assumptions used are continuously reviewed. The Group monitors changes in estimates and assumptions and the factors influencing estimates and assumptions by using several internal and external sources of information. Potential changes to estimates and assumptions are taken into account in the financial periods during which the estimate or assumption changes. In addition to goodwill testing based on basic assumptions, separate sensitivity analyses were conducted for each cash-generating unit. The key variables in impairment testing are change in cash flow (+/- 5%), change in sales (+/- 5%) and change in discount rate (+/- 1 percentage points). Goodwill impairment testing Goodwill is allocated to cash-generating units (CGU). In accordance with Vapo’s management structure, the CGUs are the operating segments. Goodwill is allocated to the following cash-generating units: Neova AB and Tootsi Turvas AS as part of the Energy segment and the Kekkilä-BVB subgroup as part of the Grow&Care segment. A summary of the allocation of goodwill and the weighted averages of the discount rates used is presented in the table below. During the financial year 1 May 2019–31 December 2019, impairment of EUR 1.2 million was recognised on the goodwill allocated to the Energy segment and impairment of EUR 0.8 million was recognised on the goodwill allocated to the Grow&Care segment. No impairment was allocated to goodwill or intangible rights during the financial year 1 May 2018–30 April 2019. In estimating the cash-generating units, according to the management’s estimates, no foreseen change in any of the variables used in sensitivity analyses would lead to a situation in the other segments where a unit’s recoverable amount would be lower than its carrying amount.

53
Allocation of goodwill to cash-generating units:
EUR 1,000 WACC 31 Dec. 2019 WACC 30 Apr. 2019
Energy 6.7% 366 5.7% 1,665
Grow&Care 5.3% 24,109 5.5% 24,897
Other 4.3% 0 4.3% 0
Total 24,475 26,562
12. Tangible fixed assets
EUR 1,000 Land and water
areas Buildings
and structures Machinery and
equipment
Other tangible
assets
Prepayments
and unfinished
acquisitions Total
Cost 1 May 2019 38,034 89,846 409,561 434,756 23,618 995,815
IFRS 16 acquisition cost 1 May 2019 10,422 30,316 4,534 45,272
Translation differences 44 275 1,137 1,143 53 2,652
Acquisition of subsidiaries
Increase 1,560 4,301 34,025 18,626 19,681 78,192
Decrease -2,398 -3,694 -25,929 -19,392 -4,188 -55,600
Transfers between items -13 512 8,300 3,819 -14,422 -1,804
Cost 31 December 2019 47,648 121,556 431,628 438,953 24,743 1,064,528
Accumulated depreciation and impairment 1 May 2019
-972 -50,339 -274,464 -213,743 -539,518
Translation differences (+/-) -140 -825 -604 -1,570
Accumulated depreciation on decrease and transfers
144 -523 1,755 1,376
Transfer to long-term assets held for sale 453 453
Depreciation for the financial period -999 -5,624 -21,438 -7,774 -35,835
Impairment* -13 -4,817 -29,971 -34,801
Accumulated depreciation and impairment 31 December 2019
-1,519 -55,972 -302,067 -250,338 -609,895
Book value 31 December 2019 46,129 65,584 129,561 188,616 24,743 454,633
EUR 1,000 Land and water
areas Buildings
and structures Machinery and
equipment
Other tangible
assets
Prepayments
and unfinished
acquisitions Total
Cost 1 May 2018 41,340 87,160 363,016 417,406 24,297 933,220
Translation differences -27 -189 -792 -816 -32 -1,856
Acquisition of subsidiaries 467 238 30,652 9,461 40,818
Increase 125 4,832 8,690 1,053 25,085 39,785
Decrease -3,871 -3,302 -2,368 -4,286 -1,067 -14,895
Transfers between items 1,106 10,364 11,939 -24,665 -1,257
Cost 30 April 2019 38,034 89,845 409,562 434,756 23,618 995,816
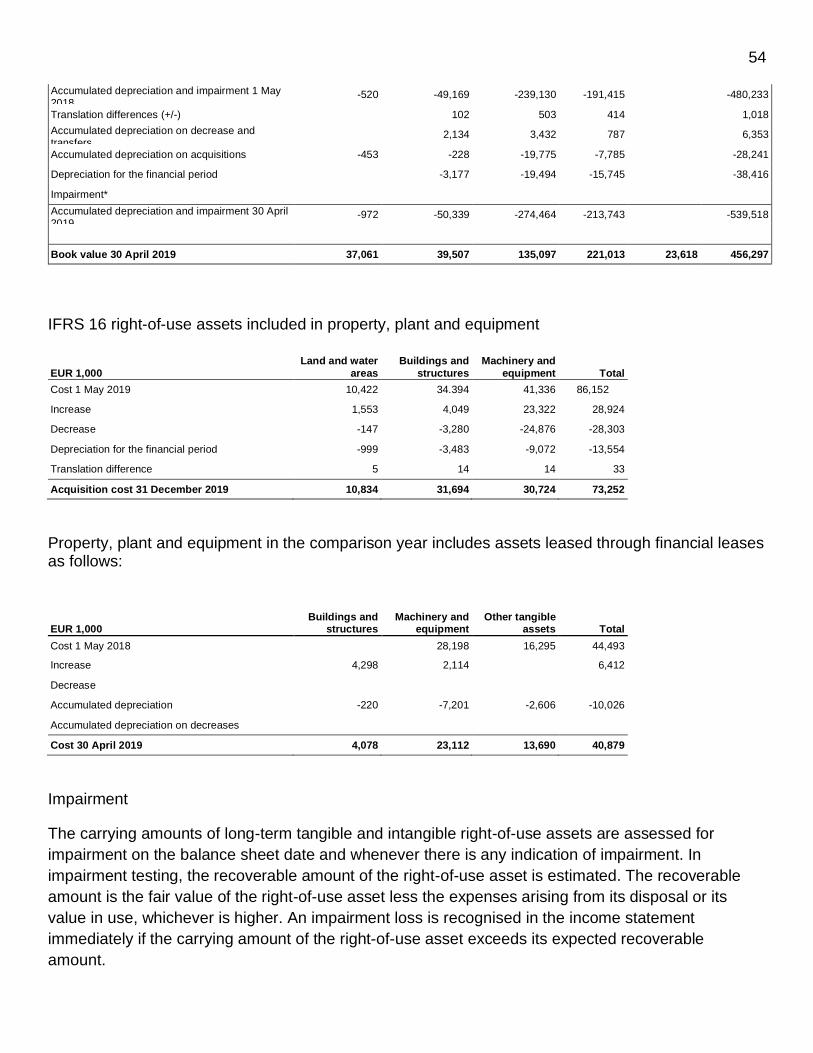
54
Accumulated depreciation and impairment 1 May 2018
-520 -49,169 -239,130 -191,415 -480,233
Translation differences (+/-) 102 503 414 1,018
Accumulated depreciation on decrease and transfers
2,134 3,432 787 6,353
Accumulated depreciation on acquisitions -453 -228 -19,775 -7,785 -28,241
Depreciation for the financial period -3,177 -19,494 -15,745 -38,416
Impairment*
Accumulated depreciation and impairment 30 April 2019
-972 -50,339 -274,464 -213,743 -539,518
Book value 30 April 2019 37,061 39,507 135,097 221,013 23,618 456,297
IFRS 16 right-of-use assets included in property, plant and equipment
EUR 1,000
Land and water
areas
Buildings and
structures
Machinery and
equipment Total
Cost 1 May 2019 10,422 34.394 41,336 86,152
Increase 1,553 4,049 23,322 28,924
Decrease -147 -3,280 -24,876 -28,303
Depreciation for the financial period -999 -3,483 -9,072 -13,554
Translation difference 5 14 14 33
Acquisition cost 31 December 2019 10,834 31,694 30,724 73,252
Property, plant and equipment in the comparison year includes assets leased through financial leases as follows:
EUR 1,000 Buildings and
structures Machinery and
equipment Other tangible
assets Total
Cost 1 May 2018 28,198 16,295 44,493
Increase 4,298 2,114 6,412
Decrease
Accumulated depreciation -220 -7,201 -2,606 -10,026
Accumulated depreciation on decreases
Cost 30 April 2019 4,078 23,112 13,690 40,879
Impairment
The carrying amounts of long-term tangible and intangible right-of-use assets are assessed for
impairment on the balance sheet date and whenever there is any indication of impairment. In
impairment testing, the recoverable amount of the right-of-use asset is estimated. The recoverable
amount is the fair value of the right-of-use asset less the expenses arising from its disposal or its
value in use, whichever is higher. An impairment loss is recognised in the income statement
immediately if the carrying amount of the right-of-use asset exceeds its expected recoverable
amount.

55
Impairment recognised on a right-of-use asset is cancelled in the event of a material change in the
estimates used to determine the recoverable amount. The value of the right-of-use asset following
such cancellation of impairment cannot exceed the value that the right-of-use asset would have had
without the impairment recognised in the previous years, less accumulated depreciation.
During the financial year 1 May 2019–31 December 2019, the Group recognised impairment totalling
EUR 36.9 million on tangible right-of-use assets. EUR 26 million of this impairment was allocated to
the fuels business and EUR 10.8 million to the heating business.
13. Shares in associates and joint ventures
EUR 1,000 31 Dec. 2019 30 Apr. 2019
Shares in associates 4,902 3,508
Shares in joint ventures 16,735 16,438
Non-depreciated goodwill included in joint ventures 3,296 3,296
Shares in associates and joint ventures
Information on the Group’s significant associates and joint ventures:
Name Primary industry Domicile Holding (%)
31 Dec. 2019 30 Apr. 2019
Scandbio AB, joint venture
Manufacture and sale of solid wood
fuels Jönköping 50 50
Vapo Lämpövoima Ky
Intermediation of securities and raw
material agreements Vantaa 19.9 19.9
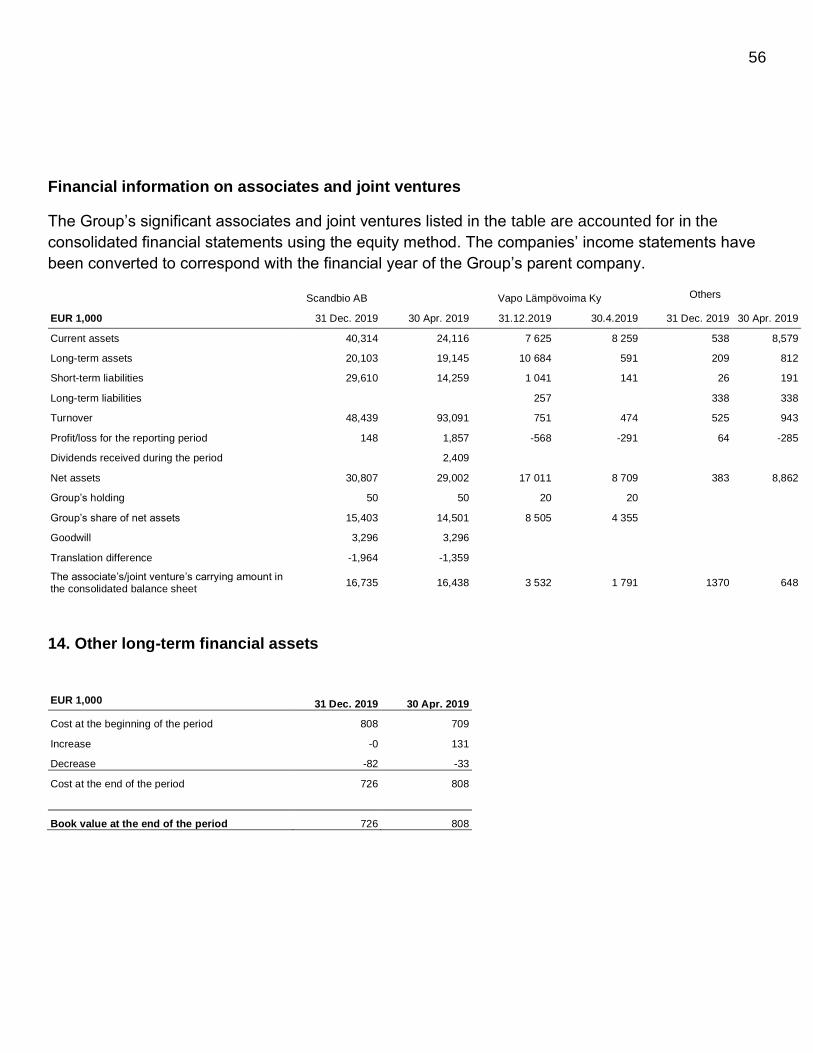
56
Financial information on associates and joint ventures
The Group’s significant associates and joint ventures listed in the table are accounted for in the
consolidated financial statements using the equity method. The companies’ income statements have
been converted to correspond with the financial year of the Group’s parent company.
Scandbio AB Vapo Lämpövoima Ky Others Other
EUR 1,000 31 Dec. 2019 30 Apr. 2019 31.12.2019 30.4.2019 31 Dec. 2019 30 Apr. 2019
Current assets 40,314 24,116 7 625 8 259 538 8,579
Long-term assets 20,103 19,145 10 684 591 209 812
Short-term liabilities 29,610 14,259 1 041 141 26 191
Long-term liabilities 257 338 338
Turnover 48,439 93,091 751 474 525 943
Profit/loss for the reporting period 148 1,857 -568 -291 64 -285
Dividends received during the period 2,409
Net assets 30,807 29,002 17 011 8 709 383 8,862
Group’s holding 50 50 20 20
Group’s share of net assets 15,403 14,501 8 505 4 355
Goodwill 3,296 3,296
Translation difference -1,964 -1,359
The associate’s/joint venture’s carrying amount in the consolidated balance sheet
16,735 16,438 3 532 1 791 1370 648
14. Other long-term financial assets
EUR 1,000 31 Dec. 2019 30 Apr. 2019
Cost at the beginning of the period 808 709
Increase -0 131
Decrease -82 -33
Cost at the end of the period 726 808
Book value at the end of the period 726 808
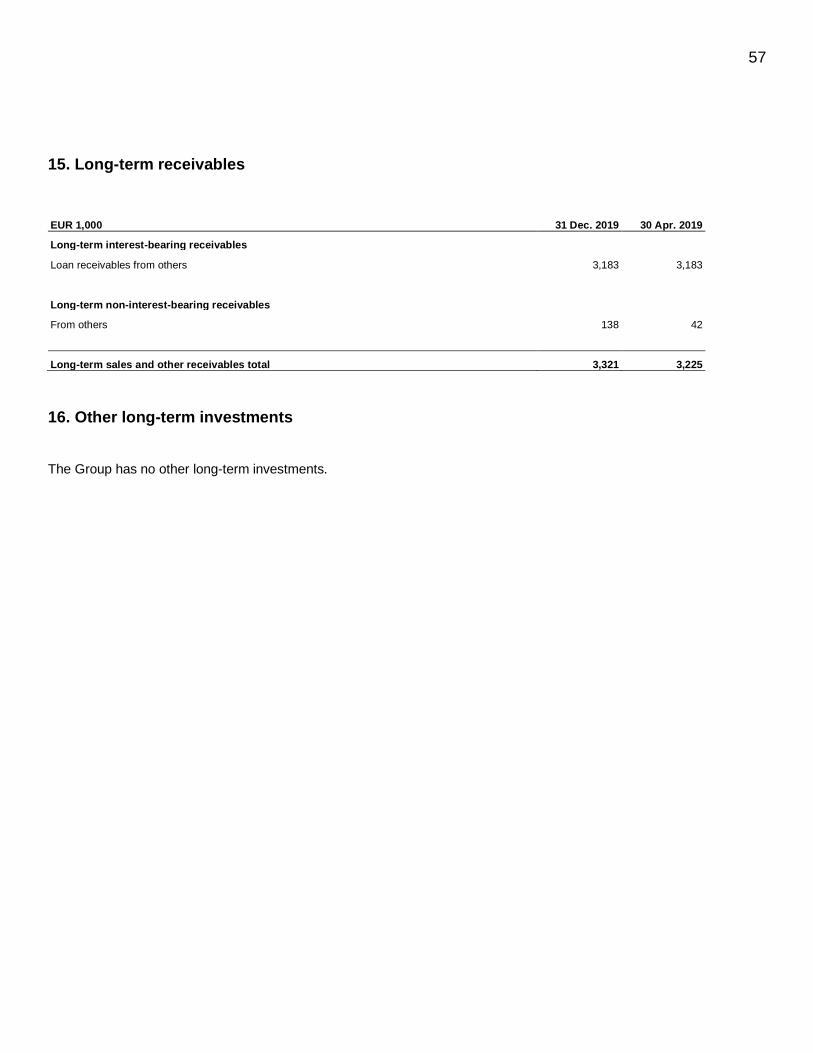
57
15. Long-term receivables
EUR 1,000 31 Dec. 2019 30 Apr. 2019
Long-term interest-bearing receivables
Loan receivables from others 3,183 3,183
Long-term non-interest-bearing receivables
From others 138 42
Long-term sales and other receivables total 3,321 3,225
16. Other long-term investments
The Group has no other long-term investments.

58
17. Deferred taxes
EUR 1,000 1 May 2019
Translation
difference
Recognised in the income
statement
Recognised
in shareholder
s’ equity
Acquired/divested
companies 31 Dec. 2019
Itemisation of deferred tax assets
Losses 167 167
Provisions 563 968 1,531
Other items 243 -1,415 -160 -1,332
Total 974 -447 -160 367
EUR 1,000 1 May 2019 Translation
difference
Recognised in the income statement
Recognised in
shareholders’ equity
Acquired/divested
companies 31 Dec. 2019
Itemisation of deferred tax liabilities
Depreciation difference and provisions 9,243 -231 9,012
Fair value measurement of intangible and tangible assets in business combinations 9,390 9,390
Other items -6,003 -1,520 -389 -7,911
Total 12,630 -1,751 -389 10,490
Deferred taxes on the balance sheet
Deferred tax assets 367
Deferred tax liability 10,490
Net tax liability 10,123
EUR 1,000 1 May 2018 Translation
difference
Recognised in
the income statement
Other changes
Acquired/div
ested companies 30 Apr. 2019
Itemisation of deferred tax assets
Losses 167 167
Provisions 628 -65 563
Other items 705 -462 243
Total 1,500 -527 974
EUR 1,000 1 May 2018
Translation
difference
Recognised in the income
statement
Other
changes
Acquired/divested
companies 30 Apr. 2019
Itemisation of deferred tax liabilities
Depreciation difference and provisions 14,973 -5,730 9,243
Fair value measurement of intangible and tangible assets in business combinations 2,716 6,674 9,390
Other accrual differences 0 -4,982 -1,021 -6,003
Total 17,689 -10,712 5,653 12,630
Deferred taxes on the balance sheet

59
Deferred tax assets 974
Deferred tax liability 12,630
Net tax liability 11,656
Deferred tax liabilities and assets are offset when there is a legally enforceable right to offset current tax assets against
current tax liabilities and when the deferred taxes related to the same fiscal authority.
On 31 December 2019, the Group had EUR 8.3 million (30 April 2019: EUR 8.3 million) in confirmed losses for which
deferred tax assets were not recognised because the Group is unlikely to accrue taxable income against which the losses
could be offset. The losses in question will not expire.
Deferred tax assets on losses not recognised in the balance sheet amounted to EUR 1.6 million (30 April 2019: EUR 1.6
million).
18. Inventories
EUR 1,000 31 Dec. 2019 30 Apr. 2019
Materials and supplies 54,629 46,968
Unfinished products 29 10,992
Finished products 135,014 87,678
Prepayments from inventories 620 356
Inventories total 190,291 145,994
19. Sales and other receivables
EUR 1,000 31 Dec. 2019 30 Apr. 2019
Sales receivables
Sales receivables 72,000 94,344
Credit loss provision -299 -208
Associates’ sales receivables 183 374
Total 71,883 94,510
Short-term other receivables and accrued income
Loan receivables 207 200
Other short-term receivables 7,000 4,427
Short-term accrued income (from others) 4,443 3,981
Total 11,650 8,608
Financial assets measured at fair value through profit or loss
Derivative instruments, no hedge accounting 3,369 4,118

60
Sales and other receivables total 86,902 107,236
The short-term sales receivables are divided by currency as follows:
EUR 1,000 31 Dec. 2019 30 Apr. 2019
EUR 59,805 75,214
USD 1,219 1,165
SEK 10,606 18,115
Other currencies 253 16
Total 71,883 94,510
Age distribution of sales receivables and items recognised as credit losses
Credit loss history
Financial year (EUR 1,000) Turnover Receivables Credit losses % of
receivables
FY2015 345,931 53,460 96 0.18%
FY2016 359,027 63,674 34 0.05%
FY2017 348,922 62,354 66 0.11%
FY2018 419,803 68,213 93 0.14%
FY2019 460,827 94,343 96 0.10%
FY20198 (1 May–31 December 2019) 297,748 72,000 79 0.11%
Average 77
Age distribution of due receivables
Sales receivables Carrying amount
Expected credit loss EUR
Not yet due 60,879 0.02% 12
Due under 30 days 6,122 0.07% 4
Due 31–60 days 1,535 1.00% 15
Due 61–91 days 590 3.00% 18
Due over 90 days 2,874 8.66% 249
Total 72,000 298
Credit loss provision 31 December 2019 IFRS 9 299
EUR 1,000 31 Dec. 2019 30 Apr. 2019
Not yet due 60,762 83,571
Due under 30 days 6,122 7,846
Due 31–60 days 1,535 843
Due 61–91 days 590 724

61
Due over 90 days 2,874 1,526
Total 71,883 94,510
Credit losses 79 96
20. Cash assets
EUR 1,000 31 Dec. 2019 30 Apr. 2019
Cash and cash equivalents 6,326 7,962
21. Notes to equity
Shareholders’ equity Vapo Oy has one class of shares. The total number of shares is 30,000. Vapo’s share capital on 31 December 2019 amounted to EUR 50,456,377.90. The nominal value of the share has not been defined. There are 30,000 shares outstanding. Descriptions of the equity funds are presented below: The invested unrestricted equity fund consists of other equity-type investments and the subscription price of shares to the extent that it is not recognised in share capital according to a case-specific decision. The reserve fund is a fund pursuant to the Estonian Commercial Code, equal in size to 10% of the separate company’s share capital. The company must transfer 10% of its annual earnings to the fund until the required amount is reached. Translation differences comprise foreign exchange-denominated changes in foreign subsidiaries’ equity and post-acquisition retained earnings.

62
22. Financial liabilities
EUR 1,000 31 Dec. 2019 30 Apr. 2019
Long-term financial liabilities measured at amortised cost
Bonds 178,574 79,109
Loans from financial institutions 33,004 82,377
Subordinated loans 5,000
Lease liabilities 66,850
Financial leasing liabilities 32,334
Total 278,429 198,820
Short-term financial liabilities measured at amortised cost
Bonds
Loans from financial institutions 31,494 48,301
Overdraft facility 3,912 2,231
Commercial papers 17,998
Lease liabilities 10,802
Financial leasing liabilities 9,370
Other liabilities to associates 246 262
Total 46,453 78,161
Long-term debt repayment schedule (per calendar year/nominal values)
EUR 1,000 2020 2021 2022 2023 2024 2025 -> Total
Bonds 0 0 0 0 110,000 70,000 180,000 Loans from financial
institutions 20,000 504 30,569 731 731 453 52,988
Lease liabilities 12,592 10,072 9,517 8,485 7,107 38,664 86,437
Total 32,592 10,576 40,086 9,216 117,838 109,117 319,425
The interest-bearing liabilities are measured at nominal values in the financial statements as they are equal to the fair
values. The interest-bearing liabilities are euro-denominated.
Following the Group’s adoption of IFRS 16 on 1 May 2019, financial leasing liabilities according to IAS 17 are no longer
reported. Instead, lease liabilities are presented in accordance with IFRS 16.
Financial leasing liabilities (the previous financial year as the comparison data)
EUR 1,000 30 Apr. 2019
Total amount of minimum rents
In less than one year 9,540
In more than one year and not more than 5 years 13,555
Later than in five years 20,168
Minimum rents total 43,263
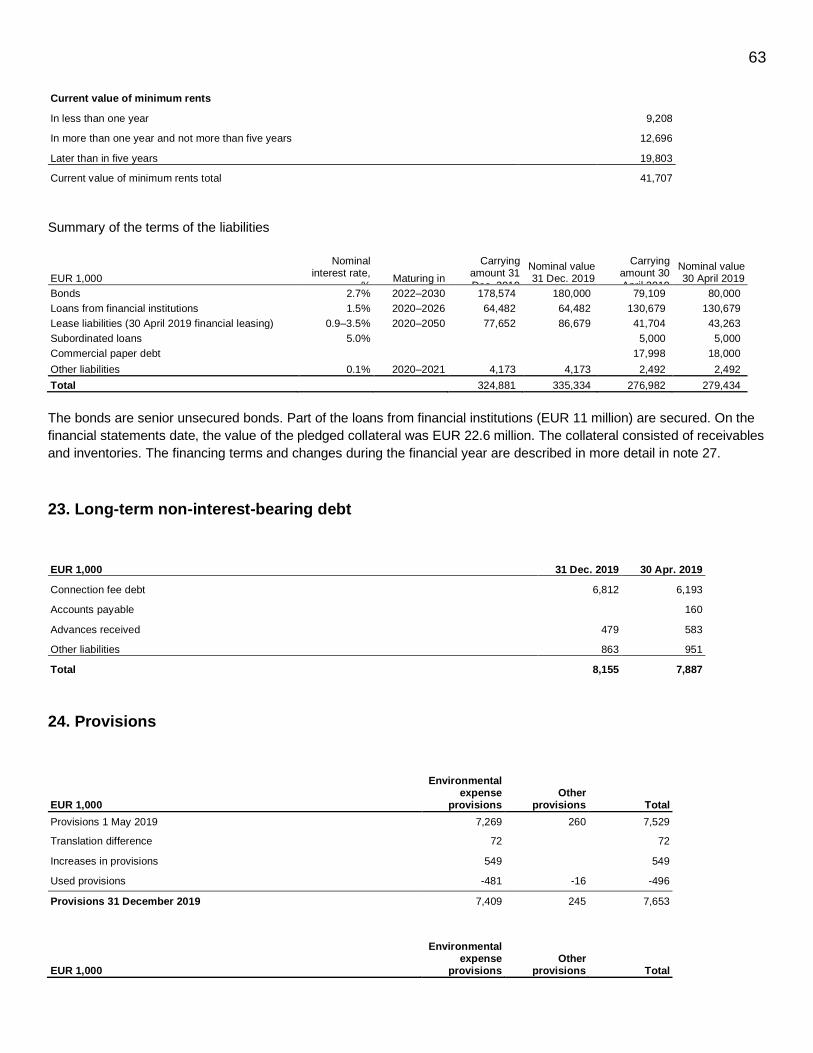
63
Current value of minimum rents
In less than one year 9,208
In more than one year and not more than five years 12,696
Later than in five years 19,803
Current value of minimum rents total 41,707
Summary of the terms of the liabilities
EUR 1,000
Nominal interest rate,
% Maturing in
Carrying amount 31
Dec. 2019
Nominal value 31 Dec. 2019
Carrying amount 30
April 2019
Nominal value 30 April 2019
Bonds 2.7% 2022–2030 178,574 180,000 79,109 80,000
Loans from financial institutions 1.5% 2020–2026 64,482 64,482 130,679 130,679
Lease liabilities (30 April 2019 financial leasing) 0.9–3.5% 2020–2050 77,652 86,679 41,704 43,263
Subordinated loans 5.0% 5,000 5,000
Commercial paper debt 17,998 18,000
Other liabilities 0.1% 2020–2021 4,173 4,173 2,492 2,492
Total 324,881 335,334 276,982 279,434
The bonds are senior unsecured bonds. Part of the loans from financial institutions (EUR 11 million) are secured. On the
financial statements date, the value of the pledged collateral was EUR 22.6 million. The collateral consisted of receivables
and inventories. The financing terms and changes during the financial year are described in more detail in note 27.
23. Long-term non-interest-bearing debt
EUR 1,000 31 Dec. 2019 30 Apr. 2019
Connection fee debt 6,812 6,193
Accounts payable 160
Advances received 479 583
Other liabilities 863 951
Total 8,155 7,887
24. Provisions
EUR 1,000
Environmental expense
provisions Other
provisions Total
Provisions 1 May 2019 7,269 260 7,529
Translation difference 72 72
Increases in provisions 549 549
Used provisions -481 -16 -496
Provisions 31 December 2019 7,409 245 7,653
EUR 1,000
Environmental expense
provisions Other
provisions Total
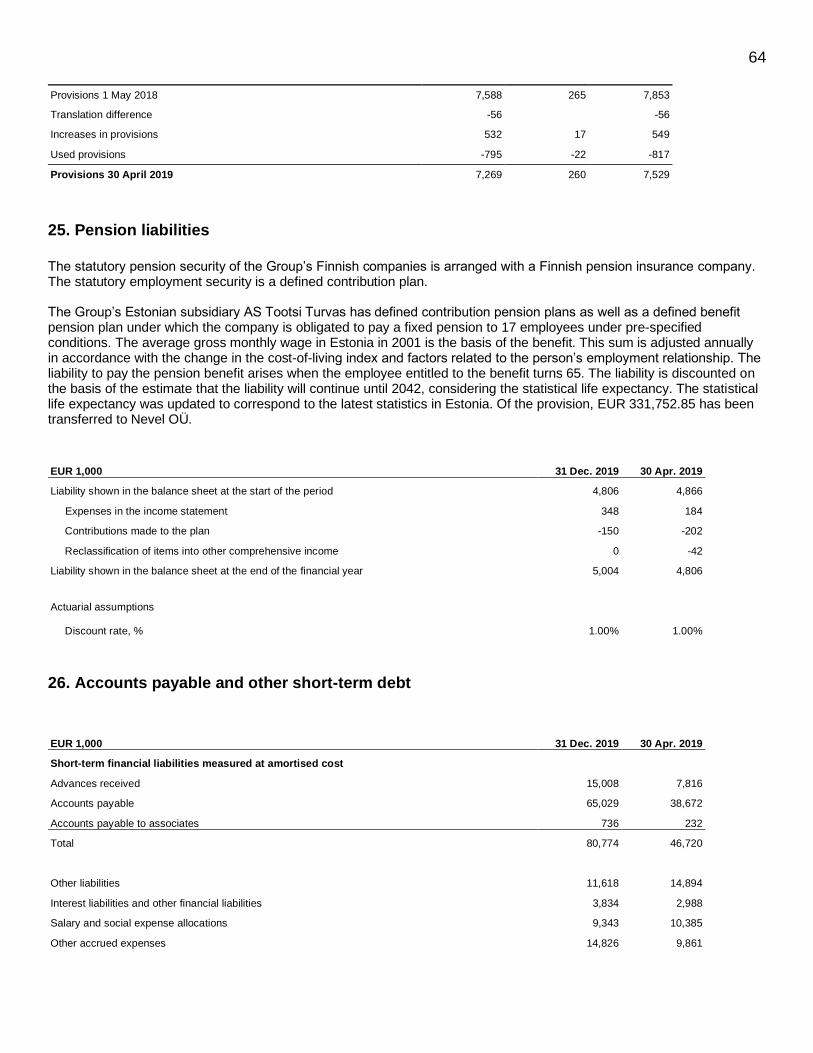
64
Provisions 1 May 2018 7,588 265 7,853
Translation difference -56 -56
Increases in provisions 532 17 549
Used provisions -795 -22 -817
Provisions 30 April 2019 7,269 260 7,529
25. Pension liabilities
The statutory pension security of the Group’s Finnish companies is arranged with a Finnish pension insurance company. The statutory employment security is a defined contribution plan. The Group’s Estonian subsidiary AS Tootsi Turvas has defined contribution pension plans as well as a defined benefit pension plan under which the company is obligated to pay a fixed pension to 17 employees under pre-specified conditions. The average gross monthly wage in Estonia in 2001 is the basis of the benefit. This sum is adjusted annually in accordance with the change in the cost-of-living index and factors related to the person’s employment relationship. The liability to pay the pension benefit arises when the employee entitled to the benefit turns 65. The liability is discounted on the basis of the estimate that the liability will continue until 2042, considering the statistical life expectancy. The statistical life expectancy was updated to correspond to the latest statistics in Estonia. Of the provision, EUR 331,752.85 has been transferred to Nevel OÜ.
EUR 1,000 31 Dec. 2019 30 Apr. 2019
Liability shown in the balance sheet at the start of the period 4,806 4,866
Expenses in the income statement 348 184
Contributions made to the plan -150 -202
Reclassification of items into other comprehensive income 0 -42
Liability shown in the balance sheet at the end of the financial year 5,004 4,806
Actuarial assumptions
Discount rate, % 1.00% 1.00%
26. Accounts payable and other short-term debt
EUR 1,000 31 Dec. 2019 30 Apr. 2019
Short-term financial liabilities measured at amortised cost
Advances received 15,008 7,816
Accounts payable 65,029 38,672
Accounts payable to associates 736 232
Total 80,774 46,720
Other liabilities 11,618 14,894
Interest liabilities and other financial liabilities 3,834 2,988
Salary and social expense allocations 9,343 10,385
Other accrued expenses 14,826 9,861
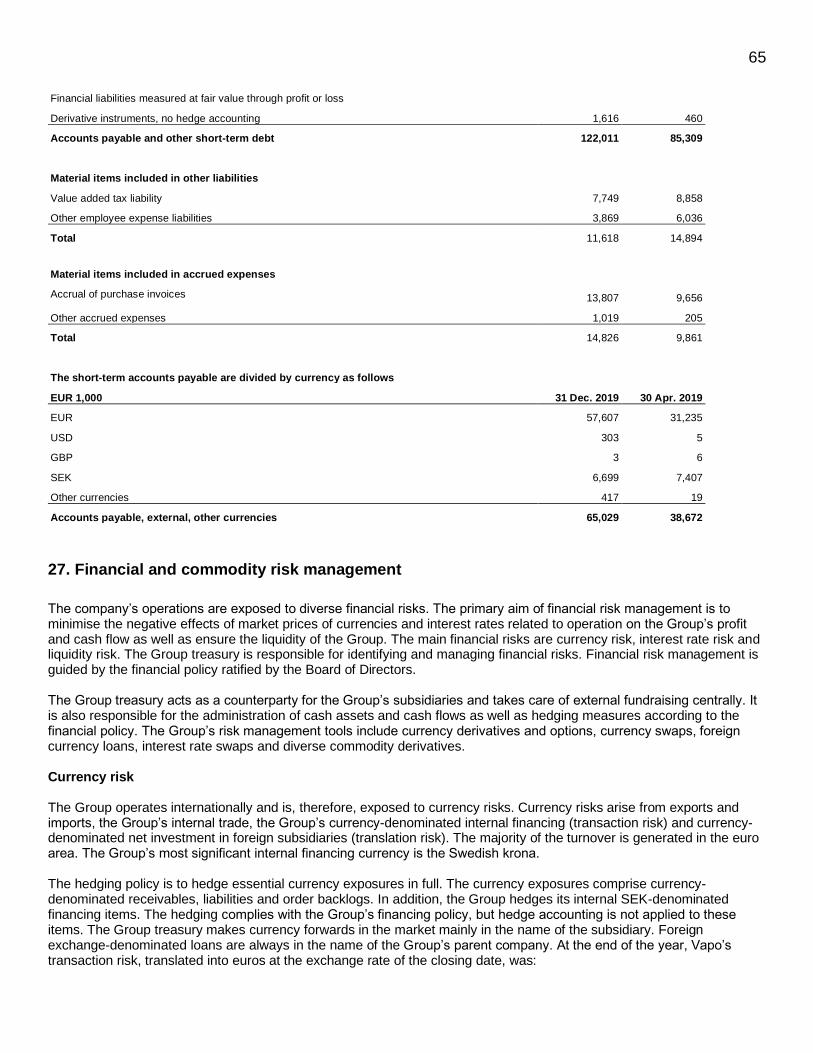
65
Financial liabilities measured at fair value through profit or loss
Derivative instruments, no hedge accounting 1,616 460
Accounts payable and other short-term debt 122,011 85,309
Material items included in other liabilities
Value added tax liability 7,749 8,858
Other employee expense liabilities 3,869 6,036
Total 11,618 14,894
Material items included in accrued expenses
Accrual of purchase invoices 13,807 9,656
Other accrued expenses 1,019 205
Total 14,826 9,861
The short-term accounts payable are divided by currency as follows
EUR 1,000 31 Dec. 2019 30 Apr. 2019
EUR 57,607 31,235
USD 303 5
GBP 3 6
SEK 6,699 7,407
Other currencies 417 19
Accounts payable, external, other currencies 65,029 38,672
27. Financial and commodity risk management
The company’s operations are exposed to diverse financial risks. The primary aim of financial risk management is to minimise the negative effects of market prices of currencies and interest rates related to operation on the Group’s profit and cash flow as well as ensure the liquidity of the Group. The main financial risks are currency risk, interest rate risk and liquidity risk. The Group treasury is responsible for identifying and managing financial risks. Financial risk management is guided by the financial policy ratified by the Board of Directors. The Group treasury acts as a counterparty for the Group’s subsidiaries and takes care of external fundraising centrally. It is also responsible for the administration of cash assets and cash flows as well as hedging measures according to the financial policy. The Group’s risk management tools include currency derivatives and options, currency swaps, foreign currency loans, interest rate swaps and diverse commodity derivatives. Currency risk The Group operates internationally and is, therefore, exposed to currency risks. Currency risks arise from exports and imports, the Group’s internal trade, the Group’s currency-denominated internal financing (transaction risk) and currency-denominated net investment in foreign subsidiaries (translation risk). The majority of the turnover is generated in the euro area. The Group’s most significant internal financing currency is the Swedish krona. The hedging policy is to hedge essential currency exposures in full. The currency exposures comprise currency-denominated receivables, liabilities and order backlogs. In addition, the Group hedges its internal SEK-denominated financing items. The hedging complies with the Group’s financing policy, but hedge accounting is not applied to these items. The Group treasury makes currency forwards in the market mainly in the name of the subsidiary. Foreign exchange-denominated loans are always in the name of the Group’s parent company. At the end of the year, Vapo’s transaction risk, translated into euros at the exchange rate of the closing date, was:
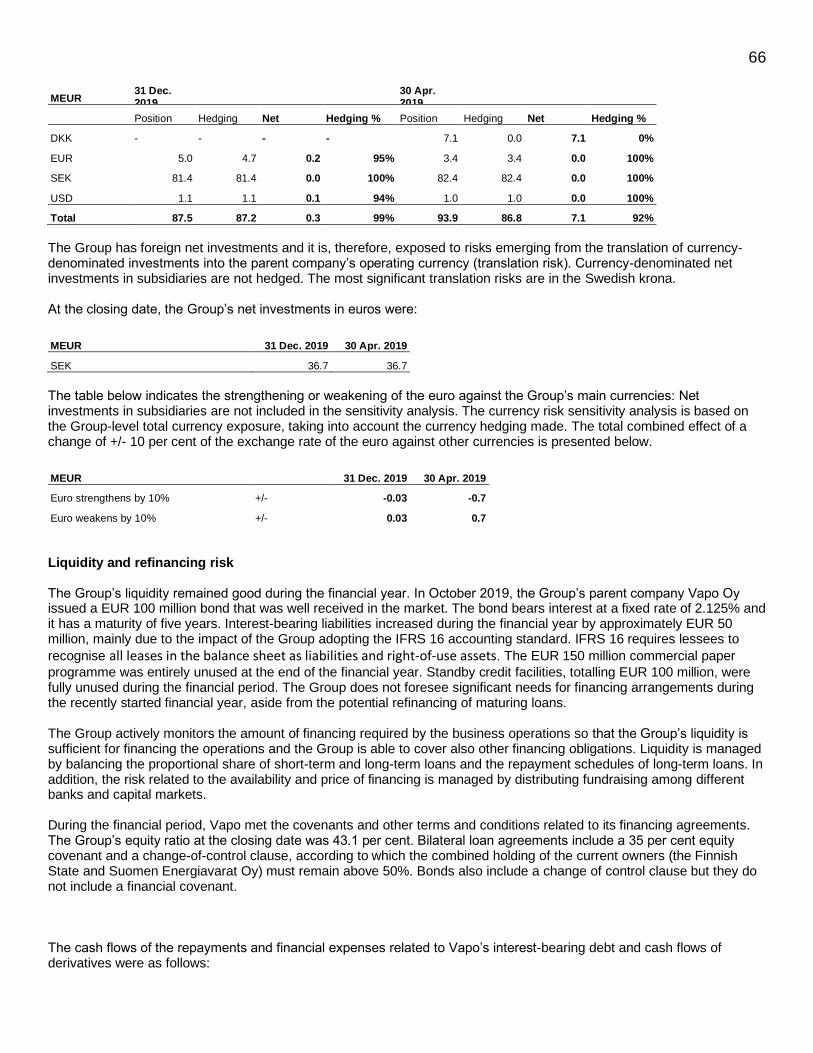
66
MEUR 31 Dec. 2019
30 Apr. 2019
Position Hedging Net Hedging % Position Hedging Net Hedging %
DKK - - - - 7.1 0.0 7.1 0%
EUR 5.0 4.7 0.2 95% 3.4 3.4 0.0 100%
SEK 81.4 81.4 0.0 100% 82.4 82.4 0.0 100%
USD 1.1 1.1 0.1 94% 1.0 1.0 0.0 100%
Total 87.5 87.2 0.3 99% 93.9 86.8 7.1 92%
The Group has foreign net investments and it is, therefore, exposed to risks emerging from the translation of currency-denominated investments into the parent company’s operating currency (translation risk). Currency-denominated net investments in subsidiaries are not hedged. The most significant translation risks are in the Swedish krona. At the closing date, the Group’s net investments in euros were:
MEUR 31 Dec. 2019 30 Apr. 2019
SEK 36.7 36.7
The table below indicates the strengthening or weakening of the euro against the Group’s main currencies: Net investments in subsidiaries are not included in the sensitivity analysis. The currency risk sensitivity analysis is based on the Group-level total currency exposure, taking into account the currency hedging made. The total combined effect of a change of +/- 10 per cent of the exchange rate of the euro against other currencies is presented below.
MEUR 31 Dec. 2019 30 Apr. 2019
Euro strengthens by 10% +/- -0.03 -0.7
Euro weakens by 10% +/- 0.03 0.7
Liquidity and refinancing risk The Group’s liquidity remained good during the financial year. In October 2019, the Group’s parent company Vapo Oy issued a EUR 100 million bond that was well received in the market. The bond bears interest at a fixed rate of 2.125% and it has a maturity of five years. Interest-bearing liabilities increased during the financial year by approximately EUR 50 million, mainly due to the impact of the Group adopting the IFRS 16 accounting standard. IFRS 16 requires lessees to
recognise all leases in the balance sheet as liabilities and right-of-use assets. The EUR 150 million commercial paper
programme was entirely unused at the end of the financial year. Standby credit facilities, totalling EUR 100 million, were fully unused during the financial period. The Group does not foresee significant needs for financing arrangements during the recently started financial year, aside from the potential refinancing of maturing loans. The Group actively monitors the amount of financing required by the business operations so that the Group’s liquidity is sufficient for financing the operations and the Group is able to cover also other financing obligations. Liquidity is managed by balancing the proportional share of short-term and long-term loans and the repayment schedules of long-term loans. In addition, the risk related to the availability and price of financing is managed by distributing fundraising among different banks and capital markets. During the financial period, Vapo met the covenants and other terms and conditions related to its financing agreements. The Group’s equity ratio at the closing date was 43.1 per cent. Bilateral loan agreements include a 35 per cent equity covenant and a change-of-control clause, according to which the combined holding of the current owners (the Finnish State and Suomen Energiavarat Oy) must remain above 50%. Bonds also include a change of control clause but they do not include a financial covenant. The cash flows of the repayments and financial expenses related to Vapo’s interest-bearing debt and cash flows of derivatives were as follows:

67
MEUR < 1 year 1–5 years > 5 years
Long-term loans
Repayments 4.5 153.1 89.0
Financial expenses 4.9 20.7 14.3
Short-term loans
Repayments 20.0 - -
Financial expenses 0.6 - -
Derivative liabilities
Income 83.5 1.7 0.0
Expenses 85.7 0.3 0.0
Total 199.2 175.7 103.3
Interest rate risk The Group’s interest-bearing net debt stood at EUR 315.2 million (EUR 265.6 million) on the balance sheet date. The Group aims to hedge against the essential impacts on the interest-bearing liabilities and receivables on the balance sheet caused by changes in interest rates. Interest rate swaps are primarily used as hedging instruments. Interest rate risk is measured with the average interest rate tying period of the debt portfolio (gap). The average interest rate tying period of the debt portfolio on 31 December 2019, including derivative instruments, was 5.4 (4.5) years. The weighted average interest rate of long-term loans including hedging was 2.44 (2.6) per cent. The interest rate risk sensitivity analysis is based on the combined company-level interest rate risk comprised of interest-bearing liabilities and derivatives, such as interest rate swaps that hedge against interest rate risk. An increase of interest rates by one percentage point, with the other factors remaining unchanged, would increase the interest expenses of Vapo’s interest-bearing liabilities and receivables that will be repriced within the next 12 months by EUR +0.3 million excluding tax effects. Interest rate derivatives are measured at full market value and the effect of changes is recognised in the income statement. Market risk of investing activity The Group is exposed to price risk due to fluctuation in the market prices of publicly quoted shares in its operations. The Group does not have publicly listed shares or other securities. Counterparty and credit risk Counterparty risks related to depositing cash assets and financing and commodity derivative instruments are managed by only making agreements and transactions with creditworthy parties that operate actively in the market. The business units are liable for credit risks related to commercial receivables. Business-related credit risk is decreased through credit insurance and customer-specific credit limits, among other measures. The Group does not have any significant concentrations of credit risk. Price risk of emission rights Some of the Group’s power plants are included in the sphere of the EU emissions trading system. During the current emissions trading period, 2013–2020, the Group will not receive all of the emission rights it needs in the national allocation plan and will therefore acquire emission rights (EUA) from the market. The price risk of emission rights is actively hedged by emission rights derivatives.

68
Price risk of electric energy The Group’s Finnish companies purchase electric energy from the market, and correspondingly the electricity generated by the power plants is sold to the market. The price risk of physical electricity is hedged using derivative instruments in accordance with the electricity trading policy. An electricity broker chosen as the partner is responsible for the practical hedging measures related to electricity trading and related investigations. The maturity of the hedges made ranges from 1 month to 5 years. The amount of energy covered by hedging is 167 GWh. Capital management The aim of the Group’s capital management is to facilitate growth according to the strategy of the business operations while optimising the total costs of capital. Hybrid bond Equity includes EUR 50 million in a hybrid bond withdrawn in 2016. The hybrid bond carries a fixed annual coupon of 6.5% for the first five years and at least 11.5% thereafter. The hybrid bond does not have a maturity date, but the company has the right to redeem it five years after its issuance. The hybrid bond is subordinated to the company’s other debt instruments. It is, however, senior to other equity instruments. The interest on the hybrid loan is paid if the Annual General Meeting decides to distribute a dividend. If dividend is not distributed, the company will decide separately on whether to pay the interest. Hybrid loan holders have no control over the company and no right to vote at shareholders’ meetings. In accordance with the dividend policy, Vapo Oy aims to annually distribute 50 per cent of the annual profit shown in the parent company’s financial statements on average, unless this compromises the preconditions for financing. Net gearing was as follows:
EUR 1,000 31 Dec. 2019 30 Apr. 2019
Interest-bearing debt 324,882 276,982
Interest-bearing receivables -3,390 -3,383
Cash and cash equivalents -6,326 -7,962
Net debt 315,166 265,636
Shareholders’ equity total 348,481 403,980
Net gearing 90.4% 65.8%
28. Fair values of financial assets and liabilities
EUR 1,000 31 Dec.
2019 30 Apr.
2019
Positive Negative Net Positive Negative Net
Agreement Fair value Fair value Fair value Fair value Fair value Fair value
Interest rate derivatives, no hedge accounting -36 -36
Currency derivatives, no hedge accounting 153 153 465 -36 430
Electricity derivatives, no hedge accounting 588 -91 498 830 -394 436
Emission right derivatives, no hedge accounting 915 915 2,828 2,828
Short-term derivative agreements 1,656 -91 1,565 4,124 -465 3,658
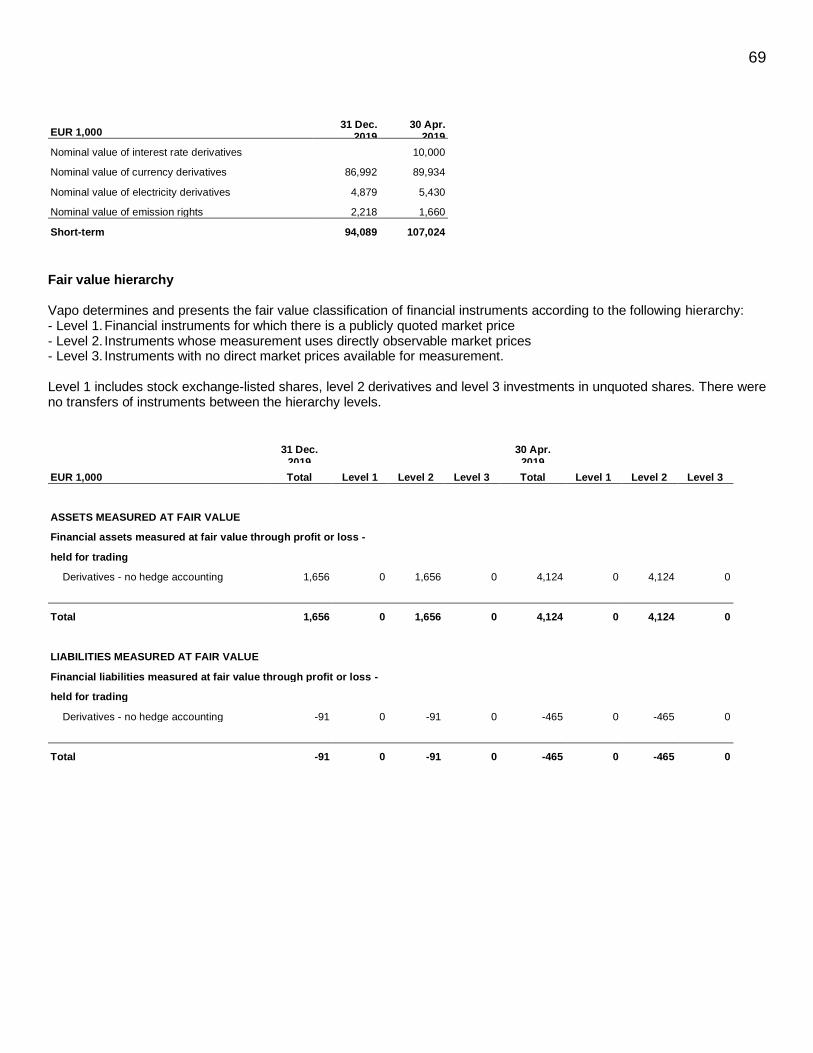
69
EUR 1,000 31 Dec.
2019 30 Apr.
2019
Nominal value of interest rate derivatives 10,000
Nominal value of currency derivatives 86,992 89,934
Nominal value of electricity derivatives 4,879 5,430
Nominal value of emission rights 2,218 1,660
Short-term 94,089 107,024
Fair value hierarchy Vapo determines and presents the fair value classification of financial instruments according to the following hierarchy: - Level 1. Financial instruments for which there is a publicly quoted market price - Level 2. Instruments whose measurement uses directly observable market prices - Level 3. Instruments with no direct market prices available for measurement. Level 1 includes stock exchange-listed shares, level 2 derivatives and level 3 investments in unquoted shares. There were no transfers of instruments between the hierarchy levels.
31 Dec.
2019 30 Apr.
2019
EUR 1,000 Total Level 1 Level 2 Level 3 Total Level 1 Level 2 Level 3
ASSETS MEASURED AT FAIR VALUE
Financial assets measured at fair value through profit or loss -
held for trading
Derivatives - no hedge accounting 1,656 0 1,656 0 4,124 0 4,124 0
Total 1,656 0 1,656 0 4,124 0 4,124 0
LIABILITIES MEASURED AT FAIR VALUE
Financial liabilities measured at fair value through profit or loss -
held for trading
Derivatives - no hedge accounting -91 0 -91 0 -465 0 -465 0
Total -91 0 -91 0 -465 0 -465 0

70
29. Subsidiaries and significant non-controlling interests
The following table presents information on the Group’s structure on the financial statements date
Holding, %
Country Company Group Parent company
Australia BVB Australia Pty Ltd 53% 0%
Belgium Haasnot BVBA 70% 0%
Spain Kekkilä Iberia S.L. 70% 0%
The Netherlands
Bas van Buuren B.V. 70% 0%
BVB Gardening B.V. 70% 0%
BVB Landscaping B.V. 70% 0%
BVB Research B.V. 70% 0%
BVB Substrates B.V. 70% 0%
Bogro B.V. 70% 0%
Euroveen B.V. 70% 0%
Euroveen Logistics B.V. 70% 0%
Geluc B.V. 70% 0%
Veenbas Potgrond B.V. 70% 0%
Germany BVB Gardening GmbH 70% 0%
Finland Grow & Care Materials Oy 70% 0%
Kekkilä-BVB Oy 70% 70%
Kekkilä Oy 70% 0%
Nevel Oy 100% 100%
Piipsan Turve Oy 48% 48%
Salon Energiantuotanto Oy 100% 0%
Suo Oy 100% 100%
Vapo Clean Waters Oy 100% 100%
Sweden BVB Substrates AB 70% 0%
Hasselfors Garden AB 70% 0%
Neova AB 100% 100%
Nevel AB 100% 0%
Estonia AS Tootsi Turvas 100% 100%
Kekkilä Eesti Oü 70% 0%
Nevel Eesti Oü
100% 100%
As the Group has control over Piipsan Turve Oy based on a shareholders’ agreement, the company is consolidated as a subsidiary.
Non-controlling interests own 51% (51%) of the company. Among Vapo Oy’s subsidiaries, Kekkilä-BVB Oy has non-controlling interests
with a shareholding of 30% (30%). Vapo A/S was merged with Vapo Oy on 30 April 2019.

71
Itemisation of significant non-controlling interests in the Group
EUR 1,000
Share of profit/loss attributable to non-controlling interests
Share of equity attributable to non-controlling interests
31 Dec. 2019 30 Apr. 2019 31 Dec. 2019 30 Apr. 2019
Subsidiaries in which there are non-controlling interests
Kekkilä-BVB 679 -1,386 39,915 40,485
Other -120 53 725 330
Total 559 -1333 40,640 40,815
0.0% 0.3% 11.7% 10.1%
30. Contingent commitments
EUR 1,000 31 Dec. 2019 30 Apr. 2019
Loans with real security
Loans from financial institutions 11,506 18,301
Guarantees given on behalf of own commitments
As collateral for own debt
Pledged inventories and fixed assets 22,577 18,301
Liabilities for other own commitments
Guarantees 19,617 14,438
Total 53,700 51,040
Contingent commitments on behalf of Group companies
Guarantees 38,462 9,676
Other rental liabilities
Due within the next one-year period 1,524
Due later, within the next 1–5 years 3,112
Due later, after more than 5 years 1,233
Total 5,869
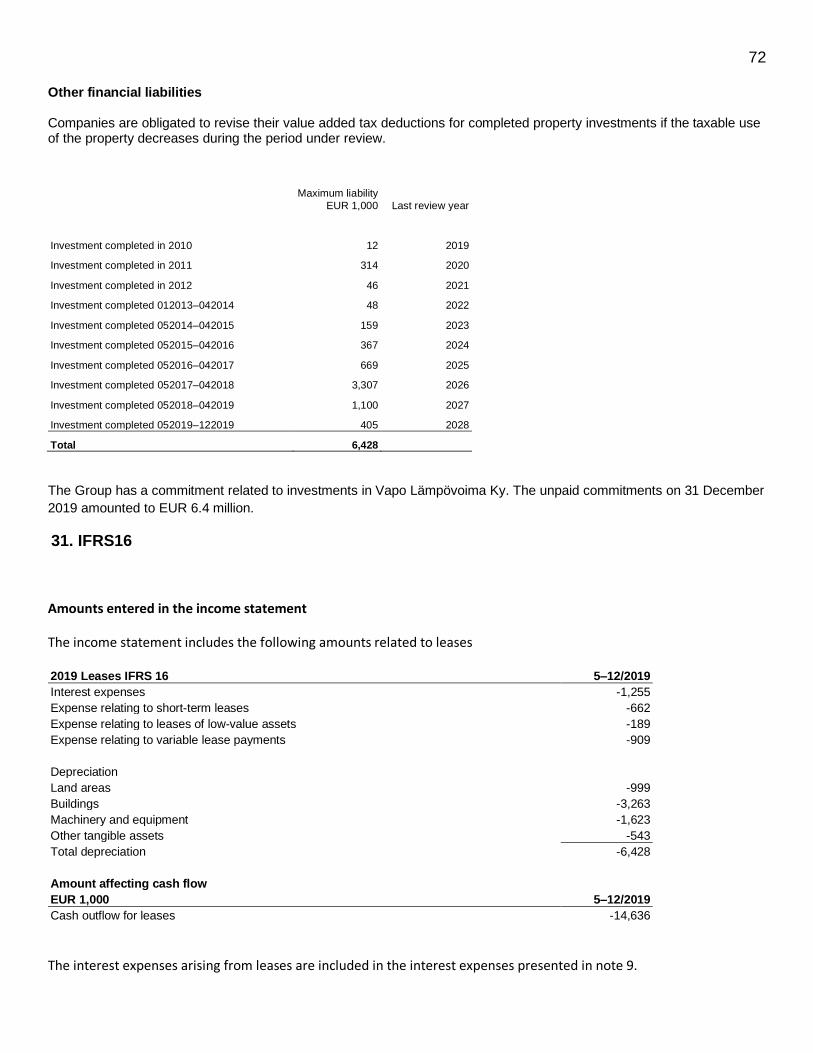
72
Other financial liabilities Companies are obligated to revise their value added tax deductions for completed property investments if the taxable use of the property decreases during the period under review.
Maximum liability
EUR 1,000 Last review year
Investment completed in 2010 12 2019
Investment completed in 2011 314 2020
Investment completed in 2012 46 2021
Investment completed 012013–042014 48 2022
Investment completed 052014–042015 159 2023
Investment completed 052015–042016 367 2024
Investment completed 052016–042017 669 2025
Investment completed 052017–042018 3,307 2026
Investment completed 052018–042019 1,100 2027
Investment completed 052019–122019 405 2028
Total 6,428
The Group has a commitment related to investments in Vapo Lämpövoima Ky. The unpaid commitments on 31 December
2019 amounted to EUR 6.4 million.
31. IFRS16
Amounts entered in the income statement
The income statement includes the following amounts related to leases
2019 Leases IFRS 16 5–12/2019
Interest expenses -1,255
Expense relating to short-term leases -662
Expense relating to leases of low-value assets -189
Expense relating to variable lease payments -909
Depreciation
Land areas -999
Buildings -3,263
Machinery and equipment -1,623
Other tangible assets -543
Total depreciation -6,428
Amount affecting cash flow
EUR 1,000 5–12/2019
Cash outflow for leases -14,636
The interest expenses arising from leases are included in the interest expenses presented in note 9.
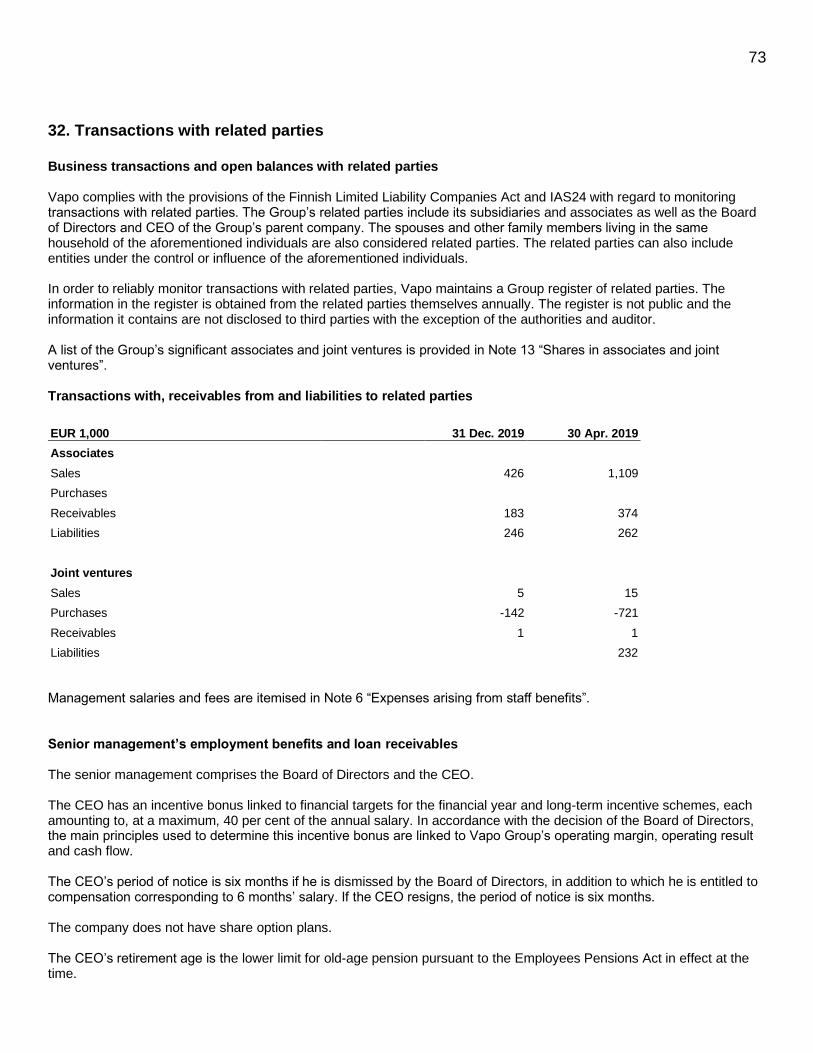
73
32. Transactions with related parties
Business transactions and open balances with related parties Vapo complies with the provisions of the Finnish Limited Liability Companies Act and IAS24 with regard to monitoring transactions with related parties. The Group’s related parties include its subsidiaries and associates as well as the Board of Directors and CEO of the Group’s parent company. The spouses and other family members living in the same household of the aforementioned individuals are also considered related parties. The related parties can also include entities under the control or influence of the aforementioned individuals. In order to reliably monitor transactions with related parties, Vapo maintains a Group register of related parties. The information in the register is obtained from the related parties themselves annually. The register is not public and the information it contains are not disclosed to third parties with the exception of the authorities and auditor. A list of the Group’s significant associates and joint ventures is provided in Note 13 “Shares in associates and joint ventures”. Transactions with, receivables from and liabilities to related parties
EUR 1,000 31 Dec. 2019 30 Apr. 2019
Associates
Sales 426 1,109
Purchases
Receivables 183 374
Liabilities 246 262
Joint ventures
Sales 5 15
Purchases -142 -721
Receivables 1 1
Liabilities 232
Management salaries and fees are itemised in Note 6 “Expenses arising from staff benefits”. Senior management’s employment benefits and loan receivables The senior management comprises the Board of Directors and the CEO. The CEO has an incentive bonus linked to financial targets for the financial year and long-term incentive schemes, each amounting to, at a maximum, 40 per cent of the annual salary. In accordance with the decision of the Board of Directors, the main principles used to determine this incentive bonus are linked to Vapo Group’s operating margin, operating result and cash flow. The CEO’s period of notice is six months if he is dismissed by the Board of Directors, in addition to which he is entitled to compensation corresponding to 6 months’ salary. If the CEO resigns, the period of notice is six months. The company does not have share option plans. The CEO’s retirement age is the lower limit for old-age pension pursuant to the Employees Pensions Act in effect at the time.

74
The Group CEO is covered by a pension scheme pursuant to the Employees’ Pensions Act. In addition, the CEO is
entitled to a defined contribution collective supplementary pension insurance to which Vapo contributes an amount
equivalent to 10 per cent of the CEO’s total annual salary (12 x monthly salary), excluding bonuses, every year.
There were no loan receivables from the senior management on 31 December 2019 and 30 April 2019.
Parent company’s financial statements, FAS
Parent company’s income statement
EUR 1,000 Note 5–12/2019 5/2018–4/2019
TURNOVER 2 114,676 246,345
Change in stock levels of finished and unfinished products 31,731 32,250
Production for own use 0 20
Other operating income 3 6,538 11,259
Materials and services 4 -79,201 -129,549
Expenses arising from staff benefits 5 -16,369 -26,540
Depreciation and impairment 6 -43,829 -26,145
Other operating expenses 7 -47,869 -84,217
OPERATING PROFIT -34,322 23,423
Financial income 8 2,126 3,095
Financial expenses 8 -6,440 -9,878
PROFIT/LOSS BEFORE APPROPRIATIONS AND TAXES -38,636 16,639
Appropriations 9 -8,132 26,145
Direct taxes 10 7,579 -7,579
PROFIT/LOSS FOR THE PERIOD -39,189 35,205

75
Parent company’s balance sheet
EUR 1,000 Note 31 Dec. 2019 30 Apr. 2019
ASSETS
Non-current assets
Intangible assets 11 6,930 9,395
Tangible assets 12 191,315 284,884
Investments 13 149,111 156,032
347,356 450,312
Current assets
Inventories 14 121,446 88,304
Long-term receivables 15 119,306 79,621
Short-term receivables 16 55,023 40,676
Cash on hand and in the bank 2,771 3,826
298,547 212,427
ASSETS 645,902 662,739
LIABILITIES
Shareholders’ equity
Share capital 50,456 50,456
Other funds 30,096 30,096
Retained earnings 197,857 166,652
Profit/loss for the period -39,189 35,205
Dividend distribution -12,300 -4,000
Shareholders’ equity total 17 226,921 278,410
Accrual of appropriations 22,001 35,317
Mandatory provisions 18 2,774 2,816
Liabilities
Long-term interest-bearing liabilities 19 261,563 211,486
Long-term non-interest-bearing liabilities 19 189 6,899
Current interest-bearing liabilities 20 49,818 78,588
Current non-interest-bearing liabilities 20 82,637 49,223
Liabilities total 394,206 346,196
LIABILITIES 645,902 662,739
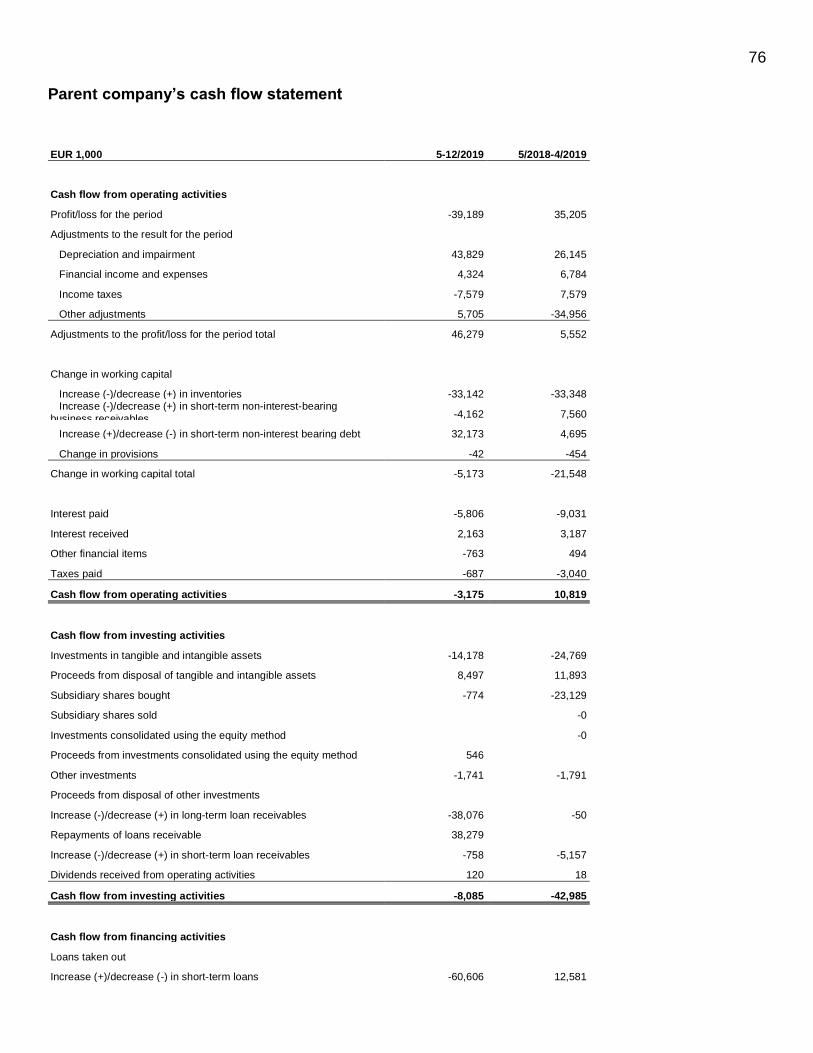
76
Parent company’s cash flow statement
EUR 1,000 5-12/2019 5/2018-4/2019
Cash flow from operating activities
Profit/loss for the period -39,189 35,205
Adjustments to the result for the period
Depreciation and impairment 43,829 26,145
Financial income and expenses 4,324 6,784
Income taxes -7,579 7,579
Other adjustments 5,705 -34,956
Adjustments to the profit/loss for the period total 46,279 5,552
Change in working capital
Increase (-)/decrease (+) in inventories -33,142 -33,348 Increase (-)/decrease (+) in short-term non-interest-bearing
business receivables -4,162 7,560
Increase (+)/decrease (-) in short-term non-interest bearing debt 32,173 4,695
Change in provisions -42 -454
Change in working capital total -5,173 -21,548
Interest paid -5,806 -9,031
Interest received 2,163 3,187
Other financial items -763 494
Taxes paid -687 -3,040
Cash flow from operating activities -3,175 10,819
Cash flow from investing activities
Investments in tangible and intangible assets -14,178 -24,769
Proceeds from disposal of tangible and intangible assets 8,497 11,893
Subsidiary shares bought -774 -23,129
Subsidiary shares sold -0
Investments consolidated using the equity method -0
Proceeds from investments consolidated using the equity method 546
Other investments -1,741 -1,791
Proceeds from disposal of other investments
Increase (-)/decrease (+) in long-term loan receivables -38,076 -50
Repayments of loans receivable 38,279
Increase (-)/decrease (+) in short-term loan receivables -758 -5,157
Dividends received from operating activities 120 18
Cash flow from investing activities -8,085 -42,985
Cash flow from financing activities
Loans taken out
Increase (+)/decrease (-) in short-term loans -60,606 12,581

77
Proceeds from long-term loans 100,000 134
Repayment of long-term loans -16,890 -331
Dividends paid -12,300 -9,000
Repayments of loans receivable
Group contributions paid
Cash flow from financing activities 10,205 3,384
Change in cash and cash equivalents -1,055 -28,782
Cash and cash equivalents opening balance 3,826 32,573
Change in cash and cash equivalents -1,055 -28,782
Cash and cash equivalents at end of period 2,771 3,826
Cash and cash equivalents, other arrangements 0 -35
Parent company’s notes
1. Accounting principles applied in the financial statements Vapo Oy’s financial statements have been prepared in accordance with the Finnish Accounting Act. The Group has adopted the international financial reporting standards (IFRS) as of 1 January 2006. Currency-denominated items and derivative agreements Foreign exchange-denominated business transactions are recognised at the exchange rate of the transaction date and assets and liabilities on the balance sheet at the closing date are translated at the exchange rate on the closing date. Exchange rate differences are recognised in exchange rate differences in financing. All derivatives are measured and recorded at fair value on the transaction and closing date. Fair value measurement is based on quoted market prices. Realised and unrealised gains and losses from derivative instruments are recorded in the financial items of the statement of income. Turnover and principles of revenue recognition Revenue recognition takes place when the output is handed over. In calculating turnover, the indirect taxes, discounts granted and complaint-related reimbursement is deducted from the proceeds of sale. Other operating income and expenses Other operating income includes capital gains from property, plant and equipment, rental revenue, gains from emission rights sold and received subsidies. Other operating expenses include capital losses from property, plant and equipment, actual expenses of emission rights and sale freight expenses, credit losses, sales provisions and other operating expenses. Research and development expenditure Research and development expenditure is recognised through profit or loss for the year during which they are incurred. Property, plant and equipment and depreciation The balance sheet values of property, plant and equipment is based on initial cost less annual depreciation and impairment. Property, plant and equipment is depreciated according to plan based on the financial useful life using the straight-line method or based on use. Economic lifetimes are 5–10 years for intangible assets and 3–40 years for tangible assets. Emission rights

78
Emission rights are handled as intangible rights measured at cost. The measurement value of emission rights received without consideration is nil. A provision for fulfilling the obligation to return the emission rights is recorded if the emission rights received without consideration are not sufficient to cover the actual amount of emissions. Therefore, the possible impact on the result is the difference between actual emissions and emission rights received. Leasing In the parent company’s financial statements, leasing fees are recognised as an annual expense. Inventories Inventories are measured at the less of cost or probably replacement value or sales price. The value of inventories is determined using the FIFO method. The cost of inventories also includes the allocated part of fixed procurement and manufacturing expenses, which as allocated to products according to the normal utilised capacity of the production unit. The inventories of peat production include peat reserved processed ready for sale, i.e. the peat sales inventory. Peat reserves not processed ready for sale are handled as peat substance in fixed assets and depreciated according to use. Taxes Income taxes are recognised in accordance with Finnish tax legislation. Deferred tax assets are presented in the notes.
2. Turnover
EUR 1,000 5–12/2019 5/2018–4/2019
Finland 114,406 242,086
Other countries 271 4,259
Total 114,676 246,345
3. Other operating income
EUR 1,000 5–12/2019 5/2018–4/2019
Rental revenue 239 250
Grants and public subsidies -11 77
Gain on merger, internal 0 19
Capital gains from equity 3,346 9,855
Other income 2,963 1,058
Total 6,538 11,259
4. Materials and services
EUR 1,000 5–12/2019 5/2018–4/2019
Purchases during the period -39,789 -61,521
Change in inventories 3,136 1,005
External services -42,548 -69,033
Total -79,201 -129,549

79
5. Notes concerning personnel and members of administrative bodies
EUR 1,000 5–12/2019 5/2018–4/2019
Personnel expenses Salaries and fees -13,383 -21,772
Pension expenses -2,662 -3,883
Other personnel expenses -324 -885
Total -16,369 -26,540
Management salaries, fees and fringe benefits total CEO and CEO’s deputy 394 415
Members of the Board of Directors 167 189
Members of the Supervisory Board 12 18
Other Management Team members 1,316 1,392
Total 1,889 2,014
Number of personnel Average during the financial period 387 368
6. Depreciation and impairment
EUR 1,000 5–12/2019 5/2018–4/2019
Intangible rights -1,260 -2,193
Buildings and structures -675 -1,458
Machinery and equipment -6,081 -11,457
Other tangible assets -10,577 -10,842
Planned depreciation -18,593 -25,951
Impairment of equity assets -25,237 -193
Total -43,829 -26,144
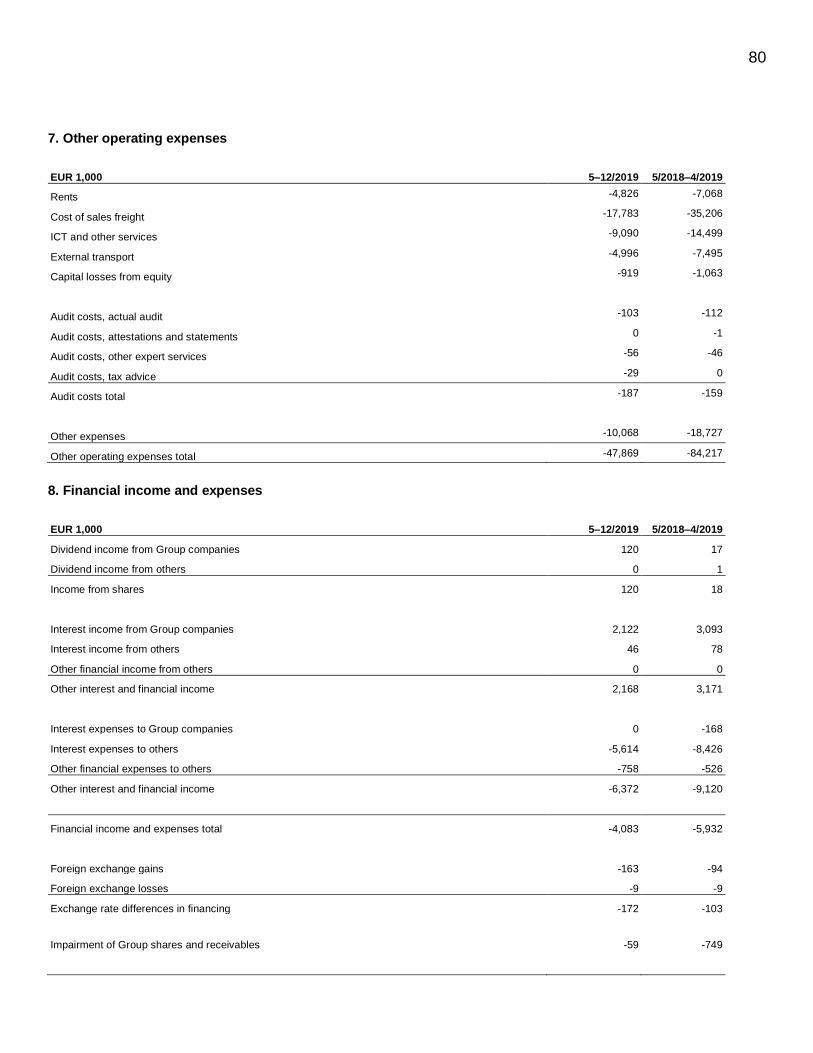
80
7. Other operating expenses
EUR 1,000 5–12/2019 5/2018–4/2019
Rents -4,826 -7,068
Cost of sales freight -17,783 -35,206
ICT and other services -9,090 -14,499
External transport -4,996 -7,495
Capital losses from equity -919 -1,063
Audit costs, actual audit -103 -112
Audit costs, attestations and statements 0 -1
Audit costs, other expert services -56 -46
Audit costs, tax advice -29 0
Audit costs total -187 -159
Other expenses -10,068 -18,727
Other operating expenses total -47,869 -84,217
8. Financial income and expenses
EUR 1,000 5–12/2019 5/2018–4/2019
Dividend income from Group companies 120 17
Dividend income from others 0 1
Income from shares 120 18
Interest income from Group companies 2,122 3,093
Interest income from others 46 78
Other financial income from others 0 0
Other interest and financial income 2,168 3,171
Interest expenses to Group companies 0 -168
Interest expenses to others -5,614 -8,426
Other financial expenses to others -758 -526
Other interest and financial income -6,372 -9,120
Financial income and expenses total -4,083 -5,932
Foreign exchange gains -163 -94
Foreign exchange losses -9 -9
Exchange rate differences in financing -172 -103
Impairment of Group shares and receivables -59 -749
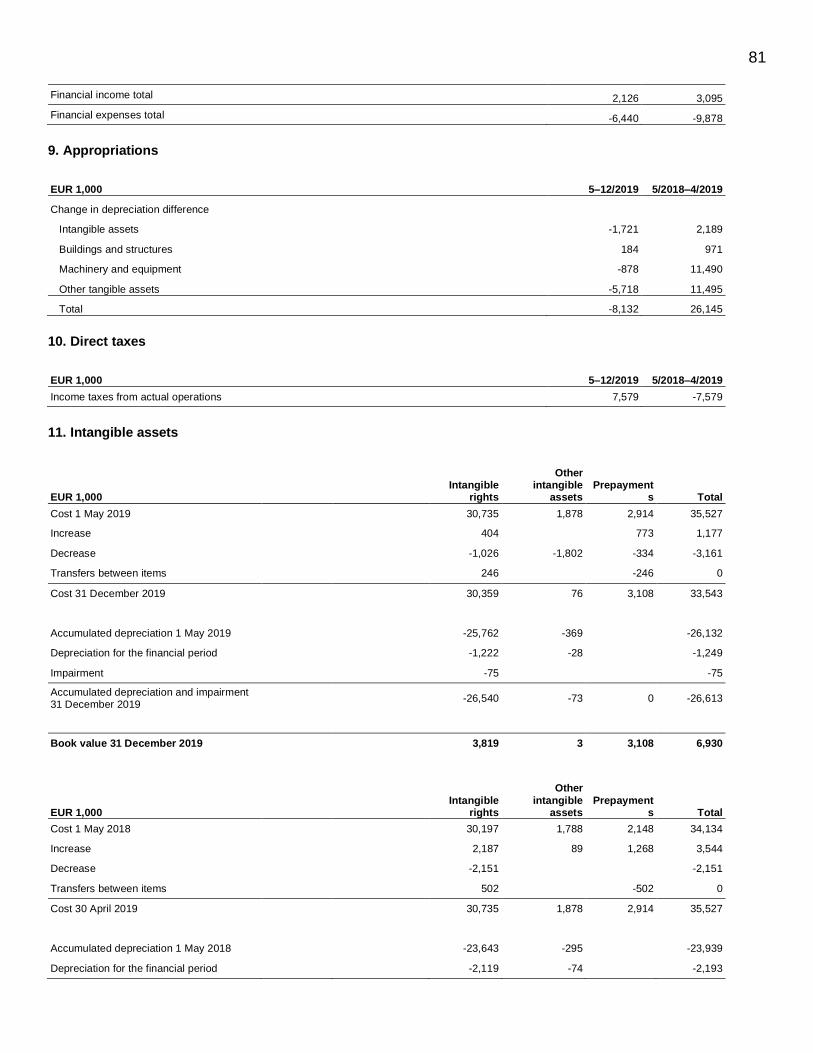
81
Financial income total 2,126 3,095
Financial expenses total -6,440 -9,878
9. Appropriations
EUR 1,000 5–12/2019 5/2018–4/2019
Change in depreciation difference
Intangible assets -1,721 2,189
Buildings and structures 184 971
Machinery and equipment -878 11,490
Other tangible assets -5,718 11,495
Total -8,132 26,145
10. Direct taxes
EUR 1,000 5–12/2019 5/2018–4/2019
Income taxes from actual operations 7,579 -7,579
11. Intangible assets
EUR 1,000 Intangible
rights
Other intangible
assets Prepayment
s Total
Cost 1 May 2019 30,735 1,878 2,914 35,527
Increase 404 773 1,177
Decrease -1,026 -1,802 -334 -3,161
Transfers between items 246 -246 0
Cost 31 December 2019 30,359 76 3,108 33,543
Accumulated depreciation 1 May 2019 -25,762 -369 -26,132
Depreciation for the financial period -1,222 -28 -1,249
Impairment -75 -75
Accumulated depreciation and impairment 31 December 2019
-26,540 -73 0 -26,613
Book value 31 December 2019 3,819 3 3,108 6,930
EUR 1,000 Intangible
rights
Other
intangible assets
Prepayments Total
Cost 1 May 2018 30,197 1,788 2,148 34,134
Increase 2,187 89 1,268 3,544
Decrease -2,151 -2,151
Transfers between items 502 -502 0
Cost 30 April 2019 30,735 1,878 2,914 35,527
Accumulated depreciation 1 May 2018 -23,643 -295 -23,939
Depreciation for the financial period -2,119 -74 -2,193
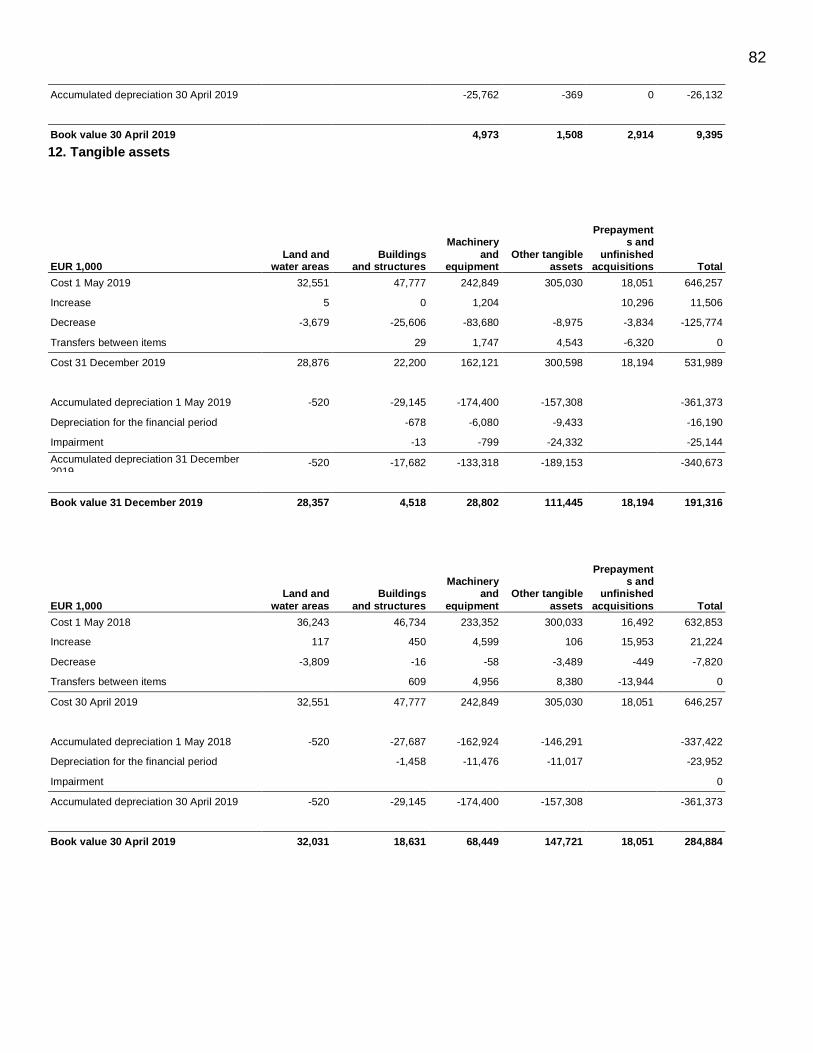
82
Accumulated depreciation 30 April 2019 -25,762 -369 0 -26,132
Book value 30 April 2019 4,973 1,508 2,914 9,395
12. Tangible assets
EUR 1,000 Land and
water areas Buildings
and structures
Machinery
and equipment
Other tangible assets
Prepayments and
unfinished acquisitions Total
Cost 1 May 2019 32,551 47,777 242,849 305,030 18,051 646,257
Increase 5 0 1,204 10,296 11,506
Decrease -3,679 -25,606 -83,680 -8,975 -3,834 -125,774
Transfers between items 29 1,747 4,543 -6,320 0
Cost 31 December 2019 28,876 22,200 162,121 300,598 18,194 531,989
Accumulated depreciation 1 May 2019 -520 -29,145 -174,400 -157,308 -361,373
Depreciation for the financial period -678 -6,080 -9,433 -16,190
Impairment -13 -799 -24,332 -25,144
Accumulated depreciation 31 December 2019
-520 -17,682 -133,318 -189,153 -340,673
Book value 31 December 2019 28,357 4,518 28,802 111,445 18,194 191,316
EUR 1,000
Land and
water areas
Buildings
and structures
Machinery and
equipment
Other tangible
assets
Prepayments and
unfinished
acquisitions Total
Cost 1 May 2018 36,243 46,734 233,352 300,033 16,492 632,853
Increase 117 450 4,599 106 15,953 21,224
Decrease -3,809 -16 -58 -3,489 -449 -7,820
Transfers between items 609 4,956 8,380 -13,944 0
Cost 30 April 2019 32,551 47,777 242,849 305,030 18,051 646,257
Accumulated depreciation 1 May 2018 -520 -27,687 -162,924 -146,291 -337,422
Depreciation for the financial period -1,458 -11,476 -11,017 -23,952
Impairment 0
Accumulated depreciation 30 April 2019 -520 -29,145 -174,400 -157,308 -361,373
Book value 30 April 2019 32,031 18,631 68,449 147,721 18,051 284,884

83
13. Investments
EUR 1,000
Shares in
Group companies
Shares in associates
Other shares and
participations Total
Cost 1 May 2019 152,897 648 2,487 156,032
Increase 774 1,741 2,515
Decrease 0
Decrease conversions, intra-Group mergers and acquisitions
0
Decrease, intra-Group mergers and acquisitions -5,133 -546 -3,758 -9,437
Impairment 0
Book value 31 December 2019 148,539 102 470 149,111
EUR 1,000
Shares in Group companies
Shares in associates
Other
shares and participations Total
Cost 1 May 2018 116,643 648 696 117,987
Increase 117,989 22,500 1,791 142,280
Decrease -57,832 -22,500 -80,332
Decrease conversions, intra-Group mergers and
acquisitions -16,000 -16,000
Decrease, intra-Group mergers and acquisitions -7,155 -7,155
Impairment -749 -749
Book value 30 April 2019 152,897 648 4,278 157,823
14. Inventories
EUR 1,000 31 Dec. 2019 30 Apr. 2019
Materials and supplies 18,800 17,591
Work-in-progress 0 7,498
Finished products 102,146 62,925
Prepayments from inventories 499 290
Total 121,446 88,304
15. Long-term receivables
EUR 1,000 31 Dec. 2019 30 Apr. 2019
Receivables from Group companies
Loan receivables 116,123 76,788
Loan receivables from others 3,183 3,183
Total 119,306 79,971

84
16. Short-term receivables
EUR 1,000 31 Dec. 2019 30 Apr. 2019
Receivables from Group companies
Sales receivables 5,402 1,865
Loan receivables 15,646 12,388
Accrued income 2,781 -61
Receivables from associates
Sales receivables 131 374
Receivables from others
Sales receivables 22,329 22,154
Loan receivables 200 200
Accrued income 6,099 2,786
Other receivables 2,436 970
Total 55,023 40,676
Essential accrued income items Allocated taxes 3,087 0
Other accrued income from sales 2,622 1,502
Other accrued income from expenses 391 1,284
Total 6,099 2,786
17. Shareholders’ equity
Restricted equity
EUR 1,000 31 Dec. 2019 30 Apr. 2019
Share capital 50,456 50,456
TOTAL RESTRICTED EQUITY ON 31 DECEMBER 50,456 50,456
Unrestricted equity
EUR 1,000 31 Dec. 2019 30 Apr. 2019
Other funds 30,096 30,096
Retained earnings at the start of the financial period 197,857 171,652
Dividend distribution -12,300 -9,000
Profit for the period -39,189 35,205
TOTAL UNRESTRICTED EQUITY ON 31 DECEMBER 176,465 227,953
Account of funds available for the distribution of profit Retained earnings 185,557 162,652
Profit/loss for the period -39,189 35,205
- capitalised development expenditure for unfinished -2,260 -2,071
DISTRIBUTABLE FUNDS 144,108 195,786

85
18. Mandatory provisions
EUR 1,000 31 Dec. 2019 30 Apr. 2019
Provision due to environmental obligations 2,774 2,816
Total 2,774 2,816
19. Long-term liabilities
EUR 1,000 31 Dec. 2019 30 Apr. 2019
Bonds 178,574 79,109
Hybrid bond 50,000 50,000
Loans from financial institutions 32,988 82,378
Connection fees 189 6,156
Long-term accounts payable 0 160
Advances received 0 583
Total 261,751 218,386
Repayment schedule of long-term interest-bearing debt (per calendar year)
EUR 1,000 2020 2021 2022 2023 2024 2025 -> Total
Bonds 0 50,000 0 0 110,000 70,000 230,000
Loans from financial institutions 20,000 504 30,569 731 731 453 52,988
Lease liabilities 1,920 1,795 1,959 2,141 1,108 6,591 15,515
Total 21,920 52,299 32,528 2,872 111,839 77,044 298,503
20. Current liabilities
EUR 1,000 31 Dec. 2019 30 Apr. 2019
Loans from financial institutions 23,911 30,000
Advances received 13,730 7,544
Accounts payable 45,784 14,135
Liabilities to Group companies: Accounts payable 630 741
Other liabilities 25,661 28,098
Accrued expenses 2,410 366
Liabilities to joint ventures: Other liabilities 246 262
Other liabilities 5,068 26,878
Accrued expenses 15,007 19,789
Total 132,446 127,812
Material items included in accrued expenses
Short-term interest liabilities 3,028 3,220
Accrued personnel expenses 3,653 5,620
Accrual of purchase invoices 8,325 5,770
Total 15,007 14,610

86
21. Contingent commitments
EUR 1,000 31 Dec. 2019 30 Apr. 2019
Other guarantees given on behalf of own commitments
Guarantees 10,356 10,090
Contingent commitments on behalf of Group companies
Guarantees 38,271 9,676
Other rental liabilities
Rental liabilities maturing in less than one year 0 818
Rental liabilities maturing within 1–5 years 0 2,432
Rental liabilities maturing later 0 1,233
Total 0 4,483
31 Dec. 2019 30 Apr. 2019
EUR 1,000 Nominal value Fair value Nominal value Fair value
Interest rate derivatives 10,000 -35
Currency derivatives 81,280 109 82,755 406
Electricity derivatives 4,879 498 5,430 436
Emission right derivatives 2,218 915 1,660 2,828
Total 88,376 1,522 99,845 3,635
31 Dec. 2019
MEUR < 1 year 1–5 years > 5 years
Income 81.7 -0.3 0.0
Expenses -80.9 -1.7 0.0
Total 0.7 -1.9 0.0
The management of financial risks is described in more detail in note 27 to the consolidated financial statements.
The parent company has land lease agreements for peat production. At the end of the financial year, annual and land area-based lease liabilities totalled EUR 10.7 million.
Year of payment
Lease amount (based on
2019) Number of
agreements Year of
payment
Lease amount (based on
2019) Number of
agreements Year of
payment
Lease amount (based on
2019) Number of
agreements
2020 993,999 873 2034 230,508 150 2048 31,501 19
2021 986,790 858 2035 175,136 109 2049 30,224 18
2022 860,403 632 2036 157,962 100 2050 29,771 17
2023 814,838 616 2037 136,456 84 2051 25,374 9
2024 782,982 585 2038 126,904 78 2052 25,163 8
2025 699,261 496 2039 119,807 72 2053 25,163 8
2026 648,043 472 2040 96,533 54 2054 15,534 7
2027 603,592 414 2041 73,700 46 2055 15,534 7
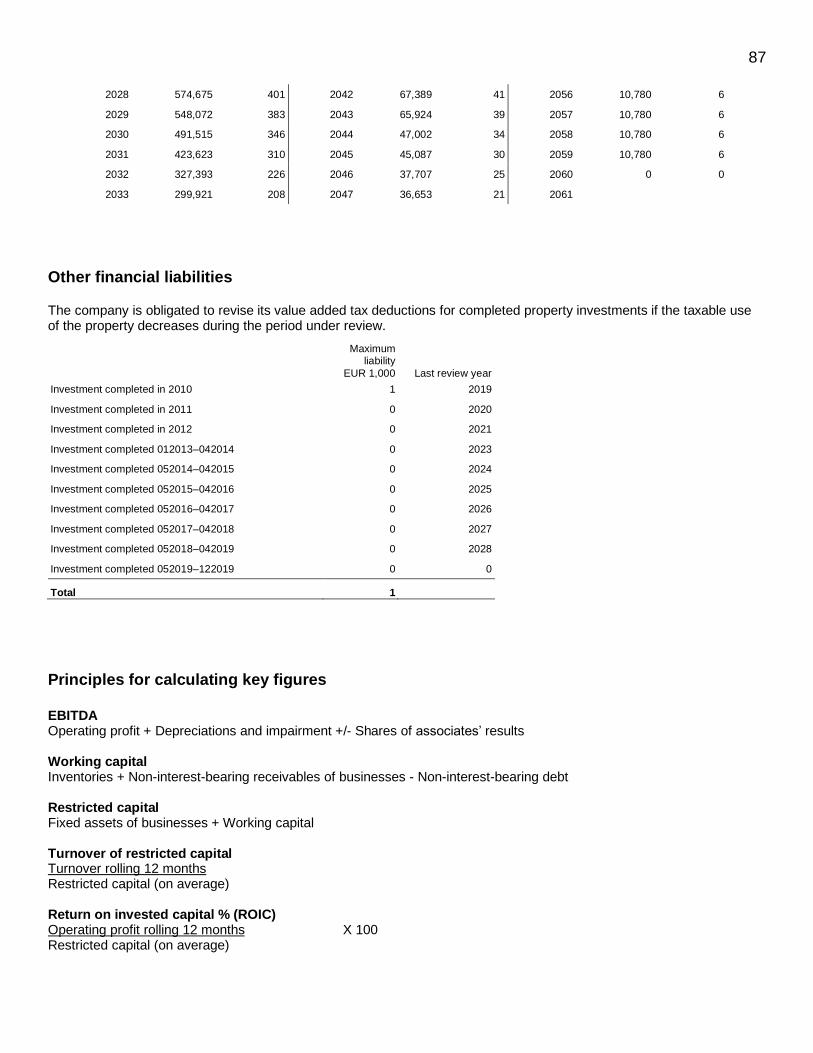
87
2028 574,675 401 2042 67,389 41 2056 10,780 6
2029 548,072 383 2043 65,924 39 2057 10,780 6
2030 491,515 346 2044 47,002 34 2058 10,780 6
2031 423,623 310 2045 45,087 30 2059 10,780 6
2032 327,393 226 2046 37,707 25 2060 0 0
2033 299,921 208 2047 36,653 21 2061
Other financial liabilities
The company is obligated to revise its value added tax deductions for completed property investments if the taxable use of the property decreases during the period under review.
Maximum liability
EUR 1,000 Last review year
Investment completed in 2010 1 2019
Investment completed in 2011 0 2020
Investment completed in 2012 0 2021
Investment completed 012013–042014 0 2023
Investment completed 052014–042015 0 2024
Investment completed 052015–042016 0 2025
Investment completed 052016–042017 0 2026
Investment completed 052017–042018 0 2027
Investment completed 052018–042019 0 2028
Investment completed 052019–122019 0 0
Total 1
Principles for calculating key figures
EBITDA Operating profit + Depreciations and impairment +/- Shares of associates’ results Working capital Inventories + Non-interest-bearing receivables of businesses - Non-interest-bearing debt Restricted capital Fixed assets of businesses + Working capital Turnover of restricted capital Turnover rolling 12 months Restricted capital (on average) Return on invested capital % (ROIC) Operating profit rolling 12 months X 100 Restricted capital (on average)

88
Return on equity % Profit before taxes rolling 12 months - income tax X 100 (Shareholders’ equity + minority interest) on average Liquidity Short-term on-interest bearing receivables Short-term non-interest-bearing liabilities Equity ratio % Shareholders’ equity + minority interest + capital loan X 100 Balance sheet total – advances received Interest-bearing net debt Interest-bearing debt - Interest-bearing loans receivable - Cash and cash equivalents Gearing % Interest-bearing net debt X 100 Shareholders’ equity + minority interest Free cash flow before taxes EBITDA +/- Change in working capital – net investments Earnings/share Profit attributable to owners of the parent company/Number of shares Shareholders’ equity/share Parent company’s shareholders’ equity/Number of shares Dividend/share Distribution of dividend for the financial period/Number of shares Dividend/profit % 100 * dividend/share / earnings/share

89
Group key figures 2016–2019
EUR million 04/2016 04/2017 04/2018 04/2019 12/2019
Turnover 459.8 392.1 419.8 460.8 297.7
Growth % -5.6 -5.0 7.1 9.8 32.4
Operating margin (EBITDA) 43.1 56.9 61.1 74.1 37.0
% of turnover 9.4 14.5 14.5 16.1 12.4
Depreciation -35.0 -35.6 -35.7 -41.5 -38.5
Impairment -0.8 -2.4 -0.9 -0.2 -38.9
Operating profit (EBIT) 8.6 20.0 26.3 33.3 -40.4
% of turnover 1.9 5.1 6.3 7.2 -13.6
Operating profit before impairment 9.4 22.4 27.2 33.5 -1.5
% of turnover 2.1 5.7 6.5 7.3 -0.5
Net financial items -9.7 -9.8 -6.0 -2.8 -7.8
Profit/loss before taxes -1.1 10.2 20.3 30.5 -48.2
Taxes -3.4 -2.0 -2.7 -5.3 8.0
Profit/loss for the reporting period -4.4 8.1 17.6 25.2 -40.2
Return on invested capital % 1.2 3.0 4.3 5.4 -1.7
Return on invested capital before impairment % 1.4 3.4 4.4 5.4 4.1
Restricted capital on average 695.8 656.9 613.2 620.8 676.4
Turnover of restricted capital (turnover/restricted capital on average)
0.7 0.6 0.7 0.7 0.8
Average working capital 163.4 138.1 112.6 122.8 144.8
Average working capital % of turnover 35.5 35.2 26.8 26.7 48.6
Restricted capital at the end of the year 669.8 633.9 578.9 691.8 677.9
Working capital at the end of the year 140.2 125.6 88.0 133.7 141.4
Gross investments 38.5 39.6 31.3 62.7 42.8
% of turnover 8.4 10.1 7.5 13.6 14.4
Gross investments/depreciation 1.1 1.1 0.9 1.5 1.1
Operating margin 43.1 56.9 61.1 74.1 37.0
+/- Change in working capital 39.6 14.7 37.6 -45.7 10.3
- Net investments -21.9 1.6 -25.0 -50.7 -26.3
Free cash flow before taxes 60.7 73.2 73.6 -22.3 21.0
Balance sheet total 795.0 812.4 697.5 805.8 828.5
Shareholders’ equity 288.2 339.7 347.9 404.0 348.5
Shareholders’ equity (average) 296.1 313.0 341.8 360.8 374.9
Interest-bearing debt 384.5 368.5 242.6 277.0 324.9
Interest-bearing net debt 366.6 269.6 206.2 265.6 315.2
Equity ratio % 37.6 43.0 51.2 51.3 42.9
Gearing % 127.2 79.4 59.3 65.8 90.4
Interest-bearing net debt/operating margin 8.5 4.7 3.4 3.6 4.0
Liquidity 2.9 4.4 2.8 2.8 2.3
Return on equity % -1.5 2.6 5.2 7.0 -5.1
Dividend distribution 4.0 4.0 7.3 12.3 12.3
Dividend % of profit * -90.0 49.3 41.1 48.7 -30.6
Average number of employees 914 773 758 869 1,050
Key figures per share
Number of shares 30,000 30,000 30,000 30,000 30,000
Earnings/share, EUR * -146 271 586 840 -1,320
Shareholders’ equity/share, EUR 9,571 11,311 11,583 12,208 10,261
Dividend/share, EUR 133 133 242 408 410
* = profit attributable to owners of the parent company
Note! The duration of the financial year 1 May 2019–31 December 2019 was 8 months.

90
Signatures to the financial statements and the report of the Board of Directors
Vantaa, 27 February 2020, Board of Directors of Vapo Oy Jan Lång Markus Tykkyläinen Chair Vice Chair Tuomas Hyyryläinen Juhani Järvelä Risto Kantola Kirsi Puntila
Minna Smedsten Maija Strandberg Vesa Tempakka CEO
Auditor’s note
A report on the audit has been issued today. Helsinki, 27 February 2020 KPMG Oy Ab
Ari Eskelinen, APA