financial statements and ratio analysis - 2012 book...
TRANSCRIPT

This is “Financial Statements and Ratio Analysis”, chapter 4 from the book Finance for Managers (index.html) (v.0.1).
This book is licensed under a Creative Commons by-nc-sa 3.0 (http://creativecommons.org/licenses/by-nc-sa/3.0/) license. See the license for more details, but that basically means you can share this book as long as youcredit the author (but see below), don't make money from it, and do make it available to everyone else under thesame terms.
This content was accessible as of December 29, 2012, and it was downloaded then by Andy Schmitz(http://lardbucket.org) in an effort to preserve the availability of this book.
Normally, the author and publisher would be credited here. However, the publisher has asked for the customaryCreative Commons attribution to the original publisher, authors, title, and book URI to be removed. Additionally,per the publisher's request, their name has been removed in some passages. More information is available on thisproject's attribution page (http://2012books.lardbucket.org/attribution.html?utm_source=header).
For more information on the source of this book, or why it is available for free, please see the project's home page(http://2012books.lardbucket.org/). You can browse or download additional books there.
i

Chapter 4
Financial Statements and Ratio Analysis
Financial Statements
PLEASE NOTE: This book is currently in draft form; material is not final.
Firms with publicly-traded securities must submit certain financial statements tothe Securities Exchange Commission (SEC). Companies must submit a 10-K, which isa summary of the firm’s financial performance using specific data followingdetailed rules. The 10-K includes the balance sheet, the statement of cash flows, andthe income statement. Firms also must submit an annual report to theirshareholders, which is a slightly different version of the firm’s performance, asmangers have a bit more flexibilty in conveying the information. Financialstatements are typically constructed by internal employees and then audited by anoutside body. A quick review of the construction of financial statements will behelpful before we analyze and interpret these statements.
For those who like to cook, financial statements share some attributes with recipes.A lasagna recipe might list the ingredients and detail the steps involved, but itmight not explain how to know exactly when the noodles were done (but notoverdone) and how to know when the cheese has melted to perfection, optinginstead for “cook for about 35 minutes.” In order to better understand what makesa delicious lasagna, we need to know not only the ingredients and steps, but how tointerpret the recipe and a basic understanding of cooking in general. In finance, afundamental analysis of financial statements would be to review them and thenperform some type of analysis of them. A fundamental analysis combines economicsand accounting. The accounting provides the data on the financial statements; theeconomics provides the tools to analyze these statements. A successful analysisincludes both the quantitative data (the financial statements) and analysis of thisdata (using, for example, ratio analysis). In this chapter we review the basicfinancial statements provided to us by the accountants and use economic analysisto analyze these statements.
27
4.1 Income Statement
PLEASE NOTE: This book is currently in draft form; material is not final.
LEARNING OBJECTIVES
1. Describe what an income statement is.2. Explain how to read an income statement.3. Describe what factors influence the income statement.
The first financial statement we examine is the income statement. An incomestatement includes revenues earned, expenses paid, and the bottom line to theinvestors: net income. The income statement is like a movie: it provides a financialfilm of a firm over a period of time. It is a moving picture of the firm’s financialperformance during a given time period, typically a year, but monthly andquarterly financial statements are also prepared. And, while the calendar year endsDecember 31, companies often pick other dates as their fiscal year end, dependingon their industry or selling cycle.
The first line (top line) of an income statement is revenue1 (also called salesrevenue or sales). This is the total dollar amount of goods and services sold duringthe given time period. From this, direct expenses incurred to make the good arededucted as cost of goods sold (COGS)2. This results in gross profit3, also known asEarnings Before Interest, Taxes, Depreciation and Amortization (EBITDA). Grossprofit is what the company made by making and selling its product. From grossprofit we need to pay operating, financial (interest) and tax expenses. Operatingexpenses4 include selling, general and administrative expenses (SG&A), leaseexpenses, depreciation and amortization and are the typical cost of doing business.While fixed assets aren’t directly “used up” over time, a machine or building willwear out over time and eventually need to be replaced. Depreciation5 andamortization6 are annual charges that reflect the legal portion of costs of theassets allowed to be deducted. Depreciation relates to tangible assets such asmachines and amortization relates to intangible assets such as patents.
Once we subtract the operating expenses from gross profit our result is earningsbefore interest and taxes (EBIT)7. EBIT shows us the firm’s ability to generate cash
1. Income or the amount ofmoney received by a companyduring a specific period.
2. Direct costs attributable to theproduction of goods or servicesincluding raw materials andlabor.
3. The total amount of profit. Thedifference between revenueand costs before accounting forother items such as interest,depreciation, taxes andamortization.
4. Expenditures that result fromnormal business operations.
5. A way to allocate the cost of anasset over its useful life.
6. Paying off a debt in regularinstallments over time.
7. A company’s profitability ascalculated by revenues minusexpenses, excluding tax andinterest.
Chapter 4 Financial Statements and Ratio Analysis
28
flow. From EBIT we subtract factors from outside the firm’s operations such as taxesand interest charges. Subtracting interest leaves net profit before taxes8 alsoknown as Earnings Before Taxes (EBT). Finally we must pay the tax man. After taxesare taken out then net income9 (or profit10) is left. A pro-forma income statementis shown in Figure 4.1 "Pro-Forma Income Statement".
Figure 4.1 Pro-Forma Income Statement
Depreciation and Taxes
Is depreciation a good or bad thing for companies? When equipment orproperty that will be used over time for operations is purchased, the companyis typically not allowed to count the purchase as an expense. If it was allowed,then they EBT would be lower by the cost, and thus taxes due would be lower.Instead, the government makes companies “write down” then machine overtime (under the “matching principle” of accounting), which leads to the taxreduction being spread out over time as well. From one point of view,depreciation is nothing more than a legally mandated loan to the government:the tax effect spread out over time instead of taken in the year the fixed assetwas purchased!
KEY TAKEAWAYS
• Income statements provide a moving picture of a company’s financialposition over a period of time.
• An income statement includes revenues earned and expenses paid andthe bottom line to the investors: net income.
8. Revenues minus all expensesexcept taxes.
9. A company’s total profitcalculated by revenue minusexpenses, depreciation,interest and taxes.
10. The financial gain whenrevenue exceeds costs.
Chapter 4 Financial Statements and Ratio Analysis
4.1 Income Statement 29

EXERCISES
1. Review the following 10-K statements
a. Here is a link to Nike’s 10-K.
http://nike.q4cdn.com/25140a27-0622-47e1-9f85-99892a766984.pdf?noexit=true
Look at the Income Statement on page 56. Can youidentify revenues? Net income?
b. Here is a link to Starbuck’s 2011 10-K.
http://investor.starbucks.com/phoenix.zhtml?c=99518&p=irol -SECText&TEXT=aHR0cDovL2lyLmludC53ZXN0bGF3YnVzaW5lc3MuY29tL2RvY3VtZW50L3YxLzAwMDExOTMxMjUtMTEtMzE3MTc1L3htbA%3d%3d
Look at the Income Statement on page 43. Can youidentify Net Income? Sales revenue? Taxes?
2. Using this data below, construct an income statement.
Last year Sun Skateboards had $200,000 in revenues. Thecompany had $70,000 in COGS and $30,000 is SG&A. It was in the40% corporate tax rate. They had depreciation expense of $35,000and interest expense of $20,000.
Chapter 4 Financial Statements and Ratio Analysis
4.1 Income Statement 30
4.2 The Balance Sheet
PLEASE NOTE: This book is currently in draft form; material is not final.
LEARNING OBJECTIVES
1. Describe what a balance sheet is.2. Explain how to read a balance sheet.3. Describe what factors influence a balance sheet.
Unlike the financial movie the income statement, a balance sheet is a snapshot of acompany’s financial position. A balance statement represents a company’s finanicalposition at a specific date in time (the company’s year end). During different timesof the year the balance sheet may change as sales, assets and receivables change. Ifa firm does seasonal business such as Toro (lawnmowers and snowblowers), itsinventory levels, sales and receivables will all vary dramatically throughout theyear.
The balance sheet is divided into two sections: assets11 on the left side andliabilities12 and equity on the right side. The left side lists all assets including cash,accounts receivable and investments. The right side lists the firm’s liabilitiesincluding accounts payable and debts. The right side also includes shareholder’sequity13 which is the value of the firm held by its stockholders and retainedearnings14.
Items on the balance sheet are listed in order of liquidity15, or the length of time ittakes to convert them to cash. The longest term items are listed last because theyare the least liquid. On the right side, stockholders are listed last because they arethe least liquid and will be paid in the event of bankruptcy only after all other debtshave been satisfied. The values listed on a balance sheet are book values which arebased on purchase price. Book values (purchase price) may be very different frommarket value (current fair market values).
11. A resource with value.
12. A company’s debts or legalobligations.
13. The equity stake in a firm heldby the firm’s investors.
14. Earnings not paid out asdividends but retained by thefirm to pay its debt or reinvestin firm.
15. Ease with which an asset can beconverted to cash.
Chapter 4 Financial Statements and Ratio Analysis
31

Assets
Assets are divided by liquidity into two categories: current assets16 and fixedassets17. Current assets consist of cash, accounts recievable and inventories. Theseitems can be expected to be coverted to cash in under one year. Inventory includesraw materials, work-in-progress and actual product. Accounts recievable generatewhen a company sells its product to a customer but it is waiting to receive payment.Fixed assets are both tangible such as buildings, machinery and land and intangiblesuch as patents. Companies also may hold investments in other companies or othersecurities. These assets are also included on the balance sheet and are listed inorder of liquidity. The sum of all of these assets is a company’s total asset number.
Liabilities and Equity
The right side of the balance sheet is for liabilities and equity and are also listed inorder of liquidity. Liabilities are listed first and are money owed. Currentliabilities18 are payments due within one year. Accounts payable are generatedwhen a company makes a purchase for raw materials or advertising but does notpay for it immediately. Listed next are longer term liabilities such as notes payableand accruals. Accruals are wages owed to employees and taxes owed to thegovernment. Notes payable are loans taken out by the company. These may also belonger term and listed under long term debt.
The equity component includes Shareholder’s Equity and Retained Earnings.Retained earnings are the cumulative amount of earnings earned by a firm sinceinception that have not been paid out as dividends. Retained earnings are not cashbut rather earnings used to finance corporate activities. Stockholder’s equity isstockholder’s claim on the firm. The sum of common stock and retained earnings iscalled ‘common equity’ or simply equity. Sometimes common equity is also referredto as net worth, a company’s assets net of its liabilities. A pro-forma balance sheet isshown in Figure 4.2 "Pro-Forma Balance Sheet".
Figure 4.2 Pro-Forma Balance Sheet
KEY TAKEAWAYS
• A balance sheet is a snapshot of a company’s financial position.• Balance sheet lists assets on the left side and liabilities and shareholder’s
equity on the right.
16. Items that can be expected tobe converted to cash in underone year.
17. Items not expected to beconverted to cash in under oneyear.
18. Liability items that areexpected to be converted tocash in under one year.
Chapter 4 Financial Statements and Ratio Analysis
4.2 The Balance Sheet 32

EXERCISES
1. Review the following 10-K statements
a. Here is a link to Nike’s 10-K.
http://nike.q4cdn.com/25140a27-0622-47e1-9f85-99892a766984.pdf?noexit=true
Look at the Balance Sheet on page 57. Can youidentify current assets? Current liabilities?Shareholder’s equity?
b. Here is a link to Starbuck’s 2011 10-K.
http://investor.starbucks.com/phoenix.zhtml?c=99518&p=irol -SECText&TEXT=aHR0cDovL2lyLmludC53ZXN0bGF3YnVzaW5lc3MuY29tL2RvY3VtZW50L3YxLzAwMDExOTMxMjUtMTEtMzE3MTc1L3htbA%3d%3d#toc232803_21
Look at the Balance Sheet on page 44. Can youidentify total assets? Total liabilities? Shareholder’sequity?
2. Last year Sun Skateboards had $80,000 in current assets and $95,000 incurrent liabilities. It had $40,000 in fixed assets. Determine the amountof shareholder’s equity and construct a balance sheet for SunSkateboards.
Chapter 4 Financial Statements and Ratio Analysis
4.2 The Balance Sheet 33

4.3 Cash Flow Statement
PLEASE NOTE: This book is currently in draft form; material is not final.
LEARNING OBJECTIVES
1. Describe what a statement of cash flows is.2. Explain how to read a cash flow statement.3. Describe what factors influence a cash flow statement.
The ability to generate cash is vital to the success of a company. The statement ofcash flows is a summary of cash flows over the period of time reported. Cash flowsare the difference between what a company brings in and what it pays out.Companies need to generate enough income from operations to fund the futuregrowth of the firm and any future investments in capital or securities and provide asolid investment for investors.
The statement of cash flows includes cash flows from operating, investing andfinancing cash flows. Operating cash flows19 are cash flows provided from normalbusiness operations. Operating cash flows also accounts for non-cash items such asdepreciation and the change in working capital. Investing cash flows20 are cashflows received from investments such as the buying and selling of fixed assets inour own firm or financial investments in other firms. Financing cash flows21 arethose received from financing activities. This includes debt such as principalpayments on loans, equity or selling investments. This section also includesdividend payments and stock repurchases.
Cash flow from operating activities can be either positive or negative: when a firmearns revenue, cash flows are positive, when it pays expenses, cash flows arenegative. Of great importance to investors is the ability of the firm to generatepositive cash flow. If not, survival will not be for long. A pro-forma statement ofcash flows is shown in Figure 4.3 "Pro-Forma Statement of Cash Flows".
Figure 4.3 Pro-Forma Statement of Cash Flows
19. Revenues generated from theoperations of a company.Generally defined as revenuesless all operating expenses.
20. Cash flows received frominvestments or other non-dayto day activities.
21. Cash flows generated fromexternal activities.
Chapter 4 Financial Statements and Ratio Analysis
34

KEY TAKEAWAYS
• Cash flows are vital to the health of a business.• The statement of cash flows consists of cash from operating, investing
and financing activities.
EXERCISES
1. Review the following 10-K statements
a. Here is a link to Nike’s 10-K.
http://nike.q4cdn.com/25140a27-0622-47e1-9f85-99892a766984.pdf?noexit=true
Look at the Statement of Cash Flows on page 58. Canyou identify the cash from operating activities? Fromfinancing activities? From investing activities?
b. Here is a link to Starbuck’s 2011 10-K.
http://investor.starbucks.com/phoenix.zhtml?c=99518&p=irol -SECText&TEXT=aHR0cDovL2lyLmludC53ZXN0bGF3YnVzaW5lc3MuY29tL2RvY3VtZW50L3YxLzAwMDExOTMxMjUtMTEtMzE3MTc1L3htbA%3d%3d#toc232803_21
Look at the Statement of Cash Flows on page 45. Canyou identify cash from operating activities? Cashfrom investing activities? Cash from financingactivities?
2. Last year, Sun Skateboards had $50,000 in operating cash flow, $45,000in financing cash flow and $30,000 in investing cash flow. Generate astatement of cash flows for Sun Skateboards.
Chapter 4 Financial Statements and Ratio Analysis
4.3 Cash Flow Statement 35

4.4 Other Statements
PLEASE NOTE: This book is currently in draft form; material is not final.
LEARNING OBJECTIVES
1. Define additional financial statements2. Understand the importance of these additional financial statements.
Statement of Shareholder Equity
The statement of shareholder equity22 describes the changes to a company’sequity section of the balance sheet over a year. This includes any equity accounttransactions such as retained earnings, common and preferred stock as well asother income. It shows the beginning balance, any additions or deductions and theending balance of shareholder equity. A pro-forma statement of shareholder equityis shown in Figure 4.4 "Pro-Forma Statement of Shareholder Equity".
Figure 4.4 Pro-Forma Statement of Shareholder Equity
Statement of Retained Earnings
The statement of retained earnings23 reports the change in retained earningsover a year. In essence it is an abbreviated form of the statement of shareholdersequity. This statement explains the changes in retained earnings from net income(or loss) and from any dividends over a period of time. A pro-forma statement ofretained earnings is shown in Figure 4.5 "Pro-Forma Statement of RetainedEarnings".
Figure 4.5 Pro-Forma Statement of Retained Earnings22. The changes to a company’s
equity section of the balancesheet over a year.
23. Abbreviated statement thatstates the changes to retainedearnings over a year.
Chapter 4 Financial Statements and Ratio Analysis
36

Notes to Financial Statements
Just as the endnotes to a paper or the notes in a margin of a novel may be the mostimportant and thought provoking pieces, the notes to financial statements24 maybe the most interesting as well. Financial statements will often include explanatorynotes about important parts of the statement. These notes provide more detailedinformation about the transactions occuring in the statements. Common issuesdiscussed include income taxes, revenue discussion, details about fixed assets,pension plan details, stock options and debt terms. Since the passage of Sarbanes-Oxley the financial statement notes also include information about compliance tothe law. Because these items can have an effect on the bottom line of a companythese notes are very important to read.
KEY TAKEAWAYS
• Sometimes the most important information is not in the main financialstatements. Be sure to look at all of the financial information—especiallythe notes! Management will explain (or try to explain!) the company’sactions in places other than the main financial statements.
• Statement of Shareholder Equity describes any changes to the equitysection of a firm’s balance sheet over a year.
• Statement of retained earnings reports the change in retained earningsover the year.
• The notes to financial statements are also very important as theycontain explanations about certain financial actions taken by thecompany.
24. Important informationdescribing what occurs infinancial statements.
Chapter 4 Financial Statements and Ratio Analysis
4.4 Other Statements 37

EXERCISE
1. Review the following 10-K statements
a. Here is a link to Nike’s 10-K.
(http://investors.nikeinc.com/Theme/Nike/files/doc_financials/AnnualReports/2010/docs/NIKE_2010_10-K.pdf) . Can you find the statement ofshareholder equity? The statement of retainedearnings? Any notes to financial statements?
b. Here is a link to Starbuck’s 2011 10-K.
http://investing.businessweek.com/research/stocks/financials/drawFiling.asp?docKey=136-000119312511317175-4GD90P5S78QNVSI18877OC4HLR&docFormat=HTM&formType=10-K
What does the statement of retained earnings sayabout the company?
c. Here is a link to McDonald’s 10-K.
http://www.aboutmcdonalds.com/mcd/investors/sec_filings.html
Can you find any notes to financial statements?
Chapter 4 Financial Statements and Ratio Analysis
4.4 Other Statements 38

4.5 Ratio Analysis
PLEASE NOTE: This book is currently in draft form; material is not final.
LEARNING OBJECTIVES
1. Understand how to analyze financial statements.2. Use the categories of ratios to gain knowledge about the strength of a
company.
This Sunday’s paper has a big ad for a toolbox. Jim was impressed and wanted to buy one forher father. Inside of it were all kinds of things: screwdrivers, hammers, pliers, etc. Someitems looked easy to use (hammer and screwdriver), while some items looked a bit morecomplicated (this big heavy looking drill). This toolbox had a bunch of incredibly useful stuffin it and Jim knew his dad knew how to use all of it.
Ratio analyses are also tools. They can be very useful, if you know how to properlyuse them (like Jim’s father) or dangerous if you don’t (like Jim). Some are easy tounderstand, others a bit more complicated. Instead of the toolbox from thenewspaper ad, in this section we focus on the financial manager’s toolkit and theitems inside.
Ratio analysis25 is one of the most important tools for evaluating a company’sfinancial health (and it can be fun too!). It’s not just about calculating ratios, it’sabout interpretation of the ratios and seeing changes, opportunities and threats.Ratios are only as good as the mind (yours) that analyzes them.
Ratios are divided into categories depending on what they analyze. The firstcategory is Liquidity Ratios.
Liquidity Ratios
Liquidity ratios26 measure the ability of a business to meet its short-term financialobligations. These ratios are associated with a firm’s working capital.
25. A quantitative tool used toanalyze a company’s financialstatements.
26. Ratios that measure the abilityof a company to meet its short-term financial obligations.
Chapter 4 Financial Statements and Ratio Analysis
39
Current Ratio
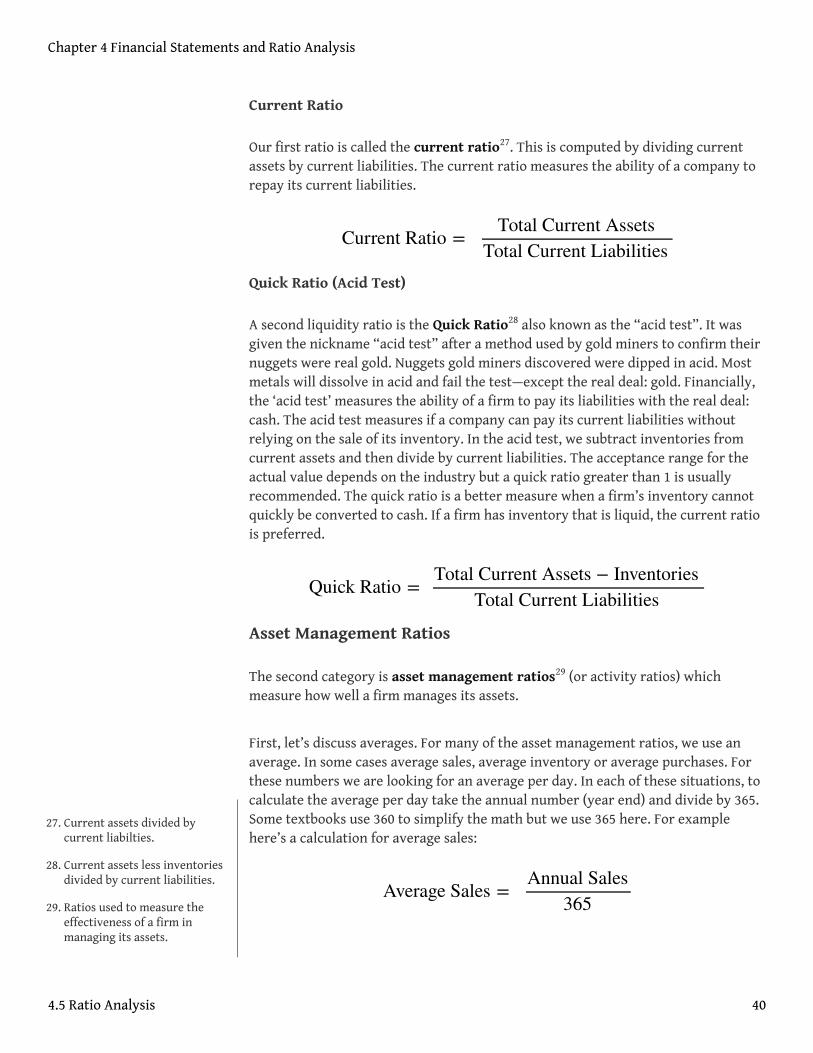
Our first ratio is called the current ratio27. This is computed by dividing currentassets by current liabilities. The current ratio measures the ability of a company torepay its current liabilities.
Quick Ratio (Acid Test)
A second liquidity ratio is the Quick Ratio28 also known as the “acid test”. It wasgiven the nickname “acid test” after a method used by gold miners to confirm theirnuggets were real gold. Nuggets gold miners discovered were dipped in acid. Mostmetals will dissolve in acid and fail the test—except the real deal: gold. Financially,the ‘acid test’ measures the ability of a firm to pay its liabilities with the real deal:cash. The acid test measures if a company can pay its current liabilities withoutrelying on the sale of its inventory. In the acid test, we subtract inventories fromcurrent assets and then divide by current liabilities. The acceptance range for theactual value depends on the industry but a quick ratio greater than 1 is usuallyrecommended. The quick ratio is a better measure when a firm’s inventory cannotquickly be converted to cash. If a firm has inventory that is liquid, the current ratiois preferred.
Asset Management Ratios
The second category is asset management ratios29 (or activity ratios) whichmeasure how well a firm manages its assets.
First, let’s discuss averages. For many of the asset management ratios, we use anaverage. In some cases average sales, average inventory or average purchases. Forthese numbers we are looking for an average per day. In each of these situations, tocalculate the average per day take the annual number (year end) and divide by 365.Some textbooks use 360 to simplify the math but we use 365 here. For examplehere’s a calculation for average sales:
Current Ratio =Total Current Assets
Total Current Liabilities
Quick Ratio =Total Current Assets − Inventories
Total Current Liabilities
Average Sales =Annual Sales
365
27. Current assets divided bycurrent liabilties.
28. Current assets less inventoriesdivided by current liabilities.
29. Ratios used to measure theeffectiveness of a firm inmanaging its assets.
Chapter 4 Financial Statements and Ratio Analysis
4.5 Ratio Analysis 40

That’s it! So any time you see an average in the next section remember to divide theannual number by 365.
Inventory Turnover Ratio
The inventory turnover ratio30 tells how many times during a year the firm’sinventory is bought and sold. Once again, this ratio is industry specific but arelatively high ratio is preferred. This result is most meaningful when compared tocompetitors and can be influenced by technology and distribution techniques.
Another meaningful measure is average age of inventory31. This is easilyconverted from the inventory turnover ratio by dividing the inventory turnoverratio into 365. Note that this is a different calculation than the averages computedabove.
Average Payment Period
The average payment period32 measures how long it takes a company to pay itssuppliers. It is calculated by dividing accounts payable by the average purchases perday. If average payment period increases then cash should increase as well.Companies usually pay their biggest suppliers first and some companies will payfaster to take advantage of trade discounts.
Receivables Turnover Ratio
The receivables turnover ratio33 is the other side of the coin. It measures how howeffective the company is in collecting money owed to them or how efficient they arein extending credit and collecting debts. It is the total revenue divided by theaverage receivables. Obviously we would like to get our money and sooner is betterthan later!
Inventory Turnover Ratio =Cost of Goods SoldAverage Inventory
Average Age of Inventory =365
Inventory Turnover Ratio
Average Payment Period =Accounts Payable
Average Purchases per Day
Receivables Turnover Ratio =Sales
Average Receivables
30. How many times during a yeara firm’s inventory is boughtand sold. Defined as the cost ofgoods sold divided by theaverage inventory.
31. Defined as 365 divided by theinventory turnover ratio.
32. Measures how long it takes acompany to pay its suppliers.Defined as accounts payabledivided by average purchasesper day.
33. Measures how effective acompany is in collecting moneyowed to them. Defined as salesdivided by accounts recievable.
Chapter 4 Financial Statements and Ratio Analysis
4.5 Ratio Analysis 41

Total Asset Turnover Ratio
Total asset turnover ratio34 gives us an idea how effectively a firm uses its assetsto generate sales. It is computed by dividing total revenues by total assets for thesame time period. If the asset turnover ratio is relatively high, then the firm isefficiently using its assets to generate sales. If it is relatively low, then the firm isnot using assets effectively and may want to consider selling some assets if sales donot increase.
Fixed Asset Turnover Ratio
Sometimes we also calculate the turnover on just our fixed assets such as plant andequipment. Because variable costs vary (that’s why they are variable costs!) thesecosts have different impacts on financial statements. Fixed asset turnover35
focuses on our long term assets and is calculated by dividing sales by net fixedassets (remember net means with depreciation taken out).
Debt Management Ratios
Debt management ratios36 measure how much a firm uses debt as a source offinancing. When a company uses debt financing, they use other people’s money tofinance their business activities. Debt has higher risk but also the potential forhigher return. Debt has an impact on a company’s financial statements. The moredebt a company uses, the greater the financial leverage. Because with debt thestockholders maintain control of the firm, the more debt a company uses, thegreater the financial leverage and the greater the returns to stockholders. With thedebt ratios we try to measure the indebtness the firm which gives us an idea of theriskiness of the firm as an investment. There are two types of measures of debtusage. The first is the ability of the company to pay back its debts. The second is thedegree of the indebtness of the firm. The first measure of the amount of debt a firmhas is the debt ratio.
Debt Ratio
The debt ratio37 is the ratio of debts to assets (in actuality total liabilities to totalassets). It measures the percentage of funds provided by current liabilities and bylong-term debt. Creditors prefer low debt ratios because a low ratio indicates that
Total Asset Turnover =Sales
Total Assets
Fixed Asset Turnover =Sales
Net Fixed Assets
34. A measure of how effective afirm is in using its assets togenerate sales. Defined as salesdivided by total assets.
35. A measure of how effective afirm is in using its fixed assetsto generate sales. Defined assales divided by total assets.
36. Calculate how much a firm usesdebt as a source of funding.
37. The ratio of debt to assets.Defined as total liabilitiesdivided by total assets.
Chapter 4 Financial Statements and Ratio Analysis
4.5 Ratio Analysis 42

the firm has plenty of assets to pay back its debts. In other words, the firm has afinancial ‘airbag’ in case of an accident which will protect against a creditor’s lossesin the event of bankruptcy. On the other hand, a stockholder may prefer a higherratio because that indicates the firm is appropriately using leverage whichmagnifies the stockholder’s return. Simply put, the debt ratio is a percent. It is thepercent of financing in the form of liabilities and is an indicator of financialleverage.
Debt-Equity Ratio
A close cousin of the debt ratio and another version of the indebtedness of a firm isthe debt-equity ratio38. The debt-equity ratio presents the information in a slightlydifferent way. It subtracts total liabilities from total assets in the denominator. Thiscalculation is easy to comprehend because it shows us dollars of debt for everydollar of equity.
Times-Interest-Earned (TIE, or the Ability to Pay Interest or InterestCoverage Ratio)
The first measure of how able a firm is to pay back its debt is the time-interest-earned39 or TIE. TIE measures the extent to which operating income can declinebefore the firm is unable to meet its annual interest costs. It is determined bydividing earnings before interest and taxes by interest expense. If a company failsto meet their interest payments then they can be sought after by creditors. Thehigher the number the more able a firm is to pay back its debts. A value of at least3.0 or preferably closer to 5.0 is preferred. (leave in?) The TIE number give us apercentage which is the percent that EBIT could fall by and the firm would still beable to make its interest payments.
EBITDA Coverage Ratio
Another measure of a firm’s ability to pay back debt is EBITDA coverage ratio40.The EBITDA Coverage ratio improves upon the TIE ratio because it includes leasepayments and because more cash is available for debt than just EBIT. This ratio is
Debt Ratio =Total Liabilities
Total Assets
Debt-Equity Ratio =Total Liabilities
(Total Assets − Total Liabilities)
Times-Interest-Earned =EBIT
Interest Expense
38. The ratio of dollars of debt forevery dollar of equity.Calculated by total liabilitiesdivided by the differencebetween total assets and totalliabilities.
39. A measure of the firm’s abilityto pay interest. Is EBIT dividedby interest expense.
40. Improves upon TIE byincluding other variables suchas lease payments. It iscalculated by the sum ofEBITDA and lease paymentsdivided by the sum of interestplus principal payments pluslease payments.
Chapter 4 Financial Statements and Ratio Analysis
4.5 Ratio Analysis 43

most useful for short-term lenders because over the short-term depreciation fundscan be used to pay off debt.
Fixed Payments Coverage Ratio
Another way to measure risk and the firm’s ability to pay back its debtors is thefixed-payments coverage ratio41. This ratio measures the firm’s ability to paybackall of its fixed-payment obligations such as loans and leases. The higher the valuethe better as that indicates the more the firm is able to cover its fixed payments.The lower the ratio, the greater the risk to lenders and owners.
Profitability Ratios
We love to focus on profit, the so called ‘bottom line’. Ratio analysis helps us to putour profit number into context. These ratios used together can help give a clearpicture of the profitability of a firm.
Profit Margin
Profit margin42 is the amount of profit left over from each dollar of sales afterexpenses are paid. The higher the number the better as it indicates that the firmretains more of each sales dollar.
Operating Profit Margin
Operating profit margin43 only uses operating expenses to calculate. It does notconsider items such as depreciation, interest or taxes. In this case, higher is alsobetter.
EBITDA Coverage Ratio = (EBITDA + Lease Payments)(Interest + Principal Payments + Lease Payments)
Fixed Payments Coverage Ratio =EBIT + Lease Payments
Interest + Lease Payments + {(Principal Payments + Preferred Stock Dividends) * { 11−T }}
Profit Margin =Sales − Cost of Goods Sold
Sales
Operating Profit Margin =Operating Profits
Sales
41. Measures the firm’s ability topayback all of its fixed-payment obligations such asloans and leases.
42. The amount of profit left overafter all expenses are paid.Defined by the differencebetween sales and cost of goodssold divided by sales.
43. Profit margin using onlyoperating expenses. Defined asoperating profits divided bysales.
Chapter 4 Financial Statements and Ratio Analysis
4.5 Ratio Analysis 44

Net Profit Margin
Net profit margin44 is the percentage of each sales dollar that remains after allexpenses have been deducted. Expenses including interest, taxes and preferredstock dividends. This can sometimes be referred to as net profits after taxes dividedby sales. In this situation, higher is also better but what is considered a ‘good’ profitmargin varies greatly across industries.
Earnings Per Share
Earnings per share45 are the amount of earnings generated by each share of stock.It is not necessarily the amount of earnings actually paid out per each share (that’sdividends per share). Earnings per share is the dollars earned for each share ofstock.
Basic Earning Power (BEP)
Basic Earning Power46 shows the raw earning power of the firm before theinfluence of taxes and leverage. This is helpful to analyze because firms have verydifferent financing and tax situations.
Return on Equity (ROE)
Two of our favorite (and most famous—if a ratio can be famous) ratios are ROE andROA. Both ratios are return on an outlay. Return on Equity47 is the ratio of netincome to total equity. This ratio tells us the return investors are earning on theirinvestment. The higher the ratio better.
Net Profit Margin =Earnings Available for Common Stockholders
Sales
Earnings Per Share =Earnings Available for Common Stockholders
Number of Shares of Common Stock Outstanding
Basic Earning Power =EBIT
Total Assets
Return on Equity =Net Income
Common Equity
44. Percentage of each dollar thatremains after all expenses havebeen paid. Calculated byearings available for commonstockholders divided by sales.
45. The amount of earningsgenerated by each share ofstock. It is earnings availablefor common stockholdersdivided by number of shares ofcommon stock outstanding.
46. The raw earning power of thefirm before taxes and leverage.It is EBIT divided by totalassets.
47. The return investors areearning on their investment.Defined as net income dividedby common equity.
Chapter 4 Financial Statements and Ratio Analysis
4.5 Ratio Analysis 45
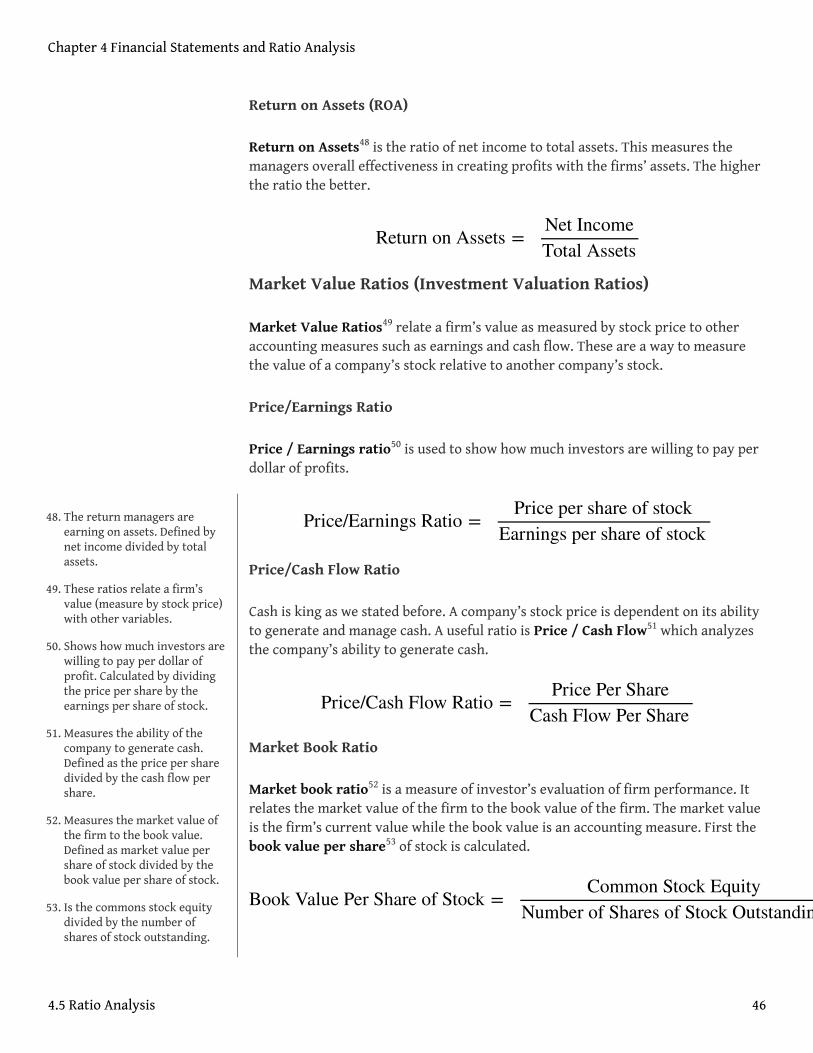
Return on Assets (ROA)
Return on Assets48 is the ratio of net income to total assets. This measures themanagers overall effectiveness in creating profits with the firms’ assets. The higherthe ratio the better.
Market Value Ratios (Investment Valuation Ratios)
Market Value Ratios49 relate a firm’s value as measured by stock price to otheraccounting measures such as earnings and cash flow. These are a way to measurethe value of a company’s stock relative to another company’s stock.
Price/Earnings Ratio
Price / Earnings ratio50 is used to show how much investors are willing to pay perdollar of profits.
Price/Cash Flow Ratio
Cash is king as we stated before. A company’s stock price is dependent on its abilityto generate and manage cash. A useful ratio is Price / Cash Flow51 which analyzesthe company’s ability to generate cash.
Market Book Ratio
Market book ratio52 is a measure of investor’s evaluation of firm performance. Itrelates the market value of the firm to the book value of the firm. The market valueis the firm’s current value while the book value is an accounting measure. First thebook value per share53 of stock is calculated.
Return on Assets =Net IncomeTotal Assets
Price/Earnings Ratio =Price per share of stock
Earnings per share of stock
Price/Cash Flow Ratio =Price Per Share
Cash Flow Per Share
Book Value Per Share of Stock =Common Stock Equity
Number of Shares of Stock Outstanding
48. The return managers areearning on assets. Defined bynet income divided by totalassets.
49. These ratios relate a firm’svalue (measure by stock price)with other variables.
50. Shows how much investors arewilling to pay per dollar ofprofit. Calculated by dividingthe price per share by theearnings per share of stock.
51. Measures the ability of thecompany to generate cash.Defined as the price per sharedivided by the cash flow pershare.
52. Measures the market value ofthe firm to the book value.Defined as market value pershare of stock divided by thebook value per share of stock.
53. Is the commons stock equitydivided by the number ofshares of stock outstanding.
Chapter 4 Financial Statements and Ratio Analysis
4.5 Ratio Analysis 46

This is then substituted in to calculate the Market/Book ratio
If a firm is expected to earn a high return relative to its risk will most often sell at ahigher Market/Book multiple.
KEY TAKEAWAYS
• Ratio analysis helps analyze the financial strength of a company• The main categories of ratio analysis are liquidity, debt management,
asset management, profitability and market value.
EXERCISE
1. Refer back to the Nike 10-K. What is their Quick Ratio? What is Nike’sROE? Debt ratio? Do the same for Starbucks.
Market Book Ratio =Market Value per share of common stockBook Value per share of common stock
Chapter 4 Financial Statements and Ratio Analysis
4.5 Ratio Analysis 47

4.6 Final Thoughts on Ratio Analysis
PLEASE NOTE: This book is currently in draft form; material is not final.
LEARNING OBJECTIVES
1. The DuPont equation combines ROE and ROA.2. Comments and limitations on ratio .
DuPont Equation
The DuPont equation54 is a handy way to analyze a company’s financial position bymerging the balance sheet and income statement using measures of profitability.DuPont merges ROA and ROE. ROA is now defined using two other ratios wecalculated: net profit margin and total asset turnover. ROA was calculated as netincome divided by total assets.
ROE was calculated as net income divided by earnings available to shareholders(common equity).
The DuPont equation defines ROA as follows:
Remembering that net profit margin is earnings available for shareholders dividedby sales and total asset turnover is sales divided by total assets, we can make thefollowing substitutions:
Return on Assets =Net IncomeTotal Assets
Return on Equity =Net Income
Common Equity
ROA = Net Profit Margin × Total Asset Turnover
54. Merges ROA and ROE. Breaks itdown into profit on acompany’s sales and return ona company’s assets.
Chapter 4 Financial Statements and Ratio Analysis
48

From this we see that sales will cancel out and ROA will become earnings availablefor shareholders divided by total assets.
This will give us the same number for ROA that was calculated using the originalformula. However, the DuPont equation breaks it down into two components: profiton a company’s sales and return to the use of a company’s assets.
Trend Analysis, Comparative Ratios and Benchmarking
Just as important as the actual numbers is the numbers value over time. Trends inratios tell us a lot about a company and can indicat if a company is trendingfavorably or unfavorably. Just as time series data is important—so is cross-sectional.We may have what we consider a fantastic ratio, but it may be low for our industtry.Ratios are particularly useful to compare to other companies and competitors.Ratios are available for industries and a company can see how it compares to itscompetitors.
Uses and Limitations of Ratio Analysis
Ratios are only as good as the head who analyzes them. They can be incrediblyhelpful tools when used properly and create horrible mistakes if misused.
1. A single ratio is generally not enough to judge the overall performanceof the firm.
2. Ratios should be used at the same time for each year.3. Be sure to use audited financial statements.4. Be aware of different accounting treatments behind the financial data
and ratios.
ROA =earnings available for shareholders
sales×
salestotal assets
ROA =earnings available for shareholders
total assets
Chapter 4 Financial Statements and Ratio Analysis
4.6 Final Thoughts on Ratio Analysis 49
KEY TAKEAWAYS
• Ratio analysis is an important and can be fun tool to use to analyze thefinancial health of a company. More than just plugging into equations isthe actual analysis of a company. Understanding what the ratios tell usand putting them into context is as important as getting the correctnumber out of the formula.
• The DuPont equation combines ROA and ROE to analyze a company.• Putting the numbers in context is as important as getting the correct
number. Looking at ratios over time and versus competitors gives usinsight into the company’s financial health.
EXERCISES
1. Calculate the DuPont equation from the following data.2. Review the company’s performance given the following time series and
cross-sectional data.
Chapter 4 Financial Statements and Ratio Analysis
4.6 Final Thoughts on Ratio Analysis 50
4.7 Worked Problem: CABS Inc.
PLEASE NOTE: This book is currently in draft form; material is not final.
LEARNING OBJECTIVES
1. See ratio analysis in work!2. Calculate and analyze ratios for a fictional company.
CABS Example
CABS Inc. is a fictional company that makes custom invitations and cards. Below aretheir financials.
Figure 4.6 CABS, Inc. Balance Sheet
Figure 4.7 CABS, Inc. Income Statement
Figure 4.8 CABS, Inc. Statement of Cash Flows
Figure 4.9 CABS, Inc. Other Data
In this section we pick some key ratios to calculate for CABS. Then we will analyzeusing data over time and versus competitors.
Liquidity Ratios
The two liquidity ratios are the Current Ratio and the Quick Ratio. Both areimportant to calculate.
Chapter 4 Financial Statements and Ratio Analysis
51

Current Ratio
To calculate the current ratio we take the current assets number from the balancesheet and divide it by the current liabilities number, also from the balance sheet.For CABS the calculation is:
Quick Ratio
To calculate the quick ratio we take three numbers from the balance sheet: currentassets, inventories and current liabilities.
Asset Management Ratios
Asset management ratios calculate how efficiently the firm uses its assets. Here wecalculate average sales per day, total asset turnover and fixed asset turnover.
Average Sales per Day
Average sales per day takes the sales number from the income statement anddivides it by 365.
Total Asset Turnover
Total asset turnover is computed by dividing the sales number from the incomestatement by the total asset number from the balance sheet.
Current Ratio =Total Current Assets
Total Current Liabilities=
315.7169.5
= 1.86
Quick Ratio =Total Current Assets − Inventories
Total Current Liabilities=
315.7 − 33.6169.5
= 1.66
average sales =annual sales
365=
1680.0365
Total Asset Turnover =Sales
Total Assets=
1680.0458.2
= 3.66
Chapter 4 Financial Statements and Ratio Analysis
4.7 Worked Problem: CABS Inc. 52

Fixed Asset Turnover
Fixed asset turnover focuses just on the fixed assets (for example a factory). Itdivides the sales number from the income statement by the net fixed assets (note:net!) from the balance sheet.
Debt Ratios
Debt management ratios measure the indebtness of the firm. The key ratios weanalyze here are the debt ratio, debt-equity and TIE.
Debt Ratio
The debt ratio simply divides two numbers from the balance sheet: total liabilitiesdivided by total assets.
Debt-Equity Ratio
The debt-equity ratio changes the denominator by subtracting total liabilities. Debt-equity also uses total assets and total liabilities from the balance sheet.
TIE
TIE measures the ability of a firm to pay back its debt. It uses EBIT and interestexpense from the income statement.
Profitability Ratios
Debt management ratios measure the indebtness of the firm. The key ratios weanalyze here are the debt ratio, debt-equity and TIE.
Fixed Asset Turnover =Sales
Net Fixed Assets=
1680.0142.5
Debt Ratio =Total Liabilities
Total Assets=
242.1458.2
= 0.52
Debt-Equity Ratio =Total Liabilities
(Total Assets − Total Liabilities)=
242.1458.20 − 242.1
= 1.12
Times-Interest-Earned =EBIT
Interest Expense=
222.625
Chapter 4 Financial Statements and Ratio Analysis
4.7 Worked Problem: CABS Inc. 53

Profit Margin
The amount of money left over after all expenses are paid. It uses sales and cost ofgoods sold from the income statement.
Operating Profit Margin
Operating profit margin is a better measure of the actual profit from operationsbecause it ignores items such as depreciation. It is operating profits (EBIT) dividedby sales. Both numbers come from the income statement.
Net Profit Margin
Net profit margin is the percentage of each sales dollar that remains after allexpenses have been deducted. It is calculated by dividing earnings (net income) bysales. Both numbers come from the income statement.
Earnings Per Share
Is the amount of earnings generated by each share of stock. It is calculated bydividing earnings by the number of shares of stock.
Basic Earning Power (BEP)
Basic Earning Power is earning power of the firm before taxes and leverage. It iscalculated by dividing EBIT from the income statement by total assets from thebalance sheet.
Profit Margin =Sales − Cost of Goods Sold
Sales=
1680.0 − 910.41680.0
= 0.46
Operating Profit Margin =Operating Profits (EBIT)
Sales=
222.61680.0
= 0.13
Net Profit Margin =Earnings Available for Common Stockholders
Sales=
118.61680.0
= 0.07
Earnings Per Share =Earnings Available for Common Stockholders
Number of Shares of Common Stock Outstanding=
118.66
= 19.77
Basic Earning Power =EBIT
Total Assets=
222.6458.2
= 0.49
Chapter 4 Financial Statements and Ratio Analysis
4.7 Worked Problem: CABS Inc. 54

Return on Equity (ROE)
Return on Equity is the ratio of net income to total equity. It is calculated bydividing net income from the income statement by equity, from the balance sheet.
Return on Assets (ROA)
Return on Assets is the ratio of net income to total assets. This is calculated bydiving net income from the income statement by total assets from the balancesheet.
Market Value Ratios (Investment Valuation Ratios)
Market Value Ratios are a way to measure the value of a company’s stock relative toanother company’s stock. Here we focus on P/E ratio and market book ratio.
Price/Earnings Ratio
Price / Earnings ratio is used to show how much investors are willing to pay perdollar of profits. It is calculated by dividing the price per share of stock (in the otherinformation section) by the earnings per share (calculated earlier).
Market Book Ratio
Market book ratio is a measure of investor’s evaluation of firm performance. Firstthe book value per share of stock is calculated using the common equity numberfrom the balance sheet and dividing it by the number of shares outstanding fromthe other information.
Return on Equity =Net Income
Common Stock Equity=
118.6216.1
= 0.55
Return on Assets =Net IncomeTotal Assets
=118.6458.2
= 0.26
Price/Earnings Ratio =Price per share of stock
Earnings per share of stock=
14919.77
= 7.54
Book Value Per Share of Stock =Common Stock Equity
Number of Shares of Stock Outstanding=
216.16
= 36.01
Chapter 4 Financial Statements and Ratio Analysis
4.7 Worked Problem: CABS Inc. 55

This is then substituted in to calculate the Market/Book ratio. This equation usesthe market price (selling price) per share of stock from the other informationsection and the book value calculated above.
Comparision Information
Below is a table summarizing the numbers we just calculated in the CABS 2011column. The table also includes CABS data from last year and also the industryaverage for 2011.
Figure 4.10 CABS, Inc. Averages
How do you think CABS is doing financially? How are they doing versus otherplayers in their industry?
KEY TAKEAWAYS
• Ratio analysis is easy and fun! It’s just a matter of knowing what numberto put where. Practice makes perfect!
• Comparing ratios over time and against competitors is an interestingway to analyze a company. It is as much of an art as it is a science.
Market Book Ratio =Market Value per share of common stockBook Value per share of common stock
=149
36.01= 4.13
Chapter 4 Financial Statements and Ratio Analysis
4.7 Worked Problem: CABS Inc. 56

EXERCISES
1. Calculate the following ratios from the data for CABS (these werenot calculated above):
a. DuPont equationb. Inventory turnoverc. average age of inventoryd. average payment periode. net profit
2. Review the 10-K for Starbucks again. Compute some ratios for Starbucks.Then find some already computed ratios on yahoo.finance. Did you getthe same numbers as an analyst? Why or why not?
Chapter 4 Financial Statements and Ratio Analysis
4.7 Worked Problem: CABS Inc. 57

4.8 End-of-Chapter Assessment
End-of-Chapter Assessment Head
First paragraph.
Paragraph.
Paragraph.
Last paragraph.
End-of-Chapter Assessment Head
1.2.3.4.5.
Chapter 4 Financial Statements and Ratio Analysis
58

End-of-Chapter Assessment Head
1.
a.b.c.d.e.
2.
a.b.c.d.e.
3.
a.b.c.d.e.
Chapter 4 Financial Statements and Ratio Analysis
4.8 End-of-Chapter Assessment 59