financial statements - anglo american annual...
TRANSCRIPT
93Anglo American plc Annual Report 2009
Financial statements
Financial statements
Contents
Responsibility statements 94Independent auditors’ report to the members of Anglo American plc 95
Principal statementsConsolidated income statement 96Consolidated statement of comprehensive income 96Consolidated balance sheet 97Consolidated cash flow statement 98Consolidated statement of changes in equity 99
Notes to the financial statements 1 Accounting policies 100 2 Segmental information 106 3 Reconciliation of Underlying earnings to Profit for the financial year
attributable to equity shareholders of the Company 109 4 Operating profit from subsidiaries and joint ventures 110 5 Exploration expenditure 111 6 Employee numbers and costs 111 7 Special items and remeasurements 111 8 Net finance costs 114 9 Financial instrument gains and losses 114 10 Tax on profit on ordinary activities 114 11 Dividends 115 12 Earnings per share 115 13 Intangible assets 116 14 Tangible assets 116 15 Environmental rehabilitation trusts 117 16 Investments in associates 117 17 Joint ventures 118 18 Financial asset investments 118 19 Inventories 118 20 Trade and other receivables 119 21 Trade and other payables 119 22 Financial assets 119 23 Financial liabilities 120 24 Financial risk management and derivative financial assets/liabilities 121 25 Provisions for liabilities and charges 126 26 Deferred tax 126 27 Retirement benefits 127 28 Called-up share capital and share-based payments 130 29 Consolidated equity analysis 136 30 Consolidated cash flow analysis 137 31 EBITDA by segment 1383 2 Acquisitions 139 33 Disposals of subsidiaries and businesses 140 34 Disposal groups and non-current assets held for sale 14135 Capital commitments 141 36 Contingent liabilities and contingent assets 141 37 Operating leases 141 38 Related party transactions 141 39 Group companies 14340 Events occurring after end of year 144 41 Financial statements of the parent company 145

Financial statements
94 Anglo American plc Annual Report 2009
Responsibility statementsfor the year ended 31 December 2009
We confirm that to the best of our knowledge:
(a) the financial statements, prepared in accordance with the applicable set of accounting standards, give a true and fair view of the assets, liabilities, financial position and profit of Anglo American plc and the undertakings included in the consolidation taken as a whole; and
(b) the Operating and financial review includes a fair review of the development and performance of the business and the position of Anglo American plc and the undertakings included in the consolidation taken as a whole, together with a description of the principal risks and uncertainties that they face.
By order of the Board
Cynthia Carroll René MédoriChief executive Finance director

95Anglo American plc Annual Report 2009
Financial statements
Independent auditors’ report to the members of Anglo American plc
We have audited the financial statements of Anglo American plc for the year ended 31 December 2009 which comprise the Consolidated income statement, the Consolidated statement of comprehensive income, the Consolidated balance sheet, the Consolidated cash flow statement, the Consolidated statement of changes in equity, the Accounting policies, the related notes 2 to 40 and the Balance sheet of the Company and related information in note 41. The financial reporting framework that has been applied in the preparation of the Group financial statements is applicable law and International Financial Reporting Standards (IFRSs) as adopted by the European Union. The financial reporting framework that has been applied in the preparation of the Company financial statements is applicable law and United Kingdom Accounting Standards (United Kingdom Generally Accepted Accounting Practice).
This report is made solely to the Company’s members, as a body, in accordance with Chapter 3 of Part 16 of the Companies Act 2006. Our audit work has been undertaken so that we might state to the Company’s members those matters we are required to state to them in an auditors’ report and for no other purpose. To the fullest extent permitted by law, we do not accept or assume responsibility to anyone other than the Company and the Company’s members as a body, for our audit work, for this report, or for the opinions we have formed.
Respective responsibilities of directors and auditorsAs explained more fully in the Statement of directors’ responsibilities, the directors are responsible for the preparation of the financial statements and for being satisfied that they give a true and fair view. Our responsibility is to audit the financial statements in accordance with applicable law and International Standards on Auditing (UK and Ireland). Those standards require us to comply with the Auditing Practices Board’s (APB’s) Ethical Standards for Auditors.
Scope of the audit of the financial statementsAn audit involves obtaining evidence about the amounts and disclosures in the financial statements sufficient to give reasonable assurance that the financial statements are free from material misstatement, whether caused by fraud or error. This includes an assessment of: whether the accounting policies are appropriate to the Group’s and the Company’s circumstances and have been consistently applied and adequately disclosed; the reasonableness of significant accounting estimates made by the directors; and the overall presentation of the financial statements.
Opinion on financial statementsIn our opinion:
the financial statements give a true and fair • view of the state of the Group’s and of the
Company’s affairs as at 31 December 2009 and of the Group’s profit for the year then ended;the Group financial statements have been • properly prepared in accordance with IFRSs as adopted by the European Union;the Company financial statements have been • properly prepared in accordance with United Kingdom Generally Accepted Accounting Practice; andthe financial statements have been prepared • in accordance with the requirements of the Companies Act 2006; and, as regards the Group financial statements, Article 4 of the IAS Regulation.
Opinion on other matters prescribed by the Companies Act 2006In our opinion:
the part of the Remuneration report to be • audited has been properly prepared in accordance with the Companies Act 2006; andthe information given in the Directors’ report • for the financial year for which the financial statements are prepared is consistent with the financial statements.
Matters on which we are required to report by exceptionWe have nothing to report in respect of the following:
Under the Companies Act 2006 we are required to report to you if, in our opinion:
adequate accounting records have not been • kept by the Company, or returns adequate for our audit have not been received from branches not visited by us; orthe Company financial statements and the part • of the Remuneration report to be audited are not in agreement with the accounting records and returns; orcertain disclosures of directors’ remuneration • specified by law are not made; orwe have not received all the information and • explanations we require for our audit.
Under the Listing rules we are required to review:the directors’ statement contained within the • Directors’ report in relation to going concern; andthe part of the Corporate governance section • relating to the Company’s compliance with the nine provisions of the June 2008 Combined Code specified for our review.
Timothy Powell (Senior Statutory Auditor)for and on behalf of Deloitte LLPChartered Accountants and Statutory Auditors London, United Kingdom
18 February 2010

Financial statements Consolidated income statementfor the year ended 31 December 2009
96 Anglo American plc Annual Report 2009
Consolidated statement of comprehensive income for the year ended 31 December 2009
2009 2008
US$ million Note
Before special items and
remeasurements
Special items and
remeasurements (note 7) Total
Before special items and
remeasurements
Special items and
remeasurements (note 7) Total
Group revenue 2 20,858 – 20,858 26,311 – 26,311Total operating costs (16,481) (1,637) (18,118) (18,330) (1,131) (19,461)Operating profit from subsidiaries and joint ventures 2,4 4,377 (1,637) 2,740 7,981 (1,131) 6,850Net profit on disposals 7 – 1,612 1,612 – 1,009 1,009Share of net income from associates 2,16 318 (234) 84 1,303 (190) 1,113Total profit from operations and associates 4,695 (259) 4,436 9,284 (312) 8,972
Investment income 514 – 514 589 – 589Interest expense (780) – (780) (850) – (850)Other financing losses (7) (134) (141) (191) 51 (140)
Net finance costs 8 (273) (134) (407) (452) 51 (401)Profit before tax 4,422 (393) 4,029 8,832 (261) 8,571Income tax expense 10 (1,305) 188 (1,117) (2,545) 94 (2,451)Profit for the financial year 3,117 (205) 2,912 6,287 (167) 6,120Attributable to:Minority interests 548 (61) 487 1,050 (145) 905Equity shareholders of the Company 3 2,569 (144) 2,425 5,237 (22) 5,215
Earnings per share (US$)Basic 12 2.02 4.34Diluted 12 1.98 4.29
Underlying earnings and underlying earnings per share are set out in note 12.
US$ million Note 2009 2008
Profit for the financial year 2,912 6,120Net gain/(loss) on revaluation of available for sale investments 741 (888)Net gain/(loss) on cash flow hedges 122 (874)Net (loss)/gain on cash flow hedges – associates (2) 4Net exchange gain/(loss) on translation of foreign operations 3,819 (4,514)Actuarial net loss on post retirement benefit schemes (217) (129)Actuarial net loss on post retirement benefit schemes – associates (5) (7)Deferred tax 29 (74) 167Net income/(expense) recognised directly in equity 4,384 (6,241)Transferred to income statement: sale of available for sale investments (1,554) (476)Transferred to income statement: cash flow hedges 162 380Transferred to initial carrying amount of hedged items: cash flow hedges 30 637Transferred to income statement: exchange differences on disposal of foreign operations (2) 2Tax on items transferred from equity 29 77 (94)Total transferred from equity (1,287) 449Total comprehensive income for the financial year 6,009 328Attributable to:Minority interests 783 487Equity shareholders of the Company 5,226 (159)

97Anglo American plc Annual Report 2009
Consolidated balance sheetas at 31 December 2009
Financial statements
US$ million Note 2009 2008 2007
Intangible assets 13 2,776 3,006 1,556Tangible assets 14 35,198 29,545 23,534Environmental rehabilitation trusts 15 342 244 252Investments in associates 16 3,312 3,612 3,341Financial asset investments 18 2,726 3,115 4,780Trade and other receivables 20 206 94 159Deferred tax assets 26 288 258 474Other financial assets (derivatives)(1) 24 238 117 160Other non-current assets 191 167 105Total non-current assets 45,277 40,158 34,361Inventories 19 3,212 2,702 2,344Trade and other receivables 20 3,348 2,929 3,572Current tax assets 214 471 223Other financial assets (derivatives)(1) 24 365 259 375Financial asset investments 18,30b 3 173 –Cash and cash equivalents 30b 3,269 2,771 3,129Total current assets 10,411 9,305 9,643Assets classified as held for sale 34 620 275 758Total assets 56,308 49,738 44,762Trade and other payables 21 (4,395) (4,770) (3,950)Short term borrowings 23,30b (1,499) (6,784) (5,895)Short term provisions 25 (209) (168) (142)Current tax liabilities (566) (804) (992)Other financial liabilities (derivatives)(1) 24 (76) (598) (375)Total current liabilities (6,745) (13,124) (11,354)Medium and long term borrowings 23,30b (12,816) (7,211) (2,404)Retirement benefit obligations 27 (706) (401) (444)Other financial liabilities (derivatives)(1) 24 (583) (899) (211)Deferred tax liabilities 26 (5,192) (4,555) (4,650)Provisions for liabilities and charges 25 (1,583) (1,317) (1,082)Other non-current liabilities (423) (395) –Total non-current liabilities (21,303) (14,778) (8,791)Liabilities directly associated with assets classified as held for sale 34 (191) (80) (287)Total liabilities (28,239) (27,982) (20,432)Net assets 28,069 21,756 24,330
EquityCalled-up share capital 28 738 738 738Share premium account 2,713 2,713 2,713Other reserves 1,379 (2,057) 3,155Retained earnings 21,291 18,827 15,855Equity attributable to equity shareholders of the Company 26,121 20,221 22,461Minority interests 1,948 1,535 1,869Total equity 28,069 21,756 24,330
(1) Comparatives have been adjusted in accordance with IAS 1 Presentation of Financial Statements – Improvements, as described in note 1.
The financial statements of Anglo American plc, registered number 3564138, were approved by the Board of directors on 18 February 2010.
Cynthia Carroll René MédoriChief executive Finance director

Financial statements
98 Anglo American plc Annual Report 2009
Consolidated cash flow statementfor the year ended 31 December 2009
US$ million Note 2009 2008
Cash inflows from operations 30a 4,904 9,579Dividends from associates 616 609Dividends from financial asset investments 23 50Income tax paid (1,456) (2,173)Net cash inflows from operating activities 4,087 8,065
Cash flows from investing activitiesAcquisition of subsidiaries, net of cash and cash equivalents acquired(1) 32 (79) (5,887)Investment in joint ventures 32 (5) (609)Investment in associates (31) (9)Cash flows from derivatives related to acquisitions – (661)Purchase of tangible assets 2 (4,607) (5,146)Purchase of financial asset investments (269) (741)Investment of advance received in anticipation of disposal(2) – (281)Loans granted (134) (108)Interest received and other investment income 244 291Disposal of subsidiaries, net of cash and cash equivalents disposed 33 69 468Sale of interests in associates 662 205Repayment of loans and capital by associates – 42Proceeds from disposal of tangible assets 46 30Proceeds from sale of financial asset investments 2,041 851Cash flows from derivatives related to investing activities (excluding acquisitions) (150) (166)Other investing activities (10) (29)Net cash used in investing activities (2,223) (11,750)
Cash flows from financing activitiesIssue of shares by subsidiaries to minority interests 96 62Sale of treasury shares to employees 29 40Purchase of treasury shares (75) (710)Interest paid (741) (741)Dividends paid to minority interests (472) (796)Dividends paid to Company shareholders – (1,550)(Repayment)/receipt of short term borrowings (6,624) 1,432Net proceeds from issue of convertible bond 1,685 –Net proceeds from issue of US bond 1,992 –Net proceeds from bonds issued under EMTN programme 2,215 2,404Receipt of other medium and long term borrowings 361 2,777Cash flows from derivatives related to net debt (85) 380Advance received in anticipation of disposal(2) – 307Other financing activities 14 (63)Net cash (used in)/inflows from financing activities (1,605) 3,542Net increase/(decrease) in cash and cash equivalents 259 (143)
Cash and cash equivalents at start of year 30c 2,744 3,074Cash movements in the year 259 (143)Effects of changes in foreign exchange rates 316 (187)Cash and cash equivalents at end of year 30c 3,319 2,744
(1) Includes amounts paid to acquire minority interests in subsidiaries.(2) Advance received in the year ended 31 December 2008 in respect of anticipated disposal of the Group’s 50% interest in the Booysendal joint venture, invested in unlisted preference shares and an escrow account,
pending completion of the transaction which occurred in June 2009. Following completion of the transaction the preference shares were sold and the proceeds are shown within ‘Proceeds from sale of financial asset investments’. At 31 December 2009 a further amount of $72 million remains in an escrow account pending completion of documentation.

99Anglo American plc Annual Report 2009
Financial statements
Consolidated statement of changes in equityfor the year ended 31 December 2009
US$ million
Total share
capital(1)Retained earnings
Share- based
payment reserve
Cumulative translation adjustment
reserve
Fair valueand otherreserves
(note 29)
Total equity attributable
to equity shareholders
of the Company
Minority interests
Total equity
Balance at 1 January 2008 3,451 15,855 262 20 2,873 22,461 1,869 24,330Total comprehensive income – 5,113 – (4,097) (1,175) (159) 487 328Dividends paid – (1,538) – – – (1,538) – (1,538)Dividends paid to minority interests – – – – – – (796) (796)Acquisition and disposal of businesses (including issue of shares to minority interests) – 6 – – – 6 (45) (39)
Minority conversion of Anglo Platinum’s preference shares – 6 – – – 6 (6) –Share buybacks – (595) – – – (595) – (595)Purchase of shares for share schemes – (88) – – – (88) – (88)Share-based payment charges on equity settled schemes – – 146 – – 146 11 157Issue of shares under employee share schemes – 97 (70) – – 27 – 27Current tax on exercised employee share schemes – 10 – – – 10 – 10Issue/purchase of treasury shares in subsidiary entities – 6 – – – 6 – 6Other – (45) (50) – 34 (61) 15 (46)Balance at 1 January 2009 3,451 18,827 288 (4,077) 1,732 20,221 1,535 21,756Total comprehensive income – 2,257 – 3,526 (557) 5,226 783 6,009Dividends paid to minority interests – – – – – – (472) (472)Acquisition and disposal of businesses (including issue of shares to minority interests) – – (14) – (1) (15) 57 42Purchase of shares for share schemes – (32) – – – (32) – (32)Share-based payment charges on equity settled schemes – – 194 – – 194 16 210Issue of shares under employee share schemes – 108 (87) – – 21 – 21Current tax on exercised employee share schemes – (1) – – – (1) – (1)Issue/purchase of treasury shares in subsidiary entities – (11) – – – (11) 15 4Issue of convertible bond – – – – 355 355 – 355Other – 143 20 – – 163 14 177Balance at 31 December 2009 3,451 21,291 401 (551) 1,529 26,121 1,948 28,069
(1) Total share capital comprises called-up share capital of $738 million (2008: $738 million) and the share premium account of $2,713 million (2008: $2,713 million).
Dividends
Note 2009 2008
Proposed ordinary dividend per share (US cents) – –Proposed ordinary dividend (US$ million) – –
Ordinary dividends paid during the year per share (US cents) 11 – 130Ordinary dividends paid during the year (US$ million) 11 – 1,538

Financial statements
100 Anglo American plc Annual Report 2009
Notes to the financial statements
1. Accounting policiesBasis of preparationThe financial statements have been prepared in accordance with International Financial Reporting Standards (IFRS) and International Financial Reporting Interpretation Committee (IFRIC) interpretations adopted for use by the European Union, with those parts of the Companies Act 2006 applicable to companies reporting under IFRS and with the requirements of the Disclosure and Transparency rules of the Financial Services Authority in the United Kingdom as applicable to periodic financial reporting. The financial statements have been prepared under the historical cost convention as modified by the revaluation of pension assets and liabilities and certain financial instruments. A summary of the principal Group accounting policies is set out below with an explanation of changes to previous policies following adoption of new accounting standards and interpretations in the year.
The details of the elections made on conversion to IFRS were set out in the 31 December 2005 Annual Report.
The preparation of financial statements in conformity with generally accepted accounting principles, requires the use of estimates and assumptions that affect the reported amounts of assets and liabilities at the date of the financial statements and the reported amounts of revenues and expenses during the reporting period. Although these estimates are based on management’s best knowledge of the amount, event or actions, actual results ultimately may differ from those estimates.
Details of the Group’s significant accounting policies and critical accounting estimates are set out in the ‘Operating and financial review’ and form part of these financial statements; these are set out on pages 66 and 67.
Significant areas of estimation uncertainty include:useful economic lives of assets and ore reserves estimates;• impairment of assets;• restoration, rehabilitation and environmental costs; and• retirement benefits.•
Going concernThe directors have, at the time of approving the financial statements, a reasonable expectation that the Company and the Group have adequate resources to continue in operational existence for the foreseeable future. Thus the going concern basis of accounting in preparing the financial statements continues to be adopted. Further details are contained in the Directors’ report on page 71.
Adoption of standards and changes in accounting policiesThe Group has adopted, with effect from 1 January 2009, IFRS 8 Operating Segments, IAS 1 Presentation of Financial Statements – Revised, IAS 1 Presentation of Financial Statements – Improvements and IFRS 7 Financial Instruments: Disclosures – Amendment.
The adoption of IFRS 8 has resulted in the segmental disclosures previously required by IAS 14 Segment Reporting being replaced by those required under IFRS 8. The segments identified in accordance with IFRS 8 are aligned to the Group’s structure of Business Units based around core commodities. In addition assets identified for divestment are managed as a separate Business Unit, Other Mining and Industrial.
The adoption of the revision to IAS 1 has resulted in the Consolidated statement of changes in equity being presented as a primary statement (previously disclosed as a note titled ‘Reconciliation of changes in equity’) and disclosure of the tax impact of individual items in the Consolidated statement of comprehensive income (by way of note). In addition, the Group has elected to continue to present a separate income statement and statement of comprehensive income.
The adoption of the improvements to IAS 1 has resulted in non-hedge derivatives whose expected settlement date is more than one year from the period end being reclassified from current to non-current and therefore the comparative information in the Consolidated balance sheet has been adjusted as follows:
2008 2007
US$ million CurrentNon-
current CurrentNon-
current
Other financial assets (derivatives)As previously reported 372 4 535 –Reclassification (113) 113 (160) 160As reported 259 117 375 160Other financial liabilities (derivatives)As previously reported (1,436) (61) (501) (85)Reclassification 838 (838) 126 (126)As reported (598) (899) (375) (211)AssetsAs previously reported 9,418 40,045 9,803 34,201Reclassification (113) 113 (160) 160As reported 9,305 40,158 9,643 34,361LiabilitiesAs previously reported (13,962) (13,940) (11,480) (8,665)Reclassification 838 (838) 126 (126)As reported (13,124) (14,778) (11,354) (8,791)
Due to the adoption of the revision and improvements to IAS 1, certain 2007 information has been included in the 2009 Financial statements.
IFRS 7 Financial Instruments: Disclosures – Amendment has resulted in additional disclosures in relation to financial assets and liabilities which are carried at fair value on the balance sheet. The amendment also reinforces existing principles for disclosure about liquidity risk. The amendment does not require comparative information to be provided in respect of the additional disclosures.
A number of other amendments to accounting standards and new interpretations issued by the International Accounting Standards Board (IASB) were applicable from 1 January 2009. They have not had a material impact on the accounting policies, methods of computation or presentation applied by the Group.
Basis of consolidationThe financial statements incorporate a consolidation of the financial statements of the Company and entities controlled by the Company (its subsidiaries) made up to 31 December each year. Control is achieved where the Company has the power to govern the financial and operating policies of an investee entity so as to obtain benefits from its activities.
The results of subsidiaries acquired or disposed of during the year are included in the Consolidated income statement from the effective date of acquisition or up to the effective date of disposal, as appropriate.
Where necessary, adjustments are made to the results of subsidiaries, joint ventures and associates to bring their accounting policies into line with those used by the Group. Intra-group transactions, balances, income and expenses are eliminated on consolidation, where appropriate.
For non-wholly owned subsidiaries, a share of the profit for the financial year and net assets is attributed to the minority interests as shown in the Consolidated income statement and Consolidated balance sheet. Any losses applicable to the minority interests in excess of the total recognised minority interests are allocated against the interests of the parent until such time as future profits have exceeded the losses previously absorbed.
AssociatesAssociates are investments over which the Group is in a position to exercise significant influence, but not control or joint control, through participation in the financial and operating policy decisions of the investee. Typically the Group owns between 20% and 50% of the voting equity of its associates. Investments in associates are accounted for using the equity method of accounting except when classified as held for sale.
The Group’s share of associates’ net income is based on their most recent audited financial statements or unaudited interim statements drawn up to the Group’s balance sheet date.

101Anglo American plc Annual Report 2009
Financial statements
For non-wholly owned subsidiaries, minority interests are initially recorded at the minorities’ proportion of the fair values of the assets and liabilities recognised at acquisition.
Tangible assetsMining properties and leases include the cost of acquiring and developing mining properties and mineral rights.
Mining properties are depreciated down to their residual values using the unit of production method based on proven and probable reserves. Depreciation is charged on new mining ventures from the date that the mining property is capable of commercial production. When there is little likelihood of a mineral right being exploited, or the value of the exploitable mineral right has diminished below cost, a write down to the recoverable amount is charged to the income statement.
For open pit operations the removal of overburden or waste ore is required to obtain access to the orebody. To the extent that the actual waste material removed per tonne of ore mined (known as the stripping ratio) is higher than the average stripping ratio in the early years of a mine’s production phase, the costs associated with this process are deferred and charged to operating costs using the expected average stripping ratio over the life of the area being mined. This reflects the fact that waste removal is necessary to gain access to the orebody and therefore realise future economic benefit. The average stripping ratio is calculated as the number of tonnes of waste material expected to be removed during the life of mine, per tonne of ore mined. The average life of mine cost per tonne is calculated as the total expected costs to be incurred to mine the orebody divided by the number of tonnes expected to be mined. The cost of stripping in any period will therefore be reflective of the average stripping rates for the orebody as a whole. However, where the pit profile is such that the actual stripping ratio is below the average in the early years no deferral takes place as this would result in recognition of a liability for which there is no obligation. Instead this position is monitored and when the cumulative calculation reflects a debit balance deferral commences. The average life of mine stripping ratio and the average life of mine cost per tonne are recalculated annually in light of additional knowledge and changes in estimates. Changes in the life of mine stripping ratio are accounted for prospectively as a change in estimate.
Land and properties in the course of construction are carried at cost less any recognised impairment. Depreciation commences when the assets are ready for their intended use. Buildings and plant and equipment are depreciated down to their residual values at varying rates on a straight line basis over their estimated useful lives or the life of mine, whichever is shorter. Estimated useful lives normally vary from up to 20 years for items of plant and equipment to a maximum of 50 years for buildings.
Residual values and estimated useful lives are reviewed at least annually.
Assets held under finance leases are depreciated over the shorter of the lease term and the estimated useful lives of the assets.
Non-mining licences and other intangiblesNon-mining licences and other intangibles are measured initially at purchase cost and are amortised on a straight line basis over their estimated useful lives. Estimated useful lives are usually between three and five years.
Impairment of tangible and intangible assets excluding goodwillAt each balance sheet date, the Group reviews the carrying amounts of its tangible and intangible assets to determine whether there is any indication that those assets are impaired. If such an indication exists, the recoverable amount of the asset is estimated in order to determine the extent of any impairment. Where the asset does not generate cash flows that are independent from other assets, the Group estimates the recoverable amount of the cash generating unit (CGU) to which the asset belongs. An intangible asset with an indefinite useful life is tested for impairment annually and whenever there is an indication that the asset may be impaired.
1. Accounting policies continuedThe total carrying values of investments in associates represent the cost of each investment including the carrying value of goodwill, the share of post acquisition retained earnings, any other movements in reserves and any long term debt interests which in substance form part of the Group’s net investment. The carrying values of associates are reviewed on a regular basis and if an impairment in value has occurred, it is written off in the period in which those circumstances are identified. The Group’s share of an associate’s losses in excess of its interest in that associate is not recognised unless the Group has an obligation to fund such losses.
Joint venture entitiesA joint venture entity is an entity in which the Group holds a long term interest and shares joint control over strategic, financial and operating decisions with one or more other venturers under a contractual arrangement.
The Group’s share of the assets, liabilities, income, expenditure and cash flows of such jointly controlled entities are accounted for using proportionate consolidation. Proportionate consolidation combines the Group’s share of the results of the joint venture entity on a line by line basis with similar items in the Group’s financial statements.
Joint venture operationsThe Group has contractual arrangements with other participants to engage in joint activities other than through a separate entity. The Group includes its assets, liabilities, expenditure and its share of revenue in such joint venture operations with similar items in the Group’s financial statements.
Revenue recognitionRevenue is derived principally from the sale of goods and is measured at the fair value of consideration received or receivable, after deducting discounts, volume rebates, value added tax and other sales taxes. Sales of concentrate are stated at their invoiced amount which is net of treatment and refining charges. A sale is recognised when the significant risks and rewards of ownership have passed. This is usually when title and insurance risk have passed to the customer and the goods have been delivered to a contractually agreed location.
Revenue from metal mining activities is based on the payable metal sold.
Sales of certain commodities are ‘provisionally priced’ such that the price is not settled until a predetermined future date based on the market price at that time. Revenue on these sales is initially recognised (when the above criteria are met) at the current market price. ‘Provisionally priced’ sales are marked to market at each reporting date using the forward price for the period equivalent to that outlined in the contract. This mark to market adjustment is recorded in revenue.
Revenues from the sale of material by-products are included within revenue. Where a by-product is not regarded as significant, revenue may be credited against the cost of sales.
Interest income is accrued on a time basis, by reference to the principal outstanding and at the effective interest rate applicable.
Dividend income from investments is recognised when the shareholders’ rights to receive payment have been established.
Business combinations and goodwill arising thereonThe identifiable assets, liabilities and contingent liabilities of a subsidiary, joint venture entity or an associate, which can be measured reliably are recorded at their provisional fair values at the date of acquisition. Any excess of the cost of acquisition over the fair values of the identifiable net assets acquired is attributed to goodwill. Provisional fair values are finalised within 12 months of the acquisition date.
Goodwill in respect of subsidiaries and joint ventures is included within intangible assets. Goodwill relating to associates is included within the carrying value of the associate.
Where the fair value of the identifiable net assets acquired exceeds the cost of the acquisition, the surplus, which represents the discount on the acquisition, is credited to the income statement in the period of acquisition.

Financial statements
102 Anglo American plc Annual Report 2009
Notes to the financial statementscontinued
Retirement benefitsThe Group operates both defined benefit and defined contribution schemes for its employees as well as post retirement medical plans. For defined contribution schemes the amount charged to the income statement is the contributions paid or payable during the year.
For defined benefit pension and post retirement medical plans, full actuarial valuations are carried out every three years using the projected unit credit method and updates are performed for each financial year end. The average discount rate for the plans’ liabilities is based on AA rated corporate bonds of a suitable duration and currency or, where there is no ‘deep market’ for such bonds, based on government bonds. Pension plan assets are measured using year end market values.
Actuarial gains and losses, which can arise from differences between expected and actual outcomes or changes in actuarial assumptions, are recognised immediately in the Consolidated statement of comprehensive income. Any increase in the present value of plan liabilities expected to arise from employee service during the year is charged to operating profit. The expected return on plan assets and the expected increase during the year in the present value of plan liabilities are included in investment income and interest expense respectively.
Past service cost is recognised immediately to the extent that the benefits are already vested and otherwise is amortised on a straight line basis over the average period until the benefits become vested.
The retirement benefit obligation recognised in the balance sheet represents the present value of the defined benefit obligation as adjusted for unrecognised past service costs and as reduced by the fair value of scheme assets. Any asset resulting from this calculation is limited to past service cost, plus the present value of available refunds and reductions in future contributions to the plan.
TaxThe tax expense includes the current tax charge and deferred tax charged to the income statement.
Current tax payable is based on taxable profit for the year. Taxable profit differs from net profit as reported in the income statement because it excludes items of income or expense that are taxable or deductible in other years and it further excludes items that are not taxable or deductible. The Group’s liability for current tax is calculated using tax rates that have been enacted or substantively enacted by the balance sheet date.
Deferred tax is the tax expected to be payable or recoverable on differences between the carrying amount of assets and liabilities in the financial statements and the corresponding tax basis used in the computation of taxable profit and is accounted for using the balance sheet liability method. Deferred tax liabilities are generally recognised for all taxable temporary differences and deferred tax assets are recognised to the extent that it is probable that taxable profits will be available against which deductible temporary differences can be utilised. Such assets and liabilities are not recognised if the temporary differences arise from the initial recognition of goodwill or an asset or liability in a transaction (other than in a business combination) that affects neither taxable profit nor accounting profit.
Deferred tax liabilities are recognised for taxable temporary differences arising on investments in subsidiaries, joint ventures and associates except where the Group is able to control the reversal of the temporary difference and it is probable that the temporary difference will not reverse in the foreseeable future.
The carrying amount of deferred tax assets is reviewed at each balance sheet date and is adjusted to the extent that it is no longer probable that sufficient taxable profit will be available to allow all or part of the asset to be recovered.
1. Accounting policies continuedRecoverable amount is the higher of fair value (less costs to sell) and value in use. In assessing value in use, the estimated future cash flows are discounted to their present value using a pre-tax discount rate that reflects current market assessments of the time value of money and the risks specific to the asset for which estimates of future cash flows have not been adjusted.
If the recoverable amount of an asset or CGU is estimated to be less than its carrying amount, the carrying amount of the asset or CGU is reduced to its recoverable amount. An impairment is reported through the income statement as a special item.
Where an impairment subsequently reverses, the carrying amount of the asset or CGU is increased to the revised estimate of its recoverable amount, but so that the increased carrying amount does not exceed the carrying amount that would have been determined had no impairment been recognised for the asset or CGU in prior years. A reversal of an impairment is reported through the income statement as a special item.
Impairment of goodwillGoodwill arising on business combinations is allocated to the group of CGUs that is expected to benefit from synergies of the combination and represents the lowest level at which goodwill is monitored by the Group’s board of directors for internal management purposes. Details of the CGUs to which goodwill is allocated are provided in note 13. The recoverable amount of the CGU or group of CGUs to which goodwill has been allocated is tested for impairment annually on a consistent date during each financial year, or when events or changes in circumstances indicate that it may be impaired.
Any impairment is recognised immediately in the income statement. Impairments of goodwill are not subsequently reversed.
Research and exploration expenditureResearch and exploration expenditure is written off in the year in which it is incurred. When a decision is taken that a mining property is economically feasible and should be developed for commercial production, all further directly attributable, pre-production expenditure is capitalised within tangible assets. Capitalisation of pre-production expenditure ceases when the mining property is capable of commercial production.
Exploration properties acquired are recognised in the balance sheet at cost less provision for any impairment. Such properties and capitalised pre-production expenditure prior to commercial production are assessed for impairment in accordance with the Group’s accounting policy stated above.
InventoryInventory and work in progress are valued at the lower of cost and net realisable value. The production cost of inventory includes an appropriate proportion of depreciation and production overheads. Cost is determined on the following bases:
Raw materials and consumables are valued at cost on a first in, first out • (FIFO) basis.Finished products are valued at raw material cost, labour cost and a proportion • of manufacturing overhead expenses.Metal and coal stocks are included within finished products and are valued at • average cost.
At precious metals operations that produce ‘joint products’, cost is allocated between products according to the ratio of contribution of these metals to gross sales revenues.

103Anglo American plc Annual Report 2009
Financial statements
Changes in the measurement of a liability relating to the decommissioning of plant or other site preparation work that result from changes in the estimated timing or amount of the cash flow or a change in the discount rate, are added to or deducted from the cost of the related asset in the current period. If a decrease in the liability exceeds the carrying amount of the asset, the excess is recognised immediately in the income statement. If the asset value is increased and there is an indication that the revised carrying value is not recoverable, an impairment test is performed in accordance with the accounting policy set out on pages 101 and 102.
For some South African operations annual contributions are made to dedicated environmental rehabilitation trusts to fund the estimated cost of rehabilitation during and at the end of the life of the relevant mine. The Group exercises full control of these trusts and therefore the trusts are consolidated. The trusts’ assets are recognised separately on the balance sheet as non-current assets at fair value. Interest earned on funds invested in the environmental rehabilitation trusts is accrued on a time proportion basis and recognised as interest income.
Foreign currency transactions and translationForeign currency transactions by Group companies are booked in the functional currencies of the companies at the exchange rate ruling on the date of transaction. At each balance sheet date, monetary assets and liabilities that are denominated in foreign currencies are retranslated at the rates prevailing on the balance sheet date. Gains and losses arising on retranslation are included in profit or loss for the period and are classified as either operating or financing depending on the nature of the monetary item giving rise to them.
On consolidation, the assets and liabilities of the Group’s overseas operations are translated into the presentation currency of the Group at exchange rates prevailing on the balance sheet date. Income and expense items are translated at the average exchange rates for the period where these approximate the rates at the dates of transactions. Any exchange differences arising are classified within equity and transferred to the Group’s cumulative translation adjustment reserve. Exchange differences on foreign currency balances with foreign operations for which settlement is neither planned nor likely to occur in the foreseeable future and therefore form part of the Group’s net investment in these foreign operations are offset in the cumulative translation adjustment reserve.
Cumulative translation differences are recycled from equity and recognised as income or expense on disposal of the operation to which they relate.
Goodwill and fair value adjustments arising on the acquisition of a foreign entity are treated as assets of the foreign entity and translated at the closing rate.
Presentation currencyAs permitted by UK company law, the Group’s results are presented in US dollars, the currency in which most of its business is conducted.
Borrowing costsInterest on borrowings directly relating to the financing of qualifying capital projects under construction is added to the capitalised cost of those projects during the construction phase, until such time as the assets are substantially ready for their intended use or sale which, in the case of mining properties, is when they are capable of commercial production. Where funds have been borrowed specifically to finance a project, the amount capitalised represents the actual borrowing costs incurred. Where the funds used to finance a project form part of general borrowings, the amount capitalised is calculated using a weighted average of rates applicable to relevant general borrowings of the Group during the period.
All other borrowing costs are recognised in the income statement in the period in which they are incurred.
1. Accounting policies continuedDeferred tax is calculated at the tax rates that are expected to apply in the period when the liability is settled or the asset is realised. Deferred tax is charged or credited to the income statement, except when it relates to items charged or credited directly to equity, in which case the deferred tax is also taken directly to equity.
Deferred tax assets and liabilities are offset when they relate to income taxes levied by the same taxation authority and the Group intends to settle its current tax assets and liabilities on a net basis.
LeasesIn addition to lease contracts, other significant contracts are assessed to determine whether, in substance, they are or contain a lease. This includes assessment of whether the arrangement is dependent on use of a specific asset and right to use that asset is conveyed through the contract.
Rental costs under operating leases are charged to the income statement in equal annual amounts over the lease term.
Assets held under finance leases are recognised as assets of the Group on inception of the lease at the lower of fair value or the present value of the minimum lease payments discounted at the interest rate implicit in the lease. The interest element of the rental is charged against profit so as to produce a constant periodic rate of interest on the remaining balance of the liability, unless it is directly attributable to qualifying assets, in which case it is capitalised in accordance with the Group’s general policy on borrowing costs set out below.
Non-current assets held for sale and discontinued operationsNon-current assets (and disposal groups) are classified as held for sale if their carrying amount will be recovered through a sale transaction rather than through continuing use. This condition is regarded as met only when a sale is highly probable within one year from the date of classification, management are committed to the sale and the asset (or disposal group) is available for immediate sale in its present condition.
Non-current assets (and disposal groups) are classified as held for sale from the date these conditions are met and are measured at the lower of carrying amount and fair value (less costs to sell). Any resulting impairment is reported through the income statement as a special item. On classification as held for sale the assets are no longer depreciated. Comparative amounts are not adjusted.
An asset or business is considered to be a ‘discontinued operation’ if it has been sold or is classified as held for sale and is part of a single co-ordinated plan to dispose of either a separate major line of business or geographical area of operation, or is a subsidiary acquired exclusively with a view to sale. Once an operation has been identified as discontinued, its net profit and cash flows are separately presented from continuing operations. Comparative information is reclassified so that net profit and cash flows of prior periods are also separately presented.
Restoration, rehabilitation and environmental costsAn obligation to incur restoration, rehabilitation and environmental costs arises when environmental disturbance is caused by the development or ongoing production of a mining property. Such costs arising from the decommissioning of plant and other site preparation work, discounted to their net present value, are provided for and capitalised at the start of each project, as soon as the obligation to incur such costs arises. These costs are charged against profits over the life of the operation, through the depreciation of the asset and the unwinding of the discount on the provision. Costs for restoration of subsequent site damage which is created on an ongoing basis during production are provided for at their net present values and charged against profits as extraction progresses.
Financial statements
104 Anglo American plc Annual Report 2009
Notes to the financial statementscontinued
Investments Investments, other than investments in subsidiaries, joint ventures and associates, are financial asset investments and are initially recorded at fair value. At subsequent reporting dates, financial assets that the Group has the expressed intention and ability to hold to maturity (‘held to maturity’) as well as loans and receivables are measured at amortised cost, less any impairment. The amortisation of any discount or premium on the acquisition of a held to maturity investment is recognised in the income statement in each period using the effective interest method.
Investments other than those classified as held to maturity or loans and receivables are classified as either at fair value through profit or loss (which includes investments held for trading) or available for sale investments. Both sub-categories are measured at each reporting date at fair value. Where investments are held for trading purposes, unrealised gains and losses for the period are included in the income statement within other gains and losses. For available for sale investments, unrealised gains and losses are recognised in equity until the investment is disposed or impaired, at which time the cumulative gain or loss previously recognised in equity is included in the income statement. Impairment losses are recognised in the income statement when the difference between the acquisition cost and current fair value is considered significant or prolonged.
Current financial asset investments consist mainly of bank term deposits and fixed and floating rate debt securities. Debt securities that are intended to be held to maturity are recorded on the amortised cost basis. Debt securities that are not intended to be held to maturity are recorded at the lower of cost and market value.
Provision is raised against these assets when there is doubt over the future realisation of value as a result of a known event or circumstance.
Convertible debtConvertible bonds are regarded as compound instruments, consisting of a liability and an equity component. At the date of issue, the fair value of the liability component is estimated using the prevailing market interest rate for similar non-convertible debt and is recorded within borrowings and carried at amortised cost. The difference between the proceeds of issue of the convertible bond and the fair value assigned to the liability component, representing the embedded option to convert the liability into equity of the Group, is included in equity.
Issue costs are apportioned between the liability and equity components of the convertible bonds where appropriate based on their relative carrying amounts at the date of issue. The portion relating to the equity component is charged directly against equity.
The interest expense on the liability component is calculated by applying the effective interest rate for similar non-convertible debt to the liability component of the instrument. The difference between this amount and the interest paid is added to the carrying amount of the liability.
Financial liabilities and equity instrumentsFinancial liabilities and equity instruments are classified and accounted for as debt or equity according to the substance of the contractual arrangements entered into. An equity instrument is any contract that evidences a residual interest in the assets of the Group after deducting all of its liabilities.
1. Accounting policies continuedShare-based paymentsThe Group has applied the requirements of IFRS 2 Share-based Payment. In accordance with the transitional provisions, IFRS 2 has been applied to all grants of equity instruments after 7 November 2002 that had not vested as at 1 January 2005.
The Group makes equity settled share-based payments to certain employees, which are measured at fair value at the date of grant and expensed on a straight line basis over the vesting period, based on the Group’s estimate of shares that will eventually vest. For those share schemes with market related vesting conditions, the fair value is determined using the Monte Carlo method at the grant date. The fair value of share options issued with non-market vesting conditions has been calculated using the Black Scholes model. For all other share awards, the fair value is determined by reference to the market value of the share at the date of grant. For all share schemes with non-market related vesting conditions, the likelihood of vesting has been taken into account when determining the relevant charge. Vesting assumptions are reviewed during each reporting period to ensure they reflect current expectations.
Black economic empowerment (BEE) transactionsWhere the Group disposes of a portion of a South African based subsidiary or operation to a BEE company at a discount to fair value, the transaction is considered to be a share-based payment (in line with the principle contained in South Africa interpretation AC 503 Accounting for Black Economic Empowerment (BEE) Transactions). The discount provided or value given is calculated in accordance with IFRS 2 and included in the determination of the profit or loss on disposal.
Employee benefit trustShares held by the employee benefit trust are recorded as treasury shares, and the carrying value is shown as a reduction in retained earnings within shareholders’ equity.
Cash and cash equivalentsCash and cash equivalents comprise cash in hand and on demand deposits, together with short term, highly liquid investments that are readily convertible to a known amount of cash and that are subject to an insignificant risk of changes in value. Bank overdrafts are, however, shown within short term borrowings in current liabilities on the balance sheet. Cash and cash equivalents in the Consolidated cash flow statement are shown net of overdrafts.
Trade receivablesTrade receivables do not carry any interest and are stated at their nominal value (with the exception of receivables relating to provisionally priced sales – as set out in the revenue recognition accounting policy) net of appropriate allowance for estimated irrecoverable amounts. Such allowances are raised based on an assessment of debtor ageing, past experience or known customer circumstances.
Trade payablesTrade payables are not interest bearing and are stated at their nominal value with the exception of amounts relating to purchases of provisionally priced concentrate which are marked to market (using the appropriate forward price) until settled.
Equity instrumentsEquity instruments issued by the Company are recorded at the proceeds received, net of direct issue costs.

105Anglo American plc Annual Report 2009
Financial statements
Derecognition of financial assets and liabilitiesFinancial assets are derecognised when the rights to receive cash flows from the asset have expired, the right to receive cash flows has been retained but an obligation to on-pay them in full without material delay has been assumed or the right to receive cash flows has been transferred together with substantially all the risks and rewards of ownership.
Financial liabilities are derecognised when the associated obligation has been discharged, cancelled or has expired.
New IFRS accounting standards and interpretations not yet adoptedIFRS 3 (Revised) Business Combinations makes a number of changes to the accounting for and disclosure of business combinations. The revised standard introduces changes to the accounting for contingent consideration and transaction costs, as well as allowing an option to calculate goodwill based on the parent’s share of net assets only or including goodwill relating to minority interests (non-controlling interests). Once adopted the Group will account for subsequent business combinations in accordance with this standard. The revised standard is effective prospectively for annual periods beginning on or after 1 July 2009.
IAS 27 (Revised) Consolidated and Separate Financial Statements requires the effects of all transactions with non-controlling interests to be recorded in equity if there is no change in control. Once adopted any transaction within this scope will be accounted for in accordance with the revised standard. The revised standard is effective prospectively for annual periods beginning on or after 1 July 2009.
IFRS 9 Financial Instruments is the first phase of the IASB’s three stage project to replace IAS 39. The first phase deals with the classification and measurement of financial assets. The standard applies for annual periods beginning on or after 1 January 2013. Early application is permitted, although IFRS 9 has not yet been endorsed for use in the European Union. Once adopted, all financial assets within the scope of IFRS 9 will be accounted for in accordance with the standard.
The following new IFRS accounting standards and interpretations not yet adopted are not expected to have a significant impact on the Group:
Amendment to IAS 39 Financial Instruments: Recognition and Measurement: Eligible Hedged Items prohibits designating inflation as a hedgeable component of a fixed rate debt and inclusion of time value in the one-sided hedged risk when designating options as hedges. The amendment is effective for accounting periods beginning on or after 1 July 2009.
Amendment to IFRS 2 Share-based payments on Group Cash-settled Share-based Payment Transactions clarifies the scope and the accounting for group cash-settled share-based payment transactions in the separate or individual financial statements of the entity receiving the goods or services when that entity has no obligation to settle the share-based payment transaction. The amendment is effective for annual periods commencing on or after 1 January 2010, subject to adoption by the European Union.
Amendment to IAS 32 Financial Instruments: Presentation – Classification of Rights Issues addresses the accounting for rights issues (rights, options or warrants) that are denominated in a currency other than the functional currency of the issuer. Prior to the amendment, such rights issues were accounted for as derivative liabilities. The amendment states that, if such rights are issued pro rata to an entity’s existing shareholders for a fixed amount of any currency, they should be classified as equity, regardless of the currency in which the exercise price is denominated. The amendment is effective for annual periods commencing on or after 1 February 2010.
1. Accounting policies continuedBank borrowingsInterest bearing bank loans and overdrafts are recorded at the proceeds received, net of direct transaction costs. Finance charges, including premiums payable on settlement or redemption and direct issue costs, are accounted for on an accruals basis and charged to the income statement using the effective interest method. They are added to the carrying amount of the instrument to the extent that they are not settled in the period in which they arise.
Derivative financial instruments and hedge accountingIn order to hedge its exposure to foreign exchange, interest rate and commodity price risk, the Group enters into forward, option and swap contracts. The Group does not use derivative financial instruments for speculative purposes. Commodity based (normal purchase or normal sale) contracts that meet the scope exemption in IAS 39 Financial Instruments: Recognition and Measurement are recognised in earnings when they are settled by physical delivery.
All derivatives are held at fair value in the balance sheet within Other financial assets (derivatives) or Other financial liabilities (derivatives). Derivatives are classified as current or non-current depending on the expected maturity of the derivative.
Changes in the fair value of derivative financial instruments that are designated and effective as hedges of future cash flows are recognised directly in equity. The gain or loss relating to the ineffective portion is recognised immediately in the income statement. If the cash flow hedge of a firm commitment or forecast transaction results in the recognition of a non-financial asset or a liability, then, at the time the asset or liability is recognised, the associated gains or losses on the derivative that had previously been recognised in equity are included in the initial measurement of the asset or liability. For hedges that do not result in the recognition of a non-financial asset or a liability, amounts deferred in equity are recognised in the income statement in the same period in which the hedged item affects profit or loss.
For an effective hedge of an exposure to changes in fair value, the hedged item is adjusted for changes in fair value attributable to the risk being hedged with the corresponding entry in profit or loss. Gains or losses from remeasuring the associated derivative are recognised in the income statement.
The gain or loss on hedging instruments relating to the effective portion of a net investment hedge is recognised in equity. The ineffective portion is recognised immediately in the income statement. Gains or losses accumulated in equity are included in the income statement on disposal of the foreign operations to which they relate.
Changes in the fair value of any derivative instruments that are not hedge accounted are recognised immediately in the income statement and are classified within other gains and losses or net finance costs depending on the type of risk the derivative relates to.
Hedge accounting is discontinued when the hedging instrument expires or is sold, terminated, exercised, revoked, or no longer qualifies for hedge accounting. At that time, any cumulative gain or loss on the hedging instrument recognised in equity is retained in equity until the forecast transaction occurs. If a hedge transaction is no longer expected to occur, the net cumulative gain or loss previously recognised in equity is included in the income statement for the period.
Derivatives embedded in other financial instruments or non-financial host contracts are treated as separate derivatives when their risks and characteristics are not closely related to those of their host contracts and the host contracts themselves are not carried at fair value with unrealised gains or losses reported in the income statement.

Financial statements
106 Anglo American plc Annual Report 2009
Notes to the financial statementscontinued
Revenue(1) Operating profit/(loss)(2)
US$ million 2009 2008 2009 2008
Platinum 4,535 6,327 32 2,169
Diamonds 1,728 3,096 64 508
Copper 3,967 3,907 2,010 1,892
Nickel 348 408 2 123
Iron Ore and Manganese 3,419 4,099 1,489 2,554
Metallurgical Coal 2,239 3,119 451 1,110
Thermal Coal 2,490 3,051 721 1,078
Other Mining and Industrial 5,908 8,951 506 1,082
Exploration – – (172) (212)Corporate Activities and Unallocated Costs 3 6 (146) (219)
Segment measure 24,637 32,964 4,957 10,085
Reconciliation:
Less: Associates (3,779) (6,653) (580) (2,104)Operating special items and remeasurements – – (1,637) (1,131)
Statutory measure 20,858 26,311 2,740 6,850
(1) Segment revenue includes the Group’s attributable share of associates’ revenue. This is reconciled to Group revenue from subsidiaries and joint ventures as presented in the Consolidated income statement.
(2) Segment operating profit is revenue less operating costs before special items and remeasurements, and includes the Group’s attributable share of associates’ operating profit. This is reconciled to Operating profit from subsidiaries and joint ventures after special items and remeasurements as presented in the Consolidated income statement.
Associates’ revenue and operating profit are as follows:
Associates’ revenue
Associates’ operating profit/(loss)(1)
US$ million 2009 2008 2009 2008
Platinum 47 39 (26) 20
Diamonds 1,728 3,096 64 508
Iron Ore and Manganese 603 1,526 143 980
Metallurgical Coal 164 170 48 102
Thermal Coal 742 841 303 375
Other Mining and Industrial 495 981 48 119
3,779 6,653 580 2,104
Reconciliation:Associates’ net finance costs (before special items and remeasurements) (28) (147)Associates’ income tax expense (before special items and remeasurements) (235) (623)Associates’ minority interests (before special items and remeasurements) 1 (31)Share of net income from associates (before special items and remeasurements) 318 1,303Associates’ special items and remeasurements (184) (223)
Associate’s tax special item (45) –Associates’ tax on special items and remeasurements (6) 17Associates’ minority interests on special items and remeasurements 1 16
Share of net income from associates 84 1,113
(1) Associates’ operating profit is the Group’s attributable share of associates’ revenue less operating costs before special items and remeasurements.
1. Accounting policies continuedAnnual improvements to IFRSs 2009 amends a number of standards including changes in presentation, recognition and measurement plus terminology and editorial changes. The 2009 amendments are effective for annual periods commencing on or after 1 January 2010, subject to adoption by the European Union.
IFRIC 19 Extinguishing Financial Liabilities with Equity Instruments clarifies the accounting when an entity renegotiates the terms of its debt with the result that the liability is extinguished by the debtor issuing its own equity instruments for the creditor. The interpretation is to be applied retrospectively from the earliest comparative period presented and is effective for annual periods beginning on or after 1 July 2010, subject to adoption by the European Union, although earlier application is permitted.
Amendments to IFRS 1 First-time Adoption of International Financial Reporting Standards and IAS 27 Consolidated and Separate Financial Statements on the Cost of an Investment in a Subsidiary, Jointly Controlled Entity or Associate.
Amendments to IFRS 1 on Additional Exemptions for First-time Adopters.
IFRIC 12 Service Concession Arrangements.
IFRIC 17 Distributions of Non-cash Assets to Owners.
IFRIC 18 Transfers of Assets from Customers.
2. Segmental informationThe Group’s segments are aligned to the structure of Business Units based around core commodities. In addition assets identified for divestment are managed as a separate Business Unit, Other Mining and Industrial. The Kumba Iron Ore, Iron Ore Brazil and Samancor Business Units have been aggregated as the Iron Ore and Manganese segment on the basis of the ultimate product produced (ferrous metals). Each Business Unit has a management team that is accountable to the Chief executive.
The Group’s Executive Committee evaluates the financial performance of the Group and its segments principally with reference to operating profit before special items and remeasurements which includes the Group’s attributable share of associates’ operating profit before special items and remeasurements.
Segments predominately derive revenue as follows – Platinum: platinum group metals; Diamonds: rough and polished diamonds and diamond jewellery; Copper and Nickel: base metals; Iron Ore and Manganese: iron ore, manganese ore and alloys; Metallurgical Coal: metallurgical coal; Thermal Coal: thermal coal; and Other Mining and Industrial: heavy building materials, zinc and steel products.
The segment results are stated after elimination of inter-segment transactions and include an allocation of corporate costs.
The Corporate Activities and Unallocated Costs segment includes insurance costs.
Due to the portfolio and management structure changes announced in October 2009, the segments have changed from those reported at 31 December 2008. Comparatives have been reclassified to align with current year presentation.

107Anglo American plc Annual Report 2009
Financial statements
Balance sheet measures are as follows:
Capital expenditure(1) Net debt(2)
US$ million 2009 2008 2009 2008
Platinum 1,150 1,563 196 995
Copper 1,068 808 (187) (622)
Nickel 554 530 380 (66)
Iron Ore and Manganese 1,044 783 874 698
Metallurgical Coal 96 467 (9) (18)
Thermal Coal 400 365 23 (139)
Other Mining and Industrial 268 603 341 354
Exploration – 1 – –Corporate Activities and Unallocated Costs 27 26 9,425 9,849
4,607 5,146 11,043 11,051
Reconciliation:
Interest capitalised 246 215
Non-cash movements(3) 379 365
Tangible asset additions 5,232 5,726Tangible assets acquired through business combinations 28 7,358
Intangible asset additions 50 1,731
Net debt in disposal groups (48) (8)
5,310 14,815 10,995 11,043
(1) Capital expenditure is segmented on a cash basis and is reconciled to balance sheet additions. Cash capital expenditure excludes cash flows on related derivatives.
(2) Segment net debt excludes net debt in disposal groups and hedges. A reconciliation of net debt to the balance sheet is provided in note 30. At 31 December 2007 net debt of $5,170 million was split by segment as follows: Platinum $846 million, Copper $(298) million, Nickel $(233) million, Iron Ore and Manganese $(123) million, Metallurgical Coal $(3) million, Thermal Coal $(76) million, Other Mining and Industrial $182 million, Exploration $(1) million and Corporate Activities and Unallocated Costs $4,876 million. Group net debt of $5,239 million included a further $69 million of net debt in disposal groups.
(3) Includes movements on tangible asset accruals and the impact of cash flow hedge derivatives.(4) Capital expenditure on an accruals basis and including additions resulting from acquisitions of interests
in subsidiaries and joint ventures is split by segment as follows: Platinum $1,445 million (2008: $3,026 million), Copper $1,186 million (2008: $1,087 million), Nickel $570 million (2008: $597 million), Iron Ore and Manganese $1,157 million (2008: $7,569 million), Metallurgical Coal $173 million (2008: $1,222 million), Thermal Coal $409 million (2008: $383 million), Other Mining and Industrial $323 million (2008: $882 million), Exploration nil (2008: $1 million) and Corporate Activities and Unallocated Costs $47 million (2008: $48 million).
(4) (4)
2. Segmental information continuedSignificant non-cash items included within operating profit are as follows:
Depreciation andamortisation(1)
Other non-cashexpenses(2)
US$ million 2009 2008 2009 2008
Platinum 636 507 92 7
Copper 244 212 71 50
Nickel 26 27 9 4
Iron Ore and Manganese 81 52 4 51
Metallurgical Coal 249 205 26 43
Thermal Coal 107 78 13 61
Other Mining and Industrial 360 404 94 108
Exploration – – 4 –Corporate Activities and Unallocated Costs 22 24 79 67
1,725 1,509 392 391
(1) The Group’s attributable share of depreciation and amortisation in associates is $248 million (2008: $253 million) and is split by segment as follows: Platinum $9 million (2008: $2 million), Diamonds $151 million (2008: $157 million), Iron Ore and Manganese $23 million (2008: $19 million), Metallurgical Coal $6 million (2008: $4 million), Thermal Coal $47 million (2008: $44 million) and Other Mining and Industrial $12 million (2008: $27 million).
(2) Other non-cash expenses include equity settled share-based payment charges and amounts included in operating costs in respect of provisions.
The following balance sheet segment measures are provided for information:
Segment assets(1) Segment liabilities(2) Net segment assets
US$ million 2009 2008 2009 2008 2009 2008
Platinum 13,082 9,713 (941) (668) 12,141 9,045
Copper 5,643 4,134 (880) (986) 4,763 3,148
Nickel 1,888 1,485 (101) (84) 1,787 1,401
Iron Ore and Manganese 10,758 10,768 (388) (311) 10,370 10,457
Metallurgical Coal 4,176 3,369 (769) (700) 3,407 2,669
Thermal Coal 2,343 1,624 (636) (606) 1,707 1,018
Other Mining and Industrial 6,231 6,435 (1,202) (1,204) 5,029 5,231
Exploration 4 3 (2) (7) 2 (4)
Corporate Activities and Unallocated Costs 311 251 (409) (310) (98) (59)
44,436 37,782 (5,328) (4,876) 39,108 32,906
Other assets and liabilities
Investments in associates(3) 3,312 3,612 – – 3,312 3,612
Financial asset investments 2,729 3,288 – – 2,729 3,288
Deferred tax assets/(liabilities) 288 258 (5,192) (4,555) (4,904) (4,297)
Cash and cash equivalents 3,269 2,771 – – 3,269 2,771
Other financial assets/(liabilities) – derivatives 603 376 (659) (1,497) (56) (1,121)
Other non-operating assets/(liabilities) 1,671 1,651 (2,128) (2,515) (457) (864)
Other provisions – – (617) (544) (617) (544)
Borrowings – – (14,315) (13,995) (14,315) (13,995)
Net assets 56,308 49,738 (28,239) (27,982) 28,069 21,756
(1) Segment assets at 31 December 2009 are operating assets and consist of intangible assets of $2,776 million (2008: $3,006 million), tangible assets of $35,198 million (2008: $29,545 million), biological assets of $4 million (2008: $3 million), environmental rehabilitation trusts of $342 million (2008: $244 million), retirement benefit assets of $54 million (2008: $32 million), inventories of $3,212 million (2008: $2,702 million) and operating receivables of $2,850 million (2008: $2,250 million).
(2) Segment liabilities at 31 December 2009 are operating liabilities and consist of non-interest bearing current liabilities of $3,447 million (2008: $3,534 million), retirement benefit obligations of $706 million (2008: $401 million) and environmental restoration and decommissioning provisions of $1,175 million (2008: $941 million).
(3) Refer to note 16 for a split of investments in associates by segment.

Financial statements
108 Anglo American plc Annual Report 2009
Notes to the financial statementscontinued
Segment revenue and operating profit/(loss) before special items and remeasurements by origin (including attributable share of revenue and operating profit/(loss) from associates) has been provided for information:
Revenue
Operating profit/(loss) before special items and
remeasurements
US$ million 2009 2008 2009 2008
South Africa 10,293 13,786 2,023 5,107
Other Africa 1,539 2,530 78 467
Europe 2,976 4,805 (54) (183)
North America 510 705 (20) (29)
South America 6,040 6,743 2,310 2,985
Australia and Asia 3,279 4,395 620 1,738
24,637 32,964 4,957 10,085
The Group’s geographical analysis of segment assets and liabilities, allocated based on where assets and liabilities are located, has been provided for information:
Segment assets(1) Segment liabilities Net segment assets
US$ million 2009 2008 2009 2008 2009 2008
South Africa 18,309 13,540 (2,148) (1,633) 16,161 11,907
Other Africa 664 364 (66) (30) 598 334
Europe 3,820 4,045 (907) (910) 2,913 3,135
North America 805 629 (132) (119) 673 510
South America 16,528 15,688 (1,262) (1,431) 15,266 14,257
Australia and Asia 4,310 3,516 (813) (753) 3,497 2,763
44,436 37,782 (5,328) (4,876) 39,108 32,906
(1) Investments in associates are not included in segment assets. The geographical distribution of these investments, based on the location of the underlying assets, is disclosed in note 16.
2. Segmental information continuedEntity wide informationThe Group’s analysis of segment revenue by product (including attributable share of revenue from associates) is as follows:
US$ million 2009 2008
Platinum 3,101 3,570
Palladium 361 531
Rhodium 527 1,632
Diamonds 1,728 3,096
Copper 3,783 3,639
Nickel 625 734
Iron ore 2,330 2,281
Manganese 603 1,526
Metallurgical coal 1,693 2,775
Thermal coal 3,197 3,637
Zinc 445 467
Steel products 1,371 1,927
Heavy building materials 2,870 4,399
Other 2,003 2,750
24,637 32,964
The Group’s geographical analysis of segment revenue (including attributable share of revenue from associates) allocated based on the country in which the customer is located, and non-current segment assets, allocated based on the country in which the assets are located, is as follows:
RevenueNon-current
segment assets(1)
US$ million 2009 2008 2009 2008
South Africa 2,567 3,951 15,161 11,040
Other Africa 139 322 599 309United Kingdom (Anglo American plc’s country of domicile) 3,850 4,672 2,686 2,491
Other Europe 5,014 7,279 241 712
US 790 1,294 123 92
Other North America 507 1,078 575 414
Brazil 662 1,423 10,105 10,468
Chile 1,229 1,398 4,280 3,448
Venezuela 5 8 281 462
Other South America 185 178 293 206
Australia 427 344 3,584 2,863
China 3,469 1,956 4 3
India 1,222 1,599 – –
Japan 2,697 4,516 – –
Other Asia 1,874 2,946 46 46
24,637 32,964 37,978 32,554
(1) Non-current segment assets are non-current operating assets and consist of tangible assets, intangible assets and biological assets. Non-current segment assets at 31 December 2007 were $25,093 million.

109Anglo American plc Annual Report 2009
Financial statements
3. Reconciliation of Underlying earnings to Profit for the financial year attributable to equity shareholders of the CompanyThe table below analyses the contribution of each segment to the Group’s operating profit (including attributable share of operating profit from associates) for the financial year and Underlying earnings, which the directors consider to be a useful additional measure of the Group’s performance. A reconciliation from ‘Profit for the financial year attributable to equity shareholders of the Company’ to ‘Underlying earnings for the financial year’ is given in note 12.
Due to the portfolio and management structure changes announced in October 2009, the segments have changed from those reported at 31 December 2008. Comparatives have been reclassified to align with current year presentation.
Operating profit (including attributable share of operating profit from associates) is reconciled to ‘Underlying earnings’ and ‘Profit for the financial year attributable to equity shareholders of the Company’ in the table below:
2009
US$ million
Operating profit/(loss)
before special items and
remeasurements(1)
Operating profit/(loss) after special
items and remeasurements
Operating special
items and remeasurements(2)
Net profit on
disposals(2)
Financing special
items andremeasurements(2)
Net interest, tax and
minority interests Total
By segment
Platinum 32 (72) 104 323 – 12 44
Diamonds 64 (139) 203 20 – (154) (90)
Copper 2,010 2,114 (104) – – (809) 1,201
Nickel 2 (86) 88 – – (15) (13)
Iron Ore and Manganese 1,489 350 1,139 6 – (918) 571
Metallurgical Coal 451 423 28 33 – (129) 322
Thermal Coal 721 715 6 21 – (204) 517
Exploration (172) (172) – 10 – 5 (167)
Corporate Activities and Unallocated Costs (146) (377) 231 – – (73) (219)
Core operations 4,451 2,756 1,695 413 – (2,285) 2,166
Other Mining and Industrial 506 361 145 1,219 – (103) 403Total/Underlying earnings 4,957 3,117 1,840 1,632 – (2,388) 2,569
Underlying earnings adjustments (1,840) 1,632 (135) 199 (144)
Profit for the financial year attributable to equity shareholders of the Company 2,425
2008
US$ million
Operating profit/(loss)
before specialitems and
remeasurements(1)
Operating profit/(loss) after special
items and remeasurements
Operating special
items andremeasurements(2)
Net profit on
disposals(2)
Financing special
items andremeasurements(2)
Net interest, tax and
minority interests Total
By segment
Platinum 2,169 2,150 19 106 – (913) 1,256
Diamonds 508 282 226 18 – (252) 256
Copper 1,892 1,825 67 142 – (848) 1,044
Nickel 123 (7) 130 (1) – (158) (35)
Iron Ore and Manganese 2,554 1,934 620 (4) – (1,404) 1,150
Metallurgical Coal 1,110 1,088 22 – – (346) 764
Thermal Coal 1,078 1,080 (2) – – (324) 754
Exploration (212) (162) (50) – – 12 (200)
Corporate Activities and Unallocated Costs (219) (305) 86 2 – (267) (486)
Core operations 9,003 7,885 1,118 263 – (4,500) 4,503
Other Mining and Industrial 1,082 843 239 764 – (348) 734
Total/Underlying earnings 10,085 8,728 1,357 1,027 – (4,848) 5,237
Underlying earnings adjustments (1,357) 1,027 36 272 (22)
Profit for the financial year attributable to equity shareholders of the Company 5,215
(1) Operating profit includes attributable share of associates’ operating profit which is reconciled to ‘Share of net income from associates’ in note 2.(2) Special items and remeasurements are set out in note 7.(3) This represents Underlying earnings for the financial year and is equal to profit for the financial year attributable to equity shareholders of the Company before special items and remeasurements.
(3)
(3)

Financial statements
110 Anglo American plc Annual Report 2009
Notes to the financial statementscontinued
4. Operating profit from subsidiaries and joint ventures
US$ million 2009 2008
Group revenue 20,858 26,311
Cost of sales(1) (15,280) (15,551)
Gross profit 5,578 10,760
Selling and distribution costs (1,590) (1,631)
Administrative expenses (1,603) (1,643)
Other gains and losses (see below) 527 (424)
Exploration expenditure (see note 5) (172) (212)
Operating profit from subsidiaries and joint ventures 2,740 6,850
(1) Includes operating special items of $2,275 million (2008: $352 million), see note 7.
US$ million 2009 2008
Operating profit is stated after charging:
Depreciation of tangible assets (see note 14) 1,711 1,505
Amortisation of intangible assets (see note 13) 14 4
Rentals under operating leases 114 210
Research and development expenditure 34 36
Operating special items(1) 2,275 352
Employee costs (see note 6) 3,734 3,281
Adjustment due to provisional pricing(2) (507) 764
Other gains and losses comprise:
Operating remeasurements(1) 638 (779)
Net gain/(loss) on non-hedge derivatives 757 (696)
Realised loss on derivatives relating to capital expenditure (105) (120)
Other remeasurements (14) 37
Other fair value gains/(losses) on derivatives – realised 83 (147)
Foreign currency (losses)/gains on other monetary items (195) 501
Gains on valuation of biological assets 1 1
Total other gains and losses 527 (424)
(1) Special items and remeasurements are set out in note 7.(2) Provisionally priced contracts resulted in a total (realised and unrealised) gain in revenue of $563 million
(2008: $865 million loss) and total (realised and unrealised) loss in operating costs of $56 million (2008: $101 million gain).
US$ million 2009 2008
Auditors’ remuneration
Audit
United Kingdom 3 3
Overseas 8 7
Other services provided by Deloitte(1)
United Kingdom 8 2
Overseas 2 2
(1) ‘Other services provided by Deloitte’ includes charges incurred in respect of the interim review, $6.5 million for services relating to bid defence and $0.4 million for services required to be undertaken by Deloitte in their capacity as auditors.
A more detailed analysis of auditors’ remuneration is provided below:
2009
Paid/payable to Deloitte
Paid/payable
to auditor (if not
Deloitte)
US$ millionUnited
Kingdom Overseas Total Overseas
Statutory audit services(1)
Anglo American plc Annual Report paid to the Company’s auditor 1.9 – 1.9 –
Subsidiary entities – for purposes of Anglo American plc Annual Report – 3.7 3.7 0.1Subsidiary entities – additional local statutory requirements 0.8 4.1 4.9 0.5
Subsidiary entities – total 0.8 7.8 8.6 0.6
Total 2.7 7.8 10.5 0.6
Other services(1)
Other services pursuant to legislation 0.7 0.6 1.3 –
Tax services 0.2 0.4 0.6 0.3
Internal audit services – – – 0.4
Other 6.9 0.9 7.8 0.6Total 7.8 1.9 9.7 1.3
(1) $0.1 million was paid/payable in respect of the audit of Group pension schemes.(2) Includes $6.5 million for services relating to bid defence and $0.4 million for services required to be
undertaken by Deloitte in their capacity as auditors.
2008
Paid/payable to Deloitte
Paid/payable
to auditor (if not
Deloitte)
US$ millionUnited
Kingdom Overseas Total Overseas
Statutory audit services(1)
Anglo American plc Annual Report paid to the Company’s auditor 2.2 – 2.2 –
Subsidiary entities – for purposes of Anglo American plc Annual Report – 3.6 3.6 0.1Subsidiary entities – additional local statutory requirements 0.6 3.8 4.4 0.5
Subsidiary entities – total 0.6 7.4 8.0 0.6
Total 2.8 7.4 10.2 0.6
Other services(1)
Other services pursuant to legislation 0.6 0.5 1.1 –
Tax services 0.2 0.6 0.8 –
Internal audit services – – – 0.4
Corporate finance 0.1 – 0.1 –
Other 0.5 1.2 1.7 0.2
Total 1.4 2.3 3.7 0.6
(1) $0.1 million was paid/payable in respect of the audit of Group pension schemes.(2) Includes $0.4 million for services required to be undertaken by Deloitte in their capacity as auditors.
(2)
(2)

111Anglo American plc Annual Report 2009
Financial statements
5. Exploration expenditureExploration expenditure is stated before special items.
US$ million 2009 2008
By commodity(1)
Platinum group metals 17 36
Copper 43 60
Nickel 22 20
Iron ore 8 18
Metallurgical coal 10 17
Thermal coal 25 18
Zinc 10 8
Central exploration activities 37 35
172 212
(1) Following the portfolio and management structure changes announced in October 2009, exploration expenditure is presented by commodity. Comparatives have been reclassified to align with current year presentation.
6. Employee numbers and costsThe average number of employees, excluding contractors and associates’ employees and including a proportionate share of employees within joint venture entities, was:
Thousand 2009 2008
By segment(1)
Platinum 58 56
Copper 4 4
Nickel 2 1
Iron Ore and Manganese 7 7
Metallurgical Coal 3 4Thermal Coal 9 9
Other Mining and Industrial 22 22
Corporate Activities and Unallocated Costs 2 2
107 105
(1) Due to the portfolio and management structure changes announced in October 2009, the segments have changed from those reported at 31 December 2008. Comparatives have been reclassified to align with current year presentation.
The average number of employees by principal location of employment was:
Thousand 2009 2008
South Africa 83 79
Other Africa 1 1
Europe 9 10
North America 1 1
South America 9 9
Australia and Asia 4 5
107 105
Payroll costs in respect of the employees included in the tables above were:
US$ million 2009 2008(1)
Wages and salaries 3,321 2,817
Social security costs 168 157
Defined contribution plans 193 143
Defined benefit plans 36 49
Other post employment benefits 6 7
Share-based payments 205 155
Total payroll costs 3,929 3,328
Reconciliation:
Less: Employee costs capitalised (82) (28)
Less: Employee costs included within operating special items (113) (19)
Employee costs included in operating costs 3,734 3,281
(1) Comparatives have been aligned with current year presentation, which is inclusive of amounts capitalised and amounts included within operating special items.
In accordance with IAS 24 Related Party Disclosures, key management personnel are those persons having authority and responsibility for planning, directing and controlling the activities of the Group, directly or indirectly, including any director (executive and non-executive) of the Group.
Compensation for key management was as follows:
US$ million 2009 2008
Salaries and short term employee benefits 14 20
Post employment benefits 2 2
Termination benefits 10 2
National insurance and social security 2 3
Share-based payments 11 11
39 38
Key management includes members of the Board and the Executive Committee. The composition of key management personnel has changed following the portfolio and management structure changes announced in October 2009.
Disclosure of directors’ emoluments, pension entitlements, share options and long term incentive plan awards required by the Companies Act 2006 and those specified for audit by Regulation 11 and Schedule 8 of the Large and Medium-Sized Companies and Groups (Accounts and Reports) Regulations 2008 are included in the Remuneration report.
7. Special items and remeasurements‘Special items’ are those items of financial performance that the Group believes should be separately disclosed on the face of the income statement to assist in the understanding of the underlying financial performance achieved by the Group. Such items are material by nature or amount to the year’s results and require separate disclosure in accordance with IAS 1 (revised 2007) paragraph 97. Special items that relate to the operating performance of the Group are classified as operating special items and include impairment charges and reversals and other exceptional items, including significant legal provisions. Non-operating special items include profits and losses on disposals of investments and businesses.
‘Remeasurements’ comprise other items which the Group believes should be reported separately to aid an understanding of the underlying financial performance of the Group. This category includes:(i) unrealised gains and losses on ‘non-hedge’ derivative instruments open at
year end (in respect of future transactions) and the reversal of the historical marked to market value of such instruments settled in the year. The full realised gains or losses are recorded in underlying earnings in the same year as the underlying transaction for which such instruments provide an economic, but not formally designated, hedge (if the underlying transaction is recorded in the balance sheet, e.g. capital expenditure, the realised amount remains in remeasurements on settlement of the derivative). Such amounts are classified in the income statement as financing when the underlying exposure is in respect of net debt and otherwise as operating.
(ii) foreign exchange gains and losses arising on the retranslation of dollar denominated De Beers preference shares held by a rand functional currency subsidiary of the Group. This is classified as financing.
(iii) foreign exchange impact arising in US dollar functional currency entities where tax calculations are generated based on local currency financial information (and hence deferred tax is susceptible to currency fluctuations). Such amounts are included within income tax expense.
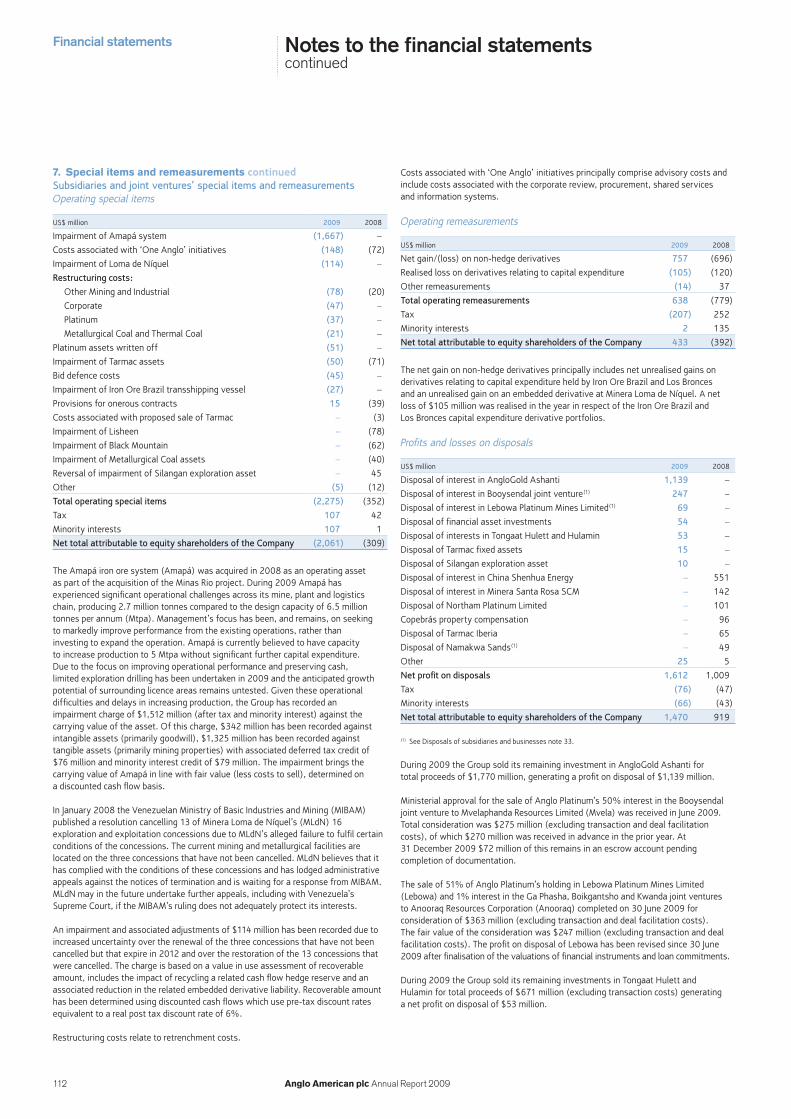
Financial statements
112 Anglo American plc Annual Report 2009
Notes to the financial statementscontinued
7. Special items and remeasurements continuedSubsidiaries and joint ventures’ special items and remeasurementsOperating special items
US$ million 2009 2008
Impairment of Amapá system (1,667) –
Costs associated with ‘One Anglo’ initiatives (148) (72)
Impairment of Loma de Níquel (114) –
Restructuring costs:
Other Mining and Industrial (78) (20)
Corporate (47) –
Platinum (37) –
Metallurgical Coal and Thermal Coal (21) –
Platinum assets written off (51) –
Impairment of Tarmac assets (50) (71)
Bid defence costs (45) –
Impairment of Iron Ore Brazil transshipping vessel (27) –
Provisions for onerous contracts 15 (39)
Costs associated with proposed sale of Tarmac – (3)
Impairment of Lisheen – (78)
Impairment of Black Mountain – (62)
Impairment of Metallurgical Coal assets – (40)
Reversal of impairment of Silangan exploration asset – 45
Other (5) (12)
Total operating special items (2,275) (352)
Tax 107 42
Minority interests 107 1
Net total attributable to equity shareholders of the Company (2,061) (309)
The Amapá iron ore system (Amapá) was acquired in 2008 as an operating asset as part of the acquisition of the Minas Rio project. During 2009 Amapá has experienced significant operational challenges across its mine, plant and logistics chain, producing 2.7 million tonnes compared to the design capacity of 6.5 million tonnes per annum (Mtpa). Management’s focus has been, and remains, on seeking to markedly improve performance from the existing operations, rather than investing to expand the operation. Amapá is currently believed to have capacity to increase production to 5 Mtpa without significant further capital expenditure. Due to the focus on improving operational performance and preserving cash, limited exploration drilling has been undertaken in 2009 and the anticipated growth potential of surrounding licence areas remains untested. Given these operational difficulties and delays in increasing production, the Group has recorded an impairment charge of $1,512 million (after tax and minority interest) against the carrying value of the asset. Of this charge, $342 million has been recorded against intangible assets (primarily goodwill), $1,325 million has been recorded against tangible assets (primarily mining properties) with associated deferred tax credit of $76 million and minority interest credit of $79 million. The impairment brings the carrying value of Amapá in line with fair value (less costs to sell), determined on a discounted cash flow basis.
In January 2008 the Venezuelan Ministry of Basic Industries and Mining (MIBAM) published a resolution cancelling 13 of Minera Loma de Níquel’s (MLdN) 16 exploration and exploitation concessions due to MLdN’s alleged failure to fulfil certain conditions of the concessions. The current mining and metallurgical facilities are located on the three concessions that have not been cancelled. MLdN believes that it has complied with the conditions of these concessions and has lodged administrative appeals against the notices of termination and is waiting for a response from MIBAM. MLdN may in the future undertake further appeals, including with Venezuela’s Supreme Court, if the MIBAM’s ruling does not adequately protect its interests. An impairment and associated adjustments of $114 million has been recorded due to increased uncertainty over the renewal of the three concessions that have not been cancelled but that expire in 2012 and over the restoration of the 13 concessions that were cancelled. The charge is based on a value in use assessment of recoverable amount, includes the impact of recycling a related cash flow hedge reserve and an associated reduction in the related embedded derivative liability. Recoverable amount has been determined using discounted cash flows which use pre-tax discount rates equivalent to a real post tax discount rate of 6%.
Restructuring costs relate to retrenchment costs.
Costs associated with ‘One Anglo’ initiatives principally comprise advisory costs and include costs associated with the corporate review, procurement, shared services and information systems.
Operating remeasurements
US$ million 2009 2008
Net gain/(loss) on non-hedge derivatives 757 (696)
Realised loss on derivatives relating to capital expenditure (105) (120)
Other remeasurements (14) 37
Total operating remeasurements 638 (779)
Tax (207) 252
Minority interests 2 135
Net total attributable to equity shareholders of the Company 433 (392)
The net gain on non-hedge derivatives principally includes net unrealised gains on derivatives relating to capital expenditure held by Iron Ore Brazil and Los Bronces and an unrealised gain on an embedded derivative at Minera Loma de Níquel. A net loss of $105 million was realised in the year in respect of the Iron Ore Brazil and Los Bronces capital expenditure derivative portfolios.
Profits and losses on disposals
US$ million 2009 2008
Disposal of interest in AngloGold Ashanti 1,139 –
Disposal of interest in Booysendal joint venture(1) 247 –
Disposal of interest in Lebowa Platinum Mines Limited(1) 69 –
Disposal of financial asset investments 54 –
Disposal of interests in Tongaat Hulett and Hulamin 53 –
Disposal of Tarmac fixed assets 15 –
Disposal of Silangan exploration asset 10 –
Disposal of interest in China Shenhua Energy – 551
Disposal of interest in Minera Santa Rosa SCM – 142
Disposal of Northam Platinum Limited – 101
Copebrás property compensation – 96
Disposal of Tarmac Iberia – 65
Disposal of Namakwa Sands(1) – 49
Other 25 5
Net profit on disposals 1,612 1,009
Tax (76) (47)
Minority interests (66) (43)
Net total attributable to equity shareholders of the Company 1,470 919
(1) See Disposals of subsidiaries and businesses note 33.
During 2009 the Group sold its remaining investment in AngloGold Ashanti for total proceeds of $1,770 million, generating a profit on disposal of $1,139 million.
Ministerial approval for the sale of Anglo Platinum’s 50% interest in the Booysendal joint venture to Mvelaphanda Resources Limited (Mvela) was received in June 2009. Total consideration was $275 million (excluding transaction and deal facilitation costs), of which $270 million was received in advance in the prior year. At 31 December 2009 $72 million of this remains in an escrow account pending completion of documentation.
The sale of 51% of Anglo Platinum’s holding in Lebowa Platinum Mines Limited (Lebowa) and 1% interest in the Ga Phasha, Boikgantsho and Kwanda joint ventures to Anooraq Resources Corporation (Anooraq) completed on 30 June 2009 for consideration of $363 million (excluding transaction and deal facilitation costs). The fair value of the consideration was $247 million (excluding transaction and deal facilitation costs). The profit on disposal of Lebowa has been revised since 30 June 2009 after finalisation of the valuations of financial instruments and loan commitments.
During 2009 the Group sold its remaining investments in Tongaat Hulett and Hulamin for total proceeds of $671 million (excluding transaction costs) generating a net profit on disposal of $53 million.
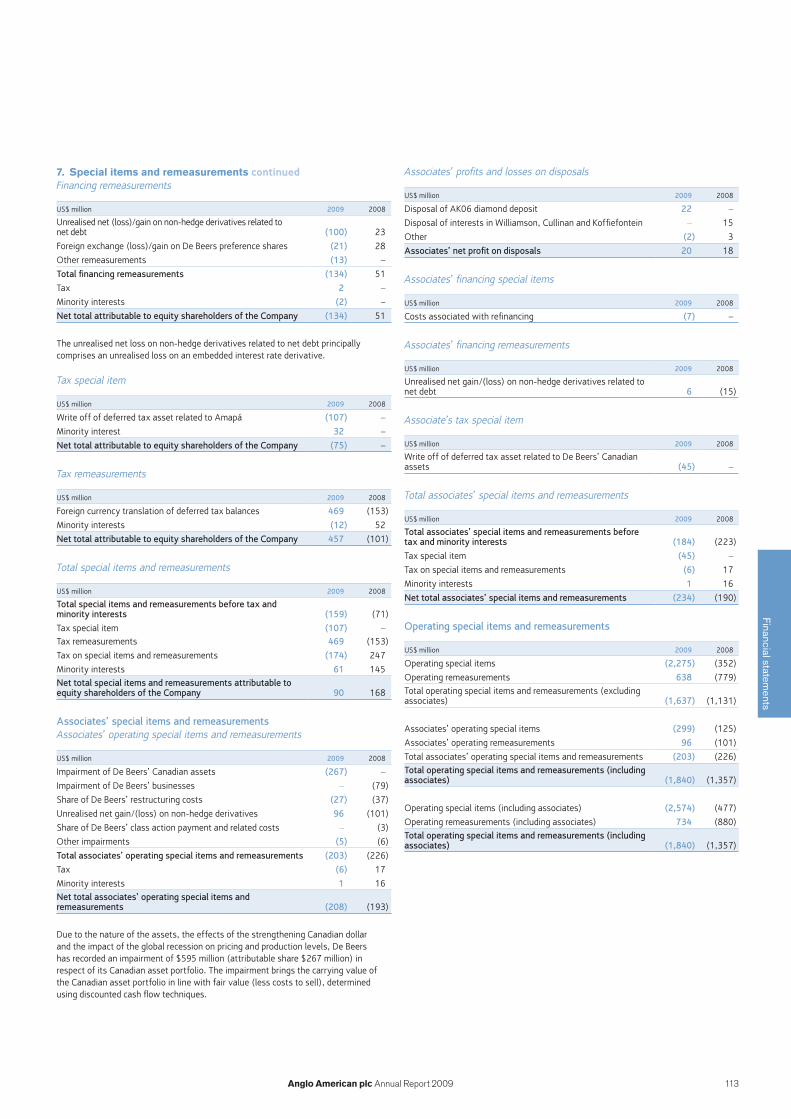
113Anglo American plc Annual Report 2009
Financial statements
7. Special items and remeasurements continuedFinancing remeasurements
US$ million 2009 2008
Unrealised net (loss)/gain on non-hedge derivatives related to net debt (100) 23
Foreign exchange (loss)/gain on De Beers preference shares (21) 28
Other remeasurements (13) –
Total financing remeasurements (134) 51
Tax 2 –
Minority interests (2) –
Net total attributable to equity shareholders of the Company (134) 51
The unrealised net loss on non-hedge derivatives related to net debt principally comprises an unrealised loss on an embedded interest rate derivative.
Tax special item
US$ million 2009 2008
Write off of deferred tax asset related to Amapá (107) –
Minority interest 32 –
Net total attributable to equity shareholders of the Company (75) –
Tax remeasurements
US$ million 2009 2008
Foreign currency translation of deferred tax balances 469 (153)
Minority interests (12) 52
Net total attributable to equity shareholders of the Company 457 (101)
Total special items and remeasurements
US$ million 2009 2008
Total special items and remeasurements before tax and minority interests (159) (71)
Tax special item (107) –Tax remeasurements 469 (153)
Tax on special items and remeasurements (174) 247
Minority interests 61 145Net total special items and remeasurements attributable to equity shareholders of the Company 90 168
Associates’ special items and remeasurementsAssociates’ operating special items and remeasurements
US$ million 2009 2008
Impairment of De Beers’ Canadian assets (267) –
Impairment of De Beers’ businesses – (79)
Share of De Beers’ restructuring costs (27) (37)
Unrealised net gain/(loss) on non-hedge derivatives 96 (101)
Share of De Beers’ class action payment and related costs – (3)
Other impairments (5) (6)
Total associates’ operating special items and remeasurements (203) (226)
Tax (6) 17
Minority interests 1 16Net total associates’ operating special items and remeasurements (208) (193)
Due to the nature of the assets, the effects of the strengthening Canadian dollar and the impact of the global recession on pricing and production levels, De Beers has recorded an impairment of $595 million (attributable share $267 million) in respect of its Canadian asset portfolio. The impairment brings the carrying value of the Canadian asset portfolio in line with fair value (less costs to sell), determined using discounted cash flow techniques.
Associates’ profits and losses on disposals
US$ million 2009 2008
Disposal of AK06 diamond deposit 22 –
Disposal of interests in Williamson, Cullinan and Koffiefontein – 15
Other (2) 3
Associates’ net profit on disposals 20 18
Associates’ financing special items
US$ million 2009 2008
Costs associated with refinancing (7) –
Associates’ financing remeasurements
US$ million 2009 2008
Unrealised net gain/(loss) on non-hedge derivatives related to net debt 6 (15)
Associate’s tax special item
US$ million 2009 2008
Write off of deferred tax asset related to De Beers’ Canadian assets (45) –
Total associates’ special items and remeasurements
US$ million 2009 2008
Total associates’ special items and remeasurements before tax and minority interests (184) (223)
Tax special item (45) –
Tax on special items and remeasurements (6) 17
Minority interests 1 16
Net total associates’ special items and remeasurements (234) (190)
Operating special items and remeasurements
US$ million 2009 2008
Operating special items (2,275) (352)
Operating remeasurements 638 (779)Total operating special items and remeasurements (excluding associates) (1,637) (1,131)
Associates’ operating special items (299) (125)
Associates’ operating remeasurements 96 (101)
Total associates’ operating special items and remeasurements (203) (226)Total operating special items and remeasurements (including associates) (1,840) (1,357)
Operating special items (including associates) (2,574) (477)
Operating remeasurements (including associates) 734 (880)Total operating special items and remeasurements (including associates) (1,840) (1,357)

Financial statements
114 Anglo American plc Annual Report 2009
Notes to the financial statementscontinued
8. Net finance costsFinance costs and exchange gains/(losses) are presented net of effective cash flow hedges for respective interest bearing and foreign currency borrowings.
The weighted average capitalisation rate applied to qualifying capital expenditure was 6.5% (2008: 12.0%). Financing remeasurements are set out in note 7.
2009 2008
US$ million
Before remeasure-
ments
After remeasure-
ments
Before remeasure-
ments
After remeasure-
ments
Investment income
Interest and other financial income 334 334 324 324Expected return on defined benefit arrangements 157 157 215 215Dividend income from financial asset investments 23 23 50 50
Total investment income 514 514 589 589
Interest expense
Interest and other finance expense (724) (724) (815) (815)
Interest paid on convertible bond (44) (44) – –Unwinding of discount on convertible bond (39) (39) – –
Interest on defined benefit arrangements (174) (174) (201) (201)Amortisation of discount relating to provisions (45) (45) (33) (33)
Dividend on redeemable preference shares – – (16) (16)
(1,026) (1,026) (1,065) (1,065)
Less: interest capitalised 246 246 215 215
Total interest expense (780) (780) (850) (850)
Other financing (losses)/gains
Net foreign exchange losses (24) (45) (173) (145)
Fair value gains/(losses) on derivatives 29 (71) (2) 21
Net fair value gains on fair value hedges 29 29 2 2
Other net fair value losses (41) (54) (18) (18)
Total other financing losses (7) (141) (191) (140)
Net finance costs (273) (407) (452) (401)
9. Financial instrument gains and lossesThe net gains and losses recorded in the Consolidated income statement, in respect of financial instruments were as follows:
US$ million 2009 2008
At fair value through profit and loss
Cash flow hedge derivatives(1) (162) (380)
Fair value hedge derivatives 68 (181)
Fair value hedge underlying instruments (39) 183
Other fair value movements(2) 1,099 (1,723)
Loans and receivables
Foreign exchange (148) (121)
Interest income at amortised cost 232 287
Available for sale
Net gain transferred on sale 1,554 476
Other income 23 50
Other financial liabilities
Foreign exchange (92) 479
Interest expense at amortised cost (594) (631)
(1) Gains and losses on derivative instruments designated in cash flow hedge relationships which have been realised in the year have been recorded in Group revenue (2008: Group revenue).
(2) Includes the impact of provisional pricing which is disclosed in note 4.
10. Tax on profit on ordinary activitiesa) Analysis of charge for the year
US$ million 2009 2008
United Kingdom corporation tax at 28% 50 –
United Kingdom corporation tax at 28.5% – 18
South Africa tax 567 840
Other overseas tax 700 1,155
Prior year adjustments (45) (78)
Current tax (excluding special items and remeasurements tax) 1,272 1,935Deferred tax (excluding special items and remeasurements tax) 33 610
Tax (excluding special items and remeasurements tax) 1,305 2,545
Special items and remeasurements tax (188) (94)
Income tax expense 1,117 2,451
b) Factors affecting tax charge for the yearThe effective tax rate for the year of 27.7% (2008: 28.6%) is lower (2008: higher) than the applicable standard rate of corporation tax for 2009 in the United Kingdom (28%) (2008: 28.5%). The reconciling items are:
US$ million 2009 2008
Profit on ordinary activities before tax 4,029 8,571Tax on profit on ordinary activities calculated at United Kingdom corporation tax rate of 28% 1,128 –Tax on profit on ordinary activities calculated at United Kingdom corporation tax rate of 28.5% – 2,443
Tax effect of share of net income from associates (24) (317)
Tax effects of:
Special items and remeasurements
Operating special items and remeasurements 558 28
Profits and losses on disposals and financing remeasurements (340) (255)
Tax special item 107 –
Tax remeasurements (469) 153
Items not taxable/deductible for tax purposes
Exploration expenditure 22 20
Non-deductible net foreign exchange loss 6 28
Non-taxable/deductible net interest (income)/expense (2) 10
Other non-deductible expenses 65 127
Other non-taxable income (39) (78)
Temporary difference adjustments
Changes in tax rates – (84)
Movements in tax losses 5 38
Enhanced tax depreciation – (26)
Other temporary differences (45) 42
Other adjustments
Secondary tax on companies and dividend withholding taxes 356 634
Effect of differences between local and United Kingdom rates (139) (181)
Prior year adjustments to current tax (45) (78)
Other adjustments (27) (53)
Income tax expense 1,117 2,451
IAS 1 requires income from associates to be presented net of tax on the face of the income statement. Associates’ tax is therefore not included within the Group’s income tax expense. Associates’ tax included within ‘Share of net income from associates’ for the year ended 31 December 2009 is $286 million (2008: $606 million). Excluding special items and remeasurements this becomes $235 million (2008: $623 million).
The effective rate of tax before special items and remeasurements including attributable share of associates’ tax for the year ended 31 December 2009 was 33.1%. This was broadly in line with the equivalent effective rate of 33.4% for the year ended 31 December 2008. In future periods it is expected that the effective tax rate, including associates’ tax, will remain above the United Kingdom statutory tax rate.
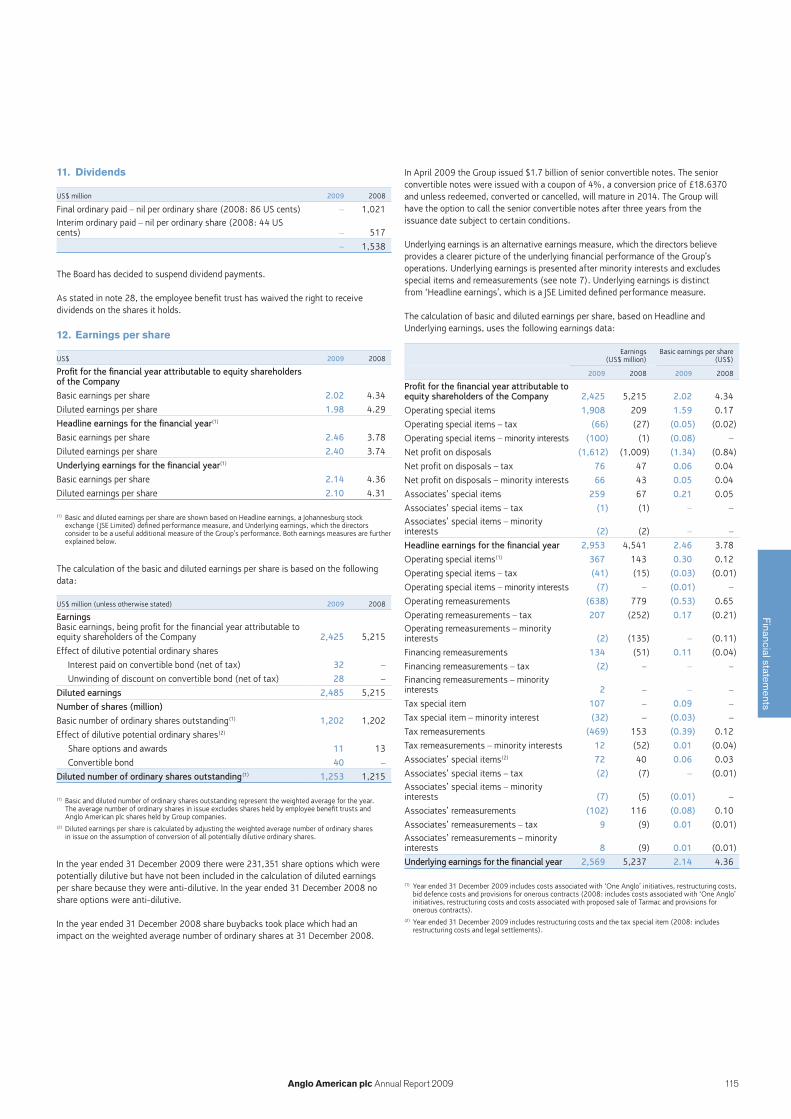
115Anglo American plc Annual Report 2009
Financial statements
11. Dividends
US$ million 2009 2008
Final ordinary paid – nil per ordinary share (2008: 86 US cents) – 1,021Interim ordinary paid – nil per ordinary share (2008: 44 US cents) – 517
– 1,538
The Board has decided to suspend dividend payments.
As stated in note 28, the employee benefit trust has waived the right to receive dividends on the shares it holds.
12. Earnings per share
US$ 2009 2008
Profit for the financial year attributable to equity shareholders of the Company
Basic earnings per share 2.02 4.34
Diluted earnings per share 1.98 4.29
Headline earnings for the financial year(1)
Basic earnings per share 2.46 3.78
Diluted earnings per share 2.40 3.74
Underlying earnings for the financial year(1)
Basic earnings per share 2.14 4.36
Diluted earnings per share 2.10 4.31
(1) Basic and diluted earnings per share are shown based on Headline earnings, a Johannesburg stock exchange (JSE Limited) defined performance measure, and Underlying earnings, which the directors consider to be a useful additional measure of the Group’s performance. Both earnings measures are further explained below.
The calculation of the basic and diluted earnings per share is based on the following data:
US$ million (unless otherwise stated) 2009 2008
EarningsBasic earnings, being profit for the financial year attributable to equity shareholders of the Company 2,425 5,215
Effect of dilutive potential ordinary shares
Interest paid on convertible bond (net of tax) 32 –
Unwinding of discount on convertible bond (net of tax) 28 –
Diluted earnings 2,485 5,215
Number of shares (million)
Basic number of ordinary shares outstanding(1) 1,202 1,202
Effect of dilutive potential ordinary shares(2)
Share options and awards 11 13
Convertible bond 40 –
Diluted number of ordinary shares outstanding(1) 1,253 1,215
(1) Basic and diluted number of ordinary shares outstanding represent the weighted average for the year. The average number of ordinary shares in issue excludes shares held by employee benefit trusts and Anglo American plc shares held by Group companies.
(2) Diluted earnings per share is calculated by adjusting the weighted average number of ordinary shares in issue on the assumption of conversion of all potentially dilutive ordinary shares.
In the year ended 31 December 2009 there were 231,351 share options which were potentially dilutive but have not been included in the calculation of diluted earnings per share because they were anti-dilutive. In the year ended 31 December 2008 no share options were anti-dilutive.
In the year ended 31 December 2008 share buybacks took place which had an impact on the weighted average number of ordinary shares at 31 December 2008.
In April 2009 the Group issued $1.7 billion of senior convertible notes. The senior convertible notes were issued with a coupon of 4%, a conversion price of £18.6370 and unless redeemed, converted or cancelled, will mature in 2014. The Group will have the option to call the senior convertible notes after three years from the issuance date subject to certain conditions.
Underlying earnings is an alternative earnings measure, which the directors believe provides a clearer picture of the underlying financial performance of the Group’s operations. Underlying earnings is presented after minority interests and excludes special items and remeasurements (see note 7). Underlying earnings is distinct from ‘Headline earnings’, which is a JSE Limited defined performance measure.
The calculation of basic and diluted earnings per share, based on Headline and Underlying earnings, uses the following earnings data:
Earnings (US$ million)
Basic earnings per share (US$)
2009 2008 2009 2008
Profit for the financial year attributable to equity shareholders of the Company 2,425 5,215 2.02 4.34
Operating special items 1,908 209 1.59 0.17
Operating special items – tax (66) (27) (0.05) (0.02)
Operating special items – minority interests (100) (1) (0.08) –
Net profit on disposals (1,612) (1,009) (1.34) (0.84)
Net profit on disposals – tax 76 47 0.06 0.04
Net profit on disposals – minority interests 66 43 0.05 0.04
Associates’ special items 259 67 0.21 0.05
Associates’ special items – tax (1) (1) – –Associates’ special items – minority interests (2) (2) – –
Headline earnings for the financial year 2,953 4,541 2.46 3.78
Operating special items(1) 367 143 0.30 0.12
Operating special items – tax (41) (15) (0.03) (0.01)
Operating special items – minority interests (7) – (0.01) –
Operating remeasurements (638) 779 (0.53) 0.65
Operating remeasurements – tax 207 (252) 0.17 (0.21)Operating remeasurements – minority interests (2) (135) – (0.11)
Financing remeasurements 134 (51) 0.11 (0.04)
Financing remeasurements – tax (2) – – –Financing remeasurements – minority interests 2 – – –
Tax special item 107 – 0.09 –
Tax special item – minority interest (32) – (0.03) –
Tax remeasurements (469) 153 (0.39) 0.12
Tax remeasurements – minority interests 12 (52) 0.01 (0.04)
Associates’ special items(2) 72 40 0.06 0.03
Associates’ special items – tax (2) (7) – (0.01)Associates’ special items – minority interests (7) (5) (0.01) –
Associates’ remeasurements (102) 116 (0.08) 0.10
Associates’ remeasurements – tax 9 (9) 0.01 (0.01)Associates’ remeasurements – minority interests 8 (9) 0.01 (0.01)
Underlying earnings for the financial year 2,569 5,237 2.14 4.36
(1) Year ended 31 December 2009 includes costs associated with ‘One Anglo’ initiatives, restructuring costs, bid defence costs and provisions for onerous contracts (2008: includes costs associated with ‘One Anglo’ initiatives, restructuring costs and costs associated with proposed sale of Tarmac and provisions for onerous contracts).
(2) Year ended 31 December 2009 includes restructuring costs and the tax special item (2008: includes restructuring costs and legal settlements).
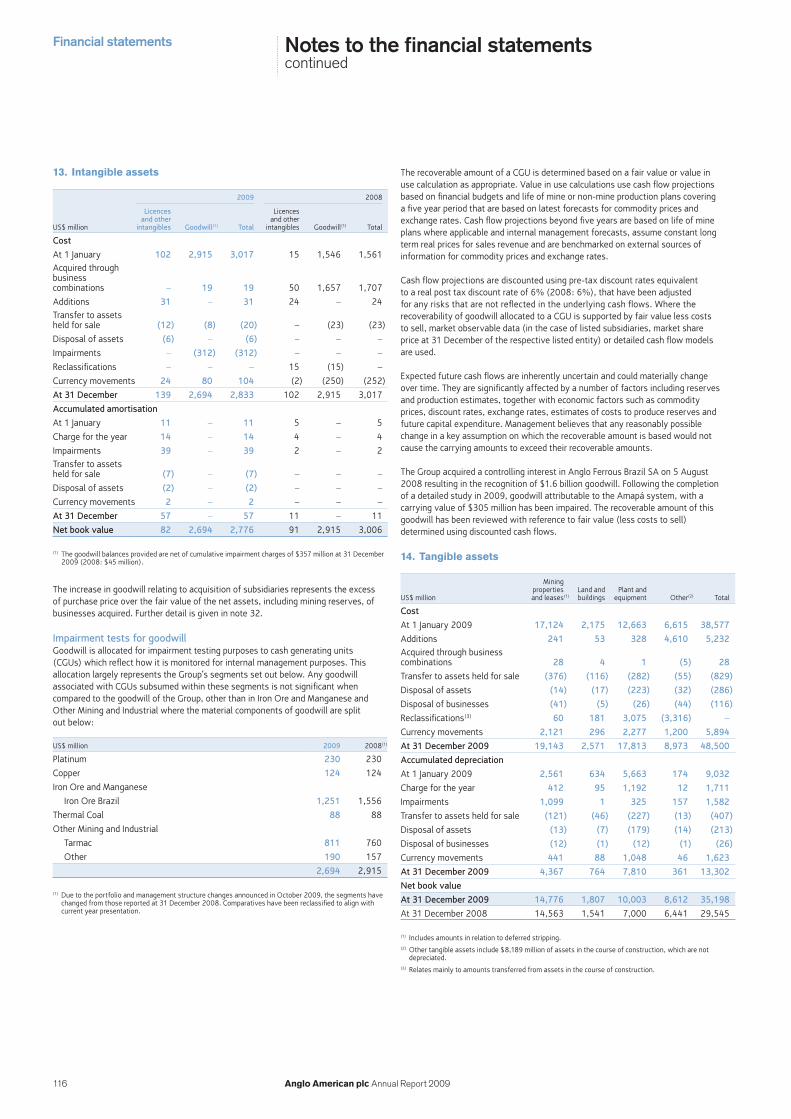
Financial statements
116 Anglo American plc Annual Report 2009
Notes to the financial statementscontinued
13. Intangible assets
2009 2008
US$ million
Licences and other
intangibles Goodwill(1) Total
Licences and other
intangibles Goodwill(1) Total
Cost
At 1 January 102 2,915 3,017 15 1,546 1,561Acquired through business combinations – 19 19 50 1,657 1,707
Additions 31 – 31 24 – 24Transfer to assets held for sale (12) (8) (20) – (23) (23)
Disposal of assets (6) – (6) – – –
Impairments – (312) (312) – – –
Reclassifications – – – 15 (15) –
Currency movements 24 80 104 (2) (250) (252)
At 31 December 139 2,694 2,833 102 2,915 3,017
Accumulated amortisation
At 1 January 11 – 11 5 – 5
Charge for the year 14 – 14 4 – 4
Impairments 39 – 39 2 – 2Transfer to assets held for sale (7) – (7) – – –
Disposal of assets (2) – (2) – – –
Currency movements 2 – 2 – – –
At 31 December 57 – 57 11 – 11
Net book value 82 2,694 2,776 91 2,915 3,006
(1) The goodwill balances provided are net of cumulative impairment charges of $357 million at 31 December 2009 (2008: $45 million).
The increase in goodwill relating to acquisition of subsidiaries represents the excess of purchase price over the fair value of the net assets, including mining reserves, of businesses acquired. Further detail is given in note 32.
Impairment tests for goodwillGoodwill is allocated for impairment testing purposes to cash generating units (CGUs) which reflect how it is monitored for internal management purposes. This allocation largely represents the Group’s segments set out below. Any goodwill associated with CGUs subsumed within these segments is not significant when compared to the goodwill of the Group, other than in Iron Ore and Manganese and Other Mining and Industrial where the material components of goodwill are split out below:
US$ million 2009 2008(1)
Platinum 230 230
Copper 124 124
Iron Ore and Manganese
Iron Ore Brazil 1,251 1,556
Thermal Coal 88 88
Other Mining and Industrial
Tarmac 811 760
Other 190 157
2,694 2,915
(1) Due to the portfolio and management structure changes announced in October 2009, the segments have changed from those reported at 31 December 2008. Comparatives have been reclassified to align with current year presentation.
The recoverable amount of a CGU is determined based on a fair value or value in use calculation as appropriate. Value in use calculations use cash flow projections based on financial budgets and life of mine or non-mine production plans covering a five year period that are based on latest forecasts for commodity prices and exchange rates. Cash flow projections beyond five years are based on life of mine plans where applicable and internal management forecasts, assume constant long term real prices for sales revenue and are benchmarked on external sources of information for commodity prices and exchange rates.
Cash flow projections are discounted using pre-tax discount rates equivalent to a real post tax discount rate of 6% (2008: 6%), that have been adjusted for any risks that are not reflected in the underlying cash flows. Where the recoverability of goodwill allocated to a CGU is supported by fair value less costs to sell, market observable data (in the case of listed subsidiaries, market share price at 31 December of the respective listed entity) or detailed cash flow models are used.
Expected future cash flows are inherently uncertain and could materially change over time. They are significantly affected by a number of factors including reserves and production estimates, together with economic factors such as commodity prices, discount rates, exchange rates, estimates of costs to produce reserves and future capital expenditure. Management believes that any reasonably possible change in a key assumption on which the recoverable amount is based would not cause the carrying amounts to exceed their recoverable amounts.
The Group acquired a controlling interest in Anglo Ferrous Brazil SA on 5 August 2008 resulting in the recognition of $1.6 billion goodwill. Following the completion of a detailed study in 2009, goodwill attributable to the Amapá system, with a carrying value of $305 million has been impaired. The recoverable amount of this goodwill has been reviewed with reference to fair value (less costs to sell) determined using discounted cash flows.
14. Tangible assets
US$ million
Mining properties and leases(1)
Land and buildings
Plant and equipment Other(2) Total
Cost
At 1 January 2009 17,124 2,175 12,663 6,615 38,577
Additions 241 53 328 4,610 5,232Acquired through business combinations 28 4 1 (5) 28
Transfer to assets held for sale (376) (116) (282) (55) (829)
Disposal of assets (14) (17) (223) (32) (286)
Disposal of businesses (41) (5) (26) (44) (116)
Reclassifications(3) 60 181 3,075 (3,316) –
Currency movements 2,121 296 2,277 1,200 5,894
At 31 December 2009 19,143 2,571 17,813 8,973 48,500
Accumulated depreciation
At 1 January 2009 2,561 634 5,663 174 9,032
Charge for the year 412 95 1,192 12 1,711
Impairments 1,099 1 325 157 1,582
Transfer to assets held for sale (121) (46) (227) (13) (407)
Disposal of assets (13) (7) (179) (14) (213)
Disposal of businesses (12) (1) (12) (1) (26)
Currency movements 441 88 1,048 46 1,623
At 31 December 2009 4,367 764 7,810 361 13,302
Net book value
At 31 December 2009 14,776 1,807 10,003 8,612 35,198
At 31 December 2008 14,563 1,541 7,000 6,441 29,545
(1) Includes amounts in relation to deferred stripping.(2) Other tangible assets include $8,189 million of assets in the course of construction, which are not
depreciated.(3) Relates mainly to amounts transferred from assets in the course of construction.
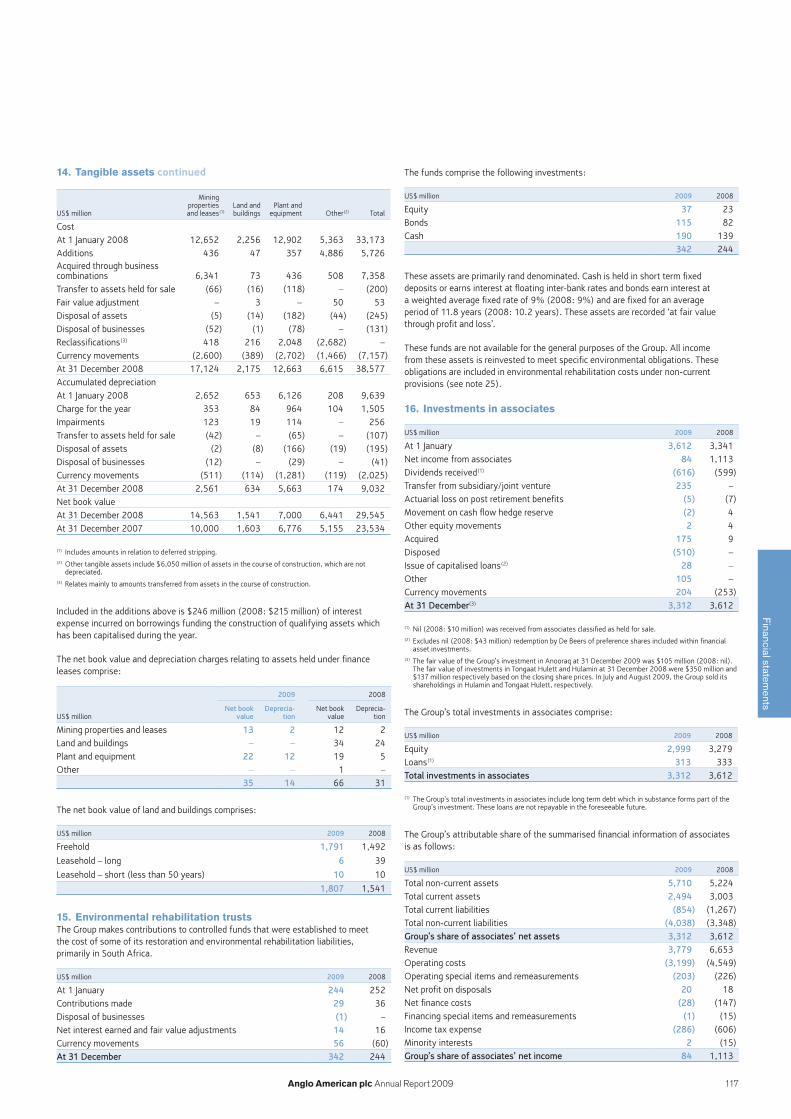
117Anglo American plc Annual Report 2009
Financial statements
14. Tangible assets continued
US$ million
Mining properties and leases(1)
Land and buildings
Plant and equipment Other(2) Total
CostAt 1 January 2008 12,652 2,256 12,902 5,363 33,173Additions 436 47 357 4,886 5,726Acquired through business combinations 6,341 73 436 508 7,358Transfer to assets held for sale (66) (16) (118) – (200)Fair value adjustment – 3 – 50 53Disposal of assets (5) (14) (182) (44) (245)Disposal of businesses (52) (1) (78) – (131)Reclassifications(3) 418 216 2,048 (2,682) –Currency movements (2,600) (389) (2,702) (1,466) (7,157)At 31 December 2008 17,124 2,175 12,663 6,615 38,577Accumulated depreciationAt 1 January 2008 2,652 653 6,126 208 9,639Charge for the year 353 84 964 104 1,505Impairments 123 19 114 – 256Transfer to assets held for sale (42) – (65) – (107)Disposal of assets (2) (8) (166) (19) (195)Disposal of businesses (12) – (29) – (41)Currency movements (511) (114) (1,281) (119) (2,025)At 31 December 2008 2,561 634 5,663 174 9,032Net book valueAt 31 December 2008 14,563 1,541 7,000 6,441 29,545At 31 December 2007 10,000 1,603 6,776 5,155 23,534
(1) Includes amounts in relation to deferred stripping.(2) Other tangible assets include $6,050 million of assets in the course of construction, which are not
depreciated.(3) Relates mainly to amounts transferred from assets in the course of construction.
Included in the additions above is $246 million (2008: $215 million) of interest expense incurred on borrowings funding the construction of qualifying assets which has been capitalised during the year.
The net book value and depreciation charges relating to assets held under finance leases comprise:
2009 2008
US$ millionNet book
valueDeprecia-
tionNet book
valueDeprecia-
tion
Mining properties and leases 13 2 12 2Land and buildings – – 34 24Plant and equipment 22 12 19 5Other – – 1 –
35 14 66 31
The net book value of land and buildings comprises:
US$ million 2009 2008
Freehold 1,791 1,492
Leasehold – long 6 39
Leasehold – short (less than 50 years) 10 10
1,807 1,541
15. Environmental rehabilitation trustsThe Group makes contributions to controlled funds that were established to meet the cost of some of its restoration and environmental rehabilitation liabilities, primarily in South Africa.
US$ million 2009 2008
At 1 January 244 252Contributions made 29 36Disposal of businesses (1) –Net interest earned and fair value adjustments 14 16Currency movements 56 (60)At 31 December 342 244
The funds comprise the following investments:
US$ million 2009 2008
Equity 37 23Bonds 115 82Cash 190 139
342 244
These assets are primarily rand denominated. Cash is held in short term fixed deposits or earns interest at floating inter-bank rates and bonds earn interest at a weighted average fixed rate of 9% (2008: 9%) and are fixed for an average period of 11.8 years (2008: 10.2 years). These assets are recorded ‘at fair value through profit and loss’.
These funds are not available for the general purposes of the Group. All income from these assets is reinvested to meet specific environmental obligations. These obligations are included in environmental rehabilitation costs under non-current provisions (see note 25).
16. Investments in associates
US$ million 2009 2008
At 1 January 3,612 3,341Net income from associates 84 1,113Dividends received(1) (616) (599)Transfer from subsidiary/joint venture 235 –Actuarial loss on post retirement benefits (5) (7)Movement on cash flow hedge reserve (2) 4Other equity movements 2 4Acquired 175 9Disposed (510) –Issue of capitalised loans(2) 28 –Other 105 –Currency movements 204 (253)At 31 December(3) 3,312 3,612
(1) Nil (2008: $10 million) was received from associates classified as held for sale.(2) Excludes nil (2008: $43 million) redemption by De Beers of preference shares included within financial
asset investments.(3) The fair value of the Group’s investment in Anooraq at 31 December 2009 was $105 million (2008: nil).
The fair value of investments in Tongaat Hulett and Hulamin at 31 December 2008 were $350 million and $137 million respectively based on the closing share prices. In July and August 2009, the Group sold its shareholdings in Hulamin and Tongaat Hulett, respectively.
The Group’s total investments in associates comprise:
US$ million 2009 2008
Equity 2,999 3,279Loans(1) 313 333Total investments in associates 3,312 3,612
(1) The Group’s total investments in associates include long term debt which in substance forms part of the Group’s investment. These loans are not repayable in the foreseeable future.
The Group’s attributable share of the summarised financial information of associates is as follows:
US$ million 2009 2008
Total non-current assets 5,710 5,224Total current assets 2,494 3,003Total current liabilities (854) (1,267)Total non-current liabilities (4,038) (3,348)Group’s share of associates’ net assets 3,312 3,612Revenue 3,779 6,653Operating costs (3,199) (4,549)Operating special items and remeasurements (203) (226)Net profit on disposals 20 18Net finance costs (28) (147)Financing special items and remeasurements (1) (15)Income tax expense (286) (606)Minority interests 2 (15)Group’s share of associates’ net income 84 1,113
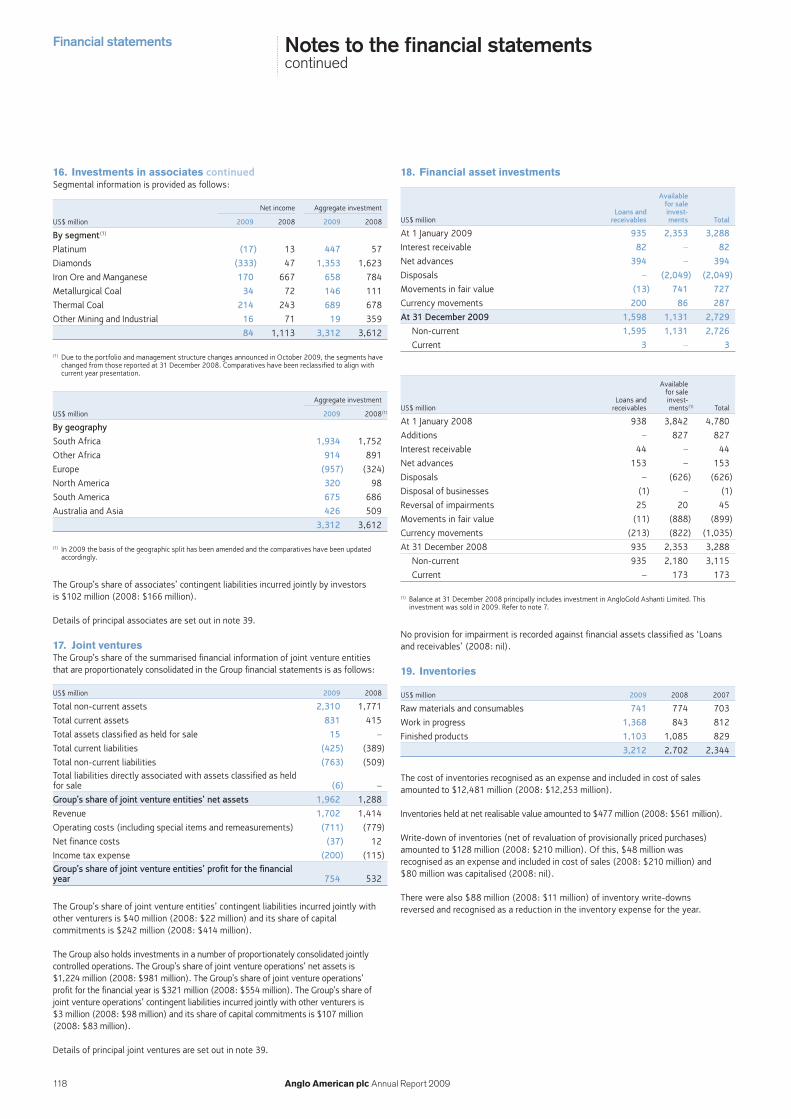
Financial statements
118 Anglo American plc Annual Report 2009
Notes to the financial statementscontinued
16. Investments in associates continuedSegmental information is provided as follows:
Net income Aggregate investment
US$ million 2009 2008 2009 2008
By segment(1)
Platinum (17) 13 447 57
Diamonds (333) 47 1,353 1,623
Iron Ore and Manganese 170 667 658 784
Metallurgical Coal 34 72 146 111
Thermal Coal 214 243 689 678
Other Mining and Industrial 16 71 19 359
84 1,113 3,312 3,612
(1) Due to the portfolio and management structure changes announced in October 2009, the segments have changed from those reported at 31 December 2008. Comparatives have been reclassified to align with current year presentation.
Aggregate investment
US$ million 2009 2008(1)
By geography
South Africa 1,934 1,752
Other Africa 914 891
Europe (957) (324)
North America 320 98
South America 675 686
Australia and Asia 426 509
3,312 3,612
(1) In 2009 the basis of the geographic split has been amended and the comparatives have been updated accordingly.
The Group’s share of associates’ contingent liabilities incurred jointly by investors is $102 million (2008: $166 million).
Details of principal associates are set out in note 39.
17. Joint venturesThe Group’s share of the summarised financial information of joint venture entities that are proportionately consolidated in the Group financial statements is as follows:
US$ million 2009 2008
Total non-current assets 2,310 1,771
Total current assets 831 415
Total assets classified as held for sale 15 –
Total current liabilities (425) (389)
Total non-current liabilities (763) (509)Total liabilities directly associated with assets classified as held for sale (6) –
Group’s share of joint venture entities’ net assets 1,962 1,288
Revenue 1,702 1,414
Operating costs (including special items and remeasurements) (711) (779)
Net finance costs (37) 12
Income tax expense (200) (115)Group’s share of joint venture entities’ profit for the financial year 754 532
The Group’s share of joint venture entities’ contingent liabilities incurred jointly with other venturers is $40 million (2008: $22 million) and its share of capital commitments is $242 million (2008: $414 million).
The Group also holds investments in a number of proportionately consolidated jointly controlled operations. The Group’s share of joint venture operations’ net assets is $1,224 million (2008: $981 million). The Group’s share of joint venture operations’ profit for the financial year is $321 million (2008: $554 million). The Group’s share of joint venture operations’ contingent liabilities incurred jointly with other venturers is $3 million (2008: $98 million) and its share of capital commitments is $107 million (2008: $83 million).
Details of principal joint ventures are set out in note 39.
18. Financial asset investments
US$ millionLoans and
receivables
Available for sale invest-ments Total
At 1 January 2009 935 2,353 3,288
Interest receivable 82 – 82
Net advances 394 – 394
Disposals – (2,049) (2,049)
Movements in fair value (13) 741 727
Currency movements 200 86 287
At 31 December 2009 1,598 1,131 2,729
Non-current 1,595 1,131 2,726
Current 3 – 3
US$ millionLoans and
receivables
Available for sale invest-ments(1) Total
At 1 January 2008 938 3,842 4,780
Additions – 827 827
Interest receivable 44 – 44
Net advances 153 – 153
Disposals – (626) (626)
Disposal of businesses (1) – (1)
Reversal of impairments 25 20 45
Movements in fair value (11) (888) (899)
Currency movements (213) (822) (1,035)
At 31 December 2008 935 2,353 3,288
Non-current 935 2,180 3,115
Current – 173 173
(1) Balance at 31 December 2008 principally includes investment in AngloGold Ashanti Limited. This investment was sold in 2009. Refer to note 7.
No provision for impairment is recorded against financial assets classified as ‘Loans and receivables’ (2008: nil).
19. Inventories
US$ million 2009 2008 2007
Raw materials and consumables 741 774 703
Work in progress 1,368 843 812
Finished products 1,103 1,085 829
3,212 2,702 2,344
The cost of inventories recognised as an expense and included in cost of sales amounted to $12,481 million (2008: $12,253 million).
Inventories held at net realisable value amounted to $477 million (2008: $561 million).
Write-down of inventories (net of revaluation of provisionally priced purchases) amounted to $128 million (2008: $210 million). Of this, $48 million was recognised as an expense and included in cost of sales (2008: $210 million) and $80 million was capitalised (2008: nil).
There were also $88 million (2008: $11 million) of inventory write-downs reversed and recognised as a reduction in the inventory expense for the year.

119Anglo American plc Annual Report 2009
Financial statements
20. Trade and other receivables
2009 2008 2007
US$ millionDue within
one yearDue after one year Total
Due within one year
Due after one year Total
Due within one year
Due after one year Total
Trade receivables 2,496 145 2,641 1,969 57 2,026 3,000 30 3,030
Amounts owed by related parties 12 – 12 13 – 13 16 – 16
Other receivables 639 55 694 725 33 758 420 125 545
Prepayments and accrued income 201 6 207 222 4 226 136 4 140
3,348 206 3,554 2,929 94 3,023 3,572 159 3,731
22. Financial assetsThe carrying amounts and fair values of financial assets are as follows:
2009 2008
US$ millionEstimated fair value
Carrying value
Estimated fair value
Carrying value
At fair value through profit and loss
Trade and other receivables(1) 838 838 192 192
Other financial assets (derivatives)(2) 603 603 376 376
Loans and receivables
Cash and cash equivalents 3,269 3,269 2,771 2,771
Trade and other receivables(1) 2,509 2,509 2,605 2,605
Financial asset investments 1,569 1,598 906 935
Available for sale investments
Financial asset investments 1,131 1,131 2,353 2,353
Total financial assets 9,919 9,948 9,203 9,232
(1) Trade and other receivables exclude prepayments.(2) Derivative instruments are analysed between those which are ‘Held for trading’ and those designated into
hedge relationships in note 24.
The fair values of financial assets represent the market value of quoted investments and other traded instruments. For non-listed investments and other non-traded financial assets fair value is calculated using discounted cash flows with market assumptions, unless carrying value is considered to approximate fair value.
An analysis of financial assets carried at fair value is set out below:
2009
US$ million Level 1(1) Level 2(2) Level 3(3) Total
At fair value through profit and loss
Trade and other receivables – 838 – 838
Other financial assets (derivatives) 3 569 31 603
Available for sale investments
Financial asset investments 1,072 19 40 1,131
1,075 1,426 71 2,572
(1) Valued using unadjusted quoted prices in active markets for identical financial instruments. This category includes listed equity shares, and certain exchange-traded derivatives.
(2) Valued using techniques based significantly on observable market data. Instruments in this category are valued using valuation techniques where all of the inputs that have a significant effect on the valuation are directly or indirectly based on observable market data.
(3) Instruments in this category have been valued using a valuation technique where at least one input (which could have a significant effect on the instrument’s valuation) is not based on observable market data. Where inputs can be observed from market data without undue cost and effort, the observed input is used. Otherwise, management determines a reasonable estimate for the input. Financial assets included within level 3 primarily consist of embedded derivatives and financial asset investments where valuation depends upon unobservable inputs.
The historical level of customer default is minimal and as a result the ‘credit quality’ of year end trade receivables which are not past due is considered to be high. Of the year end trade receivables balance the following were past due at 31 December (stated after associated impairment provision):
US$ million 2009 2008
Less than one month 123 85
Between one to two months 38 30
Between two to three months 12 10
Greater than three months 34 25
207 150
The overdue debtor ageing profile above is typical of the industry in which certain of the Group’s businesses operate. Given this, existing insurance cover (including letters of credit from financial institutions) and the nature of the related counterparties these amounts are considered recoverable.
Total trade receivables are stated net of the following impairment provision:
US$ million
At 1 January 2008 22
Charge for the year 16
Reclassification 14
Transfer to assets held for sale (2)
Currency movements (9)
At 1 January 2009 41
Charge for the year 9
Transfer to assets held for sale (4)
Currency movements 5
At 31 December 2009 51
21. Trade and other payables
US$ million 2009 2008 2007
Trade payables 2,939 3,183 2,546
Tax and social security 163 74 115
Other payables(1) 785 1,162 868
Accruals and deferred income 508 351 421
4,395 4,770 3,950
(1) On 20 August 2008 Anglo Platinum received $307 million from a subsidiary of Mvelaphanda Resources Limited (Mvela) in respect of the anticipated disposal of a 50% interest in the Booysendal joint venture. These funds were invested in accordance with the terms of sale and were only to be released to Anglo Platinum upon ministerial approval. At 31 December 2008 an amount of $253 million was included within other payables representing the obligation to repay the funds failing the receipt of such approval. Following ministerial approval and subsequent completion of the disposal on 24 June 2009, the $253 million included within other payables was released.

Financial statements
120 Anglo American plc Annual Report 2009
Notes to the financial statementscontinued
22. Financial assets continuedThe movements in the fair value of the level 3 financial assets are shown in the following table:
US$ million 2009
At 1 January 137
Net loss recorded in financing remeasurements (111)
Net gain recorded in statement of comprehensive income 1
Reclassification to Other financial liabilities (derivatives) 35
Currency movements 9
At 31 December 71
For the level 3 financial assets, changing certain inputs to reasonably possible alternative assumptions may change the fair value significantly. Where significant, the effect of a change in these assumptions to a reasonably possible alternative assumption is outlined in the table below. These sensitivities have been calculated by amending the fair value of the level 3 financial assets as at 31 December 2009 for a change in each individual assumption, as outlined below, whilst keeping all other assumptions consistent with those used to calculate the fair value recognised in the financial statements.
2009
US$ million Change in assumption
Increase/(decrease)
in fair value of assets
Financial asset investments Decrease of 10% in liquidity discount percentage 11
Increase of 10% in liquidity discount percentage (11)
Financial asset risk exposures are set out in note 24.
23. Financial liabilitiesThe carrying amounts and fair values of financial liabilities are as follows:
2009 2008
US$ millionEstimated fair value
Carrying value
Estimated fair value
Carrying value
At fair value through profit and loss
Trade and other payables(1) 315 315 687 687
Other financial liabilities (derivatives)(2) 659 659 1,497 1,497
Designated into fair value hedge
Borrowings 7,793 7,168 2,850 2,850
Financial liabilities at amortised cost
Trade and other payables(1) 4,297 4,297 4,391 4,391
Borrowings(3) 8,744 7,147 10,658 11,145
Total financial liabilities 21,808 19,586 20,083 20,570
(1) Trade and other payables exclude tax and social security and current and non-current deferred income and include other non-current payables.
(2) Derivative instruments are analysed between those which are ‘Held for trading’ and those designated into hedge relationships in note 24.
(3) Fair value of the convertible bond represents the quoted price of the debt at 31 December 2009 and therefore includes the portion accounted for in equity.
The fair value of financial liabilities is determined by reference to its quoted market price, otherwise the carrying value approximates fair value.
An analysis of financial liabilities carried at fair value is set out below:
2009
US$ million Level 1(1) Level 2(2) Level 3(3) Total
At fair value through profit and loss
Trade and other payables – 315 – 315
Other financial liabilities (derivatives) 3 543 113 659
3 858 113 974
(1) Valued using unadjusted quoted prices in active markets for identical financial instruments. This category includes exchange-traded derivatives.
(2) Valued using techniques based significantly on observable market data. Instruments in this category are valued using valuation techniques where all of the inputs that have a significant effect on the valuation are directly or indirectly based on observable market data.
(3) Instruments in this category have been valued using a valuation technique where at least one input (which could have a significant effect on the instrument’s valuation) is not based on observable market data. Where inputs can be observed from market data without undue cost and effort, the observed input is used. Otherwise, management determines a reasonable estimate for the input. Financial instruments included within level 3 primarily consist of embedded derivatives where valuation depends upon unobservable inputs.
The movements in the fair value of the level 3 financial liabilities are shown in the following table:
US$ million 2009
At 1 January 269
Net gain recorded in financing remeasurements (21)
Net loss recorded in underlying earnings 6
Reduction in assumed life of financial liability(1) (181)
Reclassification from Other financial assets (derivatives) 35
Currency movements 5
At 31 December 113
(1) Relates to reduction of embedded derivative liability in Minera Loma de Níquel and is recorded in operating special items.
For the level 3 financial liabilities, changing certain inputs to reasonably possible alternative assumptions may change the fair value significantly. Where significant, the effect of a change in these assumptions to a reasonably possible alternative assumption is outlined in the table below. These sensitivities have been calculated by amending the fair value of the level 3 financial liabilities as at 31 December 2009 for a change in each individual assumption, as outlined below, whilst keeping all other assumptions consistent with those used to calculate the fair value recognised in the financial statements.
2009
US$ million Change in assumption
Increase/(decrease)
in fair value of liabilities
Other financial liabilities (derivatives)
Increase of 5% in dividend forecast
Decrease of 5% in dividend forecast
9
(9)Shift of TJLP curve(1) (5)-5
(1) Brazilian domestic long term interest rate curve. Range provided due to the different base assumptions used by the relevant banks.
Financial liability risk exposures are set out in note 24.
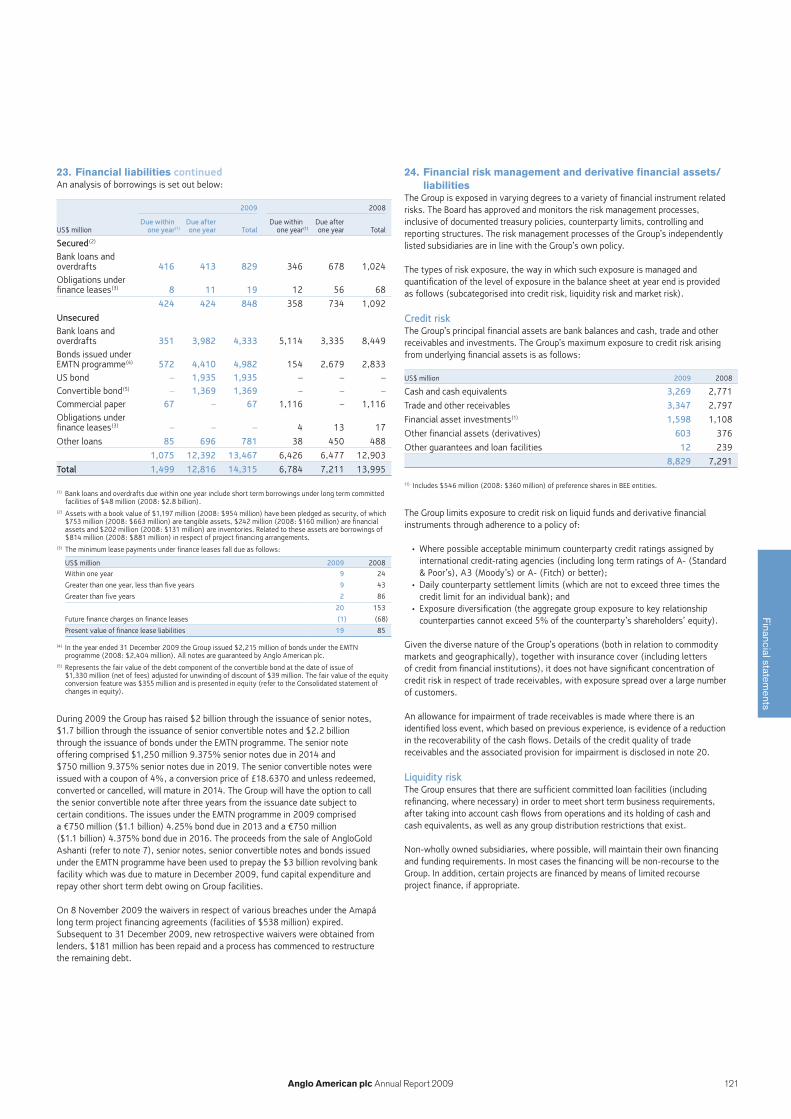
121Anglo American plc Annual Report 2009
Financial statements
23. Financial liabilities continuedAn analysis of borrowings is set out below:
2009 2008
US$ millionDue within
one year(1)Due after one year Total
Due within one year(1)
Due after one year Total
Secured(2)
Bank loans and overdrafts 416 413 829 346 678 1,024Obligations under finance leases(3) 8 11 19 12 56 68
424 424 848 358 734 1,092
UnsecuredBank loans and overdrafts 351 3,982 4,333 5,114 3,335 8,449Bonds issued under EMTN programme(4) 572 4,410 4,982 154 2,679 2,833US bond – 1,935 1,935 – – –Convertible bond(5) – 1,369 1,369 – – –Commercial paper 67 – 67 1,116 – 1,116Obligations under finance leases(3) – – – 4 13 17
Other loans 85 696 781 38 450 488
1,075 12,392 13,467 6,426 6,477 12,903
Total 1,499 12,816 14,315 6,784 7,211 13,995
(1) Bank loans and overdrafts due within one year include short term borrowings under long term committed facilities of $48 million (2008: $2.8 billion).
(2) Assets with a book value of $1,197 million (2008: $954 million) have been pledged as security, of which $753 million (2008: $663 million) are tangible assets, $242 million (2008: $160 million) are financial assets and $202 million (2008: $131 million) are inventories. Related to these assets are borrowings of $814 million (2008: $881 million) in respect of project financing arrangements.
(3) The minimum lease payments under finance leases fall due as follows:
US$ million 2009 2008
Within one year 9 24
Greater than one year, less than five years 9 43
Greater than five years 2 86
20 153
Future finance charges on finance leases (1) (68)
Present value of finance lease liabilities 19 85
(4) In the year ended 31 December 2009 the Group issued $2,215 million of bonds under the EMTN programme (2008: $2,404 million). All notes are guaranteed by Anglo American plc.
(5) Represents the fair value of the debt component of the convertible bond at the date of issue of $1,330 million (net of fees) adjusted for unwinding of discount of $39 million. The fair value of the equity conversion feature was $355 million and is presented in equity (refer to the Consolidated statement of changes in equity).
During 2009 the Group has raised $2 billion through the issuance of senior notes, $1.7 billion through the issuance of senior convertible notes and $2.2 billion through the issuance of bonds under the EMTN programme. The senior note offering comprised $1,250 million 9.375% senior notes due in 2014 and $750 million 9.375% senior notes due in 2019. The senior convertible notes were issued with a coupon of 4%, a conversion price of £18.6370 and unless redeemed, converted or cancelled, will mature in 2014. The Group will have the option to call the senior convertible note after three years from the issuance date subject to certain conditions. The issues under the EMTN programme in 2009 comprised a —750 million ($1.1 billion) 4.25% bond due in 2013 and a —750 million ($1.1 billion) 4.375% bond due in 2016. The proceeds from the sale of AngloGold Ashanti (refer to note 7), senior notes, senior convertible notes and bonds issued under the EMTN programme have been used to prepay the $3 billion revolving bank facility which was due to mature in December 2009, fund capital expenditure and repay other short term debt owing on Group facilities.
On 8 November 2009 the waivers in respect of various breaches under the Amapá long term project financing agreements (facilities of $538 million) expired. Subsequent to 31 December 2009, new retrospective waivers were obtained from lenders, $181 million has been repaid and a process has commenced to restructure the remaining debt.
24. Financial risk management and derivative financial assets/liabilities
The Group is exposed in varying degrees to a variety of financial instrument related risks. The Board has approved and monitors the risk management processes, inclusive of documented treasury policies, counterparty limits, controlling and reporting structures. The risk management processes of the Group’s independently listed subsidiaries are in line with the Group’s own policy.
The types of risk exposure, the way in which such exposure is managed and quantification of the level of exposure in the balance sheet at year end is provided as follows (subcategorised into credit risk, liquidity risk and market risk).
Credit riskThe Group’s principal financial assets are bank balances and cash, trade and other receivables and investments. The Group’s maximum exposure to credit risk arising from underlying financial assets is as follows:
US$ million 2009 2008
Cash and cash equivalents 3,269 2,771
Trade and other receivables 3,347 2,797
Financial asset investments(1) 1,598 1,108
Other financial assets (derivatives) 603 376
Other guarantees and loan facilities 12 239
8,829 7,291
(1) Includes $546 million (2008: $360 million) of preference shares in BEE entities.
The Group limits exposure to credit risk on liquid funds and derivative financial instruments through adherence to a policy of:
Where possible acceptable minimum counterparty credit ratings assigned by • international credit-rating agencies (including long term ratings of A- (Standard & Poor’s), A3 (Moody’s) or A- (Fitch) or better);Daily counterparty settlement limits (which are not to exceed three times the • credit limit for an individual bank); andExposure diversification (the aggregate group exposure to key relationship • counterparties cannot exceed 5% of the counterparty’s shareholders’ equity).
Given the diverse nature of the Group’s operations (both in relation to commodity markets and geographically), together with insurance cover (including letters of credit from financial institutions), it does not have significant concentration of credit risk in respect of trade receivables, with exposure spread over a large number of customers.
An allowance for impairment of trade receivables is made where there is an identified loss event, which based on previous experience, is evidence of a reduction in the recoverability of the cash flows. Details of the credit quality of trade receivables and the associated provision for impairment is disclosed in note 20.
Liquidity riskThe Group ensures that there are sufficient committed loan facilities (including refinancing, where necessary) in order to meet short term business requirements, after taking into account cash flows from operations and its holding of cash and cash equivalents, as well as any group distribution restrictions that exist.
Non-wholly owned subsidiaries, where possible, will maintain their own financing and funding requirements. In most cases the financing will be non-recourse to the Group. In addition, certain projects are financed by means of limited recourse project finance, if appropriate.

Financial statements
122 Anglo American plc Annual Report 2009
Notes to the financial statementscontinued
24. Financial risk management and derivative financial assets/liabilities continued
The expected undiscounted cash flows of the Group’s financial liabilities (including associated derivatives), by remaining contractual maturity, based on conditions existing at the balance sheet date are as follows:
Within one year One to two years
US$ millionFixed
interestFloating interest
Capital repayment
Fixed interest
Floating interest
Capital repayment
31 December 2009Non-derivative financial liabilities (550) (200) (5,660) (523) (185) (3,226)Net settled derivatives(2) 461 (267) – 441 (273) 5
(89) (467) (5,660) (82) (458) (3,221)
31 December 2008Non-derivative financial liabilities (191) (405) (11,385) (179) (245) (732)Net settled derivatives 156 (94) 8 164 (101) (53)
(35) (499) (11,377) (15) (346) (785)
Two to five years Greater than five years
US$ millionFixed
interestFloating interest
Capital repayment
Fixed interest
Floating interest
Capital repayment
31 December 2009Non-derivative financial liabilities (1,379) (295) (5,877) (672) (608) (4,394)Net settled derivatives(2) 1,187 (712) (32) 672 (331) (339)
(192) (1,007) (5,909) – (939) (4,733)
31 December 2008Non-derivative financial liabilities (472) (422) (4,348) (345) (114) (2,412)Net settled derivatives 443 (304) 9 345 (195) (400)
(29) (726) (4,339) – (309) (2,812)
(1) Includes guarantees and loan facilities.(2) At 31 December 2009 the expected maturities were not materially different from the contracted maturities.(3) Includes the full value of the convertible bond and assumes no conversion.
The Group had the following undrawn committed borrowing facilities at 31 December:
US$ million 2009 2008
Expiry date
Within one year(1) 2,247 2,994
Greater than one year, less than two years 3,090 5
Greater than two years, less than five years 4,093 3,081
Greater than five years 90 25
9,520 6,105
(1) Includes undrawn rand facilities equivalent to $1.9 billion (2008: $0.9 billion) in respect of a series of facilities with 364 day maturities which roll automatically on a daily basis, unless notice is served.
(1)
(3)
In addition, the Group has a dedicated, committed financing facility for Minas Rio of $1.4 billion subject to certain disbursement conditions and the granting of the remaining Installation Environmental licence (regarded as likely to occur in 2010) (2008: for Minas Rio and Barro Alto totalling $1.6 billion).
The Group also had a $2 billion European Commercial Paper Programme established in October 2004. Drawings of nil were made at 31 December 2009 (2008: $304 million). The Group also had a Rand 20 billion South African Medium Term Note Programme, established in November 2007, on which total drawings of Rand 691 million ($94 million) were made at 31 December 2009 (2008: Rand 7,273 million ($782 million)). Of this drawing, Rand 491 million ($67 million) was issued as commercial paper (2008: Rand 7,074 million ($761 million)).
Market riskThis is the risk that financial instrument fair values will fluctuate owing to changes in market prices. The significant market risks to which the Group is exposed are foreign exchange risk, interest rate risk and commodity price risk.
Foreign exchange riskAs a global business, the Group is exposed to many currencies principally as a result of non-US dollar operating costs incurred by US dollar functional currency companies and to a lesser extent, from non-US dollar revenues. The Group’s policy is generally not to hedge such exposures as hedging is not deemed appropriate given the diversified nature of the Group, though exceptions can be approved by the Group Management Committee.
In addition, currency exposures exist in respect of non-US dollar approved capital expenditure projects. The Group’s policy is that such exposure can be hedged at management’s discretion, within certain pre-defined limits.
The exposure of the Group’s financial assets and liabilities (excluding intra-group loan balances) to currency risk is as follows:
US$ million
Financial assets
(excluding derivatives)
Impact of currency
derivatives(1)Derivative
assets
Total financial assets –
exposure to currency risk
At 31 December 2009
US dollar(2) 4,353 (202) 565 4,716
Rand 3,125 177 7 3,309
Sterling 455 – – 455
Euro 85 2 – 87
Australian dollar 271 – – 271
Brazilian real 407 – – 407
Other currencies 649 23 31 703
Total financial assets 9,345 – 603 9,948
At 31 December 2008
US dollar(2) 3,118 (108) 252 3,262
Rand 3,895 82 71 4,048
Sterling 547 (2) – 545
Euro 136 – – 136
Australian dollar 290 (4) – 286
Brazilian real(3) 357 – – 357
Other currencies(3) 513 32 53 598
Total financial assets 8,856 – 376 9,232
See following page for footnotes.
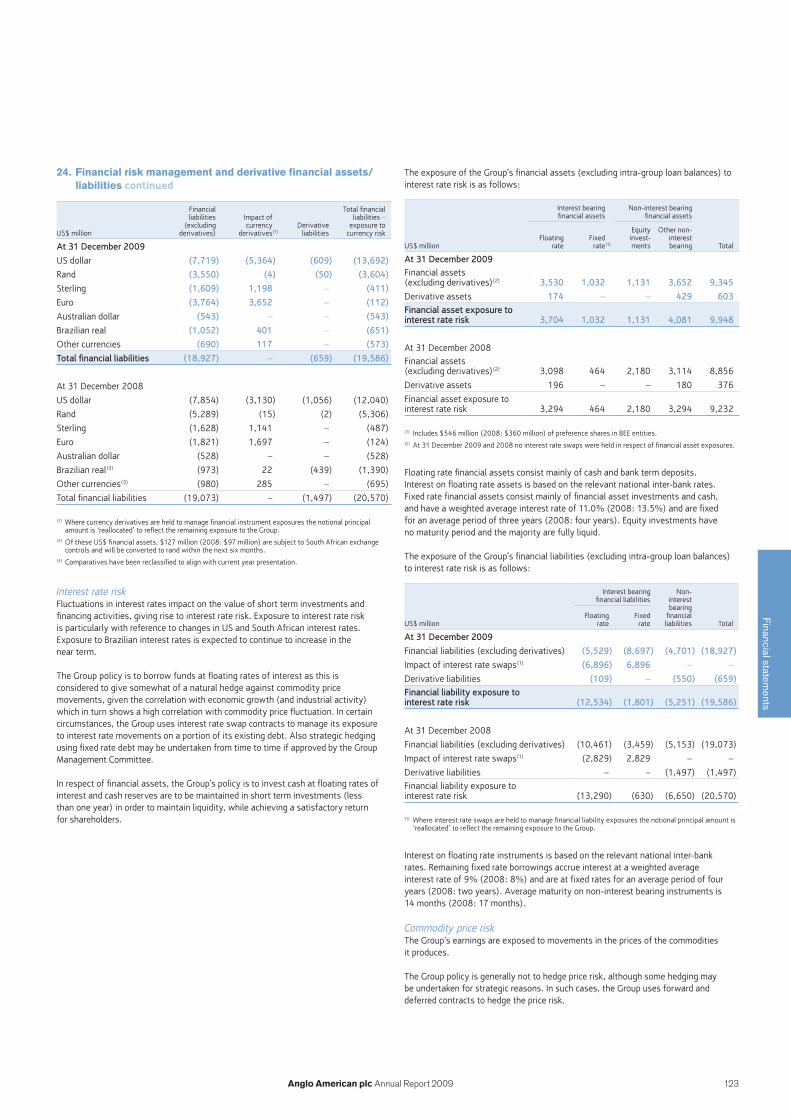
123Anglo American plc Annual Report 2009
Financial statements
24. Financial risk management and derivative financial assets/liabilities continued
US$ million
Financial liabilities
(excluding derivatives)
Impact of currency
derivatives(1)Derivative liabilities
Total financial liabilities –
exposure to currency risk
At 31 December 2009
US dollar (7,719) (5,364) (609) (13,692)
Rand (3,550) (4) (50) (3,604)
Sterling (1,609) 1,198 – (411)
Euro (3,764) 3,652 – (112)
Australian dollar (543) – – (543)
Brazilian real (1,052) 401 – (651)
Other currencies (690) 117 – (573)
Total financial liabilities (18,927) – (659) (19,586)
At 31 December 2008
US dollar (7,854) (3,130) (1,056) (12,040)
Rand (5,289) (15) (2) (5,306)
Sterling (1,628) 1,141 – (487)
Euro (1,821) 1,697 – (124)
Australian dollar (528) – – (528)
Brazilian real(3) (973) 22 (439) (1,390)
Other currencies(3) (980) 285 – (695)
Total financial liabilities (19,073) – (1,497) (20,570)
(1) Where currency derivatives are held to manage financial instrument exposures the notional principal amount is ‘reallocated’ to reflect the remaining exposure to the Group.
(2) Of these US$ financial assets, $127 million (2008: $97 million) are subject to South African exchange controls and will be converted to rand within the next six months.
(3) Comparatives have been reclassified to align with current year presentation.
Interest rate riskFluctuations in interest rates impact on the value of short term investments and financing activities, giving rise to interest rate risk. Exposure to interest rate risk is particularly with reference to changes in US and South African interest rates. Exposure to Brazilian interest rates is expected to continue to increase in the near term.
The Group policy is to borrow funds at floating rates of interest as this is considered to give somewhat of a natural hedge against commodity price movements, given the correlation with economic growth (and industrial activity) which in turn shows a high correlation with commodity price fluctuation. In certain circumstances, the Group uses interest rate swap contracts to manage its exposure to interest rate movements on a portion of its existing debt. Also strategic hedging using fixed rate debt may be undertaken from time to time if approved by the Group Management Committee.
In respect of financial assets, the Group’s policy is to invest cash at floating rates of interest and cash reserves are to be maintained in short term investments (less than one year) in order to maintain liquidity, while achieving a satisfactory return for shareholders.
The exposure of the Group’s financial assets (excluding intra-group loan balances) to interest rate risk is as follows:
Interest bearing financial assets
Non-interest bearing financial assets
US$ millionFloating
rateFixed rate(1)
Equity invest-ments
Other non- interest bearing Total
At 31 December 2009Financial assets (excluding derivatives)(2) 3,530 1,032 1,131 3,652 9,345
Derivative assets 174 – – 429 603Financial asset exposure to interest rate risk 3,704 1,032 1,131 4,081 9,948
At 31 December 2008Financial assets (excluding derivatives)(2) 3,098 464 2,180 3,114 8,856
Derivative assets 196 – – 180 376
Financial asset exposure to interest rate risk 3,294 464 2,180 3,294 9,232
(1) Includes $546 million (2008: $360 million) of preference shares in BEE entities.(2) At 31 December 2009 and 2008 no interest rate swaps were held in respect of financial asset exposures.
Floating rate financial assets consist mainly of cash and bank term deposits. Interest on floating rate assets is based on the relevant national inter-bank rates. Fixed rate financial assets consist mainly of financial asset investments and cash, and have a weighted average interest rate of 11.0% (2008: 13.5%) and are fixed for an average period of three years (2008: four years). Equity investments have no maturity period and the majority are fully liquid.
The exposure of the Group’s financial liabilities (excluding intra-group loan balances) to interest rate risk is as follows:
Interest bearing financial liabilities
Non- interest bearing
financial liabilitiesUS$ million
Floating rate
Fixed rate Total
At 31 December 2009
Financial liabilities (excluding derivatives) (5,529) (8,697) (4,701) (18,927)
Impact of interest rate swaps(1) (6,896) 6,896 – –
Derivative liabilities (109) – (550) (659)Financial liability exposure to interest rate risk (12,534) (1,801) (5,251) (19,586)
At 31 December 2008
Financial liabilities (excluding derivatives) (10,461) (3,459) (5,153) (19,073)
Impact of interest rate swaps(1) (2,829) 2,829 – –
Derivative liabilities – – (1,497) (1,497)Financial liability exposure to interest rate risk (13,290) (630) (6,650) (20,570)
(1) Where interest rate swaps are held to manage financial liability exposures the notional principal amount is ‘reallocated’ to reflect the remaining exposure to the Group.
Interest on floating rate instruments is based on the relevant national inter-bank rates. Remaining fixed rate borrowings accrue interest at a weighted average interest rate of 9% (2008: 8%) and are at fixed rates for an average period of four years (2008: two years). Average maturity on non-interest bearing instruments is 14 months (2008: 17 months).
Commodity price riskThe Group’s earnings are exposed to movements in the prices of the commodities it produces.
The Group policy is generally not to hedge price risk, although some hedging may be undertaken for strategic reasons. In such cases, the Group uses forward and deferred contracts to hedge the price risk.
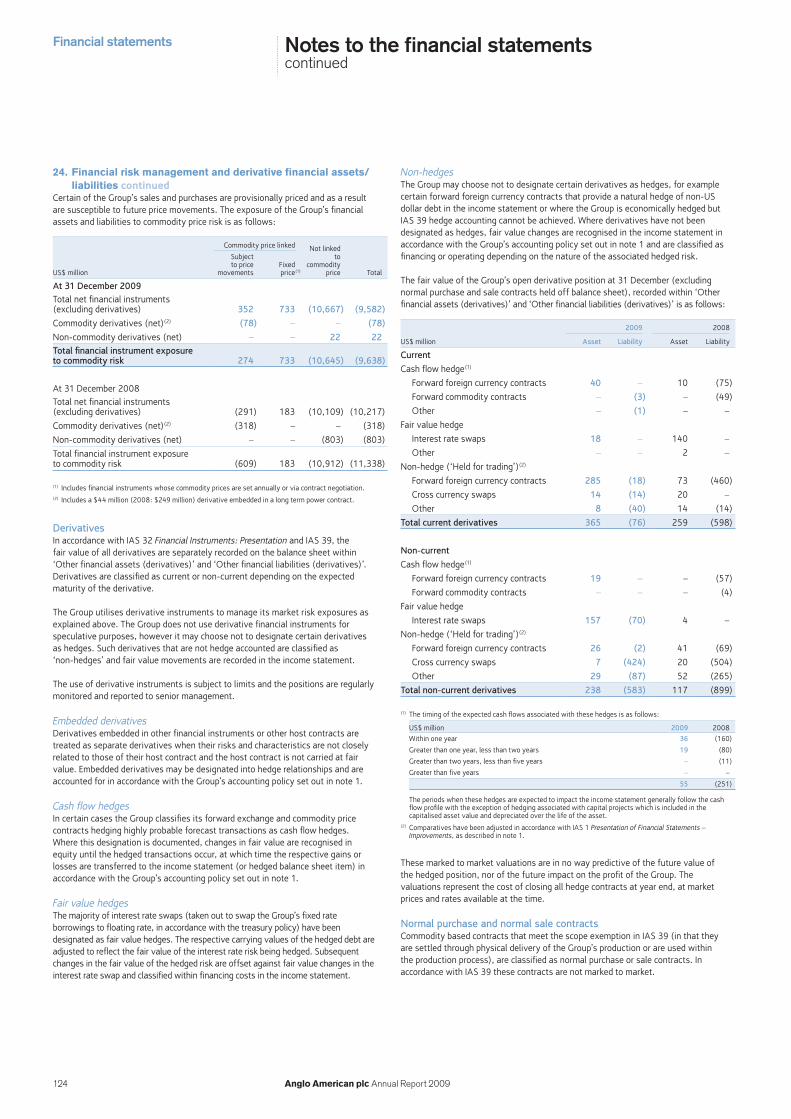
Financial statements
124 Anglo American plc Annual Report 2009
Notes to the financial statementscontinued
24. Financial risk management and derivative financial assets/liabilities continued
Certain of the Group’s sales and purchases are provisionally priced and as a result are susceptible to future price movements. The exposure of the Group’s financial assets and liabilities to commodity price risk is as follows:
Commodity price linked Not linked
US$ million
Subject to price
movementsFixed price(1)
to commodity
price Total
At 31 December 2009Total net financial instruments (excluding derivatives) 352 733 (10,667) (9,582)
Commodity derivatives (net)(2) (78) – – (78)
Non-commodity derivatives (net) – – 22 22Total financial instrument exposure to commodity risk 274 733 (10,645) (9,638)
At 31 December 2008Total net financial instruments (excluding derivatives) (291) 183 (10,109) (10,217)
Commodity derivatives (net)(2) (318) – – (318)
Non-commodity derivatives (net) – – (803) (803)
Total financial instrument exposure to commodity risk (609) 183 (10,912) (11,338)
(1) Includes financial instruments whose commodity prices are set annually or via contract negotiation.(2) Includes a $44 million (2008: $249 million) derivative embedded in a long term power contract.
DerivativesIn accordance with IAS 32 Financial Instruments: Presentation and IAS 39, the fair value of all derivatives are separately recorded on the balance sheet within ‘Other financial assets (derivatives)’ and ‘Other financial liabilities (derivatives)’. Derivatives are classified as current or non-current depending on the expected maturity of the derivative.
The Group utilises derivative instruments to manage its market risk exposures as explained above. The Group does not use derivative financial instruments for speculative purposes, however it may choose not to designate certain derivatives as hedges. Such derivatives that are not hedge accounted are classified as ‘non-hedges’ and fair value movements are recorded in the income statement.
The use of derivative instruments is subject to limits and the positions are regularly monitored and reported to senior management.
Embedded derivativesDerivatives embedded in other financial instruments or other host contracts are treated as separate derivatives when their risks and characteristics are not closely related to those of their host contract and the host contract is not carried at fair value. Embedded derivatives may be designated into hedge relationships and are accounted for in accordance with the Group’s accounting policy set out in note 1.
Cash flow hedgesIn certain cases the Group classifies its forward exchange and commodity price contracts hedging highly probable forecast transactions as cash flow hedges. Where this designation is documented, changes in fair value are recognised in equity until the hedged transactions occur, at which time the respective gains or losses are transferred to the income statement (or hedged balance sheet item) in accordance with the Group’s accounting policy set out in note 1.
Fair value hedgesThe majority of interest rate swaps (taken out to swap the Group’s fixed rate borrowings to floating rate, in accordance with the treasury policy) have been designated as fair value hedges. The respective carrying values of the hedged debt are adjusted to reflect the fair value of the interest rate risk being hedged. Subsequent changes in the fair value of the hedged risk are offset against fair value changes in the interest rate swap and classified within financing costs in the income statement.
Non-hedgesThe Group may choose not to designate certain derivatives as hedges, for example certain forward foreign currency contracts that provide a natural hedge of non-US dollar debt in the income statement or where the Group is economically hedged but IAS 39 hedge accounting cannot be achieved. Where derivatives have not been designated as hedges, fair value changes are recognised in the income statement in accordance with the Group’s accounting policy set out in note 1 and are classified as financing or operating depending on the nature of the associated hedged risk.
The fair value of the Group’s open derivative position at 31 December (excluding normal purchase and sale contracts held off balance sheet), recorded within ‘Other financial assets (derivatives)’ and ‘Other financial liabilities (derivatives)’ is as follows:
2009 2008
US$ million Asset Liability Asset Liability
Current
Cash flow hedge(1)
Forward foreign currency contracts 40 – 10 (75)
Forward commodity contracts – (3) – (49)
Other – (1) – –
Fair value hedge
Interest rate swaps 18 – 140 –
Other – – 2 –
Non-hedge (‘Held for trading’)(2)
Forward foreign currency contracts 285 (18) 73 (460)
Cross currency swaps 14 (14) 20 –
Other 8 (40) 14 (14)
Total current derivatives 365 (76) 259 (598)
Non-current
Cash flow hedge(1)
Forward foreign currency contracts 19 – – (57)
Forward commodity contracts – – – (4)
Fair value hedge
Interest rate swaps 157 (70) 4 –
Non-hedge (‘Held for trading’)(2)
Forward foreign currency contracts 26 (2) 41 (69)
Cross currency swaps 7 (424) 20 (504)
Other 29 (87) 52 (265)
Total non-current derivatives 238 (583) 117 (899)
(1) The timing of the expected cash flows associated with these hedges is as follows:
US$ million 2009 2008
Within one year 36 (160)
Greater than one year, less than two years 19 (80)
Greater than two years, less than five years – (11)
Greater than five years – –
55 (251)
The periods when these hedges are expected to impact the income statement generally follow the cash flow profile with the exception of hedging associated with capital projects which is included in the capitalised asset value and depreciated over the life of the asset.
(2) Comparatives have been adjusted in accordance with IAS 1 Presentation of Financial Statements – Improvements, as described in note 1.
These marked to market valuations are in no way predictive of the future value of the hedged position, nor of the future impact on the profit of the Group. The valuations represent the cost of closing all hedge contracts at year end, at market prices and rates available at the time.
Normal purchase and normal sale contractsCommodity based contracts that meet the scope exemption in IAS 39 (in that they are settled through physical delivery of the Group’s production or are used within the production process), are classified as normal purchase or sale contracts. In accordance with IAS 39 these contracts are not marked to market.

125Anglo American plc Annual Report 2009
Financial statements
24. Financial risk management and derivative financial assets/liabilities continued
Capital risk managementThe Group’s objectives when managing capital are to safeguard the Group’s ability to continue as a going concern in order to provide returns for shareholders and benefits for other stakeholders and, with cognisance of forecast future market conditions and structuring, to maintain an optimal capital structure to reduce the cost of capital.
In order to manage the short and long term capital structure, the Group adjusts the amount of ordinary dividends paid to shareholders, returns capital to shareholders (via, for example, share buybacks and special dividends), arranges debt to fund new acquisitions and also may sell non-core assets to reduce debt.
The Group monitors capital on the basis of the ratio of net debt to total capital less investments in associates (gearing). Net debt is calculated as total borrowings less cash and cash equivalents and current financial asset investments (excluding derivatives which provide an economic hedge of debt and including the net debt of disposal groups). Total capital is calculated as ‘Net assets’ (as shown in the Consolidated balance sheet) excluding net debt. Gearing as at 31 December 2009 was 30.8% (2008: 37.8%). The decrease in gearing since 31 December 2008 is primarily due to the increase in net assets.
Financial instrument sensitivitiesFinancial instruments affected by market risk include borrowings, deposits, derivative financial instruments, trade receivables and trade payables. The following analysis, required by IFRS 7, is intended to illustrate the sensitivity of the Group’s financial instruments (as at year end) to changes in commodity prices, exchange rates and interest rates.
The sensitivity analysis has been prepared on the basis that the components of net debt, the ratio of fixed to floating interest rates of the debt and derivatives portfolio and the proportion of financial instruments in foreign currencies are all constant and on the basis of the hedge designations in place at 31 December. In addition, the commodity price impact for provisionally priced contracts is based on the related trade receivables and trade payables at 31 December. As a consequence, this sensitivity analysis relates to the position as at 31 December.
The following assumptions were made in calculating the sensitivity analysis:
All income statement sensitivities also impact equity.• For debt and other deposits carried at amortised cost, carrying value does not • change as interest rates move.No sensitivity is provided for interest accruals as these are based on pre-agreed • interest rates and therefore are not susceptible to further rate changes.Changes in the carrying value of derivatives (from movements in commodity • prices and interest rates) designated as cash flow hedges are assumed to be recorded fully within equity on the grounds of materiality.No sensitivity has been calculated on derivatives and related underlying • instruments designated into fair value hedge relationships as these are assumed materially to offset one another.All hedge relationships are assumed to be fully effective on the grounds of • materiality.Debt with a maturity of less than one year is floating rate, unless it is a long term • fixed rate debt in its final year.Translation of foreign subsidiaries and operations into the Group’s presentation • currency has been excluded from the sensitivity.
Using the above assumptions, the following tables show the illustrative effect on the income statement and equity that would result from reasonably possible changes in the relevant commodity price, foreign currency or interest rates.
US$ millionIncome
statement Equity
Commodity price sensitivities
2009
10% increase in the platinum price (14) (14)
10% decrease in the platinum price 14 14
10% increase in the copper price 89 89
10% decrease in the copper price (89) (89)
10% increase in the coal price – –
10% decrease in the coal price – –
2008
10% increase in the platinum price (9) (9)
10% decrease in the platinum price 9 9
10% increase in the copper price 47 47
10% decrease in the copper price (47) (47)
10% increase in the coal price – (11)
10% decrease in the coal price – 11
Interest rate sensitivities
2009
50 bp increase in US interest rates 3 3
50 bp decrease in US interest rates (3) (3)
50 bp increase in South African interest rates – –
50 bp decrease in South African interest rates – –
2008
25 bp increase in US interest rates (6) (6)
25 bp decrease in US interest rates 6 6
50 bp increase in South African interest rates (11) (10)
50 bp decrease in South African interest rates 11 10
Foreign currency sensitivities(1)
2009
+10% US dollar to rand (59) (59)
-10% US dollar to rand 59 59
+10% US dollar to Australian dollar 4 4
-10% US dollar to Australian dollar (4) (4)
+10% US dollar to Brazilian real 191 198
-10% US dollar to Brazilian real (175) (183)
+10% US dollar to Chilean peso (11) (67)
-10% US dollar to Chilean peso 14 82
2008
+10% US dollar to rand 45 42
-10% US dollar to rand (46) (43)
+10% US dollar to Australian dollar 20 19
-10% US dollar to Australian dollar (20) (18)
+10% US dollar to Brazilian real (125) (128)
-10% US dollar to Brazilian real 176 180
+10% US dollar to Chilean peso (25) (42)
-10% US dollar to Chilean peso 30 51
(1) + represents strengthening of US dollar against the respective currency.
The above sensitivities are calculated with reference to a single moment in time and are subject to change due to a number of factors including:
fluctuating trade receivable and trade payable balances;• derivative instruments and borrowings settled throughout the year; • fluctuating cash balances; • changes in currency mix; and • commercial paper with short term maturities, which is regularly replaced or settled.•
As the sensitivities are limited to year end financial instrument balances they do not take account of the Group’s sales and operating costs which are highly sensitive to changes in commodity prices and exchange rates. In addition, each of the sensitivities is calculated in isolation, while in reality commodity prices, foreign exchange rates and interest rates do not move independently.

Financial statements
126 Anglo American plc Annual Report 2009
Notes to the financial statementscontinued
25. Provisions for liabilities and charges
US$ million
Environ-mental restor-
ation(1)Decomm-issioning(1) Other Total(2)
At 1 January 2009 700 241 544 1,485
Acquired through business combinations (5) 6 – 1
Disposal of businesses – (1) – (1)
Charged to the income statement 33 30 186 249Transfer to liabilities directly associated with assets held for sale (35) (11) (13) (59)
Capitalised 33 4 – 37
Unwinding of discount 21 20 4 45
Unused amounts reversed (5) (5) (61) (71)
Amounts applied (19) (1) (87) (107)
Currency movements 116 53 44 213
At 31 December 2009 839 336 617 1,792
Maturity analysis of total provisions:
US$ million 2009 2008
Current 209 168
Non-current 1,583 1,317
1,792 1,485
(1) The Group makes contributions to controlled funds to meet the cost of some of its decommissioning, restoration and environmental rehabilitation liabilities (see note 15).
(2) Provisions for liabilities and charges at 31 December 2007 were $1,224 million. This related to $675 million of environmental restoration provisions, $256 million of decommissioning provisions and $293 million of other provisions.
(3) Relates to fair value adjustments on acquisitions.(4) Amounts capitalised in the environmental restoration provision relate to amounts that will be recovered
from third parties when the actual expenditure is incurred.
Environmental restorationThe Group has an obligation to undertake restoration, rehabilitation and environmental work when environmental disturbance is caused by the development or ongoing production of a mining property. A provision is recognised for the present value of such costs. It is anticipated that these costs will be incurred over a period in excess of 20 years.
DecommissioningProvision is made for the present value of costs relating to the decommissioning of plant or other site restoration work. It is anticipated that these costs will be incurred over a period in excess of 20 years.
OtherOther provisions primarily relate to cash settled share-based payments, indemnities, warranties and legal claims. It is anticipated that these costs will be incurred over a five year period.
(3)
(4)
26. Deferred taxDeferred tax assets
US$ million 2009 2008
At 1 January 258 474
Credited/(charged) to the income statement 12 (31)
Charged to the statement of comprehensive income (33) (57)
Credited/(charged) directly to equity 13 (40)
Transfer to assets held for sale (5) (14)
Reclassifications – (21)
Currency movements 43 (53)
At 31 December 288 258
Deferred tax liabilities
US$ million 2009 2008
At 1 January (4,555) (4,650)
Credited/(charged) to the income statement 144 (398)
Credited to the statement of comprehensive income 36 130
Credited/(charged) directly to equity 7 (25)
Acquired through business combinations 54 (798)
Transfer to liabilities directly associated with assets held for sale 46 28
Disposal of businesses – 18
Reclassifications – (79)
Currency movements (924) 1,219
At 31 December (5,192) (4,555)
The amount of deferred tax recognised in the balance sheet is as follows:
US$ million 2009 2008
Deferred tax assets
Tax losses 49 13
Post retirement benefits 48 36
Share-based payments 42 8
Other temporary differences 149 201
288 258
Deferred tax liabilities
Capital allowances in excess of depreciation (2,846) (2,333)
Fair value adjustments (1,942) (2,201)
Tax losses 115 117
Derivatives (106) 119
Provisions (405) (287)
Other temporary differences (8) 30
(5,192) (4,555)
The amount of deferred tax (credited)/charged to the income statement is as follows:
US$ million 2009 2008
Capital allowances in excess of depreciation (79) 460
Fair value adjustments (502) (96)
Tax losses (33) (18)
Derivatives 208 (281)
Provisions 114 211
Other temporary differences 136 153
(156) 429

127Anglo American plc Annual Report 2009
Financial statements
26. Deferred tax continuedThe current expectation regarding the maturity of deferred tax balances is:
US$ million 2009 2008
Deferred tax assets
Recoverable within 12 months 23 62
Recoverable after 12 months 265 196
288 258
Deferred tax liabilities
Payable within 12 months (171) (218)
Payable after 12 months (5,021) (4,337)
(5,192) (4,555)
The Group had the following balances in respect of which no deferred tax asset has been recognised:
US$ millionTax losses –
revenueTax losses –
capital
Other temporary
differences Total
31 December 2009
Within one year – – – –
One to five years 14 – – 14
After five years 5 – – 5
No expiry date 3,304 1,154 7 4,465
3,323 1,154 7 4,484
31 December 2008
Within one year – – – –
One to five years 43 – – 43
After five years 21 – – 21
No expiry date 2,600 1,166 5 3,771
2,664 1,166 5 3,835
The Group also has unused tax credits of $22 million (2008: $356 million) for which no deferred tax asset is recognised in the balance sheet. These tax credits have no expiry date.
No liability has been recognised in respect of temporary differences associated with investments in subsidiaries, branches and associates and interests in joint ventures, where the Group is in a position to control the timing of the reversal of the temporary differences and it is probable that such differences will not reverse in the foreseeable future. The aggregate amount of temporary differences associated with investments in subsidiaries, branches and associates and interests in joint ventures, for which a deferred tax liability has not been recognised is $16,843 million (2008: $23,866 million). The decrease from the previous year is primarily as a result of a change to tax legislation.
27. Retirement benefitsThe Group operates defined contribution and defined benefit pension plans for the majority of its employees. It also operates post retirement medical arrangements in southern Africa and North America.
Defined contribution plansThe defined contribution pension and medical cost represents the actual contributions payable by the Group to the various plans. At 31 December 2009 there were no material outstanding or prepaid contributions and so no accrual or prepayment has been disclosed in the balance sheet in relation to these plans.
The assets of the defined contribution plans are held separately in independently administered funds. The charge in respect of these plans is calculated on the basis of the contribution payable by the Group in the financial year. The charge for the year for defined contribution pension schemes (net of amounts capitalised) was $172 million (2008: $134 million) and for defined contribution medical schemes (net of amounts capitalised) was $18 million (2008: $9 million).
Defined benefit pension plans and post retirement medical plansThe majority of the defined benefit pension plans are funded. The assets of these plans are held separately from those of the Group, in independently administered funds, in accordance with statutory requirements or local practice throughout the world. The unfunded pension plans are principally in South America.
The post retirement medical arrangements provide health benefits to retired employees and certain dependants. Eligibility for cover is dependent upon certain criteria. The majority of these plans are unfunded.
The Group’s provision of anti-retroviral therapy to HIV positive staff has not significantly impacted the post retirement medical plan liability.
Independent qualified actuaries carry out full valuations every three years using the projected unit method. The actuaries have updated the valuations to 31 December 2009.

Financial statements
128 Anglo American plc Annual Report 2009
Notes to the financial statementscontinued
27. Retirement benefits continuedThe Group’s plans in respect of pension and post retirement healthcare are summarised as follows:
2009 2008
US$ millionSouthern
AfricaThe
Americas Europe TotalSouthern
AfricaThe
Americas Europe Total
Assets(1)
Defined benefit pension plans in surplus 54 – – 54 32 – – 32
(1) Amounts are included in ‘Other non-current assets’.
2009 2008
US$ millionSouthern
AfricaThe
Americas Europe TotalSouthern
AfricaThe
Americas Europe Total
LiabilitiesDefined benefit pension plans in deficit – (173) (231) (404) – (132) (45) (177)Post retirement medical plans in deficit (271) (31) – (302) (204) (20) – (224)
(271) (204) (231) (706) (204) (152) (45) (401)
US$ million 2009 2008 2007 2006 2005
Defined benefit pension plans
Present value of liabilities (2,975) (2,157) (3,095) (4,256) (3,985)
Fair value of plan assets 2,731 2,073 3,148 4,160 3,539
Net (deficit)/surplus (244) (84) 53 (96) (446)
Surplus restriction (106) (61) (136) (163) (107)Net deficit after surplus restriction (350) (145) (83) (259) (553)
Actuarial gain/(loss) on plan assets(1) 184 (392) 39 308 438Actuarial (loss)/gain on plan liabilities(2) (361) 208 (48) (156) (435)
Post retirement medical plans
Present value of liabilities (322) (241) (329) (422) (650)
Fair value of plan assets 20 17 20 16 22
Net deficit (302) (224) (309) (406) (628)
Actuarial gain on plan assets(3) – 1 1 – –Actuarial (loss)/gain on plan liabilities(4) (10) 16 (29) 15 (67)
(1) Net experience gains on pension plan assets were $184 million (2008: loss of $392 million; 2007: gains of $32 million; 2006: gains of $314 million).
(2) Net experience losses on pension plan liabilities were $17 million (2008: $29 million; 2007: $112 million; 2006: $113 million).
(3) Net experience gains on medical plan assets were nil (2008: $1 million; 2007: losses of $1 million; 2006: losses of $1 million).
(4) Net experience losses on medical plan liabilities were $3 million (2008: $7 million; 2007: $4 million; 2006: gains of $36 million).
(5) Includes actuarial gains of $11 million due to a change in modelling methodology.
Cumulative net actuarial losses recognised in the Consolidated statement of comprehensive income are $509 million (2008: $292 million; 2007: $163 million; 2006: $126 million; 2005: $228 million).
The market value of assets was used to determine the funding level of the plans. The market value of the assets of the funded plans was sufficient to cover 97% (2008: 101%) of the benefits that had accrued to members after allowing for expected increases in future earnings and pensions. Companies within the Group are paying contributions as required in accordance with local actuarial advice. As the majority of the defined benefit pension plans are closed to new members, it is expected that contributions (in local currency) will increase as the members age.
(5)
The actual return on plan assets in respect of defined benefit pension schemes was a gain of $340 million (2008: loss of $178 million).
Income statementThe amounts recognised in the income statement are as follows:
2009 2008
US$ millionPension
plans
Post retire-ment
medical plans
Total plans
Pension plans
Post retire-ment
medical plans
Total plans
Analysis of the amountcharged to operating profit
Current service costs 32 4 36 43 5 48
Past service costs – – – 1 – 1
Total within operating costs 32 4 36 44 5 49Analysis of the amount charged to net finance costs
Expected return on plan assets(1) (156) (1) (157) (214) (1) (215)
Interest costs on plan liabilities(2) 156 18 174 180 21 201Net charge/(credit) to net finance costs – 17 17 (34) 20 (14)Total charge to the income statement 32 21 53 10 25 35
(1) Included in ‘Investment income’.(2) Included in ‘Interest expense’.
Actuarial assumptionsThe principal assumptions used to determine the actuarial present value of benefit obligations and pension charges and credits under IAS 19 Employee Benefits are detailed below (shown as weighted averages):
2009 2008
%Southern
AfricaThe
Americas EuropeSouthern
AfricaThe
Americas Europe
Defined benefit pension plansAverage discount rate for plan liabilities 9.0 8.5 5.7 7.3 8.6 6.0
Average rate of inflation 5.8 3.7 3.7 4.0 3.7 2.7Average rate of increase in salaries 7.0 6.1 3.7 5.3 5.4 2.7Average rate of increase of pensions in payment 5.8 3.1 3.7 4.0 3.2 2.8Average long term rate of return on plan assets(1) 9.6 10.5 6.6 7.6 11.3 5.9
Post retirement medical plansAverage discount rate for plan liabilities 9.0 6.6 n/a 7.3 7.1 n/a
Average rate of inflation 5.8 1.1 n/a 4.0 0.5 n/aExpected average increase in healthcare costs 7.2 4.1 n/a 5.4 3.8 n/a
(1) The long term expected return on plan assets has been set with reference to current market yields on government and corporate bonds and expected equity bond-outperformance in the relevant jurisdictions. The expected return on cash assets has been set with reference to expected bank base rates. The overall long term expected rate of return for each class is weighted by the asset allocation to the class at the balance sheet date.
Mortality assumptions are determined based on standard mortality tables with adjustments, as appropriate, to reflect experience of conditions locally. In southern Africa, the PA90 tables (2008: the PA90 tables) are used. The main schemes in Europe use the SAPS and PXA00 tables (2008: PXA00 tables). The main schemes in the Americas use the RV2004, AT2000 and UP94 tables (2008: RV2004, AT83 and UP24 tables). The mortality tables used imply that a male or female aged 60 at the balance sheet date has the following future life expectancy:
Male Female
Years 2009 2008 2009 2008
Southern Africa 20.5 20.5 25.4 25.5
The Americas 23.2 22.4 26.9 26.5
Europe 27.3 25.7 29.9 28.1
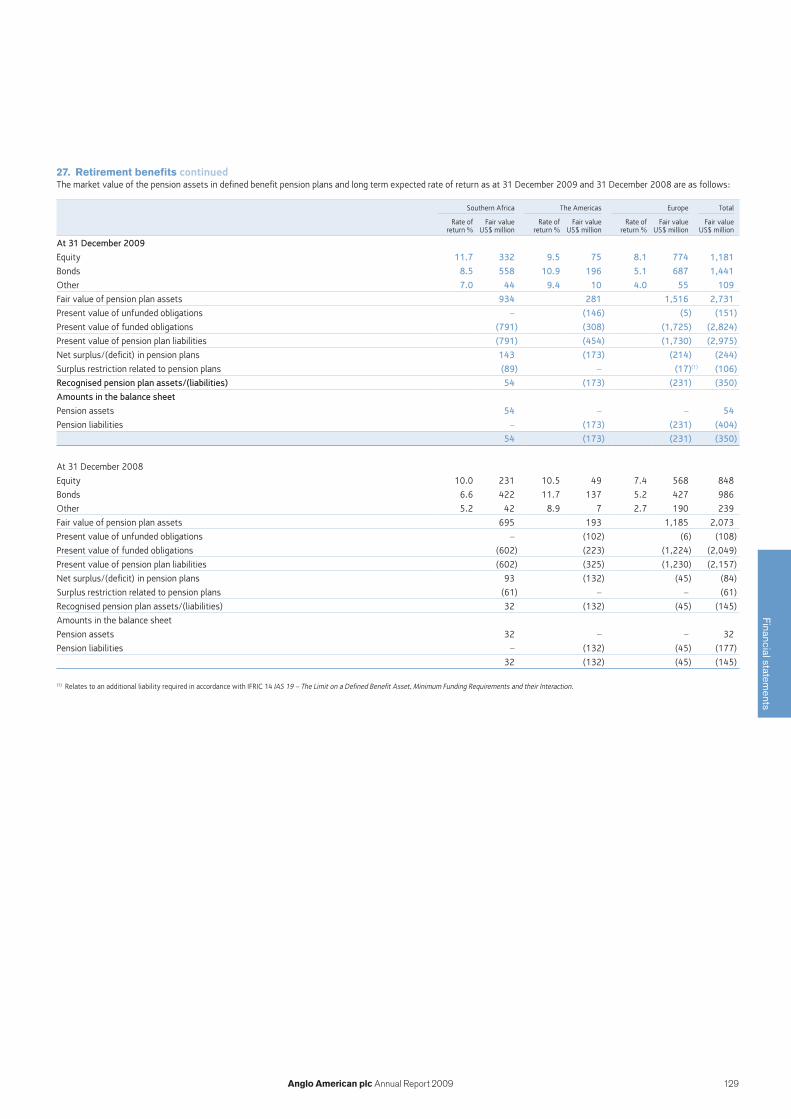
129Anglo American plc Annual Report 2009
Financial statements
27. Retirement benefits continuedThe market value of the pension assets in defined benefit pension plans and long term expected rate of return as at 31 December 2009 and 31 December 2008 are as follows:
Southern Africa The Americas Europe Total
Rate of return %
Fair value US$ million
Rate of return %
Fair value US$ million
Rate of return %
Fair value US$ million
Fair value US$ million
At 31 December 2009
Equity 11.7 332 9.5 75 8.1 774 1,181
Bonds 8.5 558 10.9 196 5.1 687 1,441
Other 7.0 44 9.4 10 4.0 55 109
Fair value of pension plan assets 934 281 1,516 2,731
Present value of unfunded obligations – (146) (5) (151)
Present value of funded obligations (791) (308) (1,725) (2,824)
Present value of pension plan liabilities (791) (454) (1,730) (2,975)
Net surplus/(deficit) in pension plans 143 (173) (214) (244)
Surplus restriction related to pension plans (89) – (17)(1) (106)
Recognised pension plan assets/(liabilities) 54 (173) (231) (350)
Amounts in the balance sheet
Pension assets 54 – – 54
Pension liabilities – (173) (231) (404)
54 (173) (231) (350)
At 31 December 2008
Equity 10.0 231 10.5 49 7.4 568 848
Bonds 6.6 422 11.7 137 5.2 427 986
Other 5.2 42 8.9 7 2.7 190 239
Fair value of pension plan assets 695 193 1,185 2,073
Present value of unfunded obligations – (102) (6) (108)
Present value of funded obligations (602) (223) (1,224) (2,049)
Present value of pension plan liabilities (602) (325) (1,230) (2,157)
Net surplus/(deficit) in pension plans 93 (132) (45) (84)
Surplus restriction related to pension plans (61) – – (61)
Recognised pension plan assets/(liabilities) 32 (132) (45) (145)
Amounts in the balance sheet
Pension assets 32 – – 32
Pension liabilities – (132) (45) (177)
32 (132) (45) (145)
(1) Relates to an additional liability required in accordance with IFRIC 14 IAS 19 – The Limit on a Defined Benefit Asset, Minimum Funding Requirements and their Interaction.

Financial statements
130 Anglo American plc Annual Report 2009
Notes to the financial statementscontinued
28. Called-up share capital and share-based paymentsCalled-up share capital
2009 2008 2007
Number of shares US$ million Number of shares US$ million Number of shares US$ million
Authorised:
5% cumulative preference shares of £1 each 50,000 – 50,000 – 50,000 –
Ordinary shares of 5486/91 US cents each 1,820,000,000 1,000 1,820,000,000 1,000 1,820,000,000 1,000
1,000 1,000 1,000
Called-up, allotted and fully paid:
5% cumulative preference shares of £1 each 50,000 – 50,000 – 50,000 –
Ordinary shares of 5486/91 US cents each:
At 1 January 1,342,919,020 738 1,342,911,897 738
Other 8,118 – 7,123 –
At 31 December 1,342,927,138 738 1,342,919,020 738 1,342,911,897 738
27. Retirement benefits continuedMovement analysisThe changes in the present value of defined benefit obligations are as follows:
2009 2008
US$ millionPension
plans
Post retire-ment
medical plans
Total plans
Pension plans
Post retire-ment
medical plans
Total plans
At 1 January (2,157) (241) (2,398) (3,095) (329) (3,424)
Current service costs (32) (4) (36) (43) (5) (48)Past service costs and effects of settlements and curtailments – – – (1) – (1)
Interest costs (156) (18) (174) (180) (21) (201)
Actuarial (losses)/gains (361) (10) (371) 208 16 224
Benefits paid 135 16 151 145 16 161Contributions paid by other members (7) (3) (10) (9) (3) (12)Transfer to liabilities directly associated with assets held for sale (1) – (1) – – –
Currency movements (396) (62) (458) 818 85 903
At 31 December (2,975) (322) (3,297) (2,157) (241) (2,398)
The changes in the fair value of plan assets are as follows:
2009 2008
US$ millionPension
plans
Post retire-ment
medical plans
Total plans
Pension plans
Post retire-ment
medical plans
Total plans
At 1 January 2,073 17 2,090 3,148 20 3,168
Expected return 156 1 157 214 1 215
Actuarial gains/(losses) 184 – 184 (392) 1 (391)
Contributions paid by employer 62 13 75 50 11 61Contributions paid by other members 7 3 10 9 5 14
Benefits paid (135) (16) (151) (145) (16) (161)
Currency movements 384 2 386 (811) (5) (816)
At 31 December 2,731 20 2,751 2,073 17 2,090
Assumed healthcare trend rates have a significant effect on the amounts recognised in the income statement. A 1% change in assumed healthcare cost trend rates would have the following effects:
1% increase 1% decrease
US$ million 2009 2008 2009 2008
Effect on the sum of service costs and interest costs 4 3 (3) (3)
Effect on defined benefit obligations 36 28 (30) (26)
The Group expects to contribute approximately $58 million to its defined benefit pension plans and $30 million to its post retirement medical plans in 2010.

131Anglo American plc Annual Report 2009
Financial statements
28. Called-up share capital and share-based payments continuedDuring 2009 8,118 ordinary shares of 5486/91 US cents each were allotted to certain non-executive directors by subscription of their after tax directors’ fees (2008: 7,123 ordinary shares).
In 2009 no ordinary shares were purchased by the Company and held in treasury (2008: 5,649,992 ordinary shares). Excluding shares held in treasury (but including the shares held by the Group in other structures, as outlined in the Tenon and Employee benefit trust sections below) the number of called-up, allotted and fully paid ordinary shares as at 31 December 2009 was 1,316,493,628; $723 million (2008: 1,316,485,510; $723 million).
At 31 December 2009 the Company held 26,433,510 ordinary shares of 5486/91 US cents in treasury (2008: 26,433,510 ordinary shares).
At general meetings, every member who is present in person has one vote on a show of hands and, on a poll, every member who is present in person or by proxy has one vote for every ordinary share held.
In the event of winding up, the holders of the cumulative preference shares will be entitled to the repayment of a sum equal to the nominal capital paid up, or credited as paid up, on the cumulative preference shares held by them and any accrued dividend, whether such dividend has been earned or declared or not, calculated up to the date of the winding up.
No ordinary shares were allotted on exercise of employee share option plans (2008: nil).
TenonTenon Investment Holdings (Pty) Limited (Tenon), a wholly owned subsidiary of Anglo American South Africa Limited (AASA), has entered into agreements with Epoch Investment Holdings Limited (Epoch), Epoch Two Investment Holdings Limited (Epoch Two) and Tarl Investments Holdings Limited (Tarl) (collectively the Investment Companies), each owned by independent charitable trusts whose trustees are independent of the Group. Under the terms of these agreements, the Investment Companies have purchased Anglo American plc shares on the market and have granted to Tenon the right to nominate a third party (which may include Anglo American plc but not any of its subsidiaries) to take transfer of the Anglo American plc shares each has purchased on the market. Tenon paid the Investment Companies 80% of the cost of the Anglo American plc shares including associated costs for this right to nominate which together with subscriptions by Tenon for non-voting participating redeemable preference shares in the Investment Companies provided all the funding required to acquire the Anglo American plc shares through the market. These payments by Tenon were sourced from the cash resources of AASA. Tenon is able to exercise its right of nomination at any time up to 31 December 2025 against payment of an average amount of $7.35 per share to Epoch, $11.44 per share to Epoch Two and $9.49 per share to Tarl which will be equal to 20% of the total costs respectively incurred by Epoch, Epoch Two and Tarl in purchasing shares nominated for transfer to the third party. These funds will then become available for redemption of the preference shares issued by the Investment Companies. The amount payable by the third party on receipt of the Anglo American plc shares will accrue to Tenon and, in accordance with paragraph 33 of IAS 32, any resulting gain or loss recorded by Tenon will not be recognised in the income statement of Anglo American plc.
Under the agreements, the Investment Companies will receive dividends on the shares they hold and have agreed to waive the right to vote those shares. The preference shares issued to the charitable trusts are entitled to a participating right of up to 10% of the profit after tax of Epoch and 5% of the profit after tax of Epoch Two and Tarl. The preference shares issued to Tenon will carry a fixed coupon of 3% plus a participating right of up to 80% of the profit after tax of Epoch and 85% of the profit after tax of Epoch Two and Tarl. Any remaining distributable earnings in the Investment Companies, after the above dividends, are then available for distribution as ordinary dividends to the charitable trusts.
The structure effectively provides Tenon with a beneficial interest in the price risk on these shares together with a participation in future dividend receipts. The Investment Companies will retain legal title to the shares until Tenon exercises its right to nominate a transferee.
At 31 December 2009 the Investment Companies together held 112,300,129 (2008: 112,300,129) Anglo American plc shares with a market value of $4,915 million (2008: $2,511 million) which represented 9% (2008: 9%) of the ordinary shares in issue (excluding treasury shares). The Investment Companies are not permitted to hold more than an aggregate of 10% of the issued share capital of Anglo American plc at any one time.
Although the Group has no voting rights in the Investment Companies and cannot appoint or remove trustees of the charitable trusts, the Investment Companies meet the accounting definition of a subsidiary in accordance with IAS 27 Consolidated and Separate Financial Statements. As a result, the Investment Companies are consolidated in accordance with the definitions of IAS 27 and the principles set out in SIC 12 Consolidation – Special Purpose Entities.
Employee benefit trustThe provision of shares to certain of the Company’s share option and share incentive schemes is facilitated by an employee benefit trust. During 2009 3,496,000 shares (2008: 5,248,591 shares) were sold to employees on exercise of their options, and provisional allocations were made to options already awarded. The cost of shares purchased by the trust is presented against retained earnings. The employee benefit trust has waived the right to receive dividends on these shares.
The market value of the 949,244 shares (2008: 4,445,244 shares) held by the trust at 31 December 2009 was $44 million (2008: $99 million).
The costs of operating the trust are borne by the Group but are not material.
Share-based paymentsDuring the year ended 31 December 2009, the Group had six share-based payment arrangements with employees, the details of which are described in the Remuneration report. All of the Group’s schemes are equity settled, either by award of options to acquire ordinary shares (ESOS, SAYE and former AAC Executive Share Incentive Scheme) or award of ordinary shares (BSP, LTIP and SIP). The ESOS and former AAC Executive Share Incentive Scheme are now closed to new participants, having been replaced with the BSP.
The total share-based payment charge relating to Anglo American plc shares for the year was made up as follows:
US$ million 2009 2008
BSP 57 50
LTIP 50 53
Other schemes 19 9
126 112
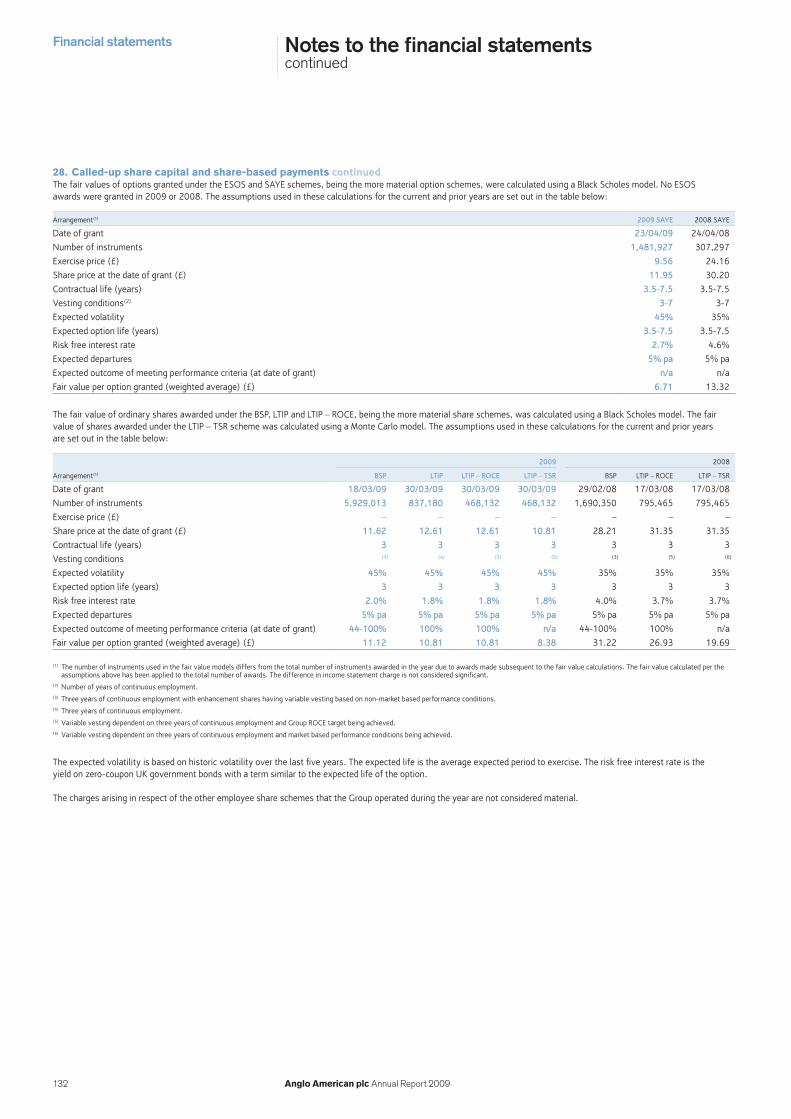
Financial statements
132 Anglo American plc Annual Report 2009
Notes to the financial statementscontinued
28. Called-up share capital and share-based payments continuedThe fair values of options granted under the ESOS and SAYE schemes, being the more material option schemes, were calculated using a Black Scholes model. No ESOS awards were granted in 2009 or 2008. The assumptions used in these calculations for the current and prior years are set out in the table below:
Arrangement(1) 2009 SAYE 2008 SAYE
Date of grant 23/04/09 24/04/08
Number of instruments 1,481,927 307,297
Exercise price (£) 9.56 24.16
Share price at the date of grant (£) 11.95 30.20
Contractual life (years) 3.5-7.5 3.5-7.5
Vesting conditions(2) 3-7 3-7
Expected volatility 45% 35%
Expected option life (years) 3.5-7.5 3.5-7.5
Risk free interest rate 2.7% 4.6%
Expected departures 5% pa 5% pa
Expected outcome of meeting performance criteria (at date of grant) n/a n/a
Fair value per option granted (weighted average) (£) 6.71 13.32
The fair value of ordinary shares awarded under the BSP, LTIP and LTIP – ROCE, being the more material share schemes, was calculated using a Black Scholes model. The fair value of shares awarded under the LTIP – TSR scheme was calculated using a Monte Carlo model. The assumptions used in these calculations for the current and prior years are set out in the table below:
2009 2008
Arrangement(1) BSP LTIP LTIP – ROCE LTIP – TSR BSP LTIP – ROCE LTIP – TSR
Date of grant 18/03/09 30/03/09 30/03/09 30/03/09 29/02/08 17/03/08 17/03/08
Number of instruments 5,929,013 837,180 468,132 468,132 1,690,350 795,465 795,465
Exercise price (£) – – – – – – –
Share price at the date of grant (£) 11.62 12.61 12.61 10.81 28.21 31.35 31.35
Contractual life (years) 3 3 3 3 3 3 3
Vesting conditions (3) (4) (5) (6) (3) (5) (6)
Expected volatility 45% 45% 45% 45% 35% 35% 35%
Expected option life (years) 3 3 3 3 3 3 3
Risk free interest rate 2.0% 1.8% 1.8% 1.8% 4.0% 3.7% 3.7%
Expected departures 5% pa 5% pa 5% pa 5% pa 5% pa 5% pa 5% pa
Expected outcome of meeting performance criteria (at date of grant) 44-100% 100% 100% n/a 44-100% 100% n/a
Fair value per option granted (weighted average) (£) 11.12 10.81 10.81 8.38 31.22 26.93 19.69
(1) The number of instruments used in the fair value models differs from the total number of instruments awarded in the year due to awards made subsequent to the fair value calculations. The fair value calculated per the assumptions above has been applied to the total number of awards. The difference in income statement charge is not considered significant.
(2) Number of years of continuous employment.(3) Three years of continuous employment with enhancement shares having variable vesting based on non-market based performance conditions.(4) Three years of continuous employment.(5) Variable vesting dependent on three years of continuous employment and Group ROCE target being achieved.(6) Variable vesting dependent on three years of continuous employment and market based performance conditions being achieved.
The expected volatility is based on historic volatility over the last five years. The expected life is the average expected period to exercise. The risk free interest rate is the yield on zero-coupon UK government bonds with a term similar to the expected life of the option.
The charges arising in respect of the other employee share schemes that the Group operated during the year are not considered material.

133Anglo American plc Annual Report 2009
Financial statements
28. Called-up share capital and share-based payments continuedA reconciliation of option movements for the more significant share-based payment arrangements over the year to 31 December 2009 and the prior year is shown below. All options outstanding at 31 December 2009 with an exercise date on or prior to 31 December 2009 are deemed exercisable. Options were exercised regularly during the year and the weighted average share price for the year ended 31 December 2009 was £19.45 (2008: £25.99).
Executive Share Option Scheme(1)
Options to acquire ordinary shares of 5486/91 US cents were outstanding under the terms of this scheme as follows:
At 31 December 2009
Year of grant Date exercisableOption price per share £
Options outstanding 1 Jan 2009
Options granted in year
Options exercised
in year
Options forfeited
in year
Options expired in year
Options outstanding
31 Dec 2009
1999 24 June 2002 to 23 June 2009 6.98 514,333 – (514,333) – – –
1999 19 October 2002 to 18 October 2009 8.00 7,000 – (7,000) – – –
2000 23 March 2003 to 22 March 2010 7.66 716,122 – (299,888) (9,000) – 407,234
2000 12 September 2003 to 11 September 2010 10.19 3,056 – – – – 3,056
2001 2 April 2004 to 1 April 2011 10.03 879,620 – (161,312) (22,408) – 695,900
2001 13 September 2004 to 12 September 2011 8.00 23,750 – – – – 23,750
2002 18 March 2005 to 17 March 2012 11.50 943,861 – (176,520) (25,338) – 742,003
2002 13 September 2005 to 12 September 2012 8.05 7,000 – – – – 7,000
2003 5 March 2006 to 4 March 2013 9.28 1,763,011 – (332,431) (64,258) – 1,366,322
2003 13 August 2006 to 12 August 2013 11.41 22,500 – (12,500) (10,000) – –
2004 1 March 2007 to 28 February 2014 13.43 1,927,167 – (319,961) (170,041) – 1,437,165
2004 10 August 2007 to 9 August 2014 11.52 57,309 – (23,500) – – 33,809
2004 29 November 2007 to 28 November 2014 12.73 8,791 – (8,791) – – –
2005 6 January 2008 to 4 January 2015 12.12 37,579 – – – – 37,579
2005 1 August 2008 to 31 July 2015 14.40 18,000 – – – – 18,000
2005 19 August 2008 to 18 August 2015 13.94 2,750 – – – – 2,750
6,931,849 – (1,856,236) (301,045) – 4,774,568
At 31 December 2008
Year of grant Date exercisableOption price per share £
Options outstanding 1 Jan 2008
Options granted in year
Options exercised
in year
Options forfeited
in year
Options expired in year
Options outstanding
31 Dec 2008
1999 24 June 2002 to 23 June 2009 6.98 772,256 – (247,973) (9,950) – 514,333
1999 19 October 2002 to 18 October 2009 8.00 29,000 – – (22,000) – 7,000
2000 23 March 2003 to 22 March 2010 7.66 1,056,732 – (267,610) (73,000) – 716,122
2000 12 September 2003 to 11 September 2010 10.19 15,000 – (8,944) (3,000) – 3,056
2001 2 April 2004 to 1 April 2011 10.03 1,251,064 – (211,600) (159,844) – 879,620
2001 13 September 2004 to 12 September 2011 8.00 26,750 – – (3,000) – 23,750
2002 18 March 2005 to 17 March 2012 11.50 1,298,242 – (220,781) (133,600) – 943,861
2002 13 September 2005 to 12 September 2012 8.05 11,000 – – (4,000) – 7,000
2003 5 March 2006 to 4 March 2013 9.28 2,350,685 – (417,174) (170,500) – 1,763,011
2003 13 August 2006 to 12 August 2013 11.41 32,937 – (9,437) (1,000) – 22,500
2004 1 March 2007 to 28 February 2014 13.43 2,641,345 – (540,912) (173,266) – 1,927,167
2004 10 August 2007 to 9 August 2014 11.52 84,373 – (23,064) (4,000) – 57,309
2004 29 November 2007 to 28 November 2014 12.73 11,147 – (2,356) – – 8,791
2005 6 January 2008 to 4 January 2015 12.12 37,579 – – – – 37,579
2005 1 August 2008 to 31 July 2015 14.40 18,000 – – – – 18,000
2005 19 August 2008 to 18 August 2015 13.94 5,500 – (2,750) – – 2,750
9,641,610 – (1,952,601) (757,160) – 6,931,849
See page 136 for footnote.

Financial statements
134 Anglo American plc Annual Report 2009
Notes to the financial statementscontinued
28. Called-up share capital and share-based payments continuedSAYE Share Option Scheme(1)
Options to acquire ordinary shares of 5486/91 US cents were outstanding under the terms of this scheme as follows:
At 31 December 2009
Year of grant Date exercisableOption price per share £
Options outstanding 1 Jan 2009
Options granted in year
Options exercised
in year
Options forfeited
in year
Options expired in year
Options outstanding
31 Dec 2009
2001 1 July 2008 to 31 December 2008 8.45 870 – – (870) – –
2002 1 September 2009 to 28 February 2010 9.23 24,349 – (19,892) (2,278) – 2,179
2003 1 September 2008 to 28 February 2009 7.52 4,189 – (3,491) (698) – –
2003 1 September 2010 to 28 February 2011 7.52 40,908 – (3,103) (1,049) – 36,756
2004 1 September 2009 to 28 February 2010 10.81 69,295 – (65,799) (2,107) – 1,389
2004 1 September 2011 to 29 February 2012 10.81 18,129 – (3,278) (2,007) – 12,844
2005 1 September 2008 to 28 February 2009 10.15 7,733 – (3,780) (3,953) – –
2005 1 September 2010 to 28 February 2011 10.15 237,371 – (27,734) (18,425) – 191,212
2005 1 September 2012 to 28 February 2013 10.15 43,060 – (2,904) (6,390) – 33,766
2006 1 September 2009 to 28 February 2010 17.97 169,942 – (109,117) (38,521) – 22,304
2006 1 September 2011 to 29 February 2012 17.97 105,138 – (2,599) (44,935) – 57,604
2006 1 September 2013 to 28 February 2014 17.97 28,699 – (269) (10,350) – 18,080
2007 1 September 2010 to 28 February 2011 21.42 137,115 – (840) (63,691) – 72,584
2007 1 September 2012 to 28 February 2013 21.42 72,086 – (539) (34,617) – 36,930
2007 1 September 2014 to 28 February 2015 21.42 30,991 – – (13,901) – 17,090
2008 1 September 2011 to 29 February 2012 24.16 168,225 – (220) (103,169) – 64,836
2008 1 September 2013 to 28 February 2014 24.16 69,231 – (92) (42,292) – 26,847
2008 1 September 2015 to 29 February 2016 24.16 32,378 – – (19,314) – 13,064
2009 1 September 2012 to 28 February 2013 9.56 – 847,891 (235) (25,411) – 822,245
2009 1 September 2014 to 28 February 2015 9.56 – 498,808 (515) (20,543) – 477,750
2009 1 September 2016 to 28 February 2017 9.56 – 135,228 – (5,282) – 129,946
1,259,709 1,481,927 (244,407) (459,803) – 2,037,426
At 31 December 2008
Year of grant Date exercisableOption price per share £
Options outstanding 1 Jan 2008
Options granted in year
Options exercised
in year
Options forfeited
in year
Options expired in year
Options outstanding
31 Dec 2008
2000 1 July 2007 to 31 December 2007 4.85 5,528 – – (5,528) – –
2001 1 July 2008 to 31 December 2008 8.45 36,294 – (35,392) (32) – 870
2002 1 September 2007 to 29 February 2008 9.23 2,648 – (429) (2,219) – –
2002 1 September 2009 to 28 February 2010 9.23 24,738 – (333) (56) – 24,349
2003 1 September 2008 to 28 February 2009 7.52 152,728 – (147,206) (1,333) – 4,189
2003 1 September 2010 to 28 February 2011 7.52 40,908 – – – – 40,908
2004 1 September 2007 to 29 February 2008 10.81 2,506 – (2,089) (417) – –
2004 1 September 2009 to 28 February 2010 10.81 72,162 – (1,441) (1,426) – 69,295
2004 1 September 2011 to 29 February 2012 10.81 18,324 – – (195) – 18,129
2005 1 September 2008 to 28 February 2009 10.15 275,727 – (262,405) (5,589) – 7,733
2005 1 September 2010 to 28 February 2011 10.15 254,714 – (7,419) (9,924) – 237,371
2005 1 September 2012 to 28 February 2013 10.15 48,059 – (162) (4,837) – 43,060
2006 1 September 2009 to 28 February 2010 17.97 208,452 – (2,459) (36,051) – 169,942
2006 1 September 2011 to 29 February 2012 17.97 122,114 – (288) (16,688) – 105,138
2006 1 September 2013 to 28 February 2014 17.97 34,021 – (133) (5,189) – 28,699
2007 1 September 2010 to 28 February 2011 21.42 178,172 – (501) (40,556) – 137,115
2007 1 September 2012 to 28 February 2013 21.42 86,324 – (64) (14,174) – 72,086
2007 1 September 2014 to 28 February 2015 21.42 36,918 – – (5,927) – 30,991
2008 1 September 2011 to 29 February 2012 24.16 – 194,711 – (26,486) – 168,225
2008 1 September 2013 to 28 February 2014 24.16 – 76,937 – (7,706) – 69,231
2008 1 September 2015 to 29 February 2016 24.16 – 35,649 – (3,271) – 32,378
1,600,337 307,297 (460,321) (187,604) – 1,259,709
See page 136 for footnote.
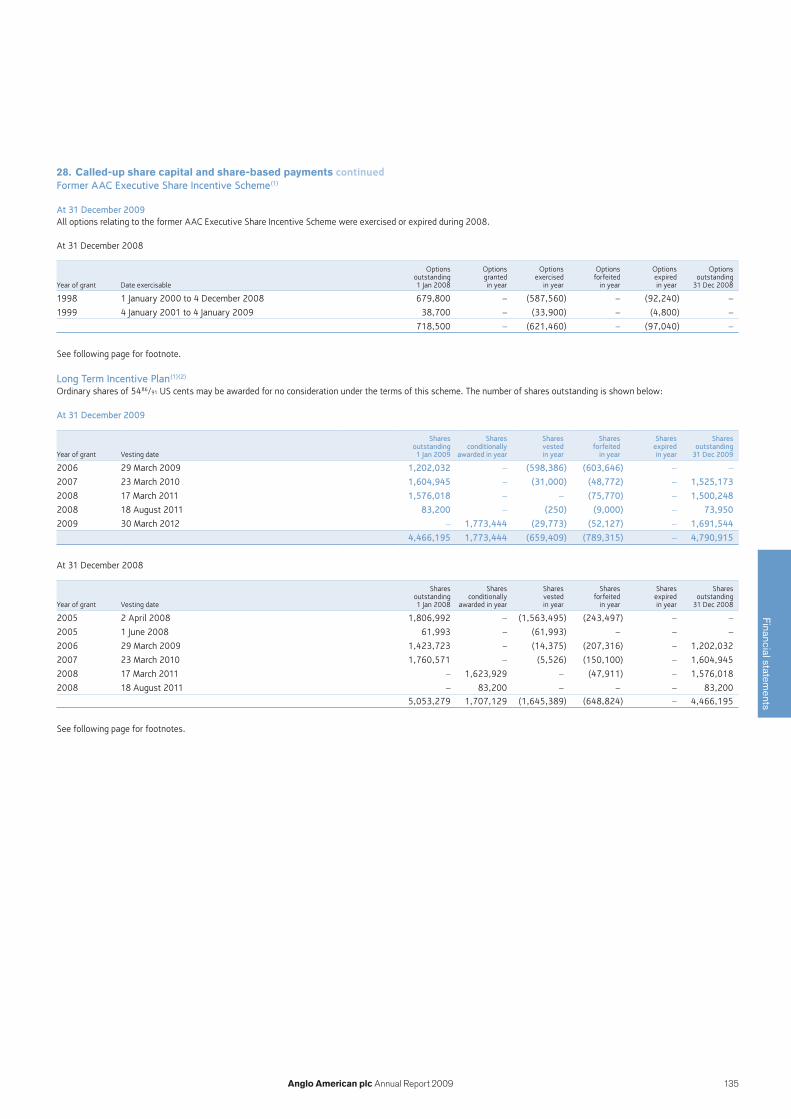
135Anglo American plc Annual Report 2009
Financial statements
28. Called-up share capital and share-based payments continuedFormer AAC Executive Share Incentive Scheme(1)
At 31 December 2009All options relating to the former AAC Executive Share Incentive Scheme were exercised or expired during 2008.
At 31 December 2008
Year of grant Date exercisable
Options outstanding 1 Jan 2008
Options granted in year
Options exercised
in year
Options forfeited
in year
Options expired in year
Options outstanding
31 Dec 2008
1998 1 January 2000 to 4 December 2008 679,800 – (587,560) – (92,240) –
1999 4 January 2001 to 4 January 2009 38,700 – (33,900) – (4,800) –
718,500 – (621,460) – (97,040) –
See following page for footnote.
Long Term Incentive Plan(1)(2)
Ordinary shares of 5486/91 US cents may be awarded for no consideration under the terms of this scheme. The number of shares outstanding is shown below:
At 31 December 2009
Year of grant Vesting date
Shares outstanding 1 Jan 2009
Shares conditionally
awarded in year
Shares vested in year
Shares forfeited
in year
Shares expired in year
Shares outstanding
31 Dec 2009
2006 29 March 2009 1,202,032 – (598,386) (603,646) – –
2007 23 March 2010 1,604,945 – (31,000) (48,772) – 1,525,173
2008 17 March 2011 1,576,018 – – (75,770) – 1,500,248
2008 18 August 2011 83,200 – (250) (9,000) – 73,950
2009 30 March 2012 – 1,773,444 (29,773) (52,127) – 1,691,544
4,466,195 1,773,444 (659,409) (789,315) – 4,790,915
At 31 December 2008
Year of grant Vesting date
Shares outstanding 1 Jan 2008
Shares conditionally
awarded in year
Shares vested in year
Shares forfeited
in year
Shares expired in year
Shares outstanding
31 Dec 2008
2005 2 April 2008 1,806,992 – (1,563,495) (243,497) – –
2005 1 June 2008 61,993 – (61,993) – – –
2006 29 March 2009 1,423,723 – (14,375) (207,316) – 1,202,032
2007 23 March 2010 1,760,571 – (5,526) (150,100) – 1,604,945
2008 17 March 2011 – 1,623,929 – (47,911) – 1,576,018
2008 18 August 2011 – 83,200 – – – 83,2005,053,279 1,707,129 (1,645,389) (648,824) – 4,466,195
See following page for footnotes.
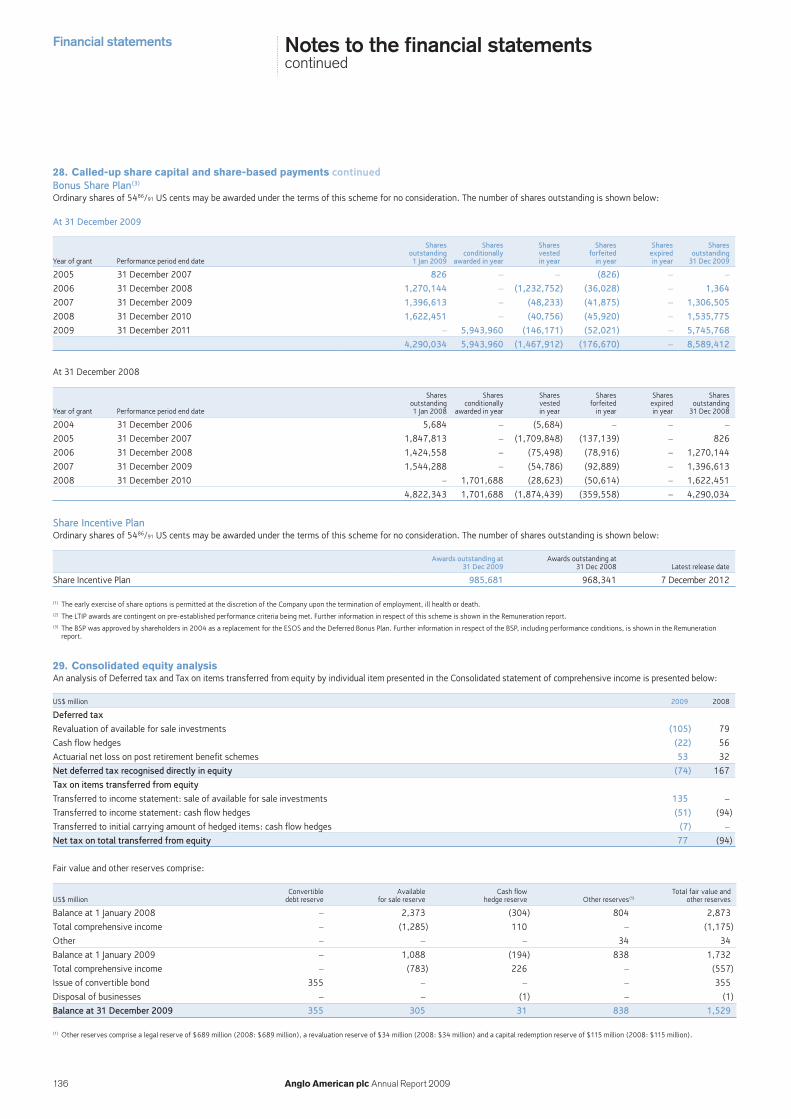
Financial statements
136 Anglo American plc Annual Report 2009
Notes to the financial statementscontinued
28. Called-up share capital and share-based payments continuedBonus Share Plan(3)
Ordinary shares of 5486/91 US cents may be awarded under the terms of this scheme for no consideration. The number of shares outstanding is shown below:
At 31 December 2009
Year of grant Performance period end date
Shares outstanding 1 Jan 2009
Shares conditionally
awarded in year
Shares vested in year
Shares forfeited
in year
Shares expired in year
Shares outstanding
31 Dec 2009
2005 31 December 2007 826 – – (826) – –
2006 31 December 2008 1,270,144 – (1,232,752) (36,028) – 1,364
2007 31 December 2009 1,396,613 – (48,233) (41,875) – 1,306,505
2008 31 December 2010 1,622,451 – (40,756) (45,920) – 1,535,775
2009 31 December 2011 – 5,943,960 (146,171) (52,021) – 5,745,768
4,290,034 5,943,960 (1,467,912) (176,670) – 8,589,412
At 31 December 2008
Year of grant Performance period end date
Shares outstanding 1 Jan 2008
Shares conditionally
awarded in year
Shares vested in year
Shares forfeited
in year
Shares expired in year
Shares outstanding
31 Dec 2008
2004 31 December 2006 5,684 – (5,684) – – –
2005 31 December 2007 1,847,813 – (1,709,848) (137,139) – 826
2006 31 December 2008 1,424,558 – (75,498) (78,916) – 1,270,144
2007 31 December 2009 1,544,288 – (54,786) (92,889) – 1,396,613
2008 31 December 2010 – 1,701,688 (28,623) (50,614) – 1,622,451
4,822,343 1,701,688 (1,874,439) (359,558) – 4,290,034
Share Incentive PlanOrdinary shares of 5486/91 US cents may be awarded under the terms of this scheme for no consideration. The number of shares outstanding is shown below:
Awards outstanding at 31 Dec 2009
Awards outstanding at 31 Dec 2008 Latest release date
Share Incentive Plan 985,681 968,341 7 December 2012
(1) The early exercise of share options is permitted at the discretion of the Company upon the termination of employment, ill health or death.(2) The LTIP awards are contingent on pre-established performance criteria being met. Further information in respect of this scheme is shown in the Remuneration report.(3) The BSP was approved by shareholders in 2004 as a replacement for the ESOS and the Deferred Bonus Plan. Further information in respect of the BSP, including performance conditions, is shown in the Remuneration
report.
29. Consolidated equity analysisAn analysis of Deferred tax and Tax on items transferred from equity by individual item presented in the Consolidated statement of comprehensive income is presented below:
US$ million 2009 2008
Deferred tax
Revaluation of available for sale investments (105) 79
Cash flow hedges (22) 56
Actuarial net loss on post retirement benefit schemes 53 32
Net deferred tax recognised directly in equity (74) 167
Tax on items transferred from equity
Transferred to income statement: sale of available for sale investments 135 –
Transferred to income statement: cash flow hedges (51) (94)
Transferred to initial carrying amount of hedged items: cash flow hedges (7) –
Net tax on total transferred from equity 77 (94)
Fair value and other reserves comprise:
US$ millionConvertible
debt reserveAvailable
for sale reserveCash flow
hedge reserve Other reserves(1)Total fair value and
other reserves
Balance at 1 January 2008 – 2,373 (304) 804 2,873
Total comprehensive income – (1,285) 110 – (1,175)
Other – – – 34 34
Balance at 1 January 2009 – 1,088 (194) 838 1,732
Total comprehensive income – (783) 226 – (557)
Issue of convertible bond 355 – – – 355
Disposal of businesses – – (1) – (1)
Balance at 31 December 2009 355 305 31 838 1,529
(1) Other reserves comprise a legal reserve of $689 million (2008: $689 million), a revaluation reserve of $34 million (2008: $34 million) and a capital redemption reserve of $115 million (2008: $115 million).
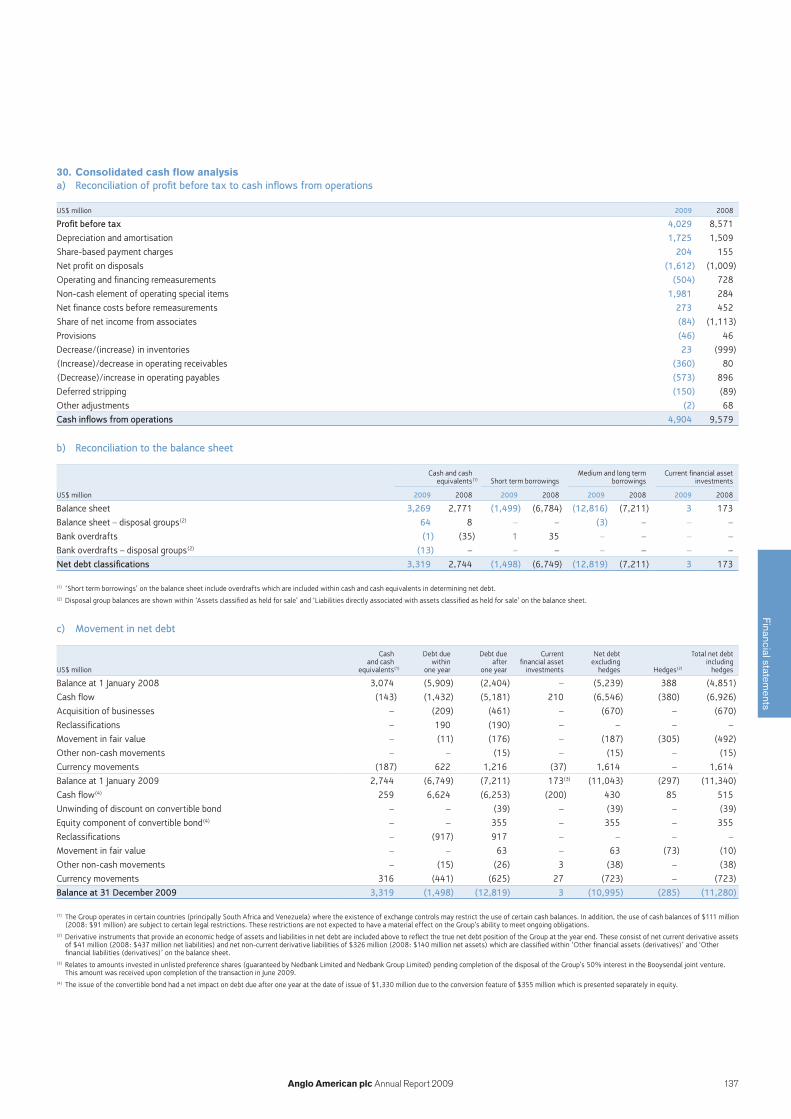
137Anglo American plc Annual Report 2009
Financial statements
30. Consolidated cash flow analysisa) Reconciliation of profit before tax to cash inflows from operations
US$ million 2009 2008
Profit before tax 4,029 8,571
Depreciation and amortisation 1,725 1,509
Share-based payment charges 204 155
Net profit on disposals (1,612) (1,009)
Operating and financing remeasurements (504) 728
Non-cash element of operating special items 1,981 284
Net finance costs before remeasurements 273 452
Share of net income from associates (84) (1,113)
Provisions (46) 46
Decrease/(increase) in inventories 23 (999)
(Increase)/decrease in operating receivables (360) 80
(Decrease)/increase in operating payables (573) 896
Deferred stripping (150) (89)
Other adjustments (2) 68
Cash inflows from operations 4,904 9,579
b) Reconciliation to the balance sheet
Cash and cash equivalents(1) Short term borrowings
Medium and long term borrowings
Current financial asset investments
US$ million 2009 2008 2009 2008 2009 2008 2009 2008
Balance sheet 3,269 2,771 (1,499) (6,784) (12,816) (7,211) 3 173
Balance sheet – disposal groups(2) 64 8 – – (3) – – –
Bank overdrafts (1) (35) 1 35 – – – –
Bank overdrafts – disposal groups(2) (13) – – – – – – –
Net debt classifications 3,319 2,744 (1,498) (6,749) (12,819) (7,211) 3 173
(1) ‘Short term borrowings’ on the balance sheet include overdrafts which are included within cash and cash equivalents in determining net debt.(2) Disposal group balances are shown within ‘Assets classified as held for sale’ and ‘Liabilities directly associated with assets classified as held for sale’ on the balance sheet.
c) Movement in net debt
US$ million
Cash and cash
equivalents(1)
Debt due within
one year
Debt due after
one year
Current financial asset investments
Net debt excluding
hedges Hedges(2)
Total net debt including
hedges
Balance at 1 January 2008 3,074 (5,909) (2,404) – (5,239) 388 (4,851)
Cash flow (143) (1,432) (5,181) 210 (6,546) (380) (6,926)
Acquisition of businesses – (209) (461) – (670) – (670)
Reclassifications – 190 (190) – – – –
Movement in fair value – (11) (176) – (187) (305) (492)
Other non-cash movements – – (15) – (15) – (15)
Currency movements (187) 622 1,216 (37) 1,614 – 1,614
Balance at 1 January 2009 2,744 (6,749) (7,211) 173 (11,043) (297) (11,340)
Cash flow(4) 259 6,624 (6,253) (200) 430 85 515
Unwinding of discount on convertible bond – – (39) – (39) – (39)
Equity component of convertible bond(4) – – 355 – 355 – 355
Reclassifications – (917) 917 – – – –
Movement in fair value – – 63 – 63 (73) (10)
Other non-cash movements – (15) (26) 3 (38) – (38)
Currency movements 316 (441) (625) 27 (723) – (723)
Balance at 31 December 2009 3,319 (1,498) (12,819) 3 (10,995) (285) (11,280)
(1) The Group operates in certain countries (principally South Africa and Venezuela) where the existence of exchange controls may restrict the use of certain cash balances. In addition, the use of cash balances of $111 million (2008: $91 million) are subject to certain legal restrictions. These restrictions are not expected to have a material effect on the Group’s ability to meet ongoing obligations.
(2) Derivative instruments that provide an economic hedge of assets and liabilities in net debt are included above to reflect the true net debt position of the Group at the year end. These consist of net current derivative assets of $41 million (2008: $437 million net liabilities) and net non-current derivative liabilities of $326 million (2008: $140 million net assets) which are classified within ‘Other financial assets (derivatives)’ and ‘Other financial liabilities (derivatives)’ on the balance sheet.
(3) Relates to amounts invested in unlisted preference shares (guaranteed by Nedbank Limited and Nedbank Group Limited) pending completion of the disposal of the Group’s 50% interest in the Booysendal joint venture. This amount was received upon completion of the transaction in June 2009.
(4) The issue of the convertible bond had a net impact on debt due after one year at the date of issue of $1,330 million due to the conversion feature of $355 million which is presented separately in equity.
(3)
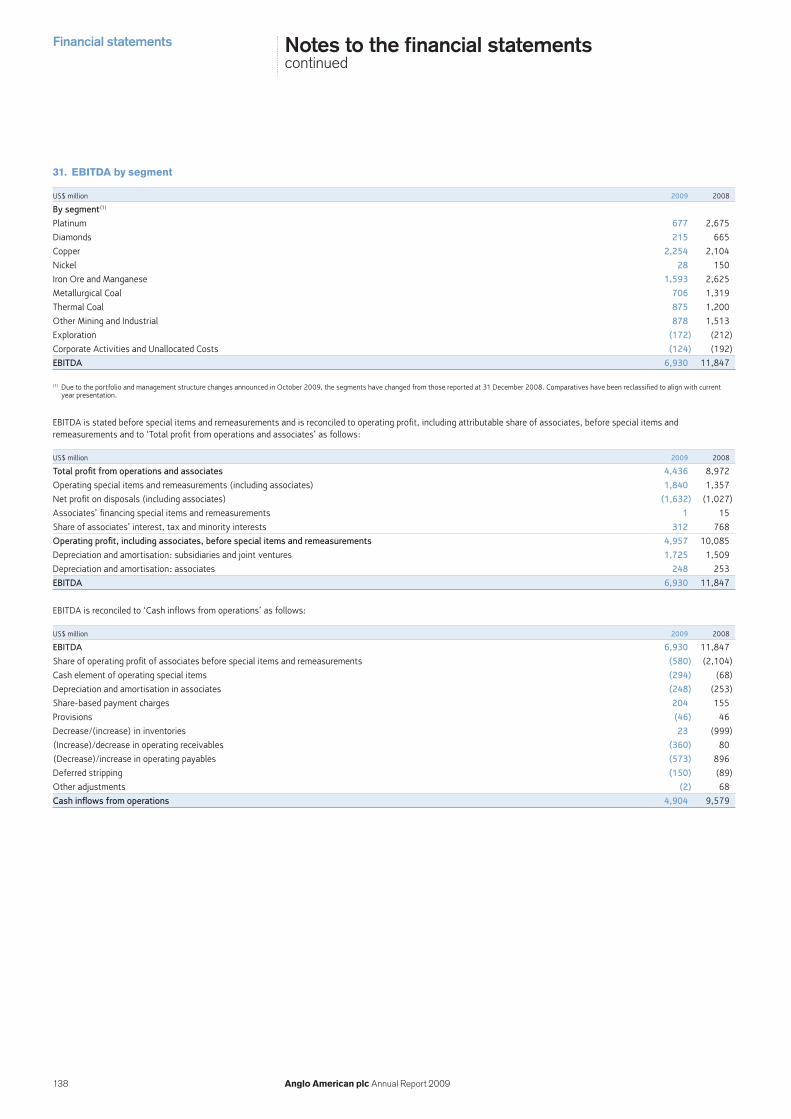
Financial statements
138 Anglo American plc Annual Report 2009
Notes to the financial statementscontinued
31. EBITDA by segment
US$ million 2009 2008
By segment(1)
Platinum 677 2,675
Diamonds 215 665
Copper 2,254 2,104
Nickel 28 150
Iron Ore and Manganese 1,593 2,625
Metallurgical Coal 706 1,319
Thermal Coal 875 1,200
Other Mining and Industrial 878 1,513
Exploration (172) (212)
Corporate Activities and Unallocated Costs (124) (192)
EBITDA 6,930 11,847
(1) Due to the portfolio and management structure changes announced in October 2009, the segments have changed from those reported at 31 December 2008. Comparatives have been reclassified to align with current year presentation.
EBITDA is stated before special items and remeasurements and is reconciled to operating profit, including attributable share of associates, before special items and remeasurements and to ‘Total profit from operations and associates’ as follows:
US$ million 2009 2008
Total profit from operations and associates 4,436 8,972
Operating special items and remeasurements (including associates) 1,840 1,357
Net profit on disposals (including associates) (1,632) (1,027)
Associates’ financing special items and remeasurements 1 15
Share of associates’ interest, tax and minority interests 312 768
Operating profit, including associates, before special items and remeasurements 4,957 10,085
Depreciation and amortisation: subsidiaries and joint ventures 1,725 1,509
Depreciation and amortisation: associates 248 253
EBITDA 6,930 11,847
EBITDA is reconciled to ‘Cash inflows from operations’ as follows:
US$ million 2009 2008
EBITDA 6,930 11,847
Share of operating profit of associates before special items and remeasurements (580) (2,104)
Cash element of operating special items (294) (68)
Depreciation and amortisation in associates (248) (253)
Share-based payment charges 204 155
Provisions (46) 46
Decrease/(increase) in inventories 23 (999)
(Increase)/decrease in operating receivables (360) 80
(Decrease)/increase in operating payables (573) 896
Deferred stripping (150) (89)
Other adjustments (2) 68
Cash inflows from operations 4,904 9,579

139Anglo American plc Annual Report 2009
Financial statements
32. AcquisitionsAcquisition of subsidiariesThe Group made no material acquisitions of subsidiaries in the year ended 31 December 2009.
In the year ended 31 December 2009 fair values shown principally include final adjustments to the fair value of assets acquired and liabilities assumed in the Anglo Ferrous Brazil SA acquisition, including the recognition of provisions in respect of certain power arrangements.
The carrying value and fair value of the net assets at the date of acquisition of a controlling interest and related net cash outflows are shown below:
2009 2008
US$ millionTotal
carrying valueTotal
fair valueTotal
fair value
Net assets acquired
Tangible assets 1 (4) 997
Other non-current assets – – 109
Current assets 2 4 457
Current liabilities (1) (8) (314)
Non-current liabilities – (11) (547)
Minority interests – – (230)
2 (19) 472
Add: Value attributable to reserves and resources acquired, net of deferred tax(1) 21 1,649
Fair value of net assets acquired 2 2,121
Goodwill arising on acquisitions 2 1,610
Total cost of acquisitions 4 3,731
Satisfied by
Net cash acquired – 255
Net cash paid(2) 4 3,476
(1) Represents the Group’s share of value (implicit in the transaction) of reserves and resources, capitalised within tangible assets.(2) Represents net cash paid to acquire a controlling interest and therefore excludes $75 million paid to acquire minority interests in existing subsidiaries (2008: $2,411 million). In the year ended 31 December 2009 this
principally related to Anglo Ferrous Brazil SA (2008: Anglo Ferrous Brazil SA and Anglo Platinum Limited). When totalled with net cash paid to acquire control, the net cash paid for acquisition of subsidiaries in the year ended 31 December 2009 is $79 million (2008: $5,887 million).
In the year ended 31 December 2008 the Group purchased 7,941,964 shares in Anglo Platinum Limited for total consideration of $1,108 million. The cash paid in the year ended 31 December 2008 was $1,113 million. At 31 December 2009 the Group’s shareholding in Anglo Platinum Limited was 79.7% (2008: 79.6%). The increase in the Group’s shareholding since 31 December 2008 is due to treasury shares purchased by Anglo Platinum Limited in the year.
On 5 August 2008 the Group acquired a 63.3% shareholding in Anglo Ferrous Brazil SA, which holds a 51% interest in the Minas Rio iron ore project (Minas Rio) and a 70% interest in Amapá at a price of R$28.147 ($18.056) per share. At that time the Group committed to extend the offer to the minority shareholders of Anglo Ferrous Brazil SA. This offer was formally made on 31 October 2008 and remained open through the first quarter of 2009, resulting in a Group shareholding in Anglo Ferrous Brazil SA at 31 December 2009 of 100% (2008: 98.9%). Total cash paid to acquire a controlling interest was $3.5 billion and a further $2.0 billion (including cash settlement of a related derivative instrument ($0.7 billion)) was paid to acquire minority interests. In the year ended 31 December 2009 $49 million was paid to acquire remaining minority interests. These transactions followed on from the acquisition in 2007 of a 49% interest in each of Minas Rio and LLX Minas Rio, which owns the port of Açu. As a result of these transactions the Group’s effective shareholding in each of the operating entities at 31 December 2009 was 100% in Minas Rio, 49% in LLX Minas Rio and 70% in Amapá (2008: 99.4% in Minas Rio, 49% in LLX Minas Rio and 69.2% in Amapá).

Financial statements
140 Anglo American plc Annual Report 2009
Notes to the financial statementscontinued
Disposals of subsidiaries and businesses in the year ended 31 December 2009The disposals of Lebowa and Booysendal were the only material disposals of a subsidiary or a joint venture in the year. The only material disposals of associates in the year related to the sale of the Group’s remaining investments in Tongaat Hulett and Hulamin, which generated a combined net cash inflow of $662 million (net of transaction costs).
Lebowa and BooysendalDuring the year ended 31 December 2009 the Group disposed of a 50% interest in the Booysendal joint venture and a 51% interest in Lebowa (and certain other joint venture projects). The disposal of Booysendal to Mvela took place on 24 June 2009. Total consideration was $275 million (excluding transaction and deal facilitation costs), of which $270 million was received in advance in the prior year (invested in unlisted preference shares and an escrow account). Upon completion of the transaction the preference shares were sold whilst $72 million remains in an escrow account pending completion of documentation. The disposal of Lebowa to Anooraq was completed on 30 June 2009 for total consideration of $363 million (excluding transaction and deal facilitation costs). The fair value of the consideration was $247 million (excluding transaction and deal facilitation costs). The Group commenced equity accounting its remaining 49% interest in Lebowa from 30 June 2009. At 31 December 2009 the Group held a 49% interest in Lebowa. These transactions were part of previously announced black economic empowerment deals.
The net asset position at the dates of disposal, together with the resulting profit on disposal and related net cash inflow is shown below:
US$ million 2009
Net assets disposed
Tangible assets 336
Current assets 11
Current liabilities (24)
Non-current liabilities (64)
Group’s share of net assets immediately prior to disposal 259
Less: Retained investments in associates (125)
Net assets disposed 134
Net gain on disposals 316
Net sale proceeds 450
Proceeds received in prior year(1) (270)
Non-cash consideration(2) (212)
Costs accrued 6
Deal facilitation charges 41
Net cash and cash equivalents disposed (9)
Net cash inflow from disposals of Lebowa and Booysendal 6
(1) A portion of the proceeds was invested in unlisted preference shares when received. Following completion of the transaction these were sold and $200 million is included in the Consolidated cash flow statement within ‘Proceeds from sale of financial asset investments’.
(2) Represents ordinary shares in Anooraq and preference shares in Plateau Resources (Proprietary) Limited.
Disposals of businesses in the year ended 31 December 2008In the year ended 31 December 2008 Namakwa Sands was the only material disposal of a business. On 1 October 2008 Namakwa Sands was sold to Exxaro Resources Limited for consideration of $330 million including deferred consideration. On 3 November 2008 as part of the same transaction, the Group completed the sale of a 26% interest in both the Black Mountain zinc, lead and copper operation and the Gamsberg zinc project for consideration of $23 million. For further details of the disposal of Namakwa Sands refer to the Group’s financial statements for the year ended 31 December 2008.
32. Acquisitions continuedAcquisition of material joint venturesThe Group made no material acquisitions of joint ventures in the year ended 31 December 2009 (2008: one).
The fair value of the net assets acquired and related net cash outflow for the prior year are shown below: US$ million 2008(1)
Net assets acquired
Tangible assets
Value attributable to reserves and resources acquired 835
Other tangible assets 108
Current assets 41
Current liabilities (37)
Non-current liabilities (97)
Fair value of net assets acquired and total cost of acquisitions 850
Satisfied by
Net cash acquired 1
Deferred consideration 242
Net cash paid(2) 607
(1) Relates to the acquisition of Foxleigh and fair value adjustments on the acquisition of a 49% interest in Minas Rio (which took place in 2007). During 2008 further consideration of $284 million (which is contingent on certain criteria being met) was recognised in respect of the acquisition of the 49% interest in Minas Rio. This was reduced from the $600 million recognised in the six months ended 30 June 2008, as a result of a change in the assumptions with regards to payment and purchase of an additional interest in Minas Rio together with an adjustment to the net deferred tax liability recognised to reflect the future tax benefit from cash payments made on acquisition. These adjustments resulted in amendments to the ‘Value attributable to reserves and resources acquired’ and deferred tax in the acquisition balance sheet.
(2) In the year ended 31 December 2009 there was net cash paid of $5 million (2008: $2 million) for other joint venture acquisitions. This resulted in total net cash paid for investments in joint ventures in the year ended 31 December 2009 of $5 million (2008: $609 million).
On 29 February 2008 Metallurgical Coal completed the acquisition of a 70% interest in the Foxleigh joint venture in Queensland, Australia. The total cost of acquisition was $606 million. The Group has proportionately consolidated 70% of Foxleigh from 29 February 2008.
33. Disposals of subsidiaries and businesses
US$ million 2009 2008
Net assets disposed
Tangible assets 425 479
Other non-current assets 2 43
Current assets 48 210
Current liabilities (34) (83)
Non-current liabilities (65) (113)
Net assets 376 536
Minority interests (3) (116)
Group’s share of net assets immediately prior to disposal 373 420
Less: Retained investments in associates (235) –
Net assets disposed 138 420
Cumulative translation differences recycled from reserves – (2)
Net gain on disposals 316 119
Net sale proceeds 454 537
Proceeds received in prior year (270) –
Non-cash consideration (212) –
Costs accrued 6 4
Deal facilitation charges 41 –
Deferred consideration – (56)
Net cash and cash equivalents disposed (10) (4)
Proceeds not yet received (4) –
Realised foreign exchange – (13)
Net cash inflow from disposals 5 468
(1) Includes net assets of $79 million no longer consolidated following loss of control of a subsidiary.(2) Net cash of $64 million has been received in the year ended 31 December 2009 in respect of deferred
consideration for disposals in 2008. This resulted in a total net cash inflow of $69 million from disposals of subsidiaries and businesses in the year ended 31 December 2009.
(1)
(2)

141Anglo American plc Annual Report 2009
Financial statements
34. Disposal groups and non-current assets held for salePlatinum disposal groups (including Booysendal and Lebowa), which were previously classified as held for sale at 31 December 2008, were disposed of in June 2009. Refer to note 33 for more details on the Platinum disposals.
The following assets and liabilities relating to disposal groups were classified as held for sale. The Group expects to complete the sale of these businesses within 12 months of the year end.
2009 2008
US$ million
Tarmac disposal groups(1) Total(2)
Intangible assets 13 –
Tangible assets 422 257
Deferred tax assets 5 –
Other non-current assets 2 2
Total non-current assets 442 259
Inventories 42 –
Trade and other receivables 72 8
Cash and cash equivalents 64 8
Total current assets 178 16
Total assets 620 275
Trade and other payables (66) (21)
Short term borrowings (13) –
Short term provisions (4) –
Total current liabilities (83) (21)
Medium and long term borrowings (3) –
Retirement benefit obligations (1) –
Deferred tax liabilities (46) (56)
Provisions for liabilities and charges (55) (3)
Other non-current liabilities (3) –
Total non-current liabilities (108) (59)
Total liabilities (191) (80)
Net assets 429 195
(1) Tarmac disposal groups relate to certain of its European businesses. Tarmac is included in the Other Mining and Industrial segment.
(2) Relates to Platinum disposal groups.
The net carrying amount of assets and associated liabilities classified as held for sale during 2009 was written down by $46 million (2008: nil).
35. Capital commitments
US$ million 2009 2008
Contracted but not provided 2,877 3,465
36. Contingent liabilities and contingent assets(i) Contingent liabilitiesThe Group is subject to various claims which arise in the ordinary course of business. Additionally, and as set out in the 2007 demerger agreement, Anglo American and Mondi have agreed to indemnify each other, subject to certain limitations, against certain liabilities. Having taken appropriate legal advice, the Group believes that the likelihood of a material liability arising is remote. At 31 December 2009 contingent liabilities in respect of the Group’s subsidiaries comprise aggregate amounts of $704 million (2008: $548 million) in respect of loans and performance guarantees given to banks and other third parties and are primarily in respect of environmental restoration and decommissioning obligations. For information relating to contingent liabilities in respect of associates and joint ventures refer to notes 16 and 17 respectively.
No contingent liabilities were secured on the assets of the Group at 31 December 2009 or 31 December 2008.
(ii) Contingent assetsThere were no significant contingent assets in the Group at 31 December 2009 or 31 December 2008.
(iii) OtherAnglo American SurAnglo American inherited a 1978 agreement with Codelco, the Chilean state mining company, when it acquired Disputada de Las Condes (since renamed Anglo American Sur) in 2002. The agreement grants Codelco the right, subject to certain conditions and limitations, to acquire up to a 49% minority interest in Anglo American Sur, the wholly owned Group company that owns the Los Bronces and El Soldado copper mines and the Chagres smelter. These conditions include limiting the window for exercising the right to once every three years in the month of January until January 2027. The right was not exercised in 2009. The calculations of the price at which Codelco can exercise its right are complex and confidential but do, inter alia, take account of company profitability over a five year period.
Anglo American South Africa LimitedAnglo American South Africa Limited (AASA), a wholly owned subsidiary of the Company, is a defendant in 25 separate lawsuits, each one on behalf of a former mineworker (or his dependents or survivors) who allegedly contracted silicosis working for gold mining companies in which AASA was a shareholder and to which AASA provided various technical and administrative services. The aggregate amount of the 25 claims is less than $5 million, although if these claims are determined adversely to AASA, there are a substantial number of additional former mineworkers who may seek to bring similar claims. The first trial of these claims is expected to be in 2011, but the arrangements have not yet been agreed.
37. Operating leasesAt 31 December the Group had the following outstanding commitments under non-cancellable operating leases:
US$ million 2009 2008
Expiry date
Within one year 140 64
One to two years 95 60
Two to five years 194 168
After five years 399 197
828 489
Operating leases relate principally to land and buildings, vehicles and shipping vessels.
38. Related party transactionsThe Group has a related party relationship with its subsidiaries, joint ventures and associates (see note 39).
The Company and its subsidiaries, in the ordinary course of business, enter into various sales, purchase and service transactions with joint ventures and associates and others in which the Group has a material interest. These transactions are under terms that are no less favourable than those arranged with third parties. These transactions are not considered to be significant.
Dividends received from associates during the year totalled $616 million (2008: $609 million), as disclosed in the Consolidated cash flow statement.
At 31 December 2009 the Group had provided loans to joint ventures of $93 million (2008: $20 million). These loans are included in financial asset investments.
At 31 December 2009 the directors of the Company and their immediate relatives controlled 3% (2008: 3%) of the voting shares of the Company.
Remuneration and benefits received by directors are disclosed in the directors’ remuneration report. Remuneration and benefits of key management personnel including directors are given in note 6.
Information relating to pension fund arrangements is disclosed in note 27.

Financial statements
142 Anglo American plc Annual Report 2009
Notes to the financial statementscontinued
38. Related party transactions continuedRelated party transactions with De BeersAt 31 December 2009 the Group held $88 million (2008: $88 million) of 10% non-cumulative redeemable preference shares in DB Investments, the holding company of De Beers Société Anonyme.
Set out below are details of certain transactions and arrangements entered into by the Group with, or for the benefit of, certain related parties of the Company for the purposes of the United Kingdom Listing Authority Listing rules, being Central Holdings Limited (and certain of its subsidiaries, together ‘CHL’) and DB Investments SA and De Beers SA (together, ‘De Beers’) which are related parties for the purposes of such rules by virtue of being companies in which Mr N.F. Oppenheimer, a director of the Company, has a relevant interest for the purposes of such rules.
It was agreed that the dividends declared by De Beers to the Group and the other shareholders in De Beers (including CHL) would be exchanged for loan obligations. The total amount of dividends exchanged amounted to $118 million in the year ended 31 December 2008. This total has increased during 2009 by $24 million. The loans are subordinated and are interest free for two years at which point they become interest bearing in line with market rates at the dates of the initial reinvestment.
In April 2009 the shareholders of De Beers provided an additional loan to De Beers, proportionate to their shareholdings, totalling $500 million. Anglo American holds a 45% interest and therefore provided a loan of $225 million. The loan is interest free for two years, at which point it reverts to a rate of interest equal to LIBOR plus 700 basis points until April 2016 and then, provided all interest payments are up to date, reduces to LIBOR plus 300 basis points. In the event of a rights issue or other share issue by De Beers, the Group would have the option to apply amounts outstanding under the loan in subscribing for ordinary shares in De Beers at the issue price applicable to the relevant share issue, which will be determined at the time of the relevant issue. The loan is subordinated in favour of third party banks/lenders and preference shareholders (including Anglo American) and is repayable after ten years. These loans are included in financial asset investments.
In February 2010 the shareholders of De Beers agreed, as part of the De Beers group’s refinancing, including third party debt refinancing, that additional equity was required by De Beers. The shareholders of De Beers (including CHL) have accordingly all agreed to subscribe, in proportion to their current shareholding, for $1 billion of additional equity in De Beers, subject to the fulfilment of certain conditions. The Group’s share of such additional equity, in line with its equity holding in De Beers, amounts to $450 million. CHL’s share of such additional equity, in line with its equity holding in De Beers, amounts to $400 million. The shareholders have further agreed that the subscription does not constitute a subscription event under the 2009 arrangements.
Pursuant to the refinancing of De Beers and to satisfy the requirements of the lenders to De Beers, the shareholders of De Beers, including the Group, have, as applicable, agreed to:(i) defer the receipt of dividends or capital on their ordinary shares until certain
financial tests (‘Normalisation’) are met and this is currently anticipated to be during 2011;
(ii) defer the receipt of dividends and mandatory redemption under the preference shares in De Beers SA until Normalisation. The total amount deferred by Anglo American is approximately $96.5 million. The dividends (or interest in respect of such dividends) will continue to accrue on the preference shares until they are paid and the preference shares redeemed; and
(iii) enter into an agreement which effectively formalises, in favour of the lenders to De Beers, the deferral of the rights to dividends or other distributions in respect of their respective ordinary shares, and, as applicable, preference shares and payments under the shareholder loans, until Normalisation; and the subordination thereof.
As part of the process of facilitating the agreed equity subscription by all the shareholders of De Beers, a temporary re-ranking of distribution rights was agreed which will result, following Normalisation, in a $20 million distribution to the shareholders of De Beers (including the Group and CHL), pro rata to their individual equity subscriptions as referred to above, which will be paid in priority to existing preferences on distributions under the terms of the preference shares in De Beers. The net effect of this re-prioritisation on Anglo American, in the event of there being insufficient cash to pay all dividends then due, is a deferral of approximately $8 million of dividends, which will continue to accrue interest until paid.
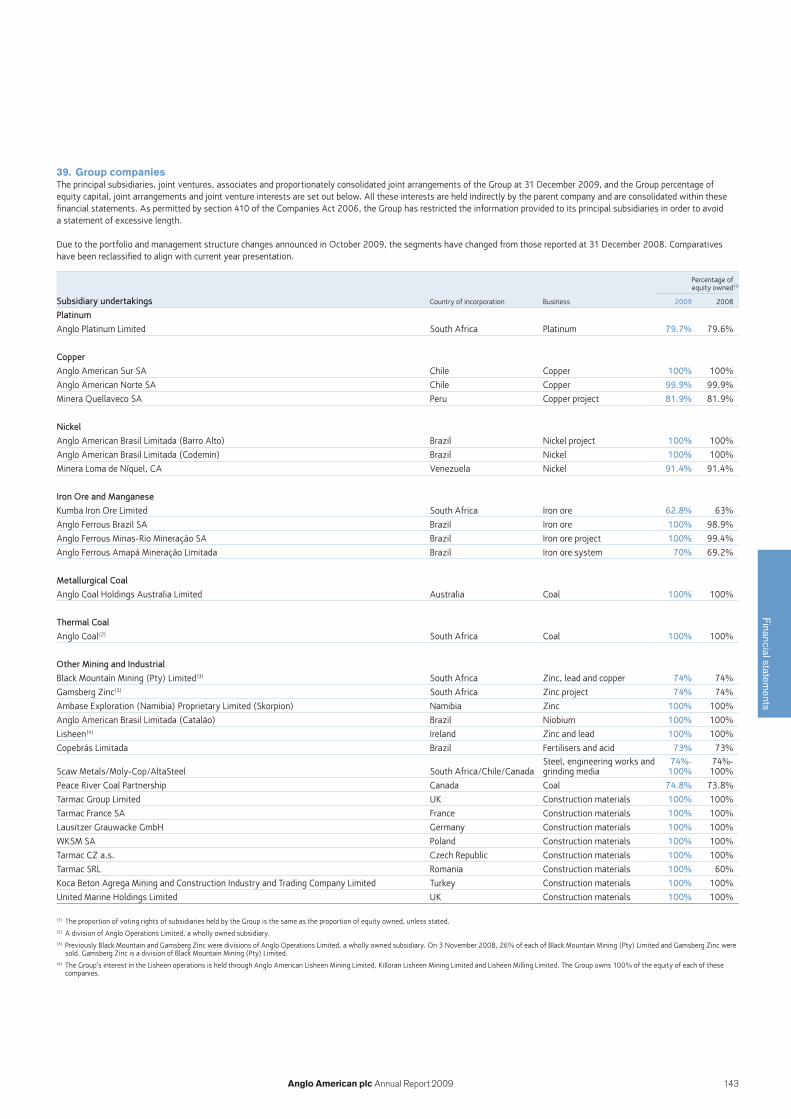
143Anglo American plc Annual Report 2009
Financial statements
39. Group companiesThe principal subsidiaries, joint ventures, associates and proportionately consolidated joint arrangements of the Group at 31 December 2009, and the Group percentage of equity capital, joint arrangements and joint venture interests are set out below. All these interests are held indirectly by the parent company and are consolidated within these financial statements. As permitted by section 410 of the Companies Act 2006, the Group has restricted the information provided to its principal subsidiaries in order to avoid a statement of excessive length.
Due to the portfolio and management structure changes announced in October 2009, the segments have changed from those reported at 31 December 2008. Comparatives have been reclassified to align with current year presentation.
Percentage of equity owned(1)
Subsidiary undertakings Country of incorporation Business 2009 2008
Platinum
Anglo Platinum Limited South Africa Platinum 79.7% 79.6%
Copper
Anglo American Sur SA Chile Copper 100% 100%
Anglo American Norte SA Chile Copper 99.9% 99.9%
Minera Quellaveco SA Peru Copper project 81.9% 81.9%
Nickel
Anglo American Brasil Limitada (Barro Alto) Brazil Nickel project 100% 100%
Anglo American Brasil Limitada (Codemin) Brazil Nickel 100% 100%
Minera Loma de Níquel, CA Venezuela Nickel 91.4% 91.4%
Iron Ore and Manganese
Kumba Iron Ore Limited South Africa Iron ore 62.8% 63%
Anglo Ferrous Brazil SA Brazil Iron ore 100% 98.9%
Anglo Ferrous Minas-Rio Mineração SA Brazil Iron ore project 100% 99.4%
Anglo Ferrous Amapá Mineração Limitada Brazil Iron ore system 70% 69.2%
Metallurgical Coal
Anglo Coal Holdings Australia Limited Australia Coal 100% 100%
Thermal Coal
Anglo Coal(2) South Africa Coal 100% 100%
Other Mining and Industrial
Black Mountain Mining (Pty) Limited(3) South Africa Zinc, lead and copper 74% 74%
Gamsberg Zinc(3) South Africa Zinc project 74% 74%
Ambase Exploration (Namibia) Proprietary Limited (Skorpion) Namibia Zinc 100% 100%
Anglo American Brasil Limitada (Catalão) Brazil Niobium 100% 100%
Lisheen(4) Ireland Zinc and lead 100% 100%
Copebrás Limitada Brazil Fertilisers and acid 73% 73%
Scaw Metals/Moly-Cop/AltaSteel South Africa/Chile/CanadaSteel, engineering works and grinding media
74%-100%
74%-100%
Peace River Coal Partnership Canada Coal 74.8% 73.8%
Tarmac Group Limited UK Construction materials 100% 100%
Tarmac France SA France Construction materials 100% 100%
Lausitzer Grauwacke GmbH Germany Construction materials 100% 100%
WKSM SA Poland Construction materials 100% 100%
Tarmac CZ a.s. Czech Republic Construction materials 100% 100%
Tarmac SRL Romania Construction materials 100% 60%
Koca Beton Agrega Mining and Construction Industry and Trading Company Limited Turkey Construction materials 100% 100%
United Marine Holdings Limited UK Construction materials 100% 100%
(1) The proportion of voting rights of subsidiaries held by the Group is the same as the proportion of equity owned, unless stated.(2) A division of Anglo Operations Limited, a wholly owned subsidiary.(3) Previously Black Mountain and Gamsberg Zinc were divisions of Anglo Operations Limited, a wholly owned subsidiary. On 3 November 2008, 26% of each of Black Mountain Mining (Pty) Limited and Gamsberg Zinc were
sold. Gamsberg Zinc is a division of Black Mountain Mining (Pty) Limited.(4) The Group’s interest in the Lisheen operations is held through Anglo American Lisheen Mining Limited, Killoran Lisheen Mining Limited and Lisheen Milling Limited. The Group owns 100% of the equity of each of these
companies.

Financial statements
144 Anglo American plc Annual Report 2009
Notes to the financial statementscontinued
39. Group companies continued
Percentage of equity owned(5)
Joint ventures Country of incorporation Business 2009 2008
Compañía Minera Doña Inés de Collahuasi SCM Chile Copper 44% 44%
LLX Minas-Rio Logística SA Brazil Port 49% 49%
AI Futtain Tarmac Quarry Products Limited Dubai Construction materials 49% 49%
Midland Quarry Products Limited(6) UK Construction materials 50% 50%
Percentage of equity owned(5)
Associates Country of incorporation Business 2009 2008
DB Investments SA Luxembourg Diamonds 45% 45%
Samancor Holdings (Pty) Limited(7) South Africa Manganese 40% 40%
Groote Eylandt Mining Company (Pty) Limited (GEMCO)(7) Australia Manganese 40% 40%
Tasmanian Electro Metallurgical Company (Pty) Limited (TEMCO)(7) Australia Manganese 40% 40%
Queensland Coal Mine Management (Pty) Limited Australia Coal 33.3% 33.3%
Cerrejón Zona Norte SA Colombia Coal 33.3% 33.3%
Carbones del Cerrejón LLC Anguilla Coal 33.3% 33.3%
Carbones del Guasare SA Venezuela Coal 24.9% 24.9%
Tongaat Hulett Limited(8) South AfricaSugar, starch, glucose and property development – 37.1%
Hulamin Limited(9) South Africa Aluminium – 38.4%
Percentage owned
Proportionately consolidated jointly controlled operations(10) Location Business 2009 2008
Drayton Australia Coal 88.2% 88.2%
Moranbah North Australia Coal 88% 88%
German Creek Australia Coal 70% 70%
Foxleigh Australia Coal 70% 70%
Dawson Australia Coal 51% 51%
(5) All equity interests shown are ordinary shares.(6) During 2008 the Group ceased accounting for Midland Quarry Products Limited as a subsidiary and began accounting for it as a joint venture as it was considered to be jointly controlled.(7) These entities have a 30 June year end.(8) Formerly The Tongaat-Hulett Group Limited. In August 2009 the Group sold its remaining investment in Tongaat Hulett Limited.(9) Unbundled from Tongaat Hulett in June 2007. In July 2009 the Group sold its remaining investment in Hulamin Limited.(10) The wholly owned subsidiary Anglo Coal Holdings Australia Limited holds the proportionately consolidated jointly controlled operations.
40. Events occurring after end of yearIn February 2010 the Group announced its commitment to take up its full allocation of shares under the rights offer announced by Anglo Platinum. Anglo Platinum expects to raise approximately $1.6 billion through the rights offer, of which the Group’s share of 79.7% is approximately $1.3 billion. The Group has also agreed to underwrite the minority portion of the rights offer.
Subsequent to 31 December 2009 De Beers has announced a $1 billion rights issue. The Group has accordingly agreed to subscribe for additional equity in proportion to its current shareholding and will therefore contribute $450 million. Refer to note 38 for further details.
During the first quarter of 2010, Anglo American agreed the sales of Tarmac’s aggregates businesses in France, Germany, Poland and the Czech Republic and its Polish concrete products business with expected total proceeds of approximately $400 million.
With the exception of the above there have been no material reportable events since 31 December 2009.

145Anglo American plc Annual Report 2009
Financial statements
41. Financial statements of the parent companya) Balance sheet of the Company, Anglo American plc, as at 31 December 2009
US$ million Note 2009 2008
Fixed assets
Fixed asset investments 41c 13,104 12,925
Current assets
Amounts due from subsidiaries 4,490 1,305
Prepayments and other debtors 13 138
Cash at bank and in hand 40 2
4,543 1,445
Creditors due within one year
Cash held on behalf of subsidiaries (79) (59)
Amounts owed to subsidiaries (187) (215)
Other creditors (15) (8)
(281) (282)
Net current assets 4,262 1,163
Total assets less current liabilities 17,366 14,088
Liabilities due after more than one year
Convertible bond (1,369) –
Net assets 15,997 14,088
Capital and reserves
Called-up share capital 41b 738 738
Share premium account 41b 2,713 2,713
Capital redemption reserve 41b 115 115
Other reserves 41b 1,955 1,955
Share-based payment reserve 41b 15 22
Convertible debt reserve 41b 355 –
Profit and loss account 41b 10,106 8,545
Total shareholders’ funds (equity) 15,997 14,088
The financial statements of Anglo American plc, registered number 3564138, were approved by the Board of directors on 18 February 2010.
Cynthia Carroll René MédoriChief executive Finance director
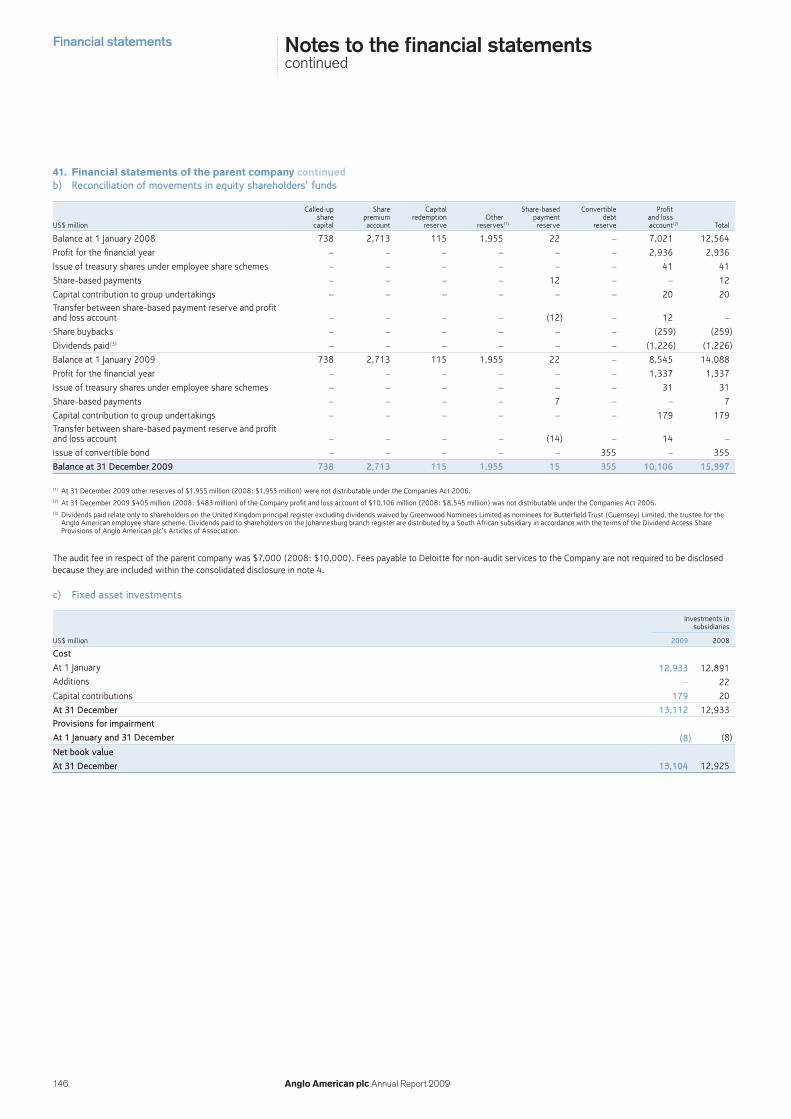
Financial statements
146 Anglo American plc Annual Report 2009
Notes to the financial statementscontinued
41. Financial statements of the parent company continuedb) Reconciliation of movements in equity shareholders’ funds
US$ million
Called-up share
capital
Share premium account
Capital redemption
reserveOther
reserves(1)
Share-based payment reserve
Convertible debt
reserve
Profit and loss account(2) Total
Balance at 1 January 2008 738 2,713 115 1,955 22 – 7,021 12,564
Profit for the financial year – – – – – – 2,936 2,936
Issue of treasury shares under employee share schemes – – – – – – 41 41
Share-based payments – – – – 12 – – 12
Capital contribution to group undertakings – – – – – – 20 20Transfer between share-based payment reserve and profit and loss account – – – – (12) – 12 –
Share buybacks – – – – – – (259) (259)
Dividends paid(3) – – – – – – (1,226) (1,226)
Balance at 1 January 2009 738 2,713 115 1,955 22 – 8,545 14,088
Profit for the financial year – – – – – – 1,337 1,337
Issue of treasury shares under employee share schemes – – – – – – 31 31
Share-based payments – – – – 7 – – 7
Capital contribution to group undertakings – – – – – – 179 179Transfer between share-based payment reserve and profit and loss account – – – – (14) – 14 –
Issue of convertible bond – – – – – 355 – 355
Balance at 31 December 2009 738 2,713 115 1,955 15 355 10,106 15,997
(1) At 31 December 2009 other reserves of $1,955 million (2008: $1,955 million) were not distributable under the Companies Act 2006.(2) At 31 December 2009 $405 million (2008: $483 million) of the Company profit and loss account of $10,106 million (2008: $8,545 million) was not distributable under the Companies Act 2006.(3) Dividends paid relate only to shareholders on the United Kingdom principal register excluding dividends waived by Greenwood Nominees Limited as nominees for Butterfield Trust (Guernsey) Limited, the trustee for the
Anglo American employee share scheme. Dividends paid to shareholders on the Johannesburg branch register are distributed by a South African subsidiary in accordance with the terms of the Dividend Access Share Provisions of Anglo American plc’s Articles of Association.
The audit fee in respect of the parent company was $7,000 (2008: $10,000). Fees payable to Deloitte for non-audit services to the Company are not required to be disclosed because they are included within the consolidated disclosure in note 4.
c) Fixed asset investments
Investments in subsidiaries
US$ million 2009 2008
Cost
At 1 January 12,933 12,891Additions – 22
Capital contributions 179 20
At 31 December 13,112 12,933Provisions for impairment
At 1 January and 31 December (8) (8)
Net book value
At 31 December 13,104 12,925

147Anglo American plc Annual Report 2009
Financial statements
41. Financial statements of the parent company continuedd) Accounting policies: Anglo American plc, the CompanyThe Anglo American plc (the Company) balance sheet and related notes have been prepared in accordance with United Kingdom Generally Accepted Accounting Principles (UK GAAP) and in accordance with UK company law. The financial information has been prepared on a historical cost basis as modified by the revaluation of certain financial instruments.
A summary of the principal accounting policies is set out below.
The preparation of financial statements in accordance with UK GAAP requires the use of estimates and assumptions that affect the reported amounts of assets and liabilities at the date of the financial statements and the reported amounts of revenues and expenses during the period. Although these estimates are based on management’s best knowledge of the amount, event or actions, following implementation of these standards, actual results may differ from those estimated.
As permitted by section 408 of the Companies Act 2006, the profit and loss account of the Company is not presented as part of these financial statements. The profit after tax for the year of the Company amounted to $1,337 million (2008: $2,936 million).
Significant accounting policiesDeferred taxDeferred tax is provided in full on all timing differences that result in an obligation at the balance sheet date to pay more tax, or a right to pay less tax, at a future date, subject to the recoverability of deferred tax assets. Deferred tax assets and liabilities are not discounted.
Share-based paymentsThe Company has applied the requirements of FRS 20 Share-based Payment. In accordance with the transitional provisions, FRS 20 has been applied to all grants of equity instruments after 7 November 2002 that had not vested as at 1 January 2005.
The Company makes equity settled share-based payments to the directors, which are measured at fair value at the date of grant and expensed on a straight line basis over the vesting period, based on the Company’s estimate of shares that will eventually vest. For those share schemes with market vesting conditions, the fair value is determined using the Monte Carlo method at the grant date. The fair value of share options issued with non-market vesting conditions has been calculated using the Black Scholes model. For all other share awards, the fair value is determined by reference to the market value of the share at the date of grant. For all share schemes with non-market related vesting conditions, the likelihood of vesting has been taken into account when determining the associated charge. Vesting assumptions are reviewed during each reporting period to ensure they reflect current expectations.
The Company also makes equity settled share-based payments to certain employees of certain subsidiary undertakings. Equity settled share-based payments that are made to employees of the Company’s subsidiaries are treated as increases in equity over the vesting period of the award, with a corresponding increase in the Company’s investments in subsidiaries, based on an estimate of the number of shares that will eventually vest.
Any payments received from subsidiaries are applied to reduce the related increases in investments in subsidiaries.
Accounting for share-based payments is the same as under IFRS 2 and details on the schemes and option pricing models relevant to the charge included in the Company financial statements are set out in note 28 to the consolidated financial statements of the Group for the year ended 31 December 2009.
InvestmentsInvestments represent equity holdings in subsidiaries, joint ventures and associates and are held at cost less provision for impairment.
Convertible debtConvertible bonds are regarded as compound instruments, consisting of a liability and an equity component. At the date of issue, the fair value of the liability component is estimated using the prevailing market interest rate for similar non-convertible debt and is recorded within borrowings. The difference between the proceeds of issue of the convertible bond and the fair value assigned to the liability component, representing the embedded option to convert the liability into equity of the Company, is included in equity.
Issue costs are apportioned between the liability and equity components of the convertible bonds where appropriate based on their relative carrying amounts at the date of issue. The portion relating to the equity component is charged directly against equity.
The interest expense on the liability component is calculated by applying the effective interest rate for similar non-convertible debt to the liability component of the instrument. The difference between this amount and the interest paid is added to the carrying amount of the liability.