financial statements july 30, 2008 for the three months ...earnings release for the three months...
TRANSCRIPT

Financial Statements July 30, 2008 For the Three Months Ended June 30, 2008 [U.S. GAAP] Name of registrant: NTT DoCoMo, Inc. (URL http://www.nttdocomo.co.jp/) Code No.: 9437 Stock exchange on which the Company’s shares are listed: Tokyo Stock Exchange-First Section Representative: Ryuji Yamada, Representative Director, President and Chief Executive Officer Contact: Shinya Hasegawa, Senior Manager, General Affairs Department / TEL +81-3-5156-1111 Scheduled date for filing of quarterly report: August 5, 2008
1. Consolidated Financial Results for the Three Months Ended June 30, 2008 (April 1, 2008 - June 30, 2008) (1) Consolidated Results of Operations Amounts are rounded off to the nearest 1 million yen. (Millions of yen, except per share amount)
Operating Revenues Operating Income Income before Income Taxes Net Income
Three months ended June 30, 2008 1,170,246 - 296,488 - 288,419 - 173,509 -
Three months ended June 30, 2007 1,182,864 (2.9)% 203,881 (25.2)% 205,466 (25.1)% 122,810 (24.9)%
Basic Earnings per Share
Diluted Earnings per Share
Three months ended June 30, 2008 4,082.16 (yen) -
Three months ended June 30, 2007 2,825.21 (yen) -
(Percentages above represent changes compared to the corresponding previous quarterly period)
(2) Consolidated Financial Position (Millions of yen, except per share amount)
Total Assets Shareholders’ Equity Equity Ratio
(Ratio of Shareholders’ Equity to Total Assets)
Shareholders’ Equity per Share
June 30, 2008 6,082,339 4,277,960 70.3% 101,094.12 (yen) March 31, 2008 6,210,834 4,276,496 68.9% 100,321.46 (yen)
2. Dividends
Cash dividends per share (yen)
Date of record End of the first quarter
End of the second quarter
End of the third quarter Year-end Total
Year ended March 31, 2008 - 2,400.00 - 2,400.00 4,800.00
Year ending March 31, 2009 - - - - -
Year ending March 31, 2009 (Forecasts) - 2,400.00 - 2,400.00 4,800.00
Change in forecasts of dividends during the three months ended June 30, 2008: None
3. Consolidated Financial Results Forecasts for the Fiscal Year Ending March 31, 2009 (April 1, 2008 - March 31, 2009) (Millions of yen, except per share amount)
Operating Revenues Operating Income Income before
Income Taxes Net Income Earnings per Share
Six months ending September 30, 2008
- - - - - - - - - -
Year ending March 31, 2009 4,768,000 1.2% 830,000 2.7% 835,000 4.3% 503,000 2.4% 11,799.78(yen)
(Percentages above represent changes compared to the corresponding previous period)
Change in earnings forecasts for the fiscal year ending March 31, 2009 during the three months ended June 30, 2008: None Note: We do not formulate consolidated financial results forecasts for six months ending September 30, 2008. (See more information on page 8.)
1

4. Others (1) Changes in significant consolidated subsidiaries (which resulted in changes in scope of consolidation) None (2) Application of accounting which is simplified or exceptional for quarterly consolidated financial statements None (3) Change in significant accounting policies, procedures and presentation in quarterly consolidated financial statements
(Items to be disclosed in “Significant Changes in Preparation Basis for Quarterly Consolidated Financial Statements”) (i) Changes due to revision of accounting standards and other regulations: Yes (ii) Others: None (See more information on page 9.) (4) Number of issued shares (common stock) (i) Number of issued shares (inclusive of treasury stock): As of June 30, 2008: 44,870,000 shares As of March 31, 2008: 44,870,000 shares (ii) Number of treasury stock: As of June 30, 2008: 2,553,396 shares As of March 31, 2008: 2,242,073 shares (iii) Number of weighted average common shares outstanding: For the three months ended June 30, 2008: 42,504,235 shares For the three months ended June 30, 2007: 43,469,272 shares
※ Explanation for forecasts of operation and other notes:
With regard to the assumptions and other related matters concerning consolidated financial results forecasts for the fiscal year ending March 31, 2009, please refer to page 8 and 19.
Consolidated financial statements in this earnings release are unaudited.
2
Earnings Release for the Three Months Ended June 30, 2008
<< 1. Operating Results >> 1.Business Overview
Competition among the network operators in the mobile communications market in Japan, which already
entered a phase of maturity given the high penetration rate, has been fueled by recent price competitions and market entry by new competitors such as MVNO*.
In such market environment, we started to offer free of charge calls for 24 hours among family members with FOMA subscription in the same “Fami-wari MAX50” account. We decided to discount the basic monthly charge of a billing plan called “Type SS Value”. We also released “FOMA 906i” series handsets and launched a new service called “Home U” which enables subscribers to make/receive a call and transmit data via local broadband connection with a compatible FOMA handset. We strived for further penetration of our new discount programs and new handset sales methods, which we believe are appropriate for the current market conditions.
In April 2008, we announced the “New DOCOMO Commitments,” which sets forth the vision for reforming DOCOMO, and upgraded privilege for membership of DOCOMO premium club in order to further promote sustainable loyalty from our valued customers.
As a result, for the three months ended June 30, 2008, operating revenues were ¥1,170.2 billion, operating income was ¥296.5 billion, income before income taxes was ¥288.4 billion and net income was ¥173.5 billion. * MVNO (Mobile Virtual Network Operator): a service provider who leases the physical wireless
communication infrastructure from other network operators to provide wireless services.
Consolidated results of operations for the three months ended June 30, 2008 were as follows. <Results of operations>
Billions of yen
(UNAUDITED) Three months ended
June 30, 2008
(Reference) (UNAUDITED)
Three months ended June 30, 2007
Operating revenues ¥ 1,170.2 ¥ 1,182.9 Operating expenses 873.8 979.0
Operating income 296.5 203.9 Other income (expense) (8.1) 1.6
Income before income taxes 288.4 205.5 Income taxes 118.0 82.6 Equity in net income (losses) of affiliates, net of
applicable taxes 3.1 (0.1) Minority interests (0.0) (0.0)
Net income ¥ 173.5 ¥ 122.8 EBITDA margin* 40.1% 32.7%
* EBITDA and EBITDA margin, as we refer to in this earnings release, are different from EBITDA as used in Item 10(e) of Regulation
S-K and may not be comparable to similarly titled measures used by other companies. For an explanation of our definitions of EBITDA and EIBITDA margin, see the reconciliations to the most directly comparable financial measures calculated and presented in accordance with GAAP on page18.
Notes: 1. Consolidated financial statements for the three months ended June 30, 2008 in this release are unaudited. 2. Amounts in this release are rounded.
3

DOCOMO Earnings Release Three Months Ended June 30, 2008
4
<Operating revenues>
Billions of yen
(UNAUDITED) Three months ended
June 30, 2008
(Reference) (UNAUDITED)
Three months ended June 30, 2007
Wireless services ¥ 977.5 ¥ 1,062.3 Cellular services revenues 936.4 1,032.7 - Voice revenues 570.3 702.8 Including: FOMA services 486.6 521.3 - Packet communications revenues 366.1 329.8 Including: FOMA services 347.7 291.1 PHS services - 3.8 Other revenues 41.1 25.8
Equipment sales 192.8 120.6 Total operating revenues ¥ 1,170.2 ¥ 1,182.9
Note: Voice revenues include data communications revenues through circuit switching systems.
<Operating expenses>
Billions of yen
(UNAUDITED) Three months ended
June 30, 2008
(Reference) (UNAUDITED)
Three months ended June 30, 2007
Personnel expenses ¥ 63.2 ¥ 62.8 Non-personnel expenses 544.0 633.5 Depreciation and amortization 168.5 177.1 Loss on disposal of property, plant and
equipment and intangible assets 6.0 7.6 Communication network charges 82.3 88.1 Taxes and public dues 9.7 9.8
Total operating expenses ¥ 873.8 ¥ 979.0 2.Segment information
(1) Mobile phone business As of June 30, 2008, the number of cellular (FOMA+mova) services subscriptions was 53.63 million (an
increase of 0.78 million compared to the number as of June 30, 2007), 84.3% of which was represented by FOMA services subscriptions of 45.20 million. The aggregate number of subscriptions to the new discount programs introduced in August 2007 such as “Fami-wari MAX50” reached approximately 25.90 million while the number of subscriptions to the “Value Plan” surpassed approximately 8.90 million as of June 30, 2008, respectively. As a result, aggregate ARPU of cellular (FOMA+mova) services decreased to ¥5,890 for the three months ended June 30, 2008 (down 10.2% compared to the same period of the prior year).
The number of handsets sold (FOMA+mova) decreased to 4.95 million units for the three months ended June 30, 2008 (a decrease of 1.29 million units compared to the same period of the prior year). “Value Course”, which was introduced in November 2007, was applied to more than 90% of the aggregate number of handsets sold through our new handset sales methods.
Our cellular churn rate for the three months ended June 30, 2008 improved significantly to 0.51% compared to 0.85% during the same period of the prior year.
For the three months ended June 30, 2008, operating revenues and operating income from mobile phone business were ¥1,154.8 billion and ¥301.0 billion, respectively.

DOCOMO Earnings Release Three Months Ended June 30, 2008
5
Number of subscriptions by services, trend of ARPU and other operation date are as follows:
<Number of subscriptions by services> Thousand subscriptions June 30, 2008 March 31, 2008 Cellular (FOMA+mova) services 53,629 53,388
Cellular (FOMA) services 45,200 43,949 Including: i-channel services 15,823 15,649 Including: flat-rate services
for unlimited i-mode usage 13,395 12,744 Cellular (mova) services 8,429 9,438
i-mode services 48,061 47,993 Notes:
1. Number of subscriptions of Cellular (FOMA+mova) services and Cellular (FOMA) services includes Communication Module services subscriptions.
2. Effective March 3, 2008, FOMA services subscription became mandatory for subscription to “2in1” service. Such FOMA services subscriptions to “2in1” services are included in the above numbers of Cellular (FOMA+mova) services subscriptions and Cellular (FOMA) services subscriptions.
3. Number of subscriptions to flat-rate services for unlimited i-mode usage: “pake-hodai” subscriptions + “pake-hodai full” subscriptions
4. Number of i-mode subscriptions = Cellular (FOMA) i-mode subscriptions + Cellular (mova) i-mode subscriptions * “2in1” refers to an optional network service which enables a subscriber to subscribe an additional phone number and an
e-mail address into a single compatible handset.
<Number of handsets sold and churn rate> Thousand units Three months ended
June 30, 2008 Three months ended
June 30, 2007 Cellular (FOMA+mova) services 4,946 6,238
Cellular (FOMA) services New FOMA subscription 1,039 1,492 Change of subscription from mova to FOMA 836 1,780 FOMA handset upgrade by FOMA subscribers 3,032 2,791
Cellular (mova) services New mova subscription 23 78 mova handset upgrade by mova subscribers and change of subscription from FOMA to mova 17 97
Churn Rate 0.51% 0.85%
<Trend of ARPU and MOU> Yen/Minutes Three months ended
June 30, 2008 Three months ended
June 30, 2007 Aggregate ARPU* (FOMA+mova) ¥ 5,890 ¥ 6,560
Voice ARPU 3,560 4,440 Packet ARPU 2,330 2,120
Aggregate ARPU (FOMA) 6,260 7,370 Voice ARPU 3,630 4,710 Packet ARPU 2,630 2,660
Aggregate ARPU (mova) 3,890 4,600 Voice ARPU 3,220 3,800 i-mode ARPU 670 800
MOU* (FOMA+mova) (minutes) 137 140 * See“Definition and Calculation Methods of ARPU and MOU”on page 17 for details of definitions and calculation methods of ARPU
and MOU.
<Results of operations> Billions of yen
(UNAUDITED) Three months ended
June 30, 2008
(Reference) (UNAUDITED)
Three months ended June 30, 2007
Operating revenues from mobile phone business ¥ 1,154.8 ¥ 1,168.9 Operating income from mobile phone business 301.0 213.2

DOCOMO Earnings Release Three Months Ended June 30, 2008
6
(2) Miscellaneous businesses Operating revenues from miscellaneous businesses for the three months ended June 30, 2008 were ¥15.5
billion, which represented 1.3% of the total operating revenues. The revenues derived mainly from high-speed internet connection services for hotel facilities, video-clip casting services, advertisement services, development, sales and maintenance of IT system and credit services. Operating expenses and operating losses from miscellaneous businesses were ¥20.0 billion and ¥4.5 billion, respectively.
<Results of operations> Billions of yen
(UNAUDITED) Three months ended
June 30, 2008
(Reference) (UNAUDITED)
Three months ended June 30, 2007
Operating revenues from miscellaneous businesses ¥ 15.5 ¥ 14.0 Operating losses from miscellaneous businesses (4.5) (9.3)
Note: For the three months ended June 30, 2007, “PHS business”, which was presented separately in the past, has been reclassified into “miscellaneous businesses”.
3.Trend of capital expenditures We continued quality improvement of our FOMA service area and reinforced its network capacity to meet an
increase in traffic demand, together with our efforts to make capital expenditure more efficient and less costly by saving on equipment purchase costs and improving our design and construction process. Total capital expenditures for the three months ended June 30, 2008 were ¥163.8 billion.
<Breakdown of capital expenditures> Billions of yen
(UNAUDITED) Three months ended
June 30, 2008
(Reference) (UNAUDITED)
Three months ended June 30, 2007
Mobile phone business ¥ 138.6 ¥ 126.2 PHS business - 0.1 Other (including information systems) 25.2 24.9 Total capital expenditures ¥ 163.8 ¥ 151.2

DOCOMO Earnings Release Three Months Ended June 30, 2008
<< 2.Financial Position >>
(1) Financial position
Billions of yen (UNAUDITED)
June 30, 2008
March 31, 2008 Total assets ¥ 6,082.3 ¥ 6,210.8 Shareholders’ equity 4,278.0 4,276.5 Liabilities 1,802.8 1,933.1
Interest bearing liabilities 525.9 478.5 Equity ratio (1) 70.3% 68.9% Debt ratio (2) 10.9% 10.1%
Notes: (1) Equity ratio = Shareholders’ equity / Total assets (2) Debt ratio = Interest bearing liabilities / (Shareholders’ equity + Interest bearing liabilities)
(2) Cash flow conditions Net cash provided by operating activities was ¥135.3 billion, reflecting the payment for income taxes of
¥203.6 billion and an increase in account receivables due to the effect of advance payment for handsets purchased in installments.
Net cash used in investing activities was ¥190.4 billion. Our expenditures for purchases of property, plant and equipment of ¥163.7 billion and purchases of intangible and other assets of ¥72.0 billion in total were partially offset by proceeds from redemption of long-term bailment for consumption to a related party of ¥50.0 billion.
Net cash used in financing activities was ¥102.7 billion. We spent ¥50.0 billion for acquisition of treasury stock, ¥27.8 billion for repayment for outstanding long-term debt and ¥102.3 billion for payment for cash dividends while financing ¥79.9 billion through issuance of corporate bonds.
The balance of cash and cash equivalents was ¥487.0 billion as of June 30, 2008.
Billions of yen
(UNAUDITED) Three months ended
June 30, 2008
(Reference) (UNAUDITED)
Three months ended June 30, 2007
Net cash provided by operating activities ¥ 135.3 ¥ 300.7 Net cash used in investing activities (190.4) (157.8) Net cash used in financing activities (102.7) (259.3) Free cash flows (1) (55.2) 142.9 Adjusted free cash flows* excluding the
effects of irregular factors (2) and changes in investments for cash management purposes (3) (105.6) 49.2
Notes:
(1) Free cash flows = Net cash provided by operating activities + Net cash used in investing activities (2) Irregular factors = Effects of uncollected revenues due to bank closures at the end of the fiscal period (3) Changes in investments for cash management purposes = Changes by purchases, redemption at maturity and disposals of
financial instruments held for cash management purposes with original maturities of longer than 3 months * See the reconciliations to the most directly compatible financial measures calculated and presented in accordance with
GAAP on page 18.
7

DOCOMO Earnings Release Three Months Ended June 30, 2008
<<3. Prospects for the Fiscal Year Ending March 31, 2009 >>
Competition in the Japanese mobile communications market has become fiercer due to recent price
competitions, market entry by new competitors such as MVNO and other factors. Under such market condition, we projected our operating revenues for the fiscal year ending March 31, 2009
to be ¥4,768.0 billion, in which a decrease in ARPU due to an adverse impact of revision of billing plans and discount programs would be offset by an increase in equipment sales due to further penetration of new handset sales methods. We will continue our cost saving efforts including efficient allocation of sales commission and reduction of network cost through improvement of administrative processes, which we expect will result in an increase in operating income by ¥21.7 billion to ¥830.0 billion from the prior fiscal year. As we are currently not aware of any factors which may have a material impact on our projected results of operations, we have not revised our projection which was announced on April 25, 2008.
※ Explanation for forecasts of operation and other notes: The mobile communications market in Japan is characterized by rapid changes in the market environment
due to technical innovations, market entry by new competitors and other factors. To respond to such changes, our corporate group may introduce new billing plans or other measures that could potentially have a significant impact on our revenues and income. The timing of introduction of such measures will be decided after comprehensively taking into consideration our operational circumstances and the actions of our competitors, and therefore, is not necessarily decided beforehand. Such measures, depending on the timing of implementation, may significantly affect our results forecasts to be made at the time of our first-quarterly results announcement. Providing such prospects on a quarter-year basis, therefore, may not be adequate or useful as information to be disclosed to investors. Accordingly, we will provide prospects for the full year only, and report the progress vis-à-vis the projected full-year forecasts by disclosing actual results on a quarterly basis.
8

DOCOMO Earnings Release Three Months Ended June 30, 2008
<<4. Other >>
(1) Changes in significant subsidiaries for the three months ended June 30, 2008 (which resulted in changes
in scope of consolidation) : None
(2) Application of accounting which is simplified or exceptional for quarterly consolidated financial statements : None
(3) Changes in significant accounting policies, procedures and presentation in quarterly consolidated
financial statements
Fair Value Measurements Effective April 1, 2008, DOCOMO adopted Statement of Financial Accounting Standards (“SFAS”)
No. 157 “Fair Value Measurements”. SFAS No. 157 defines fair value, establishes a framework for measuring fair value in generally accepted accounting principles and expands disclosures about fair value measurements. Although the definition of fair value retains the exchange price notion in earlier definitions of fair value, SFAS No. 157 clarifies that the exchange price is the price in an orderly transaction between market participants to sell the asset or transfer the liability in the market and emphasizes that fair value is a market-based measurement, rather than an entity-specific measurement. SFAS No. 157 also expands disclosures about the use of fair value to measure assets and liabilities subsequent to initial recognition through fair value hierarchy as a framework for measurement. The initial adoption of SFAS No. 157 did not have a material impact on DOCOMO’s results of operations and financial position. The disclosure required by SFAS No. 157 was omitted in this earnings release.
9

DOCOMO Earnings Release Three Months Ended June 30, 2008
<< 5. Consolidated Financial Statements >>
(1) Consolidated Balance Sheets Millions of yen
(UNAUDITED) June 30, 2008 March 31, 2008
ASSETS Current assets:
Cash and cash equivalents ¥ 487,047 ¥ 646,905 Short-term investments 1,618 52,208 Accounts receivable 724,533 686,673
Allowance for doubtful accounts (15,462) (15,037) Inventories 196,173 146,584 Deferred tax assets 79,928 108,037 Prepaid expenses and other current assets 167,850 142,410
Total current assets 1,641,687 1,767,780 Property, plant and equipment:
Wireless telecommunications equipment 5,391,939 5,346,486 Buildings and structures 800,383 797,904 Tools, furniture and fixtures 536,664 536,718 Land 198,988 198,958 Construction in progress 142,082 128,042 Accumulated depreciation and amortization (4,246,911) (4,173,501)
Total property, plant and equipment, net 2,823,145 2,834,607 Non-current investments and other assets:
Investments in affiliates 329,222 349,488 Marketable securities and other investments 177,997 187,361 Intangible assets, net 554,695 555,259 Goodwill 157,479 158,889 Other assets 255,538 234,047 Deferred tax assets 142,576 123,403
Total non-current investments and other assets 1,617,507 1,608,447 Total assets ¥ 6,082,339 ¥ 6,210,834
LIABILITIES, MINORITY INTERESTS AND SHAREHOLDERS’ EQUITY
Current liabilities: Current portion of long-term debt ¥ 64,346 ¥ 75,662 Short-term borrowings 46 1,712 Accounts payable, trade 631,726 717,453 Accrued payroll 38,790 53,538 Accrued interest 1,211 710 Accrued income taxes 102,208 203,645 Other current liabilities 186,653 181,595
Total current liabilities 1,024,980 1,234,315 Long-term liabilities:
Long-term debt (exclusive of current portion) 461,460 401,090 Liability for employees’ retirement benefits 119,297 116,888 Other long-term liabilities 197,092 180,757
Total long-term liabilities 777,849 698,735 Total liabilities 1,802,829 1,933,050 Minority interests 1,550 1,288 Shareholders’ equity: Common stock 949,680 949,680 Additional paid-in capital 948,571 948,571 Retained earnings 2,865,016 2,793,814 Accumulated other comprehensive income (19,330) 410 Treasury stock, at cost (465,977) (415,979) Total shareholders’ equity 4,277,960 4,276,496 Total liabilities, minority interests and shareholders’ equity ¥ 6,082,339 ¥ 6,210,834
10

DOCOMO Earnings Release Three Months Ended June 30, 2008
(2) Consolidated Statement of Income and Comprehensive Income
Millions of yen (UNAUDITED)
Three months ended June 30, 2008
Operating revenues: Wireless services ¥ 977,464 Equipment sales 192,782 Total operating revenues 1,170,246 Operating expenses: Cost of services (exclusive of items shown separately below) 203,615 Cost of equipment sold (exclusive of items shown separately below) 242,048 Depreciation and amortization 168,480 Selling, general and administrative 259,615 Total operating expenses 873,758 Operating income 296,488 Other income (expense): Interest expense (1,140) Interest income 566 Other, net (7,495) Total other income (expense) (8,069) Income before income taxes 288,419 Income taxes: Current 102,531 Deferred 15,467 Total income taxes 117,998 Equity in net income of affiliates, net of applicable taxes 3,123 Minority interests (35) Net income ¥ 173,509
Other comprehensive income (loss): Unrealized holding losses on available-for-sale securities, net of applicable taxes (950) Net revaluation of financial instruments, net of applicable taxes (18) Foreign currency translation adjustment, net of applicable taxes (18,522) Pension liability adjustment, net of applicable taxes (250) Comprehensive income ¥ 153,769
PER SHARE DATA
Weighted average common shares outstanding – basic and diluted (shares) 42,504,235 Basic and diluted earnings per share (yen) ¥ 4,082.16
11

DOCOMO Earnings Release Three Months Ended June 30, 2008
(3) Consolidated Statement of Cash Flows Millions of yen
(UNAUDITED) Three months ended
June 30, 2008 Cash flows from operating activities:
Net income ¥ 173,509 Adjustments to reconcile net income to net cash provided by operating
activities– Depreciation and amortization 168,480 Deferred taxes 17,673 Loss on sale or disposal of property, plant and equipment 4,718 Equity in net income of affiliates (5,288) Minority interests 35 Changes in assets and liabilities:
(Increase) in accounts receivable (37,828) Increase in allowance for doubtful accounts 421 (Increase) in inventories (49,510) (Increase) in prepaid expenses and other current assets (20,370) (Decrease) in accounts payable, trade (13,272) (Decrease) in accrued income taxes (101,437) Increase in other current liabilities 4,619 Increase in liability for employees’ retirement benefits 2,409 Increase in other long-term liabilities 17,484 Other, net (26,365)
Net cash provided by operating activities 135,278 Cash flows from investing activities:
Purchases of property, plant and equipment (163,740) Purchases of intangible and other assets (72,033) Purchases of non-current investments (1,122) Proceeds from sale of non-current investments 410 Purchases of short-term investments (1,611) Redemption of short-term investments 2,036 Proceeds from redemption of long-term bailment for consumption to a related party 50,000 Other, net (4,386)
Net cash used in investing activities (190,446) Cash flows from financing activities:
Proceeds from long-term debt 79,944 Repayment of long-term debt (27,767) Repayment of short-term borrowings (1,712) Principal payments under capital lease obligations (814) Payments to acquire treasury stock (49,998) Dividends paid (102,307) Other, net (3)
Net cash used in financing activities (102,657) Effect of exchange rate changes on cash and cash equivalents (2,033) Net increase (decrease) in cash and cash equivalents (159,858) Cash and cash equivalents at beginning of period 646,905 Cash and cash equivalents at end of period ¥ 487,047 Supplemental disclosures of cash flow information:
Cash received during the period for: Income taxes ¥ 18
Cash paid during the period for: Interest, net of amount capitalized 638 Income taxes 203,606
12

DOCOMO Earnings Release Three Months Ended June 30, 2008
(4) Going Concern Assumption
None (5) Segment Reporting
Segment information for the three months ended June 30, 2008 was as follows: Millions of yen
Three months ended June 30, 2008
Mobile phone business Miscellaneous businesses Consolidated
Operating revenues ¥ 1,154,771 ¥ 15,475 ¥ 1,170,246 Operating expenses 853,756 20,002 873,758 Operating income (losses) ¥ 301,015 ¥ (4,527) ¥ 296,488 PHS services were terminated on January 7, 2008. DOCOMO does not disclose geographical segments since the amounts of operating revenues generated outside Japan are immaterial.
(6) Significant Changes in Shareholders’ Equity
None
13

DOCOMO Earnings Release Three Months Ended June 30, 2008
(Reference) 1. Consolidated Statement of Income and Comprehensive Income
Millions of yen (UNAUDITED)
Three months ended June 30, 2007
Operating revenues: Wireless services ¥ 1,062,279 Equipment sales 120,585 Total operating revenues 1,182,864 Operating expenses: Cost of services (exclusive of items shown separately below) 184,855 Cost of equipment sold (exclusive of items shown separately below) 315,727 Depreciation and amortization 177,071 Selling, general and administrative 301,330 Total operating expenses 978,983 Operating income 203,881 Other income (expense): Interest expense (1,557) Interest income 455 Other, net 2,687 Total other income (expense) 1,585 Income before income taxes 205,466 Income taxes 82,550 Equity in net losses of affiliates, net of applicable taxes (80) Minority interests (26) Net income ¥ 122,810
Other comprehensive income (loss): Unrealized holding gains on available-for-sale securities, net of applicable taxes 2,068 Net revaluation of financial instruments, net of applicable taxes 20 Foreign currency translation adjustment, net of applicable taxes (602) Pension liability adjustment, net of applicable taxes (182) Comprehensive income ¥ 124,114
PER SHARE DATA
Weighted average common shares outstanding – basic and diluted (shares) 43,469,272 Basic and diluted earnings per share (yen) ¥ 2,825.21
14

DOCOMO Earnings Release Three Months Ended June 30, 2008
(Reference) 2. Consolidated Statement of Cash Flows Millions of yen
(UNAUDITED) Three months ended
June 30, 2007 I Cash flows from operating activities:
1. Net income ¥ 122,810 2. Adjustments to reconcile net income to net cash provided by operating
activities– (1) Depreciation and amortization 177,071 (2) Deferred taxes 3,467 (3) Loss on sale or disposal of property, plant and equipment 5,661 (4) Equity in net losses of affiliates 21 (5) Minority interests 26 (6) Changes in assets and liabilities:
Decrease in accounts receivable 9,941 (Decrease) in allowance for doubtful accounts (168) (Increase) in inventories (22,880) (Increase) in prepaid expenses and other current assets (13,560) Increase in accounts payable, trade 28,963 (Decrease) in accrued income taxes (14,457) Increase in other current liabilities 8,200 Increase in liability for employees’ retirement benefits 1,909 Increase in other long-term liabilities 7,722 Other, net (13,990)
Net cash provided by operating activities 300,736 II Cash flows from investing activities:
1. Purchases of property, plant and equipment (143,705) 2. Purchases of intangible and other assets (80,927) 3. Purchases of non-current investments (31,259) 4. Proceeds from sale and redemption of non-current investments 50,452 5. Purchases of short-term investments (2,416) 6. Redemption of short-term investments 141 7. Proceeds from redemption of long-term bailment for consumption to a related party 50,000 8. Other, net (126)
Net cash used in investing activities (157,840) III Cash flows from financing activities:
1. Repayment of long-term debt (98,200) 2. Proceeds from short-term borrowings 60 3. Repayment of short-term borrowings (52) 4. Principal payments under capital lease obligations (905) 5. Payments to acquire treasury stock (72,998) 6. Dividends paid (87,187) 7. Other, net (2)
Net cash used in financing activities (259,284) IV Effect of exchange rate changes on cash and cash equivalents 292 V Net increase (decrease) in cash and cash equivalents (116,096) VI Cash and cash equivalents at beginning of period 343,062 VII Cash and cash equivalents at end of period ¥ 226,966 Supplemental disclosures of cash flow information:
Cash received during the period for: Income taxes ¥ 6
Cash paid during the period for: Interest, net of amount capitalized 1,169 Income taxes 95,078
15
【Ref.】First Quarter
(Apr.-Jun.2007)Results
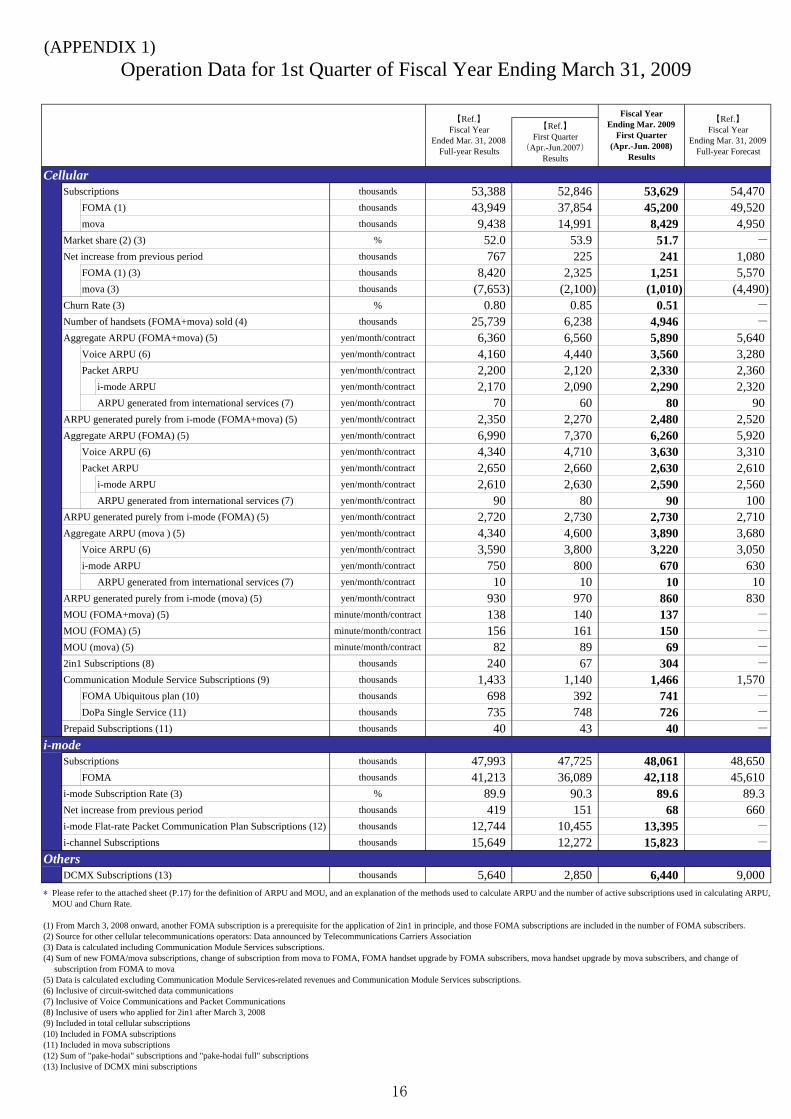
CellularSubscriptions thousands 53,388 52,846 53,629 54,470
FOMA (1) thousands 43,949 37,854 45,200 49,520mova thousands 9,438 14,991 8,429 4,950
Market share (2) (3) % 52.0 53.9 51.7 -
Net increase from previous period thousands 767 225 241 1,080FOMA (1) (3) thousands 8,420 2,325 1,251 5,570mova (3) thousands (7,653) (2,100) (1,010) (4,490)
Churn Rate (3) % 0.80 0.85 0.51 -
Number of handsets (FOMA+mova) sold (4) thousands 25,739 6,238 4,946 -
Aggregate ARPU (FOMA+mova) (5) yen/month/contract 6,360 6,560 5,890 5,640Voice ARPU (6) yen/month/contract 4,160 4,440 3,560 3,280Packet ARPU yen/month/contract 2,200 2,120 2,330 2,360
i-mode ARPU yen/month/contract 2,170 2,090 2,290 2,320ARPU generated from international services (7) yen/month/contract 70 60 80 90
ARPU generated purely from i-mode (FOMA+mova) (5) yen/month/contract 2,350 2,270 2,480 2,520Aggregate ARPU (FOMA) (5) yen/month/contract 6,990 7,370 6,260 5,920
Voice ARPU (6) yen/month/contract 4,340 4,710 3,630 3,310Packet ARPU yen/month/contract 2,650 2,660 2,630 2,610
i-mode ARPU yen/month/contract 2,610 2,630 2,590 2,560ARPU generated from international services (7) yen/month/contract 90 80 90 100
ARPU generated purely from i-mode (FOMA) (5) yen/month/contract 2,720 2,730 2,730 2,710Aggregate ARPU (mova ) (5) yen/month/contract 4,340 4,600 3,890 3,680
Voice ARPU (6) yen/month/contract 3,590 3,800 3,220 3,050i-mode ARPU yen/month/contract 750 800 670 630
ARPU generated from international services (7) yen/month/contract 10 10 10 10ARPU generated purely from i-mode (mova) (5) yen/month/contract 930 970 860 830MOU (FOMA+mova) (5) minute/month/contract 138 140 137 -
MOU (FOMA) (5) minute/month/contract 156 161 150 -
MOU (mova) (5) minute/month/contract 82 89 69 -
2in1 Subscriptions (8) thousands 240 67 304 -
Communication Module Service Subscriptions (9) thousands 1,433 1,140 1,466 1,570FOMA Ubiquitous plan (10) thousands 698 392 741 -
DoPa Single Service (11) thousands 735 748 726 -
Prepaid Subscriptions (11) thousands 40 43 40 -
i-modeSubscriptions thousands 47,993 47,725 48,061 48,650
FOMA thousands 41,213 36,089 42,118 45,610i-mode Subscription Rate (3) % 89.9 90.3 89.6 89.3Net increase from previous period thousands 419 151 68 660i-mode Flat-rate Packet Communication Plan Subscriptions (12) thousands 12,744 10,455 13,395 -
i-channel Subscriptions thousands 15,649 12,272 15,823 -
Others DCMX Subscriptions (13) thousands 5,640 2,850 6,440 9,000
Operation Data for 1st Quarter of Fiscal Year Ending March 31, 2009
【Ref.】Fiscal Year
Ending Mar. 31, 2009Full-year Forecast
【Ref.】Fiscal Year
Ended Mar. 31, 2008Full-year Results
Fiscal YearEnding Mar. 2009
First Quarter(Apr.-Jun. 2008)
Results
* Please refer to the attached sheet (P.17) for the definition of ARPU and MOU, and an explanation of the methods used to calculate ARPU and the number of active subscriptions used in calculating ARPU, MOU and Churn Rate.
(1) From March 3, 2008 onward, another FOMA subscription is a prerequisite for the application of 2in1 in principle, and those FOMA subscriptions are included in the number of FOMA subscribers.(2) Source for other cellular telecommunications operators: Data announced by Telecommunications Carriers Association(3) Data is calculated including Communication Module Services subscriptions.(4) Sum of new FOMA/mova subscriptions, change of subscription from mova to FOMA, FOMA handset upgrade by FOMA subscribers, mova handset upgrade by mova subscribers, and change of subscription from FOMA to mova(5) Data is calculated excluding Communication Module Services-related revenues and Communication Module Services subscriptions.(6) Inclusive of circuit-switched data communications(7) Inclusive of Voice Communications and Packet Communications(8) Inclusive of users who applied for 2in1 after March 3, 2008(9) Included in total cellular subscriptions(10) Included in FOMA subscriptions(11) Included in mova subscriptions(12) Sum of "pake-hodai" subscriptions and "pake-hodai full" subscriptions(13) Inclusive of DCMX mini subscriptions
(APPENDIX 1)
16
(APPENDIX 2)
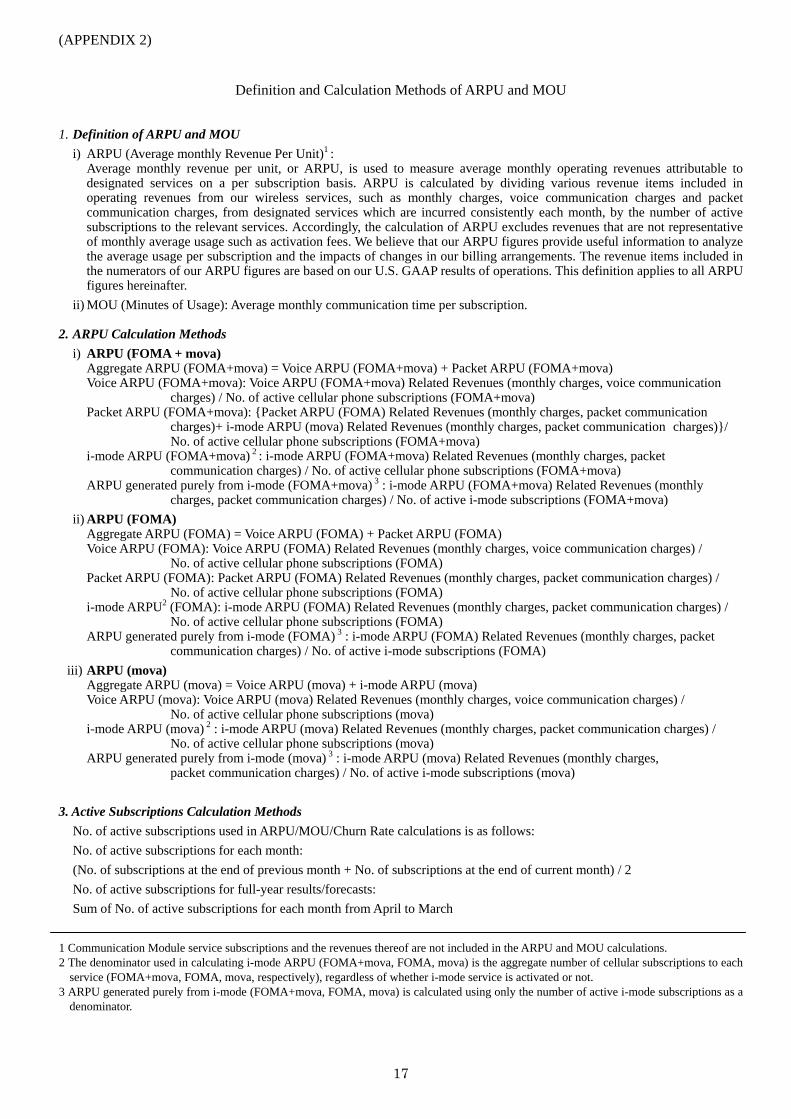
Definition and Calculation Methods of ARPU and MOU 1. Definition of ARPU and MOU
i) ARPU (Average monthly Revenue Per Unit)1 : Average monthly revenue per unit, or ARPU, is used to measure average monthly operating revenues attributable to designated services on a per subscription basis. ARPU is calculated by dividing various revenue items included in operating revenues from our wireless services, such as monthly charges, voice communication charges and packet communication charges, from designated services which are incurred consistently each month, by the number of active subscriptions to the relevant services. Accordingly, the calculation of ARPU excludes revenues that are not representative of monthly average usage such as activation fees. We believe that our ARPU figures provide useful information to analyze the average usage per subscription and the impacts of changes in our billing arrangements. The revenue items included in the numerators of our ARPU figures are based on our U.S. GAAP results of operations. This definition applies to all ARPU figures hereinafter.
ii) MOU (Minutes of Usage): Average monthly communication time per subscription. 2. ARPU Calculation Methods
i) ARPU (FOMA + mova) Aggregate ARPU (FOMA+mova) = Voice ARPU (FOMA+mova) + Packet ARPU (FOMA+mova) Voice ARPU (FOMA+mova): Voice ARPU (FOMA+mova) Related Revenues (monthly charges, voice communication charges) / No. of active cellular phone subscriptions (FOMA+mova) Packet ARPU (FOMA+mova): {Packet ARPU (FOMA) Related Revenues (monthly charges, packet communication charges)+ i-mode ARPU (mova) Related Revenues (monthly charges, packet communication charges)}/ No. of active cellular phone subscriptions (FOMA+mova) i-mode ARPU (FOMA+mova) 2 : i-mode ARPU (FOMA+mova) Related Revenues (monthly charges, packet
communication charges) / No. of active cellular phone subscriptions (FOMA+mova) ARPU generated purely from i-mode (FOMA+mova) 3 : i-mode ARPU (FOMA+mova) Related Revenues (monthly charges, packet communication charges) / No. of active i-mode subscriptions (FOMA+mova)
ii) ARPU (FOMA) Aggregate ARPU (FOMA) = Voice ARPU (FOMA) + Packet ARPU (FOMA) Voice ARPU (FOMA): Voice ARPU (FOMA) Related Revenues (monthly charges, voice communication charges) /
No. of active cellular phone subscriptions (FOMA) Packet ARPU (FOMA): Packet ARPU (FOMA) Related Revenues (monthly charges, packet communication charges) /
No. of active cellular phone subscriptions (FOMA) i-mode ARPU2 (FOMA): i-mode ARPU (FOMA) Related Revenues (monthly charges, packet communication charges) /
No. of active cellular phone subscriptions (FOMA) ARPU generated purely from i-mode (FOMA) 3 : i-mode ARPU (FOMA) Related Revenues (monthly charges, packet communication charges) / No. of active i-mode subscriptions (FOMA)
iii) ARPU (mova) Aggregate ARPU (mova) = Voice ARPU (mova) + i-mode ARPU (mova) Voice ARPU (mova): Voice ARPU (mova) Related Revenues (monthly charges, voice communication charges) / No. of active cellular phone subscriptions (mova) i-mode ARPU (mova) 2 : i-mode ARPU (mova) Related Revenues (monthly charges, packet communication charges) / No. of active cellular phone subscriptions (mova) ARPU generated purely from i-mode (mova) 3 : i-mode ARPU (mova) Related Revenues (monthly charges, packet communication charges) / No. of active i-mode subscriptions (mova)
3. Active Subscriptions Calculation Methods
No. of active subscriptions used in ARPU/MOU/Churn Rate calculations is as follows: No. of active subscriptions for each month: (No. of subscriptions at the end of previous month + No. of subscriptions at the end of current month) / 2 No. of active subscriptions for full-year results/forecasts: Sum of No. of active subscriptions for each month from April to March
1 Communication Module service subscriptions and the revenues thereof are not included in the ARPU and MOU calculations. 2 The denominator used in calculating i-mode ARPU (FOMA+mova, FOMA, mova) is the aggregate number of cellular subscriptions to each
service (FOMA+mova, FOMA, mova, respectively), regardless of whether i-mode service is activated or not. 3 ARPU generated purely from i-mode (FOMA+mova, FOMA, mova) is calculated using only the number of active i-mode subscriptions as a
denominator.
17
(APPENDIX 3)
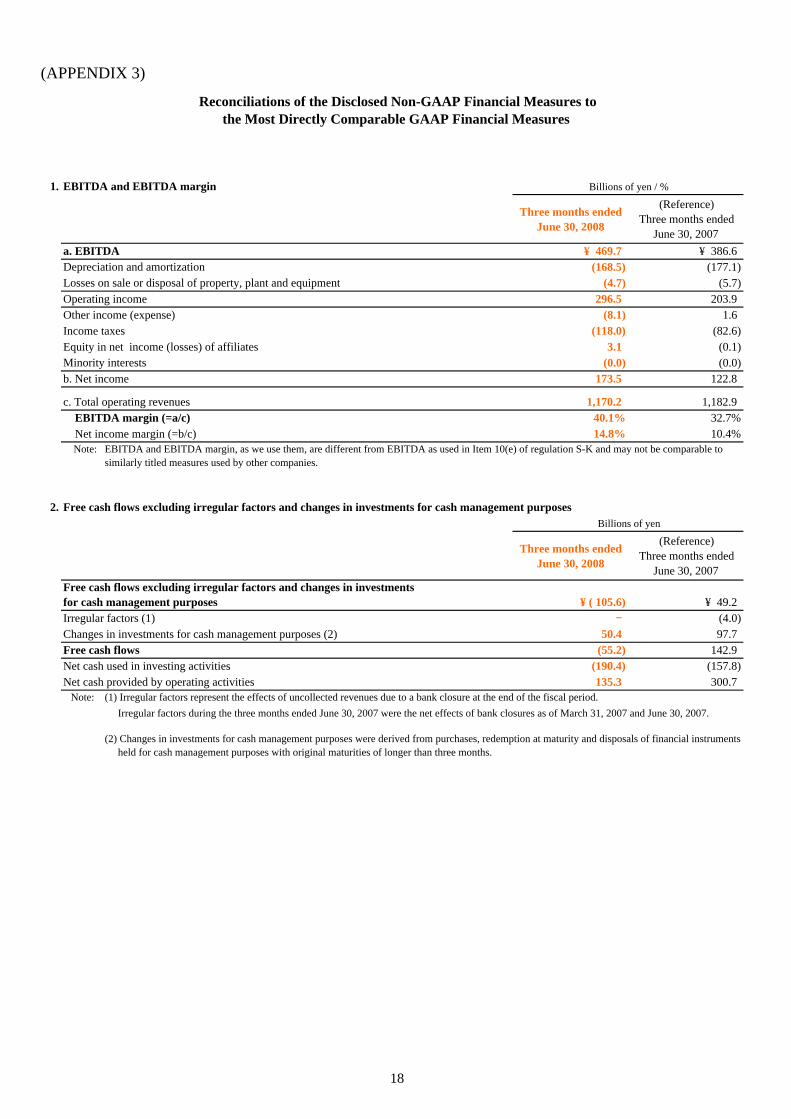
1. EBITDA and EBITDA margin Billions of yen / %
Three months endedJune 30, 2008
(Reference)Three months ended
June 30, 2007a. EBITDA ¥ 469.7 ¥ 386.6
(168.5) (177.1)(4.7) (5.7)
296.5 203.9(8.1) 1.6
(118.0) (82.6)3.1 (0.1)
(0.0) (0.0)173.5 122.8
1,170.2 1,182.940.1% 32.7%14.8% 10.4%
Note:
2. Free cash flows excluding irregular factors and changes in investments for cash management purposesBillions of yen
Three months endedJune 30, 2008
(Reference)Three months ended
June 30, 2007
¥ ( 105.6) ¥ 49.2- (4.0)
50.4 97.7(55.2) 142.9
(190.4) (157.8)135.3 300.7
Note: (1) Irregular factors represent the effects of uncollected revenues due to a bank closure at the end of the fiscal period.
Changes in investments for cash management purposes (2)Free cash flowsNet cash used in investing activitiesNet cash provided by operating activities
Free cash flows excluding irregular factors and changes in investmentsfor cash management purposes
Net income margin (=b/c)EBITDA and EBITDA margin, as we use them, are different from EBITDA as used in Item 10(e) of regulation S-K and may not be comparable tosimilarly titled measures used by other companies.
Minority interestsb. Net income
c. Total operating revenues EBITDA margin (=a/c)
Irregular factors during the three months ended June 30, 2007 were the net effects of bank closures as of March 31, 2007 and June 30, 2007.
(2) Changes in investments for cash management purposes were derived from purchases, redemption at maturity and disposals of financial instruments held for cash management purposes with original maturities of longer than three months.
Irregular factors (1)
Reconciliations of the Disclosed Non-GAAP Financial Measures to the Most Directly Comparable GAAP Financial Measures
Depreciation and amortizationLosses on sale or disposal of property, plant and equipmentOperating incomeOther income (expense)Income taxesEquity in net income (losses) of affiliates
18

DOCOMO Earnings Release Three Months Ended June 30, 2008
Special Note Regarding Forward-Looking Statements This Earnings Release contains forward-looking statements such as forecasts of results of operations,
management strategies, objectives and plans, forecasts of operational data such as expected number of subscribers, and expected dividend payments. All forward-looking statements that are not historical facts are based on management’s current plans, expectations, assumptions and estimates based on the information currently available. Some of the projected numbers in this report were derived using certain assumptions that are indispensable for making such projections in addition to historical facts. These forward-looking statements are subject to various known and unknown risks, uncertainties and other factors that could cause our actual results to differ materially from those contained in or suggested by any forward-looking statement. Potential risks and uncertainties include, without limitation, the following:
1. As competition in the market becomes more fierce due to changes in the business environment caused by
Mobile Number Portability, new market entrants, competition from other cellular service providers or other technologies, and other factors, could limit our acquisition of new subscribers, retention of existing subscribers, or may lead to diminishing ARPU or an increase in our costs and expenses.
2. Current and new services, usage patterns, and sales schemes introduced by our corporate group may not develop as planned, which could affect our financial condition and limit our growth.
3. The introduction or change of various laws or regulations or the application of such laws and regulations to our corporate group could restrict our business operations, which may adversely affect our financial condition and results of operations.
4. Limitations in the amount of frequency spectrum or facilities made available to us could negatively affect our ability to maintain and improve our service quality and level of customer satisfaction.
5. The W-CDMA technology that we use for our 3G system and/or mobile multimedia services may not be introduced by other overseas operators, which could limit our ability to offer international services to our subscribers.
6. Our domestic and international investments, alliances and collaborations may not produce the returns or provide the opportunities we expect.
7. As electronic payment capability and many other new features are built into our cellular phones, and services of parties other than those belonging to our corporate group are provided through our cellular handsets, potential problems resulting from malfunctions, defects or loss of handsets, or imperfection of services provided by such other parties may arise, which could have an adverse effect on our financial condition and results of operations.
8. Social problems that could be caused by misuse or misunderstanding of our products and services may adversely affect our credibility or corporate image.
9. Inadequate handling of confidential business information including personal information by our corporate group, contractors and other factors, may adversely affect our credibility or corporate image.
10. Owners of intellectual property rights that are essential for our business execution may not grant us the right to license or otherwise use such intellectual property rights on acceptable terms or at all, which may limit our ability to offer certain technologies, products and/or services, and we may also be held liable for damage compensation if we infringe the intellectual property rights of others.
11. Earthquakes, power shortages, malfunctioning of equipment, software bugs, computer viruses, cyber attacks, hacking, unauthorized access and other problems could cause systems failures in the networks required for the provision of service, disrupting our ability to offer services to our subscribers and may adversely affect our credibility or corporate image.
12. Concerns about wireless telecommunications health risks may adversely affect our financial condition and results of operations.
13. Our parent company, Nippon Telegraph and Telephone Corporation (NTT), could exercise influence that may not be in the interests of our other shareholders
19