financial statements - reckitt
TRANSCRIPT

142 Reckitt Benckiser Group plc (RB) Annual Report and Financial Statements 2019
FINANCIALSTATEMENTS
Contents of Financial Statements143 Independent Auditor’s Report152 Financial Statements212 Subsidiary Undertakings223 Shareholder Information

S T R AT E G I C R E P O R T G O V E R N A N C E F I N A N C I A L S TAT E M E N T S
143Reckitt Benckiser Group plc (RB) Annual Report and Financial Statements 2019
I N D E P E N D E N T AU D I TO R ’ S R E P O R TTO T H E M E M B E R S O F R EC K I T T B E N C K I S E R G RO U P P LC
1 Our opinion is unmodified We have audited the Financial Statements of Reckitt Benckiser Group plc (the “Parent Company”) and its subsidiaries (together the “Group”) for the year ended 31 December 2019 which comprise the Group Income Statement, Group Statement of Comprehensive Income, Group Balance Sheet, Group Statement of Changes in Equity, Group Cash Flow Statement, and the related Notes, including the accounting policies in Note 1 to the Financial Statements, and the Parent Company Balance Sheet, Parent Company Statement of Changes in Equity and the related Notes, including the accounting policies in Note 1 to the Parent Company Financial Statements.
In our opinion:
• the Financial Statements give a true and fair view of the state of the Group’s and of the Parent Company’s affairs as at 31 December 2019 and of the Group’s loss for the year then ended;
• the Group Financial Statements have been properly prepared in accordance with International Financial Reporting Standards as adopted by the European Union (“IFRS as adopted by the EU”);
• the Parent Company Financial Statements have been properly prepared in accordance with UK accounting standards, including FRS 102 The Financial Reporting Standard applicable in the UK and Republic of Ireland; and
• the Financial Statements have been prepared in accordance with the requirements of the Companies Act 2006 and, as regards the Group Financial Statements, Article 4 of the IAS Regulation.
Additional opinion in relation to IFRS as issued by the IASB: As explained in Note 1 to the Group Financial Statements, in addition to complying with its legal obligation to apply IFRS as adopted by the EU, the Group has also applied IFRS as issued by the International Accounting Standards Board (“IASB”).
In our opinion the Group Financial Statements have been properly prepared in accordance with IFRS as issued by the IASB.
Basis for opinionWe conducted our audit in accordance with International Standards on Auditing (UK) (“ISAs (UK)”) and applicable law. Our responsibilities are described below. We believe that the audit evidence we have obtained is a sufficient and appropriate basis for our opinion. Our audit opinion is consistent with our report to the Audit Committee.
We were first appointed as auditor by the Shareholders on 3 May 2018. The period of total uninterrupted engagement is for the two financial years ended 31 December 2019. We have fulfilled our ethical responsibilities under, and we remain independent of the Group in accordance with, UK ethical requirements including the FRC Ethical Standard as applied to listed public interest entities. No non-audit services prohibited by that standard were provided.
Overview
Materiality: Group Financial Statements as a whole
£150 million (2018: £140 million) 4.8% (2018: 4.6%) of Group loss before tax normalised to exclude exceptional adjusting items as disclosed in Note 3
Coverage 81% (2018: 82%) of Group Net Revenue 87% (2018: 77%) of total profits and losses that made up Group loss before tax
vs 2018
Recurring risks Recoverability of goodwill and indefinite life intangible assets relating to Infant and Child Nutrition (“IFCN”)
Provision for uncertain tax positions
Revenue recognition in relation to trade spend
Recoverability of Parent Company’s investment in subsidiaries

144 Reckitt Benckiser Group plc (RB) Annual Report and Financial Statements 2019
2 Key audit matters: our assessment of risks of material misstatement Key audit matters are those matters that, in our professional judgement, were of most significance in the audit of the Financial Statements and include the most significant assessed risks of material misstatement (whether or not due to fraud) identified by us, including those which had the greatest effect on: the overall audit strategy; the allocation of resources in the audit; and directing the efforts of the engagement team. We summarise below the key audit matters, in decreasing order of audit significance, in arriving at our audit opinion above, together with our key audit procedures to address those matters and, as required for public interest entities, our results from those procedures. These matters were addressed, and our results are based on procedures undertaken, in the context of, and solely for the purpose of, our audit of the Financial Statements as a whole, and in forming our opinion thereon, and consequently are incidental to that opinion, and we do not provide a separate opinion on these matters.
The risk Our response
Recoverability of goodwill and indefinite life intangible assets relating to IFCN
(£10,913 million; 2018: £16,407 million)
Refer to page 108 (Audit Committee Report), Note 1 on page 159 (accounting policy) and Note 9 on pages 172 to 175 (financial disclosures).
Forecast-based valuation:
The recoverability of goodwill and indefinite life intangible assets relating to the Infant and Child Nutrition (“IFCN”) cash generating unit (“CGU”) is assessed using forecast financial information within a discounted cash flow model (“the model”).
The model is highly sensitive to changes in key assumptions, relating to forecast financial performance, in particular Net Revenue growth and operating margins, as well as external factors such as future growth of the category as a whole, discount rates and terminal growth rates.
In the current year the Group has recognised an impairment loss of £5,037 million against IFCN goodwill. This primarily reflects:
• the accelerated deterioration in birth rates and GDP growth in China, a significant IFCN market;
• increased competition from domestic Chinese companies, driven by regulation and changing consumer tastes; and
• increased competitive pricing in bidding for The Special Supplemental Nutrition Program for Women, Infants and Children (known as “WIC”) state contracts in the USA, a significant IFCN market.
The valuation of the IFCN CGU – and consequent impairment loss – is subject to a high degree of estimation uncertainty.
Where a substantial impairment must be recognised, there may be incentive for the Group to use assumptions that are excessively cautious, leading to an overstatement of the impairment. Conversely, if assumptions are over-optimistic, the impairment loss may be understated.
Our procedures included:
Methodology implementation: With the assistance of our own modelling specialists, we critically assessed the interaction of key assumptions and drivers within the model to ensure that the output calculated as intended, and that the methodology behind the calculation was reasonable.
Sensitivity analysis: We considered the sensitivity of each assumption, identified changes to these assumptions since previous forecasts, and focused our attention on those assumptions we considered to be most sensitive, judgemental or otherwise prone to management bias.
Historical comparisons:
• We compared the performance of IFCN since acquisition against plan and evaluated this in relation to forecast growth.
• We challenged the Group on the integrity of the Group’s innovation pipeline, and its ability to deliver forecast Net Revenue growth by assessing the Group’s past experience in bringing new or improved products to market, and evaluated how that experience can be applied to the IFCN product category.
• We critically challenged the operating margin projections by reference to those achieved historically, forecast volume growth and with reference to the marketing and R&D spend required to deliver forecast Net Revenue growth.
Benchmarking assumptions:
• We critically evaluated the delta between Net Revenue growth assumptions within the model and external market data relating to projected growth for the product category as a whole. For China in particular, we considered the extent to which category growth assumptions reflected the latest sentiment on birth rates, GDP growth, and the rise of domestic competitors.
• We benchmarked Gross Margin assumptions against industry competitors, and external market volume growth forecasts. We also benchmarked the terminal growth rate assumptions against long-term estimates of GDP growth and inflation in key markets, and considered the appropriateness of real growth in light of global declining birth rates.
I N D E P E N D E N T AU D I TO R ’ S R E P O R TTO T H E M E M B E R S O F R EC K I T T B E N C K I S E R G RO U P P LC
CO N T I N U ED

S T R AT E G I C R E P O R T G O V E R N A N C E F I N A N C I A L S TAT E M E N T S
145Reckitt Benckiser Group plc (RB) Annual Report and Financial Statements 2019
The risk Our response
Recoverability of goodwill and indefinite life intangible assets relating to IFCN (continued)
The effect of these matters is that, as part of our risk assessment, we determined that there exists a reasonably possible set of changes in these key assumptions that would result in a change to the IFCN valuation and associated impairment loss well in excess of our materiality for the Financial Statements as a whole and possibly many times that amount.
It is also important that disclosures give relevant information and reflect uncertainties inherent in the impairment assessment and its outcome.
Personnel interviews: We compared judgements made centrally to direct discussion with local country General Managers and Finance Directors. We considered and challenged the Group’s assumptions with reference to alternative views provided locally.
Extended scope: We responded to the risk of management bias through enhanced market benchmarking, increased professional scepticism where market and internal forecasts deviated, and extending the scope of our valuation specialists to assist in the challenge of key country cash flow assumptions.
Our valuation expertise: We independently derived a reasonable range of appropriate discount rates with the assistance of our valuation specialists, compared these to those calculated by the Group and identified any differences in assumptions between the calculations. We challenged the Group on any such differences and assessed the discount rate in relation to our appropriate range and those utilised in previous valuations.
Assessing transparency: We considered the adequacy of the disclosures provided by Note 9 of the Group Financial Statements in relation to relevant accounting standards. We paid particular attention to transparency of disclosure of the events and circumstances that led to the recognition of the impairment loss in 2019, and ensuring the sensitivity disclosures appropriately reflect uncertainty inherent in the assessment of recoverable amount, as well as reasonably plausible changes in key assumptions. This included assessing whether reasonable possible outcomes that could have resulted in a lower impairment were made clear.
Our results We found the resulting estimate of the carrying value of goodwill and indefinite life intangible assets after recording the impairment loss in the current year to be acceptable (2018 result: acceptable) and the disclosures, including the reasonable possible outcomes, to be acceptable (2018: acceptable).
2 Key audit matters: our assessment of risks of material misstatement continued

146 Reckitt Benckiser Group plc (RB) Annual Report and Financial Statements 2019
The risk Our response
Provision for uncertain tax positions (UTPs)
(£891 million; 2018: £1,002 million)
Refer to page 108 (Audit Committee Report), Note 1 on page 159 (accounting policy) and Note 21 on page 190 (financial disclosures).
Subjective estimate:
Due to the Group operating across a number of different tax jurisdictions, and the complexities of transfer pricing and other international tax legislation, it is subject to periodic challenge by local tax authorities on a range of tax matters arising in the normal course of business.
These challenges by the local tax authorities include but are not limited to:
• transfer pricing arrangements relating to the Group’s operating model;
• transfer pricing arrangements relating to the ownership of intellectual property rights that are used across the Group;
• deductibility of interest on intra-Group borrowings; and
• the European Commission’s ongoing State Aid investigations into transfer pricing ruling practices of certain member states.
Provision for uncertain tax positions requires the Directors to make judgements and estimates in relation to tax issues and exposures.
The effect of these matters is that, as part of our risk assessment, we determined that the estimates of uncertain tax positions has a high degree of estimation uncertainty, with a potential range of reasonable outcomes greater than our materiality for the Financial Statements as a whole.
Our procedures included:
Our tax expertise: We used our own international and local tax specialists to assist us to:
• Inspect and assess the centrally prepared transfer pricing policies to determine whether they reflect the risks, activities and substance of each of the entities within the supply chain; and
• Assess the Group’s tax positions, its correspondence with the relevant tax authorities, and to analyse and challenge the assumptions used to determine provisions for tax uncertainties based on our knowledge and experiences of the application of the tax legislation.
Historical comparisons: We assessed the historical accuracy of the provision level following any recent court judgements and results of relevant tax authority audits and considered the impact on the remaining provision.
Assessing transparency: We assessed the adequacy of the Group’s disclosures in respect of uncertain tax positions.
Our resultsWe found the level of tax provisioning to be acceptable (2018 result: acceptable).
2 Key audit matters: our assessment of risks of material misstatement continued
I N D E P E N D E N T AU D I TO R ’ S R E P O R TTO T H E M E M B E R S O F R EC K I T T B E N C K I S E R G RO U P P LC
CO N T I N U ED

S T R AT E G I C R E P O R T G O V E R N A N C E F I N A N C I A L S TAT E M E N T S
147Reckitt Benckiser Group plc (RB) Annual Report and Financial Statements 2019
The risk Our response
Revenue recognition in relation to trade spend
Net Revenue (12,846 million; 2018: 12,597 million) Trade spend accrual (£1,095 million; 2018: £1,025 million)
Refer to page 108 (Audit Committee Report), Note 1 on page 159 (accounting policy) and Note 20 on page 190 (financial disclosures).
Subjective estimate:
The Group regularly enters into complex arrangements providing pricing, placement and other promotional rebates and allowances to its customers. These trade spend arrangements can vary in complexity by market, product category and customer. Revenue is measured net of outflows arising from such arrangements which – for agreements or practices spanning a period end – requires an estimate of the extent and value of future activity. These estimates can be subjective and require the use of assumptions that are susceptible to management bias.
The effect of these matters is that, as part of our risk assessment, we determined that the estimation of trade spend accruals has a high degree of estimation uncertainty, with a potential range of reasonable outcomes greater than our materiality for the Financial Statements as a whole.
Our procedures included:
Accounting policies: We assessed the appropriateness of the Group’s revenue recognition accounting policies, including the recognition criteria for trade spend. Tests of detail: For both risk-based and representative samples of trade spend accruals, we:
• recalculated the estimate to assess whether it was mathematically accurate;
• identified the key assumptions in the calculation of each accrual selected, such as forecast volumes;
• agreed those assumptions to relevant documentation, such as invoices received after the balance sheet date, customer agreements or third-party consumption data; and
• considered whether the assumptions utilised were acceptable within the context of relevant external data points and the Group’s historic experience of comparable trade spend arrangements.
Tests of detail: We tested the completeness of trade spend accruals by identifying promotional activity in the subsequent financial period and assessed whether these required an accrual at the Balance Sheet date.
Assessing transparency: We assessed the adequacy of the Group’s disclosures in relation to the degree of estimation involved in arriving at the trade spend accrual and the amount of trade spend recognised.
Our resultsWe found the trade spend accrual and related Net Revenue recognised to be acceptable (2018 result: acceptable).
Recoverability of Parent Company’s investment in subsidiaries
(£14,963 million, 2018: £14,949 million)
Note 1 on page 207 (accounting policy) and Note 2 on page 209 (financial disclosures).
Low risk, high value:
The carrying amount of the Parent Company’s investment in subsidiaries represents 99.7% (2018: 99.7%) of the Parent Company’s total assets. Its recoverability is not at a high risk of significant misstatement or subject to significant judgement. However, due to its materiality in the context of the Parent Company Financial Statements, this is considered to be the area that had the greatest effect on our overall Parent Company audit.
Our procedures included:
Tests of detail: We compared the carrying amount of 100% of the total investment balance with the direct subsidiary draft balance sheet to identify whether their net assets, being an approximation of their minimum recoverable amount, were in excess of their carrying amount and assessing whether the direct subsidiary has historically been profit-making.
Comparing valuations: We performed a reconciliation to market capitalisation, as the subsidiary owns the entire Group excluding its parent.
Our resultsWe found the assessment of the Parent Company’s recoverability of the investment in subsidiaries to be acceptable (2018 result: acceptable).
We continue to perform procedures over liabilities and contingent liabilities arising from investigations by the US Department of Justice (DoJ) and in respect to the South Korea Humidifier Sanitiser (HS) issue. However, following settlement with the DoJ during the year and payments made in relation to the HS issue, we have not assessed this as one of the most significant risks in our current year audit and, therefore, it is not separately identified in our report this year as a key audit matter.
2 Key audit matters: our assessment of risks of material misstatement continued

Group loss before tax normalised to exclude exceptional adjusting items £3,133m (2018: £3,033 million)
Group materiality£150 million (2018: £140 million)
£150 millionWhole �nancial statements materiality(2018: £140 million)
£50 millionRange of materiality at 54 components (£7.5 million – £50 million)(2018: £7.5 million to £75 million)
£7.5 millionMisstatements reported to the audit committee (2018: 7 million)
Group loss before tax normalised to exclude exceptional adjusting items
Group materiality
Full scope for Group audit purposes 2019
81%(2018: 82%)
19%
18%
79%
81% 72%
4%
23%
1%
Group net revenue
Group total assets
Key:
Speci�ed risk-focused procedures 2019
2%1%
14%
10%
85%
88%
1%
1%1%
87%(2018: 77%)
13%
86%
1%
86%(2018: 90%)
Full scope for Group audit purposes 2018
Speci�ed risk-focused procedures 2018
Audit of account balances 2018
Residual components 2018
Residual components 2019
Group pro�ts and losses that made up Group loss before tax
148 Reckitt Benckiser Group plc (RB) Annual Report and Financial Statements 2019
2 Key audit matters: our assessment of risks of material misstatement continuedLikewise, we also continue to perform procedures over the classification of exceptional items. However, with RB2.0 having broadly concluded in 2019 we have not assessed this as one of the most significant risks in our current year audit and, therefore, it is not separately identified in our report this year as a key audit matter.
3 Our application of materiality and an overview of the scope of our audit MaterialityMateriality for the Group Financial Statements as a whole was set at £150 million (2018: £140 million), determined with reference to a benchmark of Group loss before tax normalised to exclude this year’s exceptional adjusting items of £5,240 million as disclosed in Note 3 to an adjusted profit of £3,133 million (2018: Group profit before tax normalised to exclude exceptional and other adjusting items of £311 million to an adjusted profit of £3,033 million) as defined in Note 3, of which it represents 4.8% (2018: 4.6%). The Group team performed procedures on the items excluded from normalised Group loss before tax.
Materiality for the Parent Company Financial Statements as a whole was set at £75 million (2018: £75 million) determined with reference to a benchmark of Parent Company total assets of £15,011 million (2018: £14,997 million) of which it represents 0.5% (2018: 0.5%).
We agreed with the Audit Committee that we would report to the committee any corrected or uncorrected identified misstatements exceeding £7.5 million (2018: £7.0 million) in addition to other identified misstatements that warranted, in our view, reporting on qualitative grounds. We also report to the Audit Committee on disclosure matters that are identified when assessing the overall presentation of the Financial Statements.
ScopeThe Group operates in more than 60 countries across six continents with the largest footprint being in the US and China, and from 1 January 2018 the Group has been organised into two business units being Health and Hygiene Home.
We scoped the audit by obtaining an understanding of the Group and its environment and assessing the risk of material misstatement at the Group and component level. We have considered components on the basis of their contribution to Group revenue and Group loss before tax including whether we had sufficient coverage over each business unit and the specific risks in the components. Of the Group’s 388 (2018: 368) reporting components, component teams in 22 countries (2018: 23 countries) subjected 44 (2018: 44) to full scope audits for Group purposes and 10 (2018: 3) to specified risk-focused audit procedures including procedures over revenue, trade spend, inventory, cost of sales, PPE, and cash and none (2018: 1) to an audit of account balance over inventory, cost of sales, PPE and cash. The components for which we specified risk-focused audit procedures (2018: and audit of account balance) were not individually financially significant enough to require an audit for Group reporting purposes, but did present specific individual risks that needed to be addressed.
I N D E P E N D E N T AU D I TO R ’ S R E P O R TTO T H E M E M B E R S O F R EC K I T T B E N C K I S E R G RO U P P LC
CO N T I N U ED

S T R AT E G I C R E P O R T G O V E R N A N C E F I N A N C I A L S TAT E M E N T S
149Reckitt Benckiser Group plc (RB) Annual Report and Financial Statements 2019
3 Our application of materiality and an overview of the scope of our audit continuedThe remaining 19% (2018: 18%) of Group revenue, 13% (2018: 23%) of total profits and losses that made up Group loss before tax and 14% (2018: 10%) of Group total assets is represented by a number of other reporting components, none of which individually represented more than 2% (2018: 1%) of any of Group Net Revenue, Group profit or loss before tax or Group total assets. For these residual 334 (2018: 320) components, we performed analysis at an aggregated Group level and performed unpredictable procedures at the component level to re-examine our assessment that there were no significant risks of material misstatement within these.
Team StructureThe Group team led a global planning conference to discuss key audit risks and to obtain input from component and other participating locations.
The Group team instructed component auditors as to the significant areas to be covered, including the relevant risks detailed above and the information to be reported back. The Group team reviewed and approved the component materialities, which ranged from £7.5 million to £50 million (2018: £7.5 million to £75 million), having regard to the mix of size and risk profile across the components.
The work on 51 of the 54 (2018: 45 of the 48) components in scope was performed by component auditors and the rest, including the audit of the Group’s treasury company, were performed by the Group team.
The Senior Statutory Auditor or a senior member of the Group team visited 19 (2018: 21) countries, representing 50 (2018: 46) reporting components of the 54 (2018: 48) in scope for Group reporting purposes. The visits included assessing the audit risk and strategy and attending a balance sheet review with Group and/or business unit management, local management and component auditors. Video and telephone conference meetings were also held with these component auditors and 3 that were not physically visited throughout the conduct of the audit. This included attending the year end clearance meetings. At these visits and meetings, the findings reported to the Group team were discussed in more detail. In addition we reviewed the component auditors’ key working papers, including assessing the trade spend risk identified against the procedures performed, and any further work required by the Group team was then performed by the component auditor.
We attended via site visit or telephone calls balance sheet review meetings for 4 (2018: 6) components not in scope for the Group audit as part of our unpredictable procedures, to reconfirm our risk assessment and to further enhance our understanding of the business.
The Group team routinely reviews the audit documentation of all component audits. Following the outbreak of COVID-19, we were unable to visit 4 components in China and for which remote access to audit documentation is prohibited. We instead extended our oversight of those component teams through extended telephone discussions over the audit procedures performed.
4 We have nothing to report on going concern The Directors have prepared the Financial Statements on the going concern basis as they do not intend to liquidate the Parent Company or the Group or to cease their operations, and as they have concluded
that the Parent Company’s and the Group’s financial position means that this is realistic. They have also concluded that there are no material uncertainties that could have cast significant doubt over their ability to continue as a going concern for at least a year from the date of approval of the Financial Statements (“the going concern period”).
Our responsibility is to conclude on the appropriateness of the Directors’ conclusions and, had there been a material uncertainty related to going concern, to make reference to that in this audit report. However, as we cannot predict all future events or conditions and as subsequent events may result in outcomes that are inconsistent with judgements that were reasonable at the time they were made, the absence of reference to a material uncertainty in this auditor’s report is not a guarantee that the Group and the Parent Company will continue in operation.
In our evaluation of the Directors’ conclusions, we considered the inherent risks to the Group’s and the Parent Company’s business model and analysed how those risks might affect the Group’s and the Parent Company’s financial resources or ability to continue operations over the going concern period.
The risks that we considered most likely to adversely affect the Group’s and the Parent Company’s available financial resources over this period were:
• In relation to the COVID-19 pandemic, disruption at one or more of the Group’s key production facilities, the viability of key suppliers and customers, and the impact on consumer demand for the Group’s brands;
• A product safety issue leading to reputational damage with customers, consumers or regulators; and
• The impact of a significant business continuity issue affecting the Group’s manufacturing facilities or those of its suppliers.
As these were risks that could potentially cast significant doubt on the Group’s and the Parent Company’s ability to continue as a going concern, we considered sensitivities over the level of available financial resources indicated by the Group’s financial forecasts taking account of reasonably possible (but not unrealistic) adverse effects that could arise from these risks individually and collectively and evaluated the achievability of the actions the Directors consider they would take to improve the position should the risks materialise. We also considered less predictable but realistic second order impacts, such as erosion of customer or supplier confidence or a cyber-security attack, which could result in a rapid reduction of available financial resources.
Based on this work, we are required to report to you if:
• we have anything material to add or draw attention to in relation to the directors’ statement in Note 1 to the Financial Statements on the use of the going concern basis of accounting with no material uncertainties that may cast significant doubt over the Group and the Parent Company’s use of that basis for a period of at least twelve months from the date of approval of the Financial Statements; or
• the related statement under the Listing Rules set out on page 141 is materially inconsistent with our audit knowledge.
We have nothing to report in these respects, and we did not identify going concern as a key audit matter.

150 Reckitt Benckiser Group plc (RB) Annual Report and Financial Statements 2019
5 We have nothing to report on the other information in the Annual Report The Directors are responsible for the other information presented in the Annual Report together with the Financial Statements. Our opinion on the Financial Statements does not cover the other information and, accordingly, we do not express an audit opinion or, except as explicitly stated below, any form of assurance conclusion thereon.
Our responsibility is to read the other information and, in doing so, consider whether, based on our Financial Statements audit work, the information therein is materially misstated or inconsistent with the Financial Statements or our audit knowledge. Based solely on that work we have not identified material misstatements in the other information.
Strategic report and Directors’ reportBased solely on our work on the other information:
• we have not identified material misstatements in the Strategic report and the Directors’ report;
• in our opinion the information given in those reports for the financial year is consistent with the Financial Statements; and
• in our opinion those reports have been prepared in accordance with the Companies Act 2006.
Directors’ remuneration report In our opinion the part of the Directors’ remuneration report to be audited has been properly prepared in accordance with the Companies Act 2006.
Disclosures of emerging and principal risks and longer-term viabilityBased on the knowledge we acquired during our Financial Statements audit, we have nothing material to add or draw attention to in relation to:
• the Directors’ confirmation within the Viability Statement on page 77 that they have carried out a robust assessment of the emerging and principal risks facing the Group, including those that would threaten its business model, future performance, solvency and liquidity;
• the risk management and principal risk disclosures describing these risks and explaining how they are being managed and mitigated; and
• the Directors’ explanation in the Viability Statement of how they have assessed the prospects of the Group, over what period they have done so and why they considered that period to be appropriate, and their statement as to whether they have a reasonable expectation that the Group will be able to continue in operation and meet its liabilities as they fall due over the period of their assessment, including any related disclosures drawing attention to any necessary qualifications or assumptions.
Under the Listing Rules we are required to review the Viability Statement. We have nothing to report in this respect.
Our work is limited to assessing these matters in the context of only the knowledge acquired during our Financial Statements audit. As we cannot predict all future events or conditions and as subsequent events may result in outcomes that are inconsistent with judgements that were reasonable at the time they were made, the absence of anything to report on these statements is not a guarantee as to the Group’s and Parent Company’s longer-term viability.
Corporate governance disclosuresWe are required to report to you if:
• we have identified material inconsistencies between the knowledge we acquired during our Financial Statements audit and the Directors’ statement that they consider that the annual report and Financial Statements taken as a whole is fair, balanced and understandable and provides the information necessary for Shareholders to assess the Group’s position and performance, business model and strategy; or
• the section of the annual report describing the work of the Audit Committee does not appropriately address matters communicated by us to the Audit Committee.
We are required to report to you if the Corporate Governance Statement does not properly disclose a departure from the provisions of the UK Corporate Governance Code specified by the Listing Rules for our review.
We have nothing to report in these respects.
6 We have nothing to report on the other matters on which we are required to report by exception Under the Companies Act 2006, we are required to report to you if, in our opinion:
• adequate accounting records have not been kept by the Parent Company, or returns adequate for our audit have not been received from branches not visited by us; or
• the Parent Company Financial Statements and the part of the Directors’ Remuneration Report to be audited are not in agreement with the accounting records and returns; or
• certain disclosures of Directors’ remuneration specified by law are not made; or
• we have not received all the information and explanations we require for our audit.
We have nothing to report in these respects.
I N D E P E N D E N T AU D I TO R ’ S R E P O R TTO T H E M E M B E R S O F R EC K I T T B E N C K I S E R G RO U P P LC
CO N T I N U ED

S T R AT E G I C R E P O R T G O V E R N A N C E F I N A N C I A L S TAT E M E N T S
151Reckitt Benckiser Group plc (RB) Annual Report and Financial Statements 2019
7 Respective responsibilities Directors’ responsibilities As explained more fully in their statement set out on page 141, the Directors are responsible for: the preparation of the Financial Statements including being satisfied that they give a true and fair view; such internal control as they determine is necessary to enable the preparation of Financial Statements that are free from material misstatement, whether due to fraud or error; assessing the Group and Parent Company’s ability to continue as a going concern, disclosing, as applicable, matters related to going concern; and using the going concern basis of accounting unless they either intend to liquidate the Group or the Parent Company or to cease operations, or have no realistic alternative but to do so.
Auditor’s responsibilitiesOur objectives are to obtain reasonable assurance about whether the Financial Statements as a whole are free from material misstatement, whether due to fraud or other irregularities (see below), or error, and to issue our opinion in an auditor’s report. Reasonable assurance is a high level of assurance, but does not guarantee that an audit conducted in accordance with ISAs (UK) will always detect a material misstatement when it exists. Misstatements can arise from fraud, other irregularities or error and are considered material if, individually or in aggregate, they could reasonably be expected to influence the economic decisions of users taken on the basis of the Financial Statements.
A fuller description of our responsibilities is provided on the FRC’s website at www.frc.org.uk/auditorsresponsibilities.
Irregularities – ability to detectWe identified areas of laws and regulations that could reasonably be expected to have a material effect on the Financial Statements from our general commercial and sector experience and through discussion with the Directors and other management as required by auditing standards, and from inspection of the Group’s regulatory and legal correspondence and discussed with the Directors and other management the policies and procedures regarding compliance with laws and regulations. We communicated identified laws and regulations throughout our team and remained alert to any indications of non-compliance throughout the audit. This included communication from the Group team to component audit teams of relevant laws and regulations identified at the Group level.
The potential effect of these laws and regulations on the Financial Statements varies considerably.
Firstly, the Group is subject to laws and regulations that directly affect the Financial Statements including financial reporting legislation (including related companies legislation), distributable profits legislation and taxation legislation and we assessed the extent of compliance with these laws and regulations as part of our procedures on the related financial statement items.
Secondly, the Group is subject to many other laws and regulations where the consequences of non-compliance could have a material effect on amounts or disclosures in the Financial Statements, for instance through the imposition of fines or litigation or the loss of the Group’s license to operate. We identified the following areas as those most likely to have such an effect: health and safety (reflecting the nature of the Group’s production and distribution process),
anti-bribery (reflecting that the Group operates in a number of countries where there is an opportunity to engage in bribery given the lack of regulation by the local governments), interaction with healthcare professionals (reflecting the nature of the Group’s products in the Health business unit), competition law (reflecting the nature of Group’s business and market positions), consumer product law such as product safety and product claims (reflecting the nature of the Group’s diverse product base), data privacy legislation (reflecting the Group’s growing amounts of personal data held) and intellectual property legislation (reflecting the potential for the Group to infringe trademarks, copyright and patents). Auditing standards limit the required audit procedures to identify non-compliance with these laws and regulations to enquiry of the Directors and other management and inspection of regulatory and legal correspondence, if any. Through these procedures, we became aware of actual or suspected non-compliance of a scale and nature that is unexceptional for a group of this size and considered the effect as part of our procedures on the related financial statement items. The identified actual or suspected non-compliance was not sufficiently significant to our audit to result in our response being identified as a key audit matter.
Owing to the inherent limitations of an audit, there is an unavoidable risk that we may not have detected some material misstatements in the Financial Statements, even though we have properly planned and performed our audit in accordance with auditing standards. For example, the further removed non-compliance with laws and regulations (irregularities) is from the events and transactions reflected in the Financial Statements, the less likely the inherently limited procedures required by auditing standards would identify it. In addition, as with any audit, there remained a higher risk of non-detection of irregularities, as these may involve collusion, forgery, intentional omissions, misrepresentations, or the override of internal controls. We are not responsible for preventing non-compliance and cannot be expected to detect non-compliance with all laws and regulations.
8 The purpose of our audit work and to whom we owe our responsibilities This report is made solely to the Parent Company’s members, as a body, in accordance with Chapter 3 of Part 16 of the Companies Act 2006 and the terms of our engagement by the Parent Company. Our audit work has been undertaken so that we might state to the Parent Company’s members those matters we are required to state to them in an auditor’s report, and the further matters we are required to state to them in accordance with the terms agreed with the Parent Company, and for no other purpose. To the fullest extent permitted by law, we do not accept or assume responsibility to anyone other than the Parent Company and the Parent Company’s members, as a body, for our audit work, for this report, or for the opinions we have formed.
Richard Broadbelt (Senior Statutory Auditor) for and on behalf of KPMG LLP, Statutory Auditor Chartered Accountants 15 Canada Square London E14 5GL 26 March 2020

152 Reckitt Benckiser Group plc (RB) Annual Report and Financial Statements 2019
For the year ended 31 December Note2019
£m
2018 (Restated)1
£m
CONTINUING OPERATIONSNet Revenue 2 12,846 12,597Cost of sales (5,068) (4,962)
Gross profit 7,778 7,635Net operating expenses 3 (4,616) (4,577)Impairment of goodwill and other intangible assets 9 (5,116) –
Operating (Loss)/Profit 2 (1,954) 3,058
Adjusted Operating Profit 3,367 3,369Adjusting items2 3 (5,321) (311)
Operating (Loss)/Profit (1,954) 3,058
Finance income 6 161 78Finance expense 6 (314) (416)
Net finance expense (153) (338)
(Loss)/Profit before income tax (2,107) 2,720Income tax expense 7 (665) (536)
Net (loss)/income from continuing operations (2,772) 2,184
Net loss from discontinued operations 3 (898) (5)
Net (loss)/income (3,670) 2,179
Attributable to non-controlling interests 13 20Attributable to owners of the parent company (3,683) 2,159
Net (loss)/income (3,670) 2,179
Basic (loss)/earnings per ordinary shareFrom continuing operations (pence) 8 (393.0) 306.6From discontinued operations (pence) 8 (126.7) (0.7)
From total operations (pence) 8 (519.7) 305.9
Diluted (loss)/earnings per ordinary shareFrom continuing operations (pence) 8 (393.0) 305.2From discontinued operations (pence) 8 (126.7) (0.7)
From total operations (pence) 8 (519.7) 304.5
1 Restated for the adoption of IFRS 16 (see Note 31).2 Adjusting items include impairment of goodwill and other intangible assets of £5,116 million (See Note 3).
G RO U P I N CO M E S TAT E M E N T

S T R AT E G I C R E P O R T G O V E R N A N C E F I N A N C I A L S TAT E M E N T S
153Reckitt Benckiser Group plc (RB) Annual Report and Financial Statements 2019
For the year ended 31 December Note2019
£m
2018 (Restated)1
£m
Net (loss)/income (3,670) 2,179Other comprehensive (expense)/incomeItems that may be reclassified to income statement in subsequent yearsNet exchange (losses)/gains on foreign currency translation, net of tax 7 (579) 67Gains/(losses) on net investment hedges, net of tax 7 70 (44)(Losses)/gains on cash flow hedges, net of tax 7 (9) 8
(518) 31
Items that will not be reclassified to income statement in subsequent yearsRemeasurements of defined benefit pension plans, net of tax 7 14 123Revaluation of equity instruments – FVOCI 7 (13) –
1 123
Other comprehensive (expense)/income, net of tax (517) 154
Total comprehensive (expense)/income (4,187) 2,333
Attributable to non-controlling interests 12 20Attributable to owners of the parent company (4,199) 2,313
Total comprehensive (expense)/income (4,187) 2,333
Total comprehensive (expense)/income attributable to owners of the parent company arising from:Continuing operations (3,301) 2,318Discontinued operations (898) (5)
(4,199) 2,313
1 Restated for the adoption of IFRS 16 (see Note 31).
G RO U P S TAT E M E N T O F CO M P R E H E N S I V E I N CO M E

154 Reckitt Benckiser Group plc (RB) Annual Report and Financial Statements 2019
As at 31 December Note2019
£m
2018 (Restated)1
£m
2017 (Restated)1
£m
ASSETSNon-current assetsGoodwill and other intangible assets 9 24,261 30,278 29,487Property, plant and equipment 10 2,140 2,162 2,068Equity instruments – FVOCI 14 58 53 41Deferred tax assets 11 224 209 118Retirement benefit surplus 22 268 191 90Other non-current receivables 13 155 109 99
27,106 33,002 31,903
Current assetsInventories 12 1,314 1,276 1,201Trade and other receivables 13 2,079 2,097 2,004Derivative financial instruments 14 30 38 18Current tax recoverable 61 48 58Cash and cash equivalents 15 1,549 1,483 2,125
5,033 4,942 5,406Assets classified as held for sale – 10 18
5,033 4,952 5,424
Total assets 32,139 37,954 37,327
LIABILITIESCurrent liabilitiesShort-term borrowings 16 (3,650) (2,269) (1,394)Provisions for liabilities and charges 17 (178) (537) (517)Trade and other payables 20 (4,820) (4,811) (4,629)Derivative financial instruments 14 (138) (42) (19)Current tax liabilities 21 (145) (10) (65)
(8,931) (7,669) (6,624)
Non-current liabilitiesLong-term borrowings 16 (8,545) (9,950) (11,797)Deferred tax liabilities 11 (3,513) (3,619) (3,443)Retirement benefit obligations 22 (351) (318) (393)Provisions for liabilities and charges 17 (56) (74) (81)Derivative financial instruments – – (12)Non-current tax liabilities 21 (969) (1,105) (1,012)Other non-current liabilities 20 (367) (448) (408)
(13,801) (15,514) (17,146)
Total liabilities (22,732) (23,183) (23,770)
Net assets 9,407 14,771 13,557
EQUITYCapital and reservesShare capital 23 74 74 74Share premium 245 245 243Merger reserve (14,229) (14,229) (14,229)Hedging reserve 25 (2) 7 (1)Foreign currency translation reserve 25 (78) 430 407Retained earnings 23,353 28,197 27,023
Attributable to owners of the parent company 9,363 14,724 13,517Attributable to non-controlling interests 44 47 40
Total equity 9,407 14,771 13,557
1 Restated for the adoption of IFRS 16 (see Note 31).
The Financial Statements on pages 152 to 203 were approved by the Board of Directors and signed on its behalf on 26 March 2020 by:
Christopher Sinclair Laxman NarasimhanDirector Director
G RO U P B A L A N C E S H E E T

S T R AT E G I C R E P O R T G O V E R N A N C E F I N A N C I A L S TAT E M E N T S
155Reckitt Benckiser Group plc (RB) Annual Report and Financial Statements 2019
Notes
Share capital
£m
Sharepremium
£m
Merger reserves2
£m
Other reserves3
£m
Retained earnings
£m
Total attributable to owners of the
parent company
£m
Non-controlling
interests £m
Total equity
£m
Balance at 1 January 2018 (Reported) 74 243 (14,229) 406 27,039 13,533 40 13,573
Effect of IFRS 16 – – – – (16) (16) – (16)
Balance at 1 January 2018 (Restated)1 74 243 (14,229) 406 27,023 13,517 40 13,557Comprehensive incomeNet income1 – – – – 2,159 2,159 20 2,179Other comprehensive income – – – 31 123 154 – 154
Total comprehensive income1 – – – 31 2,282 2,313 20 2,333
Transactions with ownersTreasury shares re-issued 23 – 2 – – 103 105 – 105Share-based payments 24 – – – – 14 14 – 14Current tax on share awards 7 – – – – 7 7 – 7Deferred tax on share awards 7 – – – – (12) (12) – (12)Cash dividends 27 – – – – (1,187) (1,187) (13) (1,200)Transactions with non-controlling interests – – – – (33) (33) – (33)
Total transactions with owners – 2 – – (1,108) (1,106) (13) (1,119)
Balance at 31 December 2018 (Restated)1 74 245 (14,229) 437 28,197 14,724 47 14,771
Comprehensive incomeNet income – – – – (3,683) (3,683) 13 (3,670)Other comprehensive (expense)/income – – – (517) 1 (516) (1) (517)
Total comprehensive (expense)/income – – – (517) (3,682) (4,199) 12 (4,187)
Transactions with ownersTreasury shares re-issued 23 – – – – 61 61 – 61Share-based payments 24 – – – – 18 18 – 18Current tax on share awards 7 – – – – 4 4 – 4Cash dividends 27 – – – – (1,227) (1,227) (15) (1,242)Transactions with non-controlling interests – – – – (18) (18) – (18)
Total transactions with owners – – – – (1,162) (1,162) (15) (1,177)
Balance at 31 December 2019 74 245 (14,229) (80) 23,353 9,363 44 9,407
1 Restated for the adoption of IFRS 16 (see Note 31).2 The merger reserve relates to the 1999 combination of Reckitt & Colman plc and Benckiser N.V. and a Group reconstruction in 2007 treated as a merger under Part 27 of the Companies Act
2006.3 Refer to Note 25 for an explanation of other reserves.
G RO U P S TAT E M E N T O F C H A N G ES I N EQ U I T Y
156 Reckitt Benckiser Group plc (RB) Annual Report and Financial Statements 2019
For the year ended 31 December Note2019
£m
2018 (Restated)1
£m
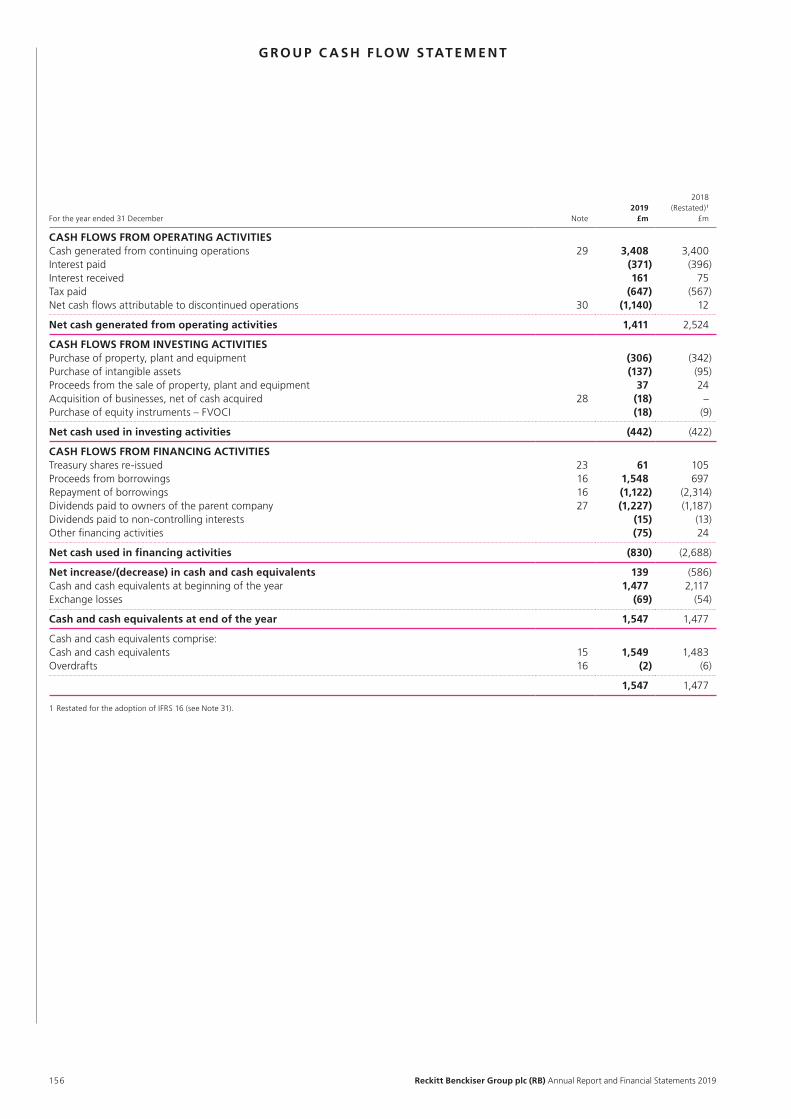
CASH FLOWS FROM OPERATING ACTIVITIESCash generated from continuing operations 29 3,408 3,400Interest paid (371) (396)Interest received 161 75Tax paid (647) (567)Net cash flows attributable to discontinued operations 30 (1,140) 12
Net cash generated from operating activities 1,411 2,524
CASH FLOWS FROM INVESTING ACTIVITIESPurchase of property, plant and equipment (306) (342)Purchase of intangible assets (137) (95)Proceeds from the sale of property, plant and equipment 37 24Acquisition of businesses, net of cash acquired 28 (18) –Purchase of equity instruments – FVOCI (18) (9)
Net cash used in investing activities (442) (422)
CASH FLOWS FROM FINANCING ACTIVITIESTreasury shares re-issued 23 61 105Proceeds from borrowings 16 1,548 697Repayment of borrowings 16 (1,122) (2,314)Dividends paid to owners of the parent company 27 (1,227) (1,187)Dividends paid to non-controlling interests (15) (13)Other financing activities (75) 24
Net cash used in financing activities (830) (2,688)
Net increase/(decrease) in cash and cash equivalents 139 (586)Cash and cash equivalents at beginning of the year 1,477 2,117Exchange losses (69) (54)
Cash and cash equivalents at end of the year 1,547 1,477
Cash and cash equivalents comprise:Cash and cash equivalents 15 1,549 1,483Overdrafts 16 (2) (6)
1,547 1,477
1 Restated for the adoption of IFRS 16 (see Note 31).
G RO U P C A S H F LOW S TAT E M E N T

S T R AT E G I C R E P O R T G O V E R N A N C E F I N A N C I A L S TAT E M E N T S
157Reckitt Benckiser Group plc (RB) Annual Report and Financial Statements 2019
1 Accounting PoliciesThe principal accounting policies adopted in the preparation of these Financial Statements are set out below. Unless otherwise stated, these policies have been consistently applied to all the years presented.
Basis of PreparationThese Financial Statements have been prepared in accordance with EU endorsed International Financial Reporting Standards (IFRS), IFRS Interpretations Committee (IFRIC) interpretations, and with those parts of the Companies Act 2006 applicable to companies reporting under IFRS. The Financial Statements are also in compliance with IFRS as issued by the International Accounting Standards Board (IASB).
These Financial Statements have been prepared under the historical cost convention, as modified by the revaluation of certain financial assets and liabilities (including derivative instruments) at fair value through profit or loss or other comprehensive income. A summary of the Group’s more important accounting policies is set out below. Historical cost is generally based on the fair value of the consideration given in exchange for goods and services.
The preparation of Financial Statements that conform to IFRS requires management to make estimates and assumptions that affect the reported amounts of assets and liabilities at the Balance Sheet date and revenue and expenses during the reporting period. Although these estimates are based on management’s best knowledge at the time, actual amounts may ultimately differ from those estimates.
New Standards, Amendments and InterpretationsThe following standards issued by the IASB and endorsed by the EU have been adopted by the Group from 1 January 2019:
IFRS 16 LeasesOn 1 January 2019, the Group adopted IFRS 16 Leases, using the full retrospective approach to previous periods and applying IAS 8 Accounting Policies, Changes in Accounting Estimates and Errors. Comparative reported numbers relating to 2018 and 2017 have been restated. Deferred tax adjustments relating to the restatement have not been made as they are not material. The impact of the restatement is included in Note 31.
The standard requires recognition of a ‘right of use’ asset, representing the right to use the underlying asset and a liability, representing the obligation to make lease payments, for almost all lease contracts. The impact on the Income Statement is that former lease-operating expenses are replaced by depreciation and interest. Total expenses (depreciation for ‘right of use’ assets and interest on lease liabilities) are higher in the earlier years of a typical lease and lower in the later years, in comparison with former accounting for operating leases. The main impact on the Statement of Cash Flows is higher cash flows from operating activities, since cash payments for the principal part of the lease liability are classified in the net cash flow from financing activities.
For leases in place on 1 January 2019 IFRS 16 is only applied for contracts that constituted a lease under IAS 17 Leases or IFRIC 4 Determining Whether an Arrangement Contains a Lease.
The following amendments and interpretations issued by the IASB and endorsed by the EU have been adopted by the Group from 1 January 2019:
IFRIC 23 Uncertainty over Income Tax TreatmentsOn 1 January 2019 the Group adopted IFRIC 23 Uncertainty over Income Tax Treatments. IFRIC 23 further clarifies the accounting for uncertainty in income taxes under IAS 12. The adoption did not lead to any changes to the opening balance of retained earnings and had no material impact on the Income Statement.
A number of new standards are effective for annual periods beginning on or after 1 January 2020 and earlier application is permitted; however, the Group has not early adopted the new or amended standards in preparing these consolidated Financial Statements.
The following amended standards and interpretations are not expected to have a significant impact on the Group’s consolidated Financial Statements.
• Amendments to References to Conceptual Framework in IFRS Standards.
• Definition of a Business (Amendments to IFRS 3).
• Definition of Material (Amendments to IAS 1 and IAS 8).
• Interest Rate Benchmark Reform (Amendments to IFRS9, IAS39 and IFRS7).
Going ConcernHaving assessed the principal risks and other matters discussed in connection with the Viability Statement, the Directors considered it appropriate to adopt the going concern basis of accounting in preparing the consolidated Financial Statements. Further detail is contained in the Strategic Report on pages 01 to 77.
Basis of ConsolidationThe consolidated Financial Statements include the results of Reckitt Benckiser Group plc, a company registered in the UK, and all its subsidiary undertakings made up to the same accounting date. Subsidiary undertakings are those entities controlled by Reckitt Benckiser Group plc. Control exists where the Group is exposed to, or has the rights to variable returns from its involvement with, the investee and has the ability to use its power over the investee to affect its returns.
Intercompany transactions, balances and unrealised gains on transactions between Group companies have been eliminated on consolidation. Unrealised losses have also been eliminated to the extent that they do not represent an impairment of a transferred asset. Subsidiaries’ accounting policies have been changed where necessary to ensure consistency with the policies adopted by the Group.
Foreign Currency TranslationItems included in the Financial Statements of each of the Group’s entities are measured using the currency of the primary economic environment in which the entity operates (the functional currency). The consolidated Financial Statements are presented in Sterling, which is the Group’s presentational currency.
Foreign currency transactions are translated into the functional currency using exchange rates prevailing at the dates of the transactions. Foreign exchange gains and losses resulting from the settlement of foreign currency transactions and from the translation at year end exchange rates of monetary assets and liabilities denominated in foreign currencies are recognised in the Income Statement, except where hedge accounting is applied.
N OT ES TO T H E F I N A N C I A L S TAT E M E N T S

158 Reckitt Benckiser Group plc (RB) Annual Report and Financial Statements 2019
1 Accounting Policies continuedThe Financial Statements of overseas subsidiary undertakings are translated into Sterling on the following basis:
• Assets and liabilities at the rate of exchange ruling at the year end date.
• Income statement account items at the average rate of exchange for the year.
Exchange differences arising from the translation of the net investment in foreign entities, and of borrowings and other currency instruments designated as hedges of such investments, are taken to equity on consolidation.
Business CombinationsThe acquisition method is used to account for the acquisition of subsidiaries. Identifiable net assets acquired (including intangibles) in a business combination are measured initially at their fair values at the acquisition date.
Where the measurement of the fair value of identifiable net assets acquired is incomplete at the end of the reporting period in which the combination occurs, the Group will report provisional fair values. Final fair values are determined within a year of the acquisition date and retrospectively applied.
The excess of the consideration transferred and the amount of any non-controlling interest over the fair value of the identifiable assets (including intangibles), liabilities and contingent liabilities acquired is recorded as goodwill.
The consideration transferred is measured as the fair value of the assets given, equity instruments issued (if any), and liabilities assumed or incurred at the date of acquisition.
Acquisition related costs are expensed as incurred.
The results of the subsidiaries acquired are included in the consolidated Financial Statements from the acquisition date.
Disposal of SubsidiariesThe financial performance of subsidiaries is included in the Group results up to the point the Group ceases to have control over that subsidiary. Any amounts previously recognised in other comprehensive income in respect of that entity, including exchange gains or losses on foreign currency translation, are accounted for as if the Group had directly disposed of related assets and liabilities. This may mean amounts previously recognised in other comprehensive income are reclassified to the income statement.
Non-Controlling InterestsOn an acquisition-by-acquisition basis the non-controlling interest is measured at either fair value or a proportionate share of the acquiree’s net assets.
Purchases of non-controlling interests are accounted for as transactions with the owners and therefore no goodwill is recognised as a result of such transactions.
RevenueRevenue from the sale of products is recognised in the Group Income Statement as and when performance obligations are satisfied by transferring control of the product or service to the customer.
Net Revenue is defined as the amount invoiced to external customers during the year and comprises, as required by IFRS 15, gross sales net of trade spend, customer allowances for credit notes, returns and consumer coupons. The methodology and assumptions used to estimate credit notes, returns and consumer coupons are monitored and adjusted regularly in the light of contractual and legal obligations, historical trends, past experience and projected market conditions.
Trade spend, which consists primarily of customer pricing allowances, placement/listing fees and promotional allowances, is governed by sales agreements with the Group’s trade customers (retailers and distributors). Trade spend also includes reimbursement arrangements under the Special Supplemental Nutrition Program for Women, Infants and Children (“WIC”), payable to the respective US State WIC agencies.
Accruals are recognised under the terms of these agreements to reflect the expected activity level and the Group’s historical experience. These accruals are reported within Trade and other payables.
Value-added tax and other sales taxes are excluded from Net Revenue.
Operating SegmentsOperating segments are reported in a manner consistent with the internal reporting provided to the Chief Operating Decision Maker (CODM). The CODM, who is responsible for allocating resources and assessing performance of the operating segments, has been identified as the Group Executive Committee.
Adjusting Items, including Exceptional ItemsThe Group makes reference to adjusting items in presenting the Group’s principal adjusted earnings measures.
These comprise exceptional items, other adjusting items, and the reclassification of finance expenses on tax balances.
Exceptional items are material, non-recurring items of expense or income, which are relevant to an understanding of the underlying performance and trends of the business. Examples of exceptional items include the following:
• Restructuring and other expenses relating to the integration of an acquired business and related expenses for reconfiguration of the Group’s activities;
• Impairments of current and non-current assets;
• Gains/losses on disposals of businesses;
• Acquisition-related costs, including advisor fees incurred for significant transactions, and adjustments to the fair values of assets and liabilities that result in non-recurring charges to the Income Statement;
• Costs arising because of material and non-recurring regulatory and litigation matters; and
• The Income Statement impact of unwinding fair value adjustments for inventory recorded as the result of a business combination.
N OT ES TO T H E F I N A N C I A L S TAT E M E N T S CO N T I N U ED

S T R AT E G I C R E P O R T G O V E R N A N C E F I N A N C I A L S TAT E M E N T S
159Reckitt Benckiser Group plc (RB) Annual Report and Financial Statements 2019
1 Accounting Policies continuedOther adjusting items are charges that the Group adjust for because their pattern of recognition is largely uncorrelated with the underlying performance of the business. They include the following:
• Amortisation of acquired brands, trademarks and similar assets; and
• Amortisation of certain other intangible assets recorded as the result of a business combination.
Adjusting items include a reclassification of finance expenses on tax balances into income tax expense, to align with the Group’s tax guidance. As a result, these expenses are presented as part of income tax in the adjusted profit before income tax measure.
Research and DevelopmentResearch expenditure is expensed in the year in which it is incurred.
Development expenditure is expensed in the year in which it is incurred, unless it meets the requirements of IAS 38 to be capitalised and then amortised over the useful life of the developed product.
Income TaxIncome tax on the profit for the year comprises current and deferred tax. Income tax is recognised in the Income Statement except to the extent that it relates to items recognised in other comprehensive income or directly in equity. In this case the tax is also recognised in other comprehensive income or directly in equity, respectively.
Current tax is the expected tax payable on the taxable income for the year, using tax rates enacted in each jurisdiction, or substantively enacted, at the Balance Sheet date, and any adjustment to tax payable in respect of previous years.
Deferred tax is provided in full, using the liability method, on temporary differences arising between the tax bases of assets and liabilities and their carrying amounts in the consolidated Financial Statements. Deferred tax is not accounted for if it arises from the initial recognition of an asset or liability in a transaction (other than a business combination) that affects neither accounting nor taxable profit or loss at that time. Deferred tax is determined using tax rates (and laws) that have been enacted or substantively enacted by the Balance Sheet date and are expected to apply when the deferred tax asset or liability is settled. Deferred tax assets are recognised to the extent that it is probable that future taxable profit will be available against which the temporary differences can be utilised.
Deferred tax is provided on temporary differences arising on investments in subsidiaries except where the investor is able to control the timing of temporary differences and it is probable that the temporary difference will not reverse in the foreseeable future.
Deferred tax assets and liabilities within the same tax jurisdiction are offset where there is a legally enforceable right to offset current tax assets against current tax liabilities and where there is an intention to settle these balances on a net basis.
Goodwill and Other Intangible Assets(i) GoodwillGoodwill is allocated to the cash generating unit (CGU), or group of CGUs (GCGU), to which it relates and is tested annually for impairment. Goodwill is carried at cost less accumulated impairment losses.
(ii) BrandsSeparately acquired brands are shown at cost less accumulated amortisation and impairment. Brands acquired as part of a business combination are recognised at fair value at the acquisition date, where they are separately identifiable. Brands are amortised over their useful economic life (no more than 10 years), except when their life is determined as being indefinite.
Applying indefinite lives to certain acquired brands is appropriate due to the stable long-term nature of the business and the enduring nature of the brands. A core element of the Group’s strategy is to invest in building its brands through an ongoing programme of product innovation and increasing marketing investment. Within the Group, a brand typically comprises an assortment of base products and more innovative products. Both contribute to the enduring nature of the brand. The base products establish the long-term positioning of the brand while a succession of innovations attracts ongoing consumer interest and attention. Indefinite life brands are allocated to the CGUs or GCGUs to which they relate and are tested annually for impairment.
The Directors also review the useful economic life of brands annually, to ensure that these lives are still appropriate. If a brand is considered to have a finite life, its carrying value is amortised over that period.
(iii) SoftwareExpenditure relating to the acquisition of computer software licenses and systems are capitalised at cost. The assets are amortised on a straight-line basis over a period of seven years for systems and five years or less for all other software licences.
(iv) Distribution RightsPayments made in respect of product registration, acquired and re-acquired distribution rights are capitalised where the rights comply with the above requirements for recognition of acquired brands. If the registration or distribution rights are for a defined time period, the intangible asset is amortised over that period. If no time period is defined, the intangible asset is treated in the same way as acquired brands.
(v) Customer contractsAcquired customer contracts are capitalised at cost. These costs are amortised on a straight-line basis over the period of the contract.
Amortisation of intangible assets in (ii) to (v) is charged to net operating expenses.

160 Reckitt Benckiser Group plc (RB) Annual Report and Financial Statements 2019
1 Accounting Policies continuedProperty, Plant and EquipmentProperty, plant and equipment is stated at cost less accumulated depreciation and impairment, with the exception of freehold land, which is shown at cost less impairment. Cost includes expenditure that is directly attributable to the acquisition of the asset. Except for freehold land and assets under construction, the cost of property, plant and equipment is written off on a straight-line basis over the period of the expected useful life of the asset. For this purpose, expected lives are determined within the following limits:
• Freehold buildings: not more than 50 years;
• Leasehold land and buildings: the lesser of 50 years or the life of the lease; and
• Owned plant and equipment: not more than 15 years (except for environmental assets and spray dryers which are not more than 20 years).
In general, production plant and equipment and office equipment are written off over ten years or less; motor vehicles and computer equipment over five years or less.
Assets’ residual values and useful lives are reviewed, and adjusted if necessary, at each Balance Sheet date. Property, plant and equipment is reviewed for impairment if events or changes in circumstances indicate that the carrying amount may not be appropriate. Freehold land is reviewed for impairment on an annual basis.
Gains and losses on the disposal of property, plant and equipment are determined by comparing the asset’s carrying value with any sale proceeds, and are included in the Income Statement.
LeasesThe Group has various lease arrangements for buildings (such as offices and warehouses), cars, and IT and other equipment. Lease terms are negotiated on an individual basis locally and furthermore subjected to domestic rules and regulations. This results in a wide range of different terms and conditions. At the inception of a lease contract, the Group assesses whether the contract conveys the right to control the use of an identified asset for a certain period in exchange for a consideration, in which case it is identified as a lease. The Group recognises a right of use asset and a corresponding lease liability with respect to all lease arrangements in which it is the lessee, except for short-term leases (defined as leases with a lease term of 12 months or less) and leases of low value assets. For these leases, the Group recognises the lease payments as an operating expense on a straight-line basis over the term of the lease. Lease related assets and liabilities are measured on a present value basis. Lease related assets and liabilities are subjected to re-measurement when either terms are modified or lease assumptions have changed. Such an event results in the lease liability being re-measured to reflect the measurement of the present value of the remaining lease payments, discounted using the discount rate at the point of the change. The lease assets are adjusted to reflect the change in the re-measured liabilities.
Right of use assetsRight of use assets are measured at cost and at the inception of the lease may include the following components:
• The initial measurement of the lease liability;
• Prepayments before commencement date of the lease;
• Initial direct costs; and
• Costs to restore.
The right of use assets are reduced for lease incentives relating to the lease. The right of use assets are depreciated on a straight-line basis over the duration of the contract. In the event that the lease contract becomes onerous, the right of use asset is impaired for the part which has become onerous.
Lease liabilitiesLease liabilities include the net present value of the following components:
• Fixed payments excluding lease incentive receivables;
• Future contractually agreed fixed increases; and
• Payments related to renewals or early termination, when options to renew or for early termination are reasonably certain to be exercised.
The lease payments are discounted using the interest rate implicit in the lease. If such a rate cannot be determined, the lessee’s incremental borrowing rate is used, being the rate that the lessee would have to pay to borrow the funds necessary to obtain an asset of similar value in a similar economic environment with similar terms and conditions. The discount rate that is used to calculate the present value reflects the interest rate applicable to the lease at inception of the contract. Lease contracts entered into in a currency different than the local functional currency are subjected to periodic foreign currency revaluations that are recognised in the Income Statement in net finance expenses.
The lease liabilities are subsequently increased by the interest costs on the lease liabilities and decreased by lease payments made.
Impairment of AssetsAssets that have indefinite lives, including goodwill and brands, are tested annually for impairment at the level where cash flows are considered to be largely independent. This testing is performed at either the CGU or GCGU level. All assets are tested for impairment if there is an event or circumstance that indicates that their carrying value may not be recoverable. If an asset’s carrying value exceeds its recoverable amount an impairment loss is recognised in the Income Statement. The recoverable amount is the higher of the asset’s value in use and its fair value less costs of disposal.
Value in use is calculated with reference to the future cash flows expected to be generated by an asset (or group of assets where cash flows are not identifiable to specific assets). The discount rates used in the asset impairment reviews are based on weighted-average costs of capital (WACCs) specific to each CGU and GCGU, subsequently converted to the implied pre-tax rates.
N OT ES TO T H E F I N A N C I A L S TAT E M E N T S CO N T I N U ED

S T R AT E G I C R E P O R T G O V E R N A N C E F I N A N C I A L S TAT E M E N T S
161Reckitt Benckiser Group plc (RB) Annual Report and Financial Statements 2019
1 Accounting Policies continuedFair value less costs of disposal is calculated using a discounted cash flow approach, with a post-tax discount rate applied to projected risk-adjusted post-tax cash flows and terminal value.
InventoriesInventories are stated at the lower of cost and net realisable value. Cost comprises materials, direct labour and an appropriate portion of overhead expenses (based on normal operating capacity) required to get the inventory to its present location and condition. Inventory valuation is determined on a first in, first out (FIFO) basis. Net realisable value represents the estimated selling price less applicable selling expenses.
Trade and Other ReceivablesTrade and other receivables are initially recognised at fair value less transaction costs and subsequently held at amortised cost, less provision for discounts and doubtful debts. Allowance losses are calculated by reviewing lifetime expected credit losses using historic and forward-looking data on credit risk.
Trade and Other PayablesTrade and other payables are initially recognised at fair value including transaction costs and subsequently carried at amortised cost.
Cash and Cash EquivalentsCash and cash equivalents comprise cash balances and other deposits with a maturity of less than three months when deposited.
For the purpose of the cash flow statement, bank overdrafts that form an integral part of the Group’s cash management, and are repayable on demand, are included as a component of cash and cash equivalents. Bank overdrafts are included within short-term borrowings in the Balance Sheet.
BorrowingsInterest-bearing borrowings are recognised initially at fair value less, where permitted by IFRS 9, any directly attributable transaction costs. Subsequent to initial recognition, interest-bearing borrowings are stated at amortised cost with any difference between cost and redemption value being recognised in the Income Statement over the period of the borrowings on an effective interest basis.
Derivative Financial Instruments and Hedging ActivityThe Group may use derivatives to manage its exposures to fluctuating interest and foreign exchange rates. These instruments are initially recognised at fair value on the date the contract is entered into and are subsequently remeasured at their fair value. The method of recognising the resulting gain or loss depends on whether the derivative is designated as a hedging instrument and, if so, the nature of the item being hedged.
At the inception of designated hedge relationships, the Group documents its risk management objectives and strategy for undertaking various hedging transactions. The Group also documents its assessment, both at hedge inception and on an ongoing basis, of whether the derivatives that are used in hedging transactions are highly effective in offsetting changes in cash flows or fair values of hedged items.
The group designates certain derivatives as either:
• hedges of a particular risk associated with a recognised asset or liability or a highly probable forecast transaction (cash flow hedges); or
• hedges of the fair value of recognised assets or liabilities or a firm commitment (fair value hedges).
Derivatives designated as cash flow hedges: the effective portion of changes in the fair value of derivatives that are designated and qualify as cash flow hedges is recognised in other comprehensive income and accumulated in the hedging reserve. Any gain or loss relating to the ineffective portion is recognised immediately in the Income Statement.
When the hedged forecast transaction subsequently results in the recognition of a non-financial item such as inventory, the amount accumulated in the hedging reserve and the cost of hedging reserve is included directly in the initial cost of the non-financial item when it is recognised. For all other transactions, the amounts accumulated in the hedging reserve are recycled to the Income Statement in the period (or periods) when the hedged item affects the Income Statement.
If the hedge no longer meets the criteria for hedge accounting or the hedging instrument is sold, expires, is terminated, or is exercised, then hedge accounting is discontinued prospectively. The amount that has been accumulated in the hedging reserve remains in equity until it is either included in the cost of a non-financial item or recycled to the Income Statement.
Derivatives designated as fair value hedges: fair value hedges are used to manage the currency and/or interest rate risks to which the fair value of certain assets and liabilities are exposed. Changes in the fair value are recognised in the Income Statement, together with any changes in the fair value of the hedged asset or liability that are attributable to the hedged risk. If such a hedge relationship no longer meets hedge accounting criteria, fair value movements on the derivative continued to be taken to the Income Statement while any fair value adjustments made to the underlying hedged item to that date are amortised through the Income Statement over its remaining life using the effective interest rate method.
Changes in the fair value of any derivative instruments that do not qualify for hedge accounting are recognised immediately in the Income Statement.
Net Investment HedgesGains and losses on those hedging instruments designated as hedges of the net investments in foreign operations are recognised in other comprehensive income to the extent that the hedging relationship is effective. Gains and losses accumulated in the foreign currency translation reserve are recycled to the Income Statement when the foreign operation is disposed of.
162 Reckitt Benckiser Group plc (RB) Annual Report and Financial Statements 2019
1 Accounting Policies continuedEquity Instruments (FVOCI)Equity Instruments (FVOCI) are investments that are neither held for trading nor classified as investments in subsidiaries, associates or joint arrangements. Subsequent to their initial recognition, Equity Instruments (FVOCI) are stated at their fair value. Gains and losses arising from subsequent changes in the fair value are recognised in the Income Statement or in other comprehensive income on a case by case basis. Accumulated gains and losses included in other comprehensive income are not recycled to the Income Statement. Dividends from other investments are recognised in the Income Statement.
Employee Share SchemesIncentives in the form of shares are provided to employees under share option and restricted share schemes vested in accordance with non-market conditions.
The fair value determined at the grant date of the equity-settled share-based payments is expensed on a straight-line basis over the vesting period, based on the Group’s estimate of equity instruments that will eventually vest. At each Balance Sheet date, the Group revises its estimate of the number of equity instruments expected to vest. The impact of the revision of the original estimates, if any, is recognised in profit or loss such that the cumulative expense reflects the revised estimate, with a corresponding adjustment to equity reserves.
Additional employer costs in respect of options and awards are charged, including social security taxes, to the Income Statement over the same period with a corresponding liability recognised.
Repurchase and Reissuance of Ordinary SharesWhen shares recognised as equity are repurchased, the amount of the consideration paid, including directly attributable costs, is recognised as a charge to equity. Repurchased shares are classified as Treasury shares and are presented in retained earnings. When Treasury shares are sold or reissued subsequently, the amount received is recognised as an increase in equity and any resulting surplus is presented within share premium or deficit presented within retained earnings.
Pension CommitmentsGroup companies operate defined contribution and (funded and unfunded) defined benefit pension plans.
The cost of providing pensions to employees who are members of defined contribution plans is charged to the Income Statement as contributions are made. The Group has no further payment obligations once the contributions have been paid.
The deficit or surplus recognised in the Balance Sheet in respect of defined benefit pension plans is the present value of the defined benefit obligation at the Balance Sheet date, less the fair value of the plan assets. The defined benefit obligation is calculated annually by independent actuaries using the projected unit credit method. The present value of the defined benefit obligation is determined by discounting the estimated future cash flows by the yield on high quality corporate bonds denominated in the currency in which the benefits will be paid, and that have a maturity approximating to the terms of the pension obligations. The costs of providing these defined benefit plans are accrued over the period of employment. Actuarial gains and losses are recognised immediately in other comprehensive income.
Past-service costs are recognised immediately in profit or loss.
The net interest amount is calculated by applying the discounted rate used to measure the defined benefit obligation at the beginning of the period to the net defined benefit liability/asset.
The net pension plan interest is presented as finance income/expense.
Post-Retirement Benefits Other than PensionsSome Group companies provide post-retirement medical care to their retirees. The costs of providing these benefits are accrued over the period of employment and the liability recognised in the Balance Sheet is calculated using the projected unit credit method and is discounted to its present value and the fair value of any related asset is deducted.
ProvisionsProvisions are recognised when the Group has a present legal or constructive obligation as a result of past events; it is more likely than not that there will be an outflow of resources to settle that obligation; and the amount can be reliably estimated. Provisions are valued at the present value of the Directors’ best estimate of the expenditure required to settle the obligation at the Balance Sheet date. Where it is possible that a settlement may be reached or it is not possible to make a reliable estimate of the estimated financial impact, appropriate disclosure is made but no provision recognised.
Share Capital TransactionsWhen the Group purchases equity share capital, the amount of the consideration paid, including directly attributable costs, is recognised as a change in equity. Purchased shares are either held in Treasury, in order to satisfy employee options, or cancelled and, in order to maintain capital, an equivalent amount to the nominal value of the shares cancelled would be transferred from retained earnings.
Dividend DistributionDividends to owners of the parent company are recognised as a liability in the period in which the dividends are approved by the Company’s Shareholders. Interim dividends are recorded in the period in which they are approved and paid.
Dividend payments are recorded at fair value. Where non-cash dividend payments are made, gains arising as a result of fair value remeasurements are recognised in profit or loss in the same period.
Accounting Estimates and JudgementsIn preparing these consolidated Financial Statements, management has made judgements and estimates that affect the application of the Group’s accounting policies and the reported amounts of assets, liabilities, income and expenses. Actual amounts and results may differ from these estimates.
The estimates and underlying assumptions are reviewed on an ongoing basis. Revisions to accounting estimates are recognised in the period in which the estimate is revised if the revision affects only that period, or in the period of the revision and future periods if the revision affects both current and future periods.
N OT ES TO T H E F I N A N C I A L S TAT E M E N T S CO N T I N U ED

S T R AT E G I C R E P O R T G O V E R N A N C E F I N A N C I A L S TAT E M E N T S
163Reckitt Benckiser Group plc (RB) Annual Report and Financial Statements 2019
1 Accounting Policies continuedCritical judgements in applying the Group’s accounting policiesOver the course of the year, management has made a number of critical judgements in the application of the Group’s accounting policies. These include the following:
• Management has identified matters that may incur liabilities in the future however does not recognise these liabilities when it is too early to determine the likely outcome or make a reliable estimate (Note 19).
• The continuing enduring nature of the Group’s brands supports the indefinite life assumption of these assets (Note 9).
• Assumptions are made as to the recoverability of tax assets especially as to whether there will be sufficient future taxable profits in the same jurisdictions to fully utilise losses in future years (Note 11).
Key sources of estimation uncertaintyEach year, management is required to make a number of assumptions regarding the future. The related year-end accounting estimates will, by definition, seldom equal the final actual results. The estimates and assumptions that have a significant risk of causing a material adjustment to the carrying amounts of assets and liabilities within the next financial year are addressed below.
• Under IFRS, goodwill and other indefinite life intangible assets must be tested for impairment on at least an annual basis. As disclosed further in Note 9, this testing generally requires management to make multiple estimates, for example around individual market pressures and forces, future price and volume growth, future margins, terminal growth rates and discount rates. In 2019, the Group recognised impairment losses of £5,116m (2018: zero), with £5,037m relating to IFCN goodwill. In addition to the above, the IFCN impairment assessment incorporated estimates relating to future China birth rates and future WIC tendering in the US. Refer to Note 9 for further information, including details on the sensitivity of the IFCN value-in-use model to reasonable changes in key assumptions.
• The actual tax paid on profits is determined based on tax laws and regulations that differ across the numerous jurisdictions in which the Group operates. Assumptions are made in applying these laws to the taxable profits in any given period in order to calculate the tax charge for that period. Where the eventual tax paid or reclaimed is different to the amounts originally estimated, the variance is charged or credited to the Income Statement in the period in which it is determined (Note 7).
The Group operates in an international tax environment and is subject to tax examinations and uncertainties in a number of jurisdictions. The issues involved can be complex and disputes may take a number of years to resolve. Each uncertainty is separately assessed and management applies judgement in the recognition and measurement of the uncertainty based on the relevant circumstances. In particular, the range of possible outcomes relating to transfer pricing exposures can be wide. The accounting estimates and judgements considered include:
– Status of the unresolved matter;
– Clarity of relevant legislation and related guidance;
– Pre-clearances issued by taxing authorities;
– Advice from in-house specialists and opinions of professional firms;
– Resolution process and range of possible outcomes;
– Past experience and precedents set by the particular taxing authority;
– Decisions and agreements reached in other jurisdictions on comparable issues;
– Unutilised tax losses, tax credits and availability of mutual agreement procedures between tax authorities; and
– Statute of limitations.
Management is of the opinion that the carrying values of the provisions made in respect of these matters represent the most accurate measurement once all facts and circumstances have been taken into account. Nevertheless, the final amounts paid to discharge the liabilities arising (either through negotiated settlement or litigation) will in all likelihood be different from the provision recognised. The net liabilities recognised in respect of uncertain tax positions at 31 December 2019 are £891m (Note 21).
• The Group provides for amounts payable to our trade customers for promotional activity and Government reimbursement arrangements. Where an activity spans across the year end, an accrual is reflected in the consolidated Financial Statements based on our estimation of customer and consumer uptake during the relevant period and the extent to which temporary funded activity has occurred. There is a timing difference between that initial estimation and final settlement of trade spend with our customers – the result of which could lead to variations between the two. As at 31 December 2019, the Group has recognised total accruals of £1,095m (2018: £1,025m) in respect of amounts payable to trade customers and government bodies for trade spend. Refer to Note 20 for further information.
• The Group recognises legal provisions in line with the Group’s provisions policy. The level of provisioning in relation to civil and/or criminal investigations is an area where management and legal judgement is important, with individual provisions being based on best estimates of the potential loss, considering all available information, external advice and historical experience. As at 31 December 2019, the Group recognised legal provisions of £151m (2018: £461m). This included exceptional legal provisions of £126 million (2018: £431 million) in relation to a number of historical regulatory matters in a number of markets, predominantly the HS issue in South Korea and the DoJ investigation in the US. Refer to Note 17 for further information.
• The value of the Group’s defined benefit pension plan obligations is dependent on a number of key assumptions. These assumptions include the rate of increase in pensionable salaries, the discount rate to be applied, the level of inflation and the life expectancy of the schemes members. Details of the key assumptions and the sensitivity of the principal schemes’ carrying value to changes in the assumptions are set out in Note 22.

164 Reckitt Benckiser Group plc (RB) Annual Report and Financial Statements 2019
2 Operating SegmentsThe Group’s operating segments comprise of RB Health and RB Hygiene Home business units reflecting the way in which information is presented to and reviewed by the Group’s Chief Operating Decision Maker (CODM) for the purposes of making strategic decisions and assessing group-wide performance.
The CODM is the Group Executive Committee. This Committee is responsible for the implementation of strategy (approved by the Board), the management of risk (delegated by the Board) and the review of group operational performance and ongoing business integration.
The Executive Committee assesses the performance of these operating segments based on Net Revenue from external customers and Adjusted Operating Profit. Intercompany transactions between operating segments are eliminated. Finance income and expense are not allocated to segments, as each is managed on a centralised basis.
The segment information provided to the Executive Committee for the operating segments for the year ended 31 December 2019 and 31 December 2018 is as follows:
Year ended 31 December 2019Health
£m
Hygiene Home
£mTotal
£m
Net Revenue 7,815 5,031 12,846
Depreciation & amortisation (232) (117) (349)
Adjusted Operating Profit 2,088 1,279 3,367Adjusting items (5,321)
Operating Loss (1,954)Net finance expense (153)
Loss before income tax (2,107)
Income tax expense (665)
Net loss from continuing operations (2,772)
Year ended 31 December 2018 (Restated)1
Heath £m
Hygiene Home
£mTotal
£m
Net Revenue 7,762 4,835 12,597
Depreciation & amortisation (216) (109) (325)
Adjusted Operating Profit1 2,213 1,156 3,369Adjusting items (311)
Operating Profit1 3,058Net finance expense (338)
Profit before income tax1 2,720
Income tax expense (536)
Net income from continuing operations 2,184
1 Restated for the adoption of IFRS 16 (see Note 31).
N OT ES TO T H E F I N A N C I A L S TAT E M E N T S CO N T I N U ED
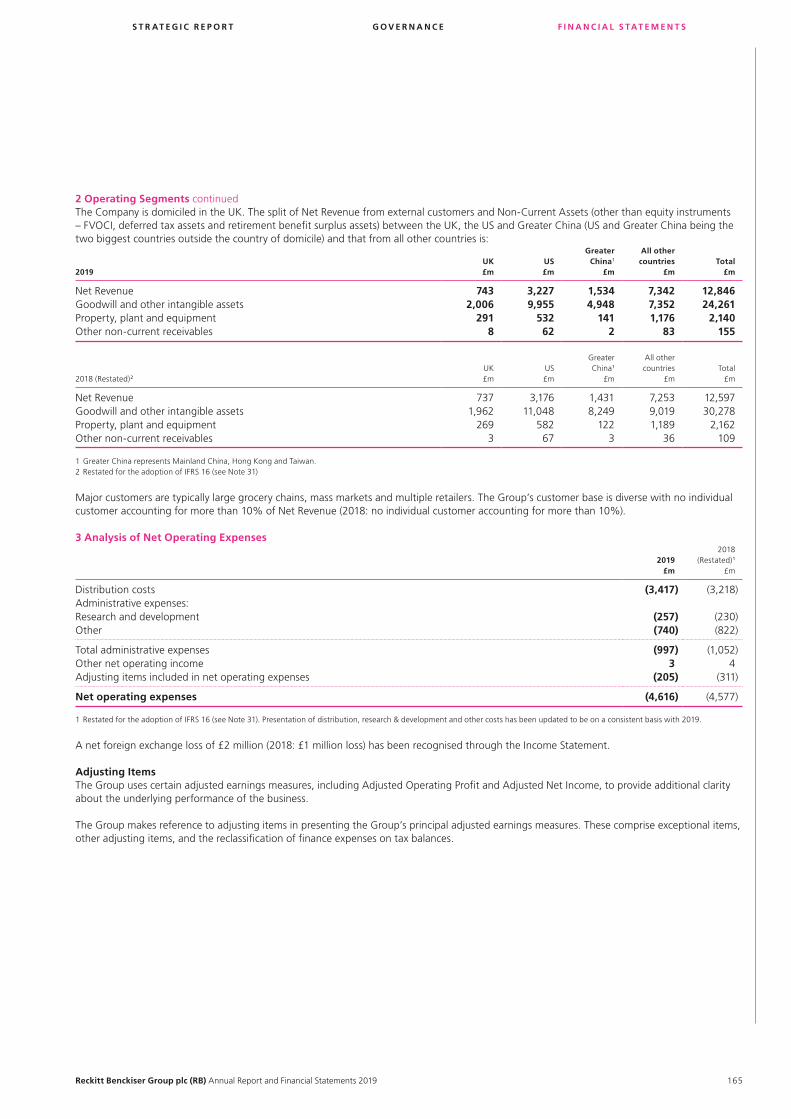
S T R AT E G I C R E P O R T G O V E R N A N C E F I N A N C I A L S TAT E M E N T S
165Reckitt Benckiser Group plc (RB) Annual Report and Financial Statements 2019
2 Operating Segments continuedThe Company is domiciled in the UK. The split of Net Revenue from external customers and Non-Current Assets (other than equity instruments – FVOCI, deferred tax assets and retirement benefit surplus assets) between the UK, the US and Greater China (US and Greater China being the two biggest countries outside the country of domicile) and that from all other countries is:
2019UK £m
US £m
Greater China1
£m
All other countries
£mTotal
£m
Net Revenue 743 3,227 1,534 7,342 12,846Goodwill and other intangible assets 2,006 9,955 4,948 7,352 24,261Property, plant and equipment 291 532 141 1,176 2,140Other non-current receivables 8 62 2 83 155
2018 (Restated)2
UK £m
US £m
Greater China1
£m
All other countries
£mTotal
£m
Net Revenue 737 3,176 1,431 7,253 12,597Goodwill and other intangible assets 1,962 11,048 8,249 9,019 30,278Property, plant and equipment 269 582 122 1,189 2,162Other non-current receivables 3 67 3 36 109
1 Greater China represents Mainland China, Hong Kong and Taiwan.2 Restated for the adoption of IFRS 16 (see Note 31)
Major customers are typically large grocery chains, mass markets and multiple retailers. The Group’s customer base is diverse with no individual customer accounting for more than 10% of Net Revenue (2018: no individual customer accounting for more than 10%).
3 Analysis of Net Operating Expenses
2019 £m
2018 (Restated)1
£m
Distribution costs (3,417) (3,218)Administrative expenses:Research and development (257) (230)Other (740) (822)
Total administrative expenses (997) (1,052)Other net operating income 3 4Adjusting items included in net operating expenses (205) (311)
Net operating expenses (4,616) (4,577)
1 Restated for the adoption of IFRS 16 (see Note 31). Presentation of distribution, research & development and other costs has been updated to be on a consistent basis with 2019.
A net foreign exchange loss of £2 million (2018: £1 million loss) has been recognised through the Income Statement.
Adjusting ItemsThe Group uses certain adjusted earnings measures, including Adjusted Operating Profit and Adjusted Net Income, to provide additional clarity about the underlying performance of the business.
The Group makes reference to adjusting items in presenting the Group’s principal adjusted earnings measures. These comprise exceptional items, other adjusting items, and the reclassification of finance expenses on tax balances.

166 Reckitt Benckiser Group plc (RB) Annual Report and Financial Statements 2019
3 Analysis of Net Operating Expenses continuedThe table below provides a reconciliation of the Group’s reported statutory earnings measures to its adjusted earnings measures for the year ended 31 December 2019:
Year ended 31 December 2019Reported
£m
Adjusting: Exceptional
items £m
Adjusting: Other items
£m
Adjusting: Finance
expense reclass
£mAdjusted
£m
Operating (Loss)/Profit (1,954) 5,2402 813 – 3,367Net finance expense (153) – – (35)4 (188)
(Loss)/profit before income tax (2,107) 5,240 81 (35) 3,179Income tax (expense)/credit (665) (45)2 (18)3 354 (693)
Net (loss)/income for the year from continuing operations (2,772) 5,195 63 – 2,486Less: Attributable to non-controlling interests (13) – – – (13)
Continuing net (loss)/income for the year attributable to owners of the parent company (2,785) 5,195 63 – 2,473Net loss for the year from discontinued operations (898)1 898 – – –
Total net (loss)/income for the year attributable to owners of the parent company (3,683) 6,093 63 – 2,473
1. Exceptional items within discontinued operations of £898 million relate to the current year charge of the settlement amount for US Department of Justice (“DoJ”) and the US Federal Trade Commission investigations. Refer to Note 30 for further details.
2. Exceptional items within Operating Profit of £5,240 million relate to:• MJN integration/RB2.0 costs of £113 million;• Restructuring and other projects of £11 million;• IFCN impairment of goodwill of £5,037 million; and• Oriental Pharma impairment of intangible assets of £79 million.
Included within income tax expense is a £45 million tax credit for these exceptional costs.3. Other adjusting items of £81 million relate to the amortisation of certain intangible assets recognised as a result of the acquisition of MJN, charged during the period ended 31 December
2019. In addition, there is a £18 million income tax credit in respect of these costs.4. Adjusting items of £35 million relate to the reclassification of interest on income tax balances from finance expense to income tax expense in the adjusting measure.
The table below provides a reconciliation of the Group’s reported statutory earnings measures to its adjusted earnings measures for the year ended 31 December 2018:
Year ended 31 December 2018 (Restated)5
Reported £m
Adjusting: Exceptional
items £m
Adjusting: Other items
£m
Adjusting: Finance expense
reclass £m
Adjusted £m
Operating Profit 3,058 2332 783 – 3,369Net finance expense (338) – – 294 (309)
Profit before income tax 2,720 233 78 29 3,060Income tax expense (536) (50)2 (17)3 (29)4 (632)
Net income for the year from continuing operations 2,184 183 61 – 2,428Less: Attributable to non-controlling interests (20) – – – (20)
Continuing net income for the year attributable to owners of the parent company 2,164 183 61 – 2,408Net loss for the year from discontinued operations (5)1 5 – – –
Total net income for the year attributable to owners of the parent company 2,159 188 61 – 2,408
1. Exceptional items within discontinued operations relate to a foreign exchange loss of £17 million on the provision booked in prior year for ongoing investigations by the US Department of Justice (“DoJ”) and the US Federal Trade Commission, offset by further consideration from McCormick & Company, Inc. of £12 million relating to the 2017 sale of RB Food.
2. Exceptional items within Operating Profit of £233 million relate to:• MJN integration/RB2.0 costs of £185 million; and• Restructuring, Supercharge and other projects of £48 million.
Included within income tax expense is a £50 million tax credit for these exceptional costs.3. Other adjusting items of £78 million relate to the amortisation of certain intangible assets recognised as a result of the acquisition of MJN, charged during the period ended 31 December
2018. In addition, there is a £17 million income tax credit in respect of these costs.4. Adjusting items of £29 million relate to the reclassification of interest on income tax balances from finance expense to income tax expense in the adjusting measure.5. Restated for adoption of IFRS16 (Note 31)
N OT ES TO T H E F I N A N C I A L S TAT E M E N T S CO N T I N U ED

S T R AT E G I C R E P O R T G O V E R N A N C E F I N A N C I A L S TAT E M E N T S
167Reckitt Benckiser Group plc (RB) Annual Report and Financial Statements 2019
4 Auditor RemunerationDuring the year, the Group (including its overseas subsidiaries) obtained the following services from the Company’s Auditor and its associates.
2019 £m
2018 £m
Audit services pursuant to legislationAudit of the Group’s Annual Report and Financial Statements 4.6 3.6Audit of the Financial Statements of the Group’s subsidiaries 8.0 5.9
Audit related assurance services 0.6 0.3
Total audit and audit-related services 13.2 9.8Fees payable to the Company’s Auditor and its associates for other services
Other Assurance services 1.3 0.1
Total non-audit services 1.3 0.1
14.5 9.9
5 EmployeesStaff CostsThe total employment costs, including Directors, were:
Note2019
£m2018
£m
Wages and salaries 1,558 1,471Social security costs 246 227Other pension costs 22 60 53Share-based payments 24 18 16
Total staff costs 1,882 1,767
Executive Directors’ aggregate emoluments are disclosed in the Directors’ Remuneration Report.
Compensation awarded to key management (the Executive Committee) was:2019
£m2018
£m
Short-term employee benefits 13 16Post-employment benefits – 1Share-based payments 5 1
18 18
Staff NumbersThe monthly average number of people employed by the Group, including Directors, during the year was:
2019 ‘000
2018 ‘000
North America 4.3 4.3Europe/ANZ 13.3 13.3DvM 24.8 24.8
42.4 42.4

168 Reckitt Benckiser Group plc (RB) Annual Report and Financial Statements 2019
6 Net Finance Expense
2019 £m
2018 (Restated)1
£m
Finance incomeInterest income on cash and cash equivalents 96 78Movement on put option liability 25 –Other finance income 40 –
Total finance income 161 78
Finance expenseInterest payable on borrowings (331) (352)Finance credit/(expense) on tax balances 35 (29)Movement on put option liability – (10)Other finance expense (18) (25)
Total finance expense (314) (416)
Net finance expense (153) (338)
1 Restated for the adoption of IFRS 16 (see Note 31).
All net finance expense relates to continuing operations only.
7 Income Tax Expense2019
£m2018
£m
Current tax 640 545Adjustment in respect of prior periods 36 50
Total current tax 676 595
Origination and reversal of temporary differences (10) (59)Impact of changes in tax rates (1) –
Total deferred tax (11) (59)
Income tax expense 665 536
Current tax includes tax incurred by UK entities of £95 million (2018: £55 million). This is comprised of UK corporation tax of £79 million (2018: £32 million) and overseas tax suffered of £16 million (2018: £23 million). UK current tax is calculated at 19% (2018: 19%) of the estimated assessable profit for the year, net of relief for overseas taxes where available. Taxation in other jurisdictions is calculated at the rates prevailing in the relevant jurisdictions.
Cash tax paid in the year was £647 million (2018: £567 million). The variance between the current year tax charge of £640 million and cash tax paid is attributable to movements on non-current tax liabilities (shown in Note 21) and timing differences arising between accrual and payment of income tax liabilities.
Origination and reversal of temporary differences includes adjustments in respect of prior periods of £12 million expense (2018: £22 million expense).
N OT ES TO T H E F I N A N C I A L S TAT E M E N T S CO N T I N U ED

S T R AT E G I C R E P O R T G O V E R N A N C E F I N A N C I A L S TAT E M E N T S
169Reckitt Benckiser Group plc (RB) Annual Report and Financial Statements 2019
7 Income Tax Expense continuedThe total tax charge on the Group’s profits for the year can be reconciled to the notional tax charge calculated at the UK tax rate as follows:
Continuing operations2019
£m
2018 (Restated)1
£m
(Loss)/Profit before income tax (2,107) 2,720Tax at the notional UK corporation tax rate of 19% (2018: 19%) (400) 517Effect of:Overseas tax rates 77 (79)Movement in provision related to uncertain tax positions (46) 78Unrecognised tax losses and other unrecognised tax assets (42) (44)Withholding and local taxes 71 74Reassessment of prior year estimates 48 (10)Impact of changes in tax rates (1) –Adjusting items 965 4Other permanent differences (7) (4)
Income tax expense/(benefit) 665 536
1 Restated for the adoption of IFRS 16 (see Note 31).
Our effective tax rate in any given financial year reflects a variety of factors that may not be present in succeeding financial years, and may be affected by variations in profit mix and changes in tax laws, regulations and related interpretations.
The effect of overseas tax rates represents the impact of profits arising outside the UK that are taxed at different rates to the UK rate.
Unrecognised tax losses and other unrecognised tax assets arising in 2019 primarily relates to income offset by previously unrecognised losses.
Withholding and local taxes includes a provision for deferred tax on unremitted earnings (Note 11). This charge is expected to arise on planned repatriations of retained earnings from overseas subsidiaries in future periods.
The reassessment of prior year estimates includes settlement reached following conclusion of tax authority review and differences between final tax return submissions and liabilities accrued in these financial statements.
Adjusting items principally relate to the non-deductible impairment of goodwill in IFCN.
We conduct business operations in a number of countries, and are therefore subject to tax and intercompany pricing laws in multiple jurisdictions. We have in the past faced, and may in the future face, audits and challenges brought by tax authorities, and we are involved in ongoing tax investigations in a number of countries. If material challenges were to be successful, our effective tax rate may increase, we may be required to modify structures at significant costs to us, we may also be subject to interest and penalty charges and we may incur costs in defending litigation or reaching a settlement. Any of the foregoing could materially and adversely affect our business, financial position and results of operations.
EC State AidOn 25 April 2019 the European Commission (“EC”) released its decision concluding that the UK Controlled Foreign Company (“CFC”) Legislation up to 31 December 2018 partially represented State Aid. On 12 June 2019 the UK government applied to annul the EC decision.
The Group’s application to annul the EC decision on the CFC Group Financing Exemption was registered in the General Court on 4 November 2019. Our application has been stayed pending the outcome of appeals made by the UK government. Management’s assessment is that no provision is required at this time.

170 Reckitt Benckiser Group plc (RB) Annual Report and Financial Statements 2019
7 Income Tax Expense continuedThe tax credit/(charge) relating to components of other comprehensive income is as follows:
2019 2018
Before tax £m
Tax (charge)/credit
£mAfter tax
£mBefore tax
£m
Tax (charge)/credit
£mAfter tax
£m
Net exchange (losses)/gains on foreign currency translation (579) – (579) 59 8 67Gains/(losses) on cash flow and net investment hedges 60 1 61 (38) 2 (36)Remeasurement of defined benefit pension plans (Note 22) 12 2 14 149 (26) 123Revaluation of equity instruments – FVOCI (13) – (13) – – –
Other comprehensive (loss)/income (520) 3 (517) 170 (16) 154
Current tax – 6Deferred tax (Note 11) 3 (22)
3 (16)
The tax credited/(charged) directly to the Statement of Changes in Equity during the year is as follows:2019
£m2018
£m
Current tax 4 7Deferred tax (Note 11) – (12)
4 (5)
8 Earnings per share
2019 pence
2018 (Restated)1
pence
Basic (loss)/earnings per shareFrom continuing operations (393.0) 306.6From discontinued operations (126.7) (0.7)
Total basic (loss)/earnings per share (519.7) 305.9Diluted (loss)/earnings per share
From continuing operations (393.0) 305.2From discontinued operations (126.7) (0.7)
Total diluted (loss)/earnings per share (519.7) 304.5Adjusted basic earnings per share
From continuing operations 349.0 341.1From discontinued operations – –
Total adjusted basic earnings per share 349.0 341.1Adjusted diluted earnings per share
From continuing operations 349.0 339.6From discontinued operations – –
Total adjusted diluted earnings per share 349.0 339.6
1 Restated for the adoption of IFRS 16 (see Note 31).
BasicBasic earnings per share is calculated by dividing the net (loss)/income attributable to owners of the parent company from continuing operations (2019: £2,785 million loss; 2018: £2,164 million income) and discontinued operations (2019: £898 million loss; 2018: £5 million loss) by the weighted average number of ordinary shares in issue during the year (2019: 708,688,420; 2018: 705,903,566).
N OT ES TO T H E F I N A N C I A L S TAT E M E N T S CO N T I N U ED

S T R AT E G I C R E P O R T G O V E R N A N C E F I N A N C I A L S TAT E M E N T S
171Reckitt Benckiser Group plc (RB) Annual Report and Financial Statements 2019
8 Earnings per share continuedDilutedDiluted earnings per share is calculated by adjusting the weighted average number of shares outstanding to assume conversion of all potentially dilutive ordinary shares. The Company has the following categories of potentially dilutive ordinary shares: Executive Share Awards (including Executive Share Options and Executive Restricted Share Scheme Awards) and Employee Sharesave Scheme Options. The options only dilute earnings when they result in the issue of shares at a value below the market price of the share and when all performance criteria (if applicable) have been met. As at 31 December 2019 there were 7,970,362 (2018: 4,628,897) Executive Share Awards excluded from the dilution because the exercise price for the options was greater than the average share price for the year or the performance criteria have not been met. In 2019, there were potential dilutive ordinary shares of 6,736,386 Executive Share Awards and 1,355,909 Employee Sharesave Scheme Options excluded from the dilution. As there is a net loss from continuing operations in 2019, the effect of these potentially dilutive shares is anti-dilutive.
2019 Average number
of shares
2018 Average number
of shares
On a basic basis 708,688,420 705,903,566Dilution for Executive Share Awards1 – 2,908,086Dilution for Employee Sharesave Scheme Options outstanding1 – 192,973
On a diluted basis 708,688,420 709,004,625
1 As there is a loss in 2019, the effect of potentially dilutive shares is anti-dilutive.
Adjusted earningsDetails of the adjusted net income attributable to owners of the parent company are as follows:
Continuing operations2019
£m
2018 (Restated)1
£m
Net (loss)/income attributable to owners of the parent company (2,785) 2,164Exceptional items, net of tax (Note 3) 5,195 183Other Adjusting items, net of tax (Note 3) 63 61
Adjusted net income attributable to owners of the parent company 2,473 2,408
1 Restated for the adoption of IFRS 16 (see Note 31).
Discontinued operations2019
£m2018
£m
Net (loss) attributable to owners of the parent company (898) (5)Exceptional items, net of tax (Note 3) 898 5
Adjusted net income attributable to owners of the parent company – –

172 Reckitt Benckiser Group plc (RB) Annual Report and Financial Statements 2019
9 Goodwill and other intangible assetsBrands
£mGoodwill
£mSoftware
£mOther
£mTotal
£m
CostAt 1 January 2018 17,888 11,519 215 165 29,787Additions – – 94 – 94Arising on business combinations – 28 – – 28Disposals – – (10) – (10)Exchange adjustments 482 304 4 3 793
At 31 December 2018 18,370 11,851 303 168 30,692
Additions 1 – 136 – 137Arising on business combinations – 14 – – 14Disposals – – (3) (1) (4)Reclassifications – – (11) 11 –Exchange adjustments (560) (349) (9) (3) (921)
At 31 December 2019 17,811 11,516 416 175 29,918
Accumulated amortisation and impairmentAt 1 January 2018 188 18 63 31 300Amortisation and impairment 61 – 38 22 121Disposals – – (8) – (8)Exchange adjustments 1 – – – 1
At 31 December 2018 250 18 93 53 414
Amortisation and impairment 141 5,037 48 23 5,249Disposals – – (3) – (3)Exchange adjustments (1) (1) (2) 1 (3)
At 31 December 2019 390 5,054 136 77 5,657
Net book valueAt 31 December 2018 18,120 11,833 210 115 30,278
At 31 December 2019 17,421 6,462 280 98 24,261
The amount stated for brands represents the fair value of brands acquired since 1985 at the date of acquisition. Other includes product registration, distribution rights, capitalised product development costs and customer contracts.
Software includes intangible assets under construction of £55 million (2018: £47 million).
N OT ES TO T H E F I N A N C I A L S TAT E M E N T S CO N T I N U ED

S T R AT E G I C R E P O R T G O V E R N A N C E F I N A N C I A L S TAT E M E N T S
173Reckitt Benckiser Group plc (RB) Annual Report and Financial Statements 2019
9 Goodwill and other intangible assets continuedThe majority of brands, all of goodwill and certain other intangibles are considered to have indefinite lives for the reasons noted in the Accounting Policies and therefore are subject to an annual impairment review. The MJN global brand, acquired MJN WIC contracts and a number of small non-core brands are deemed to have a finite life and are amortised accordingly. Amortisation is recognised in net operating expenses.
The net book values of indefinite and finite life intangible assets are as follows:
Net book value2019
£m2018
£m
Indefinite life assetsBrands 16,989 17,616Goodwill 6,462 11,833Other 49 42
Total indefinite life assets 23,500 29,491
Finite life assetsBrands 432 504Software 280 210Other 49 73
Total finite life assets 761 787
Total net book value of intangible assets 24,261 30,278
Cash Generating UnitsGoodwill and other intangible assets with indefinite lives are allocated to either individual cash generating units (CGUs), or groups of cash generating units (together ‘GCGUs’). The goodwill and intangible assets with indefinite lives are tested for impairment at the level at which identifiable cash inflows are largely independent. Generally this is at a GCGU level, but for certain intangible assets this is at a CGU level.
After considering all the evidence available, including how brand and production assets generate cash inflows and how management monitors the business, the Directors have concluded that for the purpose of impairment testing of goodwill and other intangible assets, the Group’s GCGUs are as follows: Health, Hygiene Home and IFCN.
An analysis of the net book value of indefinite life assets and goodwill by GCGU is shown below:
2019 2018
GCGU Power brands
Indefinite life assets
£mGoodwill
£mTotal
£m
Indefinite life assets
£mGoodwill
£mTotal
£m
Health Durex, Gaviscon, Mucinex, Nurofen, Scholl, Strepsils, Clearasil, Dettol, Veet 7,087 3,671 10,758 7,405 3,783 11,188
Hygiene Home Cillit Bang, Finish, Harpic, Lysol, Mortein, Air Wick, Calgon, Vanish, Woolite 1,784 45 1,829 1,851 45 1,896
IFCN Enfamil, Nutramigen 8,167 2,746 10,913 8,402 8,005 16,407
17,038 6,462 23,500 17,658 11,833 29,491
Within the Health GCGU, the cash flows of certain brands are separately identifiable. As a result, the carrying values of the associated indefinite life assets have been tested for impairment as CGUs. This is in addition to the impairment testing over the Health GCGU. The CGUs tested separately in 2019 are shown below. Brazilian Sexual Wellbeing was not tested in 2019 as changes to its factory brand mix meant that the associated cash flows were no longer separately identifiable.
Indefinite life assets excluding goodwill (post impairment)2019
£m2018
£m
Sexual Wellbeing 2,167 2,229Oriental Pharma 47 128

174 Reckitt Benckiser Group plc (RB) Annual Report and Financial Statements 2019
9 Goodwill and other intangible assets continuedAnnual Impairment ReviewGoodwill and other indefinite life intangible assets must be tested for impairment on at least an annual basis. An impairment loss is recognised when the recoverable amount of a GCGU or CGU falls materially below its net book value at the date of testing.
The determination of recoverable amount, being the higher of value-in-use and fair value less costs to dispose, is inherently judgemental and requires management to make multiple estimates, for example around individual market pressures and forces, future price and volume growth, future margins, terminal growth rates and discount rates.
When forecasting the annual cashflows that support the recoverable amount calculations, the Group generally uses its short-term budgets and medium-term strategic plans, with additional senior management and board-level review. Cashflows beyond the five-year period are projected using steady or progressively declining growth rates followed by a terminal growth rate. These rates do not exceed the long-term average growth rate for the products and markets in which the GCGU or CGU operates.
The cashflows are discounted back to their present value using a pre-tax rate considered appropriate for each GCGU and CGU. In 2019, as in 2018, these rates have been derived from management’s views on the relevant weighted average cost of capital, subsequently converted to the pre-tax equivalent rate.
For the Health and Hygiene Home GCGUs as well as the Sexual Wellbeing CGU, any reasonably possible change in the key valuation assumptions would not imply possible impairment. As in 2018, each of these assessments utilised a pre-tax discount rate of 10% and a terminal growth rate of either 3% (Health and Sexual Wellbeing) or 2% (Hygiene Home).
Refer below for further details regarding the IFCN GCGU and the Oriental Pharma CGU.
IFCNOn 15 June 2017, the Group acquired 100% of the issued share capital of MJN for cash consideration of £13,044 million ($16,642 million). The acquisition was treated as a business combination and hence both the assets acquired, and liabilities assumed, were brought onto the Group Balance Sheet at their fair value.
In 2018, the IFCN impairment assessment indicated that the IFCN recoverable amount exceeded the net book value by less than 10 percent. This was largely expected given the original 2017 fair valuation exercise and the 2018 disruption at our European manufacturing plant which negatively impacted supply to a number of markets, in particular China. Given the lack of headroom, relevant sensitivity disclosures were included in the 2018 Annual Report and Financial Statements.
As 2019 progressed, IFCN financials fell below forecasts. This was primarily due to:
• increased competition in China, particularly from domestic infant nutrition companies;
• an ongoing weakening of China market growth as a result of lower-than-expected birth rates;
• disruption to Hong Kong cross-border trade, leading to a loss of customers using this channel;
• tougher than expected trading conditions in ASEAN and LATAM;
• increased investment within the IFCN supply chain in order to provide increased resilience and long-term flexibility; and
• a longer and more challenging process relating to the integration of MJN within the wider RB Group.
In response to its assessment of these drivers, the Group revised down in late 2019 its short and medium-term expectations relating to IFCN net revenue and margins. These updated expectations were incorporated into the 2019 IFCN impairment assessment, which was performed as of 31 December 2019.
The tables below show the expected growth rates included within both the 2019 impairment assessment and the 2018 impairment assessment. In the 2019 assessment, management has assumed that net revenue growth over the medium-term (2025 to 2029) will be consistent with the terminal growth rate (applied from 2030 onwards) and that margins will remain reasonably stable.
2019
Annual growth in Net Revenue between 2020 and 20291 2% to 4%Annual growth in Gross Margin between 2020 and 20291 2% to 4%
2018
Annual growth in Net Revenue between 2019 and 20281 3% to 6%Annual growth in Gross Margin between 2019 and 20281 4% to 9%
1 At constant exchange rates, excluding the impact of future foreign exchange movements.
N OT ES TO T H E F I N A N C I A L S TAT E M E N T S CO N T I N U ED

S T R AT E G I C R E P O R T G O V E R N A N C E F I N A N C I A L S TAT E M E N T S
175Reckitt Benckiser Group plc (RB) Annual Report and Financial Statements 2019
9 Goodwill and other intangible assets continuedThe 2019 assessment indicated that the recoverable amount was equal to £9,890m. The recoverable amount was calculated on a value-in-use basis using an implied pre-tax discount rate of 9.0% (2018: 10.0%) and an IFCN-specific terminal growth rate of 2.5% (2018: 3.0%).
As a result, the Group has recognised an impairment loss of £5,037m. In accordance with IFRS, this impairment loss has been fully recognised against IFCN goodwill recognised on acquisition and subsequently reported within the Health operating segment.
Given its nature and size, the IFCN recoverable amount incorporates multiple key estimates. These are summarised in the table below.
Key estimates Commentary
Greater China market In the short to medium-term, management expects that Greater China will continue to be impacted by increased competition and regulation combined with generally subdued domestic birth rates.
US market In the US, management expects to benefit from reasonably stable market conditions. Tendering for WIC contracts is expected to remain highly competitive.
Net Revenue In the short to medium-term, management expects to achieve Net Revenue growth (excluding the impact of foreign exchange movements) of between 2% and 4% per annum. This is expected to be achieved though ongoing premiumisation, price growth and volume growth.
Margins In the short to medium-term, management has assumed that IFCN will generally be able to maintain current actual margins (both gross and operating).
Discount rate As in prior years, management engaged a third-party expert to help calculate an IFCN-specific weighted-average cost of capital (WACC) and the implied pre-tax discount rate. In addition, management performed benchmarking against other comparable companies. For valuation purposes, management used the mid-point of the calculated range. The current year movement in the discount rate is primarily due to the incorporation of additional risk and inflation-rate differentials within the underlying cashflows rather than within the discount rate.
Terminal growth rate As in prior years, management engaged a third-party expert to help calculate an IFCN-specific terminal growth rate. Management is satisfied with the reasonableness of this rate when compared against independent market growth projections and long-term country inflation rates.
Following the recognition of the impairment loss in 2019, there is now no headroom between the IFCN recoverable amount and the IFCN carrying value. Consequently, any material deterioration in the macro or business-level assumptions supporting the IFCN recoverable amount as of 31 December 2019 would necessitate the recognition of further impairment losses.
The table below shows the sensitivity of the 2019 valuation to reasonable changes in key assumptions. The table assumes no related response by management (e.g. to drive further cost savings) and is hence theoretical in nature.
(£m)
Expected Net Revenue growth rates (2020 to 2029) adjusted by 100 bps +/- 1,000Expected EBIT growth rates (2020 to 2029) adjusted by 100 bps +/- 700Terminal growth rate (applied from 2030) adjusted by 50 bps +/- 700Pre-tax discount rate adjusted by 50 bps +/- 800
Despite the recognition of the current year impairment loss, management remains confident about the long-term prospects of IFCN. Since 2017, the strength of the IFCN innovation pipeline has improved and the benefits of this are expected to be seen over coming years. In addition, management is working to progress and capitalise on multiple “white space” opportunities, the potential benefits of which have not been incorporated into the 2019 IFCN valuation in accordance with IFRS.
Oriental PharmaFollowing the 2019 impairment assessment (performed as of 31 December 2019), management recognised a £79 million impairment loss relating to the Oriental Pharma CGU. The incurrence of this loss was due to lower than expected growth compared to 2019 forecasts and a subsequent reassessment of future growth expectations.
The impairment loss was calculated on a value-in-use basis using a pre-tax discount rate of 15.0% (2018: 13.3%) and a terminal growth rate of 3.0% (2018: 3.0%). The loss impacted intangible assets included within the Health operating segment. The remaining net book value is £62 million.

176 Reckitt Benckiser Group plc (RB) Annual Report and Financial Statements 2019
10 Property, Plant and EquipmentLand and buildings
£m
Plant and equipment
£m
Right-of-use Assets
£m
Assets under construction
£mTotal
£m
CostAt 1 January 2018 (Restated)1 1,062 1,696 386 236 3,380Additions 24 61 58 244 387Disposals (18) (35) (70) – (123)Reclassifications 35 121 – (156) –Exchange adjustments 14 14 – 3 31
At 31 December 2018 (Restated)1 1,117 1,857 374 327 3,675
Additions 14 53 69 239 375Disposals (3) (54) (75) (2) (134)Reclassifications 67 164 – (231) –Exchange adjustments (43) (83) (15) (9) (150)
At 31 December 2019 1,152 1,937 353 324 3,766
Accumulated depreciation and impairmentAt 1 January 2018 (Restated)1 282 958 72 – 1,312Charge for the year 54 169 60 – 283Disposals (2) (26) (62) – (90)Impairment 5 1 – – 6Reclassifications 2 (2) – – –Exchange adjustments 2 – – – 2
At 31 December 2018 (Restated)1 343 1,100 70 – 1,513
Charge for the year 57 180 66 – 303Disposals (3) (40) (69) – (112)Impairment – 2 – – 2Exchange adjustments (16) (61) (3) – (80)
At 31 December 2019 381 1,181 64 – 1,626
Net book valueAs at 31 December 2018 (Restated)1 774 757 304 327 2,162
As at 31 December 2019 771 756 289 324 2,140
1 Restated for the adoption of IFRS 16 (see Note 31).
At 31 December 2019, the Group’s right-of-use assets included land & buildings of £268 million (2018: £277 million) and other assets of £21 million (2018: £27 million). The Group recognised depreciation of £54 million (2018: £49 million) on the land & buildings and depreciation of £12 million (2018: £11 million) on the other assets.
The Group has commitments to purchase property, plant and equipment of £59 million (2018: £48 million).
11 Deferred Tax
Deferred tax
Accelerated capital
allowances £m
Intangible assets
£m
Short-term temporary
differences £m
Tax losses £m
Retirement benefit
obligations £m
Total £m
At 1 January 2019 (24) (3,848) 409 24 29 (3,410)(Charged)/credited to the Income Statement (19) 18 (19) 22 9 11Credited/(charged) to other comprehensive income – – 1 – 2 3Exchange differences 1 120 (10) (2) (2) 107
At 31 December 2019 (42) (3,710) 381 44 38 (3,289)
N OT ES TO T H E F I N A N C I A L S TAT E M E N T S CO N T I N U ED
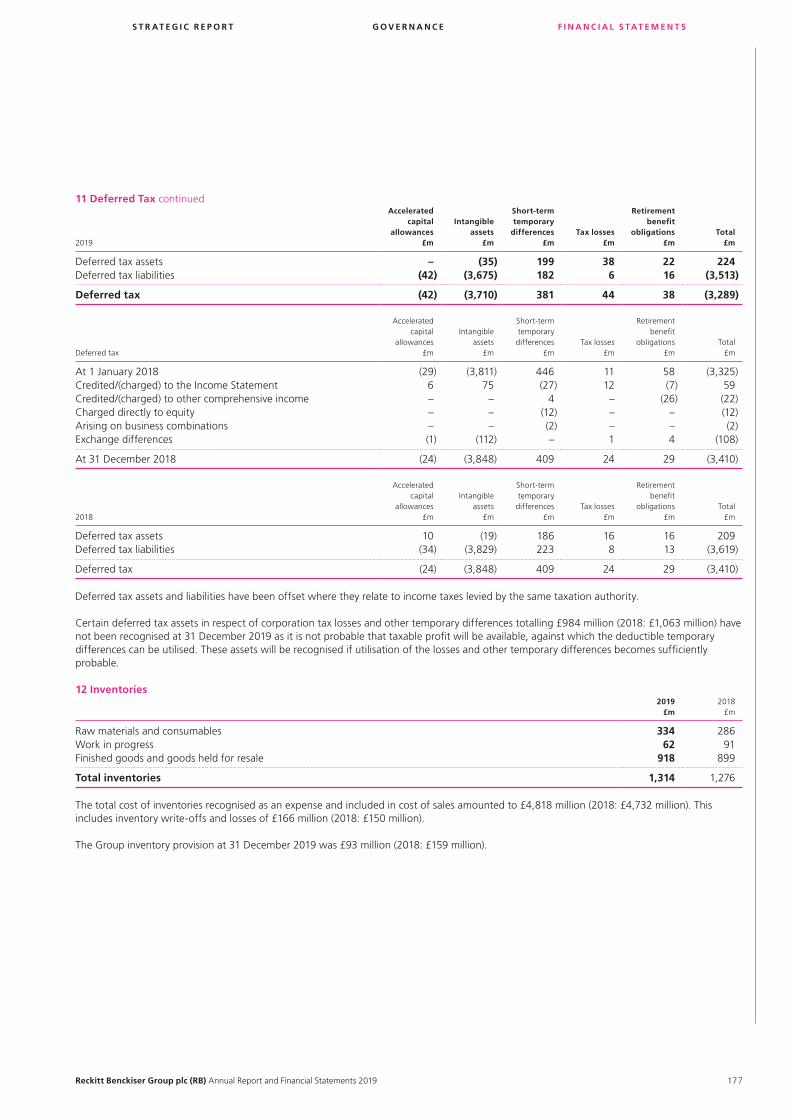
S T R AT E G I C R E P O R T G O V E R N A N C E F I N A N C I A L S TAT E M E N T S
177Reckitt Benckiser Group plc (RB) Annual Report and Financial Statements 2019
11 Deferred Tax continued
2019
Accelerated capital
allowances £m
Intangible assets
£m
Short-term temporary
differences £m
Tax losses £m
Retirement benefit
obligations £m
Total £m
Deferred tax assets – (35) 199 38 22 224Deferred tax liabilities (42) (3,675) 182 6 16 (3,513)
Deferred tax (42) (3,710) 381 44 38 (3,289)
Deferred tax
Accelerated capital
allowances £m
Intangible assets
£m
Short-term temporary
differences £m
Tax losses £m
Retirement benefit
obligations £m
Total £m
At 1 January 2018 (29) (3,811) 446 11 58 (3,325)Credited/(charged) to the Income Statement 6 75 (27) 12 (7) 59Credited/(charged) to other comprehensive income – – 4 – (26) (22)Charged directly to equity – – (12) – – (12)Arising on business combinations – – (2) – – (2)Exchange differences (1) (112) – 1 4 (108)
At 31 December 2018 (24) (3,848) 409 24 29 (3,410)
2018
Accelerated capital
allowances £m
Intangible assets
£m
Short-term temporary
differences £m
Tax losses £m
Retirement benefit
obligations £m
Total £m
Deferred tax assets 10 (19) 186 16 16 209Deferred tax liabilities (34) (3,829) 223 8 13 (3,619)
Deferred tax (24) (3,848) 409 24 29 (3,410)
Deferred tax assets and liabilities have been offset where they relate to income taxes levied by the same taxation authority.
Certain deferred tax assets in respect of corporation tax losses and other temporary differences totalling £984 million (2018: £1,063 million) have not been recognised at 31 December 2019 as it is not probable that taxable profit will be available, against which the deductible temporary differences can be utilised. These assets will be recognised if utilisation of the losses and other temporary differences becomes sufficiently probable.
12 Inventories2019
£m2018
£m
Raw materials and consumables 334 286Work in progress 62 91Finished goods and goods held for resale 918 899
Total inventories 1,314 1,276
The total cost of inventories recognised as an expense and included in cost of sales amounted to £4,818 million (2018: £4,732 million). This includes inventory write-offs and losses of £166 million (2018: £150 million).
The Group inventory provision at 31 December 2019 was £93 million (2018: £159 million).

178 Reckitt Benckiser Group plc (RB) Annual Report and Financial Statements 2019
13 Trade and Other Receivables
Amounts falling due within one year2019
£m2018
£m
Trade receivables 1,778 1,902Less: Provision for impairment of receivables (62) (67)
Trade receivables – net 1,716 1,835Other receivables 283 192Prepayments and accrued income 80 70
Trade and other receivables 2,079 2,097
The carrying amounts of the Group’s trade and other receivables are denominated in the following currencies:
Currency analysis2019
£m2018
£m
US dollar 655 687Euro 319 299Brazil real 127 120Sterling 121 128Other currencies 857 863
Trade and other receivables 2,079 2,097
The maximum exposure to credit risk at the year end is the carrying value of each class of receivable mentioned above.
a Trade ReceivablesTrade receivables consist of amounts due from customers. The Group’s customer base is large and diverse and consequently there is limited concentration of credit risk. Credit risk is assessed at a subsidiary and Group level and takes into account the financial positions of customers, past experiences, future expectations and other relevant factors. Individual credit limits are imposed based on those factors.
The following table provides an ageing analysis of trade receivables at year end:
Ageing analysis2019
£m2018
£m
Not overdue 1,455 1,538Up to 3 months overdue 259 311Over 3 months overdue 64 53
Trade receivables 1,778 1,902
At 31 December 2019, a provision of £62 million (2018: £67 million) was recorded against certain trade receivables based on a forward-looking assessment of the lifetime expected credit loss as required by IFRS 9. This assessment considered the ageing profiles of specific trade receivable balances along with the risk of future customer defaults.
As at 31 December 2019, trade receivables of £261 million (2018: £297 million) were past due but not impaired. These receivables were not impaired because having considered their nature and historical collection, recovery of the unprovided amounts is expected in due course.
b Other ReceivablesOther Receivables includes recoverable sales tax of £202 million (2018: £121 million). This contains £3 million (2018: £4 million) of impaired assets all aged over three months from a broad range of countries within the Group.
c Other Non-current ReceivablesOther non-current receivables at 31 December 2019 of £155 million (2018: £109 million) includes non-current recoverable sales tax, long-term prepayments and investments.
N OT ES TO T H E F I N A N C I A L S TAT E M E N T S CO N T I N U ED

S T R AT E G I C R E P O R T G O V E R N A N C E F I N A N C I A L S TAT E M E N T S
179Reckitt Benckiser Group plc (RB) Annual Report and Financial Statements 2019
14 Financial Instruments and Financial Risk ManagementFinancial Instruments by Category
At 31 December 2019
Amortised cost £m
Derivatives used for hedging
£m
Fair value through the
Income Statement
£m
Equity Instruments
– FVOCI £m
Carrying value total
£m
Assets as per the Balance SheetTrade and other receivables1 2,096 – – – 2,096Derivative financial instruments – FX forward exchange contracts – 26 4 – 30Equity Instruments – FVOCI2 – – – 58 58Cash and cash equivalents 1,549 – – – 1,549
Liabilities as per the Balance SheetBorrowings (commercial paper, bank loans & overdrafts)3 3,009 – – – 3,009Lease obligations3 325 – – – 325Bonds 6,201 – – – 6,201Senior notes 1,834 – – – 1,834Term loans 826 – – – 826Derivative financial instruments – FX forward exchange contracts – 28 109 – 137Derivative financial instruments – Interest rate swaps – 1 – – 1Trade and other payables4 4,671 – – – 4,671Other non-current liabilities4,5 190 – – – 190
At 31 December 2018Amortised cost
£m
Derivatives used for hedging
£m
Fair value through the
Income Statement
£m
Equity Instruments
– FVOCI £m
Carrying value total
£m
Assets as per the Balance SheetTrade and other receivables1 2,086 – – – 2,086Derivative financial instruments – FX forward exchange contracts – 24 15 – 39Equity Instruments – FVOCI2 – – – 53 53Cash and cash equivalents 1,483 – – – 1,483
Liabilities as per the Balance SheetBorrowings (commercial paper, bank loans & overdrafts)3 1,648 – – – 1,648Lease obligations3.6 340 – – – 340Bonds 6,440 – – – 6,440Senior notes 2,464 – – – 2,464Term loans 1,326 – – – 1,326Derivative financial instruments – FX forward exchange contracts – 17 9 – 26Derivative financial instruments – Interest rate swaps – 16 – – 16Trade and other payables4 4,664 – – – 4,664Other non-current liabilities4,5 224 – – – 224
1. Prepayments and employee benefit assets are excluded from the trade and other receivables balance as they are out of scope of IFRS 7.2. Equity instruments – FVOCI relate to an investment of less than 1% of the shares in issue of China Resources Pharmaceutical Group Limited (CRP) and an investment in Pharmapacks, LLC.3. The categories in this disclosure are determined by IFRS 9. Borrowings largely relate to commercial paper. As at 31 December 2019, the Group had commercial paper in issue amounting to
$2,028 million (nominal values) at the rate of between 1.8% and 2.78% with maturities ranging from 2 January 2020 to 31 July 2020, and €1,750 million (nominal values) at the rate of between negative 0.15% and negative 0.35% with maturities ranging from 23 January 2020 to 12 August 2020. Lease obligations are outside the scope of IFRS 9, but they remain within the scope of IFRS 7. Therefore lease obligations have been shown separately.
4. Social security liabilities, other employee benefit liabilities, and interest accrued on tax balances are excluded as they are out of scope of IFRS 7.5. Other non-current liabilities principally comprise put options over the non-controlling interests of certain Group subsidiaries in China of £135 million (2018: £148 million). Refer to Note 26
for further details.6. Restated for the adoption of IFRS16 (Note 31).

180 Reckitt Benckiser Group plc (RB) Annual Report and Financial Statements 2019
14 Financial Instruments and Financial Risk Management continuedThe fair value measurement hierarchy levels have been defined as follows:
• Quoted prices (unadjusted) in active markets for identical assets or liabilities (level 1).
• Inputs other than quoted prices included within level 1 that are observable for the asset or liability, either directly (i.e. as prices) or indirectly (i.e. derived from prices) (level 2). If all significant inputs required to fair value an instrument are observable, the instrument is included in level 2.
• Inputs for the asset or liability that are not based on observable market data (i.e. unobservable inputs) (level 3).
The following table categorises the Group’s financial assets and liabilities held at fair value by the valuation methodology applied in determining their fair value.
Level 1 £m
Level 2 £m
Level 3 £m
Total £m
At 31 December 2019Assets as per the Balance SheetDerivative financial instruments – FX forward exchange contracts 30 30Equity Instruments – FVOCI 30 28 58
Liabilities as per the Balance SheetDerivative financial instruments – FX forward exchange contracts 137 137Derivative financial instruments – Interest rate swaps 1 1
Level 1 £m
Level 2 £m
Level 3 £m
Total £m
At 31 December 2018Assets as per the Balance SheetDerivative financial instruments – FX forward exchange contracts 39 39Equity Instruments – FVOCI 44 9 53
Liabilities as per the Balance SheetDerivative financial instruments – FX forward exchange contracts 26 26Derivative financial instruments – Interest rate swaps 16 16
The fair value of forward foreign exchange contracts was determined using forward exchange rates derived from market sourced data at the Balance Sheet date, with the resulting value discounted back to present value (level 2 classification). The fair value of Equity Instruments – FVOCI was determined using both quoted share price information (level 1 classification) and other non-market information (level 3 classification).
The fair value of the interest rate swap contracts was calculated using discounted future cash flows at floating market rates (level 2 classification).
Except for the bonds and senior notes, the fair values of other financial assets and liabilities at amortised cost approximate their carrying values. The fair value of the bonds as at 31 December 2019 is a liability of £6,325 million (2018: £6,175 million) and the fair value of the senior notes as at 31 December 2019 is a liability of £1,950 million (2018: £2,432 million). The fair value of the bonds and senior notes was derived using quoted market rates in an active market (level 1 classification).
N OT ES TO T H E F I N A N C I A L S TAT E M E N T S CO N T I N U ED

S T R AT E G I C R E P O R T G O V E R N A N C E F I N A N C I A L S TAT E M E N T S
181Reckitt Benckiser Group plc (RB) Annual Report and Financial Statements 2019
14 Financial Instruments and Financial Risk Management continuedOffsetting financial assets and financial liabilitiesThe Group has forward foreign exchange contracts and cash that are subject to enforceable master netting arrangements. The following tables set out the carrying amounts of the recognised financial instruments that are subject to these agreements.
(a) Financial assets
At 31 December 2019
Gross amounts of recognised
financial assets
£m
Gross amounts of recognised
financial liabilities set
off in the Balance
Sheet £m
Net amounts of financial
assets presented in the Balance
Sheet £m
Financial instruments
not set off in the Balance
Sheet £m
Net amount £m
Forward foreign exchange contracts 30 – 30 (28) 2Cash and cash equivalents 1,549 – 1,549 – 1,549
1,579 – 1,579 (28) 1,551
At 31 December 2018
Gross amounts of recognised
financial assets
£m
Gross amounts of recognised
financial liabilities set
off in the Balance
Sheet £m
Net amounts of financial
assets presented in the Balance
Sheet £m
Financial instruments
not set off in the Balance
Sheet £m
Net amount £m
Forward foreign exchange contracts 39 – 39 (21) 18Cash and cash equivalents 1,483 – 1,483 – 1,483
1,522 – 1,522 (21) 1,501
(b) Financial liabilities
As at 31 December 2019
Gross amounts of recognised
financial liabilities
£m
Gross amounts of recognised
financial assets set off
in the Balance
Sheet £m
Net amounts of financial
liabilities presented in the Balance
Sheet £m
Financial instruments
not set off in the Balance
Sheet £m
Net amount £m
Forward foreign exchange contracts (137) – (137) 28 (109)Interest rate swaps (1) – (1) – (1)Bank overdrafts (2) – (2) – (2)
(140) – (140) 28 (112)
As at 31 December 2018
Gross amounts of recognised
financial liabilities
£m
Gross amounts of recognised
financial assets set off
in the Balance
Sheet £m
Net amounts of financial
liabilities presented in the Balance
Sheet £m
Financial instruments
not set off in the Balance
Sheet £m
Net amount £m
Forward foreign exchange contracts (26) – (26) 21 (5)Interest rate swaps (16) – (16) – (16)Bank overdrafts (6) – (6) – (6)
(48) – (48) 21 (27)

182 Reckitt Benckiser Group plc (RB) Annual Report and Financial Statements 2019
14 Financial Instruments and Financial Risk Management continuedFinancial Risk ManagementThe Group’s multinational operations expose it to a variety of financial risks that include the effects of changes in foreign currency exchange rates (foreign exchange risk), market prices, interest rates, credit risks and liquidity. The Group has in place a risk management programme that uses foreign currency financial instruments, including debt, and other instruments, to limit the impact of these risks on the financial performance of the Group.
The Group’s financing and financial risk management activities are centralised into Group Treasury (‘GT’) to achieve benefits of scale and control. GT manages financial exposures of the Group centrally in a manner consistent with underlying business risks. GT manages only those risks and flows generated by the underlying commercial operations, speculative transactions are not undertaken.
The Board of Directors review and agrees policies, guidelines and authority levels for all areas of Treasury activity and individually approves significant activities. GT operates under the close control of the CFO and is subject to periodic independent reviews and audits, both internal and external.
1. Market Risk(a) Currency riskThe Group operates internationally and enters into transactions in many currencies and as such is exposed to foreign exchange risk arising from various currency exposures. Foreign exchange risk arises from future commercial transactions, recognised assets and liabilities and net investments in foreign operations.
The Group’s policy is to align interest costs and operating profit of its major currencies in order to provide some protection against the translation exposure on foreign currency profits after tax. The Group may undertake borrowings and other hedging methods in the currencies of the countries where most of its assets are located.
It is the Group’s policy to monitor and only where appropriate hedge its foreign currency transaction exposure. These transaction exposures arise mainly from foreign currency receipts and payments for goods and services and from the remittances of foreign currency dividends and loans. Where the Group enters into hedges and applies hedge accounting, hedges are documented and tested for effectiveness on an ongoing basis with any ineffectiveness recorded in the Income Statement.
The local business units enter into forward foreign exchange contracts with GT to manage these exposures where practical and allowed by local regulations. GT matches the Group exposures, and hedges the position where possible, using spot and forward foreign currency exchange contracts.
The Group’s strategy is to minimise Income Statement volatility by monitoring foreign currency balances, external financing, and external hedging arrangements. The Group’s hedging profile is regularly reviewed to ensure it is appropriate and to mitigate these risks as far as possible.
The notional principal amount of the outstanding forward foreign exchange contracts at 31 December 2019 was £6,190 million payable (2018: £4,486 million payable).
As at 31 December 2019, the Group had designated bonds totalling $500 million (2018: $500 million) as the hedging instrument in a net investment hedge relationship. The hedged risk is the foreign exchange currency risk on the value of the Group’s net investments in US dollars. Possible sources of ineffectiveness include any impairments to the Group’s net investments in US dollars. The hedges are documented and are assessed for effectiveness on an ongoing basis.
As at 31 December 2019, the Group had designated commercial paper totalling €1,472 million (2018: €1,000 million), for which the carrying value was equal to the fair value, as the hedging instrument in a net investment hedge relationship. The hedged risk is the foreign exchange currency risk on the value of the Group’s net investments in Euros. The hedges are documented and are assessed for effectiveness on an ongoing basis.
The net gain or loss under these arrangements are recognised in other comprehensive income. The net effect on other comprehensive income for the year ended 31 December 2019 was a £70 million gain (2018: £44 million loss). If sterling strengthens/weakens by 5% against the US dollar and Euro, the maximum impact on Shareholders’ equity due to net investment hedging by US dollar bond and Euro commercial paper would be £77 million and £85 million respectively.
N OT ES TO T H E F I N A N C I A L S TAT E M E N T S CO N T I N U ED

S T R AT E G I C R E P O R T G O V E R N A N C E F I N A N C I A L S TAT E M E N T S
183Reckitt Benckiser Group plc (RB) Annual Report and Financial Statements 2019
14 Financial Instruments and Financial Risk Management continuedThe Group held forward foreign exchange contracts designated as cash flow hedges primarily in Sterling, Euro, US dollar, Saudi Riyal, Australian dollar and Hong Kong dollar. The notional value of the payable leg resulting from these financial instruments was as follows:
Cash Flow Hedge Profile2019
£m2018
£m
Sterling 451 241Euro 415 403US Dollar 396 395Chinese Renminbi 112 214Saudi Riyal 94 40Australian dollar 81 61Hong Kong dollar 77 9Other 544 512
2,170 1,875
These forward foreign exchange contracts are expected to mature over the period January 2020 to December 2020 (2018: January 2019 to December 2020).
Cash flow hedging is applied with the economic relationship and expected effectiveness being assessed at inception, with any ineffectiveness recognised in the Income Statement. The ineffective portion recognised in the income statement arising from cash flow hedges is immaterial (2018: immaterial).
Gains and losses recognised in the hedging reserve in other comprehensive income on forward exchange contracts in 2019 of £9 million loss (2018: £8 million gain) are recognised in the Income Statement in the year or years during which the hedged forecast transaction affects the Income Statement.
At 31 December 2019, the Group had forward contracts used for cash flow hedging with total fair value of £6 million liability (2018: £7 million asset). These contracts are denominated in a diverse range of currency pairings, where a fluctuation of 5% in any one of the contract pairings, with all others remaining constant, would have a maximum effect of £9 million (2018: £25 million) on Shareholder Equity, until the point at which the contracts mature and the forecast transaction occurs. The four largest contract pairings in order of nominal value were Euro/Polish Zloty, Euro/Sterling, Saudi Riyal/US dollar and US dollar/Sterling.
The remaining major monetary financial instruments (liquid assets, receivables, interest and non-interest bearing liabilities) are directly denominated in the functional currency of the Group or are transferred to the functional currency of the local entity through the use of derivatives.
The gains and losses from fair value movements on derivatives held at fair value through the Income Statement, recognised in the Income Statement in 2019 was a £158 million loss (2018: £65 million gain).
(b) Price riskDue to the nature of its business the Group is exposed to commodity price risk related to the production or packaging of finished goods, such as oil related, and a diverse range of other, raw materials. This risk is, however, managed primarily through medium-term contracts with certain key suppliers and is not therefore viewed as being a material risk.
(c) Interest rate riskThe Group has both interest-bearing and non interest-bearing assets and liabilities. The Group monitors its interest income and expense rate exposure on a regular basis. The Group manages its interest income rate exposure on its gross financial assets by using a combination of fixed rate term deposits.
Under the Group’s interest rate management strategy a percentage of fixed interest rate borrowings have been swapped to floating interest rates. The Group’s debt is obtained on a fixed or floating basis to align with fixed to floating debt requirements.
Interest rate swaps are held to hedge the interest rate risk associated with the $750 million 2020 Senior Note. The interest rate swaps convert the fixed rate of 3% on the 2020 Senior Note to floating and have been designated as a fair value hedge. As at 31 December 2019 interest rate swaps held at fair value totalled £1 million payable (2018: £16 million payable). The fair value adjustment applied to the bonds due to the hedge designation totalled £1 million receivable (2018: £16 million receivable). The interest rate swaps are documented and assessed for ineffectiveness on an ongoing basis, with any ineffectiveness recognised in the Income Statement. Possible sources of ineffectiveness include any changes to credit ratings of the Group or counterparties to the interest rate swaps, differences in day counts between the interest rate swaps and the coupons of the hedged senior notes, and modifications to the senior notes such as any repayments.
Various scenarios are simulated taking into consideration refinancing, renewal of existing positions, alternative financing and hedging. Based on these scenarios, the Group calculates the impact on the Income Statement of a defined interest rate shift. For each simulation, the same interest rate shift is used for all currencies, calculated on a full year and pre-tax basis.

184 Reckitt Benckiser Group plc (RB) Annual Report and Financial Statements 2019
14 Financial Instruments and Financial Risk Management continuedThe scenarios are only run for liabilities that represent the major interest-bearing positions. Based on the simulations performed, the impact on the Income Statement of a 50 basis-point shift in interest rates would be a maximum increase of £25 million (2018: £16 million) or decrease of £25 million (2018: £16 million), respectively for the liabilities covered. The simulation is done on a periodic basis to verify that the maximum loss simulated is within the limit given by management.
2. Credit RiskThe Group has no significant concentrations of credit risk. Credit risk arises from cash and cash equivalents, derivative financial instruments, deposits with banks and financial institutions, as well as credit exposures to customers. The assessment of lifetime expected credit losses relating to trade and other receivables is detailed in Note 13. Financial institution counterparties are subject to approval under the Group’s counterparty risk policy and such approval is limited to financial institutions with a BBB rating or above. The Group uses BBB and higher rated counterparties to manage risk and only uses sub BBB rated counterparties by exception. The amount of exposure to any individual counterparty is subject to a limit defined within the counterparty risk policy, which is reassessed annually by the Board of Directors. Derivative financial instruments are only traded with counterparties approved in accordance with the approved policy. Derivative risk is measured using a risk weighting method.
The Group has counterparty risk from asset positions held with financial institutions. This is comprised of short-term investments, cash and cash equivalents and derivatives positions as stated on the face of the Balance Sheet. For risk management purposes the Group assesses the exposure to major financial institutions by looking at the deposits, cash and cash equivalents and 5% of derivative notional position. The following table summarises the Group’s assessment of its exposure. The financial institutions listed in the tables are not comparable year on year.
2019
CounterpartyCredit rating
Limit £m
Exposure £m
Financial institution A AAA 300 211Financial institution B AA- 200 193Financial institution C A+ 150 137Financial institution D A 125 109Financial institution E A+ 146 101Financial institution F A 125 100Financial institution G A 116 90Financial institution H A 125 86Financial institution I A 125 84Financial institution J A 125 82
2018
CounterpartyCredit rating
Limit £m
Exposure £m
Financial institution A AA- 200 201Financial institution B AAA 300 168Financial institution C A+ 150 133Financial institution D A 121 112Financial institution E A 125 107Financial institution F A 100 99Financial institution G A+ 125 95Financial institution H A 125 89Financial institution I A 115 85Financial institution J A 125 84
3. Liquidity riskLiquidity risk is the risk that the Group cannot repay financial liabilities as and when they fall due. The Group’s liquidity risk is concentrated towards bond, term loan and senior note principal repayments due between 2020 and 2044.
The Group has various borrowing facilities available to it. The Group has bilateral credit facilities with high-quality international banks and has a financial covenant, which is not expected to restrict the Group’s future operations.
At the end of 2019, the Group had long-term debt excluding lease liabilities £8,292 million (2018: £9,670 million), of which £8,292 million (2018: £9,091 million) is repayable in more than two years. In addition, the Group has committed borrowing facilities totalling £5,500 million (2018: £4,500 million), which expire after more than two years. These facilities were undrawn at year-end. The committed borrowing facilities (both drawn and undrawn), together with central cash and investments, are considered sufficient to meet the Group’s projected cash requirements.
All borrowing facilities are at floating rates of interest.
N OT ES TO T H E F I N A N C I A L S TAT E M E N T S CO N T I N U ED

S T R AT E G I C R E P O R T G O V E R N A N C E F I N A N C I A L S TAT E M E N T S
185Reckitt Benckiser Group plc (RB) Annual Report and Financial Statements 2019
14 Financial Instruments and Financial Risk Management continuedThe facilities have been arranged to cover general corporate purposes, including support for commercial paper issuance. All facilities incur commitment fees at market rates.
The Group’s borrowing limit at 31 December 2019 calculated in accordance with the Articles of Association was £28,089 million (2018: £44,228 million).
The table below analyses the Group’s financial liabilities and the derivatives which will be settled on a net basis into relevant maturity groupings based on the remaining period at the balance sheet date to the contractual maturity date. The amounts disclosed in the table are the contractual undiscounted cash flows which have been calculated using spot rates at the relevant Balance Sheet date, including interest to be paid.
At 31 December 2019Total
£m
Less than 1 year
£m
Between 1 and 2 years
£m
Between 2 and 5 years
£m
Over 5 years
£m
Commercial paper (3,013) (3,013) – – –Bonds (7,049) (176) (176) (4,670) (2,027)Term loans (881) (21) (21) (839) –Senior notes (2,584) (637) (54) (162) (1,731)Interest rate swaps (1) (1) – – –Trade payables (1,796) (1,796) – – –Other payables (3,087) (2,875) (55) (135) (22)
At 31 December 2018Total
£m
Less than 1 year
£m
Between 1 and 2 years
£m
Between 2 and 5 years
£m
Over 5 years
£m
Commercial paper (1,608) (1,608) – – –Bonds (7,511) (183) (183) (3,389) (3,756)Term loans (1,476) (42) (42) (1,392) –Senior notes (3,337) (650) (662) (169) (1,856)Other borrowings (40) (40) – – –Interest rate swaps (18) (12) (6) – –Trade payables (1,798) (1,798) – – –Other payables (3,100) (2,865) (76) – (159)
The table below analyses the Group’s derivative financial instruments which will be settled on a gross basis into relevant maturity groupings based on the remaining period between the Balance Sheet date and the contractual maturity date. The amounts disclosed in the table are the contractual undiscounted cash flows which have been calculated using spot rates at the relevant Balance Sheet date.
At 31 December 2019
Less than 1 year
£m
Between 1 and 2 years
£m
Between 2 and 5 years
£m
Over 5 years
£m
Forward exchange contractsOutflow (6,190) – – –Inflow 6,084 – – –
At 31 December 2018
Less than 1 year
£m
Between 1 and 2 years
£m
Between 2 and 5 years
£m
Over 5 years
£m
Forward exchange contractsOutflow (4,480) (6) – –Inflow 4,491 8 – –
Cash flow forecasting is performed by the local business units and on an aggregated basis by GT. GT monitors rolling forecasts of the Group’s liquidity requirements to ensure it has sufficient cash to meet operational needs while maintaining sufficient headroom on its undrawn committed borrowing facilities. Funds over and above those required for short-term working capital purposes by the local businesses are generally remitted to GT. The Group uses the remittances to settle obligations, repay borrowings, or, in the event of a surplus, invest in short-term instruments issued by institutions with a BBB rating or better.
4. Capital ManagementThe Group considers capital to be net debt plus total equity. Net debt is calculated as total borrowings less cash and cash equivalents, short-term other investments and financing derivative financial instruments (Note 16). Total equity includes share capital, reserves and retained earnings as shown in the Group Balance Sheet.

186 Reckitt Benckiser Group plc (RB) Annual Report and Financial Statements 2019
14 Financial Instruments and Financial Risk Management continued
2019 £m
2018 (Restated)1
£m
Net debt (Note 16) 10,749 10,746Total equity 9,407 14,771
20,156 25,517
1 Restated for the adoption of IFRS16 (Note 31).
The objectives for managing capital are to safeguard the Group’s ability to continue as a going concern, in order to provide returns for Shareholders and benefits for other stakeholders and to maintain an efficient capital structure to optimise the cost of capital.
In 2019, the Group provided returns to Shareholders in the form of dividends. Refer to Note 27 for further details.
The Group monitors net debt and at year end the Group had net debt of £10,749 million (2018: £10,746 million). The Group seeks to pay down net debt using cash generated by the business to maintain an appropriate level of financial flexibility.
The Group participates in a supply chain finance programme (SCF) under which certain suppliers to the Group are able to access a Supply Chain Financing arrangement that enables them to fund their working capital. The principal purpose of this programme is to facilitate efficient payment processing and enable the willing suppliers to sell their receivables due from the Group to a bank before their due date. The Group does not incur any additional interest towards the bank on the amounts due to the suppliers. As part of this facility the Group has confirmed to certain financial institutions that it will make payments of £351 million (2018: £322 million) to these suppliers as they fall due. These amounts are recorded within Trade Payables on the Balance Sheet and all cash flows associated with the programme are included within operating cash flows as they continue to be part of the normal operating cycle of the Group and their principal nature remains operating – i.e. payments for the purchase of goods and services.
15 Cash and Cash Equivalents2019
£m2018
£m
Cash at bank and in hand 543 635Short-term bank deposits 1,006 848
Cash and cash equivalents 1,549 1,483
The Group operates in a number of territories where there are either foreign currency exchange restrictions, or where it is difficult for the Group to extract cash readily and easily in the short-term. As a result, £17 million (2018: £2 million) of cash included in cash and cash equivalents is restricted for use by the Group, yet available for use in the relevant subsidiary’s day-to-day operations.
16 Financial Liabilities – Borrowings
Current2019
£m
2018 (Restated)3
£m
Bank loans and overdrafts1 16 40Commercial paper2 2,993 1,608Bonds – –Senior notes 569 560Lease liabilities3 72 61
3,650 2,269
Non-current2019
£m
2018 (Restated)3
£m
Bonds 6,201 6,440Senior notes 1,265 1,904Term loans 826 1,326Lease liabilities3 253 280
8,545 9,950
1. Bank loans are denominated in a number of currencies: all are unsecured and bear interest based on the relevant LIBOR equivalent.2. Commercial paper was issued in US dollars and Euros, is unsecured and bears interest based on the relevant LIBOR equivalent.3. Restated for the adoption of IFRS16 (Note 31), 2018 current lease obligations include £1 million finance lease liabilities.
N OT ES TO T H E F I N A N C I A L S TAT E M E N T S CO N T I N U ED

S T R AT E G I C R E P O R T G O V E R N A N C E F I N A N C I A L S TAT E M E N T S
187Reckitt Benckiser Group plc (RB) Annual Report and Financial Statements 2019
16 Financial Liabilities – Borrowings continued
Maturity of debt (excluding lease liabilities)2019
£m
2018 (Restated)1
£m
Bank loans and overdrafts repayable:Within one year or on demand 16 40
Other borrowings repayable:Within one year:
Commercial paper 2,993 1,608Senior notes 569 560
After one year and in less than five years:Bonds 4,326 2,930Senior notes – 579Term loans 826 1,326
After five years or longer:Bonds 1,875 3,510Senior notes 1,265 1,325
11,854 11,838
Gross borrowings (unsecured) 11,870 11,878
1. Restated for the adoption of IFRS16 (Note 31).
Analysis of net debt2019
£m
2018 (Restated)1
£m
Cash and cash equivalents 1,549 1,483Overdrafts (2) (6)
Cash and cash equivalents(excluding overdrafts) 1,547 1,477
Borrowings (excluding overdrafts) (11,866) (11,872)Derivative financial instruments (debt) (105) (10)Lease liabilities2 (325) (341)
Financing liabilities (12,296) (12,223)
Net debt at end of year (10,749) (10,746)
1 Restated for the Adoption of IFRS16 (Note 31).2 Borrowings as at 31 December 2018 has been restated to present £1m of finance leases under IAS17 as lease liabilities under IFRS16
The Group uses derivative financial instruments to hedge certain elements of interest rate and exchange risk on its net debt. The split between these items and other derivatives on the Balance Sheet is shown below:
Assets Liabilities
2019 (£m) Current Non-Current Current Non-Current
Derivative financial instruments (debt) 4 – (109) –Derivative financial instruments (non-debt) 26 – (29) –
At 31 December 2019 30 – (138) –
Assets Liabilities
2018 (£m) Current Non-Current Current Non-Current
Derivative financial instruments (debt) 15 – (25) –Derivative financial instruments (non-debt) 23 1 (17) –
At 31 December 2018 38 1 (42) –
Note that non-current derivative assets are presented within other non-current other receivables on the Balance Sheet.

188 Reckitt Benckiser Group plc (RB) Annual Report and Financial Statements 2019
16 Financial Liabilities – Borrowings continuedCash and
cash equivalents
£m
Financing liabilities
£mNet Debt
£m
2018 Net Debt
(Restated)1 £m
At 1 January 2019 1,477 (12,223) (10,746) (11,095)Net increase/(decrease) in cash and cash equivalents 139 – 139 (586)Proceeds from borrowings – (1,548) (1,548) (697)Repayment of borrowings – 1,122 1,122 2,314Other financing cash flows – 75 75 (24)New lease liabilities – (63) (63) (48)Exchange, fair value and other movements (69) 341 272 (610)
At 31 December 2019 1,547 (12,296) (10,749) (10,746)
1 Restated for the Adoption of IFRS16 (Note 31).
17 Provisions for Liabilities and ChargesLegal
provisions £m
Restructuring provisions
£m
Other provisions
£m
Total provisions
£m
At 1 January 2018 501 26 71 598Charged to the Income Statement 38 44 30 112Arising on business combinations – – 31 31Utilised during the year (74) (18) (28) (120)Released to the Income Statement (5) (1) (5) (11)Exchange adjustments 1 1 (1) 1
At 31 December 2018 (Restated)1 461 52 98 611Charged to the Income Statement 82 19 24 125Utilised during the year (381) (45) (14) (440)Released to the Income Statement (7) (14) (35) (56)Exchange adjustments (4) – (2) (6)
At 31 December 2019 151 12 71 234
1 Restated for the Adoption of IFRS16 (Note 31).
Provisions have been analysed between current and non-current as follows:
2019 £m
2018 (Restated)1
£m
Current 178 537Non-current 56 74
234 611
1 Restated for the Adoption of IFRS16 (Note 31).
Provisions are recognised when the Group has a present or constructive obligation as a result of past events, it is more likely than not that there will be an outflow of resources to settle that obligation, and the amount can be reliably estimated.
Legal provisions of £151 million (2018: £461 million) including exceptional legal provisions of £126 million (2018: £431 million) in relation to a number of historical regulatory matters in a number of markets, predominantly the HS issue in South Korea and the “DoJ” investigation. During the year, a number of payments were made to claimants in respect of the HS issue in South Korea, and settlements of the DoJ investigation.
The restructuring provision relates principally to business integration costs associated with the acquisition of MJN and subsequent RB2.0 reorganisation, the majority of which is expected to be utilised within one year.
Other provisions include environmental and other obligations throughout the Group, the majority of which are expected to be utilised within five years.
N OT ES TO T H E F I N A N C I A L S TAT E M E N T S CO N T I N U ED

S T R AT E G I C R E P O R T G O V E R N A N C E F I N A N C I A L S TAT E M E N T S
189Reckitt Benckiser Group plc (RB) Annual Report and Financial Statements 2019
18 Lease liabilities
Maturity analysis – contractual undiscounted cash flows2019
£m
2018 (Restated)1
£m
Within one year 85 73Later than one and less than five years 184 203After five years 114 123
Total undiscounted lease liabilities at 31 December 383 399
Lease liabilities included in the statement of financial position at 31 December 325 340
Current 72 60Non-Current 253 280
1 Restated for the Adoption of IFRS16 (Note 31).2 Interest on lease liabilities amounted to £13 million in 2019 (2018: £13 million).
19 Contingent Liabilities and AssetsHS South KoreaThe Humidifier Sanitiser (“HS”) issue in South Korea was a tragic event. The Group continues to make both public and personal apologies to victims. There are a number of further expected costs relating to the issue that either cannot be reliably estimated or are not considered probable at the current time. In particular:1. Round 4 lung injury: The South Korean government opened Round 4 to new applicants on 25 April 2016 for an indefinite period. It has
received 5,453 applications to participate in Round 4 as at 20 February 2020 and continues to receive applications. Oxy RB has continued to make payments under a compensation plan during 2019 and made provision for the Round 4 Oxy RB Category I & II users categorised to date. The number of additional victims in Round 4 cannot be reliably estimated at the current time as it is open for an indefinite period.
2. Asthma related injury and other potential lung or non-lung injuries: A damage relief committee set up by the Ministry of Environment (“MOE”) announced a recognition standard for asthma caused by HS, based on the increased incidence of asthma in HS users. From 23 July 2018, HS users can apply for asthma-only categorisation as part of Round 4. No provision has been made because:a) no detailed underlying data has yet been made available in respect of general causation of asthma injuries by HS, although 397 victims
have been announced by the MOE as at 17 January 2020; andb) it is not possible to estimate the total number of applicants across all rounds (including future asthma-only claims in Round 4) and
therefore the total number of potential victims with potential asthma injuries or for any other injuries that the MOE may decide to recognise.
3. On 18 September 2019, a South Korean appellate court overturned a lower court’s decision and awarded damages of KRW 5 million (approximately £3,200) to an Oxy RB HS user who had been classified as Category 3 claimant. The South Korean government classifies HS claimants into 4 categories depending on the degree of causation between their lung injury and HS exposure. Category 1 and 2 HS claimants are defined by law as those being “almost certain” or having a “high possibility” of having been injured by HS products, with Category 3 claimants being considered to have only a “low possibility” of a connection between their lung injuries and HS exposure. The appellate court became the first to rule that Category 3 plaintiffs can be entitled to damages from HS manufacturers. Oxy RB disagrees with the court’s ruling and has appealed to the Supreme Court. There are currently 327 Category 3 claimants classified by the South Korean government. We are currently unable to quantify the liability for Category 3 claimants, if any, at this juncture. Category 4 claimants are also advocating that they should receive compensation.
4. On 26 July 2019, the South Korean government announced the recognition of toxic hepatitis as a HS injury. No data supporting the South Korean government’s finding has been made available. The government plans to develop categorisation standards for HS-induced toxic hepatitis and start categorising existing HS applicants after the standards have been developed.
5. On 15 November 2019, the South Korean government announced the recognition of child interstitial lung disease as a HS injury. The South Korean government has not yet publicly made available the underlying data supporting its finding that the disease can be caused by HS exposure. Although the South Korean government announced that it had established the criteria for categorising child interstitial lung disease victims, the criteria have not yet been publicly disclosed.
6. The Group continues to assess and, where appropriate, pursue rights which Oxy RB may have to recover sums from other involved parties.7. On 9 August 2017, the Humidifier Sanitiser Injury Special Relief Act (“HS Law”) became effective, setting out a mechanism for providing
government support to HS victims, while also creating a Special Relief Fund (“SRF”) to support selected cases who did not receive designation as a HS victim. The SRF was mainly funded by the HS companies, through a government levy authorized by the HS Law. Among other provisions, the HS Law also lowered the burden of proof required for claimants in litigation against HS companies. A bill to amend the HS Law was also passed by the Korean National Assembly on 6 March 2020, mainly affecting the HS injury definition and legal presumption of causation, while also creating a unified fund to support both HS victims and SRF recipients. We currently expect the amendment to take effect in late September 2020. As many of the amended terms are subject to court interpretation and much of the details are left to the lower regulations to be later enacted, the impact of these amendments will require further monitoring and analysis.
OtherFrom time to time, the Group is involved in discussions in relation to ongoing tax matters in a number of jurisdictions around the world. Whereappropriate, the Directors make provisions based on their assessment of each case. See note 7.

190 Reckitt Benckiser Group plc (RB) Annual Report and Financial Statements 2019
20 Trade and Other Payables2019
£m2018
£m
Trade payables 1,796 1,798Other payables 115 104Other tax and social security payable 133 123Accruals 2,776 2,786
Trade and other payables 4,820 4,811
Included within accruals is £1,095 million (2018: £1,025 million) in respect of amounts payable to trade customers and government bodies for trade spend.
Other Non-current LiabilitiesWithin other non-current liabilities of £367 million (2018: £448 million) is a financial liability of £135 million (2018: £148 million). This liability is in respect of the present value of the expected redemption amount of a written put option granted to the non-controlling interest as described in Note 26. The amortised cost of the liability is subject to estimation of the future performance of certain Group products. Future changes in estimation would result in the remeasurement of the liability through the income statement. In addition, other non-current liabilities includes US employee related payables of £38 million (2018: £32 million), and interest accrued on tax balances of £154 million (2018: £191 million).
21 Current and Non-current Tax Liabilities2019
£m2018
£m
Current tax liabilities (145) (10)Non-current tax liabilities (969) (1,105)
Total current and non-current tax liabilities (1,114) (1,115)
Included in Total current and non-current tax liabilities is an amount of £891m (2018: £1,002m) relating to tax contingencies primarily arising in relation to transfer pricing.
Certain tax positions taken by us are based on industry practice, tax advice and drawing similarities from our facts and circumstances to those in case law. In particular, international transfer pricing is an area of taxation that depends heavily on the underlying facts and circumstances and generally involves a significant degree of judgement. Tax assets and liabilities are offset where there is a legally enforceable right to do so.
22 Pension and Post-Retirement CommitmentsPlan DetailsThe Group operates a number of defined benefit and defined contribution pension plans around the world covering many of its employees, which are principally funded. The Group’s most significant defined benefit pension plan (UK) is a final salary plan, which closed to new entrants in 2005 and following consultation was closed to further accrual from 31 December 2017. Trustees of the plan are appointed by the Group, active members and pensioner membership, and are responsible for the governance of the plan, including paying all administrative costs and compliance with regulations. The plan is funded by the payment of contributions to the plan’s trust, which is a separate entity from the rest of the Group.
The Group also operates a number of other post-retirement plans in certain countries. The two major plans are the US Retiree Health Care Plan and the Mead Johnson & Company, LLC Medical Plan (together, the “US (Medical)” plans). In the US Retiree Health Care Plan, salaried participants become eligible for retiree health care benefits after they reach a combined ‘age and years of service rendered’ figure of 70, although the age must be a minimum of 55. This plan closed to new members in 2009. In the Mead Johnson & Company, LLC Medical Plan, acquired as part of the acquisition of MJN on 15 June 2017, participants become eligible for retiree health care benefits if they leave employment after the age of 65, leave after the age of 55 and have completed ten years of service, or have their employment involuntarily terminated after the age of 55. A Benefits Committee is appointed by the Group for both of these plans, responsible for the governance of the US plans, including paying all administrative costs and compliance with regulations. Both of these plans are unfunded.
N OT ES TO T H E F I N A N C I A L S TAT E M E N T S CO N T I N U ED

S T R AT E G I C R E P O R T G O V E R N A N C E F I N A N C I A L S TAT E M E N T S
191Reckitt Benckiser Group plc (RB) Annual Report and Financial Statements 2019
22 Pension and Post-Retirement Commitments continuedFor the principal UK plan, a full independent actuarial valuation is carried out on a triennial basis. The most recent valuation was carried out at 5 April 2019. The Group has agreed that it will aim to eliminate the pension plan technical provisions deficit in the UK and Ireland by the end of 2020. Funding levels are monitored on an annual basis and the current agreed annual deficit reduction contributions are £6 million per annum. It is expected that contributions to the UK defined benefit plan in 2020 will be £6 million (2019: £25 million).
During 2018, a UK High Court ruling (the ‘Lloyds Case’) clarified the requirement to equalise the Guaranteed Minimum Pension element of benefits for men and women due to particular members of previously contracted out UK defined benefit pension schemes. This is likely to lead to a small level of enhanced benefits in some circumstances. As no allowance had previously been made, accordingly a past service cost was charged in 2018 (£4 million) reflecting the best estimate of the likely additional benefits that will be due to members. The current year charge is nil. The final amount will be subject to agreement of the relevant pension trustees.
For the US Retiree Health Care Plan, a full independent actuarial valuation is carried out on an annual basis. The most recent valuation was carried out on 1 January 2019. For the Mead Johnson & Company, LLC Medical Plan, the most recent valuation was carried out at 31 December 2019. For both of these plans, funding levels are monitored on an annual basis with contributions made equal to the claims made each year. It is expected that the combined contributions in 2020 will be £7 million (2019: £8 million).
For the purpose of IAS 19, the projected unit valuation method was used for the UK and US plans, as per the principal UK plan triennial valuation results (at 5 April 2019) and the US Medical plan valuations to 31 December 2019. The UK plans have a weighted average duration of the deferred benefit obligation of 17.0 years (2018: 17.6 years).
Significant Actuarial AssumptionsThe significant actuarial assumptions used in determining the Group’s net liability for the UK and US (Medical) plans as at 31 December were:
2019 2018
UK%
US (Medical)%
UK%
US (Medical)%
Rate of increase in pensionable salaries 5.2 – 5.4 –Rate of increase in deferred pensions during deferment 3.1 – 3.2 –Rate of increase in pension payments 3.0 – 3.0 –Discount rate 1.9 3.1 2.7 4.1Inflation assumption – RPI 3.2 – 3.4 –Annual medical cost inflation – 4.5-8.2 – 4.5-8.0
Assumptions regarding future mortality experience are set in accordance with published statistics and experience in each territory. The expected lifetime of a participant aged 60 and the expected lifetime of a participant who will be aged 60 in 15 years (20 years in the US) are detailed below:
2019 2018
UK years
US years
UK years
US years
Number of years a current pensioner is expected to live beyond 60:Male 27.4 24.9 29.2 25.0Female 28.6 27.1 30.1 27.2
Number of years a future pensioner is expected to live beyond 60:Male 28.7 26.7 30.9 26.8Female 30.0 28.8 31.8 28.9
For the principal UK plan, the mortality assumptions were based on the standard SAPS mortality table 3NMA for males (scaled by 98%) and table 3NFA for females (scaled by 117%). Allowance for future changes is made by adopting the 2018 edition of the CMI series with a long-term improvement trend of 1.5% per annum from 2013 onwards. For the US plan the mortality assumptions were determined using the Pri-2012. Total Dataset and projected with Mortality Improvement Scale MP-2019.

192 Reckitt Benckiser Group plc (RB) Annual Report and Financial Statements 2019
22 Pension and Post-Retirement Commitments continuedAmounts Recognised on the Balance SheetThe amounts recognised on the Balance Sheet are as follows:
2019 £m
2018 £m
Balance Sheet liability for:US (Medical) (130) (126)Other (221) (192)
Liability on Balance Sheet (351) (318)
Balance Sheet assets for:UK 217 138Other 51 53
Asset on Balance Sheet 268 191
Net pension liability (83) (127)
The funded and unfunded amounts recognised on the Balance Sheet are determined as follows:
2019 2018
UK £m
US (Medical) £m
Other £m
Total £m
UK £m
US (Medical) £m
Other £m
Total £m
Present value of funded obligations (1,506) – (514) (2,020) (1,472) – (508) (1,980)Fair value of plan assets 1,741 – 534 2,275 1,628 – 523 2,151
Surplus of funded plans 235 – 20 255 156 – 15 171Present value of unfunded obligations – (130) (190) (320) – (126) (154) (280)Irrecoverable surplus1 (18) – – (18) (18) – – (18)
Net pension surplus/(liability) 217 (130) (170) (83) 138 (126) (139) (127)
1 There is no movement in irrecoverable surplus for 2019.
Group plan assets are comprised as follows:2019 2018
UK £m
US (Medical) £m
Other £m
Total £m
UK £m
US (Medical) £m
Other £m
Total £m
Equities – quoted 205 – 227 432 205 – 235 440Government bonds 1,020 – 137 1,157 941 – 130 1,071Corporate bonds 369 – 101 470 326 – 129 455Real Estate/property – unquoted 127 – 61 188 135 – 20 155Other assets – unquoted 20 – 8 28 21 – 9 30
Fair value of plan assets 1,741 – 534 2,275 1,628 – 523 2,151
The present value of obligations for the principal UK plan and the US Medical plans at last valuation date is attributable to participants as follows:
2019 2018
UK £m
US (Medical) £m
UK £m
US (Medical) £m
Active participants – (47) – (45)Participants with deferred benefits (650) (2) (759) (2)Participants receiving benefits (856) (81) (713) (79)
Present value of obligation (1,506) (130) (1,472) (126)
N OT ES TO T H E F I N A N C I A L S TAT E M E N T S CO N T I N U ED
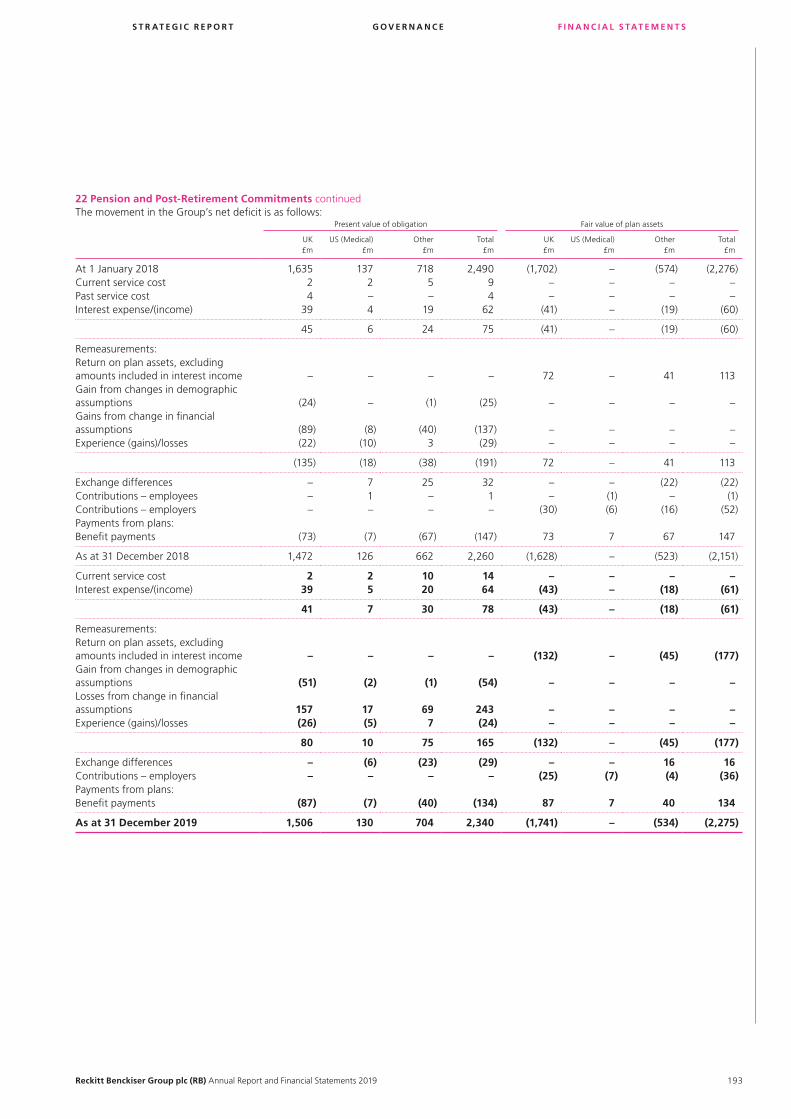
S T R AT E G I C R E P O R T G O V E R N A N C E F I N A N C I A L S TAT E M E N T S
193Reckitt Benckiser Group plc (RB) Annual Report and Financial Statements 2019
22 Pension and Post-Retirement Commitments continuedThe movement in the Group’s net deficit is as follows:
Present value of obligation Fair value of plan assets
UK £m
US (Medical) £m
Other £m
Total £m
UK £m
US (Medical) £m
Other £m
Total £m
At 1 January 2018 1,635 137 718 2,490 (1,702) – (574) (2,276)Current service cost 2 2 5 9 – – – –Past service cost 4 – – 4 – – – –Interest expense/(income) 39 4 19 62 (41) – (19) (60)
45 6 24 75 (41) – (19) (60)
Remeasurements:Return on plan assets, excluding amounts included in interest income – – – – 72 – 41 113Gain from changes in demographic assumptions (24) – (1) (25) – – – –Gains from change in financial assumptions (89) (8) (40) (137) – – – –Experience (gains)/losses (22) (10) 3 (29) – – – –
(135) (18) (38) (191) 72 – 41 113
Exchange differences – 7 25 32 – – (22) (22)Contributions – employees – 1 – 1 – (1) – (1)Contributions – employers – – – – (30) (6) (16) (52)Payments from plans:Benefit payments (73) (7) (67) (147) 73 7 67 147
As at 31 December 2018 1,472 126 662 2,260 (1,628) – (523) (2,151)
Current service cost 2 2 10 14 – – – –Interest expense/(income) 39 5 20 64 (43) – (18) (61)
41 7 30 78 (43) – (18) (61)
Remeasurements:Return on plan assets, excluding amounts included in interest income – – – – (132) – (45) (177)Gain from changes in demographic assumptions (51) (2) (1) (54) – – – –Losses from change in financial assumptions 157 17 69 243 – – – –Experience (gains)/losses (26) (5) 7 (24) – – – –
80 10 75 165 (132) – (45) (177)
Exchange differences – (6) (23) (29) – – 16 16Contributions – employers – – – – (25) (7) (4) (36)Payments from plans:Benefit payments (87) (7) (40) (134) 87 7 40 134
As at 31 December 2019 1,506 130 704 2,340 (1,741) – (534) (2,275)

194 Reckitt Benckiser Group plc (RB) Annual Report and Financial Statements 2019
22 Pension and Post-Retirement Commitments continuedAmounts Recognised in the Income StatementThe charge for the year ended 31 December is shown below:
2019 £m
2018 £m
Defined contribution plans 46 40Defined benefit plans (net charge excluding interest)
UK 2 6US (Medical) 2 2Other 10 5
Total pension costs included in operating profit (Note 5)1 60 53Income Statement charge included in finance expense 3 2
Income Statement charge included in profit before income tax 63 55
Remeasurement (gains)/losses for2:UK (52) (63)US (Medical) 10 (18)Other 30 3
(12) (78)
1 The Income Statement charge recognised in operating profit includes current service cost, and past service cost.2 Remeasurement (gains)/losses excludes nil (2018: £71 million gain) recognised in OCI for irrecoverable surplus.
Sensitivity of Significant Actuarial AssumptionsThe sensitivity of the UK defined benefit obligation to changes in the principal assumptions is shown below:
2019 Change in assumption Change in defined benefit obligation
Discount rate Increase 0.1% Decrease by 1.7%RPI increase Increase 0.1% Increase by 1.0%Life expectancy Members live 1 year longer Increase by 4.0%
2018 Change in assumption Change in defined benefit obligation
Discount rate Increase 0.1% Decrease by 1.8%RPI increase Increase 0.1% Increase by 0.6%Life expectancy Members live 1 year longer Increase by 4.0%
The above sensitivity analyses are based on a change in an assumption while holding all other assumptions constant. In practice, this is unlikely to occur, and changes in some of the assumptions may be correlated.
Impact of Medical Cost Trend RatesA one percent change in the assumed health care cost trend rates would have an immaterial impact on the service cost, interest cost and post-retirement benefit obligation.
Risk and Risk ManagementThrough its defined benefit pension plans and post-employment medical plans, the Group is exposed to a number of risks, the most significant of which are detailed as follows:
Asset Volatility: The plan liabilities are calculated using a discount rate set with reference to corporate bond yields. If plan assets underperform this yield, this will create a deficit. Both the UK and US plans hold a significant proportion of equities, which are expected to outperform corporate bonds in the long-term while providing volatility and risk in the short-term. As the plans mature, the Group intends to reduce the level of investment risk by investing more in assets that better match the liabilities. All the UK plans have agreed with the Company a plan to de-risk the investment strategy of the plans at a pace that is commensurate with a planned return to full funding over a reasonable timescale.
The de-risking plan provides for a proportion of the investment portfolio to move from equity holdings to government and corporate bonds over time. The corporate bonds are global securities with an emphasis on the UK and US. However, the Group believes that due to the long-term nature of the plan liabilities and the strength of the supporting group, a level of continuing equity investment is an appropriate element of the Group’s long-term strategy to manage the plans efficiently.
N OT ES TO T H E F I N A N C I A L S TAT E M E N T S CO N T I N U ED

S T R AT E G I C R E P O R T G O V E R N A N C E F I N A N C I A L S TAT E M E N T S
195Reckitt Benckiser Group plc (RB) Annual Report and Financial Statements 2019
22 Pension and Post-Retirement Commitments continuedChanges in Bond Yields: A decrease in government and corporate bond yields will increase plan liabilities, although this will be partially offset by an increase in the value of the plans’ bond holdings.
Inflation Risk: Some of the Group’s pension obligations are linked to inflation, and higher inflation will lead to higher liabilities (although, in most cases, caps on the level of inflationary increases are in place to protect the plan against extreme inflation). The majority of the plans’ assets are either unaffected by (fixed interest bonds) or loosely correlated with (equities) inflation, meaning that an increase in inflation will also increase the deficit. In the US plans, the pensions in payment are not linked to inflation, so this is a less material risk.
Life Expectancy: The majority of the plans’ obligations are to provide benefits for the life of the member. Whilst the plans allow for an increase in life expectancy, increases above this assumption will result in an increase in the plans’ liabilities. This is particularly significant in the UK plan, where inflationary increases result in higher sensitivity to changes in life expectancy.
Change in Regulations: The Group is aware that future changes to the regulatory framework may impact the funding basis of the various plans in the future. The Group’s pensions department monitors the changes in legislation and analyses the risks as and when they occur.
Investments are well diversified, such that the failure of any single investment would not have a material impact on the overall level of assets. A large portion of assets consists of quoted equities and quoted bonds, although the Group also invests in property and cash. The Group believes that quoted equities offer the best returns over the long-term with an acceptable level of risk. The trustees of all the UK funds have moved the overwhelming majority of their assets to low cost investment funds in consultation with the Group whilst maintaining a prudent diversification.
23 Share Capital
Issued and fully paid
Equity ordinary shares
numberNominal value
£m
At 31 December 2018 736,535,179 74
At 31 December 2019 736,535,179 74
The holders of ordinary shares (par value 10p) are entitled to receive dividends as declared from time to time and are entitled to one vote per share at meetings of the Parent Company.
Allotment of Ordinary Shares and Release of Treasury SharesDuring the year nil ordinary shares (2018: nil ordinary shares) were allotted and 2,244,826 ordinary shares were released from Treasury (2018: 3,697,245) to satisfy vestings/exercises under the Group’s various share schemes as follows:
2019 2018
Ordinary shares of 10pNumber
of sharesConsideration
£mNumber
of sharesConsideration
£m
Executive Share Options – exercises 1,216,229 51 1,581,100 67Restricted Shares Awards – vesting 803,861 – 1,121,636 –
Total under Executive Share Option and Restricted Share Schemes 2,020,090 51 2,702,736 67Senior Executives Share Ownership Policy Plan – vesting 20,000 – 69,826 –Savings-Related Share Option Schemes – exercises 204,736 10 924,683 38
Total 2,244,826 61 3,697,245 105
Market Purchases of SharesIn 2019, 2,244,826 Treasury shares were released (2018: 3,697,245), leaving a balance held at 31 December 2019 of 26,788,535 (2018: 29,033,361). Proceeds received from the reissuance of Treasury shares to exercise share options were £61 million (2018: £105 million).

196 Reckitt Benckiser Group plc (RB) Annual Report and Financial Statements 2019
24 Share-Based PaymentsThe Group operates a number of incentive schemes, including a share option scheme, a restricted share scheme, and other share award schemes. During 2017, as part of a transitional scheme for MJN employees, a cash-settled scheme replaced an MJN equity-settled scheme. All other schemes within the Group are equity-settled. The total charge for share-based payments for the year was £18 million (2018: £16 million).
Executive Share AwardsExecutive share awards, comprising both Executive Share Options and Restricted Share Awards, are awarded to the Senior Management Team. Executive Share Options are awarded at an exercise price determined on grant date and become payable on exercise – following satisfaction of performance criteria. Restricted Share Awards entitle the recipient to receive shares at no cost following satisfaction of the following performance criteria.
For awards granted before December 2012:
Adjusted earnings per share growth over three years (%) <6% 6% 7% 8% ≥9%
Proportion of awards vesting (%) Nil 40% 60% 80% 100%
For awards granted in December 2013 and thereafter:
Adjusted earnings per share growth over three years (%)
<6% 6% Between 6% and 10% ≥10%
Proportion of awards vesting (%) Nil 20% Straight-line vesting between 20% and 100% 100%
For awards granted in May 2019 and thereafter:
WeightingThreshold
(20% vesting)Maximum
(100% vesting)
Adjusted EPS growth at actual FX rates (three-year CAGR) 25% 4% 9%
Adjusted EPS growth at constant FX rates (three-year CAGR) 25% 4% 9%
Net Revenue growth (three-year CAGR) 25% 2% 6%
Return on Capital Employed (in final year) 25% 10.8% 12.8%
The cost is spread over the three years of the performance period. For Executive Committee and members of the Group Leadership Team, vesting conditions must be met over the three-year period and are not retested. For the remaining members of the Senior Management Team the targets can be retested after four or five years. If any target has not been met, any remaining shares or options which have not vested will lapse.
Other Share AwardsOther share awards represent SAYE Schemes (offered to all staff within the relevant geographic area) and a number of Senior Executive Share Ownership Policy Plan (SOPP) awards. Other share awards have contractual lives of between three and eight years and are generally not subject to any vesting criteria other than the employee’s continued employment.
Individual tranches of these other share awards are not material for detailed disclosure and therefore have been aggregated in the tables following.
Modifications to Share AwardsThe Remuneration Committee approved modifications to all unexercised share schemes in December 2014 following the demerger of RB Pharmaceuticals to compensate for the loss of scheme value. For SAYE schemes this was in the form of a one-off payment. For executive share awards this included an adjustment to shares under the amount of each grant, and the lowering of exercise price, where applicable. There is no change to the IFRS fair value charge as a result of these modifications.
Summary of Shares OutstandingAll outstanding Executive and Other share awards as at 31 December 2019 and 31 December 2018 are included in the tables following which analyse the charge for 2019 and 2018. The Group has used the Black-Scholes model to calculate the fair value of one award on the date of the grant of the award.
N OT ES TO T H E F I N A N C I A L S TAT E M E N T S CO N T I N U ED

S T R AT E G I C R E P O R T G O V E R N A N C E F I N A N C I A L S TAT E M E N T S
197Reckitt Benckiser Group plc (RB) Annual Report and Financial Statements 2019
24 Share-Based Payments continuedTable 1: Fair valueThe most significant awards are share options and restricted shares, details of which have been provided below.
The 2020 Executive Share Awards are expected to be granted in May 2020.
Black-Scholes model assumptions
Award Grant date
Exercise price at grant
£
Modified exercise price
£Performance
period
Share price on grant date
£Volatility
%Dividend yield
%Life
years
Risk-free interest rate
%
Fair value of one award
£
Share options2009 08 December 2008 27.29 26.54 2009–11 27.80 25 3.1 4 2.78 4.692010 07 December 2009 31.65 30.78 2010–12 31.80 26 3.5 4 1.69 4.702011 01 December 2010 34.64 33.68 2011–13 34.08 26 4.3 4 2.16 4.492012 05 December 2011 32.09 31.20 2012–14 32.19 25 5.4 4 1.00 3.182013 03 December 2012 39.14 38.06 2013–15 39.66 20 4.3 4 0.61 3.292014 11 December 2013 47.83 46.51 2014–16 46.69 19 3.7 4 0.76 3.852015 01 December 2014 50.57 50.57 2015–17 52.40 17 4.0 4 1.03 4.342016 02 December 2015 63.25 63.25 2016–18 64.15 18 2.9 4 1.07 6.752017 01 December 2016 67.68 67.68 2017–19 66.28 18 3.0 4 0.46 5.542018 30 November 2017 64.99 64.99 2018–20 64.86 18 3.4 4 0.68 5.582019 10 May 2019 60.83 60.83 2019–21 61.45 20 3.7 4 0.83 5.89
Restricted shares2015 01 December 2014 – – 2015–17 52.40 17 4.0 4 1.03 43.932016 02 December 2015 – – 2016–18 64.15 18 2.9 4 1.07 57.132017 01 December 2016 – – 2017–19 66.28 18 3.0 4 0.46 58.852018 30 November 2017 – – 2018–20 64.86 18 3.4 4 0.68 56.712019 10 May 2019 – – 2019–21 61.40 19 3.7 4 0.83 53.02
Table 2: Share awards movements 2019Movement in number of options
Award
Options outstanding
at 1 January
2019 number
Granted/adjustments
numberLapsed
numberExercised
number
Options outstanding
at 31 December
2019 number
Share options1
2010 99,281 – (2,557) (96,724) –2011 119,643 – (1,600) (46,534) 71,5092012 480,103 – (2,037) (110,692) 367,3742013 934,375 – (2,057) (285,725) 646,5932014 1,235,516 – (6,154) (304,943) 924,4192015 1,694,784 – (34,388) (361,852) 1,298,5442016 2,002,591 – (87,855) (9,759) 1,904,9772017 2,091,357 – (250,301) – 1,841,0562018 2,490,055 – (318,575) – 2,171,4802019 – 2,491,340 (105,901) – 2,385,439
Restricted shares1
2016 930,898 – (52,774) (733,836) 144,2882017 919,587 – (78,200) (17,326) 824,0612018 1,269,418 – (151,289) (50,849) 1,067,2802019 – 1,411,339 (45,353) (1,850) 1,364,136
Other share awardsUK SAYE 693,313 316,660 (143,765) (119,638) 746,570US SAYE 567,300 176,208 (63,610) (57,133) 622,765Overseas SAYE 1,680,092 639,818 (402,282) (27,965) 1,889,663SOPP 118,800 24,400 (20,000) (20,000) 103,200
Weighted average exercise price (share options) £56.59 £60.83 £64.01 £42.73 £58.43
1. Grant date and exercise price for each of the awards are shown in Table 1.

198 Reckitt Benckiser Group plc (RB) Annual Report and Financial Statements 2019
24 Share-Based Payments continuedTable 3: Share awards movements 2018
Movement in number of options
Award
Options outstanding
at 1 January
2018 number
Granted/adjustments
numberLapsed
numberExercised
number
Options outstanding
at 31 December
2018 number
Share options1
2009 104,597 – – (104,597) –2010 200,945 – – (101,664) 99,2812011 276,229 – – (156,586) 119,6432012 596,307 – – (116,204) 480,1032013 1,076,562 – – (142,187) 934,3752014 1,572,032 – – (336,516) 1,235,5162015 2,588,261 – (278,118) (615,359) 1,694,7842016 2,714,334 – (706,985) (4,758) 2,002,5912017 2,364,884 – (273,527) – 2,091,3572018 3,200,000 52,760 (762,705) – 2,490,055
Restricted shares1
2015 1,210,573 – (159,045) (1,051,528) –2016 1,258,037 1,000 (288,817) (39,322) 930,8982017 1,116,434 – (179,211) (17,636) 919,5872018 1,600,000 98,880 (416,312) (13,150) 1,269,418
Other share awardsUK SAYE 749,906 227,268 (120,498) (163,363) 693,313US SAYE 294,434 374,170 (36,872) (64,432) 567,300Overseas SAYE 2,112,455 807,428 (541,227) (698,564) 1,680,092SOPP 146,800 58,000 (16,174) (69,826) 118,800
Weighted average exercise price (share options) £55.91 £64.99 £62.76 £42.64 £56.59
1. Grant date and exercise price for each of the awards are shown in Table 1.
For options outstanding at the year end the weighted average remaining contractual life is 5.64 years (2018: 5.84 years). Options outstanding at 31 December 2019 that could have been exercised at that date were 5,374,275 (2018: 4,606,460) with a weighted average exercise price of £49.82 (2018: £43.87).
The assumptions made within the valuation calculation with respect to the achievement of performance criteria are based on the Directors’ expectations in light of the Group’s business model and relevant published targets.
Under the terms of the schemes, early exercise may only be granted in exceptional circumstances and therefore the effect of early exercise is not incorporated into the calculation.
The calculation also assumes that there will be no leavers in the following year. No material modifications have been made to these calculations in 2019 or 2018 for the purposes of the valuation.
An estimate of future volatility is made with reference to historical volatility over a similar time period to the performance period or the contractual life as appropriate. Historical volatility is calculated based on the annualised standard deviation of the Group’s daily share price movement, being an approximation to the continuously compounded rate of return on the share.
National Insurance contributions are payable in respect of certain share-based payment transactions and are treated as cash-settled transactions.
The weighted average share price for the year was £61.40 (2018: £63.32).
N OT ES TO T H E F I N A N C I A L S TAT E M E N T S CO N T I N U ED

S T R AT E G I C R E P O R T G O V E R N A N C E F I N A N C I A L S TAT E M E N T S
199Reckitt Benckiser Group plc (RB) Annual Report and Financial Statements 2019
24 Share-Based Payments continuedOptions and Restricted Shares Granted During the YearOptions and restricted shares granted during the year which may vest or become exercisable at various dates between 2020 and 2027 are as follows:
Price to be paid
£
Number of shares under
option
Executive share option and restricted share schemesReckitt Benckiser 2019 Long-term Incentive Plan – share options 60.83 2,491,340Reckitt Benckiser Long-term Incentive Plan – restricted shares – 1,411,339Reckitt Benckiser Group Senior Executive Share Ownership Policy Plan – 24,400
Total 3,927,079
Savings-related share option schemesUK Scheme 47.44 316,660US Scheme 47.44 176,208Overseas Scheme 47.44 639,818
Total 1,132,686
Options and Restricted Shares Outstanding at 31 December 2019Options and restricted shares which have vested or may vest at various dates between 2020 and 2027 are as follows:
Price to be paid £ Number of shares under option
From To 2019 2018
Executive share option and restricted share schemesReckitt Benckiser Long-term Incentive Plan 2011 – Annual Grant – options 33.68 71.80 11,611,391 11,147,705Reckitt Benckiser Long-term Incentive Plan 2016 – Annual Grant – restricted shares – – 3,399,765 3,119,903Reckitt Benckiser Senior Executives Share Ownership Policy Plan – – 103,200 118,800
Total 15,114,356 14,386,408
Savings-related share option schemesUK Scheme 37.20 58.95 746,570 693,313US Scheme 58.86 58.95 622,765 567,300Overseas Scheme 58.95 58.95 1,889,663 1,680,092
Total 3,258,998 2,940,705
25 Other Reserves
Hedging reserve
£m
Foreign currency
translation reserve
£m
Total other reserves
£m
Balance at 1 January 2018 (1) 407 406Other comprehensive income/(expense)Gains on cash flow hedges, net of tax 8 – 8Net exchange gains on foreign currency translation, net of tax – 67 67Losses on net investment hedges – (44) (44)
Total other comprehensive income for the year 8 23 31
Balance at 31 December 2018 7 430 437
Other comprehensive income/(expense)Losses on cash flow hedges, net of tax (9) – (9)Net exchange losses on foreign currency translation, net of tax – (578) (578)Gains on net investment hedges – 70 70
Total other comprehensive expense for the year (9) (508) (517)
Balance at 31 December 2019 (2) (78) (80)
The hedging reserve comprises the effective portion of the cumulative net change in fair value of cash flow hedging instruments related to hedge transactions that are extant at year end.

200 Reckitt Benckiser Group plc (RB) Annual Report and Financial Statements 2019
25 Other Reserves continuedThe foreign currency translation reserve contains the accumulated foreign exchange differences from the translation of the Financial Statements of the Group’s foreign operations arising when the Group’s entities are consolidated. The reserve also contains the translation of liabilities that hedge the Group’s net exposure in a foreign currency.
26 Related Party TransactionsPut and call options with non-controlling ShareholdersWithin the Health Operating Segment, there are symmetrical put and call options existing over the non-controlling shareholdings in RB & Manon Business Co. Ltd, RB & Manon Business Limited and RB (China Trading) Limited. In 2018, the parties agreed to extend these options to 31 December 2023. In the event that the options are not exercised in accordance with the agreement, they are automatically extended for a further six years.
Within the Hygiene Home Operating Segment, there are symmetrical put and call options existing over the non-controlling shareholdings in RB (Hygiene Home) HK Limited, RB & Manon Hygiene Home (HK) Limited and RB & Manon Hygiene Home (Shanghai) Limited. These options were first agreed in 2019 and are currently due to expire on 31 December 2024. In the event that the options are not exercised in accordance with the agreement, they are automatically extended for a further six years.
At 31 December 2019, the present value of these put option liabilities was £135 million (2018: £148 million).
OtherThe Group has related party relationships with its directors and key management personnel (Note 5).
27 Dividends2019
£m2018
£m
Cash dividends on equity ordinary shares:2018 Final paid: 100.2p (2017: Final 97.7p) per share 709 6882019 Interim paid: 73p (2018: Interim 70.5p) per share 518 499
Total dividends for the year 1,227 1,187
The Directors are proposing a final dividend in respect of the financial year ended 31 December 2019 of 101.6p per share which will absorb an estimated £721 million of Shareholders’ funds. If approved by Shareholders it will be paid on 28 May 2020 to Shareholders who are on the register on 17 April 2020, with an ex-dividend date of 16 April 2020.
28 AcquisitionsOn 22 February 2019 the Group completed the acquisition of 100% of the issued share capital of UpSpring, Ltd, an innovative pre and post-natal healthcare company based in Texas, USA.
29 Cash Generated From Operations
For the year ended 31 December2019
£m
2018 (Restated)1
£m
Operating (loss)/profit from continuing operations (1,954) 3,058Depreciation, amortisation and impairment2 5,554 409(Losses)/gain on sale of property, plant and equipment (4) 9(Increase) in inventories (87) (68)(Increase) in receivables (150) (103)Increase in payables and provisions 31 81Share-based payments 18 14
Cash generated from continuing operations 3,408 3,400
1 Restated for the adoption of IFRS16 (Note 31).2 Includes adjusting items of £81 million (2018: £78 million) amortisation on acquisition-related intangibles and £5,116 million of impairment on goodwill and intangible assets (note 9).
N OT ES TO T H E F I N A N C I A L S TAT E M E N T S CO N T I N U ED

S T R AT E G I C R E P O R T G O V E R N A N C E F I N A N C I A L S TAT E M E N T S
201Reckitt Benckiser Group plc (RB) Annual Report and Financial Statements 2019
30 Discontinued OperationsOn 11 July 2019, the Group announced it had reached agreements with the U.S. Department of Justice (“DoJ”) and the Federal Trade Commission (“FTC”) to resolve the long-running investigation into the sales and marketing of Suboxone Film by its former prescription pharmaceuticals business Indivior, a business that was wholly demerged from the Group in 2014.
Under the terms of the agreements, the Group agreed to pay a total of up to $1.4 billion (£1.1 billion) to fully resolve all federal investigations into the Group in connection with the subject matter of the Indivior indictment and claims relating to state Medicaid programs for those states choosing to participate in the settlement. The resolution will also protect the Group’s participation in all U.S. government programmes. As of 31 December 2019, $1.4 billion has been paid.
While the Group has acted lawfully at all times and expressly denies all allegations that it engaged in any wrongful conduct, after careful consideration, the Board of the Group determined that the agreement is in the best interests of the company and its Shareholders. It avoids the costs, uncertainty and distraction associated with continued investigations, litigation and the potential for an indictment at a time of significant transformation under RB 2.0 and during CEO transition. This is a non-criminal resolution and is on the basis that there is no admission of any violation of law or any wrongdoing by the Group or any of the Group’s employees.
31 Effect from implementation of IFRS 16 ‘Leases’The effect of the implementation of IFRS 16 on the Group Income Statement, Group Balance Sheet and Group Cash Flow for the financial year ending 31 December 2018 are set out below.
Group Income Statement31 December
2018 Reported
£m
Effects of IFRS 16
£m
31 December 2018
Restated £m
Net operating expenses (4,588) 11 (4,577)
Operating profit 3,047 11 3,058
Adjusted operating profit 3,358 11 3,369
Operating profit 3,047 11 3,058
Finance expense (403) (13) (416)
Net finance expense (325) (13) (338)
Profit before income tax 2,722 (2) 2,720
Net income for the period from continuing operations 2,186 (2) 2,184
Attributable to owners of the parent company 2,161 (2) 2,159
Net income 2,181 (2) 2,179
Basic earnings per ordinary share:From continuing operations (pence) 306.8 (0.2) 306.6
From total operations 306.1 (0.2) 305.9
Diluted earnings per ordinary share:From continuing operations (pence) 305.5 (0.3) 305.2
From total operations 304.8 (0.3) 304.5

202 Reckitt Benckiser Group plc (RB) Annual Report and Financial Statements 2019
31 Effect from implementation of IFRS 16 ‘Leases’ continuedGroup Balance Sheet
31 December 2018
Reported £m
Effects of IFRS 16
£m
31 December 2018
Restated £m
ASSETSProperty, plant and equipment 1,858 304 2,162
Total non-current assets 32,698 304 33,002
Total assets 37,650 304 37,954
LIABILITIESCurrent liabilitiesShort-term borrowings (2,209) (60) (2,269)Provisions for liabilities and charges (542) 5 (537)
(7,614) (55) (7,669)
Non-current liabilitiesLong-term borrowings (9,670) (280) (9,950)Provisions for liabilities and charges (87) 13 (74)
(15,247) (267) (15,514)
Total liabilities (22,861) (322) (23,183)
Net assets 14,789 (18) 14,771
EQUITYCapital and reservesRetained earnings 28,215 (18) 28,197
Attributable to owners of the parent company 14,742 (18) 14,724
Total equity 14,789 (18) 14,771
N OT ES TO T H E F I N A N C I A L S TAT E M E N T S CO N T I N U ED

S T R AT E G I C R E P O R T G O V E R N A N C E F I N A N C I A L S TAT E M E N T S
203Reckitt Benckiser Group plc (RB) Annual Report and Financial Statements 2019
31 Effect from implementation of IFRS 16 ‘Leases’ continued
31 December 2017
Reported £m
Effects of IFRS 16
£m
31 December 2017
Restated £m
ASSETSProperty, plant and equipment 1,754 314 2,068
Total non-current assets 31,589 314 31,903
Total assets 37,013 314 37,327
LIABILITIESCurrent liabilitiesShort-term borrowings (1,346) (48) (1,394)
(6,576) (48) (6,624)
Non-current liabilitiesLong-term borrowings (11,515) (282) (11,797)
(16,864) (282) (17,146)
Total liabilities (23,440) (330) (23,770)
Net assets 13,573 (16) 13,557
EQUITYCapital and reservesRetained earnings 27,039 (16) 27,023
Attributable to owners of the parent company 13,533 (16) 13,517
Total equity 13,573 (16) 13,557
Group Cash Flow Statement31 December
2018 Reported
£m
Effects of IFRS 16
£m
31 December 2018
Restated £m
CASH FLOWS FROM OPERATING ACTIVITIESCash generated from continuing operations 3,330 701 3,400
Net cash generated from operating activities 2,454 70 2,524
CASH FLOWS FROM INVESTING ACTIVITIESNet cash used in investing activities (422) – (422)
CASH FLOWS FROM FINANCING ACTIVITIESRepayment of borrowings (2,244) (70) (2,314)
Net cash used in financing activities (2,618) (70) (2,688)
Net decrease in cash and cash equivalents (586) – (586)
Cash and cash equivalents at end of the year 1,477 – 1,477
Cash and cash equivalents comprise:Cash and cash equivalents 1,483 – 1,483Overdrafts (6) – (6)
1,477 – 1,477
1 Includes £60m depreciation, amortisation and impairment.
32 Post Balance Sheet EventsThe impact of COVID-19 is considered to represent a non-adjusting post balance sheet event as at 31 December 2019. For further information on the potential future impact of COVID-19, refer to the Chief Executive’s statement within the Strategic Report.
In March 2020, the Group drew down around £750 million from its committed borrowing facilities due to illiquidity in the short-term market for commercial paper. Committed facilities total £5,500 million (2018: £4,500 million), of which £4,750 million remains undrawn, and available to draw. The Group remains compliant with its banking covenants. Our committed facilities are not subject to renewal until from 2022 onwards.

204 Reckitt Benckiser Group plc (RB) Annual Report and Financial Statements 2019
The five year summary below is presented on a statutory basis. The year ending 31 December 2016, 31 December 2017, 31 December 2018 and 31 December 2019 show the results for continuing operations and exclude the impact of RB Food. The years ending 31 December 2015 show the results for continuing operations including RB Food. All years exclude the impact of RB Pharmaceuticals.
The Balance Sheet has not been restated for the impact of discontinued operations.
Income Statement2019 £m
Restated4 2018
£m
Restated3 2017
£m2016
£m2015 £m
Net Revenue 12,846 12,597 11,449 9,480 8,874Operating (loss)/profit (1,954) 3,058 2,737 2,269 2,241
Adjusted Operating Profit 3,367 3,369 3,122 2,636 2,374Adjusting items (5,321) (311) (385) (367) (133)
Operating (loss)/profit (1,954) 3,058 2,737 2,269 2,241Net finance expense (153) (338) (238) (16) (33)(Loss)/Profit before income tax (2,107) 2,720 2,499 2,253 2,208Income tax (expense)/benefit (665) (536) 894 (520) (463)Attributable to non-controlling interests (13) (20) (17) (4) (2)Net income attributable to owners of the parent company from continuing operations (2,785) 2,164 3,376 1,729 1,743
Balance SheetNet assets 9,407 14,771 13,557 8,426 6,906Net Working Capital (1,427) (1,438) (1,424) (1,102) (936)StatisticsReported basisOperating margin (15.2%) 24.3% 23.9% 23.9% 25.3%Total interest to Operating Profit (times covered) -12.8x 9.0x 11.5x 141.8x 67.9xTax rate (31.5%) 19.7% -35.8% 23.1% 21.0%Diluted earnings per share, continuing (393.0) 305.2p 474.7p 242.1p 240.9pDividend cover1 (2.3x) 1.8x 2.9x 1.6x 1.7xDeclared total dividends per ordinary share 174.6p 170.7p 164.3p 153.2p 139pAdjusted basis2
Operating margin 26.2% 26.7% 27.3% 27.8% 26.8%Total interest to operating profit4,5 (times covered) 17.9x 10.9x 18.0x 164.8x 71.9xDiluted earnings per share, continuing 349.0p 339.6p 316.9p 287.6p 258.6pDividend cover1 2.0x 2.0x 1.9x 1.9x 1.9x
1. Dividend cover is calculated by dividing diluted earnings per share by total ordinary dividends per share relating to the year.2. Adjusted basis is calculated by excluding the adjusting items for the year (Note 3).3. Restated for adoption of IFRS 15 in 2017. The 2015 and 2016 balances have not been restated.4. Restated for adoption of IFRS 16 (Note 31). The 2015, 2016 and 2017 balances have not been restated.5. Adjusted operating profit cover over adjusted net finance expense.
F I V E Y E A R SU M M A RY

S T R AT E G I C R E P O R T G O V E R N A N C E F I N A N C I A L S TAT E M E N T S
205Reckitt Benckiser Group plc (RB) Annual Report and Financial Statements 2019
PA R E N T CO M PA N Y B A L A N C E S H E E T
As at 31 December Notes2019
£m2018
£m
Fixed assetsInvestments 2 14,963 14,949Current assetsDebtors due within one year 3,6 42 44Debtors due after more than one year 4 2 3Cash and cash equivalents 6 4 1
48 48Current liabilitiesCreditors due within one year 5,6 (8,425) (6,347)
Net current liabilities (8,377) (6,299)
Total assets less current liabilities 6,586 8,650
Provisions for liabilities and charges 7 (99) (369)
Net assets 6,487 8,281
EQUITYShare capital 8 74 74Share premium 245 245Retained earnings 6,168 7,962
Total equity 6,487 8,281
The Financial Statements on pages 205 to 222 were approved by the Board of Directors on 26 March 2020 and signed on its behalf by:
Christopher Sinclair Laxman NarasimhanDirector Director
Company Number: 06270876

206 Reckitt Benckiser Group plc (RB) Annual Report and Financial Statements 2019
Share capital
£m
Share premium
£m
Retained earnings
£m
Total equity
£m
Balance at 1 January 2018 74 243 7,604 7,921Comprehensive incomeProfit for the financial year – – 1,428 1,428
Total comprehensive income – – 1,428 1,428
Transactions with ownersTreasury shares re-issued – 2 103 105Share-based payments – – (10) (10)Capital contribution in respect of share-based payments – – 24 24Cash dividends – – (1,187) (1,187)
Total transactions with owners – 2 (1,070) (1,068)
Balance at 31 December 2018 74 245 7,962 8,281
Comprehensive incomeLoss for the financial year – – (646) (646)
Total comprehensive loss – – (646) (646)
Transactions with ownersTreasury shares re-issued – – 61 61Share-based payments – – 4 4Capital contribution in respect of share-based payments – – 14 14Cash dividends – – (1,227) (1,227)
Total transactions with owners – – (1,148) (1,148)
Balance at 31 December 2019 74 245 6,168 6,487
Reckitt Benckiser Group plc has £5,543 million (2018: £7,355 million) of its retained earnings available for distribution. Details of Treasury shares and other equity transactions are included in Note 23 of the Group Financial Statements.
PA R E N T CO M PA N Y S TAT E M E N T O F C H A N G ES I N EQ U I T Y

S T R AT E G I C R E P O R T G O V E R N A N C E F I N A N C I A L S TAT E M E N T S
207Reckitt Benckiser Group plc (RB) Annual Report and Financial Statements 2019
1 Parent Company Accounting PoliciesThe principal accounting policies are summarised below. They have all been applied consistently throughout the year and the preceding year.
General Information and Basis of AccountingReckitt Benckiser Group plc is a company incorporated in the United Kingdom, registered in England and Wales under the Companies Act 2006, and is a public limited company. The address of the registered office is given on page 224. The nature of the Group’s operations and its principal activities are set out in the Strategic Report on pages 1 to 77.
Statement of ComplianceThe Financial Statements have been prepared under the historical cost convention and in compliance with United Kingdom Accounting Standards, including Financial Reporting Standard 102, “The Financial Reporting Standard applicable in the United Kingdom and the Republic of Ireland” (‘FRS 102’) and the Companies Act 2006.
The functional currency of Reckitt Benckiser Group plc is considered to be Pounds Sterling because that is the currency of the primary economic environment in which the Company operates.
As permitted by s408 of the Companies Act 2006, a Statement of Comprehensive Income is not presented for Reckitt Benckiser Group plc.
Going ConcernThe Directors considered it appropriate to adopt the going concern basis of accounting in preparing the Company Financial Statements.
Financial Reporting Standard 102 – Reduced Disclosure ExemptionsFRS 102 allows a qualifying entity certain disclosure exemptions, subject to certain conditions, which have been complied with.
The Company has taken advantage of the following exemptions:(i) from preparing a Statement of Cash Flows, on the basis that it is a
qualifying entity and the Group Cash Flow Statement, included in these Financial Statements, includes the Company’s cash flows;
(ii) from disclosing the Company key management personnel compensation, as required by FRS 102 paragraph 33.7.
The Company’s results are included in the publicly available consolidated Financial Statements of Reckitt Benckiser Group plc and these Financial Statements may be obtained from 103-105 Bath Road, Slough, Berkshire SL1 3UH or at www.rb.com.
Foreign Currency TranslationTransactions denominated in foreign currencies are translated using exchange rates prevailing at the dates of the transactions. Foreign exchange gains and losses resulting from the settlement of foreign currency transactions and from the translation at year-end exchange rates of monetary assets and liabilities denominated in foreign currencies are recognised in the Statement of Comprehensive Income.
N OT ES TO T H E PA R E N T CO M PA N Y F I N A N C I A L S TAT E M E N T S
TaxationThe tax charge/credit is based on the result for the year and takes into account taxation deferred due to timing differences between the treatment of certain items for taxation and accounting purposes. Deferred tax liabilities are provided for in full and deferred tax assets are recognised to the extent that they are considered recoverable.
A net deferred tax asset is considered recoverable if it can be regarded as more likely than not that there will be suitable taxable profits against which to recover carried forward tax losses and from which the future reversal of underlying timing differences can be deducted.
Deferred tax is recognised in respect of all timing differences that have originated but not reversed at the Balance Sheet date, where transactions or events that result in an obligation to pay more tax in the future or a right to pay less tax in the future have occurred at the Balance Sheet date.
Deferred tax is measured at the average tax rates that are expected to apply in the periods in which the timing differences are expected to reverse, based on tax rates and laws that have been enacted or substantively enacted by the Balance Sheet date. Deferred tax is measured on an undiscounted basis.
Fixed Asset InvestmentsFixed asset investments are stated at the lower of cost or their recoverable amount, which is determined as the higher of net realisable value and value in use. A review of the potential impairment of an investment is carried out by the Directors if events or changes in circumstances indicate that the carrying value of the investment may not be recoverable. Such impairment reviews are performed in accordance with FRS 102 Section 27 ‘Impairment of assets’.
Employee Share SchemesIncentives in the form of shares are provided to employees under share option and restricted share schemes which vest in accordance with non-market conditions.
The fair value determined at the grant date of the equity- settled share-based payments is expensed on a straight-line basis over the vesting period, based on the Group’s estimate of equity instruments that will eventually vest. At each Balance Sheet date, the Group revises its estimate of the number of equity instruments expected to vest. The impact of the revision of the original estimates, if any, is recognised in comprehensive income or expense such that the cumulative expense reflects the revised estimate, with a corresponding adjustment to equity reserves.
Additional employer costs in respect of options and awards are charged, including social security taxes, to the Statement of Comprehensive Income over the same period, with a corresponding liability recognised.
The grant by the Company of options over its equity instruments to the employees of subsidiary undertakings in the Group is treated as a capital contribution. The fair value of employee services received, measured by reference to the grant date fair value, is recognised over the vesting period as an increase to investment in subsidiary undertakings, with a corresponding credit to equity in the Company Financial Statements.

208 Reckitt Benckiser Group plc (RB) Annual Report and Financial Statements 2019
1 Parent Company Accounting Policies continuedFinancial InstrumentsThe Company only enters into basic financial instrument transactions that result in the recognition of basic financial assets and liabilities, including trade and other receivables and payables and loans to and from related parties. These transactions are initially recorded at transaction price, unless the arrangement constitutes a financing transaction where the transaction is measured at the present value of the future receipt discounted at a market rate of interest, and subsequently recognised at amortised cost.
(i) Financial AssetsAt the end of each reporting period financial assets measured at amortised cost are assessed for objective evidence of impairment. If an asset is impaired the impairment loss is the difference between the carrying amount and the present value of the estimated cash flows discounted at the asset’s original effective interest rate. The impairment loss is recognised in comprehensive income or expense.
Financial assets are derecognised when (a) the contractual rights to the cash flows from the asset expire or are settled, or (b) substantially all the risks and rewards of the ownership of the asset are transferred to another party or (c) control of the asset has been transferred to another party who has the practical ability to unilaterally sell the asset to an unrelated third party without imposing additional restrictions.
(ii) Financial LiabilitiesBasic financial liabilities, including loans from fellow group companies, are initially recognised at transaction price, unless the arrangement constitutes a financing transaction, where the debt instrument is measured at the present value of future payments. Debt instruments are subsequently carried at amortised cost.
Financial liabilities are derecognised when the liability is extinguished, that is when the contractual obligation is discharged, cancelled or expires.
Provisions Provisions are recognised when the Company has a present legal or constructive obligation as a result of past events; it is more likely than not that there will be an outflow of resources to settle that obligation; and the amount can be reliably estimated. Provisions are valued at the present value of the Directors’ best estimate of the expenditure required to settle the obligation at the Balance Sheet date. Where it is possible that a settlement may be reached or it is not possible to make a reliable estimate of the estimated financial impact, appropriate disclosure is made but no provision recognised.
Share Capital TransactionsWhen the Company purchases equity share capital, the amount of the consideration paid, including directly attributable costs, is recognised as a charge to equity. Purchased shares are either held in treasury in order to satisfy employee options, or cancelled and, in order to maintain capital, an equivalent amount to the nominal value of the shares cancelled is transferred from retained earnings.
Repurchase and Reissuance of Ordinary SharesWhen shares recognised as equity are repurchased, the amount of the consideration paid, including directly attributable costs, is recognised as a charge to equity. Repurchased shares are classified as Treasury shares and are presented in retained earnings. When Treasury shares are sold or reissued subsequently, the amount received is recognised as an increase in equity and the resulting surplus or deficit is presented within share premium.
DividendsDividends payable are recognised when they meet the criteria for a present obligation (i.e. when they have been approved).
Accounting Estimates and JudgementsIn preparing these financial statements, management has made judgements and estimates that affect the application of the Company’s accounting policies and the reported amounts of assets, liabilities, income and expenses. Actual amounts and results may differ from these estimates.
The estimates and underlying assumptions are reviewed on an ongoing basis. Revisions to accounting estimates are recognised in the period in which the estimate is revised if the revision affects only that period, or in the period of the revision and future periods if the revision affects both current and future periods.
Key sources of estimation uncertaintyEach year, management is required to make a number of assumptions regarding the future. The related year-end accounting estimates will, by definition, seldom equal the final actual results. The estimates and assumptions that have a significant risk of causing a material adjustment to the carrying amounts of assets and liabilities within the next financial year are addressed below.
The Company recognises legal provisions in line with the Company’s provisions policy. The level of provisioning in relation to civil and/or criminal investigations is an area where management and legal judgement is important, with individual provisions being based on best estimates of the potential loss, considering all available information, external advice and historical experience. As at 31 December 2019, the Company recognised exceptional legal provisions of £99m (2018: £369m) in relation to a number of historical regulatory matters. Refer to Note 7 of the Company Financial Statements for further information.
The Company’s Directors are of the opinion that there are no further judgements and no key sources of estimation uncertainty that have a significant risk of causing a material adjustment to the carrying value of assets and liabilities for the Company within the next financial year.
N OT ES TO T H E PA R E N T CO M PA N Y F I N A N C I A L S TAT E M E N T S CO N T I N U ED
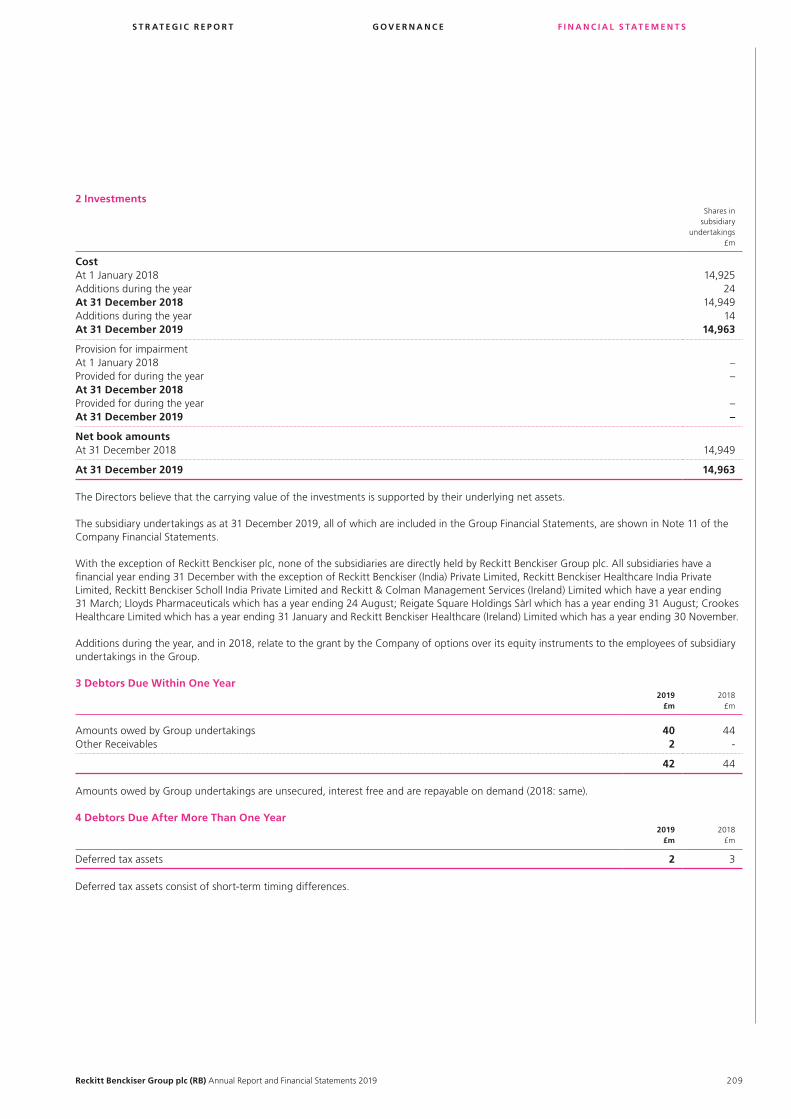
S T R AT E G I C R E P O R T G O V E R N A N C E F I N A N C I A L S TAT E M E N T S
209Reckitt Benckiser Group plc (RB) Annual Report and Financial Statements 2019
2 InvestmentsShares in
subsidiary undertakings
£m
CostAt 1 January 2018 14,925Additions during the year 24At 31 December 2018 14,949Additions during the year 14At 31 December 2019 14,963
Provision for impairmentAt 1 January 2018 –Provided for during the year –At 31 December 2018Provided for during the year –At 31 December 2019 –
Net book amountsAt 31 December 2018 14,949
At 31 December 2019 14,963
The Directors believe that the carrying value of the investments is supported by their underlying net assets.
The subsidiary undertakings as at 31 December 2019, all of which are included in the Group Financial Statements, are shown in Note 11 of the Company Financial Statements.
With the exception of Reckitt Benckiser plc, none of the subsidiaries are directly held by Reckitt Benckiser Group plc. All subsidiaries have a financial year ending 31 December with the exception of Reckitt Benckiser (India) Private Limited, Reckitt Benckiser Healthcare India Private Limited, Reckitt Benckiser Scholl India Private Limited and Reckitt & Colman Management Services (Ireland) Limited which have a year ending 31 March; Lloyds Pharmaceuticals which has a year ending 24 August; Reigate Square Holdings Sàrl which has a year ending 31 August; Crookes Healthcare Limited which has a year ending 31 January and Reckitt Benckiser Healthcare (Ireland) Limited which has a year ending 30 November.
Additions during the year, and in 2018, relate to the grant by the Company of options over its equity instruments to the employees of subsidiary undertakings in the Group.
3 Debtors Due Within One Year2019
£m2018
£m
Amounts owed by Group undertakings 40 44Other Receivables 2 -
42 44
Amounts owed by Group undertakings are unsecured, interest free and are repayable on demand (2018: same).
4 Debtors Due After More Than One Year2019
£m2018
£m
Deferred tax assets 2 3
Deferred tax assets consist of short-term timing differences.

210 Reckitt Benckiser Group plc (RB) Annual Report and Financial Statements 2019
5 Creditors Due Within One Year2019
£m2018
£m
Amounts owed to Group undertakings 8,412 6,342Taxation and social security 4 5Other payables 9 –
8,425 6,347
Included in the amounts owed to Group undertakings is an amount of £8,368 million (2018: £6,333 million) which is unsecured, carries interest at 3M LIBOR and is repayable on demand (2018: same). All other amounts owed to Group undertakings are unsecured, non-interest bearing and are repayable on demand (2018: same).
6 Financial Instruments2019
£m2018
£m
Financial assetsFinancial assets that are debt instruments measured at amortised cost 42 44Cash and cash equivalents 4 1
Financial liabilitiesFinancial liabilities at amortised cost 8,421 6,342
7 Provisions for Liabilities and ChargesLegal
provisions £m
Total provisions
£m
At 1 January 2018 356 356
Charged to the Statement of Comprehensive Income 17 17Utilised during the year (2) (2)Released to the Statement of Comprehensive Income (2) (2)
At 31 December 2018 369 369
Charged to the Statement of Comprehensive Income 79 79Utilised during the year (331) (331)Released to the Statement of Comprehensive Income (18) (18)
At 31 December 2019 99 99
Provisions have been analysed between current and non-current as follows:2019
£m2018
£m
Current 99 369 Non-current – –
99 369
Provisions relate to exceptional legal provisions in relation to a number of historic matters. Refer to note 17 of the Group Financial Statements.
N OT ES TO T H E PA R E N T CO M PA N Y F I N A N C I A L S TAT E M E N T S CO N T I N U ED

S T R AT E G I C R E P O R T G O V E R N A N C E F I N A N C I A L S TAT E M E N T S
211Reckitt Benckiser Group plc (RB) Annual Report and Financial Statements 2019
8 Share Capital
Issued and fully paidEquity
ordinary sharesNominal value
£m
At 1 January 2019 736,535,179 74Allotments – –
At 31 December 2019 736,535,179 74
The holders of ordinary shares (par value 10p) are entitled to receive dividends as declared from time to time and are entitled to one vote per share at meetings of the Parent Company.
9 Related Party TransactionsThere were no transactions with related parties other than wholly owned companies within the Group.
10 Contingent LiabilitiesThe Company has issued a guarantee to the trustees of the Reckitt Benckiser Pension Fund covering the obligations of certain UK subsidiaries of the Group who are the sponsoring employers of the UK defined benefit pension fund. The guarantee covers any amounts due to the pension fund from these subsidiaries if they fail to meet their pension obligations.
The Company has also issued a guarantee on behalf of Reckitt Benckiser Treasury Services plc in relation to the issuance of a US$8,250 million bond (two tranches of US$2,500 million, one tranche of US$2,000 million, one tranche of US$750 million and one tranche of US$500 million). Details are included in Note 14 of the Group Financial Statements.
The Company has also issued a guarantee on behalf of Reckitt Benckiser Treasury Services plc in relation to committed borrowing facilities totalling £5,500 million (2018: £4,500 million). Details of the facilities are included in Notes 14 and 32 of the Group Financial Statements.
The Company has also issued a guarantee on behalf of Mead Johnson Nutrition Company in relation to outstanding senior notes of US$2,300 million (2018:US$3,000 million) issued by Mead Johnson Nutrition Company prior to acquisition. The senior notes consist of two tranches of US$750 million, one tranche of US$500 million and one tranche of US$300 million. One tranche of US$700m was settled during the year.
Other contingent liabilities are disclosed in Note 19 of the Group Financial Statements.

212 Reckitt Benckiser Group plc (RB) Annual Report and Financial Statements 2019
11 Subsidiary UndertakingsIn accordance with Section 409 of the Companies Act 2006 and Schedule 4 of The Large and Medium-sized Companies and Groups (Accounts and Reports) Regulations 2008, a full list of related undertakings as at 31 December 2019, including their registered office address, country of incorporation and the percentage of share ownership, is disclosed below. All undertakings are indirectly owned by Reckitt Benckiser Group plc, unless otherwise stated.
From time to time, management reviews the Group structure and seeks to remove redundant, dormant or non-trading entities. The Group is currently undergoing such a review. In 2019, 19 legal entities were placed into liquidation, and our expectation is that further entities will be eliminated in 2020. The removal of legal entities ultimately allows management to focus on the core business, reduces compliance obligations and cost, and improves transparency of the Group to external parties.
All subsidiary undertakings of Reckitt Benckiser Group plc are included in the consolidated Financial Statements of the Group.
N OT ES TO T H E PA R E N T CO M PA N Y F I N A N C I A L S TAT E M E N T S CO N T I N U ED
NameCountry of Incorporation
Registered Office Share Class
Proportion of shares
held
103-105 Bath Road Limited
UK 149 ORD 100.00%
2309 Realty Corporation Philippines 116 A/B 88.32%
Airwick Industrie SAS France 60 ORD 100.00%
Anhui Guilong Pharmaceutical Trading Company Ltd
China 25 ORD 100.00%
Apenas Boa Nutrição Indústria de Alimentos Ltda.
Brazil 12 ORD 100.00%
Beleggingsmaatschappij Lemore BV
Netherlands 102 ORD 100.00%
Benckiser UK 150 ORD 100.00%
Blisa, LLC USA 122 MEMBERSHIP SHARES
100.00%
Brevet Hospital Products (UK) Limited*
UK 149 ORD 100.00%
British Surgical Industries Limited*
UK 149 ORD/PREF 100.00%
Canterbury Square Holdings S.à.r.l
Luxembourg 94 ORD 100.00%
Central Square Holding BV
Netherlands 102 ORD 100.00%
Crookes Healthcare Limited
Ireland 81 ORD 100.00%
Crookes Healthcare Limited
UK 149 ORD 100.00%
Cupal,Limited UK 149 ORD/PREF 100.00%
Dakin Brothers Limited UK 149 ORD 100.00%
Dorincourt Holdings (Ireland) Limited
Ireland 81 ORD 100.00%
Durex Limited UK 149 ORD 100.00%
Earex Products Limited* UK 149 ORD 100.00%
ERH Propack Limited UK 149 ORD 100.00%
Exponential Health LLC USA 122 MEMBERSHIP SHARES
100.00%
Fenla Industria, Comercio e Administracao Ltda
Brazil 13 COMMON 100.00%
FF Homecare & Hygiene Limited
UK 151 PREFERRED 37.50%
NameCountry of Incorporation
Registered Office Share Class
Proportion of shares
held
Gainbridge Investments (Cyprus) Limited
Cyprus 46 ORD 100.00%
Glasgow Square Limited UK 149 ORD 100.00%
Green, Young & Company Limited
UK 149 ORD 100.00%
Grosvenor Square Holding B.V.
Netherlands 102 ORD 100.00%
Guilong Pharmaceutical (Anhui) Co. Ltd
China 25 ORD 100.00%
Guilong Pharmaceutical (Anhui) Co. Ltd†
China 26 – 100.00%
Hamol Limited UK 149 ORD 100.00%
Helpcentral Limited UK 149 ORD 100.00%
Howard Lloyd & Company,Limited
UK 149 ORD 100.00%
Kukident GmbH Germany 62 COMMON 100.00%
Lancaster Square Holdings SL
Spain 134 ORD 100.00%
LI Pensions Trust Limited UK 149 ORD 100.00%
Linden Germany A Limited
UK 149 ORD 100.00%
Linden Germany B Limited
UK 149 ORD 100.00%
Lloyds Pharmaceuticals UK 149 ORD 100.00%
London International Group Limited
UK 149 ORD 100.00%
London International Trading Asia Limited
Hong Kong 68 ORD 100.00%
LRC Investments Limited* UK 149 ORD/PREF 100.00%
LRC North America Inc USA 122 COM/PREF 100.00%
LRC Products Limited UK 149 ORD 100.00%
LRC Secretarial Services Limited
UK 149 ORD 100.00%
Maddison Square Holding B.V.
Netherlands 102 ORD 100.00%
Manufactura MJN, S. de R.L. de C.V.
Mexico 98 ORD 100.00%
Mead Johnson & Company LLC
USA 122 MEMBERSHIP SHARES
100.00%
Mead Johnson B.V. Netherlands 103 ORD 100.00%

S T R AT E G I C R E P O R T G O V E R N A N C E F I N A N C I A L S TAT E M E N T S
213Reckitt Benckiser Group plc (RB) Annual Report and Financial Statements 2019
NameCountry of Incorporation
Registered Office Share Class
Proportion of shares
held
Mead Johnson do Brasil Comercio E Importacao De Productos de Nutricao Ltda.
Brazil 14 ORD 100.00%
Mead Johnson Nutricionales de México, S. de R.L. de C.V.
Mexico 98 ORD 100.00%
Mead Johnson Nutrition (Asia Pacific) Pte. Ltd.
Singapore 127 ORD 100.00%
Mead Johnson Nutrition (Australia) Pty Ltd
Australia 3 ORD 100.00%
Mead Johnson Nutrition (Belgium) BVBA
Belgium 10 ORD 100.00%
Mead Johnson Nutrition (Canada) Co.
Canada 19 COMMON 100.00%
Mead Johnson Nutrition (Colombia) Ltda.
Colombia 41 ORD 100.00%
Mead Johnson Nutrition (Dominicana), S.A.
USA 122 COMMON 100.00%
Mead Johnson Nutrition (Dominicana), S.A.†
Dominican Republic
49 – 100.00%
Mead Johnson Nutrition (France) SAS
France 60 ORD 100.00%
Mead Johnson Nutrition (Hong Kong) Limited
Hong Kong 69 ORD 100.00%
Mead Johnson Nutrition (Hong Kong) Limited†
Hong Kong 70 – 100.00%
Mead Johnson Nutrition (India) Private Limited
India 74 ORD 100.00%
Mead Johnson Nutrition (Italia) S.r.l.
Italy 84 QUOTA 100.00%
Mead Johnson Nutrition (Malaysia) Sdn Bhd
Malaysia 95 ORD 100.00%
Mead Johnson Nutrition (Panama), S. de R.L.
Panama 113 PARTNERSHIP/MEMBERSHIP
INTERESTS
100.00%
Mead Johnson Nutrition (Philippines), Inc.
Philippines 116 COMMON 99.96%
Mead Johnson Nutrition (Poland) Sp. z o.o
Poland 118 ORD 100.00%
Mead Johnson Nutrition (Puerto Rico) Inc.
USA 122 COMMON 100.00%
Mead Johnson Nutrition (Puerto Rico) Inc.†
Puerto Rico 122 – 100.00%
Mead Johnson Nutrition (Singapore) Pte. Ltd.
Singapore 127 ORD 100.00%
Mead Johnson Nutrition (Taiwan) Ltd.
Taiwan 141 ORD 100.00%
Mead Johnson Nutrition (Thailand) Ltd.
Thailand 143 COMMON 100.00%
Mead Johnson Nutrition (UK) Ltd.
UK 149 ORD 100.00%
Mead Johnson Nutrition (Venezuela) LLC
USA 122 MEMBERSHIP SHARES
100.00%
NameCountry of Incorporation
Registered Office Share Class
Proportion of shares
held
Mead Johnson Nutrition (Vietnam) Company Limited
Vietnam 159 ORD 100.00%
Mead Johnson Nutrition Argentina S.A.
Argentina 1 A/B 90.00%
Mead Johnson Nutrition Company
USA 122 COMMON 100.00%
Mead Johnson Nutrition Holdings (Singapore) Pte. Ltd.
Singapore 127 ORD 100.00%
Mead Johnson Nutrition International Holdings Pte Ltd
Singapore 127 ORD 100.00%
Mead Johnson Nutrition Nominees LLC
USA 122 MEMBERSHIP SHARES
100.00%
Mead Johnson Nutrition Trading Poland Sp. z o.o
Poland 118 ORD 100.00%
Mead Johnson Nutrition Venezuela S.C.A.
Venezuela 157 ORD/COMMON 100.00%
Mead Johnson Nutritionals (China) Ltd.
China 38 ORD 88.89%
Mead Johnson One C.V. Netherlands 104 PARTNERSHIP INTERESTS
100.00%
Mead Johnson Pediatric Nutrition Institiute (China) Ltd.
China 27 – 100.00%
Mead Johnson Pediatric Nutrition Technology (Guangzhou) Ltd
China 39 – 100.00%
Mead Johnson Two C.V. Netherlands 104 PARTNERSHIP INTERESTS
100.00%
Medcom Marketing And Prodazha Ukraine LLC*
Ukraine 152 – 100.00%
MJ UK Holdings Limited UK 149 ORD 100.00%
MJ USA Holdings LLC USA 122 MEMBERSHIP SHARES
100.00%
MJN Asia Pacific Holdings LLC
USA 122 MEMBERSHIP SHARES
100.00%
MJN Global Holdings B.V. Netherlands 105 ORD 100.00%
MJN Holdings (Netherlands) B.V.
Netherlands 105 ORD 100.00%
MJN Innovation Services B.V.
Netherlands 103 ORD 100.00%
MJN International Holdings (UK), Ltd.
UK 149 ORD 100.00%
MJN U.S. Holdings LLC USA 122 MEMBERSHIP SHARES
100.00%
New Bridge Holdings B.V. Netherlands 102 ORD 100.00%
New Bridge Street Invoicing Limited*
UK 149 ORD 100.00%
Norwich Square Holding SL
Spain 134 ORD 100.00%
Nurofen Limited UK 149 ORD 100.00%
11 Subsidiary Undertakings continued

214 Reckitt Benckiser Group plc (RB) Annual Report and Financial Statements 2019
N OT ES TO T H E PA R E N T CO M PA N Y F I N A N C I A L S TAT E M E N T S CO N T I N U ED
NameCountry of Incorporation
Registered Office Share Class
Proportion of shares
held
Open Championship Limited*
UK 149 ORD 100.00%
Optrex Limited UK 149 ORD 100.00%
Oriental Medicine Company Limited
Hong Kong 68 ORD 100.00%
Oxy Reckitt Benckiser LLC South Korea 133 ORD 100.00%
Pharmalab Limited UK 149 ORD 100.00%
Prebbles Limited* UK 149 ORD/DEF 100.00%
Propack Produkte für Haushalt und Körperpflege GmbH
Germany 63 ORD 100.00%
PT Mead Johnson Indonesia
Indonesia 77 ORD 90.10%
PT Reckitt Benckiser Hygiene Home Indonesia
Indonesia 77 ORD 100.00%
PT Reckitt Benckiser Hygiene Home Trading Indonesia
Indonesia 77 ORD 100.00%
PT Reckitt Benckiser Indonesia
Indonesia 78 ORD 100.00%
PT Reckitt Benckiser Trading Indonesia
Indonesia 79 ORD 100.00%
Qingdao London Durex Co., Ltd
China 28 ORD 100.00%
Qingdao New Bridge Corporate Management Consulting Company Limited
China 28 ORD 100.00%
R&C Nominees Limited UK 149 ORD 100.00%
R&C Nominees One Limited
UK 149 ORD 100.00%
R&C Nominees Two Limited
UK 149 ORD 100.00%
RB & Manon Business Co. Ltd
China 31 ORD 75.05%
RB & Manon Business Limited
Hong Kong 72 ORD 75.00%
RB & Manon Hygiene Home (Shanghai) Limited
China 29 ORD 100.00%
RB & Manon Hygiene Home Limited
Hong Kong 71 ORD 80.00%
RB (China Trading) Limited
UK 149 ORD 80.00%
RB (China) Holding Co. Ltd
China 30 ORD 100.00%
RB (Health) Colombia S.A.S
Colombia 42 ORD 100.00%
RB (Health) Malaysia Sdn Bhd
Malaysia 96 ORD 100.00%
RB (Hygiene Home) Australia Pty Ltd
Australia 4 ORD 100.00%
RB (Hygiene Home) Czech Republic, spol s.r.o
Czech Republic 47 ORD 100.00%
NameCountry of Incorporation
Registered Office Share Class
Proportion of shares
held
RB (Hygiene Home) HK Limited
Hong Kong 71 ORD 80.00%
RB (Hygiene Home) Hungary Kft
Hungary 73 ORD 100.00%
RB (Hygiene Home) Ltd Israel 83 ORD 100.00%
RB (Hygiene Home) New Zealand Limited
New Zealand 107 ORD 100.00%
RB (Hygiene Home) Poland Sp. z o.o
Poland 119 ORD 100.00%
RB (Hygiene Home) Romania S.R.L.
Romania 123 ORD 100.00%
RB (Hygiene Home) Slovakia, spol. s r.o.
Slovakia 130 ORD 100.00%
RB (Suzhou) Co. Ltd China 40 – 100.00%
RB Asia Holding Limited UK 149 ORD 100.00%
RB East Trading Limited *† Dubai 50 – 80.00%
RB Finance Luxembourg (2018) S.à.r.l
Luxembourg 94 ORD 100.00%
RB Health (Canada) Inc. Canada 20 COMMON/PREFERRED
100.00%
RB Health (Ecuador) Cia. Ltda.
Ecuador 54 ORD 100.00%
RB Health (US) LLC USA 154 MEMBERSHIP SHARES
100.00%
RB Health Chile SpA Chile 23 ORD 100.00%
RB Health Manufacturing (US) LLC
USA 154 MEMBERSHIP SHARES
100.00%
RB Health Mexico, S.A de C.V.
Mexico 98 ORD 100.00%
RB Health Nordic A/S sivuliike Suomessa†
Finland 58 – 100.00%
RB Health Nordic A/S, filial†
Sweden 138 – 100.00%
RB Health Nordic, NUF† Norway 110 – 100.00%
RB Health Peru S.R.L. Peru 114 ORD 100.00%
RB Health Services Mexico, S.A de C.V.
Mexico 98 ORD 100.00%
RB Healthcare Pte Ltd* Singapore 128 ORD 100.00%
RB Holding Europe Du Sud SAS
France 60 ORD 100.00%
RB Holdings (Luxembourg) S.à.r.l
Luxembourg 94 ORD 100.00%
RB Holdings (Nottingham) Limited
UK 149 ORD 100.00%
RB Holdings Luxembourg (2018) S.à.r.l
Luxembourg 94 ORD 100.00%
RB Hygiene Home (Thailand) Limited
Thailand 144 ORD 100.00%
RB Hygiene Home Arabia FZE
Dubai 53 ORD 100.00%
11 Subsidiary Undertakings continued

S T R AT E G I C R E P O R T G O V E R N A N C E F I N A N C I A L S TAT E M E N T S
215Reckitt Benckiser Group plc (RB) Annual Report and Financial Statements 2019
NameCountry of Incorporation
Registered Office Share Class
Proportion of shares
held
RB Hygiene Home Austria GmbH
Austria 5 ORD 100.00%
RB Hygiene Home Belgium SA/NV
Belgium 10 ORD 100.00%
RB Hygiene Home Deutschland GmbH
Germany 64 ORD 100.00%
RB Hygiene Home France SAS
France 60 ORD 100.00%
RB Hygiene Home India Private Limited
India 75 ORD 100.00%
RB Hygiene Home Investments Limited
UK 149 ORD 100.00%
RB Hygiene Home Japan Ltd
Japan 86 ORD 100.00%
RB Hygiene Home Netherlands B.V.
Netherlands 102 ORD 100.00%
RB Hygiene Home Nordic A/S
Denmark 48 ORD 100.00%
RB Hygiene Home Nordic A/S, filial†
Sweden 138 – 100.00%
RB Hygiene Home Nordic A/S, sivuliike Suomessa†
Finland 59 – 100.00%
RB Hygiene Home Nordic NUF†
Norway 110 – 100.00%
RB Hygiene Home Switzerland AG
Switzerland 140 ORD 100.00%
RB Ireland Hygiene Home Commercial Limited
Ireland 82 ORD 100.00%
RB LATAM Holding B.V. Netherlands 102 ORD 100.00%
RB Luxembourg (2016) Limited
UK 149 ORD 100.00%
RB Luxembourg (TFFC) S.à.r.l
Luxembourg 94 ORD 100.00%
RB Luxembourg Holdings (TFFC) Limited
UK 149 ORD 100.00%
RB Luxembourg Holdings (TFFC) Limited†
Luxembourg 94 – 100.00%
RB Manufacturing LLC USA 122 MEMBERSHIP SHARES
100.00%
RB Mexico Investments Limited
UK 149 ORD 100.00%
RB NL Brands B.V. Netherlands 102 ORD 100.00%
RB Reigate (2019) Ltd UK 149 ORD 100.00%
RB Reigate (Ireland) Unlimited Company
Ireland 81 ORD 100.00%
RB Reigate (UK) Limited UK 149 ORD 100.00%
RB Salute Mexico S.A de C.V.
Mexico 99 ORD 100.00%
RB Square Holdings Spain, S.L.
Spain 134 A/B 100.00%
RB UK Commercial Limited
UK 149 ORD 100.00%
NameCountry of Incorporation
Registered Office Share Class
Proportion of shares
held
RB UK Hygiene Home Commercial Limited
UK 149 ORD 100.00%
RB USA (2019) Ltd UK 149 ORD 100.00%
RB USA Holdings LLC USA 122 MEMBERSHIP SHARES
100.00%
RB Winchester (Ireland) Unlimited Company
Ireland 81 ORD 100.00%
RBHCR Health Reckitt Costa Rica Sociedad Anonima
Costa Rica 44 COMMON 100.00%
Reckitt & Colman (Jersey) Limited
Jersey 87 ORD/PREF 100.00%
Reckitt & Colman (Overseas) Health Limited
UK 149 ORD 100.00%
Reckitt & Colman (Overseas) Hygiene Home Limited
UK 149 ORD 100.00%
Reckitt & Colman (Overseas) Limited
UK 149 ORD 100.00%
Reckitt & Colman (UK) Limited
UK 149 ORD/PREF 100.00%
Reckitt & Colman Capital Finance Limited
Jersey 87 ORD 100.00%
Reckitt & Colman Guangzhou Limited
China 32 ORD 100.00%
Reckitt & Colman Holdings Limited
UK 149 ORD 100.00%
Reckitt & Colman Management Services (Ireland) Limited
Ireland 81 ORD 100.00%
Reckitt & Colman Pension Trustee Limited
UK 149 ORD 100.00%
Reckitt & Colman Sagrotan Verwaltungsgesellschaft GmbH
Germany 64 COMMON 100.00%
Reckitt & Colman Trustee Services Limited
UK 149 ORD 100.00%
Reckitt & Sons Limited UK 149 ORD 100.00%
Reckitt Benckiser (2012) BV
Netherlands 102 ORD 100.00%
Reckitt Benckiser (Australia) Pty Limited
Australia 4 ORD/PREF 100.00%
Reckitt Benckiser (Bangladesh) Limited
Bangladesh 8 ORD 82.96%
Reckitt Benckiser (Belgium) SA/NV
Belgium 10 ORD 100.00%
Reckitt Benckiser (Brands) Limited
UK 149 ORD 100.00%
Reckitt Benckiser (Brasil) Comercial de Produtos de Hygiene, Limpeza e Cosméticos Ltda.
Brazil 15 ORD 100.00%
11 Subsidiary Undertakings continued

216 Reckitt Benckiser Group plc (RB) Annual Report and Financial Statements 2019
N OT ES TO T H E PA R E N T CO M PA N Y F I N A N C I A L S TAT E M E N T S CO N T I N U ED
NameCountry of Incorporation
Registered Office Share Class
Proportion of shares
held
Reckitt Benckiser (Brasil) Ltda
Brazil 13 ORD 100.00%
Reckitt Benckiser (BVI) No. 1 Limited
British Virgin Islands
17 ORD 100.00%
Reckitt Benckiser (BVI) No. 1 Limited†
UK 149 – 100.00%
Reckitt Benckiser (BVI) No. 2 Limited
British Virgin Islands
17 ORD 100.00%
Reckitt Benckiser (BVI) No. 2 Limited†
UK 149 – 100.00%
Reckitt Benckiser (BVI) No. 3 Limited
British Virgin Islands
17 ORD 100.00%
Reckitt Benckiser (BVI) No. 3 Limited†
UK 149 – 100.00%
Reckitt Benckiser (BVI) No. 4 Limited
British Virgin Islands
17 ORD 100.00%
Reckitt Benckiser (Canada) Inc.
Canada 21 NEW COMMON
100.00%
Reckitt Benckiser (Cayman Islands) Limited
Cayman Islands
22 ORD 100.00%
Reckitt Benckiser (Centroamerica) SA
Costa Rica 44 ORD 100.00%
Reckitt Benckiser (Channel Islands) Limited
Guernsey 67 ORD 100.00%
Reckitt Benckiser (Czech Republic), spol. s r.o.
Czech Republic 47 ORD 100.00%
Reckitt Benckiser (Egypt) Limited
Egypt 56 ORD 100.00%
Reckitt Benckiser (ENA) BV
Netherlands 106 ORD 100.00%
Reckitt Benckiser España SL
Spain 134 ORD 100.00%
Reckitt Benckiser (Granollers) SL
Spain 134 ORD 100.00%
Reckitt Benckiser (Grosvenor) Holdings Limited
UK 149 ORD 100.00%
Reckitt Benckiser (Health) Holdings Limited
UK 149 ORD 100.00%
Reckitt Benckiser (Hygiene Home) Holdings Limited
UK 149 ORD 100.00%
Reckitt Benckiser (India) Private Limited
India 75 ORD 100.00%
Reckitt Benckiser (Lanka) Limited
Sri Lanka 137 ORD 99.99%
Reckitt Benckiser (Latvia) SIA
Latvia 93 ORD 100.00%
Reckitt Benckiser (Malaysia) Sdn Bhd
Malaysia 97 ORD 100.00%
Reckitt Benckiser (Near East) Limited
Israel 83 ORD 100.00%
NameCountry of Incorporation
Registered Office Share Class
Proportion of shares
held
Reckitt Benckiser (New Zealand) Limited
New Zealand 108 ORD 100.00%
Reckitt Benckiser (Pars) PJSC
Iran 80 ORD 100.00%
Reckitt Benckiser (Poland) SA
Poland 119 ORD 100.00%
Reckitt Benckiser (Portugal) S.A.
Portugal 120 ORD 100.00%
Reckitt Benckiser (Romania) Srl
Romania 123 ORD 100.00%
Reckitt Benckiser (RUMEA) Limited
UK 149 ORD 100.00%
Reckitt Benckiser (RUMEA) Limited†
Dubai 51 – 100.00%
Reckitt Benckiser (RUMEA) Limited†
Dubai 52 – 100.00%
Reckitt Benckiser (Singapore) Pte Limited
Singapore 129 ORD 100.00%
Reckitt Benckiser (Slovak Republic), spol. s r.o.
Slovakia 130 ORD 100.00%
Reckitt Benckiser (South America) Holding BV
Netherlands 102 ORD 100.00%
Reckitt Benckiser (Spain) BV
Netherlands 102 ORD 100.00%
Reckitt Benckiser (Switzerland) AG
Switzerland 140 ORD 100.00%
Reckitt Benckiser (Thailand) Limited
Thailand 143 ORD 100.00%
Reckitt Benckiser (UK) Limited
UK 149 ORD 100.00%
Reckitt Benckiser (USA) Limited
UK 149 ORD 100.00%
Reckitt Benckiser AG Switzerland 140 ORD 100.00%
Reckitt Benckiser Arabia FZE
Dubai 50 ORD 100.00%
Reckitt Benckiser Argentina SA
Argentina 2 ORD 100.00%
Reckitt Benckiser Asia Pacific Limited
UK 149 ORD 100.00%
Reckitt Benckiser Asia Pacific Limited†
Japan 86 ORD 100.00%
Reckitt Benckiser Austria GmbH
Austria 5 ORD 100.00%
Reckitt Benckiser Bahrain W.L.L
Bahrain 7 ORD 100.00%
Reckitt Benckiser Brands Investments BV
Netherlands 102 ORD 100.00%
Reckitt Benckiser Bulgaria Eood*
Bulgaria 18 ORD 100.00%
Reckitt Benckiser BY LLC Belarus 9 – 100.00%
Reckitt Benckiser Calgon BV
Netherlands 102 ORD 100.00%
11 Subsidiary Undertakings continued

S T R AT E G I C R E P O R T G O V E R N A N C E F I N A N C I A L S TAT E M E N T S
217Reckitt Benckiser Group plc (RB) Annual Report and Financial Statements 2019
NameCountry of Incorporation
Registered Office Share Class
Proportion of shares
held
Reckitt Benckiser Chartres SAS
France 61 ORD 100.00%
Reckitt Benckiser Chile SA Chile 24 ORD 100.00%
Reckitt Benckiser Colombia SA
Colombia 43 ORD 100.00%
Reckitt Benckiser Commercial (Italia) S.r.l.
Italy 85 QUOTA 100.00%
Reckitt Benckiser Corporate Services Limited
UK 149 ORD 100.00%
Reckitt Benckiser d.o.o Croatia 45 – 100.00%
Reckitt Benckiser Detergents GmbH
Germany 64 ORD 100.00%
Reckitt Benckiser Deutschland GmbH
Germany 64 COMMON 100.00%
Reckitt Benckiser East Africa Limited
Kenya 90 ORD 99.00%
Reckitt Benckiser Ecuador SA
Ecuador 55 ORD 100.00%
Reckitt Benckiser Europe General Partnership
UK 149 PARTNERSHIP SHARES
100.00%
Reckitt Benckiser Europe General Partnership, Slough (UK), Wallisellen Branch†
Switzerland 140 – 100.00%
Reckitt Benckiser Ev ve Hjyen Ürünleri A.S.
Turkey 147 – 100.00%
Reckitt Benckiser Expatriate Services Limited
UK 149 ORD 100.00%
Reckitt Benckiser Fabric Treatment BV
Netherlands 102 ORD 100.00%
Reckitt Benckiser Finance (2005) Limited
UK 149 ORD 100.00%
Reckitt Benckiser Finance (2007)
UK 149 ORD 100.00%
Reckitt Benckiser Finance (2010) Limited
UK 149 ORD 100.00%
Reckitt Benckiser Finance (Ireland) Unlimited Company
Ireland 81 ORD 100.00%
Reckitt Benckiser Finance Company Limited
UK 149 ORD 100.00%
Reckitt Benckiser Finish BV
Netherlands 102 ORD 100.00%
Reckitt Benckiser France SAS
France 60 ORD 100.00%
Reckitt Benckiser FSIA BV Netherlands 102 ORD 100.00%
Reckitt Benckiser Global R&D GmbH
Germany 65 COMMON 100.00%
Reckitt Benckiser Health Argentina SA
Argentina 2 ORD 100.00%
NameCountry of Incorporation
Registered Office Share Class
Proportion of shares
held
Reckitt Benckiser Health Comercial Ltda
Brazil 16 ORD 100.00%
Reckitt Benckiser Health Kenya Limited
Kenya 91 ORD 100.00%
Reckitt Benckiser Health Limited
UK 149 ORD 100.00%
Reckitt Benckiser Healthcare (Central & Eastern Europe) Limited
UK 149 ORD 100.00%
Reckitt Benckiser Healthcare (CIS) Limited
UK 149 ORD 100.00%
Reckitt Benckiser Healthcare (Ireland) Limited
Ireland 81 ORD 100.00%
Reckitt Benckiser Healthcare (Italia) S.p.A
Italy 85 ORD 100.00%
Reckitt Benckiser Healthcare (MEMA) Limited
UK 149 ORD 100.00%
Reckitt Benckiser Healthcare (Philippines), Inc.
Philippines 117 COMMON/PREF
100.00%
Reckitt Benckiser Healthcare (Russia) LLC
Russia 124 – 100.00%
Reckitt Benckiser Healthcare (UK) Limited
UK 149 ORD 100.00%
Reckitt Benckiser Healthcare Australia Pty Limited
Australia 4 ORD 100.00%
Reckitt Benckiser Healthcare BV
Netherlands 102 ORD 100.00%
Reckitt Benckiser Healthcare France SAS
France 60 ORD 100.00%
Reckitt Benckiser Healthcare India Private Limited
India 75 ORD 100.00%
Reckitt Benckiser Healthcare International Limited
UK 149 ORD 100.00%
Reckitt Benckiser Healthcare Manufacturing (Thailand) Limited
Thailand 145 ORD/PREF 100.00%
Reckitt Benckiser Healthcare Portugal Ltda
Portugal 120 ORD 100.00%
Reckitt Benckiser Healthcare SA
Spain 134 ORD 100.00%
Reckitt Benckiser Hellas Healthcare S.A.
Greece 66 ORD 100.00%
Reckitt Benckiser Hellas Hygiene Home A.E.
Greece 66 COMMON 100.00%
Reckitt Benckiser Holding (Thailand) Limited
Thailand 143 COMM/PREF 45.00%
Reckitt Benckiser Holding GmbH & Co KG
Germany 64 – 100.00%
11 Subsidiary Undertakings continued

218 Reckitt Benckiser Group plc (RB) Annual Report and Financial Statements 2019
11 Subsidiary Undertakings continued
N OT ES TO T H E PA R E N T CO M PA N Y F I N A N C I A L S TAT E M E N T S CO N T I N U ED
NameCountry of Incorporation
Registered Office Share Class
Proportion of shares
held
Reckitt Benckiser Holdings (Channel Islands) Limited
Guernsey 67 ORD 100.00%
Reckitt Benckiser Holdings (Channel Islands) Limited†
UK 149 – 100.00%
Reckitt Benckiser Holdings (Italia) S.r.l.
Italy 85 QUOTAS 100.00%
Reckitt Benckiser Holdings (Luxembourg) Limited
UK 149 ORD/PREF 100.00%
Reckitt Benckiser Holdings (Overseas) Limited
UK 149 ORD 100.00%
Reckitt Benckiser Holdings (TFFC) Limited
UK 149 ORD 100.00%
Reckitt Benckiser Holdings (USA) Limited
UK 149 ORD 100.00%
Reckitt Benckiser Holdings (USA) Limited†
Luxembourg 94 – 100.00%
Reckitt Benckiser Home Chemical Products Trading (Shanghai) Co. Limited
China 33 ORD 100.00%
Reckitt Benckiser Hong Kong Limited
Hong Kong 68 ORD 100.00%
Reckitt Benckiser Hong Kong Limited†
Taiwan 142 – 100.00%
Reckitt Benckiser Household and Healthcare Ukraine LLC
Ukraine 153 – 100.00%
Reckitt Benckiser Household Products (China) Company Limited
China 34 ORD 100.00%
Reckitt Benckiser Hygiene Home Brands B.V.
Netherlands 102 ORD 100.00%
Reckitt Benckiser Hygiene Home Egypt Limited
Egypt 57 ORD 100.00%
Reckitt Benckiser Hygiene Home Ukraine LLC
Ukraine 153 – 100.00%
Reckitt Benckiser Investments (2012) LLC
USA 122 MEMBERSHIP SHARES
100.00%
Reckitt Benckiser Investments (No. 1) S.à.r.l
Luxembourg 94 ORD 100.00%
Reckitt Benckiser Investments (No. 2) S.à.r.l
Luxembourg 94 ORD 100.00%
Reckitt Benckiser Investments (No. 4) S.à.r.l
Luxembourg 94 ORD 100.00%
Reckitt Benckiser Investments (No. 5) S.à.r.l
Luxembourg 94 ORD 100.00%
Reckitt Benckiser Investments (No. 6) S.à.r.l
Luxembourg 94 ORD 100.00%
Reckitt Benckiser Investments (No. 7) S.à.r.l
Luxembourg 94 ORD 100.00%
NameCountry of Incorporation
Registered Office Share Class
Proportion of shares
held
Reckitt Benckiser Investments (No. 8) S.à.r.l
Luxembourg 94 ORD 100.00%
Reckitt Benckiser Investments Limited
UK 149 ORD 100.00%
Reckitt Benckiser IP LLC Russia 125 – 100.00%
Reckitt Benckiser Ireland Limited
Ireland 81 ORD 100.00%
Reckitt Benckiser Italia S.p.A
Italy 85 ORD 100.00%
Reckitt Benckiser Japan Limited
Japan 86 ORD 100.00%
Reckitt Benckiser Jersey (No.1) Limited
Jersey 87 ORD 100.00%
Reckitt Benckiser Jersey (No.1) Limited†
UK 149 – 100.00%
Reckitt Benckiser Jersey (No.2) Limited
Jersey 87 ORD 100.00%
Reckitt Benckiser Jersey (No.2) Limited†
UK 149 – 100.00%
Reckitt Benckiser Jersey (No.3) Limited
Jersey 87 ORD 100.00%
Reckitt Benckiser Jersey (No.3) Limited†
UK 149 – 100.00%
Reckitt Benckiser Jersey (No.5) Limited
Jersey 87 ORD 100.00%
Reckitt Benckiser Jersey (No.5) Limited†
UK 149 – 100.00%
Reckitt Benckiser Jersey (No.7) Limited
Jersey 87 ORD/A/C/D 100.00%
Reckitt Benckiser Kazakhstan LLC
Kazakhstan 89 – 100.00%
Reckitt Benckiser Kereskedelmi Kft
Hungary 73 ORD 100.00%
Reckitt Benckiser Laundry Detergents (No. 1) BV
Netherlands 102 ORD 100.00%
Reckitt Benckiser Laundry Detergents (No. 2) BV
Netherlands 102 ORD 100.00%
Reckitt Benckiser Lime-A-Way BV
Netherlands 102 ORD 100.00%
Reckitt Benckiser LLC USA 122 MEMBERSHIP SHARES
100.00%
Reckitt Benckiser LLC Russia 126 – 100.00%
Reckitt Benckiser Luxembourg (2010) Limited
UK 149 ORD 100.00%
Reckitt Benckiser Luxembourg (No. 1) Limited
UK 149 ORD 100.00%
Reckitt Benckiser Luxembourg (No. 2) Limited
UK 149 ORD 100.00%

S T R AT E G I C R E P O R T G O V E R N A N C E F I N A N C I A L S TAT E M E N T S
219Reckitt Benckiser Group plc (RB) Annual Report and Financial Statements 2019
11 Subsidiary Undertakings continued
NameCountry of Incorporation
Registered Office Share Class
Proportion of shares
held
Reckitt Benckiser Luxembourg (No. 3) Limited
UK 149 ORD 100.00%
Reckitt Benckiser Luxembourg (No. 4) Limited
UK 149 ORD 100.00%
Reckitt Benckiser Management Services Unlimited Company
Ireland 81 A/B/C/D/E/F/G/H/I/K
100.00%
Reckitt Benckiser Marc BV Netherlands 102 ORD 100.00%
Reckitt Benckiser Mexico, S.A. de C.V.
Mexico 100 ORD 100.00%
Reckitt Benckiser Morocco Sarl AU
Morocco 101 ORD 100.00%
Reckitt Benckiser Nigeria Limited
Nigeria 109 ORD 99.53%
Reckitt Benckiser Nordic A/S
Denmark 48 ORD 100.00%
Reckitt Benckiser NV Netherlands 102 ORD 100.00%
Reckitt Benckiser NV† Luxembourg 94 – 100.00%
Reckitt Benckiser Oven Cleaners BV
Netherlands 102 ORD 100.00%
Reckitt Benckiser Pakistan Limited
Pakistan 112 ORD 98.67%
Reckitt Benckiser Peru SA Peru 115 ORD 100.00%
Reckitt Benckiser Pharmaceuticals (Proprietary) Limited
South Africa 131 ORD 100.00%
Reckitt Benckiser plc˚ UK 149 ORD 100.00%
Reckitt Benckiser Porto Alto Lda
Portugal 121 ORD 100.00%
Reckitt Benckiser Power Cleaners BV
Netherlands 102 ORD 100.00%
Reckitt Benckiser Production (Poland) Sp. z.o.o.
Poland 119 ORD 100.00%
Reckitt Benckiser S.à.r.l Luxembourg 94 A 100.00%
Reckitt Benckiser Scholl India Private Limited
India 76 ORD 100.00%
Reckitt Benckiser Service Bureau Limited
UK 149 ORD 100.00%
Reckitt Benckiser Services (Kenya) Limited
Kenya 92 ORD 100.00%
Reckitt Benckiser Services S.A. de C.V.
Mexico 100 ORD 100.00%
Reckitt Benckiser South Africa Health Holdings (Pty) Limited
South Africa 132 ORD 100.00%
Reckitt Benckiser South Africa Proprietary Limited
South Africa 132 ORD 100.00%
Reckitt Benckiser Taiwan Limited
Taiwan 142 ORD 100.00%
NameCountry of Incorporation
Registered Office Share Class
Proportion of shares
held
Reckitt Benckiser Tatabanya Kft
Hungary 73 ORD 100.00%
Reckitt Benckiser Temizlik Malzemesi San. ve Tic. A.S.
Turkey 148 – 99.96%
Reckitt Benckiser Tiret BV Netherlands 102 ORD 100.00%
Reckitt Benckiser Treasury (2007) Limited
UK 149 ORD/PREF 100.00%
Reckitt Benckiser Treasury Services plc
UK 149 ORD 100.00%
Reckitt Benckiser USA (2010) LLC
USA 122 MEMBERSHIP SHARES
100.00%
Reckitt Benckiser USA (2010) LLC†
UK 149 – 100.00%
Reckitt Benckiser USA (2012) LLC
USA 122 MEMBERSHIP SHARES
100.00%
Reckitt Benckiser USA (2013) LLC
USA 122 MEMBERSHIP SHARES
100.00%
Reckitt Benckiser USA (2013) LLC†
UK 149 – 100.00%
Reckitt Benckiser USA Finance (No.1) Limited
UK 149 ORD 100.00%
Reckitt Benckiser USA Finance (No.2) Limited
UK 149 ORD 100.00%
Reckitt Benckiser USA Finance (No.3) Limited
UK 149 ORD 100.00%
Reckitt Benckiser Vanish BV
Netherlands 102 ORD 100.00%
Reckitt Benckiser Venezuela SA
Venezuela 158 NOMINATIVE 100.00%
Reckitt Colman Chiswick (OTC) Limited
UK 149 ORD 100.00%
Reckitt Piramal Private Limited
India 74 ORD 100.00%
Reigate Square Holdings S.à.r.l
Luxembourg 94 ORD 100.00%
Relcamp Aie* Spain 135 ORD 100.00%
Rivalmuster* UK 149 ORD 100.00%
Scholl (Investments) Limited*
UK 149 ORD 100.00%
Scholl (UK) Limited UK 149 ORD 100.00%
Scholl Consumer Products Limited
UK 149 ORD 100.00%
Scholl Latin America Limited*
Bahamas 6 ORD 100.00%
Scholl Limited UK 149 ORD/PREF 100.00%
Servicios Nutricionales Mead Johnson, S. de R.L. de C.V.
Mexico 98 ORD 100.00%
Seton Healthcare Group No.2 Trustee Limited
UK 149 ORD 100.00%

220 Reckitt Benckiser Group plc (RB) Annual Report and Financial Statements 2019
11 Subsidiary Undertakings continued
N OT ES TO T H E PA R E N T CO M PA N Y F I N A N C I A L S TAT E M E N T S CO N T I N U ED
NameCountry of Incorporation
Registered Office Share Class
Proportion of shares
held
Seton Healthcare No.1 Trustee Limited
UK 149 ORD 100.00%
Sonet Group Limited* UK 149 ORD 100.00%
Sonet Healthcare Limited*
UK 149 ORD 100.00%
Sonet Investments Limited
UK 149 ORD 100.00%
Sonet Prebbles Limited UK 149 ORD 100.00%
Sonet Products Limited UK 149 ORD 100.00%
Sonet Scholl Healthcare International Limited*
UK 149 ORD 100.00%
Sonet Scholl Healthcare Limited*
UK 149 ORD 100.00%
Sonet Scholl Overseas Investments Limited
UK 149 ORD 100.00%
Sonet Scholl UK Limited UK 149 ORD 100.00%
Sphinx Holding Company, Inc.
Philippines 116 COMMON/PREF
38.00%
SSL (C C Manufacturing) Limited*
UK 149 ORD 100.00%
SSL (C C Services) Limited*
UK 149 ORD/PREF 100.00%
SSL (MG) Polymers Limited
UK 149 ORD 100.00%
SSL (MG) Products Limited*
UK 149 ORD 100.00%
SSL (RB) Products Limited UK 149 ORD 100.00%
SSL (SD) International Limited*
UK 149 ORD 100.00%
SSL Australia Pty Ltd Australia 4 ORD 100.00%
SSL Capital Ltd Jersey 88 ORD/PREF 100.00%
SSL Healthcare (Shanghai) Ltd
China 35 ORD 100.00%
SSL Healthcare Ireland Limited
Ireland 81 ORD 100.00%
SSL Healthcare Manufacturing SA
Spain 136 ORD 100.00%
SSL Healthcare Norge AS* Norway 111 ORD 100.00%
SSL Healthcare Sverige AB Sweden 139 ORD 100.00%
SSL Holdings (USA) Inc USA 122 COMMON 100.00%
SSL International plc UK 149 ORD 100.00%
SSL Manufacturing (Thailand) Limited
Thailand 146 ORD 100.00%
SSL New Zealand Limited New Zealand 108 ORD 100.00%
SSL Products Limited UK 149 ORD 100.00%
Suffolk Finance Company Limited
UK 149 ORD/DEF 100.00%
Suffolk Insurance Limited Bermuda 11 COMMON 100.00%
NameCountry of Incorporation
Registered Office Share Class
Proportion of shares
held
Tai He Tai Lai Culture Communication Co Ltd
China 36 ORD 100.00%
The Representative Office of Reckitt Benckiser (Thailand) Ltd in Ho Chi Minh City†
Vietnam 143 ORD 100.00%
Tubifoam Limited UK 149 ORD 100.00%
Ultra Chemical Limited* UK 149 ORD 100.00%
Ultra Laboratories Limited*
UK 149 ORD 100.00%
UpSpring LLC USA 155 ORD 100.00%
W.Woodward,Limited UK 149 ORD 100.00%
Winchester Square Holdings S.à.r.l
Luxembourg 94 ORD 100.00%
Xinzhou ZhongHeng Pharmaceutical Co., Ltd
China 37 ORD 100.00%
* This entity is in liquidation Interest held directly by Reckitt Benckiser Group plc† This is a registered branch
Registered Office
1 Teniente General Richieri 15, Ciudad de Sunchales. Santa Fe, Argentina
2 Bucarelli 2608 PB A, CABA, Buenos Aires, Argentina
3 King & Wood Mallesons Governor Phillip Tower Level 61 1, Farrer Place Sydney NSW 2000, Australia
4 Level 47, 680 George Street, Sydney, NSW, 2000, Australia
5 Guglgasse 15, A-1110 Wien (Vienna), Austria
6 c/o 103-105 Bath Road, Slough, SL1 3UH, United Kingdom
7 Building 330, Road 1506, Block 115. Bahrain International Investment Park, Hidd. Kingdom of Bahrain
8 58/59 Nasirabad Industrial Area, Chittagong- 4209, Bangladesh
9 220108, Minsk, Kazintsa, 121A, app.403, Belarus
10 20 Allée de la Recherche, 1070 Anderlecht, Belgium
11 Clarendon House, 2 Church Street, Hamilton, HM DX, Bermuda
12 Estrada Fukutaro Yida, n. 930, Bairro Cooperativa, in the city of Sao Bernardo Do Campo, Estate of Sao Paulo, 09852-060, Brazil
13 Rodovia Raposo Tavares, 8015, km 18, Jardim Arpoador, CEP 05577-900, São Paulo, Brazil
14 Presidente Juscelino Kubitschek Avenue, n. 1909, 24th floor, Part B, North Tower, Condomínio São Paulo Corporate Centers, 04543-907, São Paulo, Brazil
15 Av. Presidente Juscelino Kubitshek,1909, cj 241 and 251, Ed. São Paulo Corporate Center/North Tower, São Paulo – Brasil. 04543-903
16 Av. Presidente Juscelino Kubitschek, nº 1.909, Conjunto 241, Parte C, localizado no 24º andar da Torre Norte do Condomínio São Paulo Corporate Centers, Bairro Vila Nova Conceição, São Paulo , CEP 04543-907, Brazil
17 Palm Grove House, PO Box 438, Road Town, Tortola, VG1110, British Virgin Islands
18 Sofia City – 1407, Lozenets region, 22, Zlaten rog Str., 3rd floor, Office 4, Bulgaria
19 1959 Upper Water Street, Suite 900, Halifax, Nova Scotia, B3J 3N2, Canada

S T R AT E G I C R E P O R T G O V E R N A N C E F I N A N C I A L S TAT E M E N T S
221Reckitt Benckiser Group plc (RB) Annual Report and Financial Statements 2019
20 Suite 2300, Bentall 5, 550 Burrard Street, Vancouver, BC, V6C 2B5, Canada
21 1680 Tech Avenue Unit 2, Mississauga, Ontario L4W 5S9, Canada
22 PO Box 309, Ugland House, South Church Street, George Town, Grand Cayman, KY1-1104, Cayman Islands
23 Presidente Kennedy n° 5454 depto 1602. Comuna: Vitacura. Ciudad: Santiago de Chile, Chile
24 Av. Pdte. Kennedy Lateral 5454 of 1602, Vitacura, Región Metropolitana, Santiago de Chile, Chile
25 Dangtu Economic Development Zone, Maanshan City, Anhui Province, China
26 Unit 02, 11/F, Tower A, Hedonic Center, 6 , Songyue Road, Siming District, Xiamen, China
27 Room 01, Floor 2, No.2, Xiayuan Road, Dongji Industry Zone of Economic and Technology District, Guangzhou, Guangdong, China
28 No. 1-13 Shangma Part Aodong Road, High-tech Industrial Development Zone, Qingdao, China
29 16/F, Xu Jia Hui International Plaza, No.1033 Zhao Jia Bang Road, Shanghai, China
30 Unit B01, Room 401, Tower 2, Parkview Green Fang Cao Di, No.9 Dongdaqiao Road, Chaoyang District, Beijing, China
31 Room 1101, No. 1033, Zhao Jia Bang Road, Shanghai, China
32 No. 3, Canglian 1 road, ETDZ, Guangzhou, China
33 C6-8 area, 6 floor, No 333, Futexiyi Road, Free trade zone, Waigaoqiao, Shanghai, China
34 No.34 Beijing East Road, Jingzhou City, Hubei Province, China
35 Room 1605, No.660 Shangcheng Road, Pudong District, Shanghai City, China
36 Unit B06, Room 401, Tower 2, Parkview Green Fang Cao Di, No.9 Dongdaqiao Road, Chaoyang District, Beijing, China
37 Fenyuan Road, Xinzhou Economic and Technology Development Zone, Shanxi, China
38 2# Xia Yuan Road, Dongji Industrial District, Guangzhou Economic & Technological Development Zone, Guangzhou, 510730, China
39 Room 02, Floor 2, No.2, Xiayuan Road, Dongji Industry Zone of Economic and Technology District, Guangzhou, Guangdong, China
40 5th Floor, Building 1, Taicang Biological Port, No. 52 Yingang Road, Taicang Port Economic and Technological Development Zone, China
41 Calle 76 No. 11-17 Piso 3, Edificio Torre Los Nogales, Bogota, Colombia
42 Calle 76 No.11 – 17 Oficina 301 Bogotá, Colombia
43 Calle 46 # 5 – 76. Cali, Colombia
44 San José, Escazú Corporate Center, 7 Piso, Costado Sur de Multiplaza Escazú, San José, Costa Rica
45 Ulica Grada Vukovara 269d, 10 000 Zagreb, Hrvatska, Croatia
46 1 Lampousas Street, P.C. 1095, Nicosia, Cyprus
47 Vinohradská 2828/151, 130 00 Praha 3-Žižkov, Czech Republic
48 Vandtarnsvej 83A 2860 Soborg, Denmark
49 Av. Winston Churchill No.1099, Tower Acropolis, Floor 12, City of Santo Domingo, Dominican Republic
50 Behind GAC Complex, Jebel Ali Free Zone, PO Box 61344 Dubai, UAE
51 Office No. 1801 – 1803 – 1804 EMAAR Properrties – Burj Khalifa, P.O. Box: 119481, UAE
52 PO Box 119841, Jebel Ali Freezone, Dubai, UAE
53 P.O. Box 16834 Jebel Ali Free Zone Dubai, UAE
54 Av. Coruña N27 – 88 y Orellana. Quito – Ecuador
55 Av. 12 de Octubre N26-48 y Orellana. Edificio Mirage, Piso 4, Oficina 4C. (Quito-Ecuador) Código postal 170525, Ecuador
56 Polyium Building 22, Off-road 90, District 1, 5th Settlement, New Cairo, Egypt
57 Building A1, Second Floor, Plot #A14b01, Cairo Festival City, First District, Fifth Settlement, New Cairo, Egypt
58 Itsehallintokuja 6 02600 Espoo, Finland
59 Självstyrelsevägen 6 02600 Esbo, Finland
60 38 RUE Victor Basch, 91300 Massy, France
61 102 RUE de Sours 28000 Chartres, France
62 Heinestrasse 9, 69469 Weinheim, Germany
63 Robert-Koch-Str. 1, 69115 Heidelberg, Germany
64 Darwinstrasse 2-4, 69115 Heidelberg, Germany
65 Dr. Albert-Reimann-Strasse 3, 68526 Ladenburg, Germany
66 7 Taki Kavalieratou Street, 145 64 Kifissia, Greece
67 1st and 2nd Floors, Elizabeth House, Les Ruettes Brayes, St Peter Port, GY1 1EW, Guernsey
68 2206-11, Windsor House, 311 Gloucester Road, Causeway Bay, Hong Kong
69 25/F Chubb Tower, Windsor House, 311 Gloucester Road, Causeway Bay, Hong Kong
70 Alamdea Dr. Carlos D'assumpcao No.258,6 Andar, F6, Edif.Kin Heng Long Plaza, Macau, MO, Macau
71 9/F Three Exchange Square 8, Connaught Place Central, Hong Kong
72 Unit 2001, 20/F, Greenfield Tower, Concordia Plaza, No. 1 Science Museum Road, Kowloon, Hong Kong
73 134-146 ut Bocksai, 1113 Budapest, Hungary
74 Unit No. 54, 5th Floor, Kalpataru Square, Andheri-Kurla Road, Andheri (East), Mumbai – 400059, Maharashtra, India
75 Plot. No. 48, Sector 32, Institutional Area, Gurgaon-122001, Tamilnadu, India
76 Plot no. F73 & 74, Sipcot Industrial Park, Irungattukottai, Sriperumbudur Taluk, Kancheepuram District-602117, Tamilnadu, India
77 Treasury Tower – District 8 Level 59, Scbd Lot 28, Jl. Jend Sudirman Kav 52-53, Kel. Senayan, Kec., Kebayoran Baru, Kota Adm. Jakarta Selatan, Prop. Dki Jakarta, Indonesia
78 District 8 Level 58th floor. SCBD Lot 28, Jl. Jend. Sudirman kav 52-54, Jakarta 12190, Indonesia
79 Jalan Raya Narogong Km. 15, Desa Limusnunggal Pangkalan VII, Kec Cileungsi , Bogor, Indonesia
80 No. 67, West Taban Avenue, Africa Boulevard, Tehran, Iran
81 3rd Floor Kilmore House, Park Lane, Spencer Dock, Dublin 1, Ireland
82 6th Floor, 2 Grand Canal Square, Dublin 2, Ireland
83 6 Hanagar, Hod Hasharon, Israel
84 Via Birmania, 81-00144, Roma, Italy
85 Via Spadolini, 7, 20141 Milano, Italy
86 3-20-14 Higashi Gotanda, Shinagawa-ku, 141-0022, Tokyo
87 ICF 5, St. Helier, JE1 1ST, Jersey
88 44 Esplanade, St Helier, JE4 9WG, Jersey
89 Office 302, Building 15a, Koktem-1, Micro District, Almaty city, Kazakhstan
90 Plot Lr No 209/2462, Likoni Road, Nairobi, Kenya
91 14 Riverside, L.R Number 209/19436, Riverside Drive, Nairobi, Kenya
92 LR.NO.1870/1/569, 2nd Floor, Apollo Centre, Ring Road, Westlands, Kenya
11 Subsidiary Undertakings continued

222 Reckitt Benckiser Group plc (RB) Annual Report and Financial Statements 2019
N OT ES TO T H E PA R E N T CO M PA N Y F I N A N C I A L S TAT E M E N T S CO N T I N U ED
93 Rıga, Strelnieku iela 1A – 2, LV-1010, Latvia
94 1 Rue de la Poudrerie, L – 3364 Leudelange, Luxembourg
95 Suite 1005, 10th Floor, Wisma Hamzag Kwong Hing, No. 1 Leboh Ampang, 50100 Kuala Lumpur, W.P. Kuala Lumpur, Malaysia
96 Unit No. 50-8-1, 8th Floor, Wisma Uoa Damansara, 50 Jalan Dungun, Damansara Heights, 50490 Kuala Lumpur, Malaysia
97 Level 7, Menara Milenium, Jalan Damanlela, Pusat Bandar Damansara, Damansara Heights, 50490 Kuala Lumpur, Malaysia
98 Av. Ejército Nacional No. 769, Corporativo Miyana Torre B, Piso 6, Alcaldía Miguel Hidalgo, Colonia Granada, CP 11520, Mexico
99 Calzada de Tlalpan No. 2996, Col. Ex Hacienda Coapa, Del. Coyoacán, Cd. de México, C.P. 04980, Mexico
100 Circuito Dr Gustavo Baz,7 No 7, Fracc Industrial El Pedregal, Atizapan de Zaragoza, Edomex, Mexico
101 322 Boulevard, Zerktouni, Residence Boissy Ler Etage – Bourgogne, Casablanca, Morocco
102 Siriusdreef 14, 2132 WT Hoofddorp, The Netherlands
103 Middenkampweg 2, 6545 CJ Nijmegen, The Netherlands
104 225 North Canal Street, Floor 25, Chicago, IL 60606, USA
105 Zuidplein 142, Tower H, 17th Floor, 1077 XV Amsterdam, The Netherlands
106 Schiphol Boulevard 267, 1118 BH Schiphol, The Netherlands
107 Level 1, 2 Fred Thomas Drive Takapuna, Auckland, 0622, New Zealand
108 2 Fred Thomas Drive, Takapuna, Auckland 0622, New Zealand
109 12 Montgomery Road, Yaba, Lagos, Nigeria
110 Henrik Ibsens Gate 60A,0255 Oslo, Norway
111 Vollsveien 9, 1366 Lysaker, Norway
112 3rd Floor, Tenancy 04 and 05, Corporate Office Block, Dolman City, HC-3, Block 4, Scheme 5, Clifton, Karachi, Pakistan
113 Regus, Torres de la Américas, Torres de las Américas, Torre A, Piso 15. Oficina 1539., Punta Pacifica, Ciudad de Panamá, PA , Panama
114 Calle Dean Valdivia 148 Piso 5, San Isidro Lima 27, Peru
115 Avenida República de Panamá No. 2557 Int. 202, La Victoria. Lima, Peru
116 2309 Don Chino Roces Avenue Extension, Makati City, Philippines
117 3rd Floor Mead Johnson Nutrition Inc, 2309 Don Chino Roces Extension, Makati City, Philippines
118 Ul. Wołoska 22, 02-675 Warsaw, Poland
119 05-100 Nowy Dwór Mazowiecki, Ul. Okunin 1, Poland
120 R. Dom Cristóvão da Gama 1 – 1º Andar C/D, Edifício Restelo, 1400-113 Lisboa, Portugal
121 Estrada Malhada dos Carrascos nr12, 2135-061, Samora Correia, Portugal
122 Corporation Service Company, 251 Little Falls Drive, Wilmington, DE 19808, New Castle County, USA
123 89-97 Grigore Alexandrescu Street, Building A, 5th floor, Finish room, Sector 1, Bucharest, Romania
124 4, Shluzovaya emb., 3rd Floor, Moscow, 115114 Russia
125 Kozhevnicheskaya street, 14, Moscow, 115114, Russia
126 Moscow, Kosmodamianskaya Nab d.52/1, Russia
127 80 Robinson Road, #02-00, 068898, Singapore
128 1 Fifth Avenue, #04-06 Guthrie House, 268802, Singapore
129 12 Marina Boulevard, #19-01 Marina Bay Financial Centre, 018982, Singapore
130 Drienová 3, 821 08 Bratislava, Slovakia
131 8 Jet Park Road, Elandsfontein, Gauteng, 1406, South Africa
132 8 Jet Park Road, Elandsfontein, Gauteng, 1601, South Africa
133 24th Floor Two IFC, 10 Gukjegeumyung-ro, Youngdeungpo-gu, Seoul, 150-945, South Korea
134 Carrer de Mataró, 28, 08403 Granollers, Barcelona, Spain
135 Carrer de Fray Pau Carbó, 24, 08403, Granollers, Barcelona, Spain
136 Av. Can Fatjó, 151, 08191 Rubí, Barcelona, Spain
137 41 and 41/1, Lauries Raoad, Colombo 4, Sri Lanka
138 Vretenvägen 2, 4th Floor, 171 54 Solna, Sweden
139 Box 190, 101 23 Stockholm, Sweden
140 Richtistrasse 5, 8304 Wallisellen, Switzerland
141 5F., No.156, Jiankang Rd., Songshan Dist. Taipei, 105, Taiwan
142 6F., No. 136, Sec. 3, Ren’ai Rd., Da’an Dist., Taipei City 10657, Taiwan, R.O.C.
143 388 Exchange Tower, 14th Fl.,Sukhumvit Rd., Klongtoey, Bangkok, 10110, Thailand
144 No. 388, Room No. 1903, 19th Floor, Exchange Tower, Sukhumvit Road, Sub-District Klongtoey, District Klongtoey Bangkok 10110, Thailand
145 65 Moo 12 Lardkrabang-Bangplee Road, Bangplee Samutprakarn, Bangkok 10540, Thailand
146 100 Moo 5 Bangsamak, Bangpakong, Chachoengsao, Thailand
147 Orta Mahallesi Demokrasi Caddesi Benckiser Sitesi No:92 Tuzla/Istanbul, Turkey
148 Dikilitas Mah. Hakkı Yeten Cad. Selenium Plaza 10 C Fulya, Istanbul, Turkey
149 103-105 Bath Road, Slough, SL1 3UH, United Kingdom
150 4th Floor, 115, George Street, Edinburgh, EH2 4JN, Scotland
151 Northcliffe House, Young Street, London, W8 5EH, United Kingdom
152 Prospect 40-Richchia Zhovtnia., 120, 1 Block, Kiev, 03127, Ukraine
153 28A Moskovskiy Prospect, Bld.G, Office 80. 04073, Kiev, Ukraine
154 399 Interpace Parkway, Parsippany, NJ 07054, USA
155 4209 S. Industrial Drive, Suite 200, Austin, Texas, 78744, USA
156 Illinois Corporation Service Company, 801 Adlai Stevenson Drive, Springfield IL 62703, Sangamon County, USA
157 Urb. Las Mercedes, Av. Orinoco cruce con Mucuchies Torre Nordic, Piso 1, Oficina 1 y 2, Municipio Baruta Caracas, Venezuela
158 Av Intersección Avenidas Orinoco Con Mucuchies Edif Torre Nordic Piso 1 of 1 y 2 Urb Las Mercedes, Caracas, Miranda Zona, 1061, Venezuela
159 Unit 401, 4th Floor, Metropolitan Building, No. 235 Dong Khoi Street, Ben Nghe Ward, District 1, Ho Chi Minh City, Vietnam
11 Subsidiary Undertakings continued
S T R AT E G I C R E P O R T G O V E R N A N C E F I N A N C I A L S TAT E M E N T S
223Reckitt Benckiser Group plc (RB) Annual Report and Financial Statements 2019
Annual General MeetingOur AGM will he held on Tuesday 12 May 2020 at 3.00pm at 103-105 Bath Road, Slough, Berkshire, SL1 3UH.
The Notice convening the meeting, together with the business to be considered at the meeting is contained in a separate document for Shareholders and is available on our website at www.rb.com.
2020 Financial Calendar and Key Dates
Announcement of Quarter 1 interim management statement 30 April 2020
Annual General Meeting 12 May 2020
Record date for 2019 final dividend 17 April 2020
Payment of 2019 final ordinary dividend 28 May 2020
Announcement of 2020 interim results 28 July 20201
Record date for 2020 interim dividend 21 August 20201
Payment of 2020 interim ordinary dividend 29 September 20201
Announcement of Quarter 3 interim management statement 20 October 20201
1 Provisional dates.
DividendThe Directors have recommended a final dividend of 101.6 pence per share, for the year ended 31 December 2019. Subject to Shareholder approval at the 2020 AGM, payment of the final dividend will be made on 28 May 2020 to all Shareholders on the register as at 17 April 2020. The latest date for receipt of new applications to participate in the Dividend Reinvestment Plan (DRIP) in respect of the 2019 final dividend is 5 May 2020. Details on how to join the DRIP are found on page 223 of this report.
Mandatory Direct CreditIn September 2018 we changed the way we pay dividends to Shareholders and no longer pay dividends by cheque. This is known as ‘mandatory direct credit’. The reasons and benefits for introducing this change are:
• Shareholders receive dividend funds quicker;
• we reduce our environmental impact;
• we reduce the risk of cheque fraud; and
• we reduce the administration costs if issuing or banking cheques.
To have your dividends paid directly into your bank account, please logon to the Computershare Investor Centre at www.investorcentre.co.uk, or by telephone on +44 (0)370 703 0118. We will hold your dividends for you until you provide valid bank details and charges may be applied to reissue any dividend payments.
If you are based overseas, you may choose to have your dividends paid to your account in your local currency by using Computershare’s Global Payment Service (GPS). To view the terms and register to the GPS, please visit www.computershare.com/uk/investor/GPS. If you wish to reinvest your dividend to buy more shares, please join our DRIP.
S H A R E H O L D E R I N F O R M AT I O N
Dividend Reinvestment Plan (DRIP)Shareholders participating in the DRIP receive additional shares purchased in the market instead of receiving a cash dividend. You can elect to join the DRIP by registering at the Computershare Investor Centre at www.investorcentre.co.uk. Alternatively, you can request a DRIP mandate form and terms and conditions by contacting Computershare.
Electronic Shareholder CommunicationsWe encourage all Shareholders to receive an email notification when Shareholder documents become available online, to reduce our impact on the environment. An election to receive Shareholder communications in this way will:
• result in annual cost savings to the Company since less paper documentation will need to be produced and posted;
• allow for quicker and more effective communications with Shareholders; and
• support RB’s corporate responsibility profile.
Shareholders can register their email address at www.investorcentre.co.uk/etreeuk/reckittbenckiser. For each new Shareholder that does so, we will donate £1 to the Tree for All campaign run by the Woodland Trust.
Shareholders who have positively elected for electronic communications will receive an email whenever Shareholder documents are available to view on the Company’s website. Shareholders who have elected by deemed consent in accordance with the Companies Act 2006 will receive a hard copy notice of availability of a document on the Company’s website and are entitled to request a hard copy of any such document, at any time, free of charge from Computershare. Shareholders can revoke their consent at any time by contacting Computershare.
The Company’s 2019 Annual Report and Notice of the 2020 AGM are available to view at www.rb.com. The Investor section of the website also contains up-to-date information for Shareholders to view throughout the year, including:
• detailed share price information;
• financial results;
• regulatory announcements;
• dividend payment dates and amounts;
• access to Shareholder documents including the Annual Report and Notice of AGM; and
• share capital information.
Share Dealing FacilityThe Company’s shares can be traded through most banks, building societies, stockbrokers or ‘share shops’. In addition, UK-based Shareholders can buy or sell RB shares using a share dealing facility operated by the Registrar, these include internet and telephone share dealing.

224 Reckitt Benckiser Group plc (RB) Annual Report and Financial Statements 2019
S H A R E H O L D E R I N F O R M AT I O N CO N T I N U ED
Internet Share Dealing This service offers Shareholders a straightforward way to buy or sell RB’s shares on the London Stock Exchange. The commission is 1%, subject to a minimum charge of £30. In addition, stamp duty, currently 0.5%, is payable on purchases. There is no need to open an account in order to deal. Real-time dealing is available during UK market hours 08:00 to 16:30. In addition, there is a facility to place your order outside of market hours. Up to 90-day limit orders are available for sales.
To access the service, log on to www.computershare.trade/. Shareholders must have their Shareholder Reference Number (SRN) available. The SRN appears on share certificates. Internet share dealing is currently limited to certain jurisdictions: a full list of countries can be found on the Computershare website at www.computershare.trade/cert_faqs.html scroll down to the section ‘Using the service’ and then ‘Am I eligible to register for the service?’.
Telephone Share DealingTelephone share dealing is available to Shareholders residing in the UK and Ireland. The service is available Monday to Friday, excluding bank holidays, from 08.00 to 16.30 by contacting Computershare on +44 (0)370 703 0084. The commission is 1%, subject to a £50 cap. In addition, 0.5% stamp duty is payable on purchases; a full list of fees can be found online at www.computershare.trade/costs.html. To access the service, Shareholders must have their SRN to refer to during the call. Shareholders should also have a debit card to make purchases over the telephone.
Telephone share dealing is offered on an execution-only basis and no recommendation can be made with respect to buying, selling or holding shares in RB. Shareholders who are unsure of what action to take should obtain independent financial advice. It is also important to note that share values may go down as well as up, which may result in a Shareholder receiving less/more than he/she originally invested.
Detailed terms and conditions for both internet and telephone dealing are available upon request by calling +44 (0)370 702 0000.
Analysis of Shareholders as at 31 December 2019
Distribution of shares by type of Shareholder No. of holdings Shares
Nominees and institutional investors 5,504 726,213,040Individuals 11,552 10,322,139
Total 17,056 736,535,179
Size of shareholding No. of holdings Shares
1 – 500 10,350 1,943,278501 – 1,000 2,540 1,847,7941,001 – 5,000 2,531 5,222,2375,001 – 10,000 357 2,503,08210,001 – 50,000 611 14,577,02250,001 – 100,000 190 13,270,263100,001 – 1,000,000 372 118,740,1941,000,001 and above 105 578,431,309
Total 17,056 736,535,179
American Depositary ReceiptsAmerican Depositary Receipts (ADRs) are dollar-denominated securities that represent the ownership of ordinary shares in a non-US company, quoted and traded in US dollars in the US securities market. An ADRs allow the purchase, holding and sale of non-US shares by US investors. Dividends are paid to investors in US dollars.
Reckitt Benckiser Group plc ADRs are traded on the over-the-counter market (OTC) under the symbol RBGLY. Five ADRs represent one ordinary RB share. J.P. Morgan Chase Bank N.A. is the Depositary. The table below provides details of the identification of RB securities on the US market place and the London Stock Exchange.
Symbol Security Listing/Trading CUSIP/ISIN
RBGLY U.S. security (ADR) OTC Pink 756255204
RB. Ordinary share London Stock Exchange
GB00B24CGK77
ADR Depositary Bank J.P. Morgan Chase sponsors and administers the RB ADR facility. J.P. Morgan ADR shareholder services can be contacted as follows:
J.P. Morgan Chase Bank N.A.PO Box 64504, St. Paul, MN 55164-0504, USOnline via: www.shareowneronline.comTelephone number for general queries: Tel: (800) 990 1135Telephone number from outside the US: Tel: +1 651 453 2128
Company SecretaryRupert Bondy
Registered Office103-105 Bath Road, SloughBerkshire SL1 3UHTelephone: +44 (0) 1753 217800Registered and domiciled in England and Wales No. 6270876
Company StatusPublic Limited Company
AuditorKPMG LLP
SolicitorsSlaughter and May/Linklaters LLP
Registrar and Transfer OfficeThe Company’s Registrar, Computershare, is responsible for maintaining and updating the Shareholder register and making dividend payments to Shareholders. If you have any queries relating to your shareholding please write to, or telephone, the Company’s Registrar at the following address:
Computershare Investor Services PLCThe Pavilions, Bridgwater Road, Bristol BS99 6ZZReckitt Benckiser Shareholder helpline:Tel. +44 (0)370 703 0118Website: www.computershare.com/uk

S T R AT E G I C R E P O R T G O V E R N A N C E F I N A N C I A L S TAT E M E N T S
225Reckitt Benckiser Group plc (RB) Annual Report and Financial Statements 2019
Charity DonationShareGift is a UK registered charity (No.1052686) which specialises in realising the value locked up in small shareholdings for charitable purposes. The resulting proceeds are donated to a wide range of charities, reflecting suggestions received from donors. If you have only a small number of RB shares which are uneconomic to continue holding, you may wish to consider donating them to ShareGift. Please visit www.sharegift.org/donate-shares/ or telephone +44 (0)20 7930 3737 for more information about how to proceed. Further details about ShareGift can be found at www.sharegift.org.
Unsolicited MailWe are legally obliged to make our register of Shareholders available to the public, subject to a proper purpose test. As a result, some Shareholders might receive unsolicited mail. Shareholders wishing to limit the amount of such mail should write to the Mailing Preference Service, MPS FREEPOST 29 LON20771, London W1E 0ZT or register online at www.mpsonline.org.uk.
Share Fraud And ‘Boiler Room’ ScamsShare fraud is a deceptive practice that induces investors to make sales and purchases based on inaccurate information and in violation of security laws. In Boiler Room scams, fraudsters will entice investors into scams through increased persuasion and high-pressure tactics through cold calling or random contact.
RB is aware of these deceptions and urges Shareholders who are offered unsolicited investment advice, discounted shares, a premium price for shares, or free company or research reports to investigate thoroughly before making any decision.
If you receive any form of unsolicited investment advice, please take the following steps:
• confirm the name of the person and/or organisation;
• check the Financial Conduct Authority’s (FCA) Financial Services Register at https://register.fca.org.uk/ to ensure they are authorised;
• use the details on the Financial Services Register to contact the firm;
• call the FCA Consumer Helpline on +44 (0)800 111 6768 (freephone) or 0300 500 8082 (from the UK), if there are no contact details on the Register or if they are out of date;
• search the FCA’s list of unauthorised firms and individuals at www.fca.org.uk/consumers/unauthorised-firms-individuals to avoid doing business with reported offenders;
• if you are approached by fraudsters please contact the FCA using their helpline, or share fraud reporting form; and
• consider getting independent financial advice.
Using an unauthorised firm to buy or sell shares or other investments will prohibit access to the Financial Ombudsman Service or Financial Services Compensation Scheme (FSCS) should the investment be unsuccessful. Remember: if it sounds too good to be true, it probably is. If you think you have been a victim of these scams, the matter should be reported to the Police and to Action Fraud. For more information, please visit the Serious Fraud Office website at www.sfo.gov.uk/contact-us/reporting-serious-fraud-bribery-corruption/.
Cautionary Note Concerning Forward-looking StatementsThis Annual Report and Financial Statements contains statements with respect to the financial condition, results of operations and business of RB (the ‘Group’) and certain of the plans and objectives of the Group that are forward-looking statements. Words such as ‘intends’, ‘targets’, or the negative of these terms and other similar expressions of future performance or results, and their negatives, are intended to identify such forward-looking statements. In particular, all statements that express forecasts, expectations and projections with respect to future matters, including targets for Net Revenue, operating margin and cost efficiency, are forward-looking statements. Such statements are not historical facts, nor are they guarantees of future performance.
By their nature, forward-looking statements involve risk and uncertainty because they relate to events and depend on circumstances that will occur in the future. There are a number of factors that could cause actual results and developments to differ materially from those expressed or implied by these forward-looking statements, including many factors outside the Group’s control. Among other risks and uncertainties, the material or principal factors which could cause actual results to differ materially are: the general economic, business, political and social conditions in the key markets in which the Group operates; the ability of the Group to manage regulatory, tax and legal matters, including changes thereto; the reliability of the Group’s technological infrastructure or that of third parties on which the Group relies; interruptions in the Group’s supply chain and disruptions to its production facilities; the reputation of the Group’s global brands; and the recruitment and retention of key management.
These forward-looking statements speak only as of the date of this Annual Report and Financial Statements. Except as required by any applicable law or regulation, RB expressly disclaims any obligation or undertaking to release publicly any updates or revisions to any forward-looking statements contained herein to reflect any change in the Group’s expectations with regard thereto or any change in events, conditions or circumstances on which any such statement is based.
Any information contained in the 2019 Annual Report and Financial Statements on the price at which shares or other securities in Reckitt Benckiser Group plc have been bought or sold in the past, or on the yield on such shares or other securities, should not be relied upon as a guide to future performance.