financial statements - royal bank of scotland group€¦ · · 2016-02-26independent auditor’s...
TRANSCRIPT
252
Financial statements
Independent auditor’s report 253
Consolidated income statement 260
Consolidated statement of comprehensive income 261
Consolidated balance sheet 262
Consolidated statement of changes in equity 263
Consolidated cash flow statement 266
Accounting policies 267
Notes on the consolidated accounts
1 Net interest income 281
2 Non-interest income 281
3 Operating expenses 282
4 Pensions 286
5 Auditor’s remuneration 291
6 Tax 292
7 Earnings per ordinary share 293
8 Financial instruments - classification 294
9 Financial instruments - valuation 297
10 Financial instruments - maturity analysis 307
11 Financial assets - impairments 309
12 Derivatives 310
13 Debt securities 312
14 Equity shares 313
15 Intangible assets 314
16 Property, plant and equipment 315
17 Prepayments, accrued income and other assets 316
18 Discontinued operations and assets and liabilities of disposal groups 317
19 Short positions 318
20 Provisions, accruals and other liabilities 319
21 Deferred tax 321
22 Subordinated liabilities 323
23 Non-controlling interests 325
24 Share capital 325
25 Other equity 328
26 Leases 329
27 Structured entities 330
28 Asset transfers 331
29 Capital resources 332
30 Memorandum items 333
31 Net cash flow from operating activities 347
32 Analysis of the net investment in business interests and intangible assets 347
33 Interest received and paid 348
34 Analysis of changes in financing during the year 348
35 Analysis of cash and cash equivalents 348
36 Segmental analysis 349
37 Directors’ and key management remuneration 354
38 Transactions with directors and key management 354
39 Related parties 355
40 Post balance sheet events 355
Parent company financial statements and notes 356
Independent auditor’s report to the members of The Royal Bank of Scotland Group plc
253
Opinion on financial statements of The Royal Bank of Scotland Group plc
In our opinion:
• the financial statements give a true and fair view of the state of the Group’s and of the parent company’s affairs as at 31 December
2015 and of the Group’s loss for the year then ended;
• the consolidated financial statements have been properly prepared in accordance with International Financial Reporting Standards
(IFRSs) as adopted by the European Union;
• the parent company financial statements have been properly prepared in accordance with IFRSs as adopted by the European
Union and as applied in accordance with the provisions of the Companies Act 2006; and
• the financial statements have been prepared in accordance with the requirements of the Companies Act 2006 and, as regards the
Group financial statements, Article 4 of the IAS Regulation.
What we have audited
The financial statements comprise the consolidated income statement, the consolidated and parent company balance sheets as at 31
December 2015, the consolidated statement of comprehensive income, the consolidated and company statements of changes in equity,
the consolidated and parent company cash flow statements, the accounting policies and the related Notes 1 to 40 on the consolidated
financial statements, the related Notes 1 to 15 on the parent company financial statements and the information identified as “audited” in
the Capital and risk management section of the Business review. The financial reporting framework that has been applied in their
preparation is applicable law and IFRSs as adopted by the European Union and, as regards the parent company financial statements,
as applied in accordance with the provisions of the Companies Act 2006.
Separate opinion in relation to IFRSs as issued by the IASB
As explained in the accounting policies, in addition to complying with its legal obligation to apply IFRSs as adopted by the European
Union, the Group has applied IFRSs as issued by the International Accounting Standards Board (IASB).
In our opinion the Group financial statements comply with IFRSs as issued by the IASB.
Going concern and the directors’ assessment of the principal risks that would threaten the solvency or liquidity of the Group
As required by the UK Listing Rules we have reviewed the directors’ statement regarding the appropriateness of the going concern
basis of accounting on page 89 and the directors’ statement on the longer-term viability of the Group contained within the Strategic
Report on page 32.
We have nothing material to add or draw attention to in relation to:
• the directors’ confirmation on page 32 that they have carried out a robust assessment of the principal risks facing the Group,
including those that would threaten its business model, future performance, solvency or liquidity;
• the disclosures on pages 30 to 31 that describe those risks and explain how they are being managed or mitigated;
• the directors’ statement on page 89 about whether they considered it appropriate to adopt the going concern basis of accounting in
preparing them and their identification of any material uncertainties to the Group’s ability to continue to do so over a period of at
least twelve months from the date of approval of the financial statements;
• the directors’ explanation on page 32 as to how they have assessed the prospects of the Group, over what period they have done
so and why they consider that period to be appropriate, and their statement as to whether they have a reasonable expectation that
the Group will be able to continue in operation and meet its liabilities as they fall due over the period of their assessment, including
any related disclosures drawing attention to any necessary qualifications or assumptions.
We agreed with the directors’ adoption of the going concern basis of accounting and we did not identify any such material uncertainties.
However, because not all future events and conditions can be predicted, this statement is not a guarantee as to the Group’s ability to
continue as a going concern.
Independence
We are required to comply with the Financial Reporting Council’s Ethical Standards for Auditors and we confirm that we are
independent of the Group and we have fulfilled our other ethical responsibilities in accordance with those standards. We also confirm
we have not provided any of the prohibited non-audit services referred to in those standards.
Independent auditor’s report to the members of The Royal Bank of Scotland Group plc
254
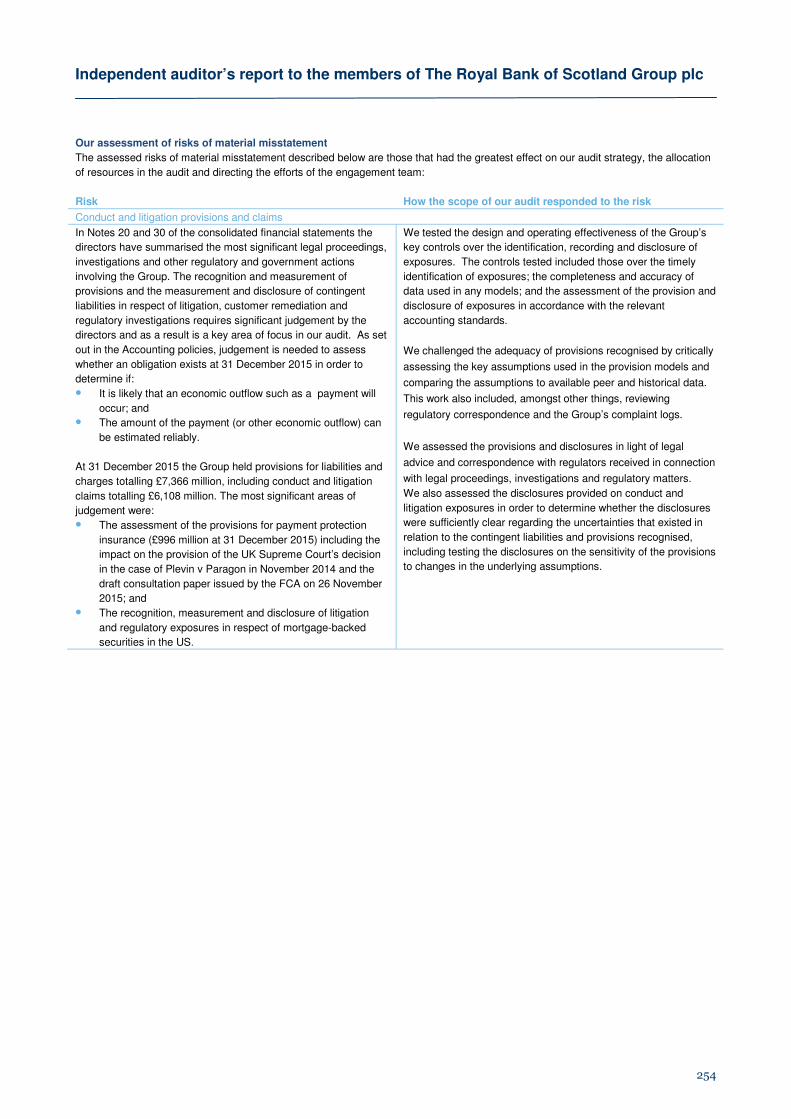
Our assessment of risks of material misstatement
The assessed risks of material misstatement described below are those that had the greatest effect on our audit strategy, the allocation
of resources in the audit and directing the efforts of the engagement team:
Risk How the scope of our audit responded to the risk
Conduct and litigation provisions and claims
In Notes 20 and 30 of the consolidated financial statements the
directors have summarised the most significant legal proceedings,
investigations and other regulatory and government actions
involving the Group. The recognition and measurement of
provisions and the measurement and disclosure of contingent
liabilities in respect of litigation, customer remediation and
regulatory investigations requires significant judgement by the
directors and as a result is a key area of focus in our audit. As set
out in the Accounting policies, judgement is needed to assess
whether an obligation exists at 31 December 2015 in order to
determine if:
• It is likely that an economic outflow such as a payment will
occur; and
• The amount of the payment (or other economic outflow) can
be estimated reliably.
At 31 December 2015 the Group held provisions for liabilities and
charges totalling £7,366 million, including conduct and litigation
claims totalling £6,108 million. The most significant areas of
judgement were:
• The assessment of the provisions for payment protection
insurance (£996 million at 31 December 2015) including the
impact on the provision of the UK Supreme Court’s decision
in the case of Plevin v Paragon in November 2014 and the
draft consultation paper issued by the FCA on 26 November
2015; and
• The recognition, measurement and disclosure of litigation
and regulatory exposures in respect of mortgage-backed
securities in the US.
We tested the design and operating effectiveness of the Group’s
key controls over the identification, recording and disclosure of
exposures. The controls tested included those over the timely
identification of exposures; the completeness and accuracy of
data used in any models; and the assessment of the provision and
disclosure of exposures in accordance with the relevant
accounting standards.
We challenged the adequacy of provisions recognised by critically
assessing the key assumptions used in the provision models and
comparing the assumptions to available peer and historical data.
This work also included, amongst other things, reviewing
regulatory correspondence and the Group’s complaint logs.
We assessed the provisions and disclosures in light of legal
advice and correspondence with regulators received in connection
with legal proceedings, investigations and regulatory matters.
We also assessed the disclosures provided on conduct and
litigation exposures in order to determine whether the disclosures
were sufficiently clear regarding the uncertainties that existed in
relation to the contingent liabilities and provisions recognised,
including testing the disclosures on the sensitivity of the provisions
to changes in the underlying assumptions.
Independent auditor’s report to the members of The Royal Bank of Scotland Group plc
255
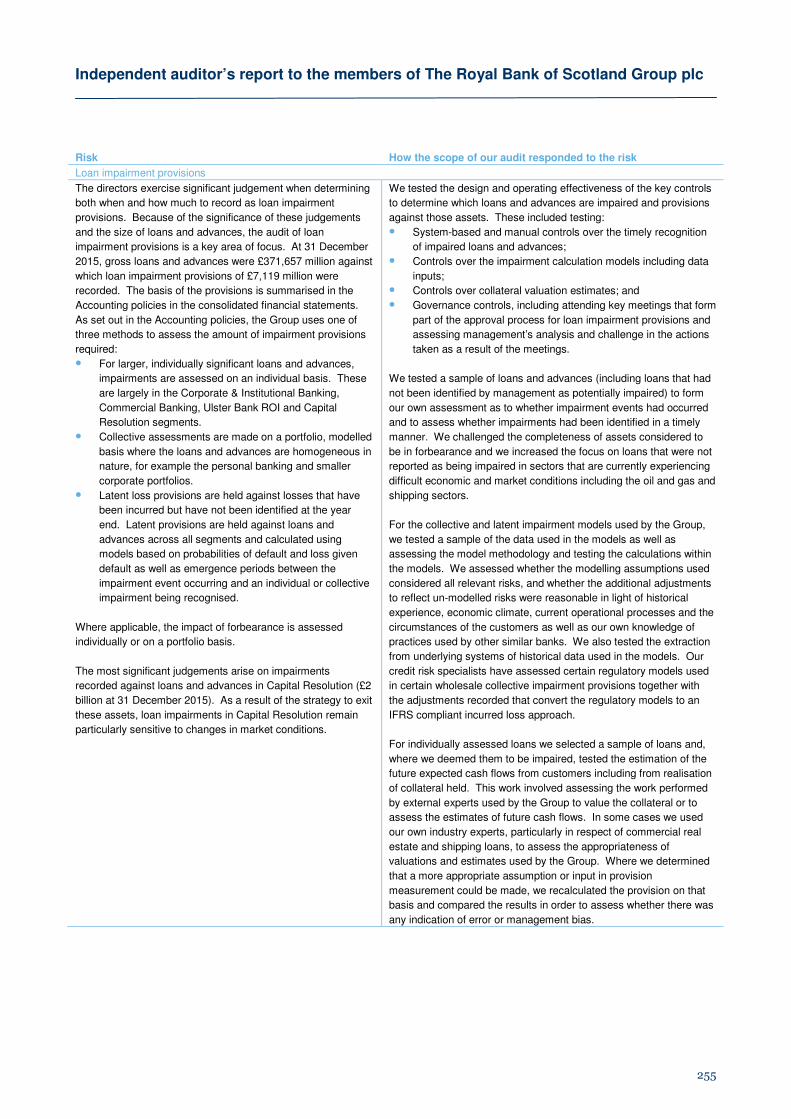
Risk How the scope of our audit responded to the risk
Loan impairment provisions
The directors exercise significant judgement when determining
both when and how much to record as loan impairment
provisions. Because of the significance of these judgements
and the size of loans and advances, the audit of loan
impairment provisions is a key area of focus. At 31 December
2015, gross loans and advances were £371,657 million against
which loan impairment provisions of £7,119 million were
recorded. The basis of the provisions is summarised in the
Accounting policies in the consolidated financial statements.
As set out in the Accounting policies, the Group uses one of
three methods to assess the amount of impairment provisions
required:
• For larger, individually significant loans and advances,
impairments are assessed on an individual basis. These
are largely in the Corporate & Institutional Banking,
Commercial Banking, Ulster Bank ROI and Capital
Resolution segments.
• Collective assessments are made on a portfolio, modelled
basis where the loans and advances are homogeneous in
nature, for example the personal banking and smaller
corporate portfolios.
• Latent loss provisions are held against losses that have
been incurred but have not been identified at the year
end. Latent provisions are held against loans and
advances across all segments and calculated using
models based on probabilities of default and loss given
default as well as emergence periods between the
impairment event occurring and an individual or collective
impairment being recognised.
Where applicable, the impact of forbearance is assessed
individually or on a portfolio basis.
The most significant judgements arise on impairments
recorded against loans and advances in Capital Resolution (£2
billion at 31 December 2015). As a result of the strategy to exit
these assets, loan impairments in Capital Resolution remain
particularly sensitive to changes in market conditions.
We tested the design and operating effectiveness of the key controls
to determine which loans and advances are impaired and provisions
against those assets. These included testing:
• System-based and manual controls over the timely recognition
of impaired loans and advances;
• Controls over the impairment calculation models including data
inputs;
• Controls over collateral valuation estimates; and
• Governance controls, including attending key meetings that form
part of the approval process for loan impairment provisions and
assessing management’s analysis and challenge in the actions
taken as a result of the meetings.
We tested a sample of loans and advances (including loans that had
not been identified by management as potentially impaired) to form
our own assessment as to whether impairment events had occurred
and to assess whether impairments had been identified in a timely
manner. We challenged the completeness of assets considered to
be in forbearance and we increased the focus on loans that were not
reported as being impaired in sectors that are currently experiencing
difficult economic and market conditions including the oil and gas and
shipping sectors.
For the collective and latent impairment models used by the Group,
we tested a sample of the data used in the models as well as
assessing the model methodology and testing the calculations within
the models. We assessed whether the modelling assumptions used
considered all relevant risks, and whether the additional adjustments
to reflect un-modelled risks were reasonable in light of historical
experience, economic climate, current operational processes and the
circumstances of the customers as well as our own knowledge of
practices used by other similar banks. We also tested the extraction
from underlying systems of historical data used in the models. Our
credit risk specialists have assessed certain regulatory models used
in certain wholesale collective impairment provisions together with
the adjustments recorded that convert the regulatory models to an
IFRS compliant incurred loss approach.
For individually assessed loans we selected a sample of loans and,
where we deemed them to be impaired, tested the estimation of the
future expected cash flows from customers including from realisation
of collateral held. This work involved assessing the work performed
by external experts used by the Group to value the collateral or to
assess the estimates of future cash flows. In some cases we used
our own industry experts, particularly in respect of commercial real
estate and shipping loans, to assess the appropriateness of
valuations and estimates used by the Group. Where we determined
that a more appropriate assumption or input in provision
measurement could be made, we recalculated the provision on that
basis and compared the results in order to assess whether there was
any indication of error or management bias.
Independent auditor’s report to the members of The Royal Bank of Scotland Group plc
256
Risk How the scope of our audit responded to the risk
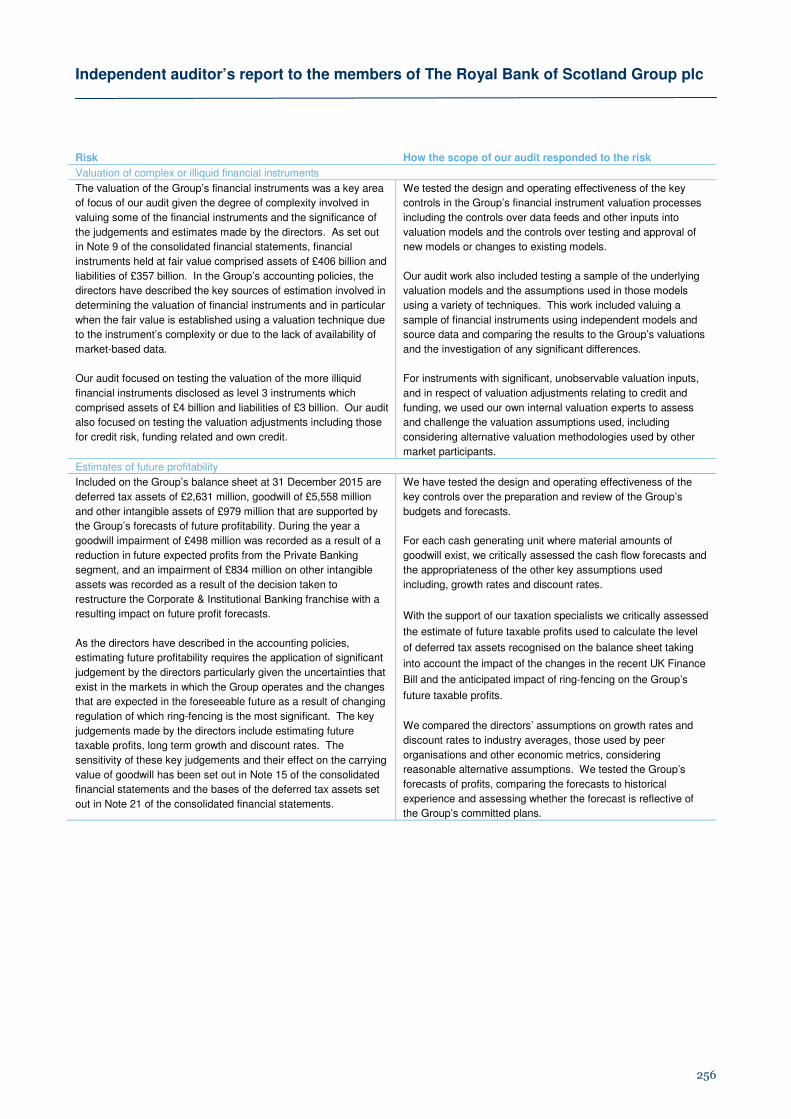
Valuation of complex or illiquid financial instruments
The valuation of the Group’s financial instruments was a key area
of focus of our audit given the degree of complexity involved in
valuing some of the financial instruments and the significance of
the judgements and estimates made by the directors. As set out
in Note 9 of the consolidated financial statements, financial
instruments held at fair value comprised assets of £406 billion and
liabilities of £357 billion. In the Group’s accounting policies, the
directors have described the key sources of estimation involved in
determining the valuation of financial instruments and in particular
when the fair value is established using a valuation technique due
to the instrument’s complexity or due to the lack of availability of
market-based data.
Our audit focused on testing the valuation of the more illiquid
financial instruments disclosed as level 3 instruments which
comprised assets of £4 billion and liabilities of £3 billion. Our audit
also focused on testing the valuation adjustments including those
for credit risk, funding related and own credit.
We tested the design and operating effectiveness of the key
controls in the Group’s financial instrument valuation processes
including the controls over data feeds and other inputs into
valuation models and the controls over testing and approval of
new models or changes to existing models.
Our audit work also included testing a sample of the underlying
valuation models and the assumptions used in those models
using a variety of techniques. This work included valuing a
sample of financial instruments using independent models and
source data and comparing the results to the Group’s valuations
and the investigation of any significant differences.
For instruments with significant, unobservable valuation inputs,
and in respect of valuation adjustments relating to credit and
funding, we used our own internal valuation experts to assess
and challenge the valuation assumptions used, including
considering alternative valuation methodologies used by other
market participants.
Estimates of future profitability
Included on the Group’s balance sheet at 31 December 2015 are
deferred tax assets of £2,631 million, goodwill of £5,558 million
and other intangible assets of £979 million that are supported by
the Group’s forecasts of future profitability. During the year a
goodwill impairment of £498 million was recorded as a result of a
reduction in future expected profits from the Private Banking
segment, and an impairment of £834 million on other intangible
assets was recorded as a result of the decision taken to
restructure the Corporate & Institutional Banking franchise with a
resulting impact on future profit forecasts.
As the directors have described in the accounting policies,
estimating future profitability requires the application of significant
judgement by the directors particularly given the uncertainties that
exist in the markets in which the Group operates and the changes
that are expected in the foreseeable future as a result of changing
regulation of which ring-fencing is the most significant. The key
judgements made by the directors include estimating future
taxable profits, long term growth and discount rates. The
sensitivity of these key judgements and their effect on the carrying
value of goodwill has been set out in Note 15 of the consolidated
financial statements and the bases of the deferred tax assets set
out in Note 21 of the consolidated financial statements.
We have tested the design and operating effectiveness of the
key controls over the preparation and review of the Group’s
budgets and forecasts.
For each cash generating unit where material amounts of
goodwill exist, we critically assessed the cash flow forecasts and
the appropriateness of the other key assumptions used
including, growth rates and discount rates.
With the support of our taxation specialists we critically assessed
the estimate of future taxable profits used to calculate the level
of deferred tax assets recognised on the balance sheet taking
into account the impact of the changes in the recent UK Finance
Bill and the anticipated impact of ring-fencing on the Group’s
future taxable profits.
We compared the directors’ assumptions on growth rates and
discount rates to industry averages, those used by peer
organisations and other economic metrics, considering
reasonable alternative assumptions. We tested the Group’s
forecasts of profits, comparing the forecasts to historical
experience and assessing whether the forecast is reflective of
the Group’s committed plans.

Independent auditor’s report to the members of The Royal Bank of Scotland Group plc
257
Risk How the scope of our audit responded to the risk
Pension accounting policy change
As described in Note 1 on page 267, in 2015 the Group revised
its accounting policy for determining whether or not it has an
unconditional right to a refund of any surplus in its defined
pension schemes. This change of policy had the effect of
reducing retained earnings by £1,483 million at 1 January 2015.
The complexities of the Group’s pension arrangements over a
number of schemes together with the complexities of accounting
for defined benefit pension schemes meant that the change in
accounting policy was an area of audit focus during the year.
Our audit focused on determining whether the new
interpretations had been appropriately applied and the
restatements were appropriate.
We used our pensions accounting specialists and our own
actuaries to understand, challenge, assess and review pertinent
evidence and calculations made in determining the pension assets
and liabilities.
Our audit work included reviewing the terms of the Group’s
pension deeds to assess and consider the rights of pension
trustees, which was a key determinant in the application of the
changes in interpretation. We also assessed and met with
external advisors to discuss the advice received by the Group in
respect of the rights of pension trustees. A key focus of our audit
work also included the calculation of:
• the liability for the minimum funding requirement, which
together with the actuarial valuation at the balance sheet date
determined the accounting deficit or surplus to be recognised;
and
• the asset ceiling, which is the amount of any surplus eligible
to continue to be recognised as an asset representing the
benefits available from reductions in future service
contributions for current employees.
IT access rights
The widespread reliance on information systems within the
Group means that the controls over access rights are critical.
The Group identified a number of deficiencies in the controls
over the provision of access to IT application systems which
increased the risk that individuals had inappropriate access and
the Group put in place a programme of activities to remediate
those deficiencies during 2015. However for the IT application
systems and databases that support financial reporting, the
existence of these deficiencies during the year and at the year-
end meant there was an increased risk that the data and reports
from the affected systems and databases were not reliable.
We tested the design and operating effectiveness of the Group’s
controls over the information systems that are critical to financial
reporting and identified weaknesses in the access controls during
the year, although many were fully resolved before the year end.
Where these deficiencies affected applications and databases
within the scope of our audit we performed a combination of
controls testing and substantive testing in order to determine
whether we could place reliance on the completeness and
accuracy of system generated information, including:
• Determined whether unauthorised or inappropriate changes
had been made to the affected databases and IT application
systems; and
• Assessed the design and operating effectiveness of any
controls that mitigated the identified risks.
In addition and where appropriate we extended the scope of our
substantive audit procedures.
The description of the risks above should be read in conjunction with the significant issues considered by the Group Audit Committee
discussed on pages 51 to 54.
These matters were addressed in the context of our audit of the financial statements as a whole, and in forming our opinion thereon,
and we do not provide a separate opinion on these matters.
Our application of materiality
We define materiality as the magnitude of misstatement in the financial statements that makes it probable that the economic decisions
of a reasonably knowledgeable person would be changed or influenced. We use materiality both in planning the scope of our audit work
and in evaluating the results of our work.
We determined materiality for the Group to be £300 million (2014 - £300 million), which was calculated as 0.6% (2014 - 0.5%) of the
total equity of the Group. This represented 25% of the Group’s loss for the year (2014 - 11% of the Group’s loss). Our materiality in
both 2015 and 2014 was based on the equity of the Group given the significant volatility of the Group’s profits and losses in recent
years.
We agreed with the Group Audit Committee that we would report all audit differences in excess of £15 million, as well as differences
below that threshold that, in our view, warranted reporting on qualitative grounds. We also report to the Group Audit Committee on
disclosure matters that we identified when assessing the overall presentation of the financial statements.
Independent auditor’s report to the members of The Royal Bank of Scotland Group plc
258
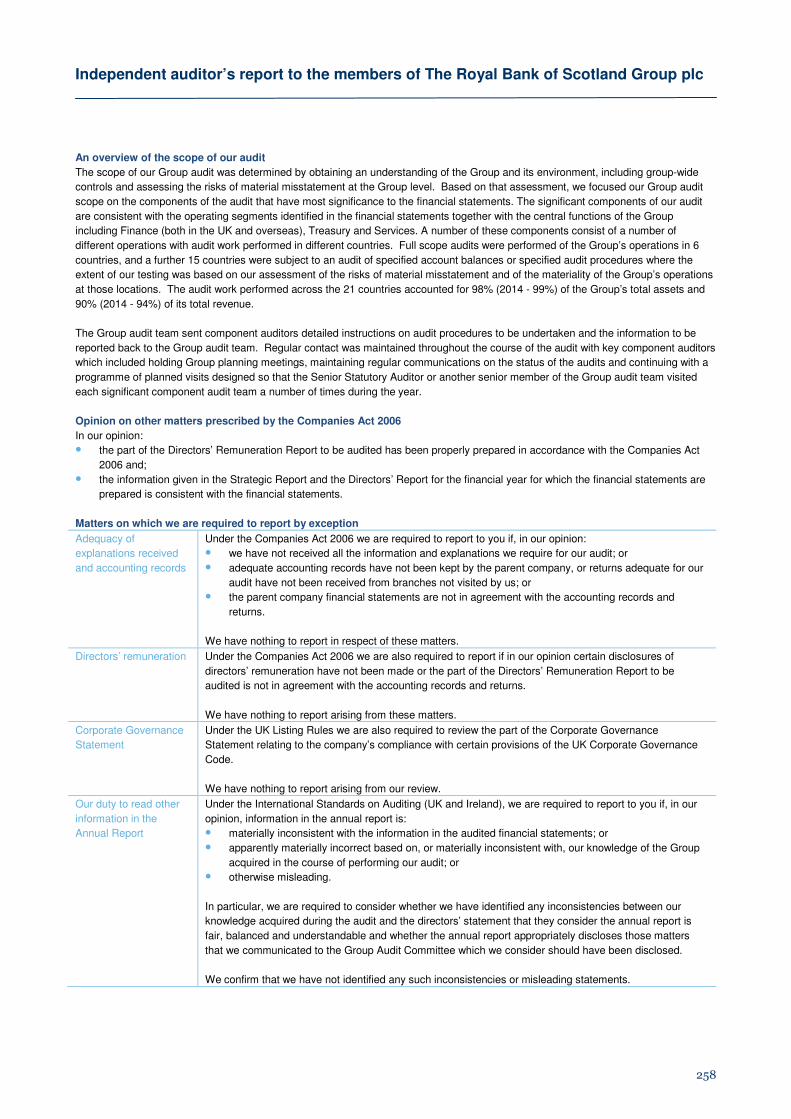
An overview of the scope of our audit
The scope of our Group audit was determined by obtaining an understanding of the Group and its environment, including group-wide
controls and assessing the risks of material misstatement at the Group level. Based on that assessment, we focused our Group audit
scope on the components of the audit that have most significance to the financial statements. The significant components of our audit
are consistent with the operating segments identified in the financial statements together with the central functions of the Group
including Finance (both in the UK and overseas), Treasury and Services. A number of these components consist of a number of
different operations with audit work performed in different countries. Full scope audits were performed of the Group’s operations in 6
countries, and a further 15 countries were subject to an audit of specified account balances or specified audit procedures where the
extent of our testing was based on our assessment of the risks of material misstatement and of the materiality of the Group’s operations
at those locations. The audit work performed across the 21 countries accounted for 98% (2014 - 99%) of the Group’s total assets and
90% (2014 - 94%) of its total revenue.
The Group audit team sent component auditors detailed instructions on audit procedures to be undertaken and the information to be
reported back to the Group audit team. Regular contact was maintained throughout the course of the audit with key component auditors
which included holding Group planning meetings, maintaining regular communications on the status of the audits and continuing with a
programme of planned visits designed so that the Senior Statutory Auditor or another senior member of the Group audit team visited
each significant component audit team a number of times during the year.
Opinion on other matters prescribed by the Companies Act 2006
In our opinion:
• the part of the Directors’ Remuneration Report to be audited has been properly prepared in accordance with the Companies Act
2006 and;
• the information given in the Strategic Report and the Directors’ Report for the financial year for which the financial statements are
prepared is consistent with the financial statements.
Matters on which we are required to report by exception
Adequacy of
explanations received
and accounting records
Under the Companies Act 2006 we are required to report to you if, in our opinion:
• we have not received all the information and explanations we require for our audit; or
• adequate accounting records have not been kept by the parent company, or returns adequate for our
audit have not been received from branches not visited by us; or
• the parent company financial statements are not in agreement with the accounting records and
returns.
We have nothing to report in respect of these matters.
Directors’ remuneration Under the Companies Act 2006 we are also required to report if in our opinion certain disclosures of
directors’ remuneration have not been made or the part of the Directors’ Remuneration Report to be
audited is not in agreement with the accounting records and returns.
We have nothing to report arising from these matters.
Corporate Governance
Statement
Under the UK Listing Rules we are also required to review the part of the Corporate Governance
Statement relating to the company’s compliance with certain provisions of the UK Corporate Governance
Code.
We have nothing to report arising from our review.
Our duty to read other
information in the
Annual Report
Under the International Standards on Auditing (UK and Ireland), we are required to report to you if, in our
opinion, information in the annual report is:
• materially inconsistent with the information in the audited financial statements; or
• apparently materially incorrect based on, or materially inconsistent with, our knowledge of the Group
acquired in the course of performing our audit; or
• otherwise misleading.
In particular, we are required to consider whether we have identified any inconsistencies between our
knowledge acquired during the audit and the directors’ statement that they consider the annual report is
fair, balanced and understandable and whether the annual report appropriately discloses those matters
that we communicated to the Group Audit Committee which we consider should have been disclosed.
We confirm that we have not identified any such inconsistencies or misleading statements.
Independent auditor’s report to the members of The Royal Bank of Scotland Group plc
259
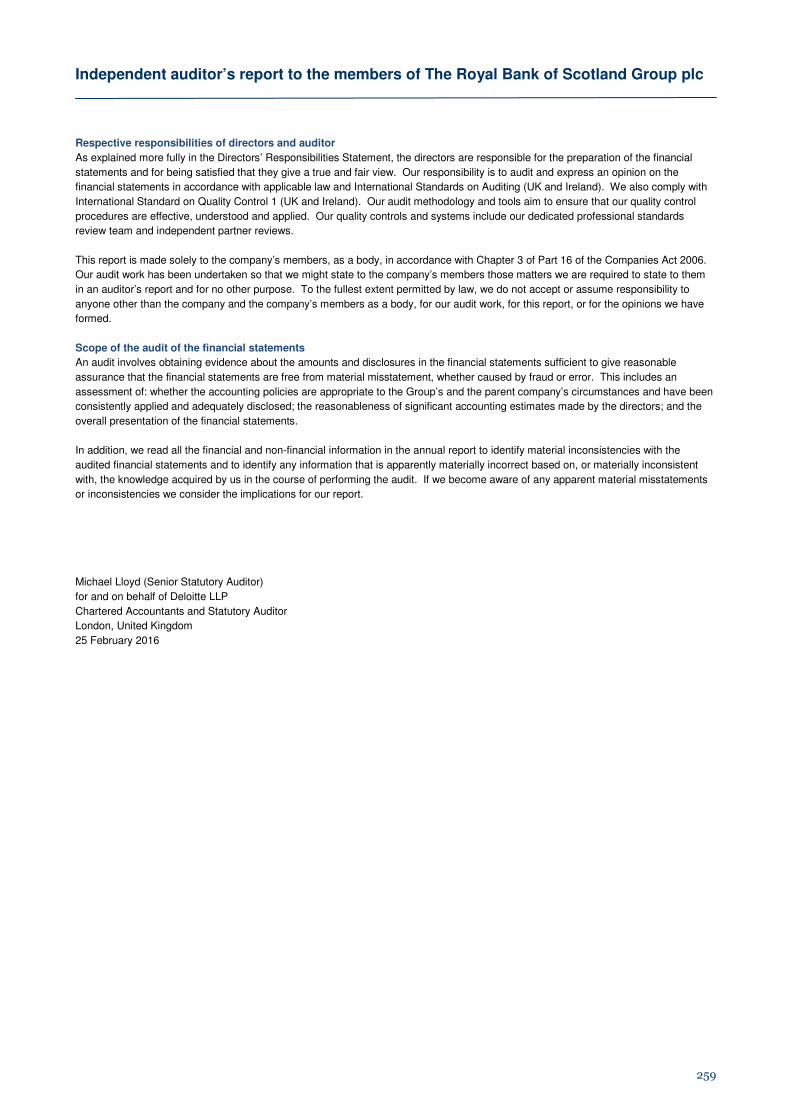
Respective responsibilities of directors and auditor
As explained more fully in the Directors’ Responsibilities Statement, the directors are responsible for the preparation of the financial
statements and for being satisfied that they give a true and fair view. Our responsibility is to audit and express an opinion on the
financial statements in accordance with applicable law and International Standards on Auditing (UK and Ireland). We also comply with
International Standard on Quality Control 1 (UK and Ireland). Our audit methodology and tools aim to ensure that our quality control
procedures are effective, understood and applied. Our quality controls and systems include our dedicated professional standards
review team and independent partner reviews.
This report is made solely to the company’s members, as a body, in accordance with Chapter 3 of Part 16 of the Companies Act 2006.
Our audit work has been undertaken so that we might state to the company’s members those matters we are required to state to them
in an auditor’s report and for no other purpose. To the fullest extent permitted by law, we do not accept or assume responsibility to
anyone other than the company and the company’s members as a body, for our audit work, for this report, or for the opinions we have
formed.
Scope of the audit of the financial statements
An audit involves obtaining evidence about the amounts and disclosures in the financial statements sufficient to give reasonable
assurance that the financial statements are free from material misstatement, whether caused by fraud or error. This includes an
assessment of: whether the accounting policies are appropriate to the Group’s and the parent company’s circumstances and have been
consistently applied and adequately disclosed; the reasonableness of significant accounting estimates made by the directors; and the
overall presentation of the financial statements.
In addition, we read all the financial and non-financial information in the annual report to identify material inconsistencies with the
audited financial statements and to identify any information that is apparently materially incorrect based on, or materially inconsistent
with, the knowledge acquired by us in the course of performing the audit. If we become aware of any apparent material misstatements
or inconsistencies we consider the implications for our report.
Michael Lloyd (Senior Statutory Auditor)
for and on behalf of Deloitte LLP
Chartered Accountants and Statutory Auditor
London, United Kingdom
25 February 2016
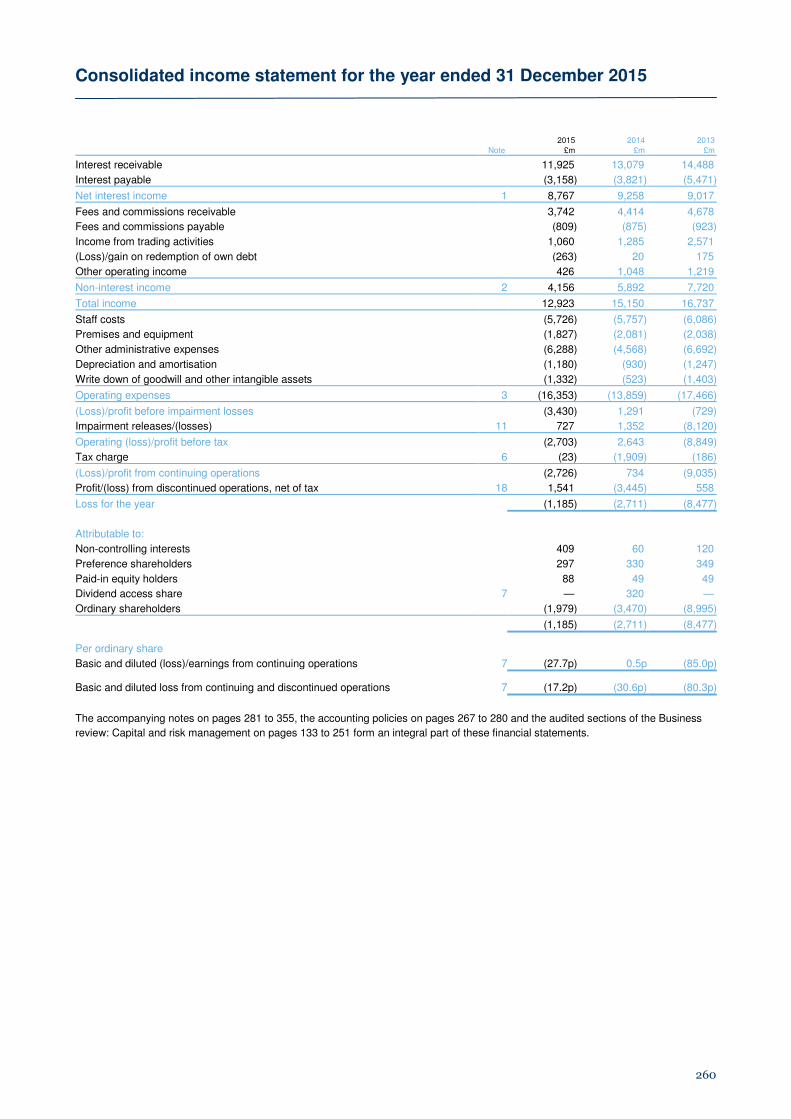
Consolidated income statement for the year ended 31 December 2015
260
Note
2015 2014 2013
£m £m £m
Interest receivable 11,925 13,079 14,488
Interest payable (3,158) (3,821) (5,471)
Net interest income 1 8,767 9,258 9,017
Fees and commissions receivable 3,742 4,414 4,678
Fees and commissions payable (809) (875) (923)
Income from trading activities 1,060 1,285 2,571
(Loss)/gain on redemption of own debt (263) 20 175
Other operating income 426 1,048 1,219
Non-interest income 2 4,156 5,892 7,720
Total income 12,923 15,150 16,737
Staff costs (5,726) (5,757) (6,086)
Premises and equipment (1,827) (2,081) (2,038)
Other administrative expenses (6,288) (4,568) (6,692)
Depreciation and amortisation (1,180) (930) (1,247)
Write down of goodwill and other intangible assets (1,332) (523) (1,403)
Operating expenses 3 (16,353) (13,859) (17,466)
(Loss)/profit before impairment losses (3,430) 1,291 (729)
Impairment releases/(losses) 11 727 1,352 (8,120)
Operating (loss)/profit before tax (2,703) 2,643 (8,849)
Tax charge 6 (23) (1,909) (186)
(Loss)/profit from continuing operations (2,726) 734 (9,035)
Profit/(loss) from discontinued operations, net of tax 18 1,541 (3,445) 558
Loss for the year (1,185) (2,711) (8,477)
Attributable to:
Non-controlling interests 409 60 120
Preference shareholders 297 330 349
Paid-in equity holders 88 49 49
Dividend access share 7 — 320 —
Ordinary shareholders (1,979) (3,470) (8,995)
(1,185) (2,711) (8,477)
Per ordinary share
Basic and diluted (loss)/earnings from continuing operations 7 (27.7p) 0.5p (85.0p)
Basic and diluted loss from continuing and discontinued operations 7 (17.2p) (30.6p) (80.3p)
The accompanying notes on pages 281 to 355, the accounting policies on pages 267 to 280 and the audited sections of the Business
review: Capital and risk management on pages 133 to 251 form an integral part of these financial statements.
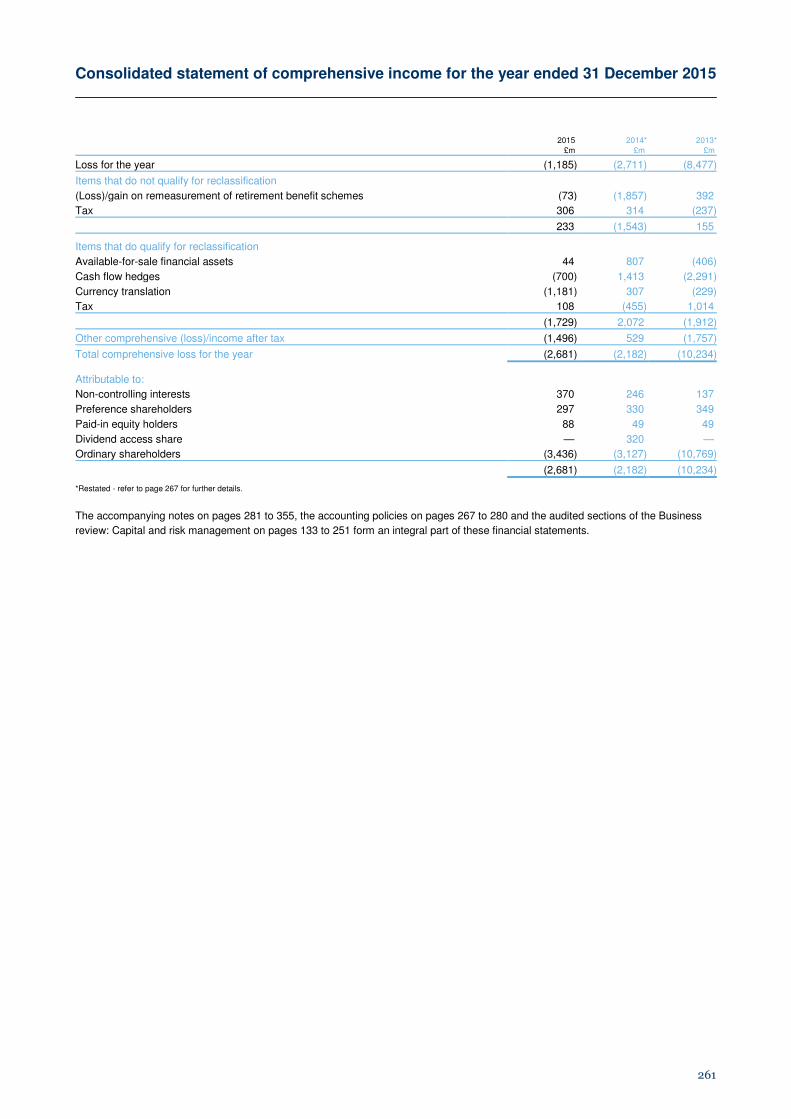
Consolidated statement of comprehensive income for the year ended 31 December 2015
261
2015 2014* 2013*
£m £m £m
Loss for the year (1,185) (2,711) (8,477)
Items that do not qualify for reclassification
(Loss)/gain on remeasurement of retirement benefit schemes (73) (1,857) 392
Tax 306 314 (237)
233 (1,543) 155 Items that do qualify for reclassification
Available-for-sale financial assets 44 807 (406)
Cash flow hedges (700) 1,413 (2,291)
Currency translation (1,181) 307 (229)
Tax 108 (455) 1,014
(1,729) 2,072 (1,912)
Other comprehensive (loss)/income after tax (1,496) 529 (1,757)
Total comprehensive loss for the year (2,681) (2,182) (10,234)
Attributable to:
Non-controlling interests 370 246 137
Preference shareholders 297 330 349
Paid-in equity holders 88 49 49
Dividend access share — 320 —
Ordinary shareholders (3,436) (3,127) (10,769)
(2,681) (2,182) (10,234)
*Restated - refer to page 267 for further details.
The accompanying notes on pages 281 to 355, the accounting policies on pages 267 to 280 and the audited sections of the Business
review: Capital and risk management on pages 133 to 251 form an integral part of these financial statements.
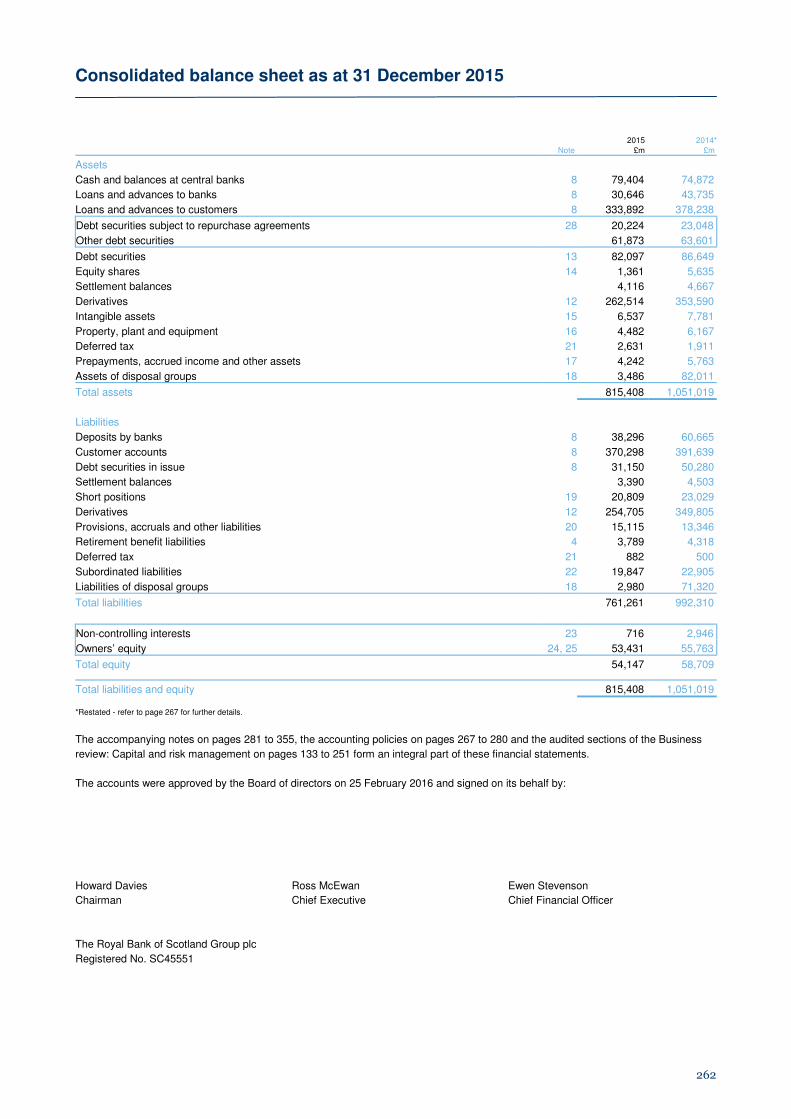
Consolidated balance sheet as at 31 December 2015
262
Note
2015 2014*
£m £m
Assets
Cash and balances at central banks 8 79,404 74,872
Loans and advances to banks 8 30,646 43,735
Loans and advances to customers 8 333,892 378,238
Debt securities subject to repurchase agreements 28 20,224 23,048
Other debt securities 61,873 63,601
Debt securities 13 82,097 86,649
Equity shares 14 1,361 5,635
Settlement balances 4,116 4,667
Derivatives 12 262,514 353,590
Intangible assets 15 6,537 7,781
Property, plant and equipment 16 4,482 6,167
Deferred tax 21 2,631 1,911
Prepayments, accrued income and other assets 17 4,242 5,763
Assets of disposal groups 18 3,486 82,011
Total assets 815,408 1,051,019
Liabilities
Deposits by banks 8 38,296 60,665
Customer accounts 8 370,298 391,639
Debt securities in issue 8 31,150 50,280
Settlement balances 3,390 4,503
Short positions 19 20,809 23,029
Derivatives 12 254,705 349,805
Provisions, accruals and other liabilities 20 15,115 13,346
Retirement benefit liabilities 4 3,789 4,318
Deferred tax 21 882 500
Subordinated liabilities 22 19,847 22,905
Liabilities of disposal groups 18 2,980 71,320
Total liabilities 761,261 992,310
Non-controlling interests 23 716 2,946
Owners’ equity 24, 25 53,431 55,763
Total equity 54,147 58,709 Total liabilities and equity 815,408 1,051,019
*Restated - refer to page 267 for further details.
The accompanying notes on pages 281 to 355, the accounting policies on pages 267 to 280 and the audited sections of the Business
review: Capital and risk management on pages 133 to 251 form an integral part of these financial statements.
The accounts were approved by the Board of directors on 25 February 2016 and signed on its behalf by:
Howard Davies
Chairman
Ross McEwan
Chief Executive
Ewen Stevenson
Chief Financial Officer
The Royal Bank of Scotland Group plc
Registered No. SC45551
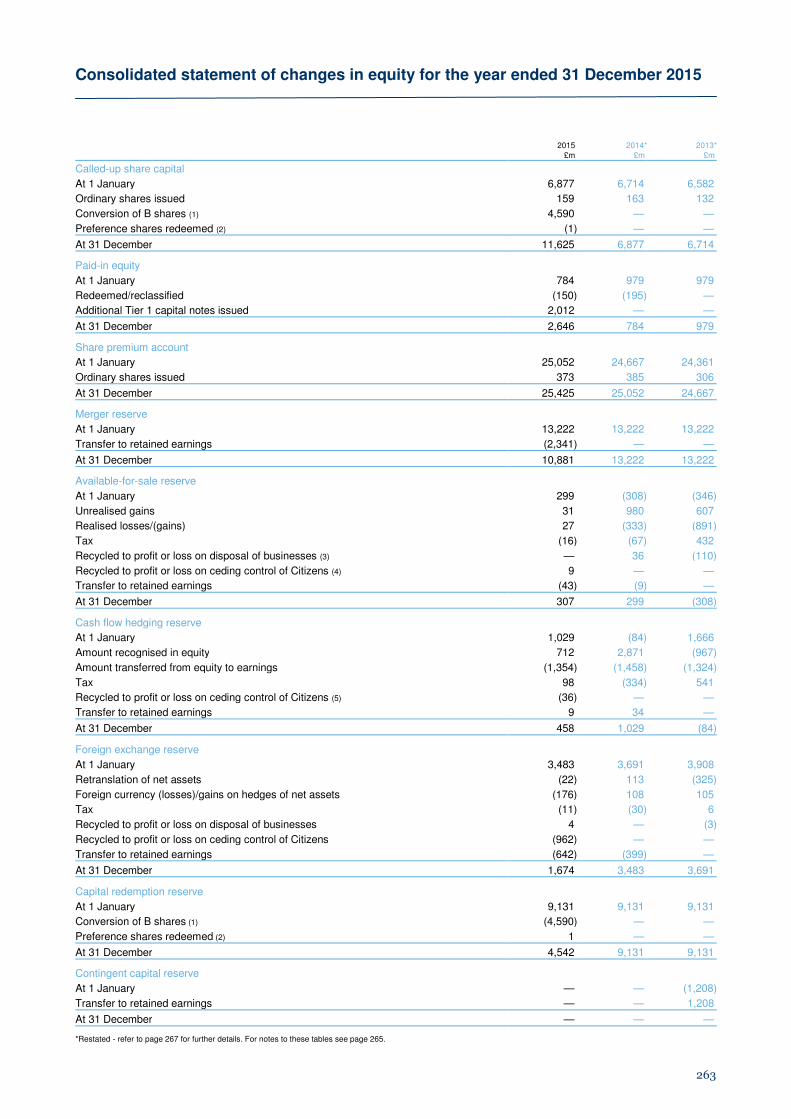
Consolidated statement of changes in equity for the year ended 31 December 2015
263
2015 2014* 2013*£m £m £m
Called-up share capital
At 1 January 6,877 6,714 6,582
Ordinary shares issued 159 163 132
Conversion of B shares (1) 4,590 — —
Preference shares redeemed (2) (1) — —
At 31 December 11,625 6,877 6,714 Paid-in equity
At 1 January 784 979 979
Redeemed/reclassified (150) (195) —
Additional Tier 1 capital notes issued 2,012 — —
At 31 December 2,646 784 979 Share premium account
At 1 January 25,052 24,667 24,361
Ordinary shares issued 373 385 306
At 31 December 25,425 25,052 24,667 Merger reserve
At 1 January 13,222 13,222 13,222
Transfer to retained earnings (2,341) — —
At 31 December 10,881 13,222 13,222 Available-for-sale reserve
At 1 January 299 (308) (346)
Unrealised gains 31 980 607
Realised losses/(gains) 27 (333) (891)
Tax (16) (67) 432
Recycled to profit or loss on disposal of businesses (3) — 36 (110)
Recycled to profit or loss on ceding control of Citizens (4) 9 — —
Transfer to retained earnings (43) (9) —
At 31 December 307 299 (308) Cash flow hedging reserve
At 1 January 1,029 (84) 1,666
Amount recognised in equity 712 2,871 (967)
Amount transferred from equity to earnings (1,354) (1,458) (1,324)
Tax 98 (334) 541
Recycled to profit or loss on ceding control of Citizens (5) (36) — —
Transfer to retained earnings 9 34 —
At 31 December 458 1,029 (84) Foreign exchange reserve At 1 January 3,483 3,691 3,908
Retranslation of net assets (22) 113 (325)
Foreign currency (losses)/gains on hedges of net assets (176) 108 105
Tax (11) (30) 6
Recycled to profit or loss on disposal of businesses 4 — (3)
Recycled to profit or loss on ceding control of Citizens (962) — —
Transfer to retained earnings (642) (399) —
At 31 December 1,674 3,483 3,691 Capital redemption reserve At 1 January 9,131 9,131 9,131
Conversion of B shares (1) (4,590) — —
Preference shares redeemed (2) 1 — —
At 31 December 4,542 9,131 9,131 Contingent capital reserve
At 1 January — — (1,208)
Transfer to retained earnings — — 1,208
At 31 December — — — *Restated - refer to page 267 for further details. For notes to these tables see page 265.
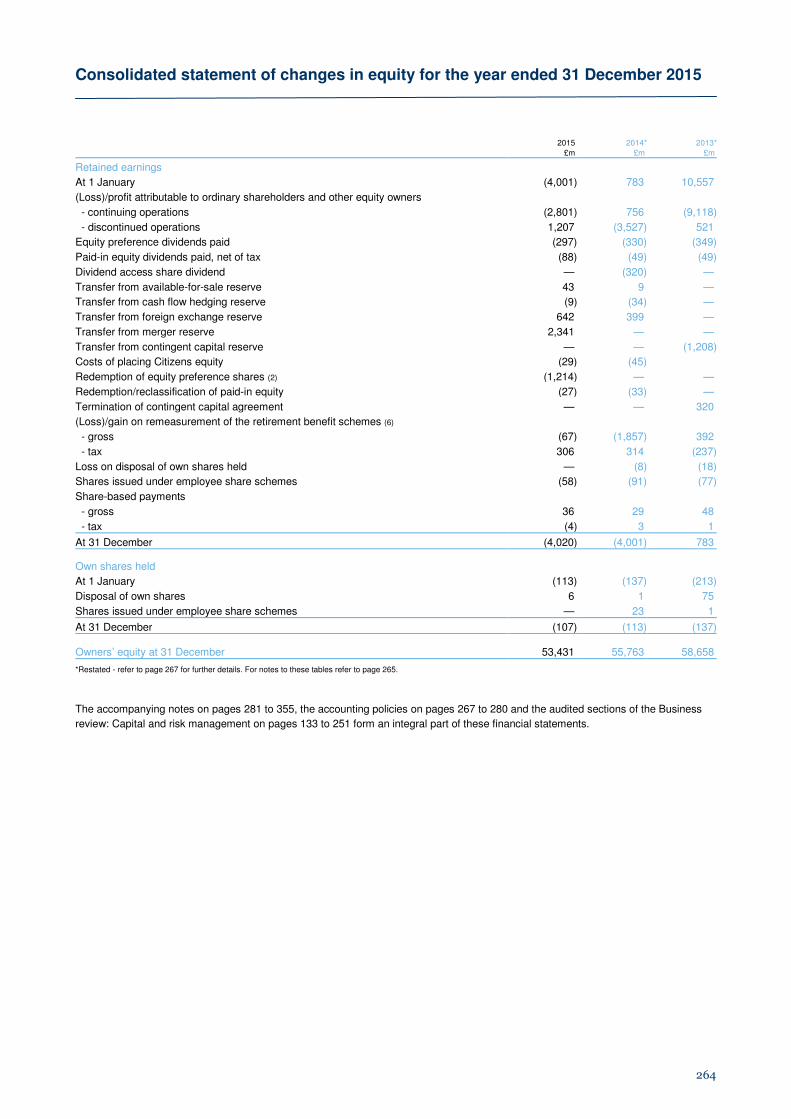
Consolidated statement of changes in equity for the year ended 31 December 2015
264
2015 2014* 2013*
£m £m £m
Retained earnings
At 1 January (4,001) 783 10,557
(Loss)/profit attributable to ordinary shareholders and other equity owners
- continuing operations (2,801) 756 (9,118)
- discontinued operations 1,207 (3,527) 521
Equity preference dividends paid (297) (330) (349)
Paid-in equity dividends paid, net of tax (88) (49) (49)
Dividend access share dividend — (320) —
Transfer from available-for-sale reserve 43 9 —
Transfer from cash flow hedging reserve (9) (34) —
Transfer from foreign exchange reserve 642 399 —
Transfer from merger reserve 2,341 — —
Transfer from contingent capital reserve — — (1,208)
Costs of placing Citizens equity (29) (45) Redemption of equity preference shares (2) (1,214) — —
Redemption/reclassification of paid-in equity (27) (33) —
Termination of contingent capital agreement — — 320
(Loss)/gain on remeasurement of the retirement benefit schemes (6)
- gross (67) (1,857) 392
- tax 306 314 (237)
Loss on disposal of own shares held — (8) (18)
Shares issued under employee share schemes (58) (91) (77)
Share-based payments
- gross 36 29 48
- tax (4) 3 1
At 31 December (4,020) (4,001) 783 Own shares held
At 1 January (113) (137) (213)
Disposal of own shares 6 1 75
Shares issued under employee share schemes — 23 1
At 31 December (107) (113) (137) Owners’ equity at 31 December 53,431 55,763 58,658
*Restated - refer to page 267 for further details. For notes to these tables refer to page 265.
The accompanying notes on pages 281 to 355, the accounting policies on pages 267 to 280 and the audited sections of the Business
review: Capital and risk management on pages 133 to 251 form an integral part of these financial statements.
Consolidated statement of changes in equity for the year ended 31 December 2015
265
2015 2014* 2013*
£m £m £m
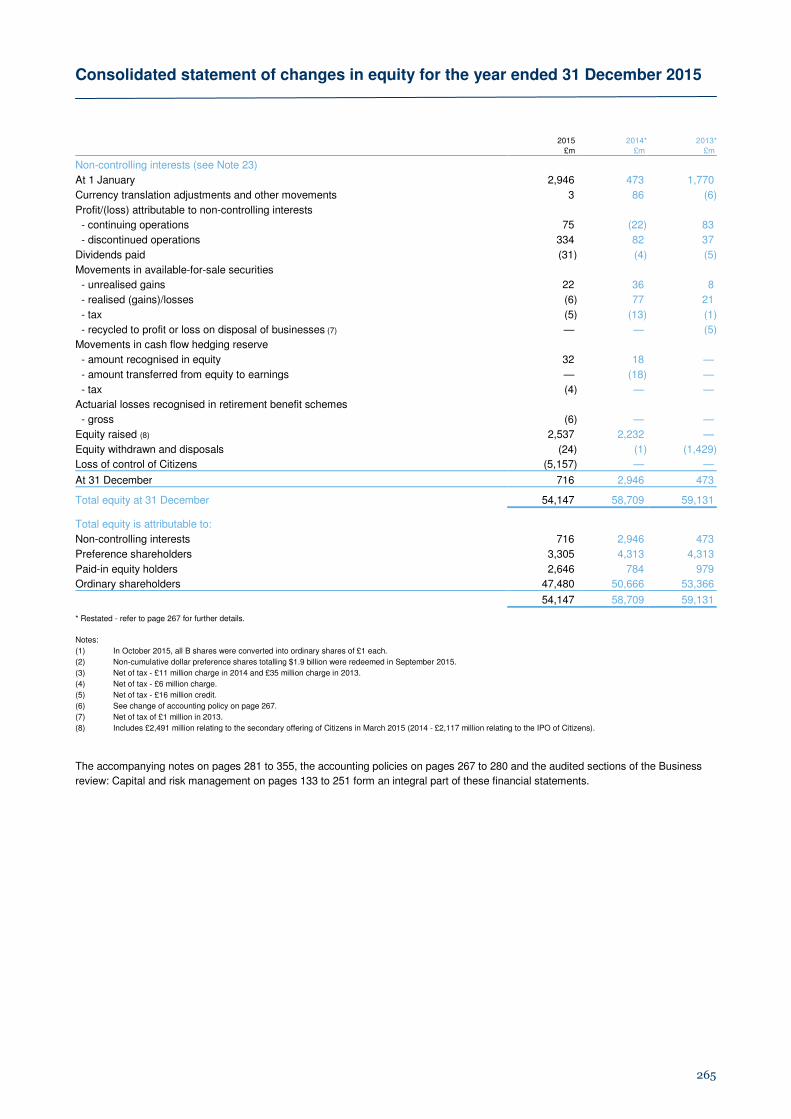
Non-controlling interests (see Note 23)
At 1 January 2,946 473 1,770
Currency translation adjustments and other movements 3 86 (6)
Profit/(loss) attributable to non-controlling interests
- continuing operations 75 (22) 83
- discontinued operations 334 82 37
Dividends paid (31) (4) (5)
Movements in available-for-sale securities
- unrealised gains 22 36 8
- realised (gains)/losses (6) 77 21
- tax (5) (13) (1)
- recycled to profit or loss on disposal of businesses (7) — — (5)
Movements in cash flow hedging reserve
- amount recognised in equity 32 18 —
- amount transferred from equity to earnings — (18) —
- tax (4) — —
Actuarial losses recognised in retirement benefit schemes
- gross (6) — —
Equity raised (8) 2,537 2,232 —
Equity withdrawn and disposals (24) (1) (1,429)
Loss of control of Citizens (5,157) — —
At 31 December 716 2,946 473 Total equity at 31 December 54,147 58,709 59,131
Total equity is attributable to: Non-controlling interests 716 2,946 473
Preference shareholders 3,305 4,313 4,313
Paid-in equity holders 2,646 784 979
Ordinary shareholders 47,480 50,666 53,366
54,147 58,709 59,131
* Restated - refer to page 267 for further details.
Notes:
(1) In October 2015, all B shares were converted into ordinary shares of £1 each.
(2) Non-cumulative dollar preference shares totalling $1.9 billion were redeemed in September 2015.
(3) Net of tax - £11 million charge in 2014 and £35 million charge in 2013.
(4) Net of tax - £6 million charge.
(5) Net of tax - £16 million credit.
(6) See change of accounting policy on page 267.
(7) Net of tax of £1 million in 2013.
(8) Includes £2,491 million relating to the secondary offering of Citizens in March 2015 (2014 - £2,117 million relating to the IPO of Citizens).
The accompanying notes on pages 281 to 355, the accounting policies on pages 267 to 280 and the audited sections of the Business
review: Capital and risk management on pages 133 to 251 form an integral part of these financial statements.
Consolidated cash flow statement for the year ended 31 December 2015
266
Note
2015 2014 2013
£m £m £m
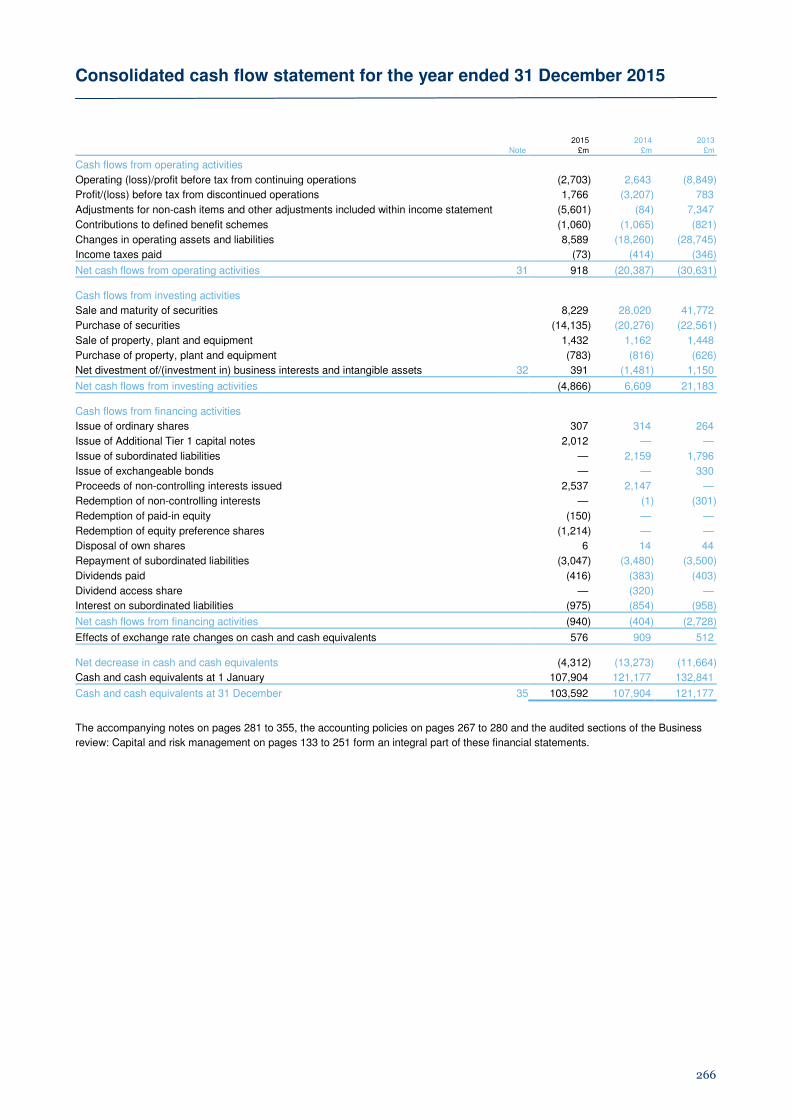
Cash flows from operating activities
Operating (loss)/profit before tax from continuing operations (2,703) 2,643 (8,849)
Profit/(loss) before tax from discontinued operations 1,766 (3,207) 783
Adjustments for non-cash items and other adjustments included within income statement (5,601) (84) 7,347
Contributions to defined benefit schemes (1,060) (1,065) (821)
Changes in operating assets and liabilities 8,589 (18,260) (28,745)
Income taxes paid (73) (414) (346)
Net cash flows from operating activities 31 918 (20,387) (30,631) Cash flows from investing activities
Sale and maturity of securities 8,229 28,020 41,772
Purchase of securities (14,135) (20,276) (22,561)
Sale of property, plant and equipment 1,432 1,162 1,448
Purchase of property, plant and equipment (783) (816) (626)
Net divestment of/(investment in) business interests and intangible assets 32 391 (1,481) 1,150
Net cash flows from investing activities (4,866) 6,609 21,183 Cash flows from financing activities
Issue of ordinary shares 307 314 264
Issue of Additional Tier 1 capital notes 2,012 — —
Issue of subordinated liabilities — 2,159 1,796
Issue of exchangeable bonds — — 330
Proceeds of non-controlling interests issued 2,537 2,147 —
Redemption of non-controlling interests — (1) (301)
Redemption of paid-in equity (150) — —
Redemption of equity preference shares (1,214) — —
Disposal of own shares 6 14 44
Repayment of subordinated liabilities (3,047) (3,480) (3,500)
Dividends paid (416) (383) (403)
Dividend access share — (320) —
Interest on subordinated liabilities (975) (854) (958)
Net cash flows from financing activities (940) (404) (2,728)
Effects of exchange rate changes on cash and cash equivalents 576 909 512 Net decrease in cash and cash equivalents (4,312) (13,273) (11,664)
Cash and cash equivalents at 1 January 107,904 121,177 132,841
Cash and cash equivalents at 31 December 35 103,592 107,904 121,177
The accompanying notes on pages 281 to 355, the accounting policies on pages 267 to 280 and the audited sections of the Business
review: Capital and risk management on pages 133 to 251 form an integral part of these financial statements.

Accounting policies
267
1. Presentation of accounts
The accounts are prepared on a going concern basis (see the
Report of the directors, page 89) and in accordance with
International Financial Reporting Standards issued by the
International Accounting Standards Board (IASB) and
interpretations issued by the IFRS Interpretations Committee of
the IASB as adopted by the European Union (EU) (together
IFRS). The EU has not adopted the complete text of IAS 39
‘Financial Instruments: Recognition and Measurement’; it has
relaxed some of the standard's hedging requirements. The Group
has not taken advantage of this relaxation: its financial
statements are prepared in accordance with IFRS as issued by
the IASB.
The company is incorporated in the UK and registered in
Scotland. Its accounts are presented in accordance with the
Companies Act 2006. With the exception of investment property
and certain financial instruments as described in Accounting
policies 9, 14, 16 and 23, the accounts are presented on an
historical cost basis.
On 31 December 2014, Citizens Financial Group Inc. was
classified as a discontinued operation and a disposal group: its
aggregate assets were presented in Assets of disposal groups
and its aggregate liabilities in Liabilities of disposal groups. Prior
period results were re-presented.
From 3 August 2015, when RBS’s interest in Citizens fell to
20.9%, Citizens was accounted for as an associate classified as
held for sale. RBS subsequently completed its divestment of
Citizens when it sold its final tranche on 30 October 2015.
Citizens is no longer a reportable segment, therefore segment
disclosures for all periods have been restated.
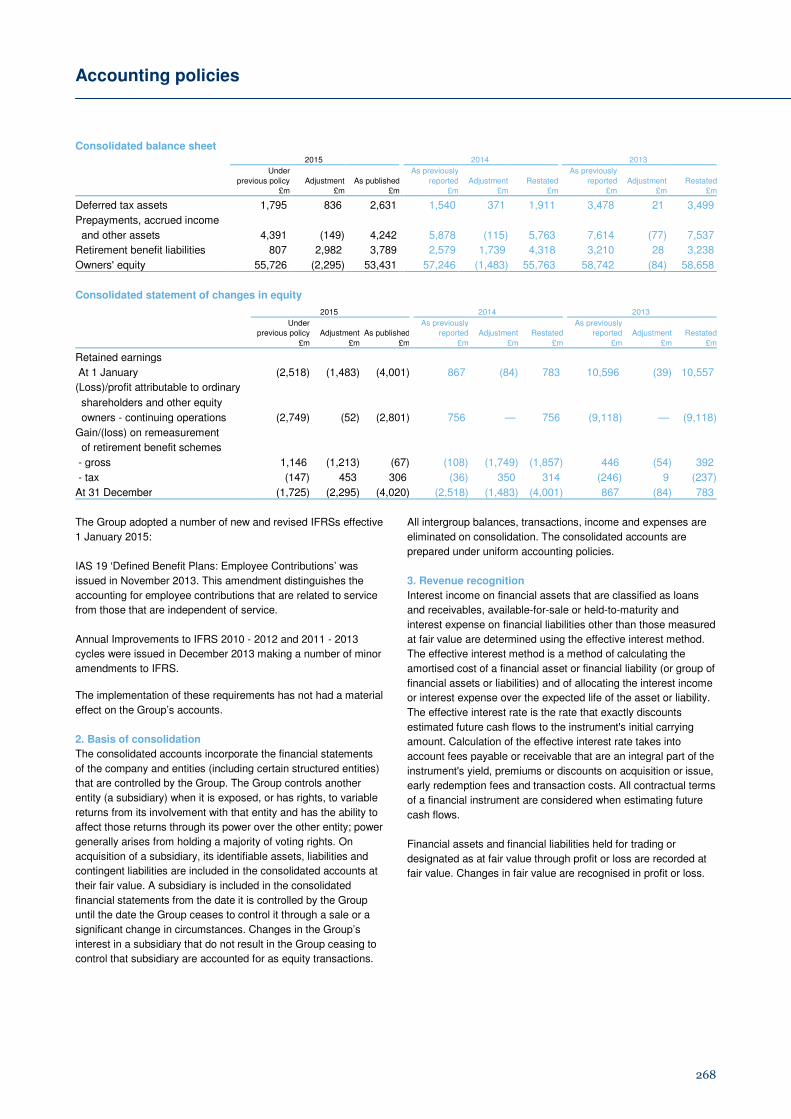
Change of accounting policy
In the fourth quarter of 2015, the Group changed its accounting
policy for the recognition of surpluses in its defined benefit
pension schemes: in particular, the policy for determining
whether or not it has an unconditional right to a refund of
surpluses in its employee pension funds. Where the Group has a
right to a refund, this is not deemed unconditional if pension fund
trustees are able unilaterally to enhance benefits for plan
members. As a result of this change, a minimum funding
requirement to cover an existing shortfall in a scheme may give
rise to an additional liability and surpluses may not be recognised
in full. The revised accounting policy, by taking account of the
powers of pension trustees in assessing the economic benefit
available as a refund, provides more relevant information about
the effect on the Group’s financial position of its defined benefit
pension schemes.
In accordance with IFRS, the amended policy has been applied
retrospectively and prior periods restated. The impact of the
change in policy is set out below.
Consolidated income statement 2015 Under previous policy Adjustment As published
£m £m £m
Staff costs (5,662) (64) (5,726)
Operating expenses (16,289) (64) (16,353)
Loss before impairment losses (3,366) (64) (3,430)
Operating loss before tax (2,639) (64) (2,703)
Tax charge (35) 12 (23)
Loss from continuing operations (2,674) (52) (2,726)
Loss for the year (1,133) (52) (1,185)
Loss attributable to ordinary shareholders (1,927) (52) (1,979)
There are no adjustments to the income statement in 2014 and 2013. The adjustment in 2015 reduced basic and diluted earnings per
ordinary share by 0.5p.
Consolidated statement of comprehensive income 2015 2014 2013
Under As previously As previously previous policy Adjustment As published reported Adjustment Restated reported Adjustment Restated
£m £m £m £m £m £m £m £m £m
Loss for year (1,133) (52) (1,185) (2,711) — (2,711) (8,477) — (8,477)
Gain/(loss) on remeasurement
of retirement benefit schemes 1,140 (1,213) (73) (108) (1,749) (1,857) 446 (54) 392
Tax (147) 453 306 (36) 350 314 (246) 9 (237)
Total comprehensive loss after tax (1,869) (812) (2,681) (783) (1,399) (2,182) (10,189) (45) (10,234)
Accounting policies
268
Consolidated balance sheet 2015 2014 2013
Under As previously As previously
previous policy Adjustment As published reported Adjustment Restated reported Adjustment Restated £m £m £m £m £m £m £m £m £m
Deferred tax assets 1,795 836 2,631 1,540 371 1,911 3,478 21 3,499
Prepayments, accrued income
and other assets 4,391 (149) 4,242 5,878 (115) 5,763 7,614 (77) 7,537
Retirement benefit liabilities 807 2,982 3,789 2,579 1,739 4,318 3,210 28 3,238
Owners' equity 55,726 (2,295) 53,431 57,246 (1,483) 55,763 58,742 (84) 58,658
Consolidated statement of changes in equity 2015 2014 2013
Under As previously As previously previous policy Adjustment As published reported Adjustment Restated reported Adjustment Restated
£m £m £m £m £m £m £m £m £m
Retained earnings At 1 January (2,518) (1,483) (4,001) 867 (84) 783 10,596 (39) 10,557
(Loss)/profit attributable to ordinary
shareholders and other equity owners - continuing operations (2,749) (52) (2,801) 756 — 756 (9,118) — (9,118)
Gain/(loss) on remeasurement
of retirement benefit schemes
- gross 1,146 (1,213) (67) (108) (1,749) (1,857) 446 (54) 392
- tax (147) 453 306 (36) 350 314 (246) 9 (237)
At 31 December (1,725) (2,295) (4,020) (2,518) (1,483) (4,001) 867 (84) 783
The Group adopted a number of new and revised IFRSs effective
1 January 2015:
IAS 19 ‘Defined Benefit Plans: Employee Contributions’ was
issued in November 2013. This amendment distinguishes the
accounting for employee contributions that are related to service
from those that are independent of service.
Annual Improvements to IFRS 2010 - 2012 and 2011 - 2013
cycles were issued in December 2013 making a number of minor
amendments to IFRS.
The implementation of these requirements has not had a material
effect on the Group’s accounts.
2. Basis of consolidation
The consolidated accounts incorporate the financial statements
of the company and entities (including certain structured entities)
that are controlled by the Group. The Group controls another
entity (a subsidiary) when it is exposed, or has rights, to variable
returns from its involvement with that entity and has the ability to
affect those returns through its power over the other entity; power
generally arises from holding a majority of voting rights. On
acquisition of a subsidiary, its identifiable assets, liabilities and
contingent liabilities are included in the consolidated accounts at
their fair value. A subsidiary is included in the consolidated
financial statements from the date it is controlled by the Group
until the date the Group ceases to control it through a sale or a
significant change in circumstances. Changes in the Group’s
interest in a subsidiary that do not result in the Group ceasing to
control that subsidiary are accounted for as equity transactions.
All intergroup balances, transactions, income and expenses are
eliminated on consolidation. The consolidated accounts are
prepared under uniform accounting policies.
3. Revenue recognition
Interest income on financial assets that are classified as loans
and receivables, available-for-sale or held-to-maturity and
interest expense on financial liabilities other than those measured
at fair value are determined using the effective interest method.
The effective interest method is a method of calculating the
amortised cost of a financial asset or financial liability (or group of
financial assets or liabilities) and of allocating the interest income
or interest expense over the expected life of the asset or liability.
The effective interest rate is the rate that exactly discounts
estimated future cash flows to the instrument's initial carrying
amount. Calculation of the effective interest rate takes into
account fees payable or receivable that are an integral part of the
instrument's yield, premiums or discounts on acquisition or issue,
early redemption fees and transaction costs. All contractual terms
of a financial instrument are considered when estimating future
cash flows.
Financial assets and financial liabilities held for trading or
designated as at fair value through profit or loss are recorded at
fair value. Changes in fair value are recognised in profit or loss.

Accounting policies
269
Fees in respect of services are recognised as the right to
consideration accrues through the provision of the service to the
customer. The arrangements are generally contractual and the
cost of providing the service is incurred as the service is
rendered. The price is usually fixed and always determinable.
The application of this policy to significant fee types is outlined
below.
Payment services - this comprises income received for payment
services including cheques cashed, direct debits, Clearing House
Automated Payments (the UK electronic settlement system) and
BACS payments (the automated clearing house that processes
direct debits and direct credits). These are generally charged on
a per transaction basis. The income is earned when the payment
or transaction occurs. Charges for payment services are usually
debited to the customer's account monthly or quarterly in arrears.
Income is accrued at period end for services provided but not yet
charged.
Credit and debit card fees - fees from card business include:
• Interchange received: as issuer, the Group receives a fee
(interchange) each time a cardholder purchases goods and
services. The Group also receives interchange fees from
other card issuers for providing cash advances through its
branch and automated teller machine networks. These fees
are accrued once the transaction has taken place.
• Periodic fees payable by a credit card or debit card holder
are deferred and taken to profit or loss over the period of the
service.
Lending (credit facilities) - commitment and utilisation fees are
determined as a percentage of the outstanding facility. If it is
unlikely that a specific lending arrangement will be entered into,
such fees are taken to profit or loss over the life of the facility
otherwise they are deferred and included in the effective interest
rate on the loan.
Brokerage fees - in respect of securities, foreign exchange,
futures or options transactions entered into on behalf of a
customer are recognised as income on execution of a significant
act.
Trade finance - income from the provision of trade finance is
recognised over the term of the finance unless specifically related
to a significant act, in which case income is recognised when the
act is executed.
Investment management - fees charged for managing
investments are recognised as revenue as the services are
provided. Incremental costs that are directly attributable to
securing an investment management contract are deferred and
charged as expense as the related revenue is recognised.
4. Assets held for sale and discontinued operations
A non-current asset (or disposal group) is classified as held for
sale if the Group will recover its carrying amount principally
through a sale transaction rather than through continuing use. A
non-current asset (or disposal group) classified as held for sale is
measured at the lower of its carrying amount and fair value less
costs to sell. If the asset (or disposal group) is acquired as part of
a business combination it is initially measured at fair value less
costs to sell.
Assets and liabilities of disposal groups classified as held for sale
and non-current assets classified as held for sale are shown
separately on the face of the balance sheet.
The results of discontinued operations - comprising the post-tax
profit or loss of discontinued operations and the post-tax gain or
loss recognised either on measurement to fair value less costs to
sell or on disposal of the discontinued operation - are shown as a
single amount on the face of the income statement; an analysis
of this amount is presented in Note 18 on the accounts. A
discontinued operation is a cash generating unit or a group of
cash generating units that either has been disposed of, or is
classified as held for sale, and (a) represents a separate major
line of business or geographical area of operations, (b) is part of
a single co-ordinated plan to dispose of a separate major line of
business or geographical area of operations or (c) is a subsidiary
acquired exclusively with a view to resale.
5. Employee benefits
Short-term employee benefits, such as salaries, paid absences,
and other benefits are accounted for on an accruals basis over
the period in which the employees provide the related services.
Employees may receive variable compensation satisfied by cash,
by debt instruments issued by the Group or by RBSG shares.
The treatment of share-based compensation is set out in
Accounting policy 25. Variable compensation that is settled in
cash or debt instruments is charged to profit or loss over the
period from the start of the year to which the variable
compensation relates to the expected settlement date taking
account of forfeiture and clawback criteria.
The Group provides post-retirement benefits in the form of
pensions and healthcare plans to eligible employees.
Contributions to defined contribution pension schemes are
recognised in profit or loss when payable.
For defined benefit schemes, the defined benefit obligation is
measured on an actuarial basis using the projected unit credit
method and discounted at a rate determined by reference to
market yields at the end of the reporting period on high quality
corporate bonds of equivalent term and currency to the scheme
liabilities. Scheme assets are measured at their fair value. The
difference between scheme assets and scheme liabilities - the
net defined benefit asset or liability - is recognised in the balance
sheet. A defined benefit asset is limited to the present value of
any economic benefits available to the Group in the form of
refunds from the plan or reduced contributions to it.
The charge to profit or loss for pension costs (recorded in
operating expenses) comprises:
• the current service cost
• interest, computed at the rate used to discount scheme
liabilities, on the net defined benefit liability or asset
• past service cost resulting from a scheme amendment or
curtailment
• gains or losses on settlement.
Accounting policies
270
A curtailment occurs when the Group significantly reduces the
number of employees covered by a plan. A plan amendment
occurs when the Group introduces, or withdraws, a defined
benefit plan or changes the benefits payable under an existing
defined benefit plan. Past service cost may be either positive
(when benefits are introduced or changed so that the present
value of the defined benefit obligation increases) or negative
(when benefits are withdrawn or changed so that the present
value of the defined benefit obligation decreases). A settlement is
a transaction that eliminates all further obligation for part or all of
the benefits.
Actuarial gains and losses (i.e. gains or and losses on re-
measuring the net defined benefit asset or liability) are
recognised in other comprehensive income in full in the period in
which they arise.
6. Intangible assets and goodwill
Intangible assets acquired by the Group are stated at cost less
accumulated amortisation and impairment losses. Amortisation is
charged to profit or loss over the assets' estimated economic
lives using methods that best reflect the pattern of economic
benefits and is included in Depreciation and amortisation. These
estimated useful economic lives are:
Computer software 3 to 12 years
Other acquired intangibles 5 to 10 years
Expenditure on internally generated goodwill and brands is
written-off as incurred. Direct costs relating to the development of
internal-use computer software are capitalised once technical
feasibility and economic viability have been established. These
costs include payroll, the costs of materials and services, and
directly attributable overheads. Capitalisation of costs ceases
when the software is capable of operating as intended. During
and after development, accumulated costs are reviewed for
impairment against the benefits that the software is expected to
generate. Costs incurred prior to the establishment of technical
feasibility and economic viability are expensed as incurred as are
all training costs and general overheads. The costs of licences to
use computer software that are expected to generate economic
benefits beyond one year are also capitalised.
Intangible assets include goodwill arising on the acquisition of
subsidiaries and joint ventures. Goodwill on the acquisition of a
subsidiary is the excess of the fair value of the consideration
transferred, the fair value of any existing interest in the subsidiary
and the amount of any non-controlling interest measured either at
fair value or at its share of the subsidiary’s net assets over the
Group's interest in the net fair value of the subsidiary’s
identifiable assets, liabilities and contingent liabilities. Goodwill
arises on the acquisition of a joint venture when the cost of
investment exceeds the Group’s share of the net fair value of the
joint venture’s identifiable assets and liabilities. Goodwill is
measured at initial cost less any subsequent impairment losses.
Goodwill arising on the acquisition of associates is included
within their carrying amounts. The gain or loss on the disposal of
a subsidiary, associate or joint venture includes the carrying
value of any related goodwill.
7. Property, plant and equipment
Items of property, plant and equipment (except investment
property - see Accounting policy 9) are stated at cost less
accumulated depreciation and impairment losses. Where an item
of property, plant and equipment comprises major components
having different useful lives, these are accounted for separately.
Depreciation is charged to profit or loss on a straight-line basis so
as to write-off the depreciable amount of property, plant and
equipment (including assets owned and let on operating leases)
over their estimated useful lives. The depreciable amount is the
cost of an asset less its residual value. Freehold land is not
depreciated.
The estimated useful lives of the Group’s property, plant and
equipment are:
Freehold buildings 50 years
Long leasehold property (leases
with more than 50 years to run) 50 years
Short leaseholds unexpired period of the
lease
Property adaptation costs 10 to 15 years
Computer equipment up to 5 years
Other equipment 4 to 15 years
The residual value and useful life of property, plant and
equipment are reviewed at each balance sheet date and updated
for any changes to previous estimates.
8. Impairment of intangible assets and property, plant and
equipment
At each reporting date, the Group assesses whether there is any
indication that its intangible assets, or property, plant and
equipment are impaired. If any such indication exists, the Group
estimates the recoverable amount of the asset and the
impairment loss if any. Goodwill is tested for impairment annually
or more frequently if events or changes in circumstances indicate
that it might be impaired.
If an asset does not generate cash flows that are independent
from those of other assets or groups of assets, the recoverable
amount is determined for the cash-generating unit to which the
asset belongs. A cash-generating unit is the smallest identifiable
group of assets that generates cash inflows that are largely
independent of the cash inflows from other assets or groups of
assets. For the purposes of impairment testing, goodwill acquired
in a business combination is allocated to each of the Group’s
cash-generating units or groups of cash-generating units
expected to benefit from the combination. The recoverable
amount of an asset or cash-generating unit is the higher of its fair
value less cost to sell and its value in use. Value in use is the
present value of future cash flows from the asset or cash-
generating unit discounted at a rate that reflects market interest
rates adjusted for risks specific to the asset or cash-generating
unit that have not been taken into account in estimating future
cash flows. If the recoverable amount of an intangible or tangible
asset is less than its carrying value, an impairment loss is
recognised immediately in profit or loss and the carrying value of
the asset reduced by the amount of the loss.
Accounting policies
271
A reversal of an impairment loss on intangible assets (excluding
goodwill) or property, plant and equipment is recognised as it
arises provided the increased carrying value is not greater than it
would have been had no impairment loss been recognised.
Impairment losses on goodwill are not reversed.
9. Investment property
Investment property comprises freehold and leasehold properties
that are held to earn rentals or for capital appreciation or both.
Investment property is not depreciated but is stated at fair value.
Fair value is based on current prices for similar properties in the
same location and condition. Any gain or loss arising from a
change in fair value is recognised in profit or loss. Rental income
from investment property is recognised on a straight-line basis
over the term of the lease in Other operating income. Lease
incentives granted are recognised as an integral part of the total
rental income.
10. Foreign currencies
The Group's consolidated financial statements are presented in
sterling which is the functional currency of the company.
Group entities record transactions in foreign currencies in their
functional currency - the currency of the primary economic
environment in which they operate - at the foreign exchange rate
ruling at the date of the transaction. Monetary assets and
liabilities denominated in foreign currencies are translated into
the relevant functional currency at the foreign exchange rates
ruling at the balance sheet date. Foreign exchange differences
arising on the settlement of foreign currency transactions and
from the translation of monetary assets and liabilities are reported
in income from trading activities except for differences arising on
cash flow hedges and hedges of net investments in foreign
operations (see Accounting policy 23).
Non-monetary items denominated in foreign currencies that are
stated at fair value are translated into the relevant functional
currency at the foreign exchange rates ruling at the dates the
values are determined. Translation differences arising on non-
monetary items measured at fair value are recognised in profit or
loss except for differences arising on available-for-sale non-
monetary financial assets, for example equity shares, which are
recognised in other comprehensive income unless the asset is
the hedged item in a fair value hedge.
Assets and liabilities of foreign operations, including goodwill and
fair value adjustments arising on acquisition, are translated into
sterling at foreign exchange rates ruling at the balance sheet
date. Income and expenses of foreign operations are translated
into sterling at average exchange rates unless these do not
approximate to the foreign exchange rates ruling at the dates of
the transactions. Foreign exchange differences arising on the
translation of a foreign operation are recognised in other
comprehensive income. The amount accumulated in equity is
reclassified from equity to profit or loss on disposal of a foreign
operation.
11. Leases
As lessor
Contracts with customers to lease assets are classified as
finance leases if they transfer substantially all the risks and
rewards of ownership of the asset to the customer; all other
contracts with customers to lease assets are classified as
operating leases.
Finance lease receivables are included in the balance sheet,
within Loans and advances to customers, at the amount of the
net investment in the lease being the minimum lease payments
and any unguaranteed residual value discounted at the interest
rate implicit in the lease. Finance lease income is allocated to
accounting periods so as to give a constant periodic rate of return
before tax on the net investment and included in Interest
receivable. Unguaranteed residual values are subject to regular
review; if there is a reduction in their value, income allocation is
revised and any reduction in respect of amounts accrued is
recognised immediately.
Rental income from operating leases is recognised in income on
a straight-line basis over the lease term unless another
systematic basis better represents the time pattern of the asset’s
use. Operating lease assets are included within Property, plant
and equipment and depreciated over their useful lives (see
Accounting policy 7). Operating lease rentals receivable are
included in Other operating income.
As lessee
The Group’s contracts to lease assets are principally operating
leases. Operating lease rental expense is included in Premises
and equipment costs and recognised as an expense on a
straight-line basis over the lease term unless another systematic
basis better represents the benefit to the Group.
12. Provisions
The Group recognises a provision for a present obligation
resulting from a past event when it is more likely than not that it
will be required to transfer economic benefits to settle the
obligation and the amount of the obligation can be estimated
reliably.
Provision is made for restructuring costs, including the costs of
redundancy, when the Group has a constructive obligation to
restructure. An obligation exists when the Group has a detailed
formal plan for the restructuring and has raised a valid
expectation in those affected by starting to implement the plan or
by announcing its main features.
If the Group has a contract that is onerous, it recognises the
present obligation under the contract as a provision. An onerous
contract is one where the unavoidable costs of meeting the
Group’s contractual obligations exceed the expected economic
benefits. When the Group vacates a leasehold property, a
provision is recognised for the costs under the lease less any
expected economic benefits (such as rental income).
Accounting policies
272
Contingent liabilities are possible obligations arising from past
events, whose existence will be confirmed only by uncertain
future events, or present obligations arising from past events that
are not recognised because either an outflow of economic
benefits is not probable or the amount of the obligation cannot be
reliably measured. Contingent liabilities are not recognised but
information about them is disclosed unless the possibility of any
outflow of economic benefits in settlement is remote.
13. Tax
Income tax expense or income, comprising current tax and
deferred tax, is recorded in the income statement except income
tax on items recognised outside profit or loss which is credited or
charged to other comprehensive income or to equity as
appropriate.
Current tax is income tax payable or recoverable in respect of the
taxable profit or loss for the year arising in profit or loss, other
comprehensive income or equity. Provision is made for current
tax at rates enacted or substantively enacted at the balance
sheet date.
Deferred tax is the tax expected to be payable or recoverable in
respect of temporary differences between the carrying amount of
an asset or liability for accounting purposes and its carrying
amount for tax purposes. Deferred tax liabilities are generally
recognised for all taxable temporary differences and deferred tax
assets are recognised to the extent that it is probable that they
will be recovered. Deferred tax is not recognised on temporary
differences that arise from initial recognition of an asset or a
liability in a transaction (other than a business combination) that
at the time of the transaction affects neither accounting nor
taxable profit or loss. Deferred tax is calculated using tax rates
expected to apply in the periods when the assets will be realised
or the liabilities settled, based on tax rates and laws enacted, or
substantively enacted, at the balance sheet date.
Deferred tax assets and liabilities are offset where the Group has
a legally enforceable right to offset and where they relate to
income taxes levied by the same taxation authority either on an
individual Group company or on Group companies in the same
tax group that intend, in future periods, to settle current tax
liabilities and assets on a net basis or on a gross basis
simultaneously.
14. Financial assets
On initial recognition, financial assets are classified into held-to-
maturity investments; held-for-trading; designated as at fair value
through profit or loss; loans and receivables; or available-for-sale
financial assets. Regular way purchases of financial assets
classified as loans and receivables are recognised on settlement
date; all other regular way transactions in financial assets are
recognised on trade date.
Held-to-maturity investments - a financial asset may be classified
as a held-to-maturity investment only if it has fixed or
determinable payments, a fixed maturity and the Group has the
positive intention and ability to hold to maturity. Held-to-maturity
investments are initially recognised at fair value plus directly
related transaction costs. They are subsequently measured at
amortised cost using the effective interest method (see
Accounting policy 3) less any impairment losses.
Held-for-trading - a financial asset is classified as held-for-trading
if it is acquired principally for sale in the near term, or forms part
of a portfolio of financial instruments that are managed together
and for which there is evidence of short-term profit taking, or it is
a derivative (not in a qualifying hedge relationship). Held-for-
trading financial assets are recognised at fair value with
transaction costs being recognised in profit or loss. Subsequently
they are measured at fair value. Gains and losses on held-for-
trading financial assets are recognised in profit or loss as they
arise.
Designated as at fair value through profit or loss - financial assets
may be designated as at fair value through profit or loss only if
such designation (a) eliminates or significantly reduces a
measurement or recognition inconsistency; or (b) applies to a
group of financial assets, financial liabilities or both, that the
Group manages and evaluates on a fair value basis; or (c) relates
to an instrument that contains an embedded derivative which is
not evidently closely related to the host contract. Financial assets
that the Group designates on initial recognition as being at fair
value through profit or loss are recognised at fair value, with
transaction costs being recognised in profit or loss, and are
subsequently measured at fair value. Gains and losses are
recognised in profit or loss as they arise.
Loans and receivables - non-derivative financial assets with fixed
or determinable repayments that are not quoted in an active
market are classified as loans and receivables, except those that
are classified as available-for-sale or as held-for-trading, or
designated as at fair value through profit or loss. Loans and
receivables are initially recognised at fair value plus directly
related transaction costs. They are subsequently measured at
amortised cost using the effective interest method (see
Accounting policy 3) less any impairment losses.
Available-for-sale financial assets - financial assets that are not
classified as held-to-maturity; held-for-trading; designated as at
fair value through profit or loss; or loans and receivables are
classified as available-for-sale. Financial assets can be
designated as available-for-sale on initial recognition. Available-
for-sale financial assets are initially recognised at fair value plus
directly related transaction costs. They are subsequently
measured at fair value. Unquoted equity investments whose fair
value cannot be measured reliably are carried at cost and
classified as available-for-sale financial assets. Impairment
losses and exchange differences resulting from retranslating the
amortised cost of foreign currency monetary available-for-sale
financial assets are recognised in profit or loss together with
interest calculated using the effective interest method (see
Accounting policy 3) as are gains and losses attributable to the
hedged risk on available-for-sale financial assets that are hedged
items in fair value hedges (see Accounting policy 23). Other
changes in the fair value of available-for-sale financial assets and
any related tax are reported in other comprehensive income until
disposal, when the cumulative gain or loss is reclassified from
equity to profit or loss.
Accounting policies
273
Reclassifications - held-for-trading and available-for-sale financial
assets that meet the definition of loans and receivables (non-
derivative financial assets with fixed or determinable payments
that are not quoted in an active market) may be reclassified to
loans and receivables if the Group has the intention and ability to
hold the financial asset for the foreseeable future or until maturity.
The Group typically regards the foreseeable future for this
purpose as twelve months from the date of reclassification.
Additionally, held-for-trading financial assets that do not meet the
definition of loans and receivables may, in rare circumstances, be
transferred to available-for-sale financial assets or to held-to-
maturity investments. Reclassifications are made at fair value.
This fair value becomes the asset's new cost or amortised cost
as appropriate. Gains and losses recognised up to the date of
reclassification are not reversed.
Fair value - the Group’s approach to determining the fair value of
financial instruments measured at fair value is set out in the
section of Critical accounting policies and key sources of
estimation uncertainty entitled Fair value - financial instruments;
further details are given in Note 9.
15. Impairment of financial assets
The Group assesses at each balance sheet date whether there is
any objective evidence that a financial asset or group of financial
assets classified as held-to-maturity, as available-for-sale or as
loans and receivables is impaired. A financial asset or group of
financial assets is impaired and an impairment loss incurred if
there is objective evidence that an event or events since initial
recognition of the asset have adversely affected the amount or
timing of future cash flows from the asset.
Financial assets carried at amortised cost - if there is objective
evidence that an impairment loss on a financial asset or group of
financial assets classified as loans and receivables or as held-to-
maturity investments has been incurred, the Group measures the
amount of the loss as the difference between the carrying amount
of the asset or group of assets and the present value of
estimated future cash flows from the asset or group of assets
discounted at the effective interest rate of the instrument at initial
recognition. For collateralised loans and receivables, estimated
future cash flows include cash flows that may result from
foreclosure less the costs of obtaining and selling the collateral,
whether or not foreclosure is probable.
Where, in the course of the orderly realisation of a loan, it is
exchanged for equity shares or property, the exchange is
accounted for as the sale of the loan and the acquisition of equity
securities or investment property. Where the Group’s interest in
equity shares following the exchange is such that the Group
controls an entity, that entity is consolidated.
Impairment losses are assessed individually for financial assets
that are individually significant and individually or collectively for
assets that are not individually significant. In making collective
impairment assessments, financial assets are grouped into
portfolios on the basis of similar risk characteristics. Future cash
flows from these portfolios are estimated on the basis of the
contractual cash flows and historical loss experience for assets
with similar credit risk characteristics.
Historical loss experience is adjusted, on the basis of observable
data, to reflect current conditions not affecting the period of
historical experience. Impairment losses are recognised in profit
or loss and the carrying amount of the financial asset or group of
financial assets reduced by establishing an allowance for
impairment losses. If, in a subsequent period, the amount of the
impairment loss reduces and the reduction can be ascribed to an
event after the impairment was recognised, the previously
recognised loss is reversed by adjusting the allowance. Once an
impairment loss has been recognised on a financial asset or
group of financial assets, interest income is recognised on the
carrying amount using the rate of interest at which estimated
future cash flows were discounted in measuring impairment.
Impaired loans and receivables are written off, i.e. the impairment
provision is applied in writing down the loan's carrying value
partially or in full, when the Group concludes that there is no
longer any realistic prospect of recovery of part or all of the loan.
For loans that are individually assessed for impairment, the
timing of write off is determined on a case-by-case basis. Such
loans are reviewed regularly and write off will be prompted by
bankruptcy, insolvency, renegotiation and similar events.
The typical time frames from initial impairment to write off for the
Group’s collectively-assessed portfolios are:
• Retail mortgages: write off usually occurs within five years,
or when an account is closed if earlier.
• Credit cards: the irrecoverable amount is written off after 12
months; three years later any remaining amounts
outstanding are written off.
• Overdrafts and other unsecured loans: write off occurs
within six years.
• Business and commercial loans: write offs of commercial
loans are determined in the light of individual circumstances;
the period does not exceed five years. Business loans are
generally written off within five years.
Amounts recovered after a loan has been written off are credited
to the loan impairment charge for the period in which they are
received.
Financial assets carried at fair value - when a decline in the fair
value of a financial asset classified as available-for-sale has been
recognised directly in other comprehensive income and there is
objective evidence that it is impaired, the cumulative loss is
reclassified from equity to profit or loss. The loss is measured as
the difference between the amortised cost (including any hedge
accounting adjustments) of the financial asset and its current fair
value. Impairment losses on available-for-sale equity instruments
are not reversed through profit or loss, but those on available-for-
sale debt instruments are reversed, if there is an increase in fair
value that is objectively related to a subsequent event.

Accounting policies
274
16. Financial liabilities
Financial liabilities are recognised initially at fair value and
classified into held-for-trading; designated as at fair value through
profit or loss; or amortised cost. Issues of financial liabilities
measured at amortised cost are recognised on settlement date;
all other regular way transactions in financial liabilities are
recognised on trade date.
Held-for-trading - a financial liability is classified as held-for-
trading if it is incurred principally for repurchase in the near term,
or forms part of a portfolio of financial instruments that are
managed together and for which there is evidence of short-term
profit taking, or it is a derivative (not in a qualifying hedge
relationship). Held-for-trading financial liabilities are recognised at
fair value with transaction costs being recognised in profit or loss.
Subsequently they are measured at fair value. Gains and losses
are recognised in profit or loss as they arise.
Designated as at fair value through profit or loss - financial
liabilities may be designated as at fair value through profit or loss
only if such designation (a) eliminates or significantly reduces a
measurement or recognition inconsistency; or (b) applies to a
group of financial assets, financial liabilities or both that the
Group manages and evaluates on a fair value basis; or (c) relates
to an instrument that contains an embedded derivative which is
not evidently closely related to the host contract.
Financial liabilities that the Group designates on initial recognition
as being at fair value through profit or loss are recognised at fair
value, with transaction costs being recognised in profit or loss,
and are subsequently measured at fair value. Gains and losses
are recognised in profit or loss as they arise.
Financial liabilities designated as at fair value through profit or
loss principally comprise structured liabilities issued by the
Group: designation significantly reduces the measurement
inconsistency between these liabilities and the related derivatives
carried at fair value.
Amortised cost - all other financial liabilities are measured at
amortised cost using the effective interest method (see
Accounting policy 3).
Fair value - the Group’s approach to determining the fair value of
financial instruments measured at fair value is set out in the
section of Critical accounting policies and key sources of
estimation uncertainty entitled Fair value - financial instruments;
further details are given in Note 9.
17. Financial guarantee contracts
Under a financial guarantee contract, the Group, in return for a
fee, undertakes to meet a customer’s obligations under the terms
of a debt instrument if the customer fails to do so. A financial
guarantee is recognised as a liability; initially at fair value and, if
not designated as at fair value through profit or loss,
subsequently at the higher of its initial value less cumulative
amortisation and any provision under the contract measured in
accordance with Accounting policy 12. Amortisation is calculated
so as to recognise fees receivable in profit or loss over the period
of the guarantee.
18. Loan commitments
Provision is made for loan commitments, other than those
classified as held-for-trading, if it is probable that the facility will
be drawn and the resulting loan will be recognised at an amount
less than the cash advanced. Syndicated loan commitments in
excess of the level of lending under the commitment approved for
retention by the Group are classified as held-for-trading and
measured at fair value.
19. Derecognition
A financial asset is derecognised when the contractual right to
receive cash flows from the asset has expired or when it has
been transferred and the transfer qualifies for derecognition. A
transfer requires that the Group either (a) transfers the
contractual rights to receive the asset's cash flows; or (b) retains
the right to the asset's cash flows but assumes a contractual
obligation to pay those cash flows to a third party. After a
transfer, the Group assesses the extent to which it has retained
the risks and rewards of ownership of the transferred asset. The
asset remains on the balance sheet if substantially all the risks
and rewards have been retained. It is derecognised if
substantially all the risks and rewards have been transferred. If
substantially all the risks and rewards have been neither retained
nor transferred, the Group assesses whether or not it has
retained control of the asset. If the Group has retained control of
the asset, it continues to recognise the asset to the extent of its
continuing involvement; if the Group has not retained control of
the asset, it is derecognised.
A financial liability is removed from the balance sheet when the
obligation is discharged, or is cancelled, or expires. On the
redemption or settlement of debt securities (including
subordinated liabilities) issued by the Group, the Group
derecognises the debt instrument and records a gain or loss
being the difference between the debt's carrying amount and the
cost of redemption or settlement. The same treatment applies
where the debt is exchanged for a new debt issue that has terms
substantially different from those of the existing debt. The
assessment of whether the terms of the new debt instrument are
substantially different takes into account qualitative and
quantitative characteristics including a comparison of the present
value of the cash flows under the new terms with the present
value of the remaining cash flows of the original debt issue
discounted at the effective interest rate of the original debt issue.
20. Sale and repurchase transactions
Securities subject to a sale and repurchase agreement under
which substantially all the risks and rewards of ownership are
retained by the Group continue to be shown on the balance sheet
and the sale proceeds recorded as a financial liability. Securities
acquired in a reverse sale and repurchase transaction under
which the Group is not exposed to substantially all the risks and
rewards of ownership are not recognised on the balance sheet
and the consideration paid is recorded as a financial asset.
Securities borrowing and lending transactions are usually
secured by cash or securities advanced by the borrower.
Borrowed securities are not recognised on the balance sheet or
lent securities derecognised.

Accounting policies
275
Cash collateral given or received is treated as a loan or deposit;
collateral in the form of securities is not recognised. However,
where securities borrowed are transferred to third parties, a
liability for the obligation to return the securities to the stock
lending counterparty is recorded.
21. Netting
Financial assets and financial liabilities are offset and the net
amount presented in the balance sheet when, and only when, the
Group currently has a legally enforceable right to set off the
recognised amounts and it intends either to settle on a net basis
or to realise the asset and settle the liability simultaneously. The
Group is party to a number of arrangements, including master
netting agreements, that give it the right to offset financial assets
and financial liabilities but where it does not intend to settle the
amounts net or simultaneously and therefore the assets and
liabilities concerned are presented gross.
22. Capital instruments
The Group classifies a financial instrument that it issues as a
liability if it is a contractual obligation to deliver cash or another
financial asset, or to exchange financial assets or financial
liabilities on potentially unfavourable terms and as equity if it
evidences a residual interest in the assets of the Group after the
deduction of liabilities. The components of a compound financial
instrument issued by the Group are classified and accounted for
separately as financial assets, financial liabilities or equity as
appropriate.
Incremental costs and related tax that are directly attributable to
an equity transaction are deducted from equity.
The consideration for any ordinary shares of the company
purchased by the Group (treasury shares) is deducted from
equity. On the cancellation of treasury shares their nominal value
is removed from equity and any excess of consideration over
nominal value is treated in accordance with the capital
maintenance provisions of the Companies Act. On the sale or
reissue of treasury shares the consideration received and related
tax are credited to equity, net of any directly attributable
incremental costs.
23. Derivatives and hedging
Derivative financial instruments are initially recognised, and
subsequently measured, at fair value. The Group’s approach to
determining the fair value of financial instruments is set out in the
section of Critical accounting policies and key sources of
estimation uncertainty entitled Fair value - financial instruments;
further details are given in Note 9.
A derivative embedded in a contract is accounted for as a stand-
alone derivative if its economic characteristics are not closely
related to the economic characteristics of the host contract;
unless the entire contract is measured at fair value with changes
in fair value recognised in profit or loss.
Gains and losses arising from changes in the fair value of
derivatives that are not the hedging instrument in a qualifying
hedge are recognised as they arise in profit or loss. Gains and
losses are recorded in Income from trading activities except for
gains and losses on those derivatives that are managed together
with financial instruments designated at fair value; these gains
and losses are included in Other operating income.
The Group enters into three types of hedge relationship: hedges
of changes in the fair value of a recognised asset or liability or
unrecognised firm commitment (fair value hedges); hedges of the
variability in cash flows from a recognised asset or liability or a
highly probable forecast transaction (cash flow hedges); and
hedges of the net investment in a foreign operation.
Hedge relationships are formally designated and documented at
inception. The documentation identifies the hedged item and the
hedging instrument and details the risk that is being hedged and
the way in which effectiveness will be assessed at inception and
during the period of the hedge. If the hedge is not highly effective
in offsetting changes in fair values or cash flows attributable to
the hedged risk, consistent with the documented risk
management strategy, hedge accounting is discontinued. Hedge
accounting is also discontinued if the Group revokes the
designation of a hedge relationship.
Fair value hedge - in a fair value hedge, the gain or loss on the
hedging instrument is recognised in profit or loss. The gain or
loss on the hedged item attributable to the hedged risk is
recognised in profit or loss and, where the hedged item is
measured at amortised cost, adjusts the carrying amount of the
hedged item. Hedge accounting is discontinued if the hedge no
longer meets the criteria for hedge accounting; or if the hedging
instrument expires or is sold, terminated or exercised; or if hedge
designation is revoked. If the hedged item is one for which the
effective interest rate method is used, any cumulative adjustment
is amortised to profit or loss over the life of the hedged item using
a recalculated effective interest rate.
Cash flow hedge - in a cash flow hedge, the effective portion of
the gain or loss on the hedging instrument is recognised in other
comprehensive income and the ineffective portion in profit or
loss. When the forecast transaction results in the recognition of a
financial asset or financial liability, the cumulative gain or loss is
reclassified from equity to profit or loss in the same periods in
which the hedged forecast cash flows affect profit or loss.
Otherwise the cumulative gain or loss is removed from equity and
recognised in profit or loss at the same time as the hedged
transaction. Hedge accounting is discontinued if the hedge no
longer meets the criteria for hedge accounting; if the hedging
instrument expires or is sold, terminated or exercised; if the
forecast transaction is no longer expected to occur; or if hedge
designation is revoked. On the discontinuance of hedge
accounting (except where a forecast transaction is no longer
expected to occur), the cumulative unrealised gain or loss is
reclassified from equity to profit or loss when the hedged cash
flows occur or, if the forecast transaction results in the recognition
of a financial asset or financial liability, when the hedged forecast
cash flows affect profit or loss. Where a forecast transaction is no
longer expected to occur, the cumulative unrealised gain or loss
is reclassified from equity to profit or loss immediately.
Accounting policies
276
Hedge of net investment in a foreign operation - in the hedge of a
net investment in a foreign operation, the portion of foreign
exchange differences arising on the hedging instrument
determined to be an effective hedge is recognised in other
comprehensive income. Any ineffective portion is recognised in
profit or loss. Non-derivative financial liabilities as well as
derivatives may be the hedging instrument in a net investment
hedge. On disposal or partial disposal of a foreign operation, the
amount accumulated in equity is reclassified from equity to profit
or loss.
24. Associates and joint ventures
An associate is an entity over which the Group has significant
influence. A joint venture one which it controls jointly with other
parties. Investments in associates and interests in joint ventures
are recognised using the equity method. They are stated initially
at cost, including attributable goodwill, and subsequently adjusted
for post-acquisition changes in the Group’s share of net assets.
25. Share-based compensation
The Group operates a number of share-based compensation
schemes under which it awards RBSG shares and share options
to its employees. Such awards are generally subject to vesting
conditions: conditions that vary the amount of cash or shares to
which an employee is entitled. Vesting conditions include service
conditions (requiring the employee to complete a specified period
of service) and performance conditions (requiring the employee
to complete a specified period of service and specified
performance targets to be met). Other conditions to which an
award is subject are non-vesting conditions (such as a
requirement to save throughout the vesting period).
The cost of employee services received in exchange for an
award of shares or share options granted is measured by
reference to the fair value of the shares or share options on the
date the award is granted and takes into account non-vesting
conditions and market performance conditions (conditions related
to the market price of RBSG shares): an award is treated as
vesting irrespective of whether any market performance condition
or non-vesting condition is met. The fair value of options granted
is estimated using valuation techniques which incorporate
exercise price, term, risk-free interest rates, the current share
price and its expected volatility. The cost is expensed on a
straight-line basis over the vesting period (the period during
which all the specified vesting conditions must be satisfied) with a
corresponding increase in equity in an equity-settled award, or a
corresponding liability in a cash-settled award. The cost is
adjusted for vesting conditions (other than market performance
conditions) so as to reflect the number of shares or share options
that actually vest.
If an award is modified, the original cost continues to be
recognised as if there had been no modification. Where
modification increases the fair value of the award, this increase is
recognised as an expense over the modified vesting period. A
new award of shares or share options is treated as the
modification of a cancelled award if, on the date the new award is
granted, the Group identifies them as replacing the cancelled
award. The cancellation of an award through failure to meet non-
vesting conditions triggers an immediate expense for any
unrecognised element of the cost of an award.
26. Cash and cash equivalents
In the cash flow statement, cash and cash equivalents comprises
cash and deposits with banks with an original maturity of less
than three months together with short-term highly liquid
investments that are readily convertible to known amounts of
cash and subject to insignificant risk of change in value.
Critical accounting policies and key sources of estimation
uncertainty
The reported results of the Group are sensitive to the accounting
policies, assumptions and estimates that underlie the preparation
of its financial statements. UK company law and IFRS require the
directors, in preparing the Group's financial statements, to select
suitable accounting policies, apply them consistently and make
judgements and estimates that are reasonable and prudent. In
the absence of an applicable standard or interpretation, IAS 8
‘Accounting Policies, Changes in Accounting Estimates and
Errors’, requires management to develop and apply an
accounting policy that results in relevant and reliable information
in the light of the requirements and guidance in IFRS dealing with
similar and related issues and the IASB's ’Conceptual Framework
for Financial Reporting’. The judgements and assumptions
involved in the Group's accounting policies that are considered by
the Board to be the most important to the portrayal of its financial
condition are discussed below. The use of estimates,
assumptions or models that differ from those adopted by the
Group would affect its reported results.
(i) Pensions
The Group operates a number of defined benefit pension
schemes as described in Note 4 on the accounts. As described in
Accounting policy 5, the assets of the schemes are measured at
their fair value at the balance sheet date. Scheme liabilities are
measured using the projected unit credit method, which takes
account of projected earnings increases, using actuarial
assumptions that give the best estimate of the future cash flows
that will arise under the scheme liabilities. These cash flows are
discounted at the interest rate applicable to high-quality corporate
bonds of the same currency and term as the liabilities. Any
recognisable surplus or deficit of scheme assets over liabilities is
recorded in the balance sheet as an asset (surplus) or liability
(deficit).
In determining the value of scheme liabilities, financial and
demographic assumptions are made including price inflation,
pension increases, earnings growth and the longevity of scheme
members. A range of assumptions could be adopted in valuing
the schemes' liabilities. Different assumptions could significantly
alter the amount of the surplus or deficit recognised in the
balance sheet and the pension cost charged to the income
statement. The assumptions adopted for the Group's pension
schemes are set out in Note 4 on the accounts, together with
sensitivities of the balance sheet and income statement to
changes in those assumptions.
A pension asset of £215 million and a liability of £3,789 million
were recognised on the balance sheet at 31 December 2015
(2014 - asset £180 million, liability £4,318 million).

Accounting policies
277
(ii) Goodwill
The Group capitalises goodwill arising on the acquisition of
businesses, as discussed in Accounting policy 6. The carrying
value of goodwill as at 31 December 2015 was £5,558 million
(2014 - £6,264 million).
Goodwill is the excess of the cost of an acquired business over
the fair value of its net assets. Goodwill is not amortised but is
tested for impairment annually or more frequently if events or
changes in circumstances indicate that it might be impaired.
Impairment testing in accordance with Accounting policy 8 above
inherently involves a number of judgmental areas: the
preparation of cash flow forecasts for periods that are beyond the
normal requirements of management reporting; the assessment
of the discount rate appropriate to the business; estimation of the
fair value of cash-generating units; and the valuation of their
separable assets. The sensitivity of the assessment to changes
in assumptions is discussed in Note 15.
(iii) Provisions for liabilities
As set out in Note 20, at 31 December 2015 the Group
recognised provisions for liabilities in respect of Payment
Protection Insurance, £996 million (2014 - £799 million), foreign
exchange investigations, £306 million (2014 - £320 million), other
customer redress, £672 million (2014 - £580 million) and other
regulatory proceedings and litigation, £3,985 million (2014 -
£1,988 million). Provisions are liabilities of uncertain timing or
amount, and are recognised when there is a present obligation as
a result of a past event, the outflow of economic benefit is
probable and the outflow can be estimated reliably. Judgement is
involved in determining whether an obligation exists, and in
estimating the probability, timing and amount of any outflows.
Where the Group can look to another party such as an insurer to
pay some or all of the expenditure required to settle a provision,
any reimbursement is recognised when, and only when, it is
virtually certain that it will be received.
Payment Protection Insurance - the Group has established a
provision for redress payable in respect of the mis-selling of
Payment Protection Insurance policies. The provision is
management’s best estimate of the anticipated costs of redress
and related administration expenses. The determination of
appropriate assumptions to underpin the provision requires
significant judgement by management. The principal assumptions
underlying the provision together with sensitivities to changes in
those assumptions are given in Note 20.
Provisions for litigation - the Group and members of the Group
are party to legal proceedings in the United Kingdom, the United
States and other jurisdictions, arising out of their normal business
operations. The measurement and recognition of liabilities in
respect of litigation involves a high degree of management
judgement. Before the existence of a present obligation as the
result of a past event can be confirmed, numerous facts may
need to be established, involving extensive and time-consuming
discovery, and novel or unsettled legal questions addressed.
Once it is determined there is an obligation, assessing the
probability of economic outflows and estimating the amount of
any liability can be very difficult. In many proceedings, it is not
possible to determine whether any loss is probable or to estimate
the amount of any loss. Furthermore, for an individual matter,
there can be a wide range of possible outcomes and often it is
not practicable to quantify a range of such outcomes. The
Group’s outstanding litigation is periodically assessed in
consultation with external professional advisers, where
appropriate, to determine the likelihood of the Group incurring a
liability. A detailed description of the Group’s material legal
proceedings and a discussion of the nature of the associated
uncertainties are given in Note 30.
Tax contingencies - determining the Group’s income tax charge
and its provisions for income taxes necessarily involves a
significant degree of estimation and judgement. The tax
treatment of some transactions is uncertain and tax computations
are yet to be agreed with the tax authorities in a number of
jurisdictions. The Group recognises anticipated tax liabilities
based on all available evidence and, where appropriate, in the
light of external advice. Any difference between the final outcome
and the amounts provided will affect current and deferred income
tax assets and liabilities in the period when the matter is
resolved.
(iv) Deferred tax
The Group makes provision for deferred tax on temporary
differences where tax recognition occurs at a different time from
accounting recognition. Deferred tax assets of £2,631 million
were recognised as at 31 December 2015 (2014 - £1,911
million).
The Group has recognised deferred tax assets in respect of
losses, principally in the UK, and temporary differences. Deferred
tax assets are recognised in respect of unused tax losses and
other temporary differences to the extent that it is probable that
there will be future taxable profits against which the losses and
other temporary differences can be utilised. The Group has
considered their carrying value as at 31 December 2015 and
concluded that, based on management’s estimates, sufficient
taxable profits will be generated in future years to recover
recognised deferred tax assets. These estimates are based on
forecast performance and take into account the Group’s plans to
implement the UK ring-fencing regime and the resultant transfers
between members of the Group.
Deferred tax assets of £6,349 million (2014 - £5,738 million) have
not been recognised in respect of tax losses and other temporary
differences where the availability of future taxable profits is
uncertain. Further details about the Group’s deferred tax assets
are given in Note 21.
Accounting policies
278
(v) Loan impairment provisions
The Group's loan impairment provisions are established to
recognise incurred impairment losses in its portfolio of loans
classified as loans and receivables and carried at amortised cost
in accordance with Accounting policy 16. At 31 December 2015,
customer loan impairment provisions amounted to £7,118 million
(2014 - £17,460 million).
A loan is impaired when there is objective evidence that events
since the loan was granted have affected expected cash flows
from the loan. Such objective evidence, indicative that a
borrower’s financial condition has deteriorated, can include for
loans that are individually assessed: the non-payment of interest
or principal; debt renegotiation; probable bankruptcy or
liquidation; significant reduction in the value of any security;
breach of limits or covenants; and deteriorating trading
performance and, for collectively assessed portfolios: the
borrowers’ payment status and observable data about relevant
macroeconomic measures.
The impairment loss is the difference between the carrying value
of the loan and the present value of estimated future cash flows
at the loan's original effective interest rate.
There are two components to the Group's loan impairment
provisions: individual and collective.
Individual component - all impaired loans that exceed specific
thresholds are individually assessed for impairment. Individually
assessed loans principally comprise the Group's portfolio of
commercial loans to medium and large businesses. Impairment
losses are recognised as the difference between the carrying
value of the loan and the discounted value of management's best
estimate of future cash repayments and proceeds from any
security held. These estimates take into account the customer's
debt capacity and financial flexibility; the level and quality of its
earnings; the amount and sources of cash flows; the industry in
which the counterparty operates; and the realisable value of any
security held. Estimating the quantum and timing of future
recoveries involves significant judgement. The size of receipts
will depend on the future performance of the borrower and the
value of security, both of which will be affected by future
economic conditions; additionally, collateral may not be readily
marketable. The actual amount of future cash flows and the date
they are received may differ from these estimates and
consequently actual losses incurred may differ from those
recognised in these financial statements.
Collective component - this is made up of two elements: loan
impairment provisions for impaired loans that are below individual
assessment thresholds (collectively assessed provisions) and for
loan losses that have been incurred but have not been separately
identified at the balance sheet date (latent loss provisions).
Collectively assessed provisions are established on a portfolio
basis using a present value methodology taking into account the
level of arrears, security, past loss experience, credit scores and
defaults based on portfolio trends. The most significant factors in
establishing these provisions are the expected loss rates and the
related average life. These portfolios include mortgages, credit
card receivables and other personal lending. The future credit
quality of these portfolios is subject to uncertainties that could
cause actual credit losses to differ materially from reported loan
impairment provisions. These uncertainties include the economic
environment, notably interest rates and their effect on customer
spending, the unemployment level, payment behaviour and
bankruptcy trends. Latent loss provisions are held against
estimated impairment losses in the performing portfolio that have
yet to be identified as at the balance sheet date. To assess the
latent loss within its portfolios, the Group has developed
methodologies to estimate the time that an asset can remain
impaired within a performing portfolio before it is identified and
reported as such.
(vi) Fair value - financial instruments
In accordance with Accounting policies 14, 16 and 23, financial
instruments classified as held-for-trading or designated as at fair
value through profit or loss and financial assets classified as
available-for-sale are recognised in the financial statements at
fair value. All derivatives are measured at fair value.
Fair value is the price that would be received to sell an asset or
paid to transfer a liability in an orderly transaction between
market participants at the measurement date. A fair value
measurement takes into account the characteristics of the asset
or liability if market participants would take those characteristics
into account when pricing the asset or liability at the
measurement date. It also uses the assumptions that market
participants would use when pricing the asset or liability. In
determining fair value the Group maximises the use of relevant
observable inputs and minimises the use of unobservable inputs.
Where the Group manages a group of financial assets and
financial liabilities on the basis of its net exposure to either
market risks or credit risk, it measures the fair value of a group of
financial assets and financial liabilities on the basis of the price
that it would receive to sell a net long position (i.e. an asset) for a
particular risk exposure or to transfer a net short position (i.e. a
liability) for a particular risk exposure in an orderly transaction at
the measurement date under current market conditions.
Credit valuation adjustments are made when valuing derivative
financial assets to incorporate counterparty credit risk.
Adjustments are also made when valuing financial liabilities
measured at fair value to reflect the Group’s own credit standing.
Accounting policies
279
Where the market for a financial instrument is not active, fair
value is established using a valuation technique. These valuation
techniques involve a degree of estimation, the extent of which
depends on the instrument’s complexity and the availability of
market-based data. Further details about the Group’s valuation
methodologies and the sensitivity to reasonably possible
alternative assumptions of the fair value of financial instruments
valued using techniques where at least one significant input is
unobservable are given in Note 9.
Accounting developments
International Financial Reporting standards
A number of IFRSs and amendments to IFRS were in issue at 31
December 2015 that would affect RBS from 1 January 2016 or
later.
Effective for 2016
‘Accounting for Acquisitions of Interests in Joint Operations’
issued in May 2014 amends IFRS 11 ‘Joint Arrangements. An
acquirer of an interest in a joint operation that is a business
applies the relevant principles for business combinations in IFRS
3 and other standards and makes the relevant disclosures
accordingly. The effective date is 1 January 2016.
‘Clarification of Acceptable Methods of Depreciation and
Amortisation’ issued in May 2014 amends IAS 16 ‘Property, Plant
and Equipment’ and IAS 38 ‘Intangible Assets’ requiring
amortisation to be based on the consumption of an asset,
introducing a rebuttable presumption that this is not achieved by
an amortisation profile aligned to revenue. The effective date is 1
January 2016.
Annual Improvements to IFRS 2012 - 2014 cycle was issued in
September 2014 making a number of minor amendments to
IFRS. Its effective date is 1 January 2016.
Amendments to IFRS 10 ‘Consolidated Financial Statements’,
IFRS 12 ‘Disclosure of Interests in Other Entities’ and IAS 28
‘Investments in Associates and Joint Ventures’ were issued in
September 2014 to clarify the accounting for sales between an
investor, its associate or joint ventures, and in December 2014 to
clarify the application of the investment entity consolidation
exception. The September 2014 amendments will be effective
from a date to be determined by the IASB and the December
2014 amendments from 1 January 2016.
An amendment to IAS 1 ‘Presentation of Financial Statements’
was issued in December 2014 to clarify the application of
materiality to financial statements. Its effective date is 1 January
2016.
None of these amendments is expected to have a material effect
on RBS’ financial statements.
Effective after 2016 - IFRS 9
In July 2014, the IASB published IFRS 9 ‘Financial Instruments’
with an effective date of 1 January 2018. IFRS 9 replaces the
current financial instruments standard IAS 39, setting out new
accounting requirements in a number of areas. The Group is
continuing its assessment of the standard’s effect on its financial
statements.
The principle features of IFRS 9 are as follows:
Recognition and derecognition
The material in IAS 39 setting out the criteria for the recognition
and derecognition of financial instruments has been included
unamended in IFRS 9.
Classification and measurement
Financial assets - There are three classifications for financial
assets in IFRS 9: fair value through profit or loss; fair value
through other comprehensive income; and amortised cost.
• Financial assets with terms that give rise to interest and
principal cash flows only and which are held in a business
model whose objective is to hold financial assets to collect
their cash flow are measured at amortised cost.
• Financial assets with terms that give rise to interest and
principal cash flows only and which are held in a business
model whose objective is achieved by holding financial
assets to collect their cash flow and selling them are
measured at fair value through other comprehensive
income.
• Other financial assets are measured at fair value through
profit and loss.
However, at initial recognition, any financial asset may be
irrevocably designated as measured at fair value through profit or
loss if such designation eliminates a measurement or recognition
inconsistency.
The Group continues to evaluate the overall effect, but expects
that the measurement basis of the majority of the Group’s
financial assets will be unchanged on application of IFRS 9.
Financial liabilities - IFRS 9’s requirements on the classification
and measurement of financial liabilities are largely unchanged
from those in IAS 39. However, there is a change to the
treatment of changes in the fair value attributable to own credit
risk of financial liabilities designated as at fair value through profit
or loss which are recognised in other comprehensive income and
not in profit or loss as required by IAS 39.
Accounting policies
280
Hedge accounting
Hedge accounting requirements are designed to align accounting
more closely to the risk management framework; permit a greater
variety of hedging instruments; and remove or simplify some of
the rule-based requirements in IAS 39. The basic mechanics of
hedge accounting: fair value, cash flow and net investment
hedges are retained. There is an option in IFRS 9 for an
accounting policy choice to continue with the IAS 39 hedge
accounting framework. The Group is actively considering its
implementation approach.
Credit impairment
IFRS 9’s credit impairment requirements apply to financial assets
measured at amortised cost, to those measured at fair value
through other comprehensive income, to lease receivables and to
certain loan commitments and financial guarantee contracts. On
initial recognition a loss allowance is established at an amount
equal to 12-month expected credit losses (‘ECL’) that is the
portion of life-time expected losses resulting from default events
that are possible within the next 12 months. Where a significant
increase in credit risk since initial recognition is identified, the loss
allowance increases so as to recognise all expected default
events over the expected life of the asset. The Group expects
that financial assets where there is objective evidence of
impairment under IAS39 will be credit impaired under IFRS 9,
and carry loss allowances based on all expected default events.
The assessment of credit risk and the estimation of ECL are
required to be unbiased and probability-weighted: determined by
evaluating at the reporting date for each customer or loan
portfolio a range of possible outcomes using reasonable and
supportable information about past events, current conditions and
forecasts of future events and economic conditions. The
estimation of ECL also takes into account the time value of
money. Recognition and measurement of credit impairments
under IFRS 9 are more forward-looking than under IAS 39.
A single bank-wide programme has been established to
implement the necessary changes in the modelling of credit loss
parameters, and the underlying credit management and financial
processes; this programme is led jointly by Risk and Finance.
The inclusion of loss allowances on all financial assets will tend
to result in an increase in overall impairment balances when
compared with the existing basis of measurement under IAS 39.
Transition
The classification and measurement and impairment
requirements are applied retrospectively by adjusting the opening
balance sheet at the date of initial application, with no
requirement to restate comparative periods. Hedge accounting is
generally applied prospectively from that date.
Effective after 2016 – other standards
In January 2016, the IASB amended IAS 7 ‘Cash Flow
Statements’ to require disclosure of the movements in financing
liabilities. The amendment is effective from1 January 2017.
In January 2016, the IASB amended IAS12 ‘Income taxes’ to
clarify the recognition of deferred tax assets in respect of
unrealised losses. The amendment is effective from 1 January
2017.
IFRS 15 ‘Revenue from Contracts with Customers’ was issued in
May 2014. It will replace IAS 11 ‘Construction Contracts’, IAS 18
‘Revenue’ and several Interpretations. Contracts are bundled or
unbundled into distinct performance obligations with revenue
recognised as the obligations are met. It is effective from 1
January 2018.
IFRS 16 ‘Leases’ was issued in January 2016 to replace IAS 17
‘Leases’. Accounting for finance leases will remain substantially
the same. Operating leases will be brought on balance sheet
through the recognition of assets representing the contractual
rights of use and liabilities will be recognised for the contractual
payments. The effective date is 1 January 2019.
The Group is assessing the effect of adopting these standards
on its financial statements.
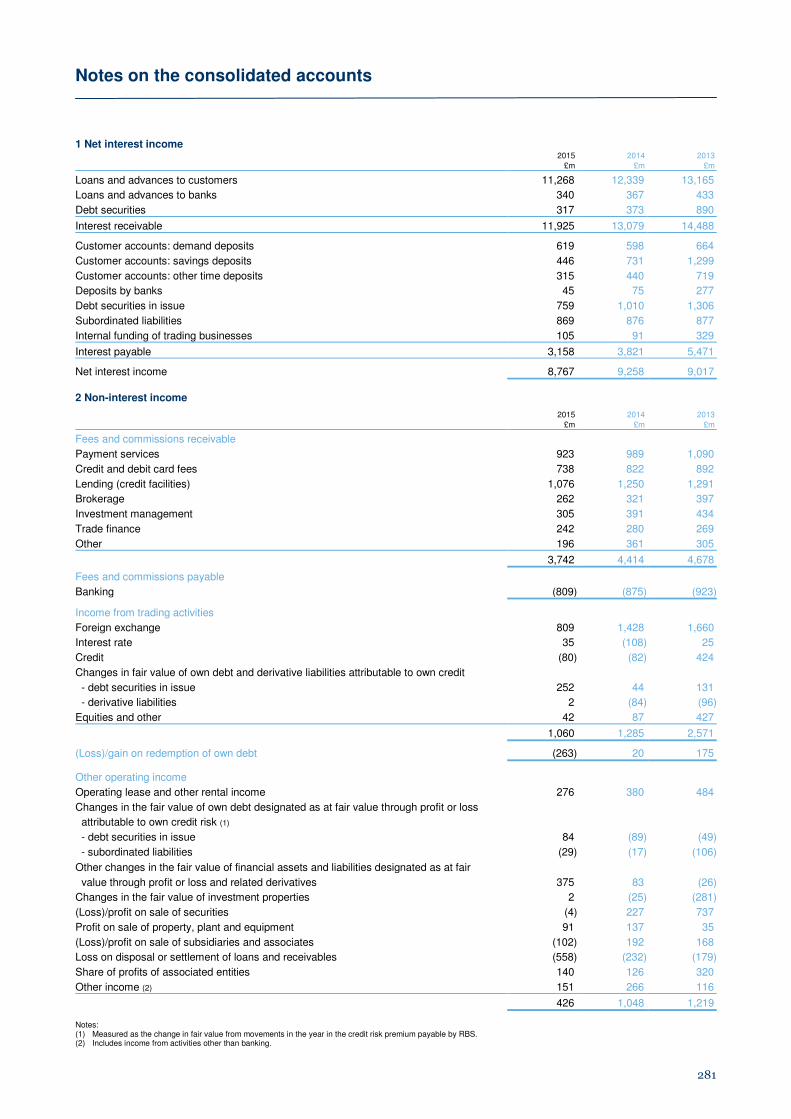
Notes on the consolidated accounts
281
1 Net interest income
2015 2014 2013
£m £m £m
Loans and advances to customers 11,268 12,339 13,165
Loans and advances to banks 340 367 433
Debt securities 317 373 890
Interest receivable 11,925 13,079 14,488 Customer accounts: demand deposits 619 598 664
Customer accounts: savings deposits 446 731 1,299
Customer accounts: other time deposits 315 440 719
Deposits by banks 45 75 277
Debt securities in issue 759 1,010 1,306
Subordinated liabilities 869 876 877
Internal funding of trading businesses 105 91 329
Interest payable 3,158 3,821 5,471 Net interest income 8,767 9,258 9,017
2 Non-interest income 2015 2014 2013
£m £m £m
Fees and commissions receivable
Payment services 923 989 1,090
Credit and debit card fees 738 822 892
Lending (credit facilities) 1,076 1,250 1,291
Brokerage 262 321 397
Investment management 305 391 434
Trade finance 242 280 269
Other 196 361 305
3,742 4,414 4,678
Fees and commissions payable
Banking (809) (875) (923)
Income from trading activities
Foreign exchange 809 1,428 1,660
Interest rate 35 (108) 25
Credit (80) (82) 424
Changes in fair value of own debt and derivative liabilities attributable to own credit
- debt securities in issue 252 44 131
- derivative liabilities 2 (84) (96)
Equities and other 42 87 427
1,060 1,285 2,571
(Loss)/gain on redemption of own debt (263) 20 175
Other operating income
Operating lease and other rental income 276 380 484
Changes in the fair value of own debt designated as at fair value through profit or loss
attributable to own credit risk (1)
- debt securities in issue 84 (89) (49)
- subordinated liabilities (29) (17) (106)
Other changes in the fair value of financial assets and liabilities designated as at fair value through profit or loss and related derivatives 375 83 (26)
Changes in the fair value of investment properties 2 (25) (281)
(Loss)/profit on sale of securities (4) 227 737
Profit on sale of property, plant and equipment 91 137 35
(Loss)/profit on sale of subsidiaries and associates (102) 192 168
Loss on disposal or settlement of loans and receivables (558) (232) (179)
Share of profits of associated entities 140 126 320
Other income (2) 151 266 116
426 1,048 1,219 Notes: (1) Measured as the change in fair value from movements in the year in the credit risk premium payable by RBS. (2) Includes income from activities other than banking.

Notes on the consolidated accounts
282
3 Operating expenses 2015 2014 2013 £m £m £m
Salaries 3,177 3,503 3,661
Variable compensation 314 408 548
Temporary and contract costs 638 526 650
Social security costs 344 379 422
Share-based compensation 36 43 49
Pension costs
- defined benefit schemes (see Note 4) 523 462 508
- curtailment and settlement gains (see Note 4) (65) — (7)
- defined contribution schemes 74 87 76
Severance 511 196 69
Other 174 153 110
Staff costs 5,726 5,757 6,086 Premises and equipment 1,827 2,081 2,038
UK bank levy 230 250 200
Other administrative expenses (1) 6,058 4,318 6,492 Property, plant and equipment depreciation and write down (see Note 16) 950 671 759
Intangible assets amortisation (see Note 15) 230 259 488
Depreciation and amortisation 1,180 930 1,247 Write down of goodwill and other intangible assets (see Note 15) 1,332 523 1,403
16,353 13,859 17,466
Integration, restructuring and divestment costs
Included in operating expenses are the following integration, restructuring and divestment costs. Premises and
Staff depreciation Other (2) Total £m £m £m £m
Integration and restructuring
2015 616 737 950 2,303
2014 261 269 268 798
2013 191 119 165 475 Divestment
2015 214 9 405 628
2014 120 3 233 356
2013 86 2 77 165 Notes: (1) Includes Payment Protection Insurance costs, Interest Rate Hedging Products redress and related costs, and other litigation and conduct costs. Further details are provided in
Note 20. (2) Includes other administrative expenses, write down of goodwill and other intangible assets.

Notes on the consolidated accounts
283
The average number of persons employed, rounded to the nearest hundred, in continuing operations during the year, excluding
temporary staff, was 88,800 (2014 - 92,800; 2013 - 97,900); on the same basis there were 10,100 people employed in discontinued
operations (2014 - 18,200; 2013 - 22,900). The average number of temporary employees during 2015 was 7,800 (2014 - 8,100; 2013 -
9,800). The number of persons employed in continuing operations at 31 December, excluding temporary staff, by reportable segment,
was as follows: 2015 2014* 2013*
UK Personal & Business Banking 24,600 24,400 26,100
Ulster Bank RoI 2,500 2,500 2,600
Personal & Business Banking 27,100 26,900 28,700
Commercial Banking 5,700 6,000 7,000
Private Banking 1,900 2,200 2,200
RBS International 700 600 700
Commercial & Private Banking 8,300 8,800 9,900
Corporate & Institutional Banking 1,200 1,700 2,100
Capital Resolution 1,300 2,400 2,300
Williams & Glyn 4,800 4,500 4,600
Central items & other 45,100 45,300 47,100
Non-Core — — 1,000
Integration and restructuring — 100 200
Total 87,800 89,700 95,900
UK 64,100 63,400 68,700
USA 1,100 2,000 2,400
Europe 6,200 7,400 8,400
Rest of the World 16,400 16,900 16,400
Total 87,800 89,700 95,900
*Represented to reflect the segmental reorganisation. There were no people employed in discontinued operations at 31 December 2015 (2014 - 17,400; 2013 - 19,000).
Share-based payments
As described in the Remuneration report on page 82, the Group grants share-based awards to employees principally on the following
bases:
Award plan Eligible employees Nature of award (1) Vesting conditions (2) Settlement
Sharesave UK, Republic of Ireland,
Channel Islands, Gibraltar
and Isle of Man
Option to buy shares under
employee savings plan
Continuing employment or
leavers in certain circumstances
2016 to 2020
Deferred performance
awards
All Awards of ordinary shares Continuing employment or
leavers in certain circumstances
2016 to 2018
Long-term incentives (3) Senior employees Awards of conditional
shares or share options
Continuing employment or
leavers in certain circumstances
and/or achievement of
performance conditions
2016 to 2020
Notes: (1) Awards are equity-settled unless international comparability is better served by cash-settled awards. (2) All awards have vesting conditions and therefore some may not vest. (3) Long-term incentives include the Executive Share Option Plan, the Long-Term Incentive Plan, the Medium-Term Performance Plan and the Employee Share Plan.
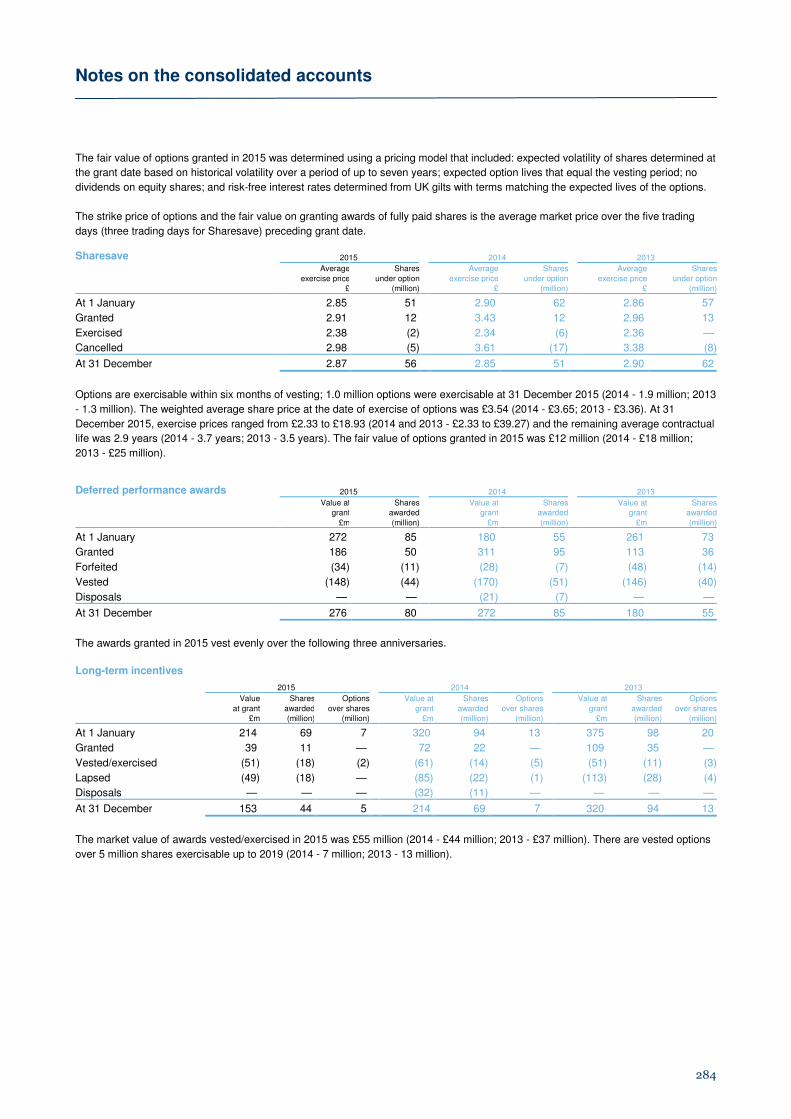
Notes on the consolidated accounts
284
The fair value of options granted in 2015 was determined using a pricing model that included: expected volatility of shares determined at
the grant date based on historical volatility over a period of up to seven years; expected option lives that equal the vesting period; no
dividends on equity shares; and risk-free interest rates determined from UK gilts with terms matching the expected lives of the options.
The strike price of options and the fair value on granting awards of fully paid shares is the average market price over the five trading
days (three trading days for Sharesave) preceding grant date. Sharesave 2015 2014 2013
Average Shares Average Shares Average Shares
exercise price under option exercise price under option exercise price under option £ (million) £ (million) £ (million)
At 1 January 2.85 51 2.90 62 2.86 57
Granted 2.91 12 3.43 12 2.96 13
Exercised 2.38 (2) 2.34 (6) 2.36 —
Cancelled 2.98 (5) 3.61 (17) 3.38 (8)
At 31 December 2.87 56 2.85 51 2.90 62
Options are exercisable within six months of vesting; 1.0 million options were exercisable at 31 December 2015 (2014 - 1.9 million; 2013
- 1.3 million). The weighted average share price at the date of exercise of options was £3.54 (2014 - £3.65; 2013 - £3.36). At 31
December 2015, exercise prices ranged from £2.33 to £18.93 (2014 and 2013 - £2.33 to £39.27) and the remaining average contractual
life was 2.9 years (2014 - 3.7 years; 2013 - 3.5 years). The fair value of options granted in 2015 was £12 million (2014 - £18 million;
2013 - £25 million). Deferred performance awards 2015 2014 2013
Value at Shares Value at Shares Value at Sharesgrant awarded grant awarded grant awarded
£m (million) £m (million) £m (million)
At 1 January 272 85 180 55 261 73
Granted 186 50 311 95 113 36
Forfeited (34) (11) (28) (7) (48) (14)
Vested (148) (44) (170) (51) (146) (40)
Disposals — — (21) (7) — —
At 31 December 276 80 272 85 180 55
The awards granted in 2015 vest evenly over the following three anniversaries.
Long-term incentives 2015 2014 2013
Value Shares Options
Value at Shares Options Value at Shares Options
at grant awarded over shares grant awarded over shares grant awarded over shares£m (million) (million) £m (million) (million) £m (million) (million)
At 1 January 214 69 7 320 94 13 375 98 20
Granted 39 11 — 72 22 — 109 35 —
Vested/exercised (51) (18) (2) (61) (14) (5) (51) (11) (3)
Lapsed (49) (18) — (85) (22) (1) (113) (28) (4)
Disposals — — — (32) (11) — — — —
At 31 December 153 44 5 214 69 7 320 94 13
The market value of awards vested/exercised in 2015 was £55 million (2014 - £44 million; 2013 - £37 million). There are vested options
over 5 million shares exercisable up to 2019 (2014 - 7 million; 2013 - 13 million).
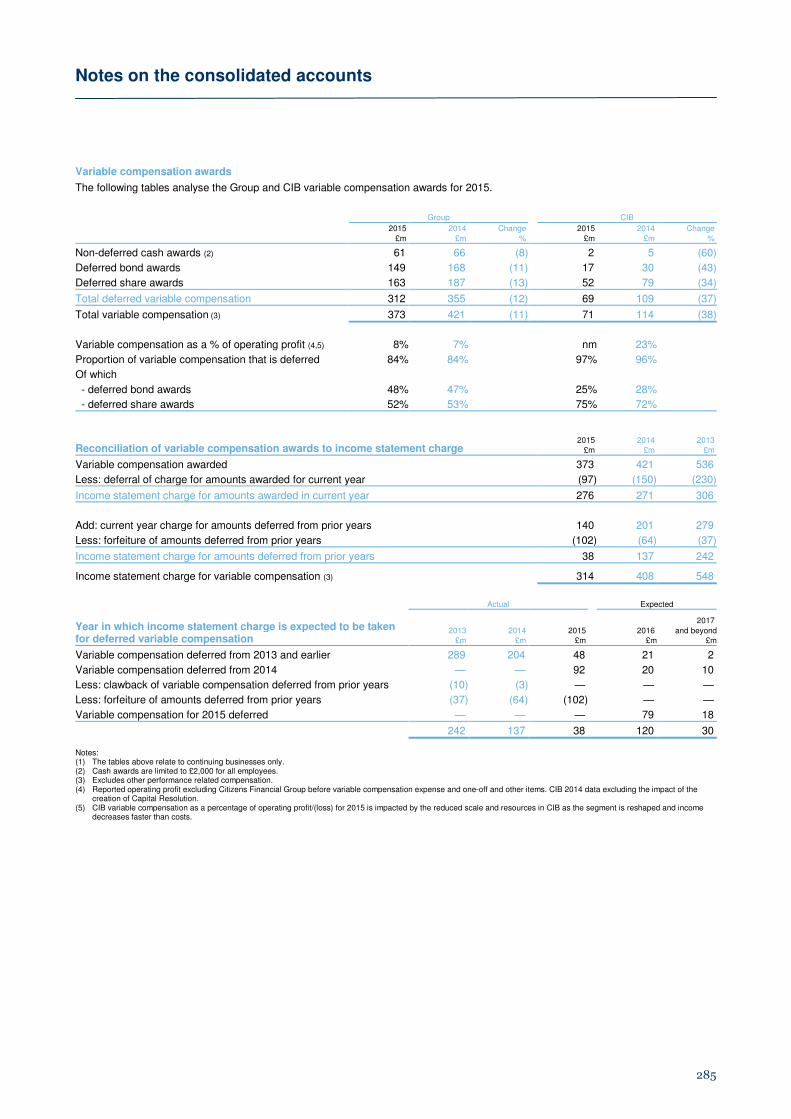
Notes on the consolidated accounts
285
Variable compensation awards The following tables analyse the Group and CIB variable compensation awards for 2015.
Group CIB
2015 2014 Change 2015 2014 Change
£m £m % £m £m %
Non-deferred cash awards (2) 61 66 (8) 2 5 (60)
Deferred bond awards 149 168 (11) 17 30 (43)
Deferred share awards 163 187 (13) 52 79 (34)
Total deferred variable compensation 312 355 (12) 69 109 (37)
Total variable compensation (3) 373 421 (11) 71 114 (38)
Variable compensation as a % of operating profit (4,5) 8% 7% nm 23%
Proportion of variable compensation that is deferred 84% 84% 97% 96%
Of which
- deferred bond awards 48% 47% 25% 28%
- deferred share awards 52% 53% 75% 72%
Reconciliation of variable compensation awards to income statement charge 2015 2014 2013
£m £m £m
Variable compensation awarded 373 421 536
Less: deferral of charge for amounts awarded for current year (97) (150) (230)
Income statement charge for amounts awarded in current year 276 271 306
Add: current year charge for amounts deferred from prior years 140 201 279
Less: forfeiture of amounts deferred from prior years (102) (64) (37)
Income statement charge for amounts deferred from prior years 38 137 242 Income statement charge for variable compensation (3) 314 408 548
Actual Expected
Year in which income statement charge is expected to be taken for deferred variable compensation
2017
2013 2014 2015 2016 and beyond£m £m £m £m £m
Variable compensation deferred from 2013 and earlier 289 204 48 21 2
Variable compensation deferred from 2014 — — 92 20 10
Less: clawback of variable compensation deferred from prior years (10) (3) — — —
Less: forfeiture of amounts deferred from prior years (37) (64) (102) — —
Variable compensation for 2015 deferred — — — 79 18
242 137 38 120 30 Notes: (1) The tables above relate to continuing businesses only. (2) Cash awards are limited to £2,000 for all employees. (3) Excludes other performance related compensation. (4) Reported operating profit excluding Citizens Financial Group before variable compensation expense and one-off and other items. CIB 2014 data excluding the impact of the
creation of Capital Resolution. (5) CIB variable compensation as a percentage of operating profit/(loss) for 2015 is impacted by the reduced scale and resources in CIB as the segment is reshaped and income
decreases faster than costs.
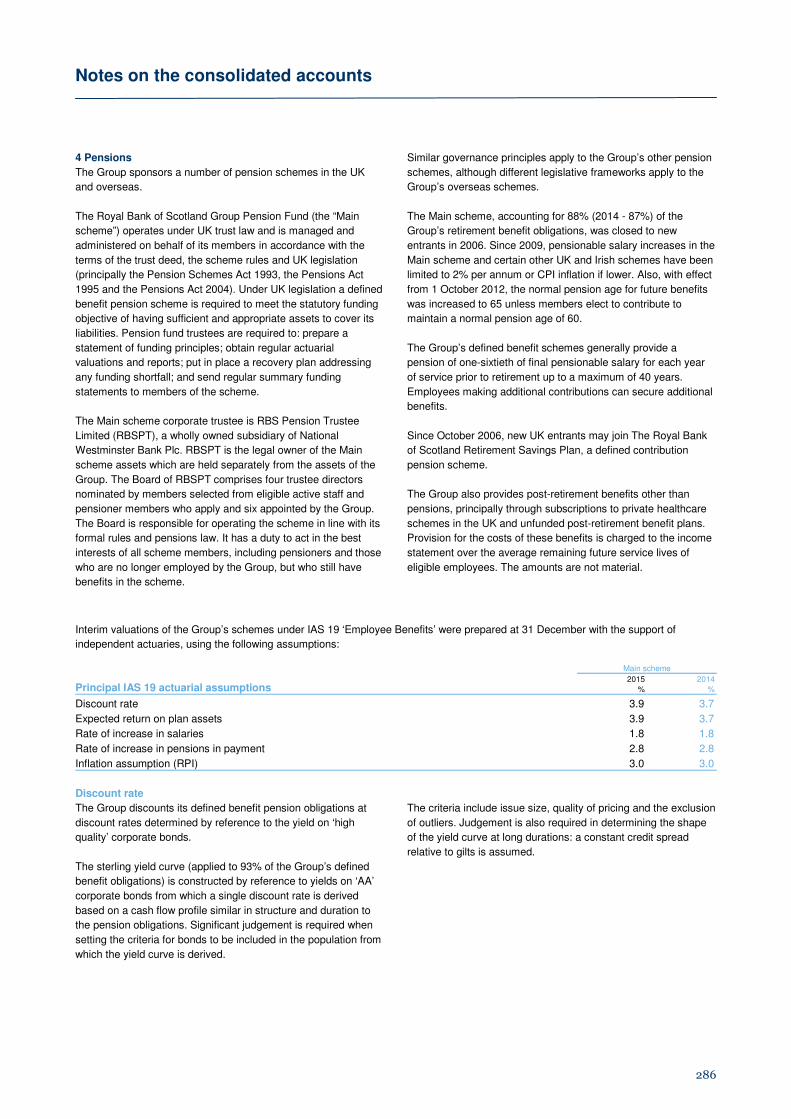
Notes on the consolidated accounts
286
4 Pensions
The Group sponsors a number of pension schemes in the UK
and overseas.
The Royal Bank of Scotland Group Pension Fund (the “Main
scheme”) operates under UK trust law and is managed and
administered on behalf of its members in accordance with the
terms of the trust deed, the scheme rules and UK legislation
(principally the Pension Schemes Act 1993, the Pensions Act
1995 and the Pensions Act 2004). Under UK legislation a defined
benefit pension scheme is required to meet the statutory funding
objective of having sufficient and appropriate assets to cover its
liabilities. Pension fund trustees are required to: prepare a
statement of funding principles; obtain regular actuarial
valuations and reports; put in place a recovery plan addressing
any funding shortfall; and send regular summary funding
statements to members of the scheme.
The Main scheme corporate trustee is RBS Pension Trustee
Limited (RBSPT), a wholly owned subsidiary of National
Westminster Bank Plc. RBSPT is the legal owner of the Main
scheme assets which are held separately from the assets of the
Group. The Board of RBSPT comprises four trustee directors
nominated by members selected from eligible active staff and
pensioner members who apply and six appointed by the Group.
The Board is responsible for operating the scheme in line with its
formal rules and pensions law. It has a duty to act in the best
interests of all scheme members, including pensioners and those
who are no longer employed by the Group, but who still have
benefits in the scheme.
Similar governance principles apply to the Group’s other pension
schemes, although different legislative frameworks apply to the
Group’s overseas schemes.
The Main scheme, accounting for 88% (2014 - 87%) of the
Group’s retirement benefit obligations, was closed to new
entrants in 2006. Since 2009, pensionable salary increases in the
Main scheme and certain other UK and Irish schemes have been
limited to 2% per annum or CPI inflation if lower. Also, with effect
from 1 October 2012, the normal pension age for future benefits
was increased to 65 unless members elect to contribute to
maintain a normal pension age of 60.
The Group’s defined benefit schemes generally provide a
pension of one-sixtieth of final pensionable salary for each year
of service prior to retirement up to a maximum of 40 years.
Employees making additional contributions can secure additional
benefits.
Since October 2006, new UK entrants may join The Royal Bank
of Scotland Retirement Savings Plan, a defined contribution
pension scheme.
The Group also provides post-retirement benefits other than
pensions, principally through subscriptions to private healthcare
schemes in the UK and unfunded post-retirement benefit plans.
Provision for the costs of these benefits is charged to the income
statement over the average remaining future service lives of
eligible employees. The amounts are not material.
Interim valuations of the Group’s schemes under IAS 19 ‘Employee Benefits’ were prepared at 31 December with the support of
independent actuaries, using the following assumptions:
Principal IAS 19 actuarial assumptions
Main scheme 2015 2014
% %
Discount rate 3.9 3.7
Expected return on plan assets 3.9 3.7
Rate of increase in salaries 1.8 1.8
Rate of increase in pensions in payment 2.8 2.8
Inflation assumption (RPI) 3.0 3.0
Discount rate
The Group discounts its defined benefit pension obligations at
discount rates determined by reference to the yield on ‘high
quality’ corporate bonds.
The sterling yield curve (applied to 93% of the Group’s defined
benefit obligations) is constructed by reference to yields on ‘AA’
corporate bonds from which a single discount rate is derived
based on a cash flow profile similar in structure and duration to
the pension obligations. Significant judgement is required when
setting the criteria for bonds to be included in the population from
which the yield curve is derived.
The criteria include issue size, quality of pricing and the exclusion
of outliers. Judgement is also required in determining the shape
of the yield curve at long durations: a constant credit spread
relative to gilts is assumed.
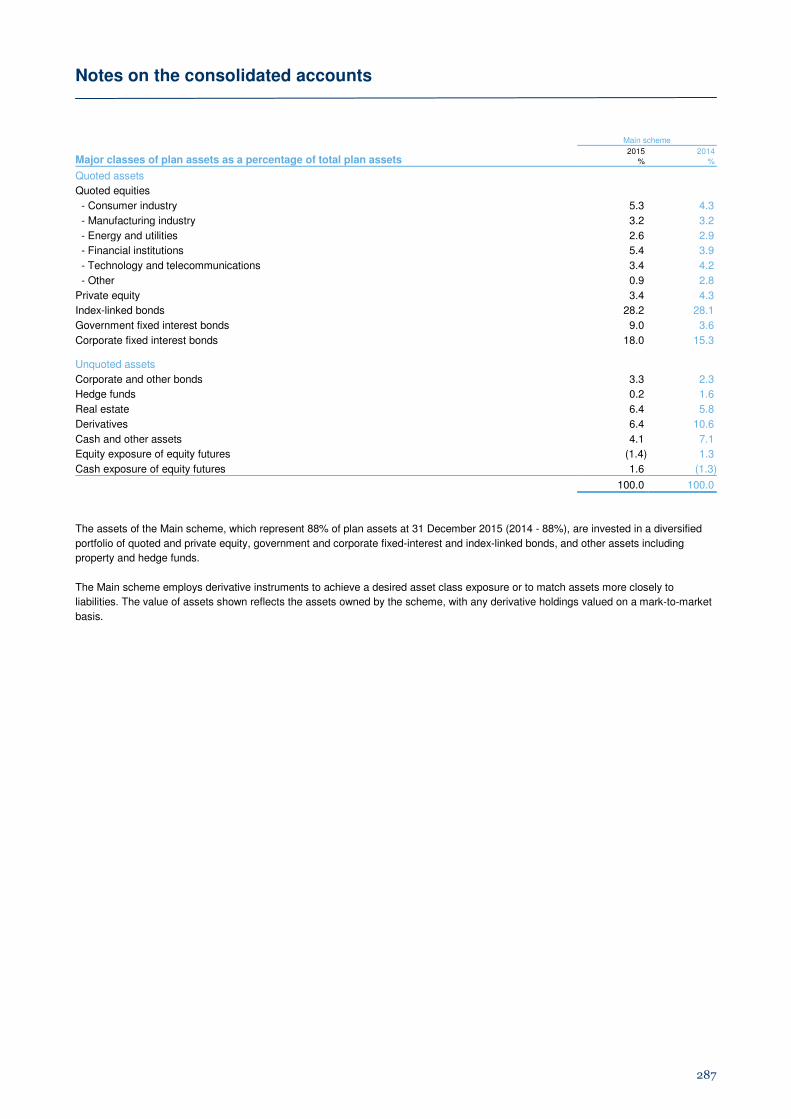
Notes on the consolidated accounts
287
Major classes of plan assets as a percentage of total plan assets
Main scheme 2015 2014
% %
Quoted assets
Quoted equities
- Consumer industry 5.3 4.3
- Manufacturing industry 3.2 3.2
- Energy and utilities 2.6 2.9
- Financial institutions 5.4 3.9
- Technology and telecommunications 3.4 4.2
- Other 0.9 2.8
Private equity 3.4 4.3
Index-linked bonds 28.2 28.1
Government fixed interest bonds 9.0 3.6
Corporate fixed interest bonds 18.0 15.3 Unquoted assets
Corporate and other bonds 3.3 2.3
Hedge funds 0.2 1.6
Real estate 6.4 5.8
Derivatives 6.4 10.6
Cash and other assets 4.1 7.1
Equity exposure of equity futures (1.4) 1.3
Cash exposure of equity futures 1.6 (1.3)
100.0 100.0
The assets of the Main scheme, which represent 88% of plan assets at 31 December 2015 (2014 - 88%), are invested in a diversified
portfolio of quoted and private equity, government and corporate fixed-interest and index-linked bonds, and other assets including
property and hedge funds.
The Main scheme employs derivative instruments to achieve a desired asset class exposure or to match assets more closely to
liabilities. The value of assets shown reflects the assets owned by the scheme, with any derivative holdings valued on a mark-to-market
basis.
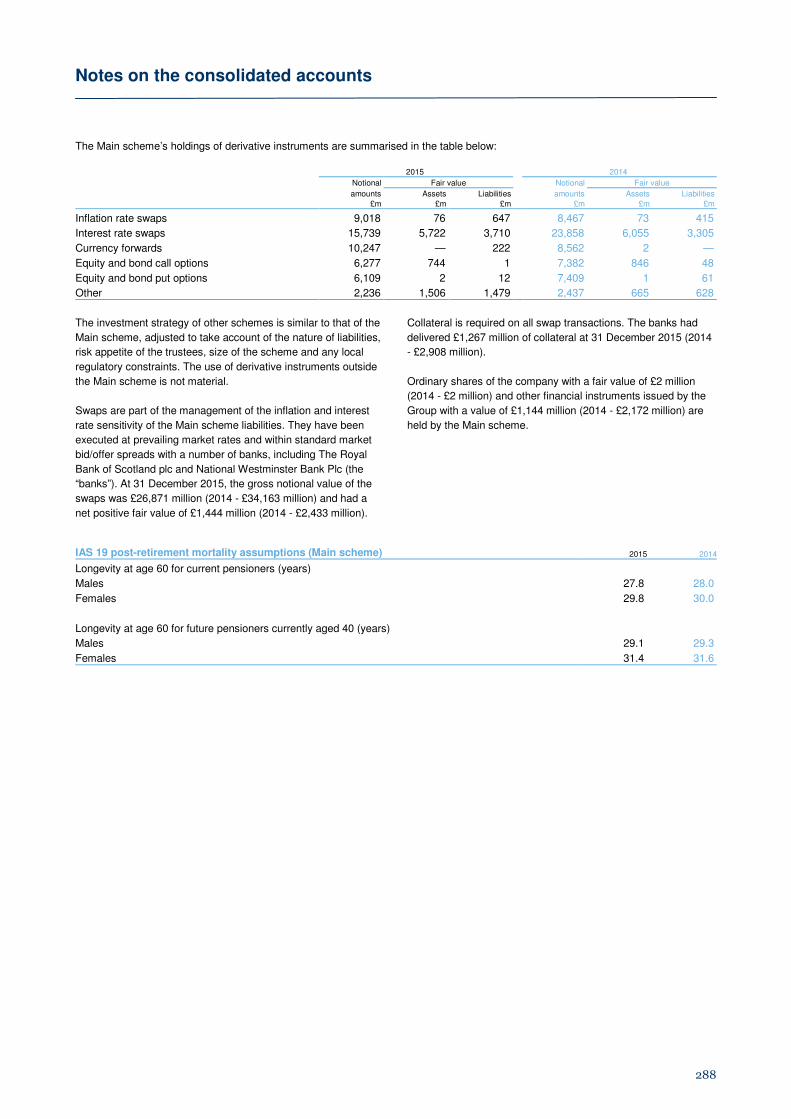
Notes on the consolidated accounts
288
The Main scheme’s holdings of derivative instruments are summarised in the table below: 2015 2014
Notional Fair value Notional Fair value
amounts Assets Liabilities amounts Assets Liabilities
£m £m £m £m £m £m
Inflation rate swaps 9,018 76 647 8,467 73 415
Interest rate swaps 15,739 5,722 3,710 23,858 6,055 3,305
Currency forwards 10,247 — 222 8,562 2 —
Equity and bond call options 6,277 744 1 7,382 846 48
Equity and bond put options 6,109 2 12 7,409 1 61
Other 2,236 1,506 1,479 2,437 665 628
The investment strategy of other schemes is similar to that of the
Main scheme, adjusted to take account of the nature of liabilities,
risk appetite of the trustees, size of the scheme and any local
regulatory constraints. The use of derivative instruments outside
the Main scheme is not material.
Swaps are part of the management of the inflation and interest
rate sensitivity of the Main scheme liabilities. They have been
executed at prevailing market rates and within standard market
bid/offer spreads with a number of banks, including The Royal
Bank of Scotland plc and National Westminster Bank Plc (the
“banks”). At 31 December 2015, the gross notional value of the
swaps was £26,871 million (2014 - £34,163 million) and had a
net positive fair value of £1,444 million (2014 - £2,433 million).
Collateral is required on all swap transactions. The banks had
delivered £1,267 million of collateral at 31 December 2015 (2014
- £2,908 million).
Ordinary shares of the company with a fair value of £2 million
(2014 - £2 million) and other financial instruments issued by the
Group with a value of £1,144 million (2014 - £2,172 million) are
held by the Main scheme.
IAS 19 post-retirement mortality assumptions (Main scheme) 2015 2014
Longevity at age 60 for current pensioners (years)
Males 27.8 28.0
Females 29.8 30.0
Longevity at age 60 for future pensioners currently aged 40 (years)
Males 29.1 29.3
Females 31.4 31.6
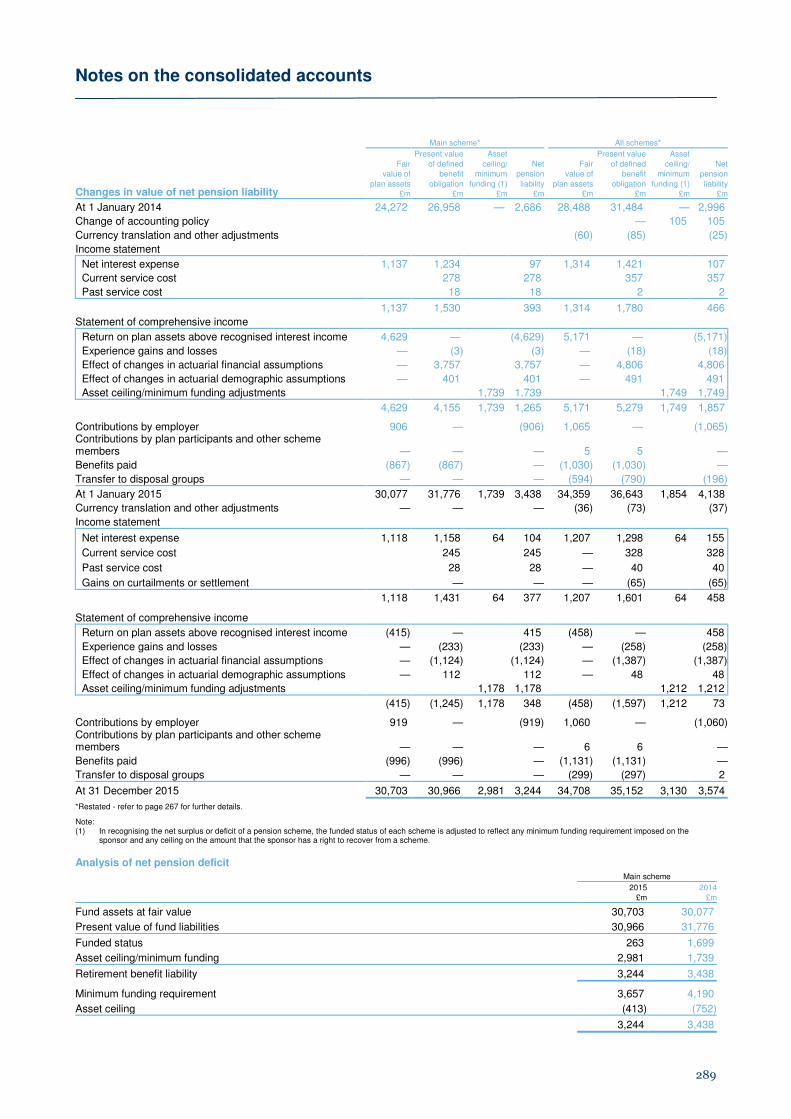
Notes on the consolidated accounts
289
Main scheme* All schemes* Present value Asset Present value Asset
Fair of defined ceiling/ Net Fair of defined ceiling/ Net value of benefit minimum pension value of benefit minimum pension
Changes in value of net pension liability plan assets obligation funding (1) liability plan assets obligation funding (1) liability
£m £m £m £m £m £m £m £m
At 1 January 2014 24,272 26,958 — 2,686 28,488 31,484 — 2,996
Change of accounting policy — 105 105
Currency translation and other adjustments (60) (85) (25)
Income statement
Net interest expense 1,137 1,234 97 1,314 1,421 107
Current service cost 278 278 357 357
Past service cost 18 18 2 2
1,137 1,530 393 1,314 1,780 466
Statement of comprehensive income
Return on plan assets above recognised interest income 4,629 — (4,629) 5,171 — (5,171)
Experience gains and losses — (3) (3) — (18) (18)
Effect of changes in actuarial financial assumptions — 3,757 3,757 — 4,806 4,806
Effect of changes in actuarial demographic assumptions — 401 401 — 491 491
Asset ceiling/minimum funding adjustments 1,739 1,739 1,749 1,749
4,629 4,155 1,739 1,265 5,171 5,279 1,749 1,857 Contributions by employer 906 — (906) 1,065 — (1,065)Contributions by plan participants and other scheme members — — — 5 5 —
Benefits paid (867) (867) — (1,030) (1,030) —
Transfer to disposal groups — — — (594) (790) (196)
At 1 January 2015 30,077 31,776 1,739 3,438 34,359 36,643 1,854 4,138
Currency translation and other adjustments — — — (36) (73) (37)
Income statement
Net interest expense 1,118 1,158 64 104 1,207 1,298 64 155
Current service cost 245 245 — 328 328
Past service cost 28 28 — 40 40
Gains on curtailments or settlement — — — (65) (65)
1,118 1,431 64 377 1,207 1,601 64 458 Statement of comprehensive income
Return on plan assets above recognised interest income (415) — 415 (458) — 458
Experience gains and losses — (233) (233) — (258) (258)
Effect of changes in actuarial financial assumptions — (1,124) (1,124) — (1,387) (1,387)
Effect of changes in actuarial demographic assumptions — 112 112 — 48 48
Asset ceiling/minimum funding adjustments 1,178 1,178 1,212 1,212
(415) (1,245) 1,178 348 (458) (1,597) 1,212 73 Contributions by employer 919 — (919) 1,060 — (1,060)Contributions by plan participants and other scheme members — — — 6 6 —
Benefits paid (996) (996) — (1,131) (1,131) —
Transfer to disposal groups — — — (299) (297) 2
At 31 December 2015 30,703 30,966 2,981 3,244 34,708 35,152 3,130 3,574
*Restated - refer to page 267 for further details.
Note: (1) In recognising the net surplus or deficit of a pension scheme, the funded status of each scheme is adjusted to reflect any minimum funding requirement imposed on the
sponsor and any ceiling on the amount that the sponsor has a right to recover from a scheme.
Analysis of net pension deficit Main scheme 2015 2014
£m £m
Fund assets at fair value 30,703 30,077
Present value of fund liabilities 30,966 31,776
Funded status 263 1,699
Asset ceiling/minimum funding 2,981 1,739
Retirement benefit liability 3,244 3,438
Minimum funding requirement 3,657 4,190
Asset ceiling (413) (752)
3,244 3,438
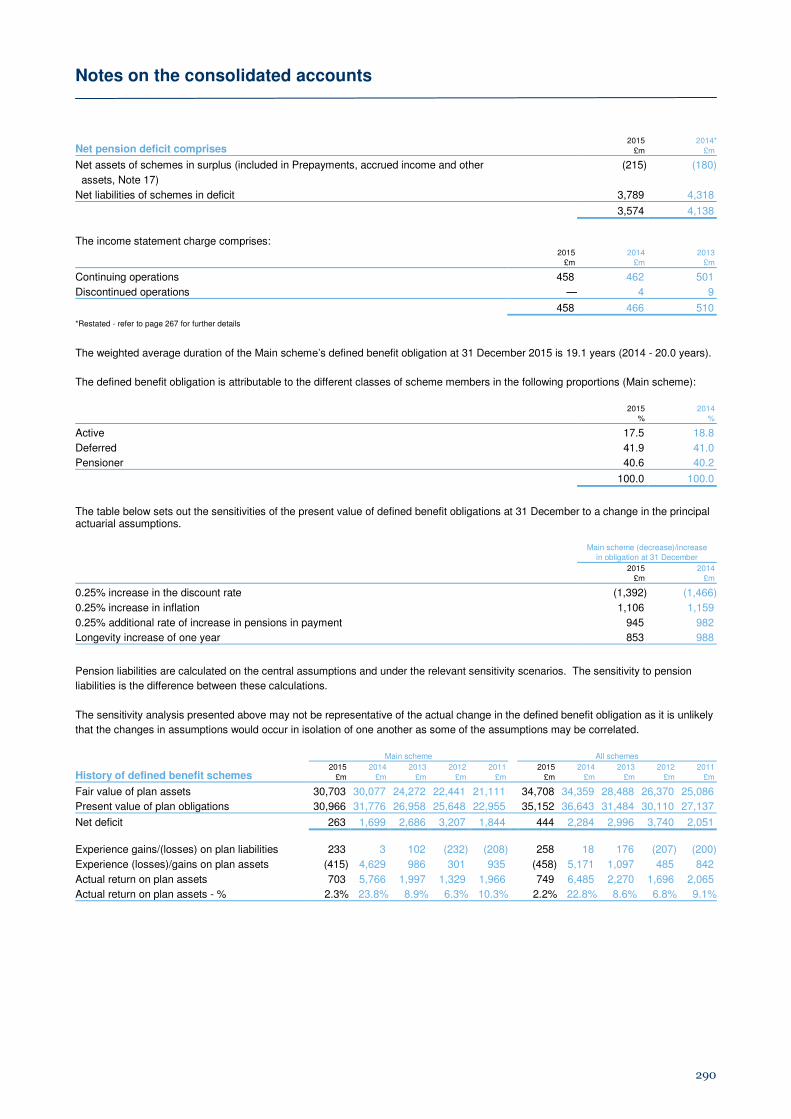
Notes on the consolidated accounts
290
Net pension deficit comprises 2015 2014*
£m £m
Net assets of schemes in surplus (included in Prepayments, accrued income and other (215) (180)
assets, Note 17)
Net liabilities of schemes in deficit 3,789 4,318
3,574 4,138
The income statement charge comprises:
2015 2014 2013
£m £m £m
Continuing operations 458 462 501
Discontinued operations — 4 9
458 466 510
*Restated - refer to page 267 for further details
The weighted average duration of the Main scheme’s defined benefit obligation at 31 December 2015 is 19.1 years (2014 - 20.0 years).
The defined benefit obligation is attributable to the different classes of scheme members in the following proportions (Main scheme): 2015 2014 % %
Active 17.5 18.8
Deferred 41.9 41.0
Pensioner 40.6 40.2
100.0 100.0
The table below sets out the sensitivities of the present value of defined benefit obligations at 31 December to a change in the principal actuarial assumptions.
Main scheme (decrease)/increase
in obligation at 31 December
2015 2014 £m £m
0.25% increase in the discount rate (1,392) (1,466)
0.25% increase in inflation 1,106 1,159
0.25% additional rate of increase in pensions in payment 945 982
Longevity increase of one year 853 988
Pension liabilities are calculated on the central assumptions and under the relevant sensitivity scenarios. The sensitivity to pension
liabilities is the difference between these calculations.
The sensitivity analysis presented above may not be representative of the actual change in the defined benefit obligation as it is unlikely
that the changes in assumptions would occur in isolation of one another as some of the assumptions may be correlated.
Main scheme All schemes
History of defined benefit schemes 2015 2014 2013 2012 2011 2015 2014 2013 2012 2011
£m £m £m £m £m £m £m £m £m £m
Fair value of plan assets 30,703 30,077 24,272 22,441 21,111 34,708 34,359 28,488 26,370 25,086
Present value of plan obligations 30,966 31,776 26,958 25,648 22,955 35,152 36,643 31,484 30,110 27,137
Net deficit 263 1,699 2,686 3,207 1,844 444 2,284 2,996 3,740 2,051
Experience gains/(losses) on plan liabilities 233 3 102 (232) (208) 258 18 176 (207) (200)
Experience (losses)/gains on plan assets (415) 4,629 986 301 935 (458) 5,171 1,097 485 842
Actual return on plan assets 703 5,766 1,997 1,329 1,966 749 6,485 2,270 1,696 2,065
Actual return on plan assets - % 2.3% 23.8% 8.9% 6.3% 10.3% 2.2% 22.8% 8.6% 6.8% 9.1%
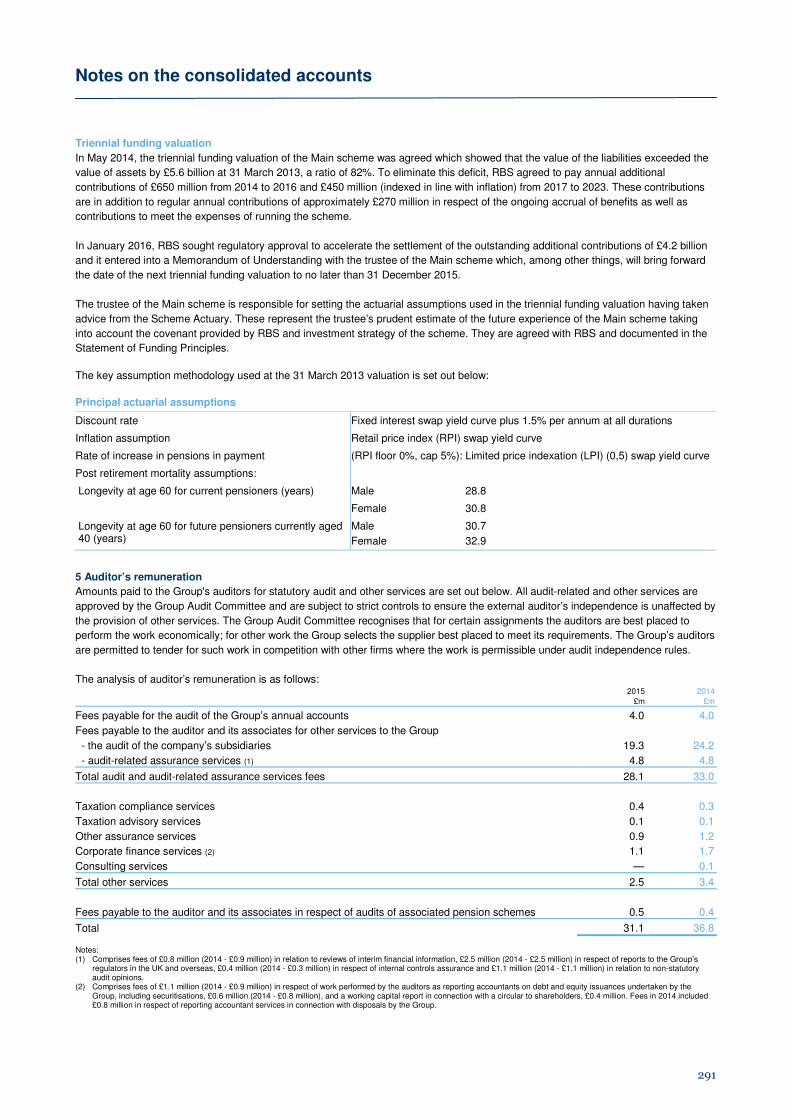
Notes on the consolidated accounts
291
Triennial funding valuation
In May 2014, the triennial funding valuation of the Main scheme was agreed which showed that the value of the liabilities exceeded the
value of assets by £5.6 billion at 31 March 2013, a ratio of 82%. To eliminate this deficit, RBS agreed to pay annual additional
contributions of £650 million from 2014 to 2016 and £450 million (indexed in line with inflation) from 2017 to 2023. These contributions
are in addition to regular annual contributions of approximately £270 million in respect of the ongoing accrual of benefits as well as
contributions to meet the expenses of running the scheme.
In January 2016, RBS sought regulatory approval to accelerate the settlement of the outstanding additional contributions of £4.2 billion
and it entered into a Memorandum of Understanding with the trustee of the Main scheme which, among other things, will bring forward
the date of the next triennial funding valuation to no later than 31 December 2015.
The trustee of the Main scheme is responsible for setting the actuarial assumptions used in the triennial funding valuation having taken
advice from the Scheme Actuary. These represent the trustee’s prudent estimate of the future experience of the Main scheme taking
into account the covenant provided by RBS and investment strategy of the scheme. They are agreed with RBS and documented in the
Statement of Funding Principles.
The key assumption methodology used at the 31 March 2013 valuation is set out below:
Principal actuarial assumptions
Discount rate Fixed interest swap yield curve plus 1.5% per annum at all durations
Inflation assumption Retail price index (RPI) swap yield curve
Rate of increase in pensions in payment (RPI floor 0%, cap 5%): Limited price indexation (LPI) (0,5) swap yield curve
Post retirement mortality assumptions:
Longevity at age 60 for current pensioners (years) Male 28.8
Female 30.8
Longevity at age 60 for future pensioners currently aged 40 (years)
Male
Female
30.7
32.9
5 Auditor’s remuneration
Amounts paid to the Group's auditors for statutory audit and other services are set out below. All audit-related and other services are
approved by the Group Audit Committee and are subject to strict controls to ensure the external auditor’s independence is unaffected by
the provision of other services. The Group Audit Committee recognises that for certain assignments the auditors are best placed to
perform the work economically; for other work the Group selects the supplier best placed to meet its requirements. The Group’s auditors
are permitted to tender for such work in competition with other firms where the work is permissible under audit independence rules.
The analysis of auditor’s remuneration is as follows: 2015 2014
£m £m
Fees payable for the audit of the Group’s annual accounts 4.0 4.0
Fees payable to the auditor and its associates for other services to the Group
- the audit of the company’s subsidiaries 19.3 24.2
- audit-related assurance services (1) 4.8 4.8
Total audit and audit-related assurance services fees 28.1 33.0
Taxation compliance services 0.4 0.3
Taxation advisory services 0.1 0.1
Other assurance services 0.9 1.2
Corporate finance services (2) 1.1 1.7
Consulting services — 0.1
Total other services 2.5 3.4
Fees payable to the auditor and its associates in respect of audits of associated pension schemes 0.5 0.4
Total 31.1 36.8 Notes: (1) Comprises fees of £0.8 million (2014 - £0.9 million) in relation to reviews of interim financial information, £2.5 million (2014 - £2.5 million) in respect of reports to the Group’s
regulators in the UK and overseas, £0.4 million (2014 - £0.3 million) in respect of internal controls assurance and £1.1 million (2014 - £1.1 million) in relation to non-statutory audit opinions.
(2) Comprises fees of £1.1 million (2014 - £0.9 million) in respect of work performed by the auditors as reporting accountants on debt and equity issuances undertaken by the Group, including securitisations, £0.6 million (2014 - £0.8 million), and a working capital report in connection with a circular to shareholders, £0.4 million. Fees in 2014 included £0.8 million in respect of reporting accountant services in connection with disposals by the Group.

Notes on the consolidated accounts
292
6 Tax 2015 2014 2013 £m £m £m
Current tax
Charge for the year (249) (423) (315)
Over provision in respect of prior years 220 247 120
(29) (176) (195)
Deferred tax
Credit/(charge) for the year arising from UK tax rate changes 94 — (313)
Other (charges)/credits for the year (94) (259) 899
Reduction in the carrying value of deferred tax assets — (1,472) (701)
Under/(over) provision in respect of prior years 6 (2) 124
Tax charge for the year (23) (1,909) (186)
The actual tax charge differs from the expected tax charge computed by applying the standard rate of UK corporation tax of 20.25%
(2014 - 21.50%; 2013 - 23.25%) as follows: 2015 2014 2013
£m £m £m
Expected tax credit/(charge) 547 (568) 2,057
Losses and temporary differences in year where no deferred tax asset recognised (1,086) (89) (887)
Foreign profits taxed at other rates 510 76 (117)
UK tax rate change impact (1) 94 — (313)
Non-deductible goodwill impairment (124) (28) (247)
Items not allowed for tax
- losses on disposals and write-downs (23) (12) (20)
- UK bank levy (50) (54) (47)
- regulatory and legal actions (232) (182) (144)
- other disallowable items (199) (191) (212)
Non-taxable items
- gain on sale of Direct Line Insurance Group — 41 —
- gain on sale of Global Merchant Services — — 37
- other non-taxable items 173 79 153
Taxable foreign exchange movements 19 21 (25)
Losses brought forward and utilised 122 225 36
(Reduction)/increase in carrying value of deferred tax asset in respect of:
- UK losses — (850) (701)
- US losses and temporary differences — (775) —
- Ireland losses — 153 —
Adjustments in respect of prior years (2) 226 245 244
Actual tax charge (23) (1,909) (186) Notes: (1) In recent years the UK Government has steadily reduced the rate of UK corporation tax, with the latest enacted rates standing at 20% with effect from 1 April 2015, 19% from 1
April 2017 and 18% from 1 April 2020. The Finance (No 2) Act 2015 restricts the rate at which tax losses are given credit in future periods to the main rate of UK corporation tax rate, excluding the Banking Surcharge 8% rate introduced by this Act. Deferred tax assets and liabilities at 31 December 2015 take into account the reduced rates in respect of tax losses and non-banking temporary differences and where appropriate, the banking surcharge inclusive rate in respect of other banking temporary differences.
(2) Prior year tax adjustments for 2015 include releases of tax provisions that reflect the reduction of exposures in countries where RBS is ceasing operations in line with the strategy to become a smaller, simpler UK focused bank. The prior year tax adjustment also reflects adjustments to reflect submitted tax computations in the UK and overseas and a further prior year tax credit in respect of tax losses arising in the Belfast Branch of Ulster Bank Ireland Limited reflecting UK tax law changes and European Court of Justice decisions on the surrender of tax losses.
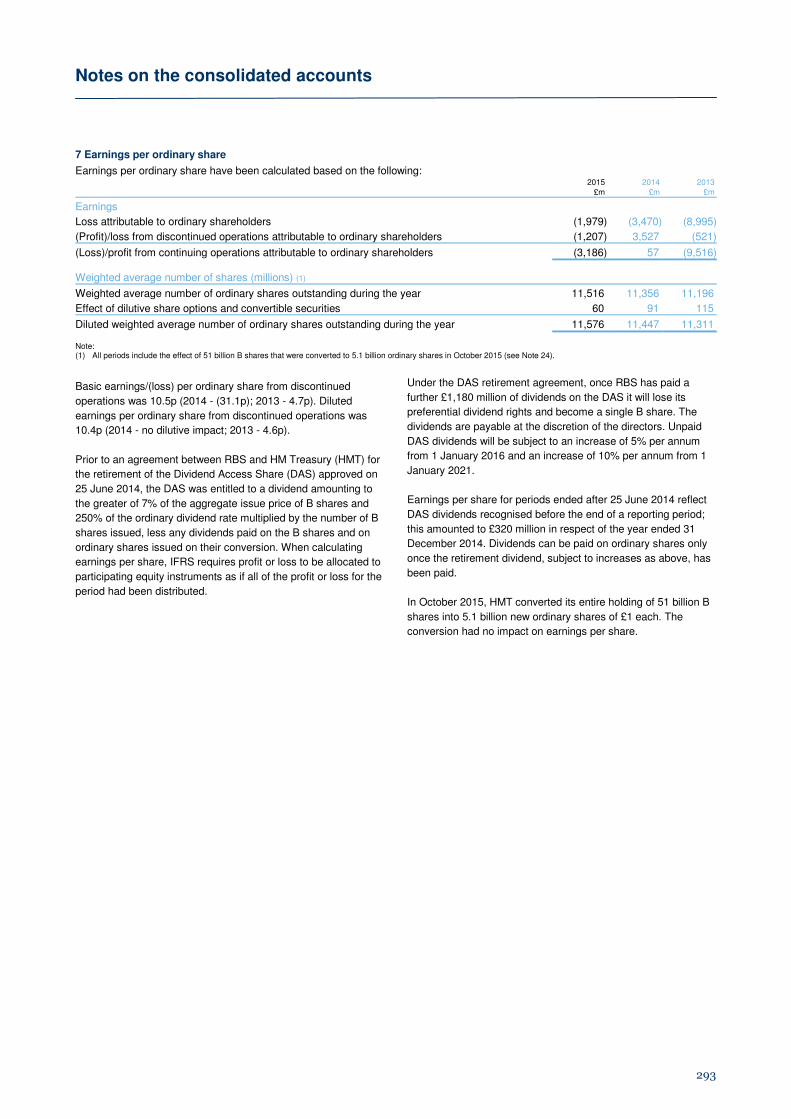
Notes on the consolidated accounts
293
7 Earnings per ordinary share Earnings per ordinary share have been calculated based on the following:
2015 2014 2013
£m £m £m
Earnings
Loss attributable to ordinary shareholders (1,979) (3,470) (8,995)
(Profit)/loss from discontinued operations attributable to ordinary shareholders (1,207) 3,527 (521)
(Loss)/profit from continuing operations attributable to ordinary shareholders (3,186) 57 (9,516)
Weighted average number of shares (millions) (1)
Weighted average number of ordinary shares outstanding during the year 11,516 11,356 11,196
Effect of dilutive share options and convertible securities 60 91 115
Diluted weighted average number of ordinary shares outstanding during the year 11,576 11,447 11,311 Note: (1) All periods include the effect of 51 billion B shares that were converted to 5.1 billion ordinary shares in October 2015 (see Note 24).
Basic earnings/(loss) per ordinary share from discontinued
operations was 10.5p (2014 - (31.1p); 2013 - 4.7p). Diluted
earnings per ordinary share from discontinued operations was
10.4p (2014 - no dilutive impact; 2013 - 4.6p).
Prior to an agreement between RBS and HM Treasury (HMT) for
the retirement of the Dividend Access Share (DAS) approved on
25 June 2014, the DAS was entitled to a dividend amounting to
the greater of 7% of the aggregate issue price of B shares and
250% of the ordinary dividend rate multiplied by the number of B
shares issued, less any dividends paid on the B shares and on
ordinary shares issued on their conversion. When calculating
earnings per share, IFRS requires profit or loss to be allocated to
participating equity instruments as if all of the profit or loss for the
period had been distributed.
Under the DAS retirement agreement, once RBS has paid a
further £1,180 million of dividends on the DAS it will lose its
preferential dividend rights and become a single B share. The
dividends are payable at the discretion of the directors. Unpaid
DAS dividends will be subject to an increase of 5% per annum
from 1 January 2016 and an increase of 10% per annum from 1
January 2021.
Earnings per share for periods ended after 25 June 2014 reflect
DAS dividends recognised before the end of a reporting period;
this amounted to £320 million in respect of the year ended 31
December 2014. Dividends can be paid on ordinary shares only
once the retirement dividend, subject to increases as above, has
been paid.
In October 2015, HMT converted its entire holding of 51 billion B
shares into 5.1 billion new ordinary shares of £1 each. The
conversion had no impact on earnings per share.
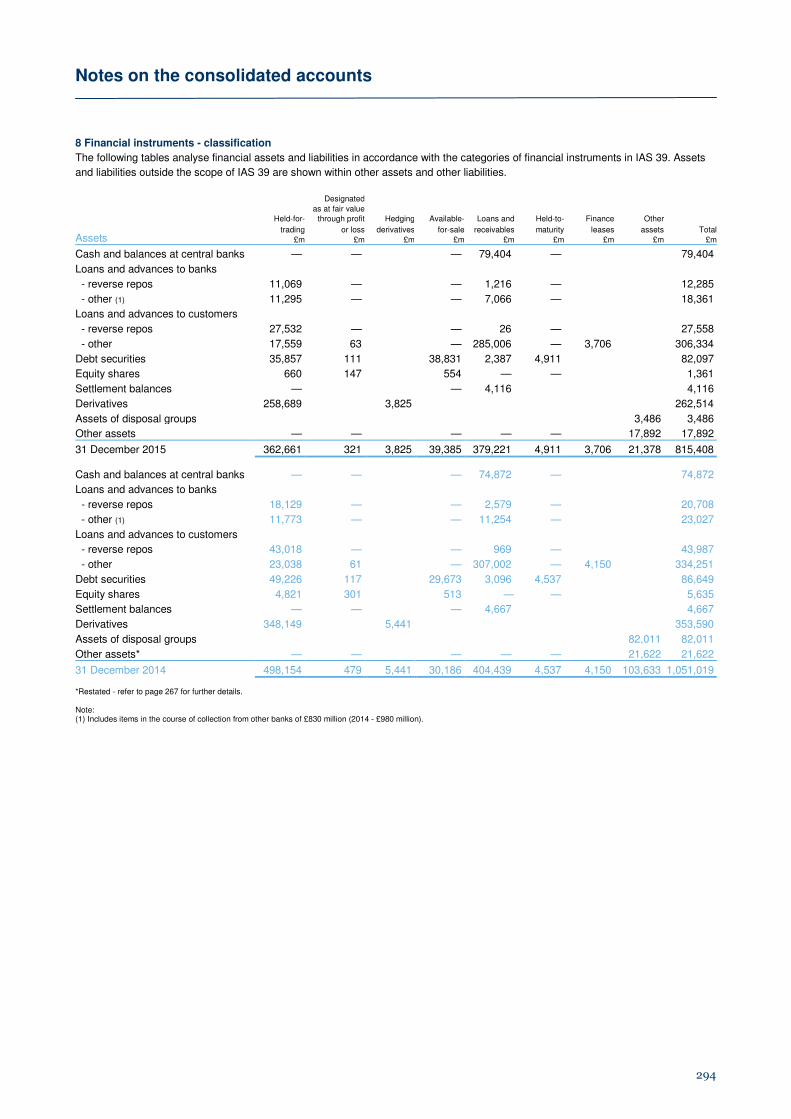
Notes on the consolidated accounts
294
8 Financial instruments - classification
The following tables analyse financial assets and liabilities in accordance with the categories of financial instruments in IAS 39. Assets
and liabilities outside the scope of IAS 39 are shown within other assets and other liabilities. Designated
Total
as at fair value
Assets
Held-for- through profit Hedging Available- Loans and Held-to- Finance Other
trading or loss derivatives for-sale receivables maturity leases assets
£m £m £m £m £m £m £m £m £m
Cash and balances at central banks — — — 79,404 — 79,404
Loans and advances to banks
- reverse repos 11,069 — — 1,216 — 12,285
- other (1) 11,295 — — 7,066 — 18,361
Loans and advances to customers
- reverse repos 27,532 — — 26 — 27,558
- other 17,559 63 — 285,006 — 3,706 306,334
Debt securities 35,857 111 38,831 2,387 4,911 82,097
Equity shares 660 147 554 — — 1,361
Settlement balances — — 4,116 4,116
Derivatives 258,689 3,825 262,514
Assets of disposal groups 3,486 3,486
Other assets — — — — — 17,892 17,892
31 December 2015 362,661 321 3,825 39,385 379,221 4,911 3,706 21,378 815,408
Cash and balances at central banks — — — 74,872 — 74,872
Loans and advances to banks
- reverse repos 18,129 — — 2,579 — 20,708
- other (1) 11,773 — — 11,254 — 23,027
Loans and advances to customers
- reverse repos 43,018 — — 969 — 43,987
- other 23,038 61 — 307,002 — 4,150 334,251
Debt securities 49,226 117 29,673 3,096 4,537 86,649
Equity shares 4,821 301 513 — — 5,635
Settlement balances — — — 4,667 4,667
Derivatives 348,149 5,441 353,590
Assets of disposal groups 82,011 82,011
Other assets* — — — — — 21,622 21,622
31 December 2014 498,154 479 5,441 30,186 404,439 4,537 4,150 103,633 1,051,019
*Restated - refer to page 267 for further details. Note: (1) Includes items in the course of collection from other banks of £830 million (2014 - £980 million).
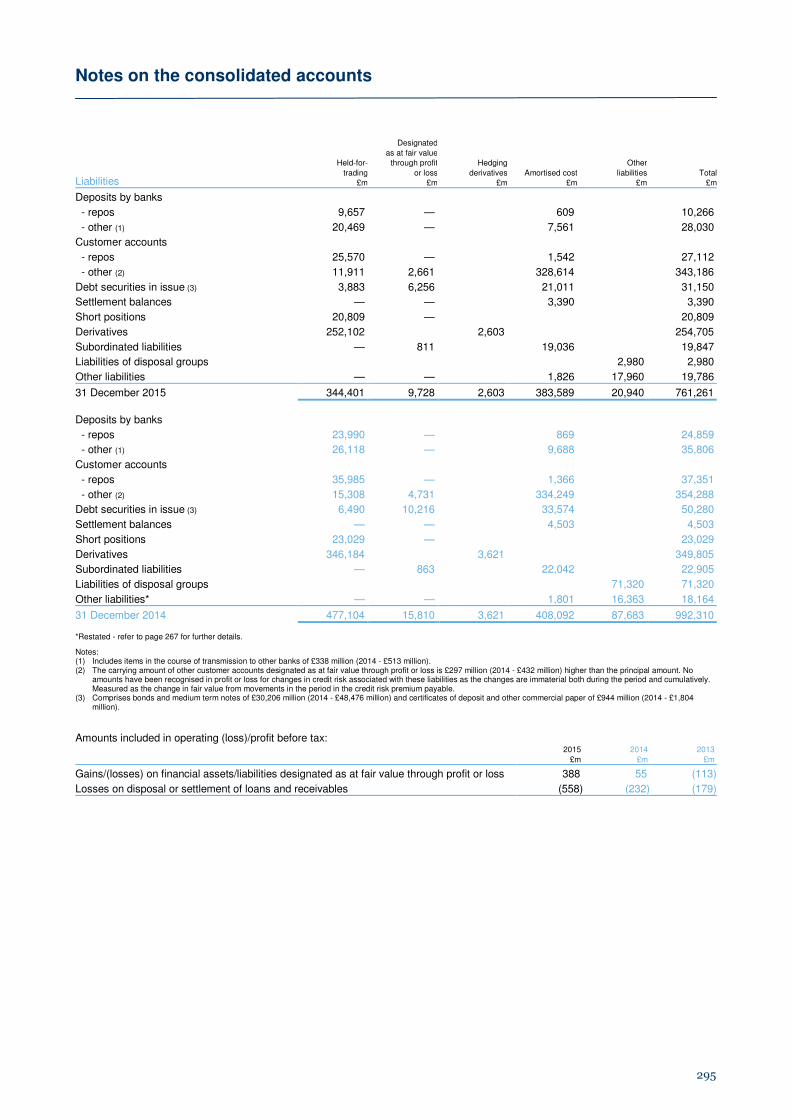
Notes on the consolidated accounts
295
Designated
Total
as at fair value Held-for- through profit Hedging Other
Liabilities trading or loss derivatives Amortised cost liabilities
£m £m £m £m £m £m
Deposits by banks
- repos 9,657 — 609 10,266
- other (1) 20,469 — 7,561 28,030
Customer accounts
- repos 25,570 — 1,542 27,112
- other (2) 11,911 2,661 328,614 343,186
Debt securities in issue (3) 3,883 6,256 21,011 31,150
Settlement balances — — 3,390 3,390
Short positions 20,809 — 20,809
Derivatives 252,102 2,603 254,705
Subordinated liabilities — 811 19,036 19,847
Liabilities of disposal groups 2,980 2,980
Other liabilities — — 1,826 17,960 19,786
31 December 2015 344,401 9,728 2,603 383,589 20,940 761,261
Deposits by banks
- repos 23,990 — 869 24,859
- other (1) 26,118 — 9,688 35,806
Customer accounts
- repos 35,985 — 1,366 37,351
- other (2) 15,308 4,731 334,249 354,288
Debt securities in issue (3) 6,490 10,216 33,574 50,280
Settlement balances — — 4,503 4,503
Short positions 23,029 — 23,029
Derivatives 346,184 3,621 349,805
Subordinated liabilities — 863 22,042 22,905
Liabilities of disposal groups 71,320 71,320
Other liabilities* — — 1,801 16,363 18,164
31 December 2014 477,104 15,810 3,621 408,092 87,683 992,310
*Restated - refer to page 267 for further details.
Notes: (1) Includes items in the course of transmission to other banks of £338 million (2014 - £513 million). (2) The carrying amount of other customer accounts designated as at fair value through profit or loss is £297 million (2014 - £432 million) higher than the principal amount. No
amounts have been recognised in profit or loss for changes in credit risk associated with these liabilities as the changes are immaterial both during the period and cumulatively. Measured as the change in fair value from movements in the period in the credit risk premium payable.
(3) Comprises bonds and medium term notes of £30,206 million (2014 - £48,476 million) and certificates of deposit and other commercial paper of £944 million (2014 - £1,804 million).
Amounts included in operating (loss)/profit before tax:
2015 2014 2013
£m £m £m
Gains/(losses) on financial assets/liabilities designated as at fair value through profit or loss 388 55 (113)
Losses on disposal or settlement of loans and receivables (558) (232) (179)

Notes on the consolidated accounts
296
The tables below present information on financial assets and financial liabilities that are offset on the balance sheet under IFRS or
subject to enforceable master netting agreement together with financial collateral received or given.
Offsetable instruments Offsetable potential not recognised by IFRS Effect of Net amount after Instruments
2015
master netting Other the effect of netting outside
IFRS Balance and similar Cash financial arrangements and netting Balance Gross offset sheet agreements collateral collateral related collateral arrangements sheet total
£m £m £m £m £m £m £m £m £m
Assets
Derivatives 380,467 (123,662) 256,805 (214,800) (27,629) (7,535) 6,841 5,709 262,514
Reverse repos 74,204 (34,361) 39,843 (2,500) — (37,218) 125 — 39,843
Loans to customers 2,955 (2,955) — — — — — 306,334 306,334
Settlement balances 1,271 (1,225) 46 (26) — — 20 4,070 4,116
458,897 (162,203) 296,694 (217,326) (27,629) (44,753) 6,986 316,113 612,807
Liabilities
Derivatives 368,378 (118,366) 250,012 (214,800) (25,729) (8,213) 1,270 4,693 254,705
Repos 71,739 (34,361) 37,378 (2,500) — (34,878) — — 37,378
Customer accounts 8,251 (8,251) — — — — — 343,186 343,186
Settlement balances 1,872 (1,225) 647 (26) — — 621 2,743 3,390
450,240 (162,203) 288,037 (217,326) (25,729) (43,091) 1,891 350,622 638,659
2014
Assets
Derivatives 588,525 (245,418) 343,107 (295,315) (33,272) (7,014) 7,506 10,483 353,590
Reverse repos 95,393 (30,823) 64,570 (5,016) — (59,505) 49 125 64,695
Loans to customers 3,781 (3,781) — — — — — 334,251 334,251
Settlement balances 2,094 (1,997) 97 — — — 97 4,570 4,667
689,793 (282,019) 407,774 (300,331) (33,272) (66,519) 7,652 349,429 757,203
Liabilities
Derivatives 583,363 (241,235) 342,128 (295,315) (30,203) (14,437) 2,173 7,677 349,805
Repos 91,888 (30,823) 61,065 (5,016) — (56,049) — 1,145 62,210
Customer accounts 7,964 (7,964) — — — — — 354,288 354,288
Settlement balances 1,998 (1,997) 1 — — — 1 4,502 4,503
685,213 (282,019) 403,194 (300,331) (30,203) (70,486) 2,174 367,612 770,806
Reclassification of financial instruments
There were no reclassifications in 2015. In 2008 and 2009, financial assets were reclassified from held-for-trading (HFT) into loans and
receivables (LAR) and from HFT into AFS. The tables below show the carrying value, fair value and the effect on profit or loss of these
reclassifications.
Amount that Reduction/ Amount recognised in would have been (increase) in
the income statement recognised had profit or loss
Carrying Fair Impairment reclassification as a result of value value Income losses not occurred reclassification
2015 £m £m £m £m £m £m
Reclassified from HFT to LAR 1,002 877 (19) (15) 4 38
Reclassified from HFT to AFS (1) 206 206 14 — 8 (6)
1,208 1,083 (5) (15) 12 32
2014
Reclassified from HFT to LAR 1,506 1,348 11 (76) 193 258
Reclassified from HFT to AFS (1) 251 251 29 — 27 (2)
1,757 1,599 40 (76) 220 256 Note: (1) A loss of £3 million (2014 - gain of £12 million) was taken to AFS reserves.
In 2014, UK Government bonds with a fair value of £3.6 billion were reclassified from available-for-sale (AFS) to held-to-maturity (HTM).

Notes on the consolidated accounts
297
9 Financial instruments - valuation
Valuation of financial instruments carried at fair value
Control environment
RBS's control environment for the determination of the fair value
of financial instruments includes formalised protocols for the
review and validation of fair values independent of the
businesses entering into the transactions. There are specific
controls to ensure consistent pricing policies and procedures,
incorporating disciplined price verification. RBS ensures that
appropriate attention is given to bespoke transactions, structured
products, illiquid products and other instruments which are
difficult to price.
Independent price verification (IPV)
IPV is a key element of the control environment. Valuations are
first performed by the business which entered into the
transaction. Such valuations may be directly from available
prices, or may be derived using a model and variable model
inputs. These valuations are reviewed, and if necessary
amended, by a team independent of those trading the financial
instruments, in the light of available pricing evidence.
IPV differences are classified according to the quality of
independent market observables into IPV quality bands linked to
the fair value hierarchy principles, as laid out in IFRS 13 ‘Fair
Value Measurement’. These differences are classified into fair
value levels 1, 2 and 3 (with the valuation uncertainty risk
increasing as the levels rise from 1 to 3) and then further
classified into high, medium, low and indicative depending on the
quality of the independent data available to validate the prices.
Valuations are revised if they are outside agreed thresholds.
Governance framework
IPV takes place at least each month end date, for exposures in
the regulatory trading book and at least quarterly for exposures in
the regulatory banking book. The IPV control includes formalised
reporting and escalation of any valuation differences in breach of
established thresholds. The Pricing Unit determines IPV policy,
monitors adherence to that policy and performs additional
independent reviews of highly subjective valuation issues.
The Modelled Product Review Committee sets the policy for
model documentation, testing and review, and prioritises models
with significant exposure for review by the RBS Pricing Model
Risk team. The CIB and RCR Valuation Committees are made up
of valuation specialists and senior business representatives from
various functions and oversee pricing, reserving and valuations
issues. These committees meet monthly to review and ratify any
methodology changes. The Executive Valuation Committee
meets quarterly to address key material and subjective valuation
issues, to review items escalated by the CIB and RCR Valuation
Committees and to discuss other relevant matters including
prudential valuation.
Valuation hierarchy
Initial classification of a financial instrument is carried out by the
Product Control team following the principles in IFRS 13. They
base their judgment on information gathered during the IPV
process for instruments which include the sourcing of
independent prices and model inputs. The quality and
completeness of the information gathered in the IPV process
gives an indication as to the liquidity and valuation uncertainty of
an instrument.
These initial classifications are reviewed and challenged by the
Pricing Unit and are also subject to senior management review.
Particular attention is paid to instruments crossing from one level
to another, new instrument classes or products, instruments that
are generating significant profit and loss and instruments where
valuation uncertainty is high.
Valuation techniques
RBS derives fair value of its instruments differently depending on
whether the instrument is a non-modelled or a modelled product.
Non-modelled products
Non-modelled products are valued directly from a price input
typically on a position by position basis and include cash, equities
and most debt securities.
Modelled products
Modelled products valued using a pricing model range in
complexity from comparatively vanilla products such as interest
rate swaps and options (e.g. interest rate caps and floors)
through to more complex derivatives. The valuation of modelled
products requires an appropriate model and inputs into this
model. Sometimes models are also used to derive inputs (e.g. to
construct volatility surfaces). RBS uses a number of modelling
methodologies.
Inputs to valuation models
Values between and beyond available data points are obtained
by interpolation and extrapolation. When utilising valuation
techniques, the fair value can be significantly affected by the
choice of valuation model and by underlying assumptions
concerning factors such as the amounts and timing of cash flows,
discount rates and credit risk. The principal inputs to these
valuation techniques are as follows:
• Bond prices - quoted prices are generally available for
government bonds, certain corporate securities and some
mortgage-related products.
• Credit spreads - where available, these are derived from
prices of credit default swaps or other credit based
instruments, such as debt securities. For others, credit
spreads are obtained from pricing services.
• Interest rates - these are principally benchmark interest
rates such as the London Interbank Offered Rate (LIBOR),
Overnight Index Swaps (OIS) rate and other quoted interest
rates in the swap, bond and futures markets.

Notes on the consolidated accounts
298
• Foreign currency exchange rates - there are observable
prices both for spot and forward contracts and futures in the
world's major currencies.
• Equity and equity index prices - quoted prices are generally
readily available for equity shares listed on the world's major
stock exchanges and for major indices on such shares.
• Commodity prices - many commodities are actively traded in
spot and forward contracts and futures on exchanges in
London, New York and other commercial centres.
• Price volatilities and correlations - volatility is a measure of
the tendency of a price to change with time. Correlation
measures the degree which two or more prices or other
variables are observed to move together.
• Prepayment rates - the fair value of a financial instrument
that can be prepaid by the issuer or borrower differs from
that of an instrument that cannot be prepaid. In valuing
prepayable instruments that are not quoted in active
markets, RBS considers the value of the prepayment option.
• Counterparty credit spreads - adjustments are made to
market prices (or parameters) when the creditworthiness of
the counterparty differs from that of the assumed
counterparty in the market price (or parameters).
• Recovery rates/loss given default - these are used as an
input to valuation models and reserves for asset-backed
securities and other credit products as an indicator of
severity of losses on default. Recovery rates are primarily
sourced from market data providers or inferred from
observable credit spreads.
Consensus pricing
RBS uses consensus prices for the IPV of some instruments. The
consensus service encompasses the equity, interest rate,
currency, commodity, credit, property, fund and bond markets,
providing comprehensive matrices of vanilla prices and a wide
selection of exotic products. CIB and RCR contribute to
consensus pricing services where there is a significant interest
either from a positional point of view or to test models for future
business use. Data sourced from consensus pricing services are
used for a combination of control processes including direct price
testing, evidence of observability and model testing. In practice
this means that RBS submits prices for all material positions for
which a service is available. Data from consensus services are
subject to the same level of quality review as other inputs used
for IPV process.
In order to determine a reliable fair value, where appropriate,
management applies valuation adjustments to the pricing
information gathered from the above sources. The sources of
independent data are reviewed for quality and are applied in the
IPV processes using a formalised input quality hierarchy. These
adjustments reflect RBS's assessment of factors that market
participants would consider in setting a price.
Furthermore, on an ongoing basis, RBS assesses the
appropriateness of any model used. To the extent that the price
determined by internal models does not represent the fair value
of the instrument, for instance in highly stressed market
conditions, RBS makes adjustments to the model valuation to
calibrate to other available pricing sources.
Where unobservable inputs are used, RBS may determine a
range of possible valuations derived from differing stress
scenarios to determine the sensitivity associated with the
valuation. When establishing the fair value of a financial
instrument using a valuation technique, RBS considers
adjustments to the modelled price which market participants
would make when pricing that instrument. Such adjustments
include the credit quality of the counterparty and adjustments to
compensate for model limitations.
Valuation reserves
When valuing financial instruments in the trading book,
adjustments are made to mid-market valuations to cover bid-offer
spread, liquidity and credit risk. A breakdown of valuation
adjustments is provided in Capital and risk management: Credit
derivatives on page 230.
Credit valuation adjustments (CVA)
CVA represent an estimate of the adjustment to fair value that a
market participant would make to incorporate the counterparty
credit risk inherent in derivative exposures. CVA is actively
managed by a credit and market risk hedging process, and
therefore movements in CVA are partially offset by trading
revenue on the hedges.
The CVA is calculated on a portfolio basis reflecting an estimate
of the amount a third party would charge to assume the credit
risk.
Where a positive exposure exists to a counterparty that is
considered to be close to default, the CVA is calculated by
applying expected losses to the current level of exposure.
Otherwise, expected losses are applied to estimated potential
future positive exposures which are modelled to reflect the
volatility of the market factors which drive the exposures and the
correlation between those factors.
Expected losses are determined from market implied probabilities
of default and internally assessed recovery levels. The probability
of default is calculated with reference to observable credit
spreads and observable recovery levels. For counterparties
where observable data do not exist, the probability of default is
determined from the credit spreads and recovery levels of
similarly rated entities.
Collateral held under a credit support agreement is factored into
the CVA calculation. In such cases where RBS holds collateral
against counterparty exposures, CVA is held to the extent that
residual risk remains.
Notes on the consolidated accounts
299
Bid-offer, liquidity and other reserves
Fair value positions are adjusted to bid (long positions) or offer
(short positions) levels, by marking individual cash positions
directly to bid or offer or by taking bid-offer reserves calculated on
a portfolio basis for derivatives exposures. The bid-offer
approach is based on current market spreads and standard
market bucketing of risk.
Bid-offer adjustments for each risk factor (including delta (the
degree to which the price of an instrument changes in response
to a change in the price of the underlying), vega (the degree to
which the price of an instrument changes in response to the
volatility in the price of the underlying), correlation (the degree to
which prices of different instruments move together)) are
determined by aggregating similar risk exposures arising on
different products. Additional basis bid-offer reserves are taken
where these are charged in the market.
Bid-offer spreads vary by maturity and risk type to reflect different
spreads in the market. For positions where there is no observable
quote, the bid-offer spreads are widened in comparison to
proxies to reflect reduced liquidity or observability. Bid-offer
methodologies may also incorporate liquidity triggers whereby
wider spreads are applied to risks above pre-defined thresholds.
As permitted by IFRS 13, netting is applied on a portfolio basis to
reflect the value at which RBS believes it could exit the portfolio,
rather than the sum of exit costs for each of the portfolio’s
individual trades. This is applied where the asset and liability
positions are managed as a portfolio for risk and reporting
purposes.
Vanilla risk on exotic products is typically reserved as part of the
overall portfolio based calculation e.g. delta and vega risk on
exotic products are included within the delta and vega bid-offer
calculations.
Product related risks such as correlation risk, attract specific bid-
offer reserves. Additional reserves are provided for exotic
products to ensure overall reserves match market close-out
costs. These market close-out costs inherently incorporate risk
decay and cross-effects (taking into account how changes in one
risk factor may affect other inputs rather than treating all risk
factors independently) that are unlikely to be adequately reflected
in a static hedge based on vanilla instruments. Where there is
limited bid-offer information for a product, the pricing approach
and risk management strategy are taken into account when
assessing the reserve.
The discount rates applied to derivative cash flows in determining
fair value reflect any underlying collateral agreements.
Collateralised derivatives are generally discounted at the relevant
OIS rates at an individual trade level. Uncollateralised derivatives
are discounted with reference to funding levels by applying a
funding spread over benchmark interest rates on a portfolio basis
(funding valuation adjustment).
Funding valuation adjustment (FVA)
FVA represent an estimate of the adjustment to fair value that a
market participant would make to incorporate funding costs and
benefits that arise in relation to uncollateralised derivative
exposures.
Funding levels are applied to estimated potential future
exposures, the modelling of which is consistent with the approach
used in the calculation of CVA. The counterparty contingent
nature of the exposures is reflected in the calculation.
Amounts deferred on initial recognition
On initial recognition of financial assets and liabilities valued
using valuation techniques incorporating information other than
observable market data, any difference between the transaction
price and that derived from the valuation technique is deferred.
Such amounts are recognised in profit or loss over the life of the
transaction; when market data becomes observable; or when the
transaction matures or is closed out as appropriate. At 31
December 2015, net gains of £81 million (2014 - £119 million)
were carried forward. During the year, net gains of £16 million
(2014 - £53 million) were deferred and £53 million (2014 - £139
million) were recognised in the income statement.
Own credit
RBS takes into account the effect of its own credit standing when
valuing financial liabilities recorded at fair value in accordance
with IFRS. Own credit spread adjustments are made when
valuing issued debt held at fair value, including issued structured
notes, and derivatives. An own credit adjustment is applied to
positions where it is believed that counterparties would consider
RBS's creditworthiness when pricing trades.
For issued debt this adjustment is based on debt issuance
spreads above average inter-bank rates (at a range of tenors).
Secondary senior debt issuance spreads are used in the
calculation of the own credit adjustment applied to senior debt.
The fair value of RBS's derivative financial liabilities is also
adjusted to reflect RBS's own credit risk through debit valuation
adjustments (DVA). Expected gains are applied to estimated
potential future negative exposures, the modelling of which is
consistent with the approach used in the calculation of CVA.
Expected gains are determined from market implied probabilities
of default and recovery levels. FVA is considered the primary
adjustment applied to derivative liabilities. The extent to which
DVA and FVA overlap is eliminated from DVA.
The own credit adjustment does not alter cash flows, is not used
for performance management, is disregarded for regulatory
capital reporting processes and will reverse over time as the
liabilities mature.
The reserve movement between periods will not equate to the
reported profit or loss for own credit. The balance sheet reserves
are stated by conversion of underlying currency balances at spot
rates for each period whereas the income statement includes
intra-period foreign exchange sell-offs.
The effect of change in credit spreads could reverse in future
periods provided the liability is not repaid at a premium or a
discount.
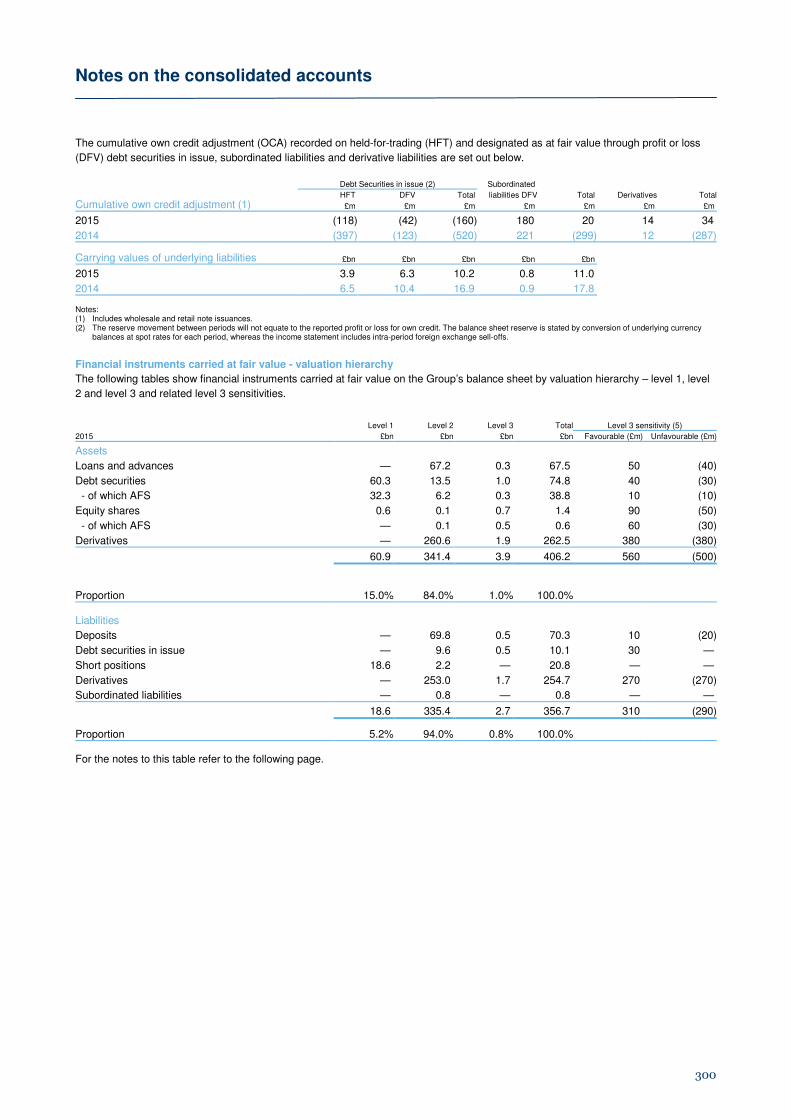
Notes on the consolidated accounts
300
The cumulative own credit adjustment (OCA) recorded on held-for-trading (HFT) and designated as at fair value through profit or loss
(DFV) debt securities in issue, subordinated liabilities and derivative liabilities are set out below. Debt Securities in issue (2) Subordinated
Cumulative own credit adjustment (1) HFT DFV Total liabilities DFV Total Derivatives Total
£m £m £m £m £m £m £m
2015 (118) (42) (160) 180 20 14 34
2014 (397) (123) (520) 221 (299) 12 (287) Carrying values of underlying liabilities £bn £bn £bn £bn £bn
2015 3.9 6.3 10.2 0.8 11.0
2014 6.5 10.4 16.9 0.9 17.8 Notes: (1) Includes wholesale and retail note issuances. (2) The reserve movement between periods will not equate to the reported profit or loss for own credit. The balance sheet reserve is stated by conversion of underlying currency
balances at spot rates for each period, whereas the income statement includes intra-period foreign exchange sell-offs.
Financial instruments carried at fair value - valuation hierarchy The following tables show financial instruments carried at fair value on the Group’s balance sheet by valuation hierarchy – level 1, level
2 and level 3 and related level 3 sensitivities.
Level 1 Level 2 Level 3 Total Level 3 sensitivity (5)
2015 £bn £bn £bn £bn Favourable (£m) Unfavourable (£m)
Assets
Loans and advances — 67.2 0.3 67.5 50 (40)
Debt securities 60.3 13.5 1.0 74.8 40 (30)
- of which AFS 32.3 6.2 0.3 38.8 10 (10)
Equity shares 0.6 0.1 0.7 1.4 90 (50)
- of which AFS — 0.1 0.5 0.6 60 (30)
Derivatives — 260.6 1.9 262.5 380 (380)
60.9 341.4 3.9 406.2 560 (500)
Proportion 15.0% 84.0% 1.0% 100.0% Liabilities
Deposits — 69.8 0.5 70.3 10 (20)
Debt securities in issue — 9.6 0.5 10.1 30 —
Short positions 18.6 2.2 — 20.8 — —
Derivatives — 253.0 1.7 254.7 270 (270)
Subordinated liabilities — 0.8 — 0.8 — —
18.6 335.4 2.7 356.7 310 (290)
Proportion 5.2% 94.0% 0.8% 100.0% For the notes to this table refer to the following page.
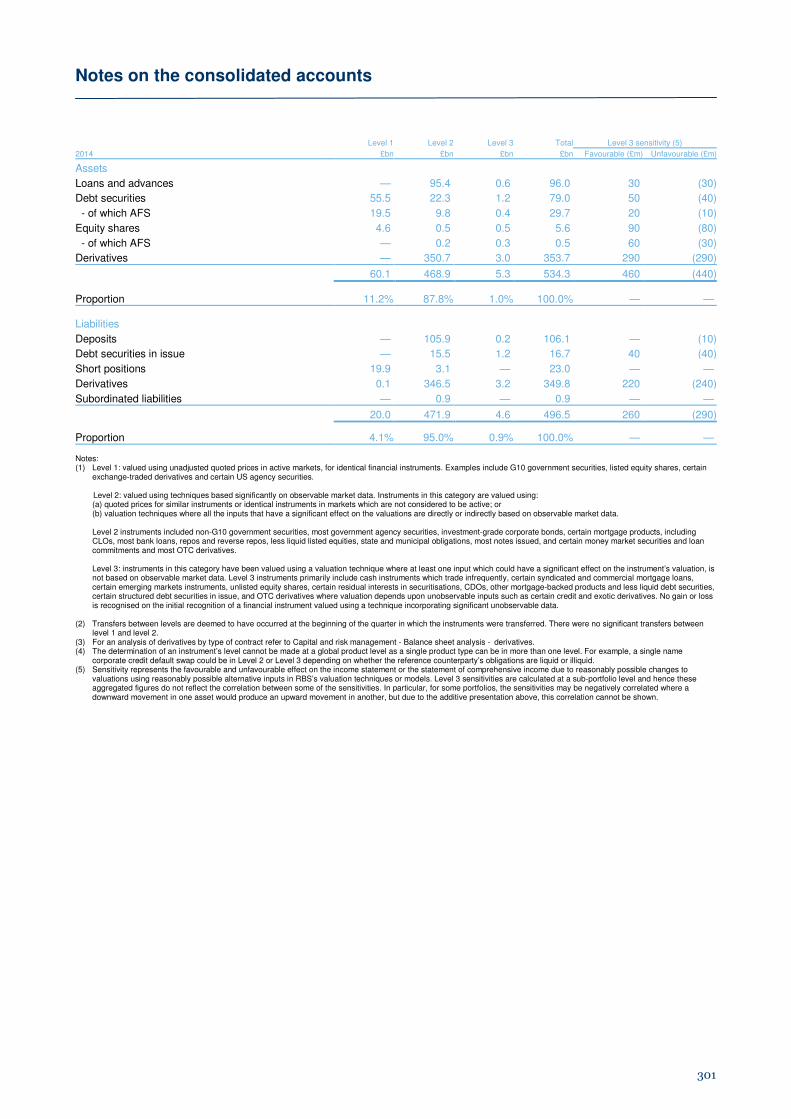
Notes on the consolidated accounts
301
Level 1 Level 2 Level 3 Total Level 3 sensitivity (5)
2014 £bn £bn £bn £bn Favourable (£m) Unfavourable (£m)
Assets
Loans and advances — 95.4 0.6 96.0 30 (30)
Debt securities 55.5 22.3 1.2 79.0 50 (40)
- of which AFS 19.5 9.8 0.4 29.7 20 (10)
Equity shares 4.6 0.5 0.5 5.6 90 (80)
- of which AFS — 0.2 0.3 0.5 60 (30)
Derivatives — 350.7 3.0 353.7 290 (290)
60.1 468.9 5.3 534.3 460 (440)
Proportion 11.2% 87.8% 1.0% 100.0% — — Liabilities
Deposits — 105.9 0.2 106.1 — (10)
Debt securities in issue — 15.5 1.2 16.7 40 (40)
Short positions 19.9 3.1 — 23.0 — —
Derivatives 0.1 346.5 3.2 349.8 220 (240)
Subordinated liabilities — 0.9 — 0.9 — —
20.0 471.9 4.6 496.5 260 (290)
Proportion 4.1% 95.0% 0.9% 100.0% — — Notes: (1) Level 1: valued using unadjusted quoted prices in active markets, for identical financial instruments. Examples include G10 government securities, listed equity shares, certain
exchange-traded derivatives and certain US agency securities. Level 2: valued using techniques based significantly on observable market data. Instruments in this category are valued using:
(a) quoted prices for similar instruments or identical instruments in markets which are not considered to be active; or (b) valuation techniques where all the inputs that have a significant effect on the valuations are directly or indirectly based on observable market data.
Level 2 instruments included non-G10 government securities, most government agency securities, investment-grade corporate bonds, certain mortgage products, including CLOs, most bank loans, repos and reverse repos, less liquid listed equities, state and municipal obligations, most notes issued, and certain money market securities and loan commitments and most OTC derivatives.
Level 3: instruments in this category have been valued using a valuation technique where at least one input which could have a significant effect on the instrument’s valuation, is not based on observable market data. Level 3 instruments primarily include cash instruments which trade infrequently, certain syndicated and commercial mortgage loans, certain emerging markets instruments, unlisted equity shares, certain residual interests in securitisations, CDOs, other mortgage-backed products and less liquid debt securities, certain structured debt securities in issue, and OTC derivatives where valuation depends upon unobservable inputs such as certain credit and exotic derivatives. No gain or loss is recognised on the initial recognition of a financial instrument valued using a technique incorporating significant unobservable data.
(2) Transfers between levels are deemed to have occurred at the beginning of the quarter in which the instruments were transferred. There were no significant transfers between level 1 and level 2.
(3) For an analysis of derivatives by type of contract refer to Capital and risk management - Balance sheet analysis - derivatives. (4) The determination of an instrument’s level cannot be made at a global product level as a single product type can be in more than one level. For example, a single name
corporate credit default swap could be in Level 2 or Level 3 depending on whether the reference counterparty’s obligations are liquid or illiquid. (5) Sensitivity represents the favourable and unfavourable effect on the income statement or the statement of comprehensive income due to reasonably possible changes to
valuations using reasonably possible alternative inputs in RBS’s valuation techniques or models. Level 3 sensitivities are calculated at a sub-portfolio level and hence these aggregated figures do not reflect the correlation between some of the sensitivities. In particular, for some portfolios, the sensitivities may be negatively correlated where a downward movement in one asset would produce an upward movement in another, but due to the additive presentation above, this correlation cannot be shown.
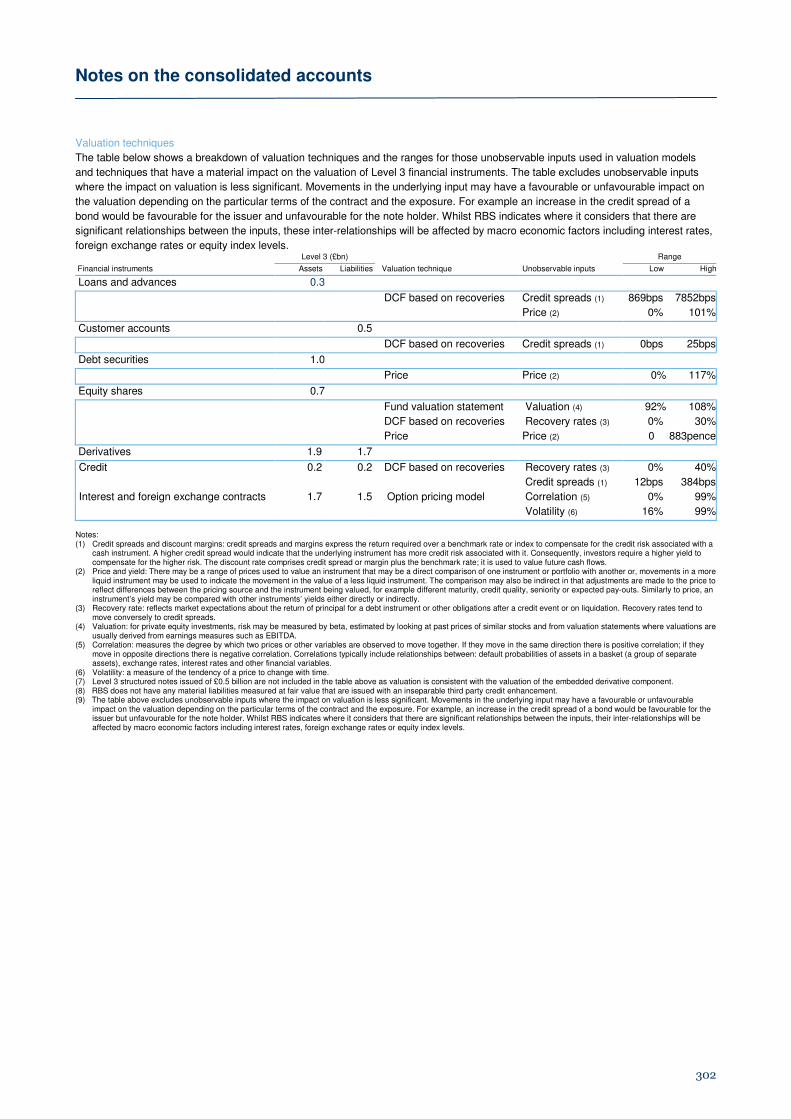
Notes on the consolidated accounts
302
Valuation techniques
The table below shows a breakdown of valuation techniques and the ranges for those unobservable inputs used in valuation models
and techniques that have a material impact on the valuation of Level 3 financial instruments. The table excludes unobservable inputs
where the impact on valuation is less significant. Movements in the underlying input may have a favourable or unfavourable impact on
the valuation depending on the particular terms of the contract and the exposure. For example an increase in the credit spread of a
bond would be favourable for the issuer and unfavourable for the note holder. Whilst RBS indicates where it considers that there are
significant relationships between the inputs, these inter-relationships will be affected by macro economic factors including interest rates,
foreign exchange rates or equity index levels. Level 3 (£bn) Range
Financial instruments Assets Liabilities Valuation technique Unobservable inputs Low High
Loans and advances 0.3
DCF based on recoveries Credit spreads (1) 869bps 7852bps
Price (2) 0% 101%
Customer accounts 0.5
DCF based on recoveries Credit spreads (1) 0bps 25bps
Debt securities 1.0
Price Price (2) 0% 117%
Equity shares 0.7
Fund valuation statement Valuation (4) 92% 108%
DCF based on recoveries Recovery rates (3) 0% 30%
Price Price (2) 0 883pence
Derivatives 1.9 1.7
Credit 0.2 0.2 DCF based on recoveries Recovery rates (3) 0% 40%
Credit spreads (1) 12bps 384bps
Interest and foreign exchange contracts 1.7 1.5 Option pricing model Correlation (5) 0% 99%
Volatility (6) 16% 99% Notes: (1) Credit spreads and discount margins: credit spreads and margins express the return required over a benchmark rate or index to compensate for the credit risk associated with a
cash instrument. A higher credit spread would indicate that the underlying instrument has more credit risk associated with it. Consequently, investors require a higher yield to compensate for the higher risk. The discount rate comprises credit spread or margin plus the benchmark rate; it is used to value future cash flows.
(2) Price and yield: There may be a range of prices used to value an instrument that may be a direct comparison of one instrument or portfolio with another or, movements in a more liquid instrument may be used to indicate the movement in the value of a less liquid instrument. The comparison may also be indirect in that adjustments are made to the price to reflect differences between the pricing source and the instrument being valued, for example different maturity, credit quality, seniority or expected pay-outs. Similarly to price, an instrument’s yield may be compared with other instruments’ yields either directly or indirectly.
(3) Recovery rate: reflects market expectations about the return of principal for a debt instrument or other obligations after a credit event or on liquidation. Recovery rates tend to move conversely to credit spreads.
(4) Valuation: for private equity investments, risk may be measured by beta, estimated by looking at past prices of similar stocks and from valuation statements where valuations are usually derived from earnings measures such as EBITDA.
(5) Correlation: measures the degree by which two prices or other variables are observed to move together. If they move in the same direction there is positive correlation; if they move in opposite directions there is negative correlation. Correlations typically include relationships between: default probabilities of assets in a basket (a group of separate assets), exchange rates, interest rates and other financial variables.
(6) Volatility: a measure of the tendency of a price to change with time. (7) Level 3 structured notes issued of £0.5 billion are not included in the table above as valuation is consistent with the valuation of the embedded derivative component. (8) RBS does not have any material liabilities measured at fair value that are issued with an inseparable third party credit enhancement. (9) The table above excludes unobservable inputs where the impact on valuation is less significant. Movements in the underlying input may have a favourable or unfavourable
impact on the valuation depending on the particular terms of the contract and the exposure. For example, an increase in the credit spread of a bond would be favourable for the issuer but unfavourable for the note holder. Whilst RBS indicates where it considers that there are significant relationships between the inputs, their inter-relationships will be affected by macro economic factors including interest rates, foreign exchange rates or equity index levels.
Notes on the consolidated accounts
303
9 Financial instruments - valuation continued
The Level 3 sensitivities on the previous page are calculated at a
trade or low level portfolio basis. They are not calculated on an
overall portfolio basis and therefore do not reflect the likely
potential uncertainty on the portfolio as a whole. The figures are
aggregated and do not reflect the correlated nature of some of
the sensitivities. In particular, for some of the portfolios the
sensitivities may be negatively correlated where a downwards
movement in one asset would produce an upwards movement in
another, but due to the additive presentation of the above figures
this correlation cannot be displayed. The actual potential
downside sensitivity of the total portfolio may be less than the
non-correlated sum of the additive figures as shown in the above
table.
Judgmental issues
The diverse range of products traded by RBS results in a wide
range of instruments that are classified into Level 3 of the
hierarchy. Whilst the majority of these instruments naturally fall
into a particular level, for some products an element of judgment
is required. The majority of RBS’s financial instruments carried at
fair value are classified as Level 2: inputs are observable either
directly (i.e. as a price) or indirectly (i.e. derived from prices).
Active and inactive markets
A key input in the decision making process for the allocation of
assets to a particular level is liquidity. In general, the degree of
valuation uncertainty depends on the degree of liquidity of an
input.
Where markets are liquid or very liquid, little judgment is required.
However, when the information regarding the liquidity in a
particular market is not clear, a judgment may need to be made.
This can be more difficult as assessing the liquidity of a market is
not always straightforward. For an equity traded on an exchange,
daily volumes of trading can be seen, but for an over-the-counter
(OTC) derivative assessing the liquidity of the market with no
central exchange is more difficult.
A key related issue is where a market moves from liquid to illiquid
or vice versa. Where this change is considered to be temporary,
the classification is not changed. For example, if there is little
market trading in a product on a reporting date but at the
previous reporting date and during the intervening period the
market has been considered to be liquid, the instrument will
continue to be classified in the same level in the hierarchy. This is
to provide consistency so that transfers between levels are driven
by genuine changes in market liquidity and do not reflect short
term or seasonal effects.
The breadth and depth of the IPV data allows for a rules based
quality assessment to be made of market activity, liquidity and
pricing uncertainty, which assists with the process of allocation to
an appropriate level. Where suitable independent pricing
information is not readily available, the quality assessment will
result in the instrument being assessed as Level 3.
Modelled products
For modelled products the market convention is to quote these
trades through the model inputs or parameters as opposed to a
cash price equivalent. A mark-to-market is derived from the use
of the independent market inputs calculated using RBS’s model.
The decision to classify a modelled instrument as Level 2 or 3 will
be dependent upon the product/model combination, the currency,
the maturity, the observability and quality of input parameters and
other factors. All these must be assessed to classify the asset.
If an input fails the observability or quality tests then the
instrument is considered to be in Level 3 unless the input can be
shown to have an insignificant effect on the overall valuation of
the product.
The majority of derivative instruments for example vanilla interest
rate swaps, foreign exchange swaps and liquid single name
credit derivatives are classified as Level 2 as they are vanilla
products valued using observable inputs. The valuation
uncertainty on these is considered to be low and both input and
output testing may be available.
Non-modelled products
Non-modelled products are generally quoted on a price basis and
can therefore be considered for each of the three levels. This is
determined by the market activity, liquidity and valuation
uncertainty of the instruments which is in turn measured from the
availability of independent data used by the IPV process to
allocate positions to IPV quality levels.
The availability and quality of independent pricing information are
considered during the classification process. An assessment is
made regarding the quality of the independent information. For
example, where consensus prices are used for non-modelled
products, a key assessment of the quality of a price is the depth
of the number of prices used to provide the consensus price. If
the depth of contributors falls below a set hurdle rate, the
instrument is considered to be Level 3. This hurdle rate is that
used in the IPV process to determine the IPV quality rating.
However, where an instrument is generally considered to be
illiquid, but regular quotes from market participants exist, these
instruments may be classified as Level 2 depending on frequency
of quotes, other available pricing and whether the quotes are
used as part of the IPV process or not.
For some instruments with a wide number of available price
sources, there may be differing quality of available information
and there may be a wide range of prices from different sources.
In these situations the highest quality source is used to determine
the classification of the asset. For example, a tradable quote
would be considered a better source than a consensus price.
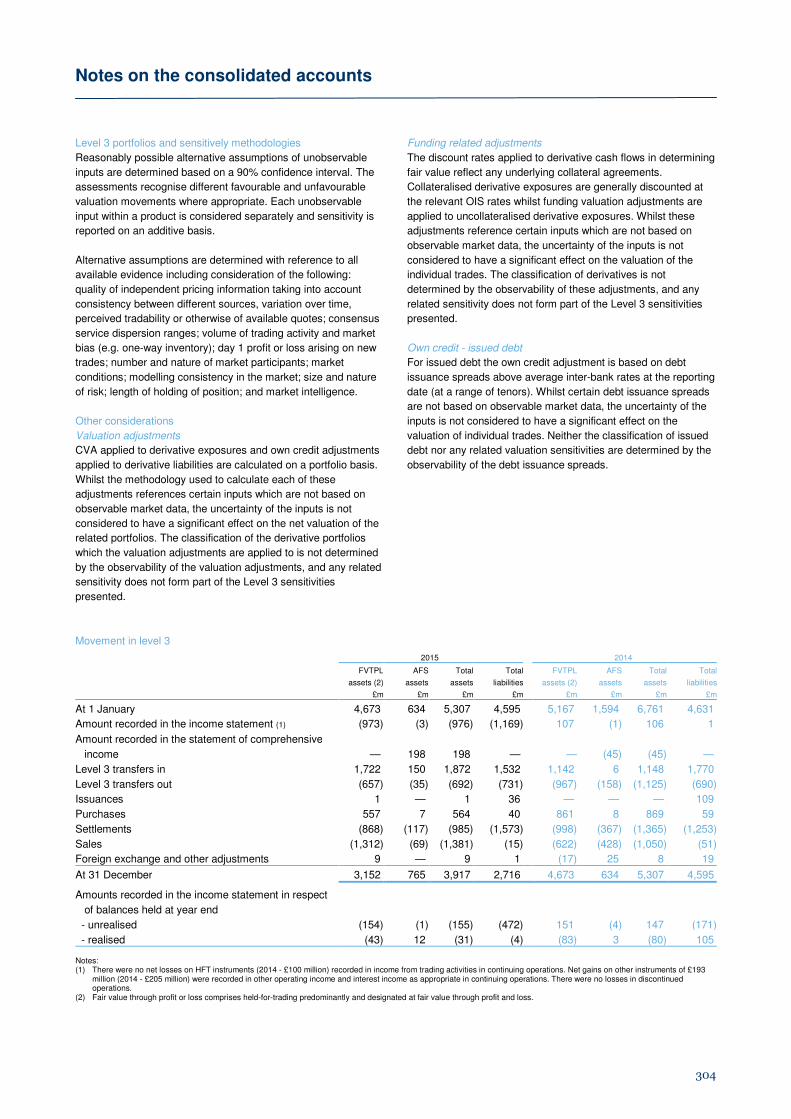
Notes on the consolidated accounts
304
Level 3 portfolios and sensitively methodologies
Reasonably possible alternative assumptions of unobservable
inputs are determined based on a 90% confidence interval. The
assessments recognise different favourable and unfavourable
valuation movements where appropriate. Each unobservable
input within a product is considered separately and sensitivity is
reported on an additive basis.
Alternative assumptions are determined with reference to all
available evidence including consideration of the following:
quality of independent pricing information taking into account
consistency between different sources, variation over time,
perceived tradability or otherwise of available quotes; consensus
service dispersion ranges; volume of trading activity and market
bias (e.g. one-way inventory); day 1 profit or loss arising on new
trades; number and nature of market participants; market
conditions; modelling consistency in the market; size and nature
of risk; length of holding of position; and market intelligence.
Other considerations
Valuation adjustments
CVA applied to derivative exposures and own credit adjustments
applied to derivative liabilities are calculated on a portfolio basis.
Whilst the methodology used to calculate each of these
adjustments references certain inputs which are not based on
observable market data, the uncertainty of the inputs is not
considered to have a significant effect on the net valuation of the
related portfolios. The classification of the derivative portfolios
which the valuation adjustments are applied to is not determined
by the observability of the valuation adjustments, and any related
sensitivity does not form part of the Level 3 sensitivities
presented.
Funding related adjustments
The discount rates applied to derivative cash flows in determining
fair value reflect any underlying collateral agreements.
Collateralised derivative exposures are generally discounted at
the relevant OIS rates whilst funding valuation adjustments are
applied to uncollateralised derivative exposures. Whilst these
adjustments reference certain inputs which are not based on
observable market data, the uncertainty of the inputs is not
considered to have a significant effect on the valuation of the
individual trades. The classification of derivatives is not
determined by the observability of these adjustments, and any
related sensitivity does not form part of the Level 3 sensitivities
presented.
Own credit - issued debt
For issued debt the own credit adjustment is based on debt
issuance spreads above average inter-bank rates at the reporting
date (at a range of tenors). Whilst certain debt issuance spreads
are not based on observable market data, the uncertainty of the
inputs is not considered to have a significant effect on the
valuation of individual trades. Neither the classification of issued
debt nor any related valuation sensitivities are determined by the
observability of the debt issuance spreads.
Movement in level 3 2015 2014
FVTPL AFS Total Total FVTPL AFS Total Total
assets (2) assets assets liabilities assets (2) assets assets liabilities
£m £m £m £m £m £m £m £m
At 1 January 4,673 634 5,307 4,595 5,167 1,594 6,761 4,631
Amount recorded in the income statement (1) (973) (3) (976) (1,169) 107 (1) 106 1
Amount recorded in the statement of comprehensive income — 198 198 — — (45) (45) —
Level 3 transfers in 1,722 150 1,872 1,532 1,142 6 1,148 1,770
Level 3 transfers out (657) (35) (692) (731) (967) (158) (1,125) (690)
Issuances 1 — 1 36 — — — 109
Purchases 557 7 564 40 861 8 869 59
Settlements (868) (117) (985) (1,573) (998) (367) (1,365) (1,253)
Sales (1,312) (69) (1,381) (15) (622) (428) (1,050) (51)
Foreign exchange and other adjustments 9 — 9 1 (17) 25 8 19
At 31 December 3,152 765 3,917 2,716 4,673 634 5,307 4,595
Amounts recorded in the income statement in respect
of balances held at year end
- unrealised (154) (1) (155) (472) 151 (4) 147 (171)
- realised (43) 12 (31) (4) (83) 3 (80) 105 Notes: (1) There were no net losses on HFT instruments (2014 - £100 million) recorded in income from trading activities in continuing operations. Net gains on other instruments of £193
million (2014 - £205 million) were recorded in other operating income and interest income as appropriate in continuing operations. There were no losses in discontinued operations.
(2) Fair value through profit or loss comprises held-for-trading predominantly and designated at fair value through profit and loss.
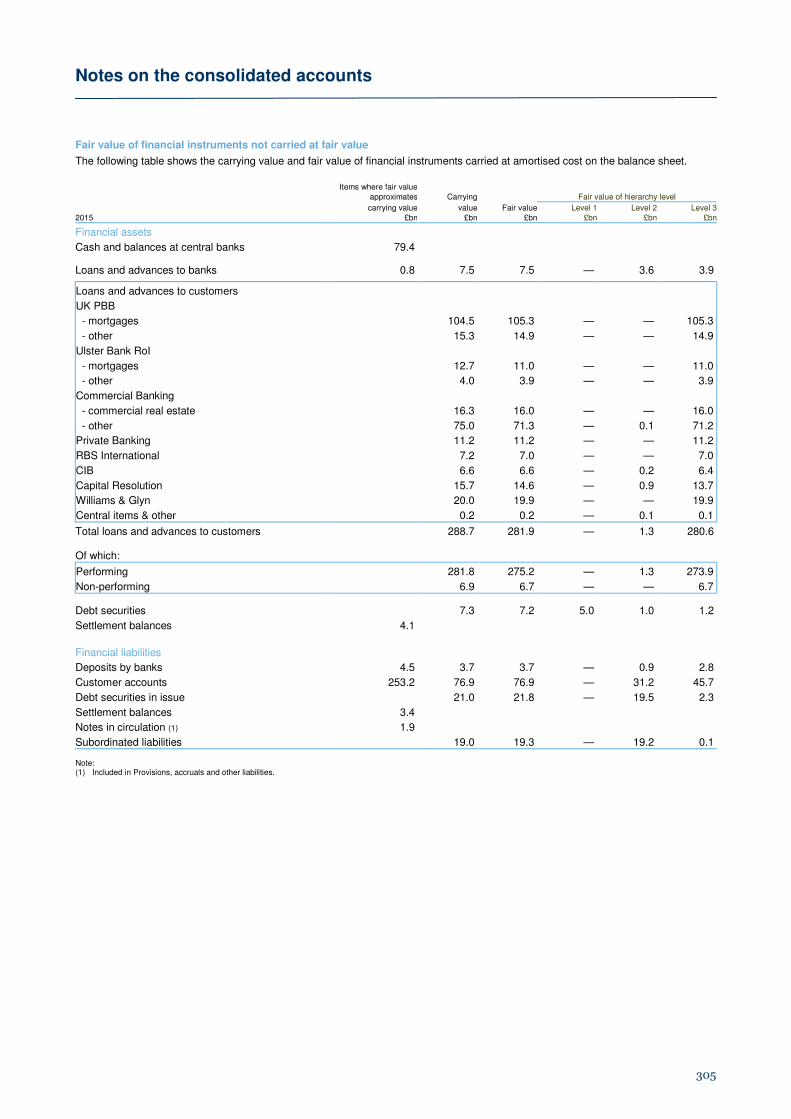
Notes on the consolidated accounts
305
Fair value of financial instruments not carried at fair value The following table shows the carrying value and fair value of financial instruments carried at amortised cost on the balance sheet. Items where fair value
approximates Carrying Fair value of hierarchy level
carrying value value Fair value Level 1 Level 2 Level 32015 £bn £bn £bn £bn £bn £bn
Financial assets
Cash and balances at central banks 79.4 Loans and advances to banks 0.8 7.5 7.5 — 3.6 3.9 Loans and advances to customers
UK PBB
- mortgages 104.5 105.3 — — 105.3
- other 15.3 14.9 — — 14.9
Ulster Bank RoI
- mortgages 12.7 11.0 — — 11.0
- other 4.0 3.9 — — 3.9
Commercial Banking
- commercial real estate 16.3 16.0 — — 16.0
- other 75.0 71.3 — 0.1 71.2
Private Banking 11.2 11.2 — — 11.2
RBS International 7.2 7.0 — — 7.0
CIB 6.6 6.6 — 0.2 6.4
Capital Resolution 15.7 14.6 — 0.9 13.7
Williams & Glyn 20.0 19.9 — — 19.9
Central items & other 0.2 0.2 — 0.1 0.1
Total loans and advances to customers 288.7 281.9 — 1.3 280.6 Of which: Performing 281.8 275.2 — 1.3 273.9
Non-performing 6.9 6.7 — — 6.7 Debt securities 7.3 7.2 5.0 1.0 1.2
Settlement balances 4.1
Financial liabilities
Deposits by banks 4.5 3.7 3.7 — 0.9 2.8
Customer accounts 253.2 76.9 76.9 — 31.2 45.7
Debt securities in issue 21.0 21.8 — 19.5 2.3
Settlement balances 3.4
Notes in circulation (1) 1.9
Subordinated liabilities 19.0 19.3 — 19.2 0.1 Note: (1) Included in Provisions, accruals and other liabilities.
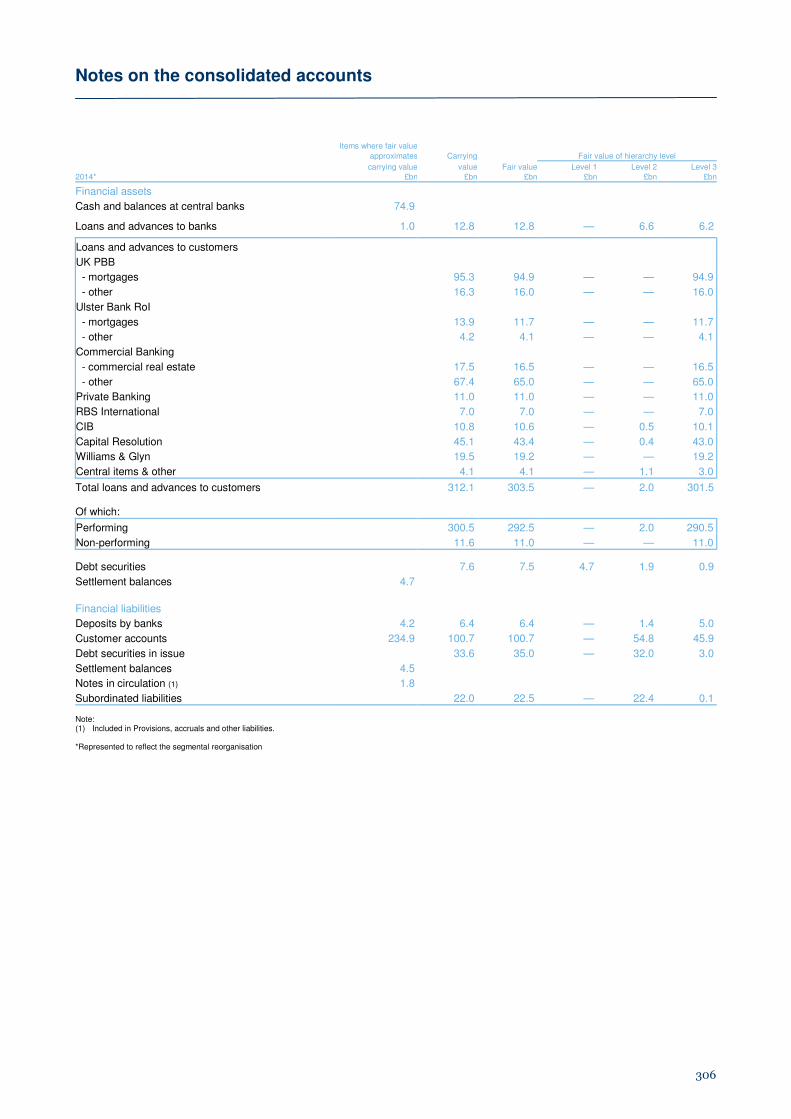
Notes on the consolidated accounts
306
Items where fair value
approximates Carrying Fair value of hierarchy level
carrying value value Fair value Level 1 Level 2 Level 32014* £bn £bn £bn £bn £bn £bn
Financial assets
Cash and balances at central banks 74.9 Loans and advances to banks 1.0 12.8 12.8 — 6.6 6.2 Loans and advances to customers
UK PBB
- mortgages 95.3 94.9 — — 94.9
- other 16.3 16.0 — — 16.0
Ulster Bank RoI
- mortgages 13.9 11.7 — — 11.7
- other 4.2 4.1 — — 4.1
Commercial Banking
- commercial real estate 17.5 16.5 — — 16.5
- other 67.4 65.0 — — 65.0
Private Banking 11.0 11.0 — — 11.0
RBS International 7.0 7.0 — — 7.0
CIB 10.8 10.6 — 0.5 10.1
Capital Resolution 45.1 43.4 — 0.4 43.0
Williams & Glyn 19.5 19.2 — — 19.2
Central items & other 4.1 4.1 — 1.1 3.0
Total loans and advances to customers 312.1 303.5 — 2.0 301.5 Of which: Performing 300.5 292.5 — 2.0 290.5
Non-performing 11.6 11.0 — — 11.0 Debt securities 7.6 7.5 4.7 1.9 0.9
Settlement balances 4.7
Financial liabilities
Deposits by banks 4.2 6.4 6.4 — 1.4 5.0
Customer accounts 234.9 100.7 100.7 — 54.8 45.9
Debt securities in issue 33.6 35.0 — 32.0 3.0
Settlement balances 4.5
Notes in circulation (1) 1.8
Subordinated liabilities 22.0 22.5 — 22.4 0.1 Note: (1) Included in Provisions, accruals and other liabilities. *Represented to reflect the segmental reorganisation
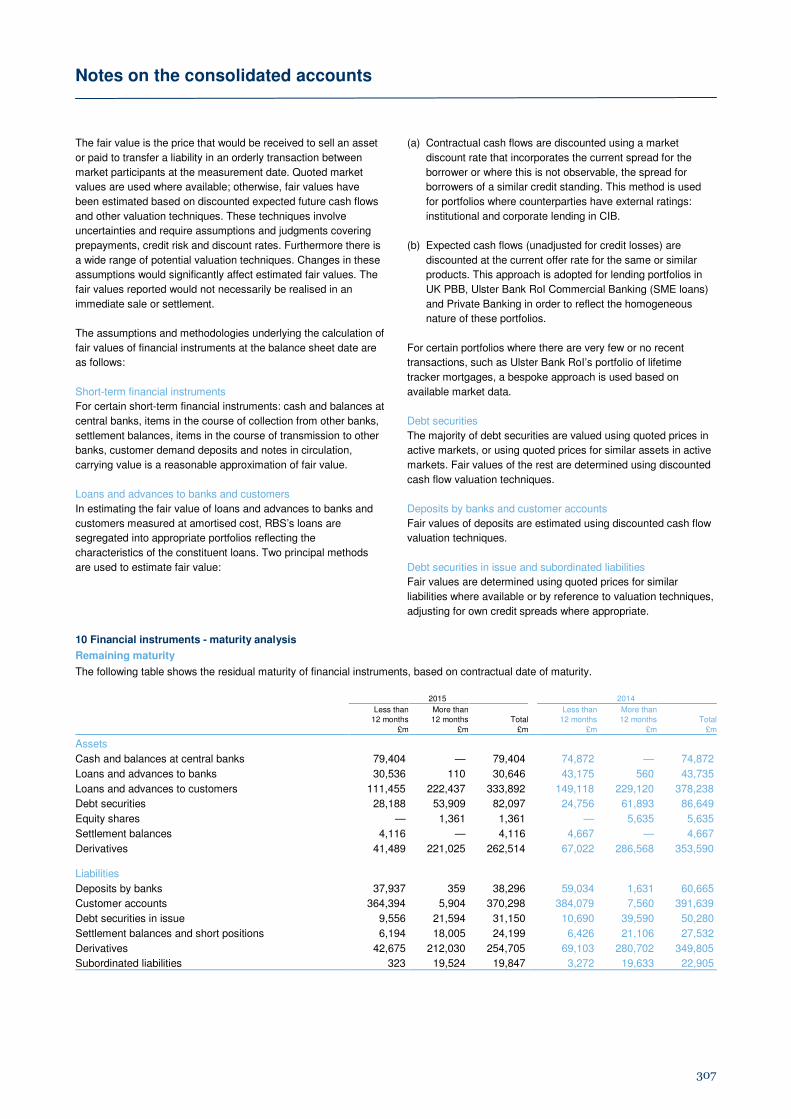
Notes on the consolidated accounts
307
The fair value is the price that would be received to sell an asset
or paid to transfer a liability in an orderly transaction between
market participants at the measurement date. Quoted market
values are used where available; otherwise, fair values have
been estimated based on discounted expected future cash flows
and other valuation techniques. These techniques involve
uncertainties and require assumptions and judgments covering
prepayments, credit risk and discount rates. Furthermore there is
a wide range of potential valuation techniques. Changes in these
assumptions would significantly affect estimated fair values. The
fair values reported would not necessarily be realised in an
immediate sale or settlement.
The assumptions and methodologies underlying the calculation of
fair values of financial instruments at the balance sheet date are
as follows:
Short-term financial instruments
For certain short-term financial instruments: cash and balances at
central banks, items in the course of collection from other banks,
settlement balances, items in the course of transmission to other
banks, customer demand deposits and notes in circulation,
carrying value is a reasonable approximation of fair value.
Loans and advances to banks and customers
In estimating the fair value of loans and advances to banks and
customers measured at amortised cost, RBS’s loans are
segregated into appropriate portfolios reflecting the
characteristics of the constituent loans. Two principal methods
are used to estimate fair value:
(a) Contractual cash flows are discounted using a market
discount rate that incorporates the current spread for the
borrower or where this is not observable, the spread for
borrowers of a similar credit standing. This method is used
for portfolios where counterparties have external ratings:
institutional and corporate lending in CIB.
(b) Expected cash flows (unadjusted for credit losses) are
discounted at the current offer rate for the same or similar
products. This approach is adopted for lending portfolios in
UK PBB, Ulster Bank RoI Commercial Banking (SME loans)
and Private Banking in order to reflect the homogeneous
nature of these portfolios.
For certain portfolios where there are very few or no recent
transactions, such as Ulster Bank RoI’s portfolio of lifetime
tracker mortgages, a bespoke approach is used based on
available market data.
Debt securities
The majority of debt securities are valued using quoted prices in
active markets, or using quoted prices for similar assets in active
markets. Fair values of the rest are determined using discounted
cash flow valuation techniques.
Deposits by banks and customer accounts
Fair values of deposits are estimated using discounted cash flow
valuation techniques.
Debt securities in issue and subordinated liabilities
Fair values are determined using quoted prices for similar
liabilities where available or by reference to valuation techniques,
adjusting for own credit spreads where appropriate.
10 Financial instruments - maturity analysis Remaining maturity The following table shows the residual maturity of financial instruments, based on contractual date of maturity. 2015 2014
Less than More than
Total Less than More than
Total12 months 12 months 12 months 12 months
£m £m £m £m £m £m
Assets
Cash and balances at central banks 79,404 — 79,404 74,872 — 74,872
Loans and advances to banks 30,536 110 30,646 43,175 560 43,735
Loans and advances to customers 111,455 222,437 333,892 149,118 229,120 378,238
Debt securities 28,188 53,909 82,097 24,756 61,893 86,649
Equity shares — 1,361 1,361 — 5,635 5,635
Settlement balances 4,116 — 4,116 4,667 — 4,667
Derivatives 41,489 221,025 262,514 67,022 286,568 353,590 Liabilities
Deposits by banks 37,937 359 38,296 59,034 1,631 60,665
Customer accounts 364,394 5,904 370,298 384,079 7,560 391,639
Debt securities in issue 9,556 21,594 31,150 10,690 39,590 50,280
Settlement balances and short positions 6,194 18,005 24,199 6,426 21,106 27,532
Derivatives 42,675 212,030 254,705 69,103 280,702 349,805
Subordinated liabilities 323 19,524 19,847 3,272 19,633 22,905
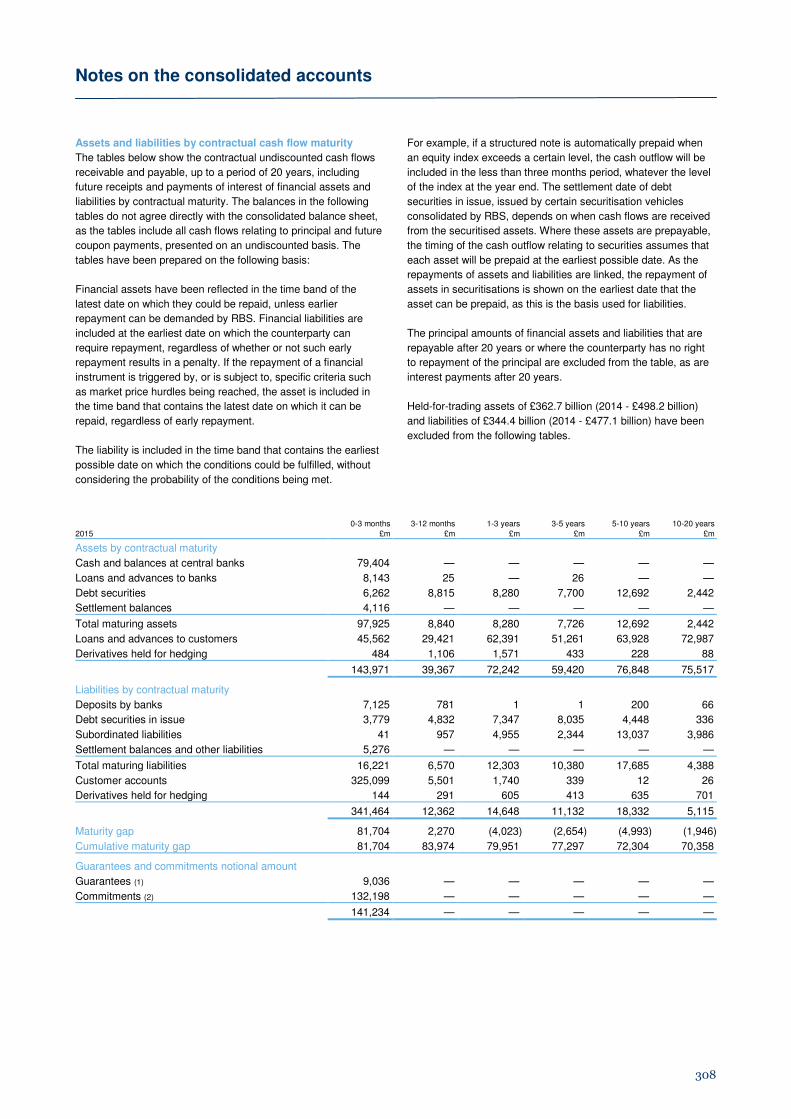
Notes on the consolidated accounts
308
Assets and liabilities by contractual cash flow maturity
The tables below show the contractual undiscounted cash flows
receivable and payable, up to a period of 20 years, including
future receipts and payments of interest of financial assets and
liabilities by contractual maturity. The balances in the following
tables do not agree directly with the consolidated balance sheet,
as the tables include all cash flows relating to principal and future
coupon payments, presented on an undiscounted basis. The
tables have been prepared on the following basis:
Financial assets have been reflected in the time band of the
latest date on which they could be repaid, unless earlier
repayment can be demanded by RBS. Financial liabilities are
included at the earliest date on which the counterparty can
require repayment, regardless of whether or not such early
repayment results in a penalty. If the repayment of a financial
instrument is triggered by, or is subject to, specific criteria such
as market price hurdles being reached, the asset is included in
the time band that contains the latest date on which it can be
repaid, regardless of early repayment.
The liability is included in the time band that contains the earliest
possible date on which the conditions could be fulfilled, without
considering the probability of the conditions being met.
For example, if a structured note is automatically prepaid when
an equity index exceeds a certain level, the cash outflow will be
included in the less than three months period, whatever the level
of the index at the year end. The settlement date of debt
securities in issue, issued by certain securitisation vehicles
consolidated by RBS, depends on when cash flows are received
from the securitised assets. Where these assets are prepayable,
the timing of the cash outflow relating to securities assumes that
each asset will be prepaid at the earliest possible date. As the
repayments of assets and liabilities are linked, the repayment of
assets in securitisations is shown on the earliest date that the
asset can be prepaid, as this is the basis used for liabilities.
The principal amounts of financial assets and liabilities that are
repayable after 20 years or where the counterparty has no right
to repayment of the principal are excluded from the table, as are
interest payments after 20 years.
Held-for-trading assets of £362.7 billion (2014 - £498.2 billion)
and liabilities of £344.4 billion (2014 - £477.1 billion) have been
excluded from the following tables.
0-3 months 3-12 months 1-3 years 3-5 years 5-10 years 10-20 years
2015 £m £m £m £m £m £m
Assets by contractual maturity
Cash and balances at central banks 79,404 — — — — —
Loans and advances to banks 8,143 25 — 26 — —
Debt securities 6,262 8,815 8,280 7,700 12,692 2,442
Settlement balances 4,116 — — — — —
Total maturing assets 97,925 8,840 8,280 7,726 12,692 2,442
Loans and advances to customers 45,562 29,421 62,391 51,261 63,928 72,987
Derivatives held for hedging 484 1,106 1,571 433 228 88
143,971 39,367 72,242 59,420 76,848 75,517
Liabilities by contractual maturity
Deposits by banks 7,125 781 1 1 200 66
Debt securities in issue 3,779 4,832 7,347 8,035 4,448 336
Subordinated liabilities 41 957 4,955 2,344 13,037 3,986
Settlement balances and other liabilities 5,276 — — — — —
Total maturing liabilities 16,221 6,570 12,303 10,380 17,685 4,388
Customer accounts 325,099 5,501 1,740 339 12 26
Derivatives held for hedging 144 291 605 413 635 701
341,464 12,362 14,648 11,132 18,332 5,115
Maturity gap 81,704 2,270 (4,023) (2,654) (4,993) (1,946)
Cumulative maturity gap 81,704 83,974 79,951 77,297 72,304 70,358 Guarantees and commitments notional amount
Guarantees (1) 9,036 — — — — —
Commitments (2) 132,198 — — — — —
141,234 — — — — —
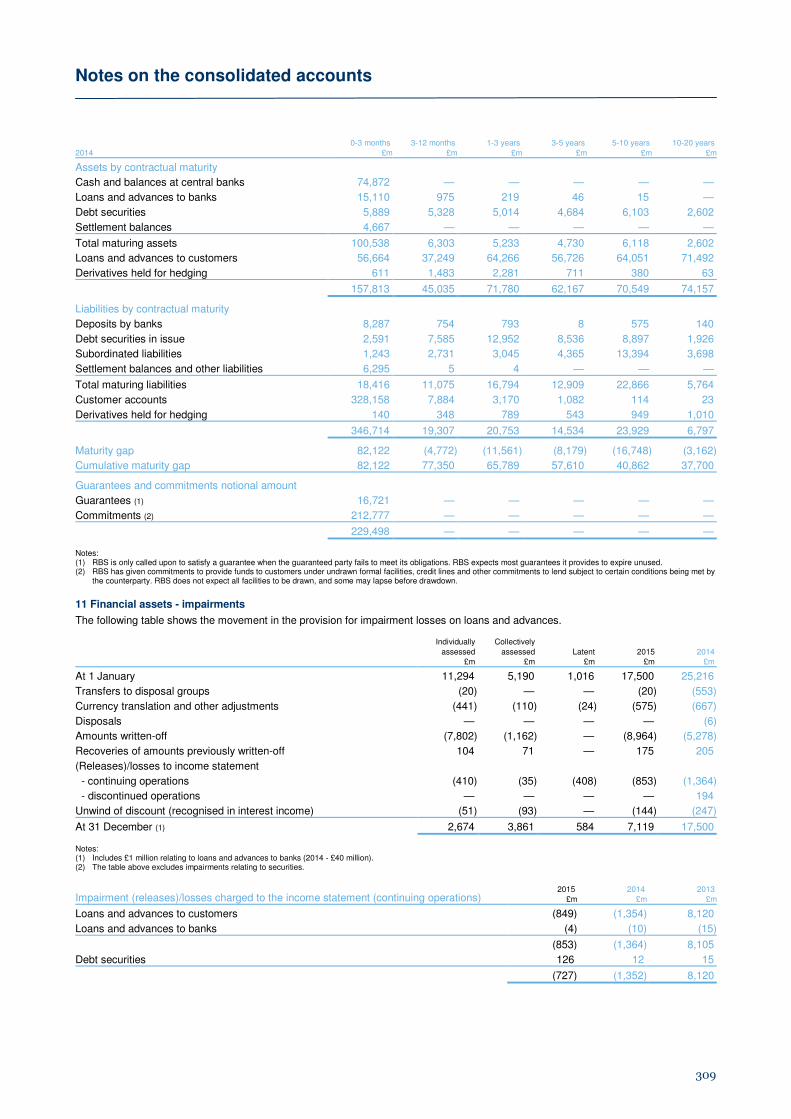
Notes on the consolidated accounts
309
0-3 months 3-12 months 1-3 years 3-5 years 5-10 years 10-20 years
2014 £m £m £m £m £m £m
Assets by contractual maturity
Cash and balances at central banks 74,872 — — — — —
Loans and advances to banks 15,110 975 219 46 15 —
Debt securities 5,889 5,328 5,014 4,684 6,103 2,602
Settlement balances 4,667 — — — — —
Total maturing assets 100,538 6,303 5,233 4,730 6,118 2,602
Loans and advances to customers 56,664 37,249 64,266 56,726 64,051 71,492
Derivatives held for hedging 611 1,483 2,281 711 380 63
157,813 45,035 71,780 62,167 70,549 74,157
Liabilities by contractual maturity
Deposits by banks 8,287 754 793 8 575 140
Debt securities in issue 2,591 7,585 12,952 8,536 8,897 1,926
Subordinated liabilities 1,243 2,731 3,045 4,365 13,394 3,698
Settlement balances and other liabilities 6,295 5 4 — — —
Total maturing liabilities 18,416 11,075 16,794 12,909 22,866 5,764
Customer accounts 328,158 7,884 3,170 1,082 114 23
Derivatives held for hedging 140 348 789 543 949 1,010
346,714 19,307 20,753 14,534 23,929 6,797
Maturity gap 82,122 (4,772) (11,561) (8,179) (16,748) (3,162)
Cumulative maturity gap 82,122 77,350 65,789 57,610 40,862 37,700 Guarantees and commitments notional amount
Guarantees (1) 16,721 — — — — —
Commitments (2) 212,777 — — — — —
229,498 — — — — — Notes: (1) RBS is only called upon to satisfy a guarantee when the guaranteed party fails to meet its obligations. RBS expects most guarantees it provides to expire unused. (2) RBS has given commitments to provide funds to customers under undrawn formal facilities, credit lines and other commitments to lend subject to certain conditions being met by
the counterparty. RBS does not expect all facilities to be drawn, and some may lapse before drawdown.
11 Financial assets - impairments
The following table shows the movement in the provision for impairment losses on loans and advances.
Individually Collectively
Latent 2014 assessed assessed 2015 £m £m £m £m £m
At 1 January 11,294 5,190 1,016 17,500 25,216
Transfers to disposal groups (20) — — (20) (553)
Currency translation and other adjustments (441) (110) (24) (575) (667)
Disposals — — — — (6)
Amounts written-off (7,802) (1,162) — (8,964) (5,278)
Recoveries of amounts previously written-off 104 71 — 175 205
(Releases)/losses to income statement
- continuing operations (410) (35) (408) (853) (1,364)
- discontinued operations — — — — 194
Unwind of discount (recognised in interest income) (51) (93) — (144) (247)
At 31 December (1) 2,674 3,861 584 7,119 17,500 Notes: (1) Includes £1 million relating to loans and advances to banks (2014 - £40 million). (2) The table above excludes impairments relating to securities.
Impairment (releases)/losses charged to the income statement (continuing operations) 2015 2014 2013
£m £m £m
Loans and advances to customers (849) (1,354) 8,120
Loans and advances to banks (4) (10) (15)
(853) (1,364) 8,105
Debt securities 126 12 15
(727) (1,352) 8,120
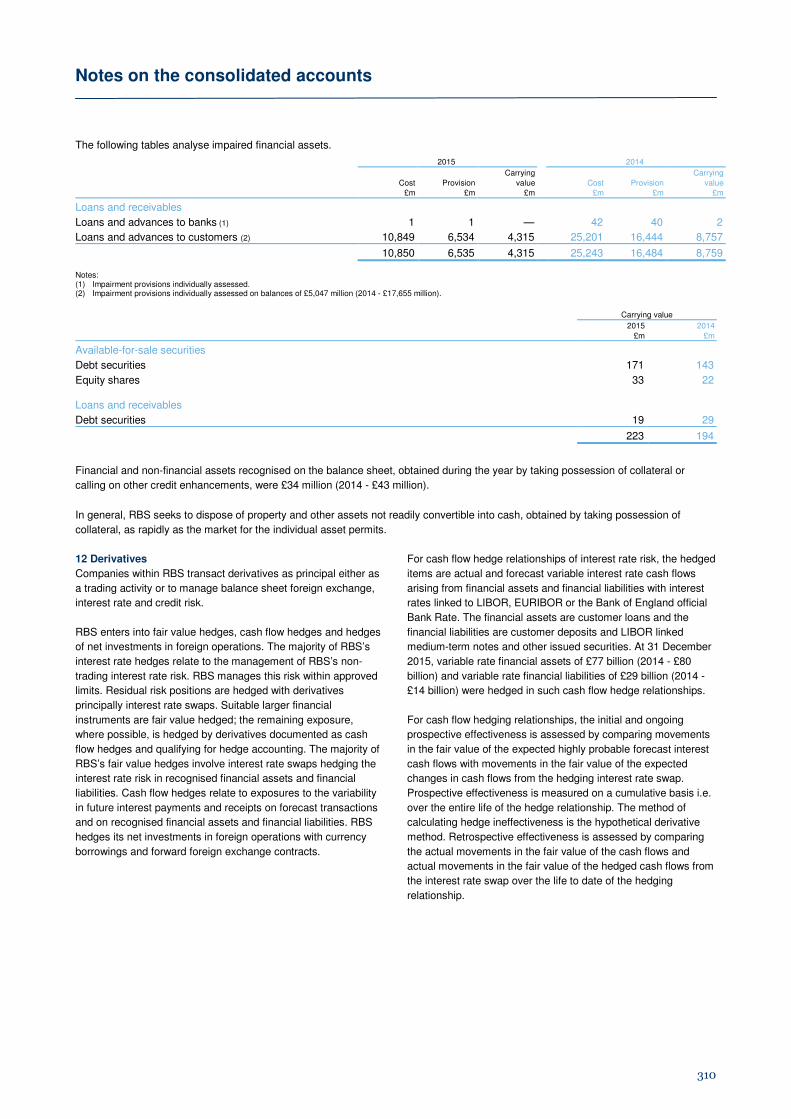
Notes on the consolidated accounts
310
The following tables analyse impaired financial assets. 2015 2014
Carrying Carrying
Cost Provision value Cost Provision value £m £m £m £m £m £m
Loans and receivables
Loans and advances to banks (1) 1 1 — 42 40 2
Loans and advances to customers (2) 10,849 6,534 4,315 25,201 16,444 8,757
10,850 6,535 4,315 25,243 16,484 8,759 Notes: (1) Impairment provisions individually assessed. (2) Impairment provisions individually assessed on balances of £5,047 million (2014 - £17,655 million).
Carrying value
2015 2014
£m £m
Available-for-sale securities
Debt securities 171 143
Equity shares 33 22 Loans and receivables
Debt securities 19 29
223 194
Financial and non-financial assets recognised on the balance sheet, obtained during the year by taking possession of collateral or
calling on other credit enhancements, were £34 million (2014 - £43 million).
In general, RBS seeks to dispose of property and other assets not readily convertible into cash, obtained by taking possession of
collateral, as rapidly as the market for the individual asset permits.
12 Derivatives
Companies within RBS transact derivatives as principal either as
a trading activity or to manage balance sheet foreign exchange,
interest rate and credit risk.
RBS enters into fair value hedges, cash flow hedges and hedges
of net investments in foreign operations. The majority of RBS’s
interest rate hedges relate to the management of RBS’s non-
trading interest rate risk. RBS manages this risk within approved
limits. Residual risk positions are hedged with derivatives
principally interest rate swaps. Suitable larger financial
instruments are fair value hedged; the remaining exposure,
where possible, is hedged by derivatives documented as cash
flow hedges and qualifying for hedge accounting. The majority of
RBS’s fair value hedges involve interest rate swaps hedging the
interest rate risk in recognised financial assets and financial
liabilities. Cash flow hedges relate to exposures to the variability
in future interest payments and receipts on forecast transactions
and on recognised financial assets and financial liabilities. RBS
hedges its net investments in foreign operations with currency
borrowings and forward foreign exchange contracts.
For cash flow hedge relationships of interest rate risk, the hedged
items are actual and forecast variable interest rate cash flows
arising from financial assets and financial liabilities with interest
rates linked to LIBOR, EURIBOR or the Bank of England official
Bank Rate. The financial assets are customer loans and the
financial liabilities are customer deposits and LIBOR linked
medium-term notes and other issued securities. At 31 December
2015, variable rate financial assets of £77 billion (2014 - £80
billion) and variable rate financial liabilities of £29 billion (2014 -
£14 billion) were hedged in such cash flow hedge relationships.
For cash flow hedging relationships, the initial and ongoing
prospective effectiveness is assessed by comparing movements
in the fair value of the expected highly probable forecast interest
cash flows with movements in the fair value of the expected
changes in cash flows from the hedging interest rate swap.
Prospective effectiveness is measured on a cumulative basis i.e.
over the entire life of the hedge relationship. The method of
calculating hedge ineffectiveness is the hypothetical derivative
method. Retrospective effectiveness is assessed by comparing
the actual movements in the fair value of the cash flows and
actual movements in the fair value of the hedged cash flows from
the interest rate swap over the life to date of the hedging
relationship.

Notes on the consolidated accounts
311
For fair value hedge relationships of interest rate risk, the hedged
items are typically large corporate fixed-rate loans, government
securities, fixed rate finance leases, fixed rate medium-term
notes or preference shares classified as debt. At 31 December
2015, fixed rate financial assets of £25 billion (2014 - £18 billion)
and fixed rate financial liabilities of £21 billion (2014 - £32 billion)
were hedged by interest rate swaps in fair value hedge
relationships.
The initial and ongoing prospective effectiveness of fair value
hedge relationships is assessed on a cumulative basis by
comparing movements in the fair value of the hedged item
attributable to the hedged risk with changes in the fair value of
the hedging interest rate swap. Retrospective effectiveness is
assessed by comparing the actual movements in the fair value of
the hedged items attributable to the hedged risk with actual
movements in the fair value of the hedging derivative over the life
to date of the hedging relationship.
2015 2014
Notional Notional amount Assets Liabilities amount Assets Liabilities
£bn £m £m £bn £m £m
Exchange rate contracts
Spot, forwards and futures 1,962 22,922 22,403 2,025 32,960 33,419
Currency swaps 759 18,293 21,878 870 22,254 26,844
Options purchased 484 13,706 — 896 23,458 —
Options written 495 — 13,947 881 — 23,457
Interest rate contracts
Interest rate swaps 12,535 174,438 162,040 20,161 219,411 211,287
Options purchased 1,372 31,310 — 1,471 49,248 —
Options written 1,333 — 32,497 1,552 — 47,866
Futures and forwards 4,543 390 317 4,133 886 739
Credit derivatives 67 909 840 125 2,254 2,611
Equity and commodity contracts 18 546 783 78 3,119 3,582
262,514 254,705 353,590 349,805
Included in the table above are derivatives held for hedging purposes as follows:
2015 2014
Assets Liabilities Assets Liabilities £m £m £m £m
Fair value hedging
Interest rate contracts 1,480 1,667 2,122 2,319
Cash flow hedging
Interest rate contracts 2,231 917 3,240 1,291
Exchange rate contacts 52 2 — 5
Net investment hedging
Exchange rate contracts 62 17 78 6
Total 3,825 2,603 5,440 3,621
Hedge ineffectiveness recognised in other operating income in continuing operations comprised: 2015 2014 2013
£m £m £m
Fair value hedging
Gains/(losses) on the hedged items attributable to the hedged risk 110 809 (165)
(Losses)/gains on the hedging instruments (39) (840) 154
Fair value hedging ineffectiveness 71 (31) (11)
Cash flow hedging ineffectiveness (23) (33) (64)
48 (64) (75)

Notes on the consolidated accounts
312
The following table shows when hedged cash flows are expected to occur and when they will affect income for designated cash flow hedges.
Over 0-1 years 1-5 years 5-10 years 10-20 years 20 years Total
Hedged forecast cash flows expected to occur £m £m £m £m £m £m
2015
Forecast receivable cash flows 332 828 231 — — 1,391
Forecast payable cash flows (119) (192) (62) (78) (11) (462)
2014
Forecast receivable cash flows 278 844 227 — — 1,349
Forecast payable cash flows (49) (100) (61) (92) (12) (314)
13 Debt securities
Central and local government
Banks
Other
Corporate Total
financial Of which
UK US Other institutions ABS (1)2015 £m £m £m £m £m £m £m £m
Held-for-trading 4,107 4,627 22,222 576 3,689 636 35,857 707
Designated as at fair value through profit or loss — — 111 — — — 111 —
Available-for-sale 9,110 10,265 12,137 1,639 5,578 102 38,831 2,362
Loans and receivables — — — 1 2,242 144 2,387 2,222
Held-to-maturity 4,911 — — — — — 4,911 —
18,128 14,892 34,470 2,216 11,509 882 82,097 5,291
Available-for-sale
Gross unrealised gains 383 104 269 3 110 7 876 88
Gross unrealised losses (7) (62) (9) (1) (58) (3) (140) (42) 2014
Held-for-trading 6,218 7,709 24,451 1,499 7,372 1,977 49,226 3,559
Designated as at fair value through profit or loss — — 111 2 4 — 117 —
Available-for-sale 4,747 5,230 11,058 3,404 5,073 161 29,673 3,608
Loans and receivables — — — 185 2,774 137 3,096 2,734
Held-to-maturity 4,537 — — — — — 4,537 —
15,502 12,939 35,620 5,090 15,223 2,275 86,649 9,901
Available-for-sale
Gross unrealised gains 451 144 541 8 166 6 1,316 128
Gross unrealised losses (1) (5) (3) (1) (133) (2) (145) (120) Note: (1) Includes asset-backed securities issued by US federal agencies and government sponsored entities, and covered bonds.
Gross gains of £69 million (2014 - £502 million) and gross losses of £133 million (2014 - £386 million) were realised on the sale of
available-for-sale securities in continuing operations.
Gross gains of £11 million (2014 - £20 million) and gross losses of nil (2014 - £3 million) were realised on the sale of available-for-sale
securities in discontinued operations.
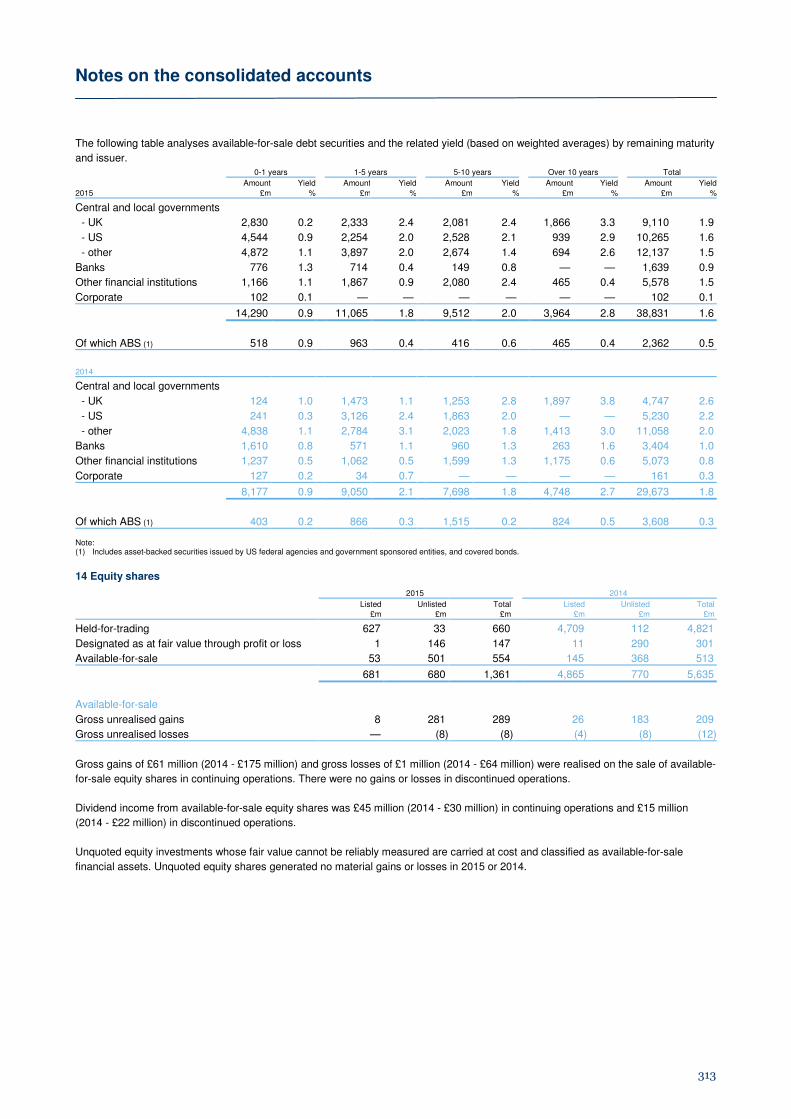
Notes on the consolidated accounts
313
The following table analyses available-for-sale debt securities and the related yield (based on weighted averages) by remaining maturity
and issuer. 0-1 years 1-5 years 5-10 years Over 10 years Total
Amount Yield Amount Yield Amount Yield Amount Yield Amount Yield
2015 £m % £m % £m % £m % £m %
Central and local governments
- UK 2,830 0.2 2,333 2.4 2,081 2.4 1,866 3.3 9,110 1.9
- US 4,544 0.9 2,254 2.0 2,528 2.1 939 2.9 10,265 1.6
- other 4,872 1.1 3,897 2.0 2,674 1.4 694 2.6 12,137 1.5
Banks 776 1.3 714 0.4 149 0.8 — — 1,639 0.9
Other financial institutions 1,166 1.1 1,867 0.9 2,080 2.4 465 0.4 5,578 1.5
Corporate 102 0.1 — — — — — — 102 0.1
14,290 0.9 11,065 1.8 9,512 2.0 3,964 2.8 38,831 1.6
Of which ABS (1) 518 0.9 963 0.4 416 0.6 465 0.4 2,362 0.5
2014
Central and local governments
- UK 124 1.0 1,473 1.1 1,253 2.8 1,897 3.8 4,747 2.6
- US 241 0.3 3,126 2.4 1,863 2.0 — — 5,230 2.2
- other 4,838 1.1 2,784 3.1 2,023 1.8 1,413 3.0 11,058 2.0
Banks 1,610 0.8 571 1.1 960 1.3 263 1.6 3,404 1.0
Other financial institutions 1,237 0.5 1,062 0.5 1,599 1.3 1,175 0.6 5,073 0.8
Corporate 127 0.2 34 0.7 — — — — 161 0.3
8,177 0.9 9,050 2.1 7,698 1.8 4,748 2.7 29,673 1.8
Of which ABS (1) 403 0.2 866 0.3 1,515 0.2 824 0.5 3,608 0.3 Note: (1) Includes asset-backed securities issued by US federal agencies and government sponsored entities, and covered bonds.
14 Equity shares 2015 2014
Listed Unlisted Total Listed Unlisted Total £m £m £m £m £m £m
Held-for-trading 627 33 660 4,709 112 4,821
Designated as at fair value through profit or loss 1 146 147 11 290 301
Available-for-sale 53 501 554 145 368 513
681 680 1,361 4,865 770 5,635
Available-for-sale
Gross unrealised gains 8 281 289 26 183 209
Gross unrealised losses — (8) (8) (4) (8) (12)
Gross gains of £61 million (2014 - £175 million) and gross losses of £1 million (2014 - £64 million) were realised on the sale of available-
for-sale equity shares in continuing operations. There were no gains or losses in discontinued operations.
Dividend income from available-for-sale equity shares was £45 million (2014 - £30 million) in continuing operations and £15 million
(2014 - £22 million) in discontinued operations.
Unquoted equity investments whose fair value cannot be reliably measured are carried at cost and classified as available-for-sale
financial assets. Unquoted equity shares generated no material gains or losses in 2015 or 2014.
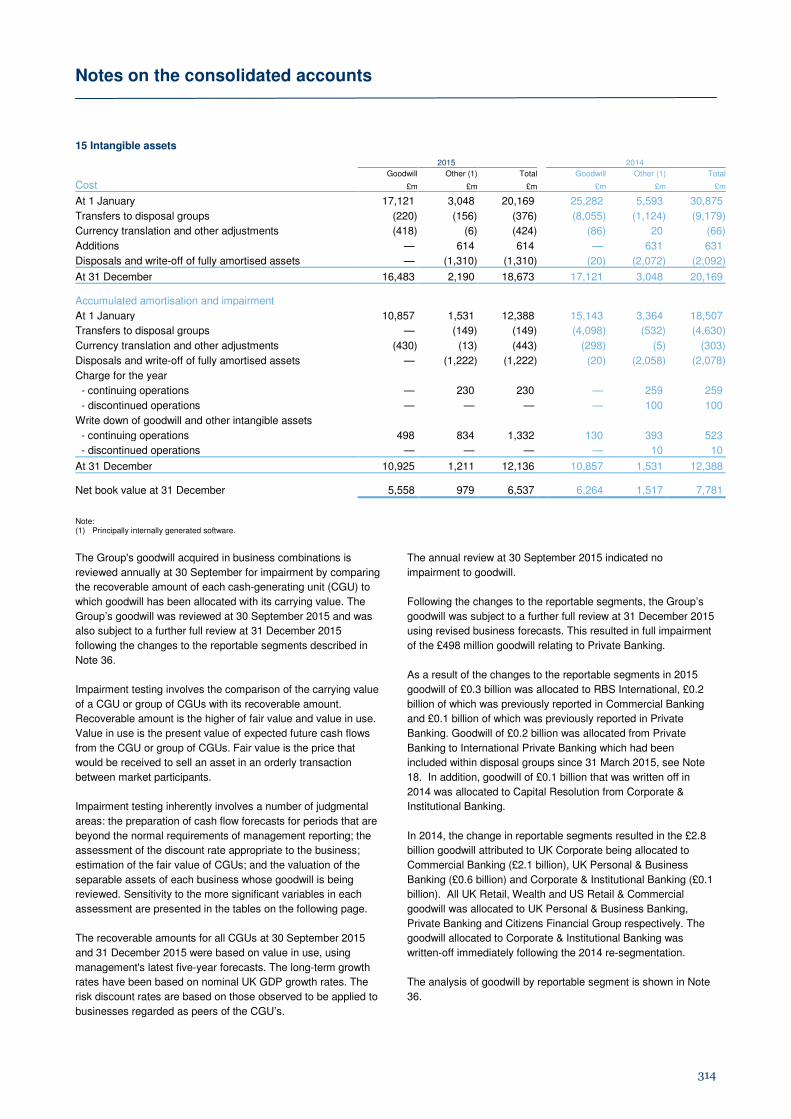
Notes on the consolidated accounts
314
15 Intangible assets 2015 2014
Goodwill Other (1) Total Goodwill Other (1) Total
Cost £m £m £m £m £m £m
At 1 January 17,121 3,048 20,169 25,282 5,593 30,875
Transfers to disposal groups (220) (156) (376) (8,055) (1,124) (9,179)
Currency translation and other adjustments (418) (6) (424) (86) 20 (66)
Additions — 614 614 — 631 631
Disposals and write-off of fully amortised assets — (1,310) (1,310) (20) (2,072) (2,092)
At 31 December 16,483 2,190 18,673 17,121 3,048 20,169 Accumulated amortisation and impairment
At 1 January 10,857 1,531 12,388 15,143 3,364 18,507
Transfers to disposal groups — (149) (149) (4,098) (532) (4,630)
Currency translation and other adjustments (430) (13) (443) (298) (5) (303)
Disposals and write-off of fully amortised assets — (1,222) (1,222) (20) (2,058) (2,078)
Charge for the year
- continuing operations — 230 230 — 259 259
- discontinued operations — — — — 100 100
Write down of goodwill and other intangible assets
- continuing operations 498 834 1,332 130 393 523
- discontinued operations — — — — 10 10
At 31 December 10,925 1,211 12,136 10,857 1,531 12,388 Net book value at 31 December 5,558 979 6,537 6,264 1,517 7,781
Note: (1) Principally internally generated software.
The Group's goodwill acquired in business combinations is
reviewed annually at 30 September for impairment by comparing
the recoverable amount of each cash-generating unit (CGU) to
which goodwill has been allocated with its carrying value. The
Group’s goodwill was reviewed at 30 September 2015 and was
also subject to a further full review at 31 December 2015
following the changes to the reportable segments described in
Note 36.
Impairment testing involves the comparison of the carrying value
of a CGU or group of CGUs with its recoverable amount.
Recoverable amount is the higher of fair value and value in use.
Value in use is the present value of expected future cash flows
from the CGU or group of CGUs. Fair value is the price that
would be received to sell an asset in an orderly transaction
between market participants.
Impairment testing inherently involves a number of judgmental
areas: the preparation of cash flow forecasts for periods that are
beyond the normal requirements of management reporting; the
assessment of the discount rate appropriate to the business;
estimation of the fair value of CGUs; and the valuation of the
separable assets of each business whose goodwill is being
reviewed. Sensitivity to the more significant variables in each
assessment are presented in the tables on the following page.
The recoverable amounts for all CGUs at 30 September 2015
and 31 December 2015 were based on value in use, using
management's latest five-year forecasts. The long-term growth
rates have been based on nominal UK GDP growth rates. The
risk discount rates are based on those observed to be applied to
businesses regarded as peers of the CGU’s.
The annual review at 30 September 2015 indicated no
impairment to goodwill.
Following the changes to the reportable segments, the Group’s
goodwill was subject to a further full review at 31 December 2015
using revised business forecasts. This resulted in full impairment
of the £498 million goodwill relating to Private Banking.
As a result of the changes to the reportable segments in 2015
goodwill of £0.3 billion was allocated to RBS International, £0.2
billion of which was previously reported in Commercial Banking
and £0.1 billion of which was previously reported in Private
Banking. Goodwill of £0.2 billion was allocated from Private
Banking to International Private Banking which had been
included within disposal groups since 31 March 2015, see Note
18. In addition, goodwill of £0.1 billion that was written off in
2014 was allocated to Capital Resolution from Corporate &
Institutional Banking.
In 2014, the change in reportable segments resulted in the £2.8
billion goodwill attributed to UK Corporate being allocated to
Commercial Banking (£2.1 billion), UK Personal & Business
Banking (£0.6 billion) and Corporate & Institutional Banking (£0.1
billion). All UK Retail, Wealth and US Retail & Commercial
goodwill was allocated to UK Personal & Business Banking,
Private Banking and Citizens Financial Group respectively. The
goodwill allocated to Corporate & Institutional Banking was
written-off immediately following the 2014 re-segmentation.
The analysis of goodwill by reportable segment is shown in Note
36.

Notes on the consolidated accounts
315
The carrying value of goodwill and the amount by which it is exceeded by the recoverable amount are set out below by reportable
segment, along with the key assumptions applied in calculating the recoverable amount and sensitivities to changes in those
assumptions. The details below are based on the updated review performed at 31 December 2015 and take into account the revised
reportable segments. Consequential
Consequential impact of 1% impact of 5% Assumptions Recoverable adverse movement in adverse movement
Terminal Pre-tax amount exceeded Discount Terminal in forecast
Goodwill growth rate discount rate carrying value rate growth rate pre-tax earnings 31 December 2015 £bn % % £bn £bn £bn £bn
UK Personal & Business Banking 3.4 4.5 12.0 10.7 (2.6) (1.5) (1.7)
Commercial Banking 1.9 4.5 12.1 6.4 (1.9) (0.9) (1.2)
RBS International 0.3 4.5 10.2 1.2 (0.5) (0.3) (0.2)
30 September 2014
UK Personal & Business Banking 3.4 4.5 11.5 17.6 (3.6) (2.5) (1.6)
Commercial Banking 2.1 4.5 11.7 3.0 (1.9) (0.9) (1.0)
Private Banking 0.8 4.5 11.4 0.7 (0.5) (0.3) (0.2)
Other intangible assets are reviewed for indicators of impairment. In 2015, £834 million (2014 - £401 million) of previously capitalised
software was written-off primarily as a result of the reorganisation of CIB.
16 Property, plant and equipment Long Short Computers Operating Investment Freehold leasehold leasehold and other lease
properties premises premises premises equipment assets Total2015 £m £m £m £m £m £m £m
Cost or valuation
At 1 January 1,933 2,860 240 1,334 2,982 1,551 10,900
Transfers to disposal groups — (7) — (41) (25) — (73)
Currency translation and other adjustments (100) 13 (2) (4) 1 15 (77)
Additions 31 139 8 125 350 202 855
Change in fair value of investment properties
- continuing operations 2 — — — — — 2
Disposals and write-off of fully depreciated assets (951) (446) (69) (155) (1,003) (212) (2,836)
At 31 December 915 2,559 177 1,259 2,305 1,556 8,771 Accumulated impairment, depreciation and amortisation
At 1 January — 1,006 130 798 2,137 662 4,733
Transfers to disposal groups — (3) — (24) (23) — (50)
Currency translation and other adjustments — 9 11 (3) (2) 5 20
Write down of property, plant and equipment — 279 — — 93 — 372
Disposals and write-off of fully depreciated assets — (263) (49) (106) (802) (144) (1,364)
Charge for the year
- continuing operations — 62 (5) 94 274 153 578
At 31 December — 1,090 87 759 1,677 676 4,289 Net book value at 31 December 915 1,469 90 500 628 880 4,482
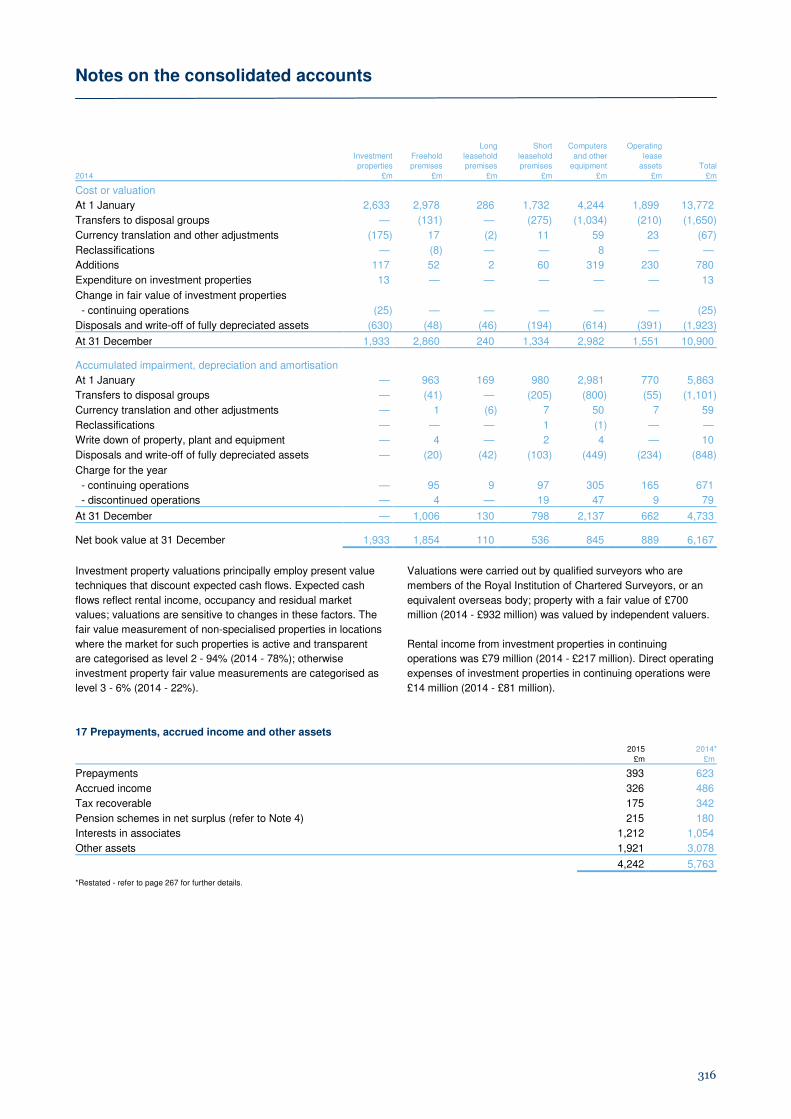
Notes on the consolidated accounts
316
Long Short Computers Operating
Investment Freehold leasehold leasehold and other lease properties premises premises premises equipment assets Total
2014 £m £m £m £m £m £m £m
Cost or valuation
At 1 January 2,633 2,978 286 1,732 4,244 1,899 13,772
Transfers to disposal groups — (131) — (275) (1,034) (210) (1,650)
Currency translation and other adjustments (175) 17 (2) 11 59 23 (67)
Reclassifications — (8) — — 8 — —
Additions 117 52 2 60 319 230 780
Expenditure on investment properties 13 — — — — — 13
Change in fair value of investment properties - continuing operations (25) — — — — — (25)
Disposals and write-off of fully depreciated assets (630) (48) (46) (194) (614) (391) (1,923)
At 31 December 1,933 2,860 240 1,334 2,982 1,551 10,900 Accumulated impairment, depreciation and amortisation
At 1 January — 963 169 980 2,981 770 5,863
Transfers to disposal groups — (41) — (205) (800) (55) (1,101)
Currency translation and other adjustments — 1 (6) 7 50 7 59
Reclassifications — — — 1 (1) — —
Write down of property, plant and equipment — 4 — 2 4 — 10
Disposals and write-off of fully depreciated assets — (20) (42) (103) (449) (234) (848)
Charge for the year - continuing operations — 95 9 97 305 165 671
- discontinued operations — 4 — 19 47 9 79
At 31 December — 1,006 130 798 2,137 662 4,733 Net book value at 31 December 1,933 1,854 110 536 845 889 6,167
Investment property valuations principally employ present value
techniques that discount expected cash flows. Expected cash
flows reflect rental income, occupancy and residual market
values; valuations are sensitive to changes in these factors. The
fair value measurement of non-specialised properties in locations
where the market for such properties is active and transparent
are categorised as level 2 - 94% (2014 - 78%); otherwise
investment property fair value measurements are categorised as
level 3 - 6% (2014 - 22%).
Valuations were carried out by qualified surveyors who are
members of the Royal Institution of Chartered Surveyors, or an
equivalent overseas body; property with a fair value of £700
million (2014 - £932 million) was valued by independent valuers.
Rental income from investment properties in continuing
operations was £79 million (2014 - £217 million). Direct operating
expenses of investment properties in continuing operations were
£14 million (2014 - £81 million).
17 Prepayments, accrued income and other assets 2015 2014*
£m £m
Prepayments 393 623
Accrued income 326 486
Tax recoverable 175 342
Pension schemes in net surplus (refer to Note 4) 215 180
Interests in associates 1,212 1,054
Other assets 1,921 3,078
4,242 5,763
*Restated - refer to page 267 for further details.
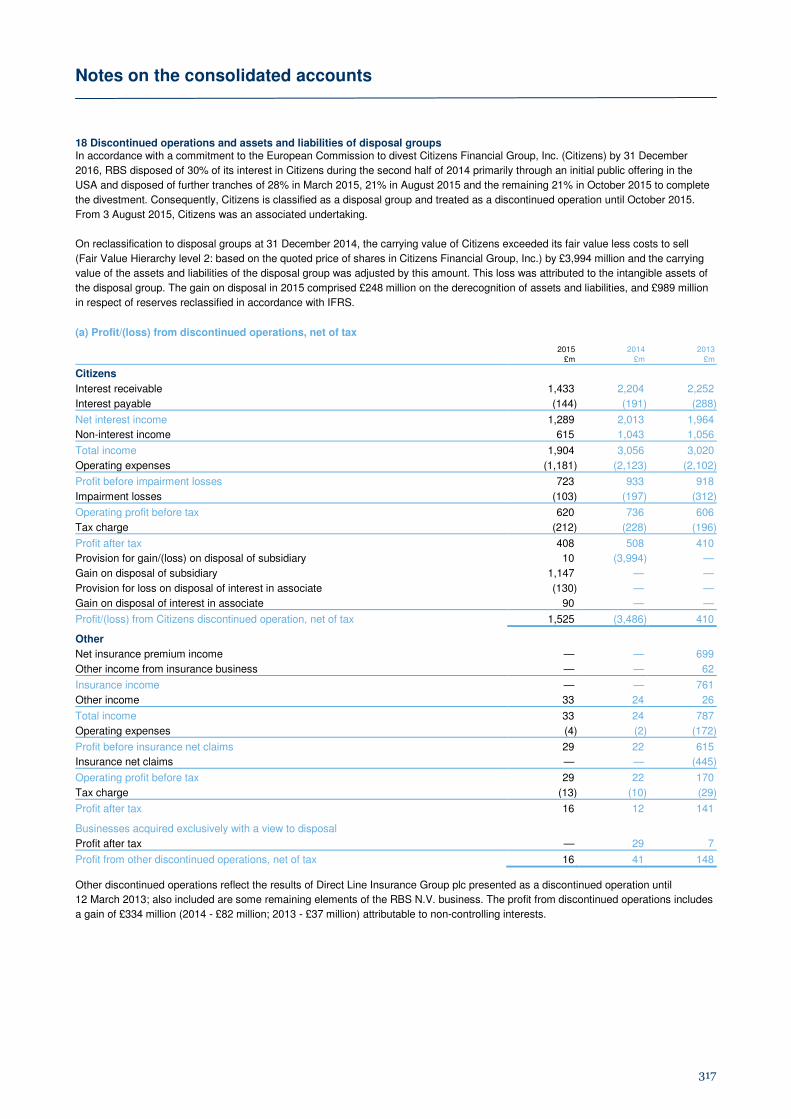
Notes on the consolidated accounts
317
18 Discontinued operations and assets and liabilities of disposal groups In accordance with a commitment to the European Commission to divest Citizens Financial Group, Inc. (Citizens) by 31 December
2016, RBS disposed of 30% of its interest in Citizens during the second half of 2014 primarily through an initial public offering in the
USA and disposed of further tranches of 28% in March 2015, 21% in August 2015 and the remaining 21% in October 2015 to complete
the divestment. Consequently, Citizens is classified as a disposal group and treated as a discontinued operation until October 2015.
From 3 August 2015, Citizens was an associated undertaking.
On reclassification to disposal groups at 31 December 2014, the carrying value of Citizens exceeded its fair value less costs to sell
(Fair Value Hierarchy level 2: based on the quoted price of shares in Citizens Financial Group, Inc.) by £3,994 million and the carrying
value of the assets and liabilities of the disposal group was adjusted by this amount. This loss was attributed to the intangible assets of
the disposal group. The gain on disposal in 2015 comprised £248 million on the derecognition of assets and liabilities, and £989 million
in respect of reserves reclassified in accordance with IFRS.
(a) Profit/(loss) from discontinued operations, net of tax 2015 2014 2013 £m £m £m
Citizens
Interest receivable 1,433 2,204 2,252
Interest payable (144) (191) (288)
Net interest income 1,289 2,013 1,964
Non-interest income 615 1,043 1,056
Total income 1,904 3,056 3,020
Operating expenses (1,181) (2,123) (2,102)
Profit before impairment losses 723 933 918
Impairment losses (103) (197) (312)
Operating profit before tax 620 736 606
Tax charge (212) (228) (196)
Profit after tax 408 508 410
Provision for gain/(loss) on disposal of subsidiary 10 (3,994) —
Gain on disposal of subsidiary 1,147 — —
Provision for loss on disposal of interest in associate (130) — —
Gain on disposal of interest in associate 90 — —
Profit/(loss) from Citizens discontinued operation, net of tax 1,525 (3,486) 410
Other
Net insurance premium income — — 699
Other income from insurance business — — 62
Insurance income — — 761
Other income 33 24 26
Total income 33 24 787
Operating expenses (4) (2) (172)
Profit before insurance net claims 29 22 615
Insurance net claims — — (445)
Operating profit before tax 29 22 170
Tax charge (13) (10) (29)
Profit after tax 16 12 141 Businesses acquired exclusively with a view to disposal
Profit after tax — 29 7
Profit from other discontinued operations, net of tax 16 41 148
Other discontinued operations reflect the results of Direct Line Insurance Group plc presented as a discontinued operation until
12 March 2013; also included are some remaining elements of the RBS N.V. business. The profit from discontinued operations includes
a gain of £334 million (2014 - £82 million; 2013 - £37 million) attributable to non-controlling interests.
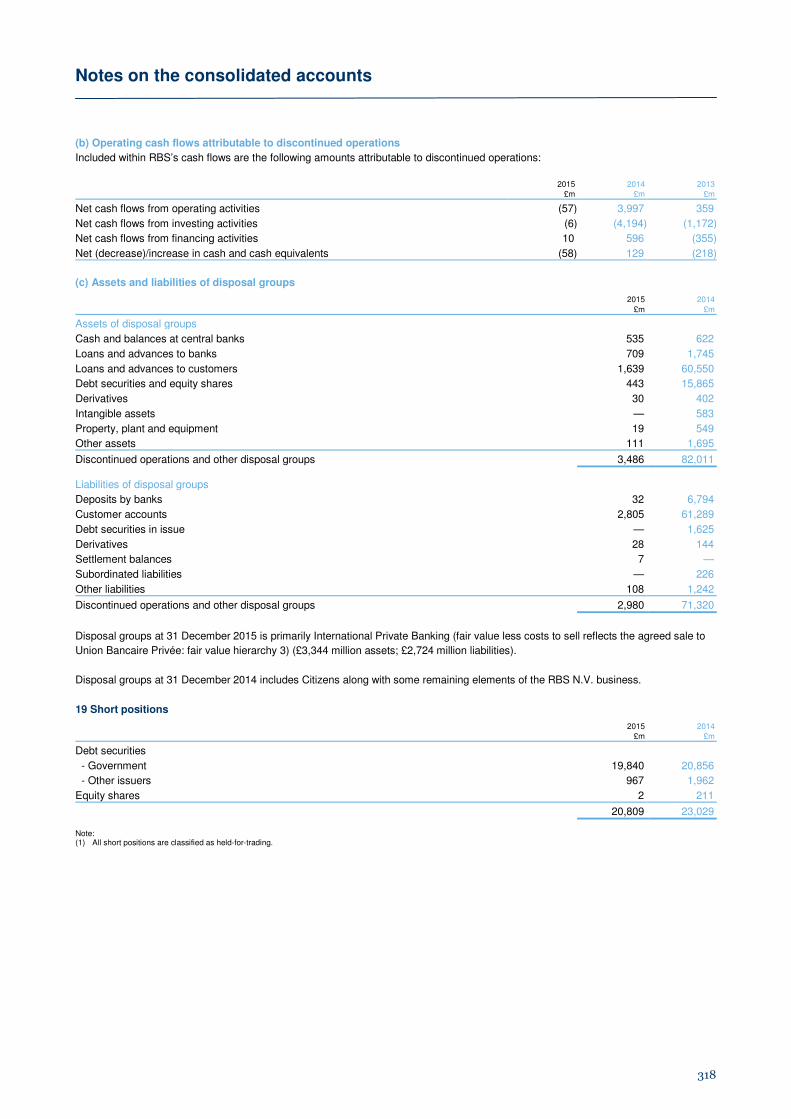
Notes on the consolidated accounts
318
(b) Operating cash flows attributable to discontinued operations
Included within RBS’s cash flows are the following amounts attributable to discontinued operations: 2015 2014 2013 £m £m £m
Net cash flows from operating activities (57) 3,997 359
Net cash flows from investing activities (6) (4,194) (1,172)
Net cash flows from financing activities 10 596 (355)
Net (decrease)/increase in cash and cash equivalents (58) 129 (218)
(c) Assets and liabilities of disposal groups 2015 2014
£m £m
Assets of disposal groups
Cash and balances at central banks 535 622
Loans and advances to banks 709 1,745
Loans and advances to customers 1,639 60,550
Debt securities and equity shares 443 15,865
Derivatives 30 402
Intangible assets — 583
Property, plant and equipment 19 549
Other assets 111 1,695
Discontinued operations and other disposal groups 3,486 82,011
Liabilities of disposal groups
Deposits by banks 32 6,794
Customer accounts 2,805 61,289
Debt securities in issue — 1,625
Derivatives 28 144
Settlement balances 7 —
Subordinated liabilities — 226
Other liabilities 108 1,242
Discontinued operations and other disposal groups 2,980 71,320
Disposal groups at 31 December 2015 is primarily International Private Banking (fair value less costs to sell reflects the agreed sale to
Union Bancaire Privée: fair value hierarchy 3) (£3,344 million assets; £2,724 million liabilities).
Disposal groups at 31 December 2014 includes Citizens along with some remaining elements of the RBS N.V. business.
19 Short positions 2015 2014 £m £m
Debt securities
- Government 19,840 20,856
- Other issuers 967 1,962
Equity shares 2 211
20,809 23,029 Note: (1) All short positions are classified as held-for-trading.
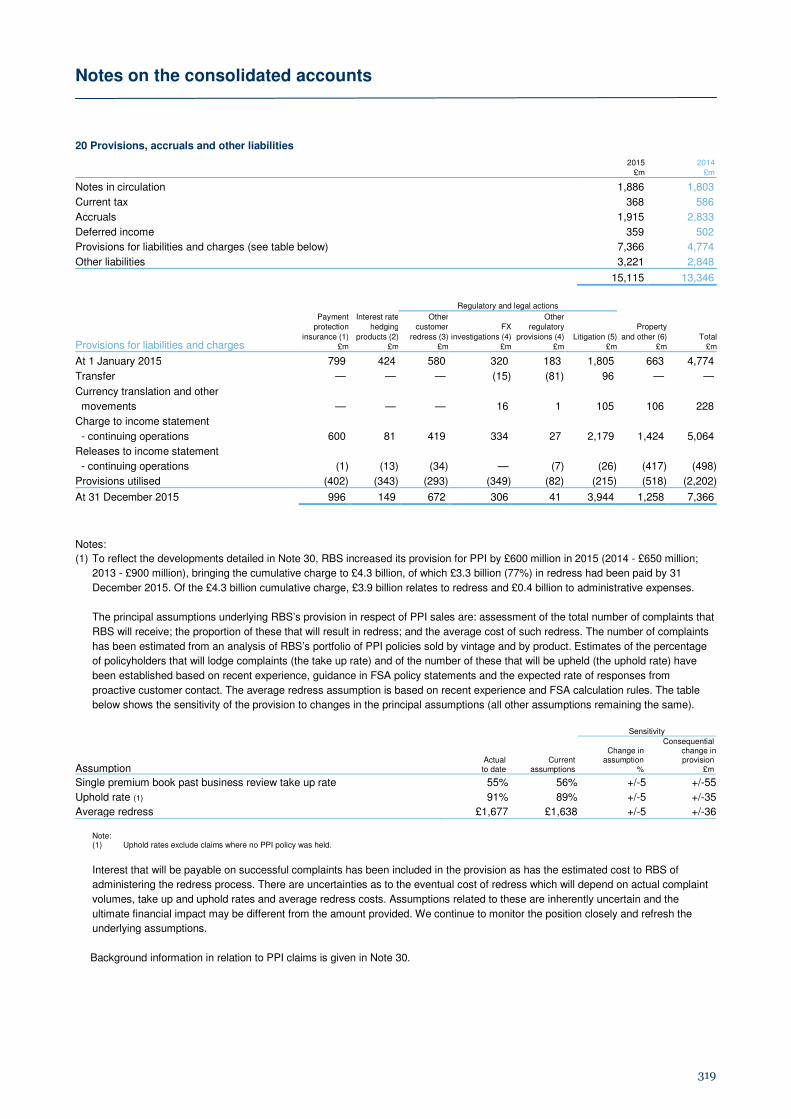
Notes on the consolidated accounts
319
20 Provisions, accruals and other liabilities 2015 2014 £m £m
Notes in circulation 1,886 1,803
Current tax 368 586
Accruals 1,915 2,833
Deferred income 359 502
Provisions for liabilities and charges (see table below) 7,366 4,774
Other liabilities 3,221 2,848
15,115 13,346
Regulatory and legal actions
Provisions for liabilities and charges
Payment Interest rate Other Other
Litigation (5)
Total
protection hedging customer FX regulatory Property
insurance (1) products (2) redress (3) investigations (4) provisions (4) and other (6)£m £m £m £m £m £m £m £m
At 1 January 2015 799 424 580 320 183 1,805 663 4,774
Transfer — — — (15) (81) 96 — —
Currency translation and other movements — — — 16 1 105 106 228
Charge to income statement
- continuing operations 600 81 419 334 27 2,179 1,424 5,064
Releases to income statement
- continuing operations (1) (13) (34) — (7) (26) (417) (498)
Provisions utilised (402) (343) (293) (349) (82) (215) (518) (2,202)
At 31 December 2015 996 149 672 306 41 3,944 1,258 7,366
Notes:
(1) To reflect the developments detailed in Note 30, RBS increased its provision for PPI by £600 million in 2015 (2014 - £650 million;
2013 - £900 million), bringing the cumulative charge to £4.3 billion, of which £3.3 billion (77%) in redress had been paid by 31
December 2015. Of the £4.3 billion cumulative charge, £3.9 billion relates to redress and £0.4 billion to administrative expenses.
The principal assumptions underlying RBS’s provision in respect of PPI sales are: assessment of the total number of complaints that
RBS will receive; the proportion of these that will result in redress; and the average cost of such redress. The number of complaints
has been estimated from an analysis of RBS’s portfolio of PPI policies sold by vintage and by product. Estimates of the percentage
of policyholders that will lodge complaints (the take up rate) and of the number of these that will be upheld (the uphold rate) have
been established based on recent experience, guidance in FSA policy statements and the expected rate of responses from
proactive customer contact. The average redress assumption is based on recent experience and FSA calculation rules. The table
below shows the sensitivity of the provision to changes in the principal assumptions (all other assumptions remaining the same).
Sensitivity
Assumption Actual to date
Current assumptions
Change in assumption
%
Consequential change in provision
£m
Single premium book past business review take up rate 55% 56% +/-5 +/-55
Uphold rate (1) 91% 89% +/-5 +/-35
Average redress £1,677 £1,638 +/-5 +/-36
Note: (1) Uphold rates exclude claims where no PPI policy was held.
Interest that will be payable on successful complaints has been included in the provision as has the estimated cost to RBS of
administering the redress process. There are uncertainties as to the eventual cost of redress which will depend on actual complaint
volumes, take up and uphold rates and average redress costs. Assumptions related to these are inherently uncertain and the
ultimate financial impact may be different from the amount provided. We continue to monitor the position closely and refresh the
underlying assumptions.
Background information in relation to PPI claims is given in Note 30.

Notes on the consolidated accounts
320
(2) RBS has a provision of £149 million for its liability in respect of the sale of Interest Rate Hedging Products (IRHP), having an
incurred cost of £1.5 billion. The provision includes redress that will be paid to customers, consequential loss (including interest) on
customer redress, the cost to RBS of exiting the hedging positions and the cost of undertaking the review.
In 2015, RBS increased its provision by £68 million (2014 - £185 million; 2013 - £550 million), principally reflecting a marginal
increase in redress experience compared to expectations and the cost of a small number of consequential loss claims over and
above interest offered as part of basic redress payments. The outcomes of all cases have now been agreed with the independent
skilled person appointed to review all decisions.
The cumulative charge for IRHP is £1.5 billion, of which £1.1 billion relates to redress and £0.4 billion to administrative expenses.
The principal assumptions underlying RBS’s provision are:
• the proportion of relevant customers with interest rate caps that will ask to be included in the review;
• the type of consequential loss claims that will be received;
• movements in market rates that will impact the cost of closing out legacy hedging positions; and
• the cost of the review.
Uncertainties remain over the number of transactions that will qualify for redress and the nature and cost of that redress, including
the cost of consequential loss claims.
Background information in relation to Interest Rate Hedging Products claims is given in Note 30.
(3) RBS has provided for other customer redress, primarily in relation to investment advice in retail and private banking, £100 million
(2014 - £190 million) and packaged accounts, £157 million (2014 - £150 million).
(4) RBS is party to certain legal proceedings and regulatory investigations and continues to co-operate with a number of regulators. All
such matters are periodically reassessed with the assistance of external professional advisers, where appropriate, to determine the
likelihood of RBS incurring a liability and to evaluate the extent to which a reliable estimate of any liability can be made. An
additional charge of £361 million was booked in 2015 (2014 - £820 million; 2013 - £124 million), primarily relating to investigations
into the foreign exchange market, regulatory fines in connection with the June 2012 technology incident and other conduct and
regulatory matters. Details of these investigations and a discussion of the nature of the associated uncertainties are given in Note
30.
(5) Arising out of its normal business operations, RBS is party to legal proceedings in the United Kingdom, the United States and other
jurisdictions. An additional charge of £2.2 billion was recorded in 2015 as a result of greater levels of certainty on expected
outcomes, primarily in respect of mortgage-backed securities and securities-related litigation following third party settlements and
regulatory decisions. Detailed descriptions of RBS’s legal proceedings and discussion of the associated uncertainties are given in
Note 30.
(6) The majority of property provisions relate to vacant leasehold property and comprise the present value of the shortfall between
rentals payable and rentals receivable from sub-letting. Other provisions include restructuring provisions of £483 million principally
termination benefits.

Notes on the consolidated accounts
321
21 Deferred tax
2015 2014*
£m £m
Deferred tax asset (2,631) (1,911)
Deferred tax liability 882 500
Net deferred tax asset (1,749) (1,411)
Net deferred tax asset comprised: Fair Tax Accelerated value of AFS Cash losses
capital Deferred financial financial flow Share carried Pension allowances Provisions gains instruments assets Intangibles hedging schemes forward Other Total
£m £m £m £m £m £m £m £m £m £m £m £m
At 1 January 2014 (498) 1,258 (1,483) 327 3 (15) 226 1 (12) (2,496) (282) (2,971)
Transfer to disposal groups 28 (579) 423 — — 60 (276) 48 — — 33 (263)
Charge/(credit) to income
statement
- continuing operations 47 (181) 878 (4) (18) (5) — (62) (13) 1,019 72 1,733
- discontinued operations (6) 33 (38) — — (2) 51 6 — — 38 82
(Credit)/charge to other
comprehensive income (291) — — — — 34 — 281 (3) (12) — 9
Currency translation and
other adjustments 2 10 (33) — (13) (6) 4 6 (2) 10 21 (1)
At 1 January 2015 (718) 541 (253) 323 (28) 66 5 280 (30) (1,479) (118) (1,411)
Acquisitions/(disposals) of
subsidiaries 7 (19) — (3) — (5) — — — — (1) (21)
Charge/(credit) to income statement 162 (292) (84) (187) 48 (45) — 100 3 134 155 (6)
(Credit)/charge to other
comprehensive income (314) — — — — 65 — (128) 4 — — (373)
Currency translation and
other adjustments 6 8 (7) (1) 1 19 (1) 1 — 13 23 62
At 31 December 2015 (857) 238 (344) 132 21 100 4 253 (23) (1,332) 59 (1,749)
Deferred tax assets in respect of unused tax losses are recognised if the losses can be used to offset probable future taxable profits
after taking into account the expected reversal of other temporary differences. Recognised deferred tax assets in respect of tax losses
are analysed further below.
2015 2014*
£m £m
UK tax losses carried forward
- The Royal Bank of Scotland plc 462 489
- UK branch of RBS N.V. 1 —
- National Westminster Bank Plc 628 768
- Ulster Bank Limited 31 —
1,122 1,257
Overseas tax losses carried forward
- Ulster Bank Ireland Limited 210 222
1,332 1,479
*Restated - refer to page 267 for further details.
Notes on the consolidated accounts
322
UK tax losses
Under UK tax rules, tax losses can be carried forward indefinitely.
In periods from April 2015, the Finance Act 2015 limits the offset
of losses carried forward by UK banks to 50% of profits. The
main rate of UK Corporation Tax will reduce from 20% to 19%
from 1 April 2017 and to 18% from 1 April 2020. Under the
Finance (No 2) Act 2015, tax losses carried forward at 31
December 2015 are given credit in future periods at the main rate
of UK corporation tax rate, excluding the Banking Surcharge rate
(8%) introduced by the Act. Deferred tax assets and liabilities at
31 December 2015 take into account the reduced rates in respect
of tax losses and non-banking temporary differences and where
appropriate, the banking surcharge inclusive rate in respect of
other banking temporary differences.
The Royal Bank of Scotland plc – The Royal Bank of Scotland plc
reported a taxable profit in 2011 and tax losses in 2012 and
2013. The tax loss for 2012 reflected the reversal of previous
own credit gains offset by core banking profitability. In 2013 UK
tax losses were largely attributable to loan impairment charges
arising from the accelerated recovery strategy recorded in the
final quarter of the period. In 2014, core profitability remained
strong and a taxable profit arose. In 2015 a further tax loss arises
as a result of restructuring costs incurred as part of RBS's
strategic plan. A reduction in the carrying value of deferred tax
assets of £701 million was recorded in 2013 with a further
reduction of £850 million being recorded in 2014. In addition,
deferred tax of £150 million was not recognised in respect of
excess 2013 UK taxable losses. Restructuring will continue to
constrain the utilisation of carried forward tax losses in the near-
term. RBS expects that the balance of recognised deferred tax
asset at 31 December 2015 of £462 million in respect of tax
losses amounting to £2,433 million will be recovered by the end
of 2020.
National Westminster Bank Plc – the deferred tax asset in
respect of tax losses at 31 December 2015 relates to residual
unrelieved trading losses that arose between 2009 and 2014.
59% of the losses that arose were relieved against taxable profits
arising in other UK Group companies. Based on its strategic
plan, RBS expects that the recognised deferred tax asset of £628
million in respect of tax losses amounting to £3,307 million will be
recovered by the end of 2020.
Overseas tax losses
Ulster Bank Ireland Limited – a deferred tax asset of £210 million
has been recognised in respect of losses of £1,678 million (2014
- £1,776 million; 2013 - £592 million) of total tax losses of £7,083
million carried forward at 31 December 2015 (2014 - £8,599
million; 2013 - £11,575 million). These losses arose principally as
a result of significant impairment charges between 2008 and
2013 reflecting challenging economic conditions in the Republic
of Ireland. Impairment charges have reduced and Ulster Bank
Ireland Limited returned to profitability during 2014 and 2015.
Based on RBS’s strategic plan, the losses on which a deferred
tax asset has been recognised will be utilised against future
taxable profits by the end of 2022.
Unrecognised deferred tax
Deferred tax assets of £6,349 million (2014 - £5,738 million; 2013
- £4,942 million) have not been recognised in respect of tax
losses and other temporary differences carried forward of
£27,483 million (2014 - £26,742 million; 2013 - £28,099 million) in
jurisdictions where doubt exists over the availability of future
taxable profits. Of these losses and other temporary differences,
£4,737 million expire within five years and £7,148 million
thereafter. The balance of tax losses and other temporary
differences carried forward has no expiry date.
Deferred tax liabilities of £256 million (2014 - £186 million; 2013 -
£186 million) have not been recognised in respect of retained
earnings of overseas subsidiaries and held-over gains on the
incorporation of overseas branches. Retained earnings of
overseas subsidiaries are expected to be reinvested indefinitely
or remitted to the UK free from further taxation. No taxation is
expected to arise in the foreseeable future in respect of held-over
gains. Changes to UK tax legislation largely exempts from UK
tax, overseas dividends received on or after 1 July 2009.

Notes on the consolidated accounts
323
22 Subordinated liabilities 2015 2014 £m £m
Dated loan capital 13,866 17,028
Undated loan capital 4,826 4,771
Preference shares 1,155 1,106
19,847 22,905
Certain preference shares issued by the company are classified as liabilities; these securities remain subject to the capital maintenance
rules of the Companies Act 2006.
The following tables analyse the remaining contractual maturity of subordinated liabilities by the final redemption date and by the
next call date.
2016 2017 2018-2020 2021-2025 Thereafter Perpetual Total
2015 - final redemption £m £m £m £m £m £m £m
Sterling 19 — — 369 — 631 1,019
US dollar 79 — 676 6,674 3,027 2,052 12,508
Euro 195 648 1,794 2,240 251 184 5,312
Other 30 — — 737 — 241 1,008
323 648 2,470 10,020 3,278 3,108 19,847
Currently 2016 2017 2018-2020 2021-2025 Thereafter Perpetual Total
2015 - call date £m £m £m £m £m £m £m £m
Sterling 15 74 51 155 483 44 197 1,019
US dollar 3,208 880 1,435 750 5,240 995 — 12,508
Euro — 1,091 1,063 2,540 321 250 47 5,312
Other 8 263 737 — — — — 1,008
3,231 2,308 3,286 3,445 6,044 1,289 244 19,847
2015 2016 2017-2019 2020-2024 Thereafter Perpetual Total
2014 - final redemption £m £m £m £m £m £m £m
Sterling 700 — — 381 — 640 1,721
US dollar 926 — 793 6,371 2,766 1,948 12,804
Euro 1,120 27 2,672 2,420 267 195 6,701
Other 526 — 77 796 — 280 1,679
3,272 27 3,542 9,968 3,033 3,063 22,905
Currently 2015 2016 2017-2019 2020-2024 Thereafter Perpetual Total
2014 - call date £m £m £m £m £m £m £m £m
Sterling 15 700 57 212 495 45 197 1,721
US dollar 2,871 1,962 — 2,020 5,007 944 — 12,804
Euro — 1,284 861 3,893 347 267 49 6,701
Other 8 602 273 796 — — — 1,679
2,894 4,548 1,191 6,921 5,849 1,256 246 22,905

Notes on the consolidated accounts
324
Issuances and redemptions during the year (values as at date of transaction) are set out below. Capital 2015 2014
treatment £m £m
New issues
The Royal Bank of Scotland Group plc
€1,000 million 3.63% subordinated notes 2024 Tier 2 — 828
US$2,250 million 5.13% subordinated notes 2024 Tier 2 — 1,331
— 2,159
Redemptions
The Royal Bank of Scotland Group plc
US$750 million 5.00% subordinated notes Tier 2 — 453
US$250 million 5.00% subordinated notes Tier 2 — 151
€391 million floating rate undated notes Tier 1 — 310
US$318 million floating rate undated notes Tier 1 — 188 The Royal Bank of Scotland plc
€23 million floating rate dated notes Ineligible 17 —
US$675 million 5.05% dated notes Ineligible 445 —
AU$18 million floating rate dated notes Ineligible 9 —
AU$36 million floating rate dated notes Ineligible 18 —
USD$ 238 million floating rate dated notes Ineligible 154 —
€750 million 4.88% dated notes Tier 2 546 —
£250 million 9.63% dated notes Tier 2 250 —
CHF400 million 2.38% dated notes Tier 2 259 —
CHF100 million 2.38% dated notes Tier 2 65 —
CHF200 million 2.38% dated notes Tier 2 129 —
AUD397 million floating rate subordinated notes Tier 2 — 217
AUD265 million floating rate subordinated notes Tier 2 — 145
CAD217 million floating rate subordinated notes Tier 2 — 94
US$322 million floating rate subordinated notes Tier 2 — 177
US$229 million floating rate subordinated notes Tier 2 — 144
US$686 million floating rate subordinated notes Tier 2 — 431
€227 million floating rate subordinated notes Tier 2 — 179
CHF34 million floating rate subordinated notes Tier 2 — 23
£56 million 6.00% undated notes Tier 2 — 56
€176 million floating rate undated notes Tier 2 — 138
€170 million floating rate undated notes Tier 2 — 133
£1 million floating rate undated notes Tier 2 — 1
AUD32 million floating rate subordinated notes (partial redemption) Tier 2 — 17
AUD53.7 million floating rate subordinated notes (partial redemption) Tier 2 — 29
€79.75 million floating rate notes (partial redemption) Tier 2 — 65
US$211.9 million floating rate subordinated notes (partial redemption) Tier 2 — 129 NatWest plc £87 million 5.95% undated notes Tier 2 87 —
£300 million 7.88% dated notes Tier 2 300 — Ulster Bank Ireland Ltd
£60 million floating rate subordinated notes Tier 2 — 60 RBS N.V. and subsidiaries
US$22 million 6.14% dated notes (partial redemption) Ineligible 15 —
AU$26 million floating rate dated notes Ineligible 13 —
AU$123 million floating rate dated notes Ineligible 62 —
US$564 million floating rate dated notes Ineligible 380 —
€415 million floating rate dated notes Ineligible 294 —
€5 million floating rate dated notes Ineligible 4 —
AUD451.8 million 6.50% subordinated notes (partial redemption) Tier 2 — 240
AUD149.2 million 7.46% subordinated notes (partial redemption) Tier 2 — 79
US$72.8 million 6.14% subordinated notes (partial redemption) Tier 2 — 45 The Royal Bank of Scotland Berhad
MYR200 million 4.15% subordinated notes Ineligible — 36
3,047 3,540
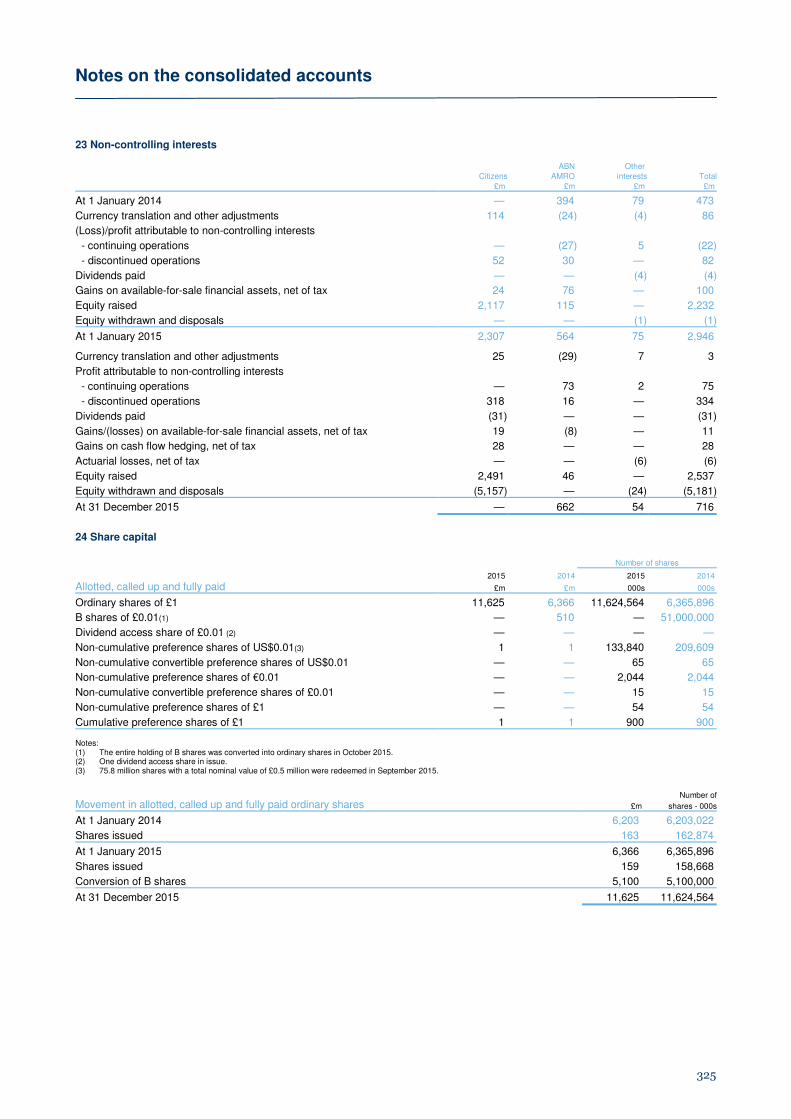
Notes on the consolidated accounts
325
23 Non-controlling interests
ABN Other Citizens AMRO interests Total
£m £m £m £m
At 1 January 2014 — 394 79 473
Currency translation and other adjustments 114 (24) (4) 86
(Loss)/profit attributable to non-controlling interests
- continuing operations — (27) 5 (22)
- discontinued operations 52 30 — 82
Dividends paid — — (4) (4)
Gains on available-for-sale financial assets, net of tax 24 76 — 100
Equity raised 2,117 115 — 2,232
Equity withdrawn and disposals — — (1) (1)
At 1 January 2015 2,307 564 75 2,946 Currency translation and other adjustments 25 (29) 7 3
Profit attributable to non-controlling interests
- continuing operations — 73 2 75
- discontinued operations 318 16 — 334
Dividends paid (31) — — (31)
Gains/(losses) on available-for-sale financial assets, net of tax 19 (8) — 11
Gains on cash flow hedging, net of tax 28 — — 28
Actuarial losses, net of tax — — (6) (6)
Equity raised 2,491 46 — 2,537
Equity withdrawn and disposals (5,157) — (24) (5,181)
At 31 December 2015 — 662 54 716
24 Share capital Number of shares 2015 2014 2015 2014
Allotted, called up and fully paid £m £m 000s 000s
Ordinary shares of £1 11,625 6,366 11,624,564 6,365,896
B shares of £0.01(1) — 510 — 51,000,000
Dividend access share of £0.01 (2) — — — —
Non-cumulative preference shares of US$0.01(3) 1 1 133,840 209,609
Non-cumulative convertible preference shares of US$0.01 — — 65 65
Non-cumulative preference shares of €0.01 — — 2,044 2,044
Non-cumulative convertible preference shares of £0.01 — — 15 15
Non-cumulative preference shares of £1 — — 54 54
Cumulative preference shares of £1 1 1 900 900 Notes: (1) The entire holding of B shares was converted into ordinary shares in October 2015. (2) One dividend access share in issue. (3) 75.8 million shares with a total nominal value of £0.5 million were redeemed in September 2015.
Movement in allotted, called up and fully paid ordinary shares Number of
£m shares - 000s
At 1 January 2014 6,203 6,203,022
Shares issued 163 162,874
At 1 January 2015 6,366 6,365,896
Shares issued 159 158,668
Conversion of B shares 5,100 5,100,000
At 31 December 2015 11,625 11,624,564
Notes on the consolidated accounts
326
Ordinary shares
There is no authorised share capital under the company’s
constitution. At 31 December 2015, the directors had authority
granted at the 2015 Annual General Meeting to issue up to £274
million nominal of ordinary shares other than by pre-emption to
existing shareholders.
During 2015, the company allotted and issued the following new
ordinary shares of £1 each:
Month Number of shares
Subscription price per share
Gross proceeds
April 21.3m 352.070p £75 million
June 21.3m 352.811p £75 million
December 47.5m 315.942p £150 million
In addition, the company issued 69 million ordinary shares of £1
each in connection with employee share plans. In October 2015,
the company allotted and issued 5.1 billion new ordinary shares
of £1 each to HM Treasury on conversion of 51 billion B shares.
The company did not pay an ordinary dividend in 2015 or 2014.
B shares and dividend access share
From December 2009, HM Treasury owned 51 billion B shares
with a nominal value of £0.01 each and a dividend access share
with a nominal value of £0.01.
The B shares carried no voting rights at general meetings of
ordinary shareholders and were convertible at any time at HM
Treasury’s option into ordinary shares at the rate of ten B shares
for each ordinary share. In October 2015, all of the B shares were
converted into ordinary shares of £1 each.
On 25 June 2014, the company’s independent shareholders
approved the ‘DAS Retirement Agreement’ between RBS and
HM Treasury to provide for the future retirement of the Dividend
Access Share (‘DAS’). The DAS Retirement Agreement sets out
terms for the removal of the DAS. Under the DAS Retirement
Agreement once RBS has paid dividends on the DAS totalling
£1.5 billion, it will lose its preferential rights and become a single
B share.
Preference shares
Under IFRS certain of RBS's preference shares are classified as
debt and are included in subordinated liabilities on the balance
sheet.
Between 1 January 2016 and the date of approval of these
accounts, dividends amounting to US$77 million and £0.4 million
have been declared in respect of equity preference shares for
payment on 31 March 2016.
Other securities
Certain of RBS's subordinated securities in the legal form of debt
are classified as equity under IFRS.
These securities entitle the holders to interest which may be
deferred at the sole discretion of the company. Repayment of the
securities is at the sole discretion of the company on giving
between 30 and 60 days notice.
Non-cumulative preference shares
Non-cumulative preference shares entitle the holders thereof
(subject to the terms of issue) to receive periodic non-cumulative
cash dividends at specified fixed rates for each Series payable
out of distributable profits of the company.
The non-cumulative preference shares are redeemable at the
option of the company, in whole or in part from time to time at the
rates detailed in the table below plus dividends otherwise payable
for the then current dividend period accrued to the date of
redemption.
In September 2015, the company redeemed in whole the Series
M, N, P and Q non-cumulative preference shares of US$0.01.
The Group has resumed payments on all discretionary non-equity
capital instruments following the end of the European
Commission ban in 2012 for RBS and 2013 for RBS N.V. Future
coupons and dividends on hybrid capital instruments will only be
paid subject to, and in accordance with, the terms of the relevant
instruments.
In the context of macro-prudential policy discussions, the Board
decided to partially neutralise any impact on CET1 capital of
coupon and dividend payments for 2013, 2014 and 2015. £300
million of new equity was issued during the course of 2015 and
the Board has decided a further £300 million of new equity will be
issued during the course of 2016 to again partially neutralise the
CET1 impact of coupon and dividend payments.
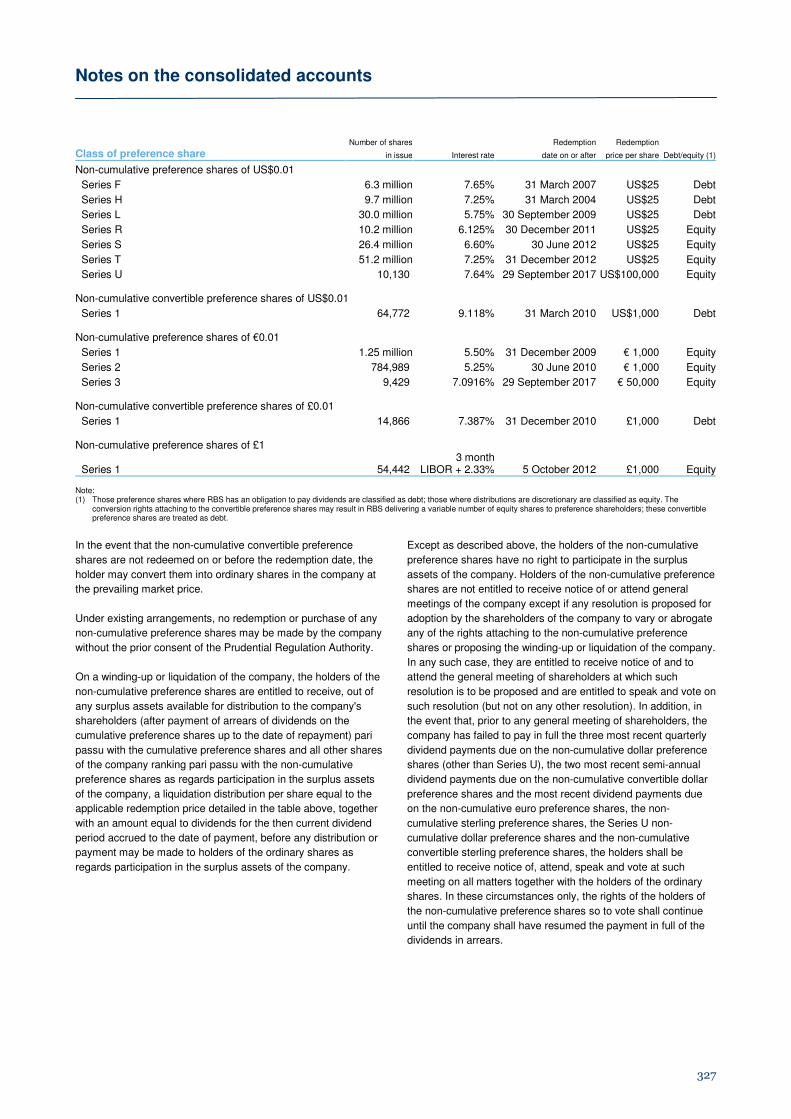
Notes on the consolidated accounts
327
Class of preference share Number of shares Redemption Redemption
in issue Interest rate date on or after price per share Debt/equity (1)
Non-cumulative preference shares of US$0.01
Series F 6.3 million 7.65% 31 March 2007 US$25 Debt
Series H 9.7 million 7.25% 31 March 2004 US$25 Debt
Series L 30.0 million 5.75% 30 September 2009 US$25 Debt
Series R 10.2 million 6.125% 30 December 2011 US$25 Equity
Series S 26.4 million 6.60% 30 June 2012 US$25 Equity
Series T 51.2 million 7.25% 31 December 2012 US$25 Equity
Series U 10,130 7.64% 29 September 2017 US$100,000 Equity Non-cumulative convertible preference shares of US$0.01
Series 1 64,772 9.118% 31 March 2010 US$1,000 Debt Non-cumulative preference shares of €0.01
Series 1 1.25 million 5.50% 31 December 2009 € 1,000 Equity
Series 2 784,989 5.25% 30 June 2010 € 1,000 Equity
Series 3 9,429 7.0916% 29 September 2017 € 50,000 Equity Non-cumulative convertible preference shares of £0.01
Series 1 14,866 7.387% 31 December 2010 £1,000 Debt Non-cumulative preference shares of £1
Series 1 54,442 3 month
LIBOR + 2.33% 5 October 2012 £1,000 Equity Note: (1) Those preference shares where RBS has an obligation to pay dividends are classified as debt; those where distributions are discretionary are classified as equity. The
conversion rights attaching to the convertible preference shares may result in RBS delivering a variable number of equity shares to preference shareholders; these convertible preference shares are treated as debt.
In the event that the non-cumulative convertible preference
shares are not redeemed on or before the redemption date, the
holder may convert them into ordinary shares in the company at
the prevailing market price.
Under existing arrangements, no redemption or purchase of any
non-cumulative preference shares may be made by the company
without the prior consent of the Prudential Regulation Authority.
On a winding-up or liquidation of the company, the holders of the
non-cumulative preference shares are entitled to receive, out of
any surplus assets available for distribution to the company's
shareholders (after payment of arrears of dividends on the
cumulative preference shares up to the date of repayment) pari
passu with the cumulative preference shares and all other shares
of the company ranking pari passu with the non-cumulative
preference shares as regards participation in the surplus assets
of the company, a liquidation distribution per share equal to the
applicable redemption price detailed in the table above, together
with an amount equal to dividends for the then current dividend
period accrued to the date of payment, before any distribution or
payment may be made to holders of the ordinary shares as
regards participation in the surplus assets of the company.
Except as described above, the holders of the non-cumulative
preference shares have no right to participate in the surplus
assets of the company. Holders of the non-cumulative preference
shares are not entitled to receive notice of or attend general
meetings of the company except if any resolution is proposed for
adoption by the shareholders of the company to vary or abrogate
any of the rights attaching to the non-cumulative preference
shares or proposing the winding-up or liquidation of the company.
In any such case, they are entitled to receive notice of and to
attend the general meeting of shareholders at which such
resolution is to be proposed and are entitled to speak and vote on
such resolution (but not on any other resolution). In addition, in
the event that, prior to any general meeting of shareholders, the
company has failed to pay in full the three most recent quarterly
dividend payments due on the non-cumulative dollar preference
shares (other than Series U), the two most recent semi-annual
dividend payments due on the non-cumulative convertible dollar
preference shares and the most recent dividend payments due
on the non-cumulative euro preference shares, the non-
cumulative sterling preference shares, the Series U non-
cumulative dollar preference shares and the non-cumulative
convertible sterling preference shares, the holders shall be
entitled to receive notice of, attend, speak and vote at such
meeting on all matters together with the holders of the ordinary
shares. In these circumstances only, the rights of the holders of
the non-cumulative preference shares so to vote shall continue
until the company shall have resumed the payment in full of the
dividends in arrears.
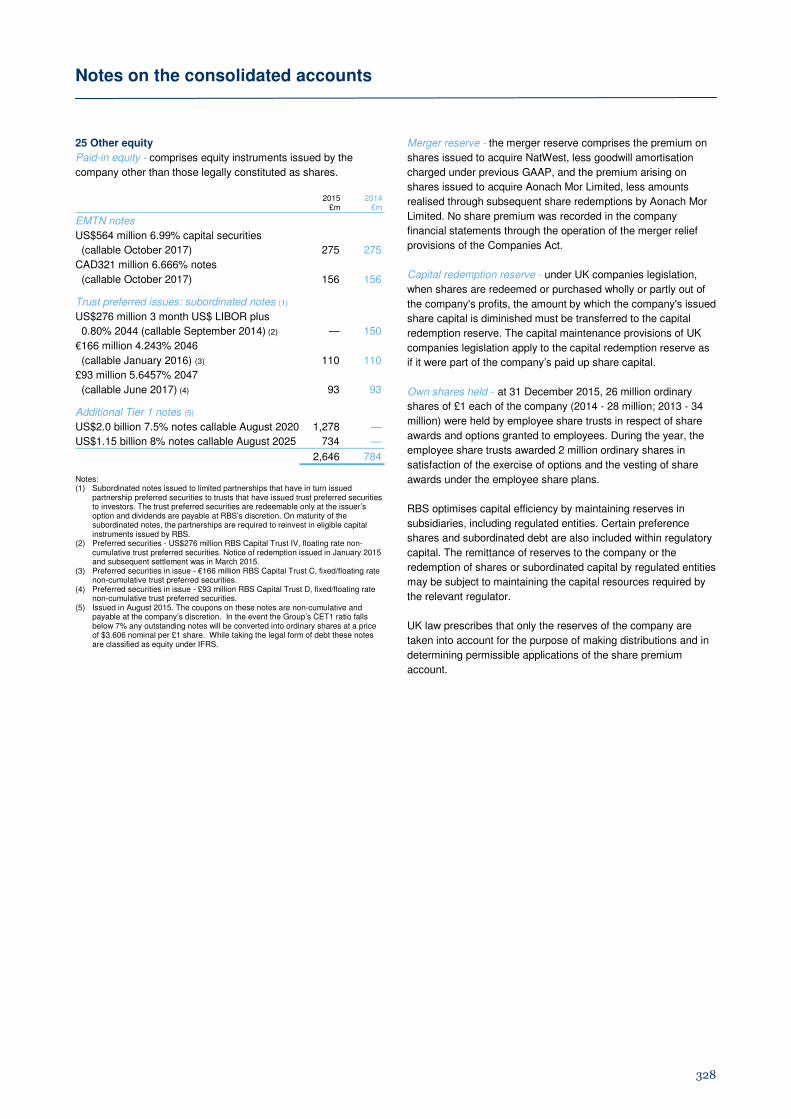
Notes on the consolidated accounts
328
25 Other equity
Paid-in equity - comprises equity instruments issued by the
company other than those legally constituted as shares.
2015 2014 £m £m
EMTN notes
US$564 million 6.99% capital securities
(callable October 2017) 275 275
CAD321 million 6.666% notes
(callable October 2017) 156 156
Trust preferred issues: subordinated notes (1)
US$276 million 3 month US$ LIBOR plus
0.80% 2044 (callable September 2014) (2) — 150
€166 million 4.243% 2046
(callable January 2016) (3) 110 110
£93 million 5.6457% 2047
(callable June 2017) (4) 93 93
Additional Tier 1 notes (5)
US$2.0 billion 7.5% notes callable August 2020 1,278 —
US$1.15 billion 8% notes callable August 2025 734 —
2,646 784 Notes: (1) Subordinated notes issued to limited partnerships that have in turn issued
partnership preferred securities to trusts that have issued trust preferred securities to investors. The trust preferred securities are redeemable only at the issuer’s option and dividends are payable at RBS’s discretion. On maturity of the subordinated notes, the partnerships are required to reinvest in eligible capital instruments issued by RBS.
(2) Preferred securities - US$276 million RBS Capital Trust IV, floating rate non-cumulative trust preferred securities. Notice of redemption issued in January 2015 and subsequent settlement was in March 2015.
(3) Preferred securities in issue - €166 million RBS Capital Trust C, fixed/floating rate non-cumulative trust preferred securities.
(4) Preferred securities in issue - £93 million RBS Capital Trust D, fixed/floating rate non-cumulative trust preferred securities.
(5) Issued in August 2015. The coupons on these notes are non-cumulative and payable at the company’s discretion. In the event the Group’s CET1 ratio falls below 7% any outstanding notes will be converted into ordinary shares at a price of $3.606 nominal per £1 share. While taking the legal form of debt these notes are classified as equity under IFRS.
Merger reserve - the merger reserve comprises the premium on
shares issued to acquire NatWest, less goodwill amortisation
charged under previous GAAP, and the premium arising on
shares issued to acquire Aonach Mor Limited, less amounts
realised through subsequent share redemptions by Aonach Mor
Limited. No share premium was recorded in the company
financial statements through the operation of the merger relief
provisions of the Companies Act.
Capital redemption reserve - under UK companies legislation,
when shares are redeemed or purchased wholly or partly out of
the company's profits, the amount by which the company's issued
share capital is diminished must be transferred to the capital
redemption reserve. The capital maintenance provisions of UK
companies legislation apply to the capital redemption reserve as
if it were part of the company’s paid up share capital.
Own shares held - at 31 December 2015, 26 million ordinary
shares of £1 each of the company (2014 - 28 million; 2013 - 34
million) were held by employee share trusts in respect of share
awards and options granted to employees. During the year, the
employee share trusts awarded 2 million ordinary shares in
satisfaction of the exercise of options and the vesting of share
awards under the employee share plans.
RBS optimises capital efficiency by maintaining reserves in
subsidiaries, including regulated entities. Certain preference
shares and subordinated debt are also included within regulatory
capital. The remittance of reserves to the company or the
redemption of shares or subordinated capital by regulated entities
may be subject to maintaining the capital resources required by
the relevant regulator.
UK law prescribes that only the reserves of the company are
taken into account for the purpose of making distributions and in
determining permissible applications of the share premium
account.
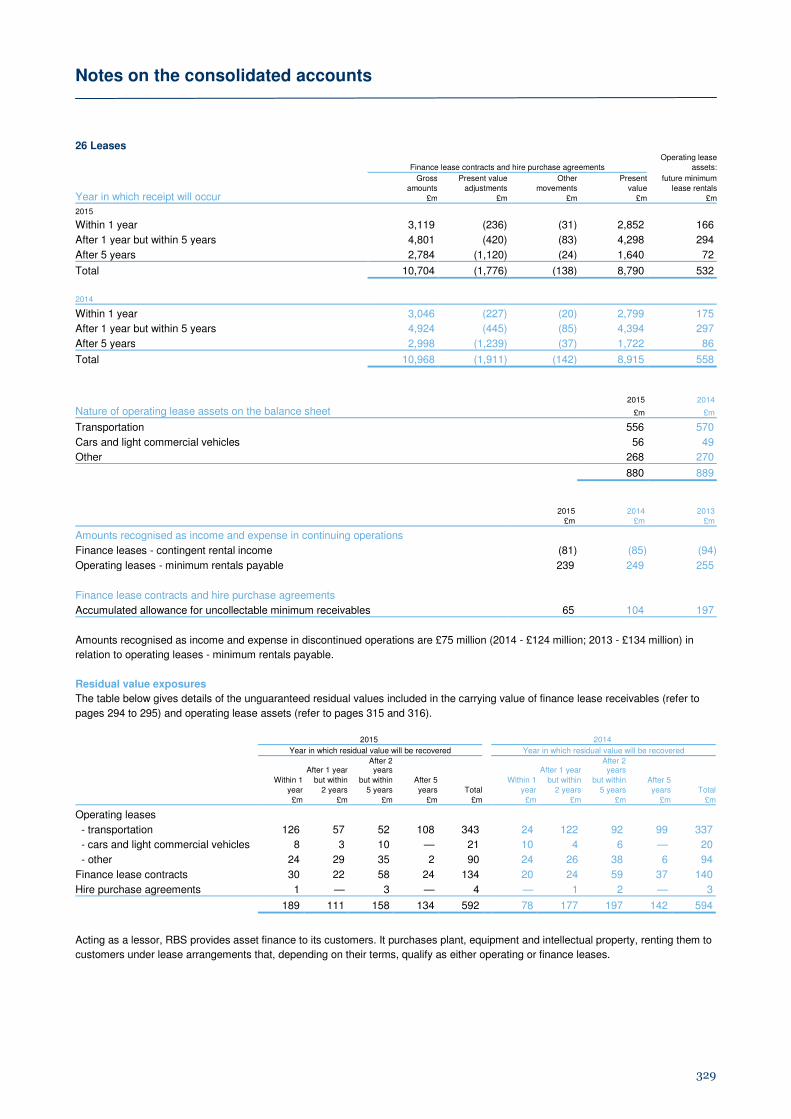
Notes on the consolidated accounts
329
26 Leases
Year in which receipt will occur
Finance lease contracts and hire purchase agreements Operating lease
assets:
Gross Present value Other Present future minimumamounts adjustments movements value lease rentals
£m £m £m £m £m
2015
Within 1 year 3,119 (236) (31) 2,852 166
After 1 year but within 5 years 4,801 (420) (83) 4,298 294
After 5 years 2,784 (1,120) (24) 1,640 72
Total 10,704 (1,776) (138) 8,790 532
2014
Within 1 year 3,046 (227) (20) 2,799 175
After 1 year but within 5 years 4,924 (445) (85) 4,394 297
After 5 years 2,998 (1,239) (37) 1,722 86
Total 10,968 (1,911) (142) 8,915 558
2015 2014
Nature of operating lease assets on the balance sheet £m £m
Transportation 556 570
Cars and light commercial vehicles 56 49
Other 268 270
880 889
2015 2014 2013
£m £m £m
Amounts recognised as income and expense in continuing operations
Finance leases - contingent rental income (81) (85) (94)
Operating leases - minimum rentals payable 239 249 255
Finance lease contracts and hire purchase agreements
Accumulated allowance for uncollectable minimum receivables 65 104 197
Amounts recognised as income and expense in discontinued operations are £75 million (2014 - £124 million; 2013 - £134 million) in
relation to operating leases - minimum rentals payable.
Residual value exposures
The table below gives details of the unguaranteed residual values included in the carrying value of finance lease receivables (refer to
pages 294 to 295) and operating lease assets (refer to pages 315 and 316). 2015 2014
Year in which residual value will be recovered Year in which residual value will be recovered
After 1 year After 2 years
Total
After 1 yearAfter 2 years
TotalWithin 1 but within but within After 5 Within 1 but within but within After 5
year 2 years 5 years years year 2 years 5 years years
£m £m £m £m £m £m £m £m £m £m
Operating leases
- transportation 126 57 52 108 343 24 122 92 99 337
- cars and light commercial vehicles 8 3 10 — 21 10 4 6 — 20
- other 24 29 35 2 90 24 26 38 6 94
Finance lease contracts 30 22 58 24 134 20 24 59 37 140
Hire purchase agreements 1 — 3 — 4 — 1 2 — 3
189 111 158 134 592 78 177 197 142 594
Acting as a lessor, RBS provides asset finance to its customers. It purchases plant, equipment and intellectual property, renting them to
customers under lease arrangements that, depending on their terms, qualify as either operating or finance leases.

Notes on the consolidated accounts
330
27 Structured entities
A structured entity (SE) is an entity that has been designed such
that voting or similar rights are not the dominant factor in deciding
who controls the entity, for example, when any voting rights relate
to administrative tasks only and the relevant activities are
directed by means of contractual arrangements. SEs are usually
established for a specific, limited purpose. They do not carry out
a business or trade and typically have no employees. They take a
variety of legal forms - trusts, partnerships and companies - and
fulfil many different functions. As well as being a key element of
securitisations, SEs are also used in fund management activities
in order to segregate custodial duties from the provision of fund
management advice.
Consolidated structured entities
Securitisations
In a securitisation, assets, or interests in a pool of assets, are
transferred generally to an SE which then issues liabilities to third
party investors. The majority of securitisations are supported
through liquidity facilities or other credit enhancements. RBS
arranges securitisations to facilitate client transactions and
undertakes own asset securitisations to sell or to fund portfolios
of financial assets. RBS also acts as an underwriter and
depositor in securitisation transactions in both client and
proprietary transactions.
RBS’s involvement in client securitisations takes a number of
forms. It may: sponsor or administer a securitisation programme;
provide liquidity facilities or programme-wide credit enhancement;
and purchase securities issued by the vehicle.
Own asset securitisations
In own-asset securitisations, the pool of assets held by the SE is
either originated by RBS, or (in the case of whole loan
programmes) purchased from third parties.
The table below analyses the asset categories for those own-
asset securitisations where the transferred assets continue to be
recorded on RBS’s balance sheet.
2015 2014
Debt securities in issue Debt securities in issue
Asset type
Held by third Held by Held by third Held by Assets parties RBS (1) Total Assets parties RBS (1) Total
£m £m £m £m £m £m £m £m
Mortgages
- UK 3,954 961 3,067 4,028 11,992 3,543 9,877 13,420
- Irish 7,395 1,472 6,836 8,308 8,593 1,697 7,846 9,543
UK credit cards — — — — 2,717 — 1,567 1,567
Other loans (2) 333 9 238 247 5,373 334 5,245 5,579
11,682 2,442 10,141 12,583 28,675 5,574 24,535 30,109
Cash deposits 1,201 4,616
12,883 33,291 Notes: (1) Debt securities retained by RBS may be pledged with central banks. (2) Corporate, social housing and student loans.
Commercial paper conduits
RBS consolidates a number of asset-backed commercial paper (ABCP) conduits. A conduit is an SE that issues commercial paper and
uses the proceeds to purchase or fund a pool of assets. The commercial paper is secured on the assets and is redeemed by further
commercial paper issuance, repayment of assets or funding from liquidity facilities. Commercial paper is typically short-dated, usually up
to three months. At 31 December 2015 assets held by the conduits totalled £0.6 billion (2014 - £0.6 billion). At 31 December 2015 and
2014 the conduits were funded entirely by RBS.
Covered bond programme
Certain loans and advances to customers have been assigned to bankruptcy remote limited liability partnerships to provide security for
issues of debt securities by RBS. RBS retains all of the risks and rewards of these loans, the partnerships are consolidated, the loans
retained on RBS’s balance sheet and the related covered bonds included within debt securities in issue. At 31 December 2015, £11,207
million of mortgages provided security for debt securities in issue of £5,585 million (2014: mortgages - £13,401 million, bonds - £7,114
million).

Notes on the consolidated accounts
331
Unconsolidated structured entities
RBS’s interests in unconsolidated structured entities are analysed below. 2015 2014
Asset backed Investment Asset backed Investment
securitisation funds securitisation fundsvehicles and other Total vehicles and other Total
£m £m £m £m £m £m
Held-for-trading
Loans and advances to customers 139 — 139 449 22 471
Debt securities 455 73 528 3,854 2 3,856
Equity shares — 113 113 — 327 327
Derivative assets 548 13 561 1,670 10 1,680
Derivative liabilities (152) (23) (175) (851) (28) (879)
Total 990 176 1,166 5,122 333 5,455
Other than held-for-trading
Loans and advances to customers 2,663 2 2,665 5,549 23 5,572
Debt securities 3,263 123 3,386 5,644 147 5,791
Total 5,926 125 6,051 11,193 170 11,363
Liquidity facilities/loan commitments 1,362 — 1,362 2,759 — 2,759
Guarantees — — — 71 — 71 Maximum exposure 8,278 301 8,579 19,145 503 19,648 Notes: (1) Income from interests in unconsolidated structured entities includes interest receivable, changes in fair value and other income less impairments. (2) A sponsored entity is a structured entity established by RBS where RBS provides liquidity and/or credit enhancements or provides ongoing services to the entity. RBS can act as
sponsor for its own or for customers’ transactions. (3) In 2015, no assets were transferred into sponsored structured entities (2014 - £1,756 million) which are not consolidated by RBS and for which RBS held no interest at 31
December 2015. Income arising from sponsored entities where we hold net interest at year end was £39 million (2014 - £172 million).
28 Asset transfers
Transfers that do not qualify for derecognition
Securities repurchase agreements and lending transactions
RBS enters into securities repurchase agreements and securities
lending transactions under which it transfers securities in
accordance with normal market practice.
Generally, the agreements require additional collateral to be
provided if the value of the securities falls below a predetermined
level. Under standard terms for repurchase transactions in the
UK and US markets, the recipient of collateral has an unrestricted
right to sell or repledge it, subject to returning equivalent
securities on settlement of the transaction.
Securities sold under repurchase transactions are not
derecognised if RBS retains substantially all the risks and
rewards of ownership. The fair value (and carrying value) of
securities transferred under such repurchase transactions
included on the balance sheet, are set out below. All of these
securities could be sold or repledged by the holder.
Assets subject to securities repurchase agreements or security lending transactions 2015 2014
£m £m
Debt securities 20,224 23,048
Equity shares 9 2,557
Assets pledged as collateral
The Group pledges collateral with its counterparties in respect of derivative liabilities and bank and other borrowings. Assets pledged against liabilities Liabilities secured by assets
Loans and Loans and
advances advances Deposits Customer
to banks to customers Securities Total by banks accounts Derivatives Total
£m £m £m £m £m £m £m £m
2015 11,477 17,633 14,517 43,627 293 — 31,131 31,424
2014 11,973 23,245 9,595 44,813 770 130 39,289 40,189
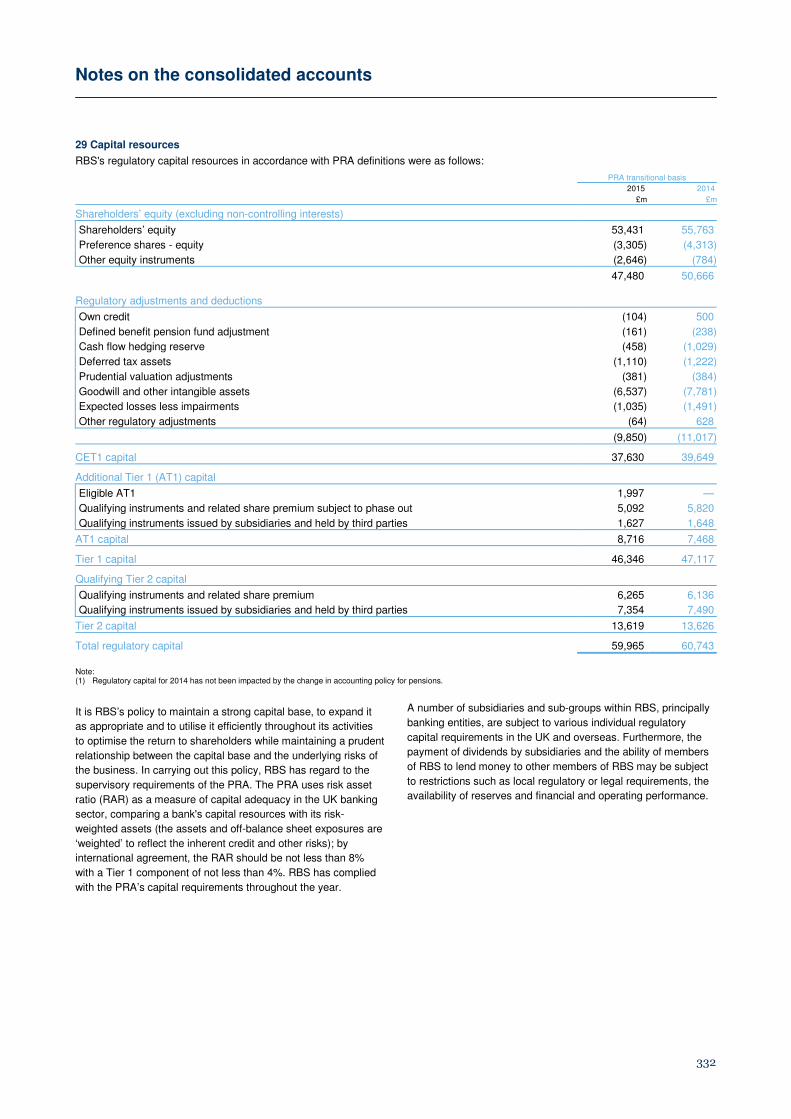
Notes on the consolidated accounts
332
29 Capital resources RBS's regulatory capital resources in accordance with PRA definitions were as follows: PRA transitional basis
2015 2014
£m £m
Shareholders’ equity (excluding non-controlling interests)
Shareholders’ equity 53,431 55,763
Preference shares - equity (3,305) (4,313)
Other equity instruments (2,646) (784)
47,480 50,666 Regulatory adjustments and deductions
Own credit (104) 500
Defined benefit pension fund adjustment (161) (238)
Cash flow hedging reserve (458) (1,029)
Deferred tax assets (1,110) (1,222)
Prudential valuation adjustments (381) (384)
Goodwill and other intangible assets (6,537) (7,781)
Expected losses less impairments (1,035) (1,491)
Other regulatory adjustments (64) 628
(9,850) (11,017) CET1 capital 37,630 39,649 Additional Tier 1 (AT1) capital
Eligible AT1 1,997 —
Qualifying instruments and related share premium subject to phase out 5,092 5,820
Qualifying instruments issued by subsidiaries and held by third parties 1,627 1,648
AT1 capital 8,716 7,468 Tier 1 capital 46,346 47,117 Qualifying Tier 2 capital
Qualifying instruments and related share premium 6,265 6,136
Qualifying instruments issued by subsidiaries and held by third parties 7,354 7,490
Tier 2 capital 13,619 13,626 Total regulatory capital 59,965 60,743
Note: (1) Regulatory capital for 2014 has not been impacted by the change in accounting policy for pensions.
It is RBS’s policy to maintain a strong capital base, to expand it
as appropriate and to utilise it efficiently throughout its activities
to optimise the return to shareholders while maintaining a prudent
relationship between the capital base and the underlying risks of
the business. In carrying out this policy, RBS has regard to the
supervisory requirements of the PRA. The PRA uses risk asset
ratio (RAR) as a measure of capital adequacy in the UK banking
sector, comparing a bank's capital resources with its risk-
weighted assets (the assets and off-balance sheet exposures are
‘weighted’ to reflect the inherent credit and other risks); by
international agreement, the RAR should be not less than 8%
with a Tier 1 component of not less than 4%. RBS has complied
with the PRA’s capital requirements throughout the year.
A number of subsidiaries and sub-groups within RBS, principally
banking entities, are subject to various individual regulatory
capital requirements in the UK and overseas. Furthermore, the
payment of dividends by subsidiaries and the ability of members
of RBS to lend money to other members of RBS may be subject
to restrictions such as local regulatory or legal requirements, the
availability of reserves and financial and operating performance.

Notes on the consolidated accounts
333
30 Memorandum items
Contingent liabilities and commitments
The amounts shown in the table below are intended only to provide an indication of the volume of business outstanding at 31 December
2015. Although RBS is exposed to credit risk in the event of a customer’s failure to meet its obligations, the amounts shown do not, and
are not intended to, provide any indication of RBS's expectation of future losses. More than More than
2015 2014
1 year but 3 years but
Less than less than less than Over 1 year 3 years 5 years 5 years
£m £m £m £m £m £m
Guarantees and assets pledged as collateral security 2,725 1,081 1,739 3,491 9,036 16,721
Other contingent liabilities 3,195 1,703 798 1,306 7,002 9,581
Standby facilities, credit lines and other commitments 55,602 25,610 41,754 14,748 137,714 214,884
Contingent liabilities and commitments 61,522 28,394 44,291 19,545 153,752 241,186 Note: (1) Includes liquidity facilities provided to RBS sponsored conduits.
Banking commitments and contingent obligations, which have
been entered into on behalf of customers and for which there are
corresponding obligations from customers, are not included in
assets and liabilities. RBS's maximum exposure to credit loss, in
the event of its obligation crystallising and all counterclaims,
collateral or security proving valueless, is represented by the
contractual nominal amount of these instruments included in the
table above. These commitments and contingent obligations are
subject to RBS's normal credit approval processes.
Guarantees - RBS gives guarantees on behalf of customers. A
financial guarantee represents an irrevocable undertaking that
RBS will meet a customer's specified obligations to third party if
the customer fails to do so. The maximum amount that RBS
could be required to pay under a guarantee is its principal
amount as in the table above. RBS expects most guarantees to
expire unused.
Other contingent liabilities - these include standby letters of
credit, supporting customer debt issues and contingent liabilities
relating to customer trading activities such as those arising from
performance and customs bonds, warranties and indemnities.
Standby facilities and credit line lend - under a loan commitment,
RBS agrees to make funds available to a customer in the future.
Loan commitments, which are usually for a specified term, may
be unconditionally cancellable or may persist, provided all
conditions in the loan facility are satisfied or waived.
Commitments to lend include commercial standby facilities and
credit lines, liquidity facilities to commercial paper conduits and
unutilised overdraft facilities.
Other commitments - these include documentary credits, which
are commercial letters of credit providing for payment by RBS to
a named beneficiary against presentation of specified
documents, forward asset purchases, forward deposits placed
and undrawn note issuance and revolving underwriting facilities,
and other short-term trade related transactions.
Notes on the consolidated accounts
334
Contractual obligations for future expenditure not provided for in the accounts
The following table shows contractual obligations for future expenditure not provided for in the accounts at the year end.
2015 2014 £m £m
Operating leases
Minimum rentals payable under non-cancellable leases (1)
- within 1 year 232 237
- after 1 year but within 5 years 759 784
- after 5 years 2,006 2,110
2,997 3,131
Capital expenditure on property, plant and equipment 59 35
Contracts to purchase goods or services (2) 1,442 1,827
4,498 4,993 Notes: (1) Predominantly property leases. (2) Of which due within 1 year: £302 million (2014 - £389 million).
Trustee and other fiduciary activities
In its capacity as trustee or other fiduciary role, the Group may
hold or place assets on behalf of individuals, trusts, companies,
pension schemes and others. The assets and their income are
not included in the Group's financial statements. The Group
earned fee income of £321 million (2014 - £425 million; 2013 -
£462 million) from these activities.
The Financial Services Compensation Scheme
The Financial Services Compensation Scheme (FSCS), the UK's
statutory fund of last resort for customers of authorised financial
services firms, pays compensation if a firm is unable to meet its
obligations. The FSCS funds compensation for customers by
raising management expenses levies and compensation levies
on the industry. In relation to protected deposits, each deposit-
taking institution contributes towards these levies in proportion to
their share of total protected deposits on 31 December of the
year preceding the scheme year (which runs from 1 April to 31
March), subject to annual maxima set by the Prudential
Regulation Authority. In addition, the FSCS has the power to
raise levies on a firm that has ceased to participate in the scheme
and is in the process of ceasing to be authorised for the costs
that it would have been liable to pay had the FSCS made a levy
in the financial year it ceased to be a participant in the scheme.
The FSCS has borrowed from HM Treasury to fund
compensation costs associated with the failure of Bradford &
Bingley, Heritable Bank, Kaupthing Singer & Friedlander,
Landsbanki ‘Icesave’ and London Scottish Bank plc. The industry
repaid the remaining balance on the non-Bradford and Bingley
loans during the period. The Bradford and Bingley loan is interest
bearing with the reference rate being the higher of 12 month
LIBOR plus 111 basis points or the relevant gilt rate for the
equivalent cost of borrowing from HMT. The FSCS and HM
Treasury have agreed that the period of these loans will reflect
the expected timetable for recoveries from the estate of Bradford
& Bingley. In addition, the FSCS levied an interim payment
relating to resolution costs for Dunfermline Building Society of
£325 million. The total capital element levied on the industry in
the 2015/16 scheme year was £353 million (£399 million in the
2014/15 scheme year).
RBS Group has accrued £41 million for its share of estimated
FSCS levies.
Litigation, investigations and reviews
The Royal Bank of Scotland Group plc (the company or RBSG
plc) and certain members of the Group are party to legal
proceedings and the subject of investigation and other regulatory
and governmental action (“Matters”) in the United Kingdom (UK),
the United States (US), the European Union (EU) and other
jurisdictions.
RBS recognises a provision for a liability in relation to these
Matters when it is probable that an outflow of economic benefits
will be required to settle an obligation resulting from past events,
and a reliable estimate can be made of the amount of the
obligation. While the outcome of these Matters is inherently
uncertain, the directors believe that, based on the information
available to them, appropriate provisions have been made in
respect of the Matters as at 31 December 2015 (see Note 20).
The aggregate provisions for regulatory and legal actions of £2.9
billion recognised during 2015 included provisions in respect of
mortgage backed securities litigation (£2.1 billion) and payment
protection insurance (£0.6 billion).
In many proceedings and investigations, it is not possible to
determine whether any loss is probable or to estimate reliably the
amount of any loss, either as a direct consequence of the
relevant proceedings and investigations or as a result of adverse
impacts or restrictions on RBS’s reputation, businesses and
operations. Numerous legal and factual issues may need to be
resolved, including through potentially lengthy discovery and
document production exercises and determination of important
factual matters, and by addressing novel or unsettled legal
questions relevant to the proceedings in question, before a
liability can reasonably be estimated for any claim. RBS cannot
predict if, how, or when such claims will be resolved or what the
eventual settlement, damages, fine, penalty or other relief, if any,
may be, particularly for claims that are at an early stage in their
development or where claimants seek substantial or
indeterminate damages.
In respect of certain matters described below, we have
established a provision and in certain of those matters, we have
indicated that we have established a provision.

Notes on the consolidated accounts
335
There are situations where RBS may pursue an approach that in
some instances leads to a settlement agreement. This may occur
in order to avoid the expense, management distraction or
reputational implications of continuing to contest liability, or in
order to take account of the risks inherent in defending claims or
investigations even for those matters for which RBS believes it
has credible defences and should prevail on the merits. The
uncertainties inherent in all such matters affect the amount and
timing of any potential outflows for both matters with respect to
which provisions have been established and other contingent
liabilities.
The future outflow of resources in respect of any matter may
ultimately prove to be substantially greater than or less than the
aggregate provision that RBS has recognised. Where (and as far
as) liability cannot be reasonably estimated, no provision has
been recognised.
Other than those discussed below, no member of the Group is or
has been involved in governmental, legal or regulatory
proceedings (including those which are pending or threatened)
that are expected to be material, individually or in aggregate.
RBS expects that in future periods additional provisions,
settlement amounts, and customer redress payments will be
necessary, in amounts that are expected to be substantial in
some instances.
Litigation
Shareholder litigation (UK)
Between March and July 2013, claims were issued in the High
Court of Justice of England and Wales by sets of current and
former shareholders, against RBS (and in one of those claims,
also against certain former individual officers and directors)
alleging that untrue and misleading statements and/or improper
omissions, in breach of the Financial Services and Markets Act
2000, were made in connection with the rights issue announced
by RBS on 22 April 2008. In July 2013 these and other similar
threatened claims were consolidated by the Court via a Group
Litigation Order. RBS’s defence to the claims was filed on 13
December 2013. Since then, further High Court claims have been
issued against RBS under the Group Litigation Order which is
now closed to further claimants. The aggregate value of the
shares subscribed for at 200 pence per share by the claimant
shareholders is approximately £4 billion although their damages
claims are not yet quantified.
The court timetable provides that a trial of the preliminary issue of
whether the rights issue prospectus contained untrue and
misleading statements and/or improper omissions will commence
in March 2017. In the event that the Court makes such a finding,
further trial(s) will be required to consider whether any such
statements and/or omissions caused loss and, if so, the quantum
of that loss.
Other securitisation and securities related litigation in the US
RBS companies have been named as defendants in their various
roles as issuer, depositor and/or underwriter in a number of
claims in the US that relate to the securitisation and securities
underwriting businesses. These cases include actions by
individual purchasers of securities and a purported class action
suit. Together, the pending individual and class action cases
(including those claims specifically described in this note) involve
the issuance of approximately US$43 billion of mortgage-backed
securities (MBS) issued primarily from 2005 to 2007.
In general, plaintiffs in these actions claim that certain disclosures
made in connection with the relevant offerings contained
materially false or misleading statements and/or omissions
regarding the underwriting standards pursuant to which the
mortgage loans underlying the securities were issued.
RBS companies remain as defendants in more than 20 lawsuits
brought by or on behalf of purchasers of MBS, including the
purported class action identified below.
In the event of an adverse judgment in any of these cases, the
amount of RBS’s liability will depend on numerous factors that
are relevant to the calculation of damages, which may include the
recognised loss of principal value in the securities at the time of
judgment (write-downs); the value of the remaining unpaid
principal balance of the securities at the time the case began, at
the time of judgment (if the plaintiff still owns the securities at the
time of judgment), or at the time when the plaintiff disposed of the
securities (if plaintiff sold the securities); and a calculation of pre
and post judgment interest that the plaintiff could be awarded,
which could be a material amount.
In September 2011, the US Federal Housing Finance Agency
(FHFA) as conservator for the Federal National Mortgage
Association (Fannie Mae) and the Federal Home Loan Mortgage
Corporation (Freddie Mac) filed MBS-related lawsuits against
RBS and a number of other financial institutions, all of which,
except for the two cases described below, have since settled for
amounts that were publicly disclosed.
The primary FHFA lawsuit against RBS remains pending in the
United States District Court for the District of Connecticut, and it
relates to approximately US$32 billion of MBS for which RBS
entities acted as sponsor/depositor and/or lead underwriter or co-
lead underwriter. Of these US$32 billion, approximately US$8.6
billion were outstanding at 31 December 2015 with cumulative
write downs to date on the securities of approximately US$1.1
billion (being the recognised loss of principal value suffered by
security holders). In September 2013, the Court denied the
defendants’ motion to dismiss FHFA’s amended complaint in this
case. This matter continues in the discovery phase.

Notes on the consolidated accounts
336
The other remaining FHFA lawsuit that involves RBS relates to
MBS issued by Nomura Holding America Inc. (Nomura) and
subsidiaries, and is now the subject of an appeal. On 11 May
2015, following a trial, the United States District Court for the
Southern District of New York issued a written decision in favour
of FHFA on its claims against Nomura and RBS Securities Inc.,
finding, as relevant to RBS, that the offering documents for four
Nomura-issued MBS for which RBS Securities Inc. served as an
underwriter, relating to US$1.4 billion in original principal balance,
contained materially misleading statements about the mortgage
loans that backed the securitisations, in violation of the Securities
Act and Virginia securities law.
RBS Securities Inc. estimates that its net exposure under the
Court’s judgment is approximately US$383 million, which
consists of the difference between the amount of the judgment
against RBS Securities Inc. (US$636 million) and the current
estimated market value of the four MBS that FHFA would return
to RBS Securities Inc. pursuant to the judgment, plus the costs
and attorney’s fees that will be due to FHFA if the judgment is
upheld.
The Court has stayed the judgment pending the result of the
appeal that the defendants are taking to the United States Court
of Appeals for the Second Circuit, though post-judgment interest
on the judgment amount will accrue while the appeal is pending.
RBS Securities Inc. intends to pursue a contractual claim for
indemnification against Nomura with respect to any losses it
suffers as a result of this matter.
The National Credit Union Administration Board (NCUA) is
litigating two MBS cases against RBS companies (on behalf of
US Central Federal Credit Union and Western Corporate Federal
Credit Union). The original principal balance of the MBS at issue
in these two NCUA cases is US$3.25 billion. In September 2015,
in a third case brought by NCUA (on behalf of Southwest
Corporate Federal Credit Union and Members United Corporate
Federal Credit Union), the NCUA accepted RBS’s offer of
judgment for US$129.6 million, plus attorney’s fees, to resolve
the matter, which concerned US$312 million in MBS. RBS has
paid to the plaintiff the agreed US$129.6 million plus attorney’s
fees.
Other remaining MBS lawsuits against RBS companies include,
among others, cases filed by the Federal Home Loan Banks of
Boston and Seattle. RBS has settled the MBS lawsuits filed by
the Federal Home Loan Bank of San Francisco and the
Commonwealth of Virginia on behalf of the Virginia Retirement
System for amounts that have now been provided for or paid to
the plaintiffs.
RBS companies are also defendants in a purported MBS class
action entitled New Jersey Carpenters Health Fund v. Novastar
Mortgage Inc. et al., which remains pending in the United States
District Court for the Southern District of New York. Another MBS
class action (Luther v. Countrywide Financial Corp. et al. and
related class action cases) was settled in 2013 without any
contribution from RBS, but several members of the settlement
class are appealing the court-approved settlement to the United
States Court of Appeals for the Ninth Circuit.
Certain other claims on behalf of public and private institutional
investors have been threatened against RBS in connection with
various mortgage-related offerings. RBS cannot predict whether
any of these threatened claims will be pursued, but expects that
several may.
RBS has £3.8 billion in cumulative provisions relating to the MBS
litigation described in this note, including £2.1 billion added in
2015. Additional settlement costs or provisions related to the
MBS litigation, as well as the investigations into MBS-related
conduct involving RBS set out under ‘Investigations and reviews’
on page 339 (for which no provisions have been made), may be
necessary in future periods for amounts that could be substantial
in some instances and in aggregate could be substantially in
excess of the £3.8 billion in existing provisions.
In many of the securitisation and securities related cases in the
US, RBS has or will have contractual claims to indemnification
from the issuers of the securities (where an RBS company is
underwriter) and/or the underlying mortgage originator (where an
RBS company is issuer). The amount and extent of any recovery
on an indemnification claim, however, is uncertain and subject to
a number of factors, including the ongoing creditworthiness of the
indemnifying party, a number of whom are or may be insolvent.
London Interbank Offered Rate (LIBOR)
Certain members of the Group have been named as defendants
in a number of class actions and individual claims filed in the US
with respect to the setting of LIBOR and certain other benchmark
interest rates. The complaints are substantially similar and allege
that certain members of the Group and other panel banks
individually and collectively violated various federal laws,
including the US commodities and antitrust laws, and state
statutory and common law, as well as contracts, by manipulating
LIBOR and prices of LIBOR-based derivatives in various markets
through various means.
Most of the USD LIBOR-related actions in which RBS companies
are defendants, including all purported class actions relating to
USD LIBOR, were transferred to a coordinated proceeding in the
United States District Court for the Southern District of New York.
Notes on the consolidated accounts
337
In the coordinated proceeding, consolidated class action
complaints were filed on behalf of (1) exchange-based purchaser
plaintiffs, (2) over-the-counter purchaser plaintiffs, and (3)
corporate debt purchaser plaintiffs. Over 35 other USD LIBOR-
related actions naming RBS as a defendant, including purported
class actions on behalf of lenders and mortgage borrowers, were
also made part of the coordinated proceeding.
In a series of orders issued in 2013 and 2014, the Court
overseeing the coordinated USD proceeding dismissed class
plaintiffs' antitrust claims and claims under RICO (Racketeer
Influenced and Corrupt Organizations Act), but declined to
dismiss (a) certain Commodity Exchange Act claims on behalf of
persons who transacted in Eurodollar futures contracts and
options on futures contracts on the Chicago Mercantile Exchange
(on the theory that defendants' alleged persistent suppression of
USD LIBOR caused loss to plaintiffs), and (b) certain contract
and unjust enrichment claims on behalf of over-the-counter
purchaser plaintiffs who transacted directly with a defendant.
Since then, the Court has issued additional orders broadly
addressing other potential grounds for dismissal of various of
plaintiffs’ claims, including dismissal for lack of personal
jurisdiction, and the Court is now in the process of applying these
rulings across the cases in the coordinated proceeding. The
Court’s dismissal of plaintiffs’ antitrust claims is currently on
appeal to the United States Court of Appeals for the Second
Circuit.
Certain members of the Group have also been named as
defendants in class actions relating to (i) JPY LIBOR and
Euroyen TIBOR, (ii) Euribor, (iii) Swiss Franc LIBOR, and (iv)
Pound sterling LIBOR, all of which are pending before other
judges in the United States District Court for the Southern District
of New York. On 28 March 2014, the Court in the action relating
to Euroyen TIBOR futures contracts dismissed the plaintiffs’
antitrust claims, but declined to dismiss their claims under the
Commodity Exchange Act for price manipulation.
Details of LIBOR investigations involving RBS are set out under
‘Investigations and reviews’ on page 339.
ISDAFIX antitrust litigation
Beginning in September 2014, RBS plc and a number of other
financial institutions were named as defendants in several
purported class action complaints (now consolidated into one
complaint) pending in the United States District Court for the
Southern District of New York) alleging manipulation of USD
ISDAFIX rates. RBS has reached an agreement to settle this
matter, subject to final settlement documentation and court
approval. The settlement amount is covered by an existing
provision.
Credit default swap antitrust litigation
Certain members of the Group, as well as a number of other
financial institutions, are defendants in a consolidated antitrust
class action pending in the United States District Court for the
Southern District of New York alleging an unlawful restraint of
trade in the market for credit default swaps. The RBS defendants
have reached an agreement to settle this matter for US$33
million, and that settlement received preliminary approval from
the Court on 29 October 2015. The settlement amount has been
paid into escrow pending final court approval of the settlement.
FX antitrust litigation
Group companies have settled all claims that are or could be
asserted on behalf of the classes in a consolidated action
alleging an antitrust conspiracy in relation to foreign exchange
transactions, which is pending in the United States District Court
for the Southern District of New York. Following the Court’s
preliminary approval of the settlement on 15 December 2015,
RBS paid the total settlement amount (US$255 million) into
escrow pending final court approval of the settlement. Other class
action complaints, including a complaint asserting Employee
Retirement Income Security Act claims on behalf of employee
benefit plans that engaged in FX transactions, are pending in the
same court and name certain members of the Group as
defendants.
In September 2015, certain members of the Group, as well as a
number of other financial institutions, were named as defendants
in two purported class actions filed in Ontario and Quebec on
behalf of persons in Canada who entered into foreign exchange
transactions or who invested in funds that entered into foreign
exchange transactions. The plaintiffs allege that the defendants
violated the Canadian Competition Act by conspiring to
manipulate the prices of currency trades.
Certain other foreign exchange transaction related claims have
been or may be threatened against RBS in other jurisdictions.
RBS cannot predict whether any of these claims will be pursued,
but expects that several may.
US Treasury securities antitrust litigation
Beginning in July 2015, numerous class action antitrust
complaints were filed in US federal courts against a number of
primary dealers of US Treasury securities, including RBS
Securities Inc. The complaints allege that the defendants rigged
the US Treasury securities auction bidding process to deflate
prices at which they bought such securities and colluded to
increase the prices at which they sold such securities to plaintiffs.
The complaints assert claims under the US antitrust laws and the
Commodity Exchange Act on behalf of persons who transacted in
US Treasury securities or derivatives based on such instruments,
including futures and options. On 8 December 2015, all pending
matters were transferred to the United States District Court for
the Southern District of New York for coordinated or consolidated
pretrial proceedings.
Notes on the consolidated accounts
338
Interest rate swaps antitrust litigation
On 25 November 2015, RBS plc and other members of the
Group, as well as a number of other interest rate swap dealers,
were named as defendants in a class action antitrust complaint
filed in the United States District Court for the Southern District of
New York. A similar complaint was filed in the United States
District Court for the Northern District of Illinois on 18 February
2016. The complaints allege that the defendants violated the US
antitrust laws by restraining competition in the market for interest
rate swaps through various means and thereby caused inflated
bid-ask spreads for interest rate swaps, to the alleged detriment
of the plaintiff class. RBS anticipates moving to dismiss the
claims asserted in these matters.
Madoff
In December 2010, Irving Picard, as trustee for the bankruptcy
estates of Bernard L. Madoff and Bernard L. Madoff Investment
Securities LLC., filed a clawback claim against The Royal Bank of
Scotland N.V. (RBS N.V.) in the New York bankruptcy court. In
the operative complaint, filed in August 2012, the trustee seeks to
recover US$75.8 million in redemptions that RBS N.V. allegedly
received from certain Madoff feeder funds and US$162.1 million
that RBS N.V. allegedly received from its swap counterparties at
a time when RBS N.V. allegedly ‘knew or should have known of
Madoff’s possible fraud’. The Trustee alleges that those transfers
were preferences or fraudulent conveyances under the US
bankruptcy code and New York law and he asserts the purported
right to claw them back for the benefit of Madoff’s estate. A
further claim, for US$21.8 million, was filed in October 2011. This
matter is subject to pre-discovery motions to dismiss the claims
against RBS N.V..
Thornburg adversary proceeding
RBS Securities Inc. and certain other RBS companies, as well
as several other financial institutions, are defendants in an
adversary proceeding filed in the US bankruptcy court in
Maryland by the trustee for TMST, Inc. (formerly known as
Thornburg Mortgage, Inc.). The trustee seeks recovery of
transfers made under certain restructuring agreements as,
among other things, avoidable fraudulent and preferential
conveyances and transfers. On 25 September 2014, the Court
largely denied the defendants' motion to dismiss this matter and,
as a result, discovery is ongoing.
CPDO Litigation
CPDO claims have been served on RBS N.V. in England, the
Netherlands and Australia, and on RBS in England, relating to
the sale of a type of structured financial product known as a
constant proportion debt obligation (CPDO). The claims in the
Netherlands have been stayed pending the outcome of the
claims in England. In November 2012, the Federal Court of
Australia issued a judgment against RBS N.V. and others in one
such case holding that RBS N.V. and others committed certain
wrongful acts in connection with the rating and sale of the CPDO.
In March 2013, RBS N.V. was ordered to pay A$19.7 million.
Following an unsuccessful appeal, RBS N.V. made the required
payments totalling A$19.7 million in March and April 2013. The
judgment may potentially have significance to the other claims
served and to any future similar claims.
Interest rate hedging products litigation
RBS is dealing with a large number of active litigation claims in
relation to the sale of interest rate hedging products (IRHPs). In
general claimants allege that the relevant interest rate hedging
products were mis-sold to them, with some also alleging RBS
made misrepresentations in relation to LIBOR. Claims have been
brought by customers who were considered under the UK
Financial Conduct Authority (FCA) redress programme, as well
as customers who were outside of the scope of that programme,
which was closed to new entrants on 31 March 2015. RBS
encouraged those customers that were eligible to seek redress
under the FCA redress programme to participate in that
programme. RBS remains exposed to potential claims from
customers who were either ineligible to be considered for redress
or who are dissatisfied with their redress offers.
In addition to claims alleging that IRHPs were mis-sold, RBS has
received a number of claims involving allegations that it breached
a legal duty of care in its conduct of the FCA redress programme.
These claims have been brought by customers who are
dissatisfied with redress offers made to them through the FCA
redress programme. The claims followed a preliminary decision
against another UK bank. RBS has since been successful in
opposing an application by a customer to amend its pleadings to
include similar claims against RBS, on the basis that the bank
does not owe a legal duty of care to customers in carrying out the
FCA review. The customer has sought permission to appeal and
this is being considered by the Mercantile Court. If the Mercantile
Court does not allow this, the customer will need to formally apply
for leave to appeal in the Court of Appeal.
Weiss v. National Westminster Bank Plc
NatWest is defending a lawsuit filed by a number of US nationals
(or their estates, survivors, or heirs) who were victims of terrorist
attacks in Israel. The plaintiffs allege that NatWest is liable for
damages arising from those attacks pursuant to the US Anti-
terrorism Act because NatWest previously maintained bank
accounts and transferred funds for the Palestine Relief &
Development Fund, an organisation which plaintiffs allege
solicited funds for Hamas, the alleged perpetrator of the attacks.
On 28 March 2013, the trial court (the United States District Court
for the Eastern District of New York) granted summary judgment
in favour of NatWest on the issue of scienter, but on 22
September 2014, that summary judgment ruling was vacated by
the United States Court of Appeals for the Second Circuit. The
appeals court returned the case to the trial court for consideration
of NatWest's other asserted grounds for summary judgment and,
if necessary, for trial.
Notes on the consolidated accounts
339
Freeman v. HSBC Holdings PLC and others
On 10 November 2014, RBS N.V. and certain other financial
institutions (HSBC, Barclays, Standard Chartered, Credit Suisse,
and Bank Saderat) were named as defendants in a complaint
filed by a number of US nationals (or their estates, survivors, or
heirs), most of whom are or were US military personnel, who
were killed or injured in more than 70 attacks in Iraq between
2004 and 2011. The attacks were allegedly perpetrated by
Hezbollah and certain Iraqi terror cells allegedly funded by the
Islamic Republic of Iran. According to the plaintiffs’ allegations,
RBS N.V. and the other defendants are liable for damages
arising from the attacks because they allegedly conspired with
Iran and certain Iranian banks to assist Iran in transferring money
to Hezbollah and the Iraqi terror cells, in violation of the US Anti-
terrorism Act, by agreeing to engage in "stripping" of transactions
initiated by the Iranian banks so that the Iranian nexus to the
transactions would not be detected. On 2 April 2015, the plaintiffs
filed an amended complaint adding Commerzbank as an
additional defendant. On 29 May 2015, the defendants filed a
motion to dismiss the amended complaint in this matter.
Investigations and reviews
RBS’s businesses and financial condition can be affected by the
actions of various governmental and regulatory authorities in the
UK, the US, the EU and elsewhere. RBS has engaged, and will
continue to engage, in discussions with relevant governmental
and regulatory authorities, including in the UK, the US, the EU
and elsewhere, on an ongoing and regular basis, and in response
to informal and formal inquiries or investigations, regarding
operational, systems and control evaluations and issues including
those related to compliance with applicable laws and regulations,
including consumer protection, business conduct,
competition/anti-trust, anti-bribery, anti-money laundering and
sanctions regimes. The Corporate & Institutional Banking (CIB)
segment in particular has been providing information regarding a
variety of matters, including, for example, the setting of
benchmark rates and related derivatives trading, conduct in the
foreign exchange market, and various issues relating to the
issuance, underwriting, and sales and trading of fixed-income
securities, including structured products and government
securities. Any matters discussed or identified during such
discussions and inquiries may result in, among other things,
further inquiry or investigation, other action being taken by
governmental and regulatory authorities, increased costs being
incurred by RBS, remediation of systems and controls, public or
private censure, restriction of RBS’s business activities and/or
fines. Any of the events or circumstances mentioned in this
paragraph or below could have a material adverse effect on RBS,
its business, authorisations and licences, reputation, results of
operations or the price of securities issued by it.
RBS is co-operating fully with the investigations and reviews
described below.
Loan securitisation business investigations
In the US, RBS is involved in reviews, investigations and
proceedings (both formal and informal) by federal and state
governmental law enforcement and other agencies and self-
regulatory organisations, including the DOJ and various other
members of the RMBS Working Group of the Financial Fraud
Enforcement Task Force (including several state attorneys
general), relating to, among other things, issuance, underwriting
and trading in mortgage-backed securities, collateralised debt
obligations (CDOs), collateralised loan obligations (CLOs) and
synthetic products.
In connection with these inquiries, Group companies have
received requests for information and subpoenas seeking
information about, among other things, the structuring of CDOs,
financing to loan originators, purchase of whole loans,
sponsorship and underwriting of securitisations, due diligence,
representations and warranties, communications with ratings
agencies, disclosure to investors, document deficiencies, trading
activities and practices and repurchase requests.
These ongoing matters include, among others, active
investigations by the civil and criminal divisions of the DOJ and
the office of the attorney general of Connecticut, on behalf of the
Connecticut Department of Banking, relating primarily to due
diligence on and disclosure related to loans purchased for, or
otherwise included in, securitisations and related disclosures. On
31 August 2015, the Connecticut Department of Banking issued
two letters to RBS Securities Inc., indicating that it is has
concluded that RBS Securities Inc. may have violated the
Connecticut Uniform Securities Act when underwriting MBS,
noting RBS plc’s May 2015 FX-related guilty plea, and offering an
opportunity for RBS Securities Inc. to demonstrate its compliance
with the law and why administrative proceedings seeking fines
and other remedies should not be commenced. RBS Securities
Inc. submitted responses to these letters in October 2015, and
related discussions are ongoing.
The investigations also include civil and criminal investigations
relating to alleged misrepresentations in the trading of various
forms of asset-backed securities, including residential mortgage-
backed securities, commercial mortgage-backed securities,
CDOs, and CLOs. In March and December 2015, two former
RBS Securities Inc. traders entered guilty pleas in the United
States District Court for the District of Connecticut, each to one
count of conspiracy to commit securities fraud while employed at
RBS Securities Inc.
In 2007, the New York State Attorney General issued subpoenas
to a wide array of participants in the securitisation and securities
industry, focusing on the information underwriters obtained from
the independent firms hired to perform due diligence on
mortgages. RBS completed its production of documents
requested by the New York State Attorney General in 2008,
principally producing documents related to loans that were
pooled into one securitisation transaction.
Notes on the consolidated accounts
340
In May 2011, the New York State Attorney General requested
additional information about RBS’s mortgage securitisation
business and, following the formation of the RMBS Working
Group, has focused on the same or similar issues as the other
state and federal MBS Working Group investigations described
above. The investigation is ongoing and RBS continues to
respond to requests for information.
At this stage, as there remains considerable uncertainty around
the outcome of MBS-related regulatory and governmental
investigations it is not practicable reliably to estimate the
aggregate potential impact on RBS which is expected to be
material.
US mortgages - loan repurchase matters
RBS’s CIB business in North America has been a purchaser of
non-agency US residential mortgages in the secondary market,
and an issuer and underwriter of non-agency residential
mortgage-backed securities (MBS). CIB did not originate or
service any US residential mortgages and it was not a significant
seller of mortgage loans to government sponsored enterprises
(GSEs) (e.g. the Federal National Mortgage Association and the
Federal Home Loan Mortgage Association).
In issuing MBS, CIB generally assigned certain representations
and warranties regarding the characteristics of the underlying
loans made by the originator of the residential mortgages;
however, in some circumstances, CIB made such
representations and warranties itself. Where CIB has given those
or other representations and warranties (whether relating to
underlying loans or otherwise), CIB may be contractually required
to repurchase such loans or indemnify certain parties against
losses for certain breaches of such representations and
warranties.
In certain instances where it is required to repurchase loans or
related securities, CIB may be able to assert claims against third
parties who provided representations or warranties to CIB when
selling loans to it, although the ability to recover against such
parties is uncertain. Between the start of 2009 and 31 December
2015, CIB received approximately US$753 million in repurchase
demands in respect of loans made primarily from 2005 to 2008
and related securities sold where obligations in respect of
contractual representations or warranties were undertaken by
CIB. However, repurchase demands presented to CIB are
subject to challenge and rebuttal by CIB.
At this stage, as there remains considerable uncertainty around
the outcome of loan repurchase related claims it is not
practicable reliably to estimate the aggregate potential impact, if
any, on RBS which may be material.
LIBOR and other trading rates
In February 2013, RBS announced settlements with the Financial
Services Authority (FSA) in the UK, the United States Commodity
Futures Trading Commission (CFTC) and the United States
Department of Justice (DOJ) in relation to investigations into
submissions, communications and procedures around the setting
of LIBOR. RBS agreed to pay penalties of £87.5 million, US$325
million and US$150 million to these authorities respectively to
resolve the investigations and also agreed to certain
undertakings in its settlement with the CFTC. As part of the
agreement with the DOJ, RBS plc entered into a Deferred
Prosecution Agreement (DPA) in relation to one count of wire
fraud relating to Swiss Franc LIBOR and one count for an
antitrust violation relating to Yen LIBOR. The DPA expired in April
2015 and is of no further effect.
In April 2013, RBS Securities Japan Limited entered a plea of
guilty to one count of wire fraud relating to Yen LIBOR and in
January 2014, the US District Court for the District of Connecticut
entered a final judgment in relation to the conviction of RBS
Securities Japan Limited pursuant to the plea agreement.
In February 2014, RBS paid settlement penalties of
approximately €260 million and €131 million to resolve
investigations by the European Commission (EC) into Yen LIBOR
competition infringements and EURIBOR competition
infringements respectively. This matter is now concluded.
In July 2014, RBS entered into an Enforceable Undertaking with
the Australian Securities and Investments Commission (ASIC) in
relation to potential misconduct involving the Australian Bank Bill
Swap Rate. RBS made various undertakings and agreed to make
a voluntary contribution of A$1.6 million to fund independent
financial literacy projects in Australia.
In October 2014, the EC announced its findings that (1) RBS and
one other financial institution had participated in a bilateral cartel
aimed at influencing the Swiss Franc LIBOR benchmark interest
rate between March 2008 and July 2009; and (2) RBS and three
other financial institutions had participated in a related cartel on
bid-ask spreads of Swiss Franc interest rate derivatives in the
European Economic Area (EEA). RBS received full immunity
from fines.
RBS is co-operating with investigations and new and ongoing
requests for information by various other governmental and
regulatory authorities, including in the UK, US and Asia, into its
submissions, communications and procedures relating to a
number of trading rates, including LIBOR and other interest rate
settings, and non-deliverable forwards.
Notes on the consolidated accounts
341
RBS is providing information and documents to the CFTC as part
of its investigation into the setting of USD, EUR and GBP
ISDAFIX and related trading activities. RBS understands that the
CFTC investigation is at an advanced stage. RBS is also under
investigation by competition authorities in a number of
jurisdictions stemming from the actions of certain individuals in
the setting of LIBOR and other trading rates, as well as interest
rate-related trading. At this stage, as there remains considerable
uncertainty around the outcome of these investigations, it is not
practicable to estimate the aggregate impact reliably, if any, on
RBS which may be material.
Foreign exchange related investigations
In November 2014, RBS plc reached a settlement with the FCA
and the CFTC in relation to investigations into failings in RBSG
plc’s FX businesses within its Corporate & Institutional Banking
(CIB) segment. RBS plc agreed to pay penalties of £217 million
to the FCA and US$290 million to the CFTC to resolve the
investigations. The fines were paid on 19 November 2014.
On 20 May 2015, RBS plc announced that it had reached
settlements with the DOJ and the Board of Governors of the
Federal Reserve System (Federal Reserve) in relation to
investigations into its FX business within its CIB segment. RBS
plc paid a penalty of US$274 million to the Federal Reserve and
has agreed to pay a penalty of US$395 million to the DOJ to
resolve the investigations. The DOJ fine is fully covered by
existing provisions.
As part of its plea agreement with the DOJ, RBS plc pled guilty in
the United States District Court for the District of Connecticut to a
one-count information charging an antitrust conspiracy. RBS plc
admitted that it knowingly, through one of its euro/US dollar
currency traders, joined and participated in a conspiracy to
eliminate competition in the purchase and sale of the euro/US
dollar currency pair exchanged in the FX spot market.
The charged conspiracy occurred between as early as December
2007 to at least April 2010. Pursuant to the plea agreement
(which is publicly available), the DOJ and RBS plc have agreed
jointly to recommend to the Court that it impose a sentence
consisting of a US$395 million criminal fine and a term of
probation, which among other things, would prohibit RBS plc from
committing another crime in violation of US law or engaging in
the FX trading practices that form the basis for the charged crime
and require RBS plc to implement a compliance program
designed to prevent and detect the unlawful conduct at issue and
to strengthen its compliance and internal controls as required by
other regulators (including the FCA and the CFTC). If RBS plc is
sentenced to a term of probation, a violation of the terms of
probation could lead to the imposition of additional penalties.
RBS plc and RBS Securities Inc. have also entered into a cease
and desist order with the Federal Reserve relating to FX and
other designated market activities (the FX Order). In the FX
Order, which is publicly available and will remain in effect until
terminated by the Federal Reserve, RBS plc and RBS Securities
Inc. agreed to take certain remedial actions with respect to FX
activities and certain other designated market activities, including
the creation of an enhanced written internal controls and
compliance program, an improved compliance risk management
program, and an enhanced internal audit program. RBS plc and
RBS Securities Inc. are obligated to implement and comply with
these programs after they are approved by the Federal Reserve,
and are also required to conduct, on an annual basis, a review of
applicable compliance policies and procedures and a risk-
focused sampling of key controls.
RBS is responding to investigations and inquiries from other
governmental and regulatory (including competition) authorities
on similar issues relating to failings in its FX business within its
CIB segment, including with respect to potential collateral
consequences of the RBS plc guilty plea described above. The
timing and amount of financial penalties with respect to any
further settlements and related litigation risks and collateral
consequences remain uncertain and could be material.
On 21 July 2014, the Serious Fraud Office in the UK announced
that it was launching a criminal investigation into allegations of
fraudulent conduct in the foreign exchange market, apparently
involving multiple financial institutions. At this stage, as there
remains considerable uncertainty around the outcome of this
investigation it is not practicable reliably to estimate the
aggregate impact, if any, on RBS which may be material.
Interest rate hedging products (IRHP) redress programme
In June 2012, following an industry wide review, the FSA
announced that RBS and other UK banks had agreed to a
redress exercise and past business review in relation to the sale
of interest rate hedging products to some small and medium
sized businesses classified as retail clients or private customers
under FSA rules.
In January 2013 the FSA issued a report outlining the principles
to which it wished RBS and other UK banks to adhere in
conducting the review and redress exercise. This exercise is
being scrutinised by an independent reviewer, KPMG (appointed
as a Skilled Person under section 166 of the Financial Services
and Markets Act), who is reviewing and approving all outcomes,
and the FCA is overseeing this. RBS has reached agreement
with KPMG in relation to redress determinations for all in scope
customers. The review and redress exercise was closed to new
entrants on 31 March 2015. RBS and KPMG are now focussing
on securing a few remaining acceptances of redress offers and
assessing consequential loss claims. In October 2015, RBS
agreed with the FCA that its review was nearing completion, and
on 31 October 2015 all customers who had received final redress
offers but had not yet responded were informed that the final date
for acceptance of those offers is 31 January 2016.
Notes on the consolidated accounts
342
Customers who have not yet received a final redress
determination will be given three months to accept any redress
offer before that offer lapses. As at the end of January 2016, 94%
of all review files had been closed.
The Central Bank of Ireland also requested Ulster Bank Ireland
Limited (UBIL), along with a number of Irish banks, to undertake
a similar exercise and past business review in relation to the sale
of IRHP to retail designated small and medium sized businesses
in the Republic of Ireland. RBS also agreed to undertake a similar
exercise and past business review in respect of relevant
customers of RBS International. The reviews undertaken in
respect of both RBS International customers and UBIL customers
are complete.
RBS provisions in relation to the above redress exercises total
£1.5 billion to date for these matters, of which £1.4 billion had
been utilised at 31 December 2015.
Judicial Review of Skilled Person’s role in IRHP review
RBS has been named as an interested party in a number of
claims for judicial review of KPMG’s decisions as Skilled Person
in RBS’s previously disclosed IRHP redress programme. This
follows a similar claim from a customer of another UK bank, also
against KPMG.
All of these claims have been stayed pending the outcome of the
other bank’s case, in which the customer has already received
permission to proceed. That case, which went to trial on 25
January 2016, will decide whether a section 166-appointed
Skilled Person is susceptible to judicial review. If so, the
additional claims which seek to set aside the decisions of KPMG
as Skilled Person on RBS's IRHP redress programme may then
proceed to full hearing to assess the fairness of KPMG’s role in
the redress programme in those particular cases. If deemed
unfair, this could have a consequential impact on the
reasonableness of the methodology applied to reviewed and
settled IRHP files generally.
As there remains considerable uncertainty and the judicial review
is at an early stage, it is not practicable reliably to estimate the
impact of such matters, if any, on RBS which may be material.
FSA mystery shopping review
In February 2013, the FSA announced the results of a mystery
shopping review it undertook into the investment advice offered
by banks and building societies to retail clients. As a result of that
review the FSA announced that firms involved were cooperative
and agreed to take immediate action. RBS was one of the firms
involved.
The action required included a review of the training provided to
advisers, considering whether changes are necessary to both
advice processes and controls for new business, and undertaking
a past business review to identify any historic poor advice (and
where breaches of regulatory requirements are identified, to put
this right for customers).
Subsequent to the FSA announcing the results of its mystery
shopping review, the FCA has required RBS to carry out a past
business review and customer contact exercise on a sample of
historic customers that received investment advice on certain
lump sum products through the UK Financial Planning channel of
the Personal & Business Banking (PBB) segment of RBS, which
includes RBS plc and NatWest, during the period from March
2012 until December 2012.
This review was conducted under section 166 of the Financial
Services and Markets Act, under which a Skilled Person was
appointed to carry out the exercise. Redress has been
paid/offered to certain customers in this sample group. Following
discussions with the FCA after issue of the draft section 166
report, RBS agreed with the FCA that it would carry out a wider
review/remediation exercise relating to certain investment,
insurance and pension sales from 1 January 2011 to present.
RBS will be writing to the relevant customers during 2016. In
addition, RBS agreed with the FCA that it would carry out a
remediation exercise, for a specific customer segment who were
sold a particular structured product, in response to concerns
raised by the FCA with regard to (a) the target market for the
product and (b) how the product may have been described to
customers by certain advisers. Redress has been paid/offered to
certain customers who took out the structured product.
RBS provisions in relation to investment advice total £249 million
to date for these matters, of which £73 million had been utilised
at 31 December 2015.
Card Protection Plan Limited
In August 2013, the FCA announced that Card Protection Plan
Limited and 13 banks and credit card issuers, including RBS, had
agreed to a compensation scheme in relation to the sale of card
and/or identity protection insurance to certain retail customers.
The closing date before which any claims under the
compensation scheme must have been submitted has now
passed. All compensation payments have now been made and
all claims, whether through the courts or the Financial
Ombudsman Service, are now barred. The compensation
payments were covered by existing provisions.
Packaged accounts
As a result of an uplift in packaged current account complaints,
RBS proactively put in place dedicated resources in 2013 to
investigate and resolve complaints on an individual basis. RBS
has made provisions totalling £307 million to date for this matter.
FCA review of RBS’s treatment of SMEs
In November 2013, a report by Lawrence Tomlinson,
entrepreneur in residence at the UK Government’s Department
for Business Innovation and Skills, was published (“Tomlinson
Report”). The Tomlinson Report was critical of RBS’s treatment
of SMEs.

Notes on the consolidated accounts
343
The Tomlinson Report was passed to the PRA and FCA. Shortly
thereafter, the FCA announced that an independent Skilled
Person would be appointed under section 166 of the Financial
Services and Markets Act to review the allegations in the
Tomlinson Report. On 17 January 2014, a Skilled Person was
appointed. The Skilled Person’s review is focused on RBS’s UK
small and medium sized business customers with credit
exposures of up to £20 million whose relationship was managed
within RBS’s Global Restructuring Group or within similar units
within RBS’s Corporate Banking Division that were focused on
customers in financial difficulties. In the period 2008 to 2013 RBS
was one of the leading providers of credit to the UK SME sector.
Separately, in November 2013, RBS instructed the law firm
Clifford Chance to conduct an independent review of the principal
allegation made in the Tomlinson Report: RBS was alleged to be
culpable of systematic and institutional behaviour in artificially
distressing otherwise viable businesses and through that putting
businesses into insolvency. Clifford Chance published its report
on 17 April 2014 and, while they made certain recommendations
to enhance customer experience and transparency of pricing,
they concluded that there was no evidence to support the
principal allegation.
A separate independent review of the principal allegation, led by
Mason Hayes & Curran, Solicitors, was conducted in the
Republic of Ireland. The report was published in December 2014
and found no evidence to support the principal allegation.
RBS is fully cooperating with the FCA in its review.
The Skilled Person review focuses on the allegations made in the
Tomlinson Report and certain observations made by Sir Andrew
Large in his 2013 Independent Lending Review, and is broader in
scope than the reviews undertaken by Clifford Chance and
Mason, Hayes & Curran which are referred to above. The Skilled
Person is expected to deliver the initial findings from its review to
RBS and the FCA during the first half of 2016 but no final
timescale has been determined. RBS will have an opportunity to
respond to any such review findings before the Skilled Person
delivers its final report. In the event that the Skilled Person’s
review concludes that there were material failings in RBS’s
treatment of SME customers those conclusions could, depending
on their nature, scale and type, result in the commencement of
regulatory enforcement action by the FCA, the imposition of
redress requirements and the commencement of litigation claims
against RBS, as well as potentially wider investigations and
litigation related to RBS’s treatment of customers in financial
difficulty. At this stage, as there remains considerable uncertainty
around the final conclusions of the Skilled Person’s review and
any collateral consequences thereof, it is not practicable reliably
to estimate the potential impact on RBS.
Multilateral interchange fees
On 11 September 2014, the Court of Justice upheld earlier
decisions by the EU Commission and the General Court that
MasterCard’s multilateral interchange fee (MIF) arrangements for
cross border payment card transactions with MasterCard and
Maestro branded consumer credit and debit cards in the EEA are
in breach of competition law.
In April 2013, the EC announced it was opening a new
investigation into interchange fees payable in respect of
payments made in the EEA by MasterCard cardholders from non-
EEA countries.
In May 2013, the EC announced it had reached an agreement
with Visa regarding immediate cross border credit card MIF rates.
This agreement has now been market tested and was made
legally binding on 26 February 2014. The agreement is to last for
four years.
In addition, on 8 June 2015, a regulation on interchange fees for
card payments entered into force. The regulation requires the
capping of both cross-border and domestic MIF rates for debit
and credit consumer cards. The regulation also sets out other
reforms including to the Honour All Cards Rule which require
merchants to accept all cards with the same level of MIF but not
cards with different MIF levels.
In the UK, the Office of Fair Trading (OFT) had previously
opened investigations into domestic interchange fees applicable
in respect of Visa and MasterCard consumer and commercial
credit and debit card transactions. On 6 May 2015, the successor
body to the OFT, the Competition & Markets Authority (CMA),
announced that it had closed these investigations on the grounds
of administrative priorities.
There remains uncertainty around the outcomes of the ongoing
EC investigation, and regulation, but they may have a material
adverse effect on the structure and operation of four party card
payment schemes in general and, therefore, on RBS’s business
in this sector.
Payment Protection Insurance (PPI)
Since 2011, RBS has been implementing a policy statement
agreed with the FCA for the handling of complaints about the
mis-selling of PPI. RBS is also monitoring developments
following the UK Supreme Court’s decision in the case of Plevin v
Paragon Personal Finance Ltd in November 2014. That decision
was that the sale of a single premium PPI policy could create an
‘unfair relationship’ under s.140A of the Consumer Credit Act
1974 (the ‘Consumer Credit Act’) because the premium
contained a particularly high level of undisclosed commission.
Notes on the consolidated accounts
344
The Financial Ombudsman Service (FOS) has confirmed on its
website that unfair relationship provisions in the Consumer Credit
Act and the Plevin judgment are ’potentially relevant
considerations’ in some of the PPI complaints referred to FOS.
On 27 May 2015, the FCA announced that it was considering
whether additional rules and/or guidance are required to deal with
the impact of the Plevin decision on complaints about PPI
generally.
On 26 November 2015, the FCA issued Consultation Paper
15/39, in which it sets out proposed rules and guidance for how
firms should handle PPI complaints fairly in light of the Plevin
decision and how the FOS should consider relevant PPI
complaints. The Consultation Paper also contains proposals for
the introduction in 2018 on a date to be confirmed of a deadline
for submission of PPI complaints. The deadline for submitting a
response to the Consultation Paper is 26 February 2016. RBS
intends to respond.
The proposals in the Consultation Paper include an FCA-led
communications campaign to raise awareness of the deadline
and to prompt those who intend to complain to act ahead of the
deadline. If the proposals are agreed and implemented, RBS
expects higher claims volumes, persisting longer than previously
modelled, and additional compensation payments in relation to
PPI claims made as a result of the Plevin judgment.
Complaints made after the proposed 2018 deadline would lose
the right to be assessed by firms or by the Financial Ombudsman
Service, bringing an end to new PPI cases in 2018.
PPI complaint volumes during Q4 2015 were in line with previous
trends. Actual payments made to settle PPI claims during Q4
covered the four month period from 1 September until 31
December 2015. This is in contrast to payments made during Q3,
which covered the period from 1 June until 31 August 2015. This
change was due to enhanced operating processes introduced in
Q4 2015.
RBS has made provisions totalling £4.3 billion to date for PPI
claims, including £0.6 billion for 2015, of which £3.3 billion had
been utilised by 31 December.
UK retail banking
In March 2014, the CMA announced that it would be undertaking
an update of the OFT’s 2013 personal current account (PCA)
market study, in parallel with its market study into small and
medium-sized enterprise (SME) banking which was announced in
June 2013. In July 2014 the CMA published its preliminary
findings in respect of both the PCA and SME market studies. The
CMA provisionally decided to make a market investigation
reference (MIR) into retail banking which would cover PCA and
SME banking. On 6 November 2014, the CMA made its final
decision to proceed with a MIR. On 22 October 2015 the CMA
published a summary of its provisional findings and notice of
possible remedies.
The CMA has provisionally concluded there are a number of
competition concerns in the provision of PCAs, business current
accounts and SME lending, particularly around low levels of
customers searching and switching, resulting in banks not being
put under enough competitive pressure, and new products and
new banks not attracting customers quickly enough.
The notice of possible remedies sets out measures to address
these concerns, including measures to make it easier for
customers to compare products, and requiring banks to help
raise public awareness of, and confidence in, switching bank
accounts. On 29 January 2016, the CMA announced that it
expects to extend the timetable for the MIR (by up to 6 months)
and it will decide on the length of this extension by early March
2016. The CMA also intends to announce in early March 2016
when the provisional decision on remedies will be published.
Alongside the MIR, the CMA is also reviewing the undertakings
given by certain banks following the Competition Commission’s
2002 investigation into SME banking as well as the 2008
Northern Ireland PCA Banking Market Investigation Order 2008.
At this stage as there remains uncertainty around the final
outcome of these reviews it is not practicable reliably to estimate
the potential impact on RBS, which may be material.
FCA Wholesale Sector Competition Review
On 9 July 2014, the FCA launched a review of competition in the
wholesale sector to identify any areas which may merit further
investigation through an in-depth market study.
The initial review was an exploratory exercise and focused
primarily on competition in wholesale securities and investment
markets, and related activities such as corporate banking. It
commenced with a three month consultation exercise, including a
call for inputs from stakeholders. Following this consultation
period, the FCA published its feedback statement on 19 February
2015 which announced that the FCA is to undertake a market
study into investment and corporate banking and potentially into
asset management. The terms of reference for the investment
and corporate banking market study were published on 22 May
2015. The FCA is intending to publish an interim report in March
2016. At this stage, as there remains considerable uncertainty
around the outcome of these reviews it is not practicable reliably
to estimate the aggregate impact, if any, on RBS which may be
material.
On 18 November 2015, the FCA also announced that a market
study would be undertaken into asset management. The FCA
intends to publish an interim report in Summer 2016 with the final
report expected in early 2017.
At this stage, as there remains considerable uncertainty around
the outcome of these reviews it is not practicable reliably to
estimate the aggregate impact, if any, on RBS which may be
material.
Notes on the consolidated accounts
345
Credit default swaps (CDS) investigation
In April 2011 the EC opened an antitrust investigation into the
CDS information market to which RBS was a party. In general
terms, the EC raised concerns that a number of banks, Markit
and ISDA may have jointly prevented exchanges from entering
the CDS market. On 4 December 2015 the EC decided to close
the case against RBS and the other bank parties to the
investigation. Markit and ISDA remain party to the investigation.
Governance and risk management consent order
In July 2011, RBS agreed with the Board of Governors of the
Federal Reserve System, the New York State Banking
Department, the Connecticut Department of Banking, and the
Illinois Department of Financial and Professional Regulation to
enter into a consent Cease and Desist Order (Governance Order)
(which is publicly available) to address deficiencies related to
governance, risk management and compliance systems and
controls in the US branches of RBS plc and RBS N.V. branches
(the US Branches).
In the Governance Order, RBS agreed to create the following
written plans or programmes:
• a plan to strengthen board and senior management
oversight of the corporate governance, management, risk
management, and operations of RBS’s US operations on
an enterprise-wide and business line basis,
• an enterprise-wide risk management programme for
RBS’s US operations
• a plan to oversee compliance by RBS’s US operations
with all applicable US laws, rules, regulations, and
supervisory guidance
• a Bank Secrecy Act/anti-money laundering compliance
programme for the US Branches on a consolidated basis
• a plan to improve the US Branches’ compliance with all
applicable provisions of the Bank Secrecy Act and its
rules and regulations as well as the requirements of
Regulation K of the Federal Reserve
• a customer due diligence programme designed to ensure
reasonably the identification and timely, accurate, and
complete reporting by the US Branches of all known or
suspected violations of law or suspicious transactions to
law enforcement and supervisory authorities, as required
by applicable suspicious activity reporting laws and
regulations, and
• a plan designed to enhance the US Branches’
compliance with Office of Foreign Assets Control (OFAC)
requirements.
The Governance Order identified specific items to be addressed,
considered, and included in each proposed plan or programme.
RBS also agreed in the Governance Order to adopt and
implement the plans and programmes after approval by the
regulators, to comply fully with the plans and programmes
thereafter, and to submit to the regulators periodic written
progress reports regarding compliance with the Governance
Order.
RBS has created, submitted, and adopted plans and/or
programmes to address each of the areas identified above. In
connection with RBS’s efforts to implement these plans and
programmes, it has, among other things, made investments in
technology, hired and trained additional personnel, and revised
compliance, risk management, and other policies and procedures
for RBS’s US operations. RBS continues to test the effectiveness
of the remediation efforts it has undertaken to ensure they are
sustainable and meet regulators' expectations. Furthermore, RBS
continues to work closely with the regulators in its efforts to fulfil
its obligations under the Governance Order, which will remain in
effect until terminated by the regulators.
RBS may be subject to formal and informal supervisory actions
and may be required by its US banking supervisors to take
further actions and implement additional remedial measures with
respect to these and additional matters. RBS’s activities in the
US may be subject to significant limitations and/or conditions.
US dollar processing consent order
In December 2013 RBS and RBS plc agreed a settlement with
the Federal Reserve, the New York State Department of
Financial Services (DFS), and the Office of Foreign Assets
Control (OFAC) with respect to RBS plc’s historical compliance
with US economic sanction regulations outside the US. As part of
the settlement, RBS and RBS plc entered into a consent Cease
and Desist Order with the Federal Reserve (US Dollar
Processing Order), which remains in effect until terminated by the
Federal Reserve. The US Dollar Processing Order (which is
publicly available) indicated, among other things, that RBS and
RBS plc lacked adequate risk management and legal review
policies and procedures to ensure that activities conducted
outside the US comply with applicable OFAC regulations.
RBS agreed to create an OFAC compliance programme to
ensure compliance with OFAC regulations by RBS’s global
business lines outside the US, and to adopt, implement, and
comply with the programme. Prior to and in connection with the
US Dollar Processing Order, RBS has made investments in
technology, hired and trained personnel, and revised compliance,
risk management, and other policies and procedures.

Notes on the consolidated accounts
346
Under the US Dollar Processing Order (as part of the OFAC
compliance programme) RBS was required to appoint an
independent consultant to conduct an annual OFAC compliance
review of compliance policies and their implementation and an
appropriate risk-focused sampling of US dollar payments. RBS
appointed the independent consultant and their report was
submitted to the authorities on 14 June 2015. The independent
consultant review examined a significant number of sanctions
alerts and no reportable issues were identified.
Pursuant to the US Dollar Processing Order, the authorities have
requested a second annual review to be conducted by an
independent consultant during the course of 2016 and RBS is
currently in discussions to agree the scope and timing of such
review. In addition, pursuant to requirements of the US Dollar
Processing Order, RBS has provided the required written
submissions, including quarterly updates, in a timely manner, and
RBS continues to participate in a constructive dialogue with the
authorities.
US/Swiss tax programme
In August 2013, the DOJ announced a programme for Swiss
banks (the Programme) which provides Swiss banks with an
opportunity to obtain resolution, through non-prosecution
agreements or non-target letters, of the DOJ’s investigations of
the role that Swiss banks played in concealing the assets of US
tax payers in offshore accounts (US related accounts). In
December 2013, Coutts & Co Ltd., a member of the Group
incorporated in Switzerland, notified the DOJ that it intended to
participate in the Programme.
As required by the Programme, Coutts & Co Ltd. subsequently
conducted a review of its US related accounts and presented the
results of the review to the DOJ. On 23 December 2015, Coutts &
Co Ltd. entered into a non-prosecution agreement (the NPA) in
which Coutts & Co Ltd. paid a US$78.5 million penalty and
acknowledged responsibility for certain conduct set forth in a
statement of facts accompanying the agreement. Under the
NPA, which has a term of four years, Coutts & Co Ltd. is
required, among other things, to provide certain information,
cooperate with DOJ’s investigations, and commit no U.S. federal
offenses. If Coutts & Co Ltd. abides by the NPA, the DOJ will not
prosecute it for certain tax-related and monetary transaction
offenses in connection with US related accounts.
German prosecutor investigation into Coutts & Co Ltd
A prosecuting authority in Germany undertook an investigation
into Coutts & Co Ltd in Switzerland, and current and former
employees, for alleged aiding and abetting of tax evasion by
certain Coutts & Co Ltd clients. Coutts & Co Ltd cooperated with
the relevant authorities and on 4 December 2015 paid EUR 23.8
million to settle the investigation against it. The settlement
amount was covered by an existing provision.
Review of suitability of advice provided by Coutts & Co
In 2013 the FCA conducted a thematic review of the advice
processes across the UK wealth management industry. As a
result of this review, Coutts & Co undertook a past business
review into the suitability of investment advice provided to its
clients. This review is well advanced, with the focus on Coutts &
Co contacting remaining clients and offering redress in
appropriate cases. RBS has made appropriate provision based
on its estimate of exposure arising from this review.
Enterprise Finance Guarantee Scheme
The Enterprise Finance Guarantee (EFG) scheme is a
government lending initiative for small businesses with viable
business proposals that lack security for conventional
lending. From 2009 until the end of 2015, RBS provided over
£980 million of lending under the EFG scheme. RBS
has identified a number of instances where it has not properly
explained to customers how borrower and guarantor liabilities
work under the EFG scheme. There are also concerns around
the eligibility of some customers to participate in the EFG
scheme and around potential over or under-payment of quarterly
premiums paid by customers. In January 2015, RBS announced
a review of all EFG loans where there is a possibility that the
customer may have been disadvantaged. The review has been
completed and RBS is in the final stages of advising customers of
their review outcome, which in some cases involves payment of
redress. RBS has made appropriate provision based on its
estimate of exposure arising from this review.
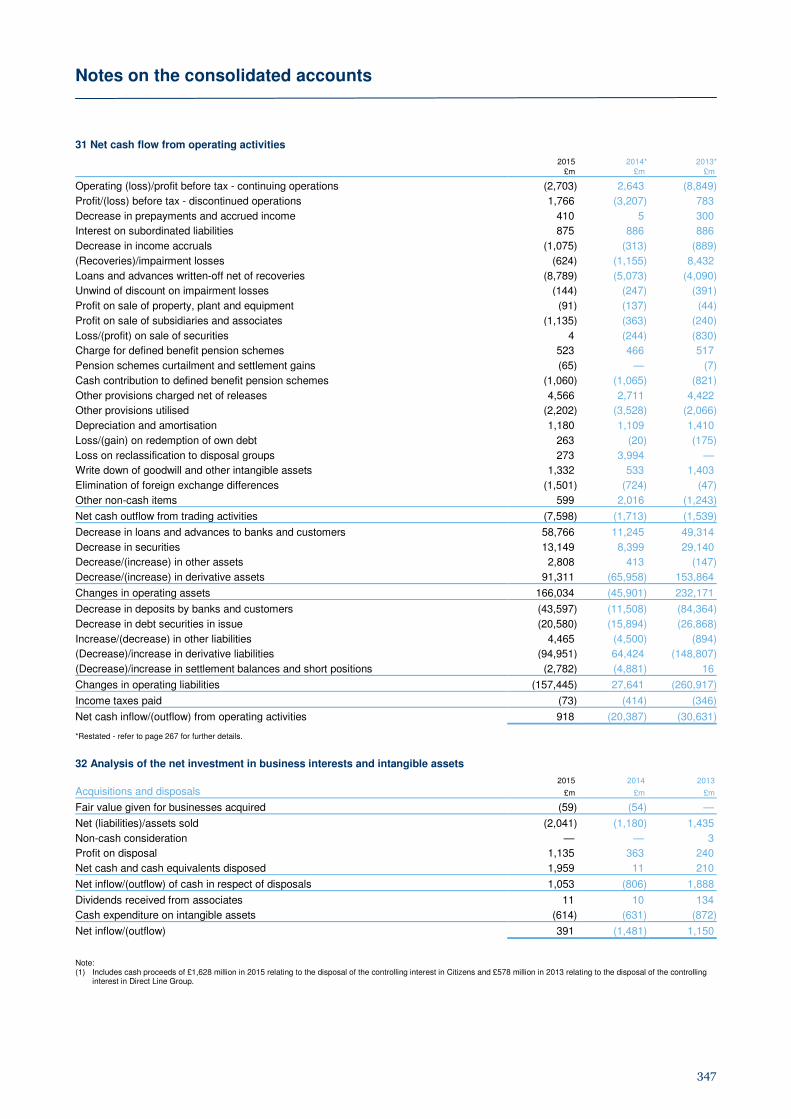
Notes on the consolidated accounts
347
31 Net cash flow from operating activities 2015 2014* 2013* £m £m £m
Operating (loss)/profit before tax - continuing operations (2,703) 2,643 (8,849)
Profit/(loss) before tax - discontinued operations 1,766 (3,207) 783
Decrease in prepayments and accrued income 410 5 300
Interest on subordinated liabilities 875 886 886
Decrease in income accruals (1,075) (313) (889)
(Recoveries)/impairment losses (624) (1,155) 8,432
Loans and advances written-off net of recoveries (8,789) (5,073) (4,090)
Unwind of discount on impairment losses (144) (247) (391)
Profit on sale of property, plant and equipment (91) (137) (44)
Profit on sale of subsidiaries and associates (1,135) (363) (240)
Loss/(profit) on sale of securities 4 (244) (830)
Charge for defined benefit pension schemes 523 466 517
Pension schemes curtailment and settlement gains (65) — (7)
Cash contribution to defined benefit pension schemes (1,060) (1,065) (821)
Other provisions charged net of releases 4,566 2,711 4,422
Other provisions utilised (2,202) (3,528) (2,066)
Depreciation and amortisation 1,180 1,109 1,410
Loss/(gain) on redemption of own debt 263 (20) (175)
Loss on reclassification to disposal groups 273 3,994 —
Write down of goodwill and other intangible assets 1,332 533 1,403
Elimination of foreign exchange differences (1,501) (724) (47)
Other non-cash items 599 2,016 (1,243)
Net cash outflow from trading activities (7,598) (1,713) (1,539)
Decrease in loans and advances to banks and customers 58,766 11,245 49,314
Decrease in securities 13,149 8,399 29,140
Decrease/(increase) in other assets 2,808 413 (147)
Decrease/(increase) in derivative assets 91,311 (65,958) 153,864
Changes in operating assets 166,034 (45,901) 232,171
Decrease in deposits by banks and customers (43,597) (11,508) (84,364)
Decrease in debt securities in issue (20,580) (15,894) (26,868)
Increase/(decrease) in other liabilities 4,465 (4,500) (894)
(Decrease)/increase in derivative liabilities (94,951) 64,424 (148,807)
(Decrease)/increase in settlement balances and short positions (2,782) (4,881) 16
Changes in operating liabilities (157,445) 27,641 (260,917)
Income taxes paid (73) (414) (346)
Net cash inflow/(outflow) from operating activities 918 (20,387) (30,631)
*Restated - refer to page 267 for further details.
32 Analysis of the net investment in business interests and intangible assets 2015 2014 2013
Acquisitions and disposals £m £m £m
Fair value given for businesses acquired (59) (54) —
Net (liabilities)/assets sold (2,041) (1,180) 1,435
Non-cash consideration — — 3
Profit on disposal 1,135 363 240
Net cash and cash equivalents disposed 1,959 11 210
Net inflow/(outflow) of cash in respect of disposals 1,053 (806) 1,888
Dividends received from associates 11 10 134
Cash expenditure on intangible assets (614) (631) (872)
Net inflow/(outflow) 391 (1,481) 1,150
Note: (1) Includes cash proceeds of £1,628 million in 2015 relating to the disposal of the controlling interest in Citizens and £578 million in 2013 relating to the disposal of the controlling
interest in Direct Line Group.

Notes on the consolidated accounts
348
33 Interest received and paid
2015 2014 2013
£m £m £m
Interest received 11,788 13,453 17,948
Interest paid (3,598) (4,194) (6,450)
8,190 9,259 11,498
34 Analysis of changes in financing during the year
Share capital, share premium, Subordinated liabilities paid-in equity and merger reserve
2015 2014 2013 2015 2014 2013
£m £m £m £m £m £m
At 1 January 45,935 45,582 45,144 22,905 24,012 26,773
Issue of ordinary shares 307 314 264
Issue of Additional Tier 1 capital notes 2,012 — —
Redemption of paid-in equity (150) — —
Issue of subordinated liabilities — 2,159 1,796
Repayment of subordinated liabilities (3,047) (3,480) (3,500)
Net cash inflow/(outflow) from financing 2,169 314 264 (3,047) (1,321) (1,704)
Conversion of B shares 4,590 — —
Ordinary shares issued in respect of employee share schemes 225 234 174
Reclassification of paid-in equity — (195) —
Redemption of equity preference shares (1) — —
Transfer of merger reserve to retained earnings (2,341) — —
Other adjustments including foreign exchange — — — (11) 214 (1,057)
At 31 December 50,577 45,935 45,582 19,847 22,905 24,012
35 Analysis of cash and cash equivalents
2015 2014 2013
£m £m £m
At 1 January
- cash 92,060 101,172 91,658
- cash equivalents 15,844 20,005 41,183
107,904 121,177 132,841
Net cash outflow (4,312) (13,273) (11,664)
At 31 December 103,592 107,904 121,177
Comprising:
Cash and balances at central banks 79,404 74,872 82,659
Treasury bills and debt securities 1,578 1,899 702
Loans and advances to banks 22,610 31,133 37,816
Cash and cash equivalents 103,592 107,904 121,177
Note: (1) Includes cash collateral posted with bank counterparties in respect of derivative liabilities of £11,031 million (2014 - £11,508 million; 2013 - £10,342 million).
Certain members of RBS are required by law or regulation to maintain balances with the central banks in the jurisdictions in which they
operate. These balances are set out below. 2015 2014 2013
Bank of England £0.5bn £0.6bn £0.6bn
US Federal Reserve — US$1.3bn US$1.2bn
De Nederlandsche Bank €0.3bn €0.2bn €0.2bn
Notes on the consolidated accounts
349
36 Segmental analysis
(a) Reportable segments
The directors manage RBS primarily by class of business and
present the segmental analysis on that basis. This includes the
review of net interest income for each class of business - interest
receivable and payable for all reportable segments is therefore
presented net. Segments charge market prices for services
rendered between each other; funding charges between
segments are determined by RBS Treasury, having regard to
commercial demands. The segment performance measure is
operating profit/(loss).
Organisational structure
RBS continues to deliver on its plan to build a strong, simple and
fair bank for both customers and shareholders. To support this
and reflect the progress made on the initiatives above the
previously reported operating segments have been realigned as
follows:
Personal & Business Banking (PBB) comprises two reportable
segments. UK Personal & Business Banking (UK PBB) and
Ulster Bank RoI. UK PBB serves individuals and mass affluent
customers in the UK together with small businesses (generally up
to £2 million turnover). UK PBB includes Ulster Bank customers
in Northern Ireland. Ulster Bank RoI serves individuals and
businesses in the Republic of Ireland (RoI).
Commercial & Private Banking (CPB) comprises three reportable
segments. Commercial Banking, Private Banking and RBS
International (RBSI). Commercial Banking serves commercial
and mid-corporate customers in the UK. Private Banking serves
high net worth individuals in the UK and RBSI serves retail,
commercial, corporate and financial institution customers in
Jersey, Guernsey, Isle of Man and Gibraltar.
Corporate & Institutional Banking (CIB) serves UK and Western
European corporate customers, and global financial institutions,
supported by trading and distribution platforms in the UK, US and
Singapore.
Capital Resolution consists of established businesses: CIB
Capital Resolution and RBS Capital Resolution (RCR).
CIB Capital Resolution was created from non-strategic portfolios
from CIB, to enable the build of a strong go-forward CIB
business, consisting of three regional businesses (Americas,
EMEA and APAC), Shipping, Markets assets, Other legacy
assets including Saudi Hollandi Bank (SHB) and Global
Transaction Services. There is a three stage process in place to
guide the business down; starting with taking capital out, then
running down the cost base and finally managing tail risk in the
longer-term.
RCR was created on 1 January 2014 to de-risk the balance
sheet. The original perimeter was £47 billion of funded assets
consisting of four asset groups: Ulster Bank (Ulster RCR), Real
Estate Finance (ex. Ireland), Corporate and Markets. The
remaining funded assets of £4.6 billion are included in Capital
Resolution.
Williams & Glyn comprises the RBS England and Wales branch-
based businesses, along with certain SME and corporate
activities across the UK. During the period presented W&G has
not operated as a separate legal entity. The perimeter of the
segment currently reported does not include certain portfolios
that are ultimately intended to be divested as part of W&G, for
example, certain NatWest branches in Scotland.
Central items & other comprises corporate functions, such as
Treasury, Finance, Risk Management, Compliance, Legal,
Communications and Human Resources. Central functions
manages RBS capital resources and RBS-wide regulatory
projects and provides services to the reportable segments.
Balances relating to Citizens and the international private banking
business are also included.
Non-Core Division, established in 2009 as a principal vehicle for
risk reduction, was dissolved on 31 December 2013.
Reporting changes
In line with RBS’s strategy to be a simpler bank, the following
reporting changes have been implemented in relation to the
presentation of RBS results:
The following items previously reported separately after operating
profit are now being reported within operating profit. • Own credit adjustments; • Gain/(loss) on redemption of own debt;
• Write-down of goodwill;
• Strategic disposals; and • RFS Holdings minority interest (RFS MI).
Allocation of central balance sheet items
RBS allocates all central costs relating to Services and Functions
to the business using appropriate drivers. These are reported as
indirect costs in the segmental income statements. However,
previously central balance sheet items have not been allocated.
The assets (and risk-weighted assets) held centrally, mainly
relating to Treasury, are now allocated using appropriate drivers.
Revised Treasury allocations
Treasury allocations which are included within the segmental net
interest income balances have been revised to reflect the
following:
• In preparation for the separation of Williams & Glyn, that
element of Treasury allocations previously charged to
UK PBB is now retained centrally.
• To reflect the impact of changes to the notional equity
allocation for the purposes of calculating segmental return
on equity.
Citizens Financial Group
Citizens was classified as a discontinued operation and as a
disposal group on 31 December 2014 and its assets and
liabilities from that date to 3 August 2015 have been aggregated
and presented as separate lines in accordance with IFRS 5. On 3
August 2015, RBS’s interest in Citizens fell to 20.9% and it was
treated as an associate held for sale thereafter. On 30 October
2015, RBS sold its remaining shareholding in Citizens. Citizens is
no longer treated as a reportable segment.
Comparatives have been restated for the organisational and
reporting changes outlined above.
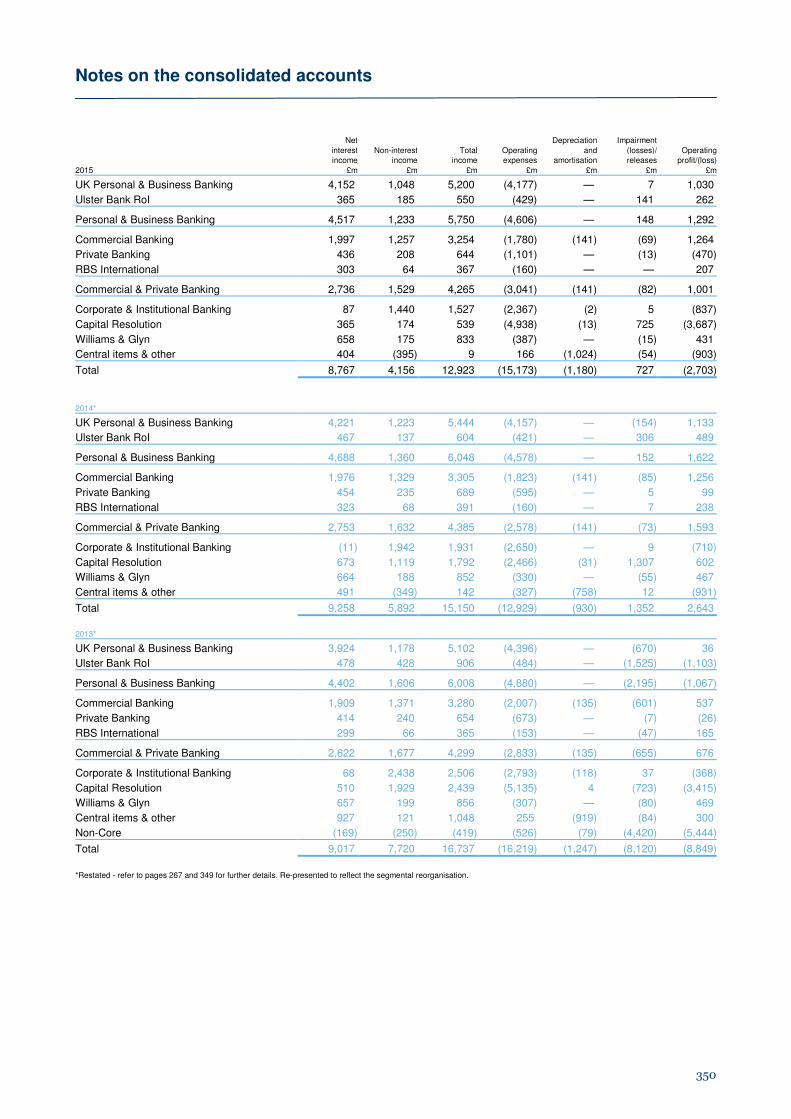
Notes on the consolidated accounts
350
2015
Net Depreciation Impairment
interest Non-interest Total Operating and (losses)/ Operating income income income expenses amortisation releases profit/(loss)
£m £m £m £m £m £m £m
UK Personal & Business Banking 4,152 1,048 5,200 (4,177) — 7 1,030
Ulster Bank RoI 365 185 550 (429) — 141 262 Personal & Business Banking 4,517 1,233 5,750 (4,606) — 148 1,292 Commercial Banking 1,997 1,257 3,254 (1,780) (141) (69) 1,264
Private Banking 436 208 644 (1,101) — (13) (470)
RBS International 303 64 367 (160) — — 207 Commercial & Private Banking 2,736 1,529 4,265 (3,041) (141) (82) 1,001 Corporate & Institutional Banking 87 1,440 1,527 (2,367) (2) 5 (837)
Capital Resolution 365 174 539 (4,938) (13) 725 (3,687)
Williams & Glyn 658 175 833 (387) — (15) 431
Central items & other 404 (395) 9 166 (1,024) (54) (903)
Total 8,767 4,156 12,923 (15,173) (1,180) 727 (2,703)
2014*
UK Personal & Business Banking 4,221 1,223 5,444 (4,157) — (154) 1,133
Ulster Bank RoI 467 137 604 (421) — 306 489 Personal & Business Banking 4,688 1,360 6,048 (4,578) — 152 1,622 Commercial Banking 1,976 1,329 3,305 (1,823) (141) (85) 1,256
Private Banking 454 235 689 (595) — 5 99
RBS International 323 68 391 (160) — 7 238 Commercial & Private Banking 2,753 1,632 4,385 (2,578) (141) (73) 1,593 Corporate & Institutional Banking (11) 1,942 1,931 (2,650) — 9 (710)
Capital Resolution 673 1,119 1,792 (2,466) (31) 1,307 602
Williams & Glyn 664 188 852 (330) — (55) 467
Central items & other 491 (349) 142 (327) (758) 12 (931)
Total 9,258 5,892 15,150 (12,929) (930) 1,352 2,643
2013*
UK Personal & Business Banking 3,924 1,178 5,102 (4,396) — (670) 36
Ulster Bank RoI 478 428 906 (484) — (1,525) (1,103) Personal & Business Banking 4,402 1,606 6,008 (4,880) — (2,195) (1,067) Commercial Banking 1,909 1,371 3,280 (2,007) (135) (601) 537
Private Banking 414 240 654 (673) — (7) (26)
RBS International 299 66 365 (153) — (47) 165 Commercial & Private Banking 2,622 1,677 4,299 (2,833) (135) (655) 676 Corporate & Institutional Banking 68 2,438 2,506 (2,793) (118) 37 (368)
Capital Resolution 510 1,929 2,439 (5,135) 4 (723) (3,415)
Williams & Glyn 657 199 856 (307) — (80) 469
Central items & other 927 121 1,048 255 (919) (84) 300
Non-Core (169) (250) (419) (526) (79) (4,420) (5,444)
Total 9,017 7,720 16,737 (16,219) (1,247) (8,120) (8,849)
*Restated - refer to pages 267 and 349 for further details. Re-presented to reflect the segmental reorganisation.
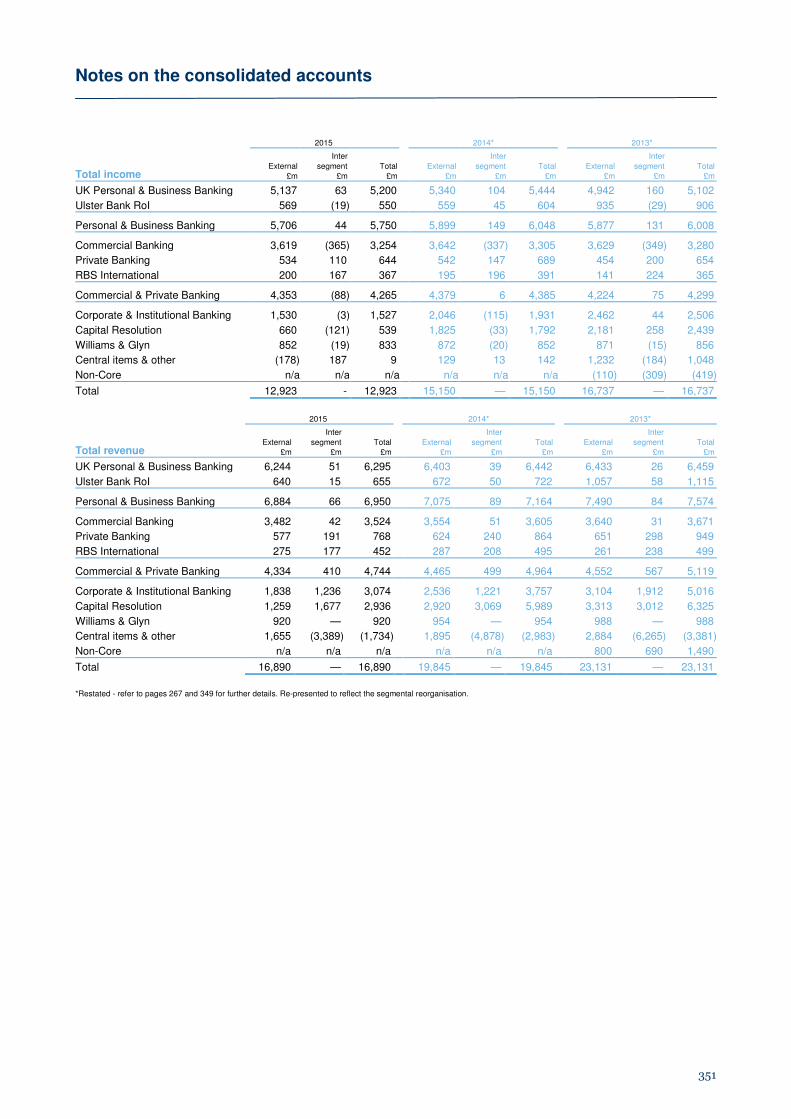
Notes on the consolidated accounts
351
2015 2014* 2013*
Total income
Inter Inter
Inter
External segment Total External segment Total External segment Total £m £m £m £m £m £m £m £m £m
UK Personal & Business Banking 5,137 63 5,200 5,340 104 5,444 4,942 160 5,102
Ulster Bank RoI 569 (19) 550 559 45 604 935 (29) 906 Personal & Business Banking 5,706 44 5,750 5,899 149 6,048 5,877 131 6,008 Commercial Banking 3,619 (365) 3,254 3,642 (337) 3,305 3,629 (349) 3,280
Private Banking 534 110 644 542 147 689 454 200 654
RBS International 200 167 367 195 196 391 141 224 365 Commercial & Private Banking 4,353 (88) 4,265 4,379 6 4,385 4,224 75 4,299 Corporate & Institutional Banking 1,530 (3) 1,527 2,046 (115) 1,931 2,462 44 2,506
Capital Resolution 660 (121) 539 1,825 (33) 1,792 2,181 258 2,439
Williams & Glyn 852 (19) 833 872 (20) 852 871 (15) 856
Central items & other (178) 187 9 129 13 142 1,232 (184) 1,048
Non-Core n/a n/a n/a n/a n/a n/a (110) (309) (419)
Total 12,923 - 12,923 15,150 — 15,150 16,737 — 16,737
2015 2014* 2013*
Total revenue
Inter Inter Inter
External segment Total External segment Total External segment Total £m £m £m £m £m £m £m £m £m
UK Personal & Business Banking 6,244 51 6,295 6,403 39 6,442 6,433 26 6,459
Ulster Bank RoI 640 15 655 672 50 722 1,057 58 1,115 Personal & Business Banking 6,884 66 6,950 7,075 89 7,164 7,490 84 7,574 Commercial Banking 3,482 42 3,524 3,554 51 3,605 3,640 31 3,671
Private Banking 577 191 768 624 240 864 651 298 949
RBS International 275 177 452 287 208 495 261 238 499 Commercial & Private Banking 4,334 410 4,744 4,465 499 4,964 4,552 567 5,119 Corporate & Institutional Banking 1,838 1,236 3,074 2,536 1,221 3,757 3,104 1,912 5,016
Capital Resolution 1,259 1,677 2,936 2,920 3,069 5,989 3,313 3,012 6,325
Williams & Glyn 920 — 920 954 — 954 988 — 988
Central items & other 1,655 (3,389) (1,734) 1,895 (4,878) (2,983) 2,884 (6,265) (3,381)
Non-Core n/a n/a n/a n/a n/a n/a 800 690 1,490
Total 16,890 — 16,890 19,845 — 19,845 23,131 — 23,131
*Restated - refer to pages 267 and 349 for further details. Re-presented to reflect the segmental reorganisation.

Notes on the consolidated accounts
352
2015 2014* 2013*
Cost to Cost to
Cost to
acquire fixed acquire fixed acquire fixed assets and assets and assets and
intangible intangible intangibleAssets Liabilities assets Assets Liabilities assets Assets Liabilities assets
£m £m £m £m £m £m £m £m £m
UK Personal & Business Banking 143,871 140,659 — 137,827 136,958 — 133,814 131,766 —
Ulster Bank RoI 21,264 15,837 — 22,488 17,962 — 27,481 19,975 11 Personal & Business Banking 165,135 156,496 — 160,315 154,920 — 161,295 151,741 11 Commercial Banking 133,546 94,619 214 127,903 89,754 227 127,262 96,060 98
Private Banking 17,022 23,257 — 17,724 22,558 17 17,440 22,635 26
RBS International 23,130 21,398 — 23,449 20,997 — 21,532 21,059 — Commercial & Private Banking 173,698 139,274 214 169,076 133,309 244 166,234 139,754 124 Corporate & Institutional Banking 215,272 193,589 2 276,153 261,477 23 246,026 224,073 494
Capital Resolution 201,476 186,470 27 327,253 272,499 111 311,413 271,660 —
Williams & Glyn 24,088 24,171 — 23,634 22,065 — 23,531 21,580 —
Central items & other 35,739 61,261 1,227 94,588 148,040 1,047 90,259 153,789 1,109
Non-Core n/a n/a n/a n/a n/a n/a 29,064 6,094 18
815,408 761,261 1,470 1,051,019 992,310 1,425 1,027,822 968,691 1,756
Segmental analysis of assets and liabilities included in disposal groups: 2015 2014* 2013*
Assets Liabilities Assets Liabilities Assets Liabilities
£m £m £m £m £m £m
RBS International — — 2 — 3 —
Corporate & Institutional Banking — — 18 14 78 48
Capital Resolution 130 251 569 2 — —
Central items & other 3,356 2,729 81,422 71,304 2,163 3,309
Non-Core n/a n/a n/a n/a 773 21
3,486 2,980 82,011 71,320 3,017 3,378
Segmental analysis of goodwill is as follows: UK Personal & Business Commercial Private RBS Capital Central items
Banking Banking Banking International Resolution and other (1) Total £m £m £m £m £m £m £m
At 1 January 2014* 3,351 1,907 715 300 130 3,736 10,139
Transfer to disposal groups — — — — — (3,957) (3,957)
Currency translation and other adjustments — — (9) — — 221 212
Write down of goodwill - continuing operations — — — — (130) — (130)
At 1 January 2015* 3,351 1,907 706 300 — — 6,264
Transfers to disposal groups — — (220) — — — (220)
Currency translation and other adjustments — — 12 — — — 12
Write down of goodwill - continuing operations — — (498) — — — (498)
At 31 December 2015 3,351 1,907 — 300 — — 5,558
*Restated - refer to pages 267 and 349 for further details. Re-presented to reflect the segmental reorganisation. Note: (1) Relates to Citizens Financial Group.

Notes on the consolidated accounts
353
(b) Geographical segments The geographical analysis in the tables below has been compiled on the basis of location of office where the transactions are recorded.
2015 UK USA Europe RoW Total
£m £m £m £m £m
Total revenue 14,724 315 1,247 604 16,890 Net interest income 7,947 162 407 251 8,767
Net fees and commissions 2,377 139 334 83 2,933
Income from trading activities 942 44 85 (11) 1,060
Other operating income 102 (118) 34 145 163
Total income 11,368 227 860 468 12,923 Operating (loss)/profit before tax (87) (2,723) 261 (154) (2,703)
Total assets 673,409 77,514 42,133 22,352 815,408
Of which total assets held for sale — 15 1,251 2,220 3,486
Total liabilities 630,818 75,971 34,942 19,530 761,261
Of which total liabilities held for sale — 16 418 2,546 2,980
Net assets attributable to equity owners and non-controlling interests 42,591 1,543 7,191 2,822 54,147
Contingent liabilities and commitments 127,781 9,729 14,961 1,281 153,752
Cost to acquire property, plant and equipment and intangible assets 1,331 70 36 33 1,470 2014* Total revenue 15,913 1,261 1,817 854 19,845 Net interest income 7,976 223 637 422 9,258
Net fees and commissions 2,483 285 595 176 3,539
Income from trading activities 530 538 238 (21) 1,285
Other operating income 941 89 (83) 121 1,068
Total income 11,930 1,135 1,387 698 15,150 Operating profit before tax 828 375 1,354 86 2,643
Total assets 780,141 182,471 51,227 37,180 1,051,019
Of which total assets held for sale 48 80,985 — 978 82,011
Total liabilities 746,343 166,489 45,417 34,061 992,310
Of which total liabilities held for sale 2 71,282 — 36 71,320
Net assets attributable to equity owners and non-controlling interests 33,798 15,982 5,810 3,119 58,709
Contingent liabilities and commitments 103,576 89,002 41,399 7,209 241,186
Cost to acquire property, plant and equipment and intangible assets 1,025 244 133 23 1,425 2013* Total revenue 16,015 2,188 2,913 2,015 23,131 Net interest income 7,794 236 746 241 9,017
Net fees and commissions 2,544 336 663 212 3,755
Income from trading activities 1,474 899 106 92 2,571
Other operating income 644 203 242 305 1,394
Total income 12,456 1,674 1,757 850 16,737 Operating (loss)/profit before tax (2,444) (1,221) (5,262) 78 (8,849)
Total assets 747,291 197,789 40,113 42,629 1,027,822
Of which total assets held for sale 915 750 198 1,154 3,017
Total liabilities 692,889 183,549 50,107 42,146 968,691
Of which total liabilities held for sale — 3,210 81 87 3,378
Net assets attributable to equity owners and non-controlling interests 54,402 14,240 (9,994) 483 59,131
Contingent liabilities and commitments 107,500 83,048 41,368 10,093 242,009
Cost to acquire property, plant and equipment and intangible assets 1,086 428 232 10 1,756 *Restated - refer to pages 267 and 349 for further details.
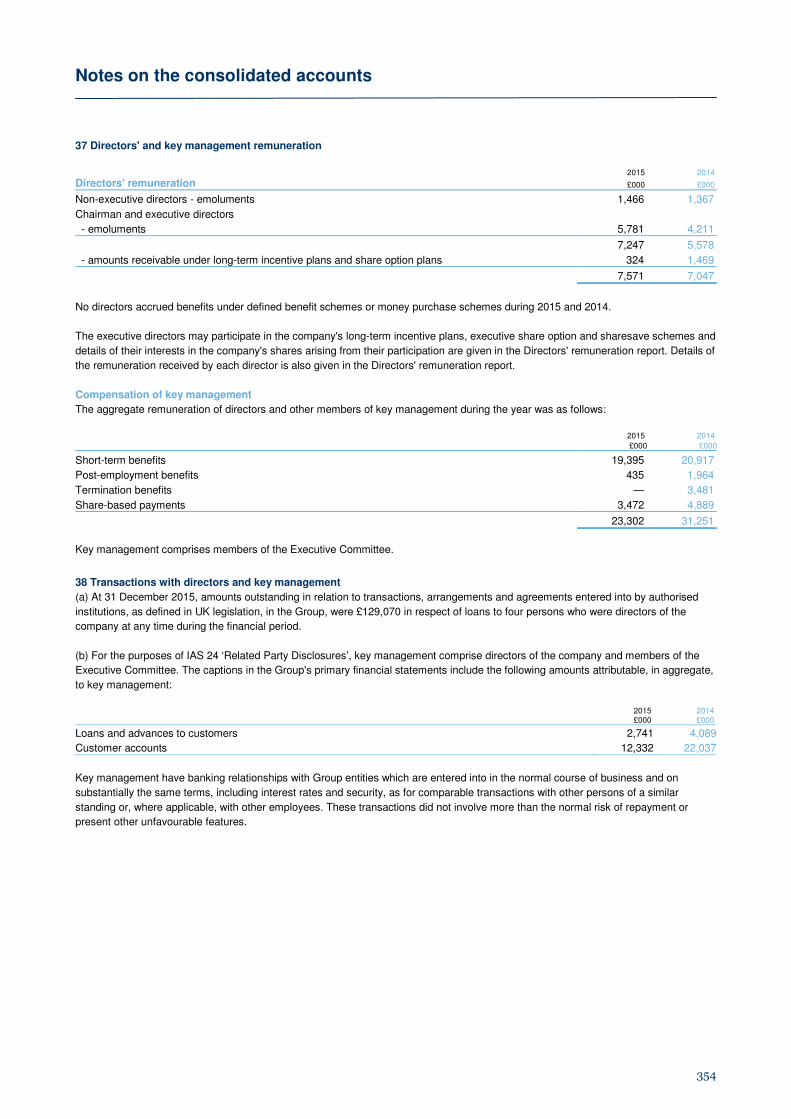
Notes on the consolidated accounts
354
37 Directors' and key management remuneration 2015 2014
Directors' remuneration £000 £000
Non-executive directors - emoluments 1,466 1,367
Chairman and executive directors
- emoluments 5,781 4,211
7,247 5,578
- amounts receivable under long-term incentive plans and share option plans 324 1,469
7,571 7,047
No directors accrued benefits under defined benefit schemes or money purchase schemes during 2015 and 2014.
The executive directors may participate in the company's long-term incentive plans, executive share option and sharesave schemes and
details of their interests in the company's shares arising from their participation are given in the Directors' remuneration report. Details of
the remuneration received by each director is also given in the Directors' remuneration report.
Compensation of key management
The aggregate remuneration of directors and other members of key management during the year was as follows: 2015 2014
£000 £000
Short-term benefits 19,395 20,917
Post-employment benefits 435 1,964
Termination benefits — 3,481
Share-based payments 3,472 4,889
23,302 31,251
Key management comprises members of the Executive Committee.
38 Transactions with directors and key management
(a) At 31 December 2015, amounts outstanding in relation to transactions, arrangements and agreements entered into by authorised
institutions, as defined in UK legislation, in the Group, were £129,070 in respect of loans to four persons who were directors of the
company at any time during the financial period.
(b) For the purposes of IAS 24 ‘Related Party Disclosures’, key management comprise directors of the company and members of the
Executive Committee. The captions in the Group's primary financial statements include the following amounts attributable, in aggregate,
to key management:
2015 £000
2014 £000
Loans and advances to customers 2,741 4,089
Customer accounts 12,332 22,037
Key management have banking relationships with Group entities which are entered into in the normal course of business and on
substantially the same terms, including interest rates and security, as for comparable transactions with other persons of a similar
standing or, where applicable, with other employees. These transactions did not involve more than the normal risk of repayment or
present other unfavourable features.
Notes on the consolidated accounts
355
39 Related parties
UK Government
On 1 December 2008, the UK Government through HM Treasury
became the ultimate controlling party of The Royal Bank of
Scotland Group plc. The UK Government's shareholding is
managed by UK Financial Investments Limited, a company
wholly owned by the UK Government. As a result, the UK
Government and UK Government controlled bodies became
related parties of the Group. During 2015, all of the B shares held
by the UK Government were converted into ordinary shares of £1
each and the Dividend Access Share Retirement Agreement was
agreed between RBS and HM Treasury (see Note 24 on page
325).
The Group enters into transactions with many of these bodies on
an arm’s length basis. Transactions include the payment of: taxes
principally UK corporation tax (page 292) and value added tax;
national insurance contributions; local authority rates; and
regulatory fees and levies (including the bank levy (page 282)
and FSCS levies (page 334) together with banking transactions
such as loans and deposits undertaken in the normal course of
banker-customer relationships.
Bank of England facilities
The Group may participate in a number of schemes operated by
the Bank of England in the normal course of business.
Members of the Group that are UK authorised institutions are
required to maintain non-interest bearing (cash ratio) deposits
with the Bank of England amounting to 0.18% of their average
eligible liabilities in excess of £600 million. They also have
access to Bank of England reserve accounts: sterling current
accounts that earn interest at the Bank of England Rate.
Other related parties
(a) In their roles as providers of finance, RBS companies provide
development and other types of capital support to
businesses. These investments are made in the normal
course of business and on arm's length terms. In some
instances, the investment may extend to ownership or control
over 20% or more of the voting rights of the investee
company. However, these investments are not considered to
give rise to transactions of a materiality requiring disclosure
under IAS 24.
(b) RBS recharges The Royal Bank of Scotland Group Pension
Fund with the cost of administration services incurred by it.
The amounts involved are not material to the Group.
(c) In accordance with IAS 24, transactions or balances between
RBS entities that have been eliminated on consolidation are
not reported.
(d) The captions in the primary financial statements of the parent
company include amounts attributable to subsidiaries. These
amounts have been disclosed in aggregate in the relevant
notes to the financial statements.
40 Post balance sheet events
On 26 January 2016, National Westminster Bank Plc signed a
Memorandum of Understanding with RBS Pension Trustee
Limited regarding a payment of £4.2 billion into The Royal Bank
of Scotland Group Pension Fund before 31 March 2016 and
bringing forward the date of the next triennial valuation of the
scheme to no later than 31 December 2015. Pension matters are
further disclosed in Note 4 on page 286.
There have been no other significant events between 31
December 2015 and the date of approval of these accounts
which would require a change to or additional disclosure in the
accounts.
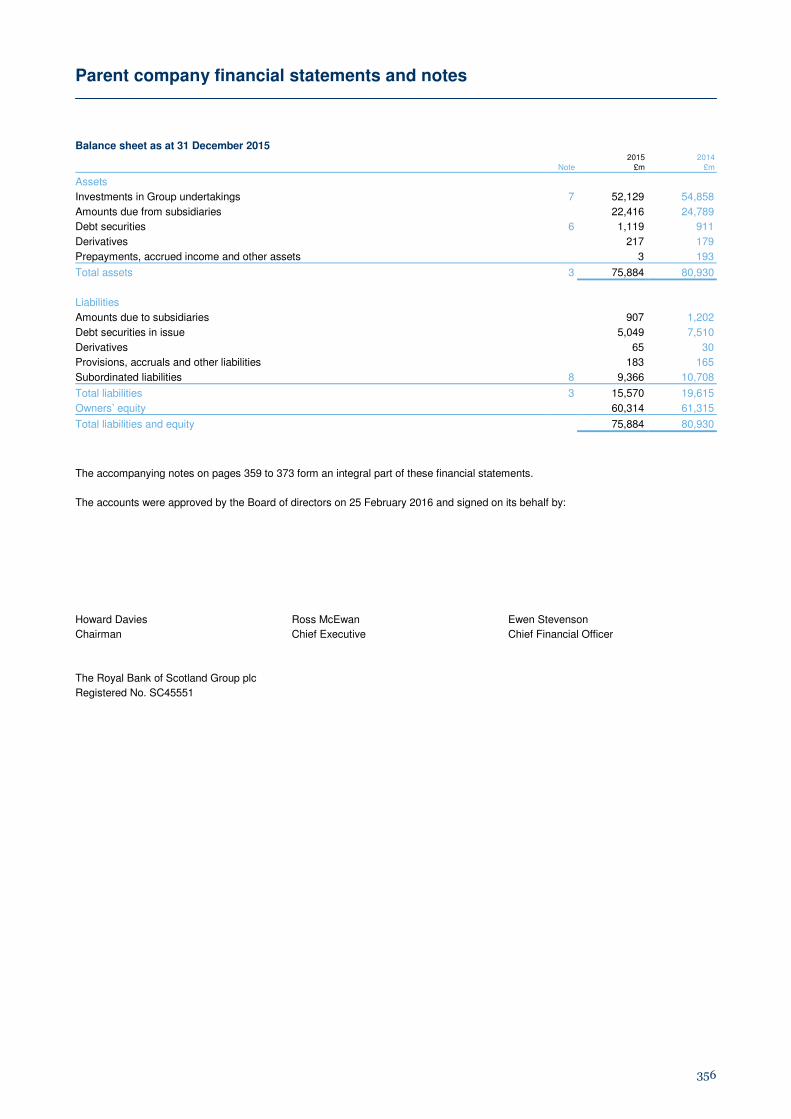
Parent company financial statements and notes
356
Balance sheet as at 31 December 2015
Note 2015 2014
£m £m
Assets
Investments in Group undertakings 7 52,129 54,858
Amounts due from subsidiaries 22,416 24,789
Debt securities 6 1,119 911
Derivatives 217 179
Prepayments, accrued income and other assets 3 193
Total assets 3 75,884 80,930
Liabilities
Amounts due to subsidiaries 907 1,202
Debt securities in issue 5,049 7,510
Derivatives 65 30
Provisions, accruals and other liabilities 183 165
Subordinated liabilities 8 9,366 10,708
Total liabilities 3 15,570 19,615
Owners’ equity 60,314 61,315
Total liabilities and equity 75,884 80,930
The accompanying notes on pages 359 to 373 form an integral part of these financial statements.
The accounts were approved by the Board of directors on 25 February 2016 and signed on its behalf by:
Howard Davies
Chairman
Ross McEwan
Chief Executive
Ewen Stevenson
Chief Financial Officer
The Royal Bank of Scotland Group plc
Registered No. SC45551
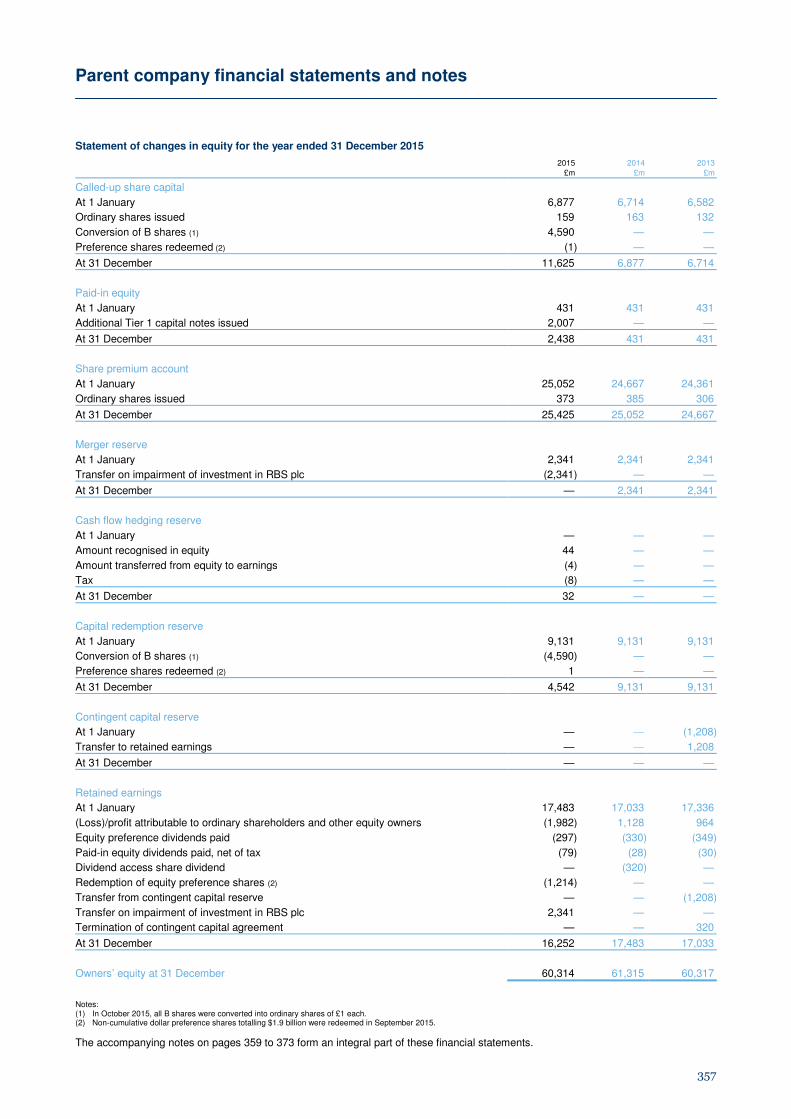
Parent company financial statements and notes
357
Statement of changes in equity for the year ended 31 December 2015 2015 2014 2013 £m £m £m
Called-up share capital
At 1 January 6,877 6,714 6,582
Ordinary shares issued 159 163 132
Conversion of B shares (1) 4,590 — —
Preference shares redeemed (2) (1) — —
At 31 December 11,625 6,877 6,714
Paid-in equity
At 1 January 431 431 431
Additional Tier 1 capital notes issued 2,007 — —
At 31 December 2,438 431 431
Share premium account
At 1 January 25,052 24,667 24,361
Ordinary shares issued 373 385 306
At 31 December 25,425 25,052 24,667
Merger reserve
At 1 January 2,341 2,341 2,341
Transfer on impairment of investment in RBS plc (2,341) — —
At 31 December — 2,341 2,341
Cash flow hedging reserve
At 1 January — — —
Amount recognised in equity 44 — —
Amount transferred from equity to earnings (4) — —
Tax (8) — —
At 31 December 32 — —
Capital redemption reserve
At 1 January 9,131 9,131 9,131
Conversion of B shares (1) (4,590) — —
Preference shares redeemed (2) 1 — —
At 31 December 4,542 9,131 9,131
Contingent capital reserve
At 1 January — — (1,208)
Transfer to retained earnings — — 1,208
At 31 December — — —
Retained earnings
At 1 January 17,483 17,033 17,336
(Loss)/profit attributable to ordinary shareholders and other equity owners (1,982) 1,128 964
Equity preference dividends paid (297) (330) (349)
Paid-in equity dividends paid, net of tax (79) (28) (30)
Dividend access share dividend — (320) —
Redemption of equity preference shares (2) (1,214) — —
Transfer from contingent capital reserve — — (1,208)
Transfer on impairment of investment in RBS plc 2,341 — —
Termination of contingent capital agreement — — 320
At 31 December 16,252 17,483 17,033
Owners’ equity at 31 December 60,314 61,315 60,317
Notes: (1) In October 2015, all B shares were converted into ordinary shares of £1 each. (2) Non-cumulative dollar preference shares totalling $1.9 billion were redeemed in September 2015.
The accompanying notes on pages 359 to 373 form an integral part of these financial statements.
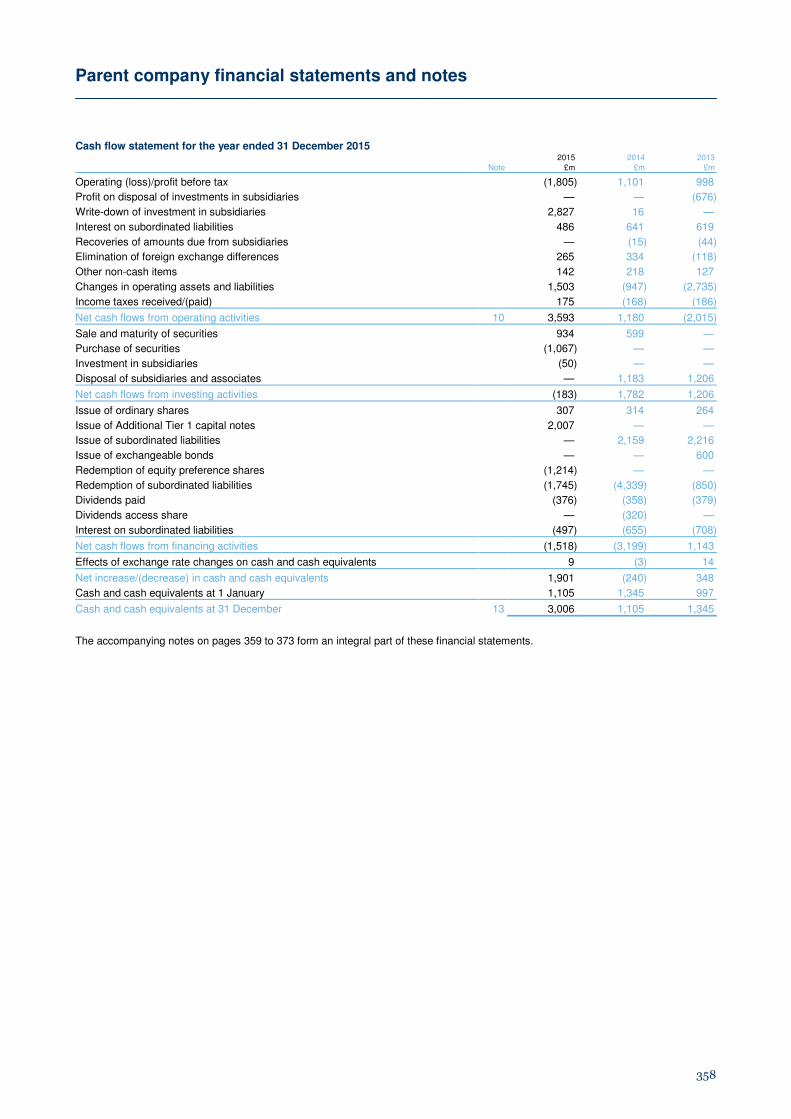
Parent company financial statements and notes
358
Cash flow statement for the year ended 31 December 2015
Note
2015 2014 2013
£m £m £m
Operating (loss)/profit before tax (1,805) 1,101 998
Profit on disposal of investments in subsidiaries — — (676)
Write-down of investment in subsidiaries 2,827 16 —
Interest on subordinated liabilities 486 641 619
Recoveries of amounts due from subsidiaries — (15) (44)
Elimination of foreign exchange differences 265 334 (118)
Other non-cash items 142 218 127
Changes in operating assets and liabilities 1,503 (947) (2,735)
Income taxes received/(paid) 175 (168) (186)
Net cash flows from operating activities 10 3,593 1,180 (2,015)
Sale and maturity of securities 934 599 —
Purchase of securities (1,067) — —
Investment in subsidiaries (50) — —
Disposal of subsidiaries and associates — 1,183 1,206
Net cash flows from investing activities (183) 1,782 1,206
Issue of ordinary shares 307 314 264
Issue of Additional Tier 1 capital notes 2,007 — —
Issue of subordinated liabilities — 2,159 2,216
Issue of exchangeable bonds — — 600
Redemption of equity preference shares (1,214) — —
Redemption of subordinated liabilities (1,745) (4,339) (850)
Dividends paid (376) (358) (379)
Dividends access share — (320) —
Interest on subordinated liabilities (497) (655) (708)
Net cash flows from financing activities (1,518) (3,199) 1,143
Effects of exchange rate changes on cash and cash equivalents 9 (3) 14
Net increase/(decrease) in cash and cash equivalents 1,901 (240) 348
Cash and cash equivalents at 1 January 1,105 1,345 997
Cash and cash equivalents at 31 December 13 3,006 1,105 1,345
The accompanying notes on pages 359 to 373 form an integral part of these financial statements.
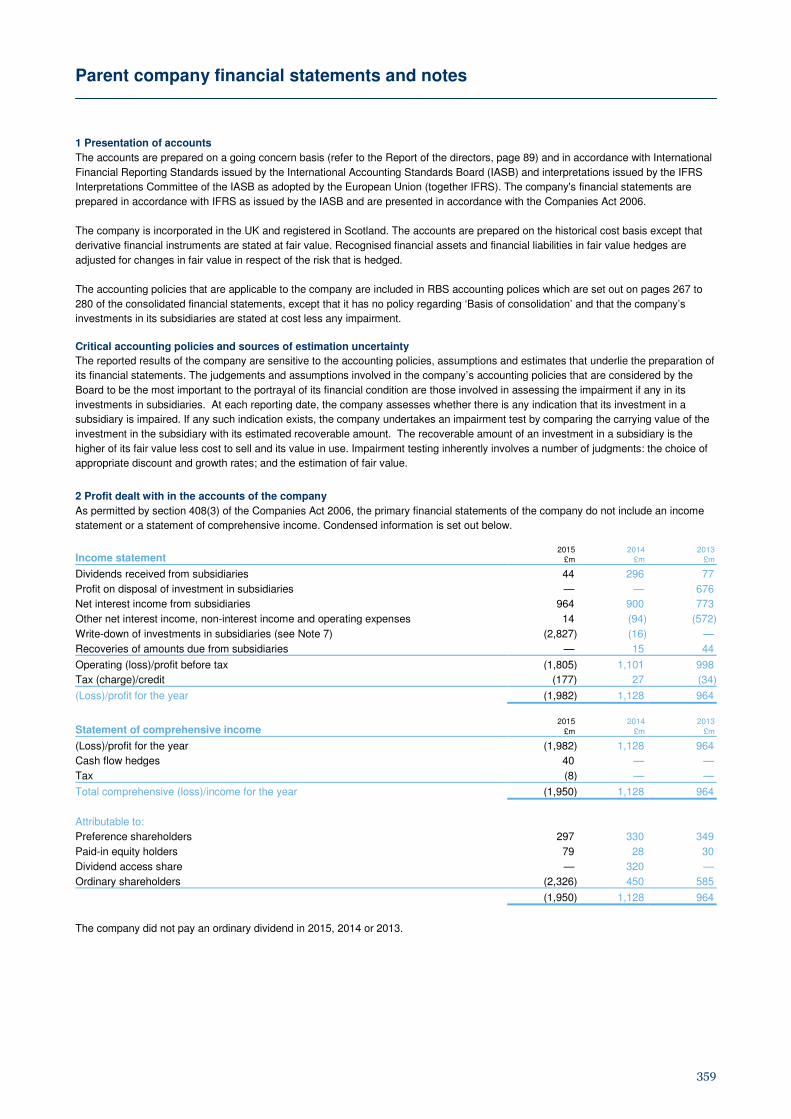
Parent company financial statements and notes
359
1 Presentation of accounts
The accounts are prepared on a going concern basis (refer to the Report of the directors, page 89) and in accordance with International
Financial Reporting Standards issued by the International Accounting Standards Board (IASB) and interpretations issued by the IFRS
Interpretations Committee of the IASB as adopted by the European Union (together IFRS). The company's financial statements are
prepared in accordance with IFRS as issued by the IASB and are presented in accordance with the Companies Act 2006.
The company is incorporated in the UK and registered in Scotland. The accounts are prepared on the historical cost basis except that
derivative financial instruments are stated at fair value. Recognised financial assets and financial liabilities in fair value hedges are
adjusted for changes in fair value in respect of the risk that is hedged.
The accounting policies that are applicable to the company are included in RBS accounting polices which are set out on pages 267 to
280 of the consolidated financial statements, except that it has no policy regarding ‘Basis of consolidation’ and that the company’s
investments in its subsidiaries are stated at cost less any impairment.
Critical accounting policies and sources of estimation uncertainty
The reported results of the company are sensitive to the accounting policies, assumptions and estimates that underlie the preparation of
its financial statements. The judgements and assumptions involved in the company’s accounting policies that are considered by the
Board to be the most important to the portrayal of its financial condition are those involved in assessing the impairment if any in its
investments in subsidiaries. At each reporting date, the company assesses whether there is any indication that its investment in a
subsidiary is impaired. If any such indication exists, the company undertakes an impairment test by comparing the carrying value of the
investment in the subsidiary with its estimated recoverable amount. The recoverable amount of an investment in a subsidiary is the
higher of its fair value less cost to sell and its value in use. Impairment testing inherently involves a number of judgments: the choice of
appropriate discount and growth rates; and the estimation of fair value.
2 Profit dealt with in the accounts of the company
As permitted by section 408(3) of the Companies Act 2006, the primary financial statements of the company do not include an income
statement or a statement of comprehensive income. Condensed information is set out below.
Income statement 2015 2014 2013
£m £m £m
Dividends received from subsidiaries 44 296 77
Profit on disposal of investment in subsidiaries — — 676
Net interest income from subsidiaries 964 900 773
Other net interest income, non-interest income and operating expenses 14 (94) (572)
Write-down of investments in subsidiaries (see Note 7) (2,827) (16) —
Recoveries of amounts due from subsidiaries — 15 44
Operating (loss)/profit before tax (1,805) 1,101 998
Tax (charge)/credit (177) 27 (34)
(Loss)/profit for the year (1,982) 1,128 964
Statement of comprehensive income 2015 2014 2013
£m £m £m
(Loss)/profit for the year (1,982) 1,128 964
Cash flow hedges 40 — —
Tax (8) — —
Total comprehensive (loss)/income for the year (1,950) 1,128 964
Attributable to:
Preference shareholders 297 330 349
Paid-in equity holders 79 28 30
Dividend access share — 320 —
Ordinary shareholders (2,326) 450 585
(1,950) 1,128 964
The company did not pay an ordinary dividend in 2015, 2014 or 2013.

Parent company financial statements and notes
360
3 Financial instruments - classification
The following table shows the company's financial assets and liabilities in accordance with the categories of financial instruments in IAS
39.
2015 2014
£m £m
Assets Investment in Group undertakings 52,129 54,858
Loans and advances to banks (1) - loans and receivables 22,148 24,490
Loans and advances to customers (1) - loans and receivables 268 299
Debt securities - loans and receivables 1,119 911
Derivatives (1)
- held-for-trading 5 6
- hedging 212 173
217 179
Prepayments, accrued income and other assets - non-financial assets 3 193
75,884 80,930
Liabilities Deposits by banks (2) - amortised cost 907 1,202
Customer accounts (2) - amortised cost Debt securities in issue - amortised cost 4,960 7,365
- designated as at fair value through profit or loss 89 145
5,049 7,510
Derivatives (2) - held-for-trading 51 19
- hedging 14 11
65 30
Accruals, deferred income and other liabilities - non-financial liabilities 183 165
Subordinated liabilities - amortised cost 9,366 10,708
15,570 19,615
Owners’ equity 60,314 61,315
75,884 80,930 Notes: (1) Due from subsidiaries. (2) Due to subsidiaries.
4 Financial instruments - fair value The following table shows the carrying value and fair value of financial instruments carried at amortised cost on the balance sheet.
2015 2014
Carrying Carrying value Fair value value Fair value
£bn £bn £bn £bn
Financial assets
Amounts due from subsidiaries (1) 22.4 23.1 24.8 26.3
Debt securities (2) 1.1 1.5 0.9 1.8 Financial liabilities
Amounts due to subsidiaries (3) 0.9 1.0 1.2 1.2
Debt securities in issue (2) 5.0 5.1 7.4 7.5
Subordinated liabilities (2) 9.4 9.8 10.7 11.3 Notes: (1) Fair value hierarchy: level 2 - £11.9 billion (2014 - £13.7 billion) and level 3 - £11.2 billion (2014 - £12.6 billion). (2) Fair value hierarchy level 2. (3) Fair value hierarchy level 3 (2014 – level 2).
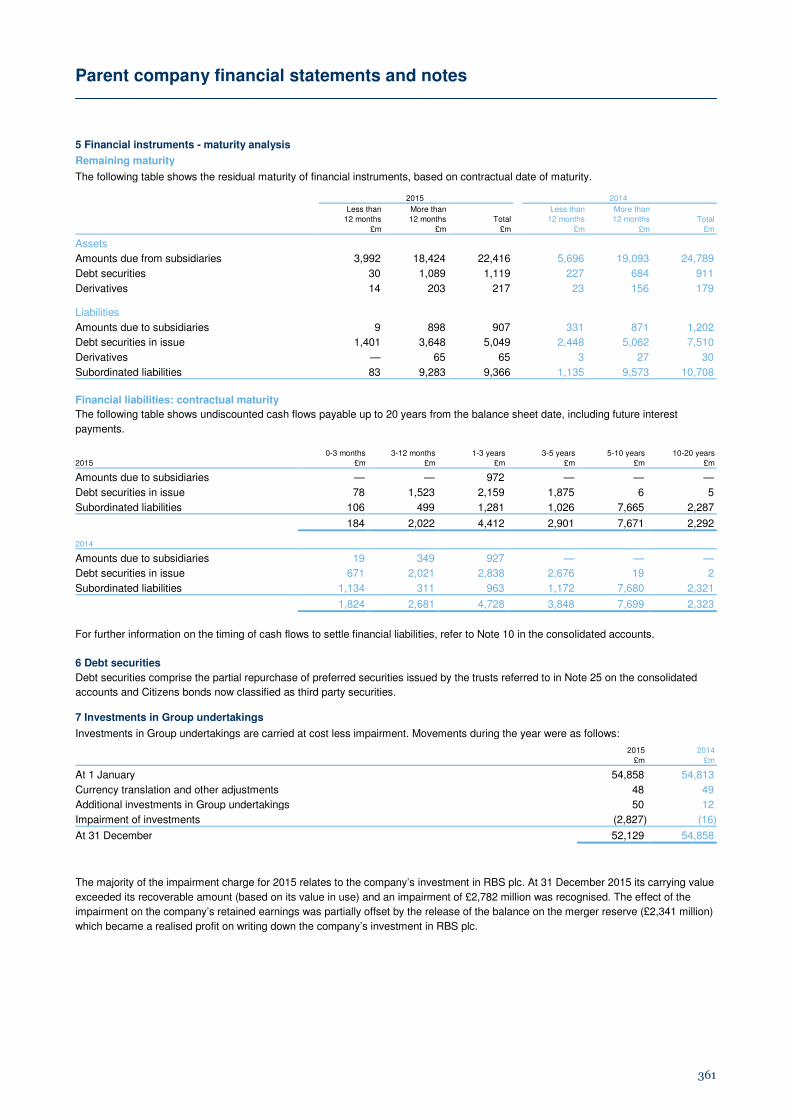
Parent company financial statements and notes
361
5 Financial instruments - maturity analysis Remaining maturity The following table shows the residual maturity of financial instruments, based on contractual date of maturity.
2015 2014
Less than More than Total
Less than More than Total 12 months 12 months 12 months 12 months
£m £m £m £m £m £m
Assets
Amounts due from subsidiaries 3,992 18,424 22,416 5,696 19,093 24,789
Debt securities 30 1,089 1,119 227 684 911
Derivatives 14 203 217 23 156 179 Liabilities
Amounts due to subsidiaries 9 898 907 331 871 1,202
Debt securities in issue 1,401 3,648 5,049 2,448 5,062 7,510
Derivatives — 65 65 3 27 30
Subordinated liabilities 83 9,283 9,366 1,135 9,573 10,708
Financial liabilities: contractual maturity
The following table shows undiscounted cash flows payable up to 20 years from the balance sheet date, including future interest
payments.
2015 0-3 months 3-12 months 1-3 years 3-5 years 5-10 years 10-20 years
£m £m £m £m £m £m
Amounts due to subsidiaries — — 972 — — —
Debt securities in issue 78 1,523 2,159 1,875 6 5
Subordinated liabilities 106 499 1,281 1,026 7,665 2,287
184 2,022 4,412 2,901 7,671 2,292
2014
Amounts due to subsidiaries 19 349 927 — — —
Debt securities in issue 671 2,021 2,838 2,676 19 2
Subordinated liabilities 1,134 311 963 1,172 7,680 2,321
1,824 2,681 4,728 3,848 7,699 2,323
For further information on the timing of cash flows to settle financial liabilities, refer to Note 10 in the consolidated accounts.
6 Debt securities
Debt securities comprise the partial repurchase of preferred securities issued by the trusts referred to in Note 25 on the consolidated
accounts and Citizens bonds now classified as third party securities. 7 Investments in Group undertakings Investments in Group undertakings are carried at cost less impairment. Movements during the year were as follows: 2015 2014
£m £m
At 1 January 54,858 54,813
Currency translation and other adjustments 48 49
Additional investments in Group undertakings 50 12
Impairment of investments (2,827) (16)
At 31 December 52,129 54,858
The majority of the impairment charge for 2015 relates to the company’s investment in RBS plc. At 31 December 2015 its carrying value
exceeded its recoverable amount (based on its value in use) and an impairment of £2,782 million was recognised. The effect of the
impairment on the company’s retained earnings was partially offset by the release of the balance on the merger reserve (£2,341 million)
which became a realised profit on writing down the company’s investment in RBS plc.
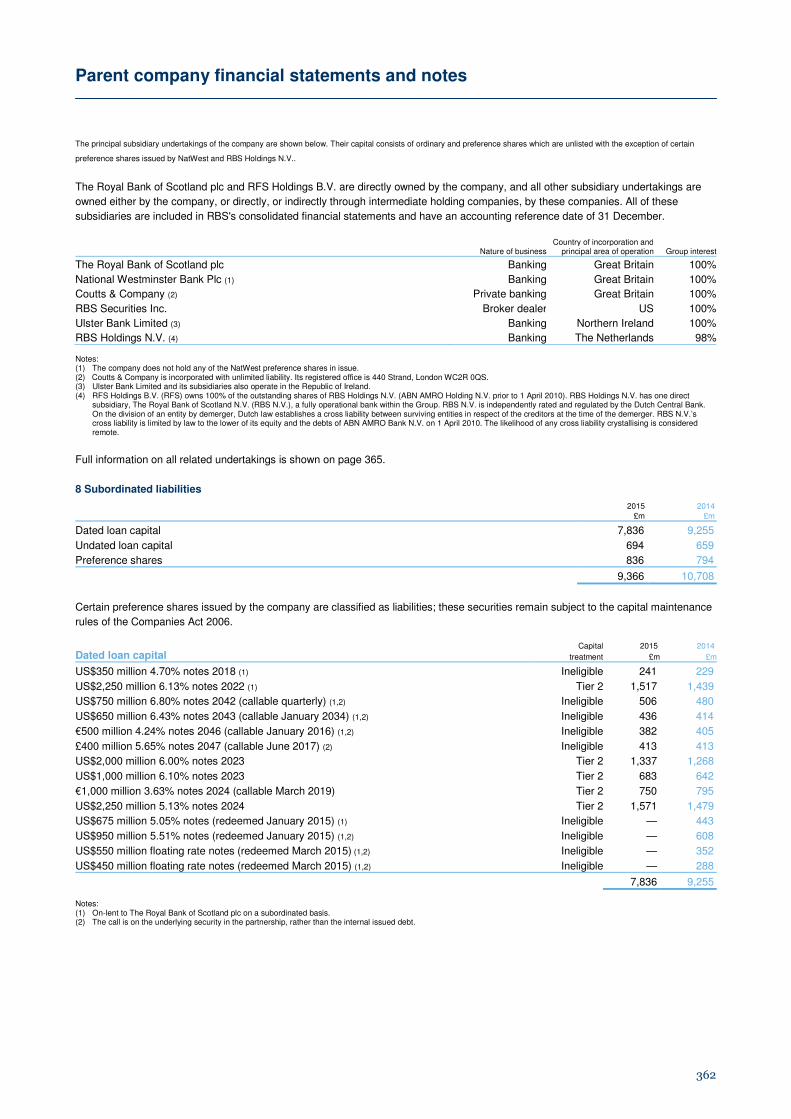
Parent company financial statements and notes
362
The principal subsidiary undertakings of the company are shown below. Their capital consists of ordinary and preference shares which are unlisted with the exception of certain
preference shares issued by NatWest and RBS Holdings N.V..
The Royal Bank of Scotland plc and RFS Holdings B.V. are directly owned by the company, and all other subsidiary undertakings are
owned either by the company, or directly, or indirectly through intermediate holding companies, by these companies. All of these
subsidiaries are included in RBS's consolidated financial statements and have an accounting reference date of 31 December.
Nature of business
Country of incorporation and principal area of operation Group interest
The Royal Bank of Scotland plc Banking Great Britain 100%
National Westminster Bank Plc (1) Banking Great Britain 100%
Coutts & Company (2) Private banking Great Britain 100%
RBS Securities Inc. Broker dealer US 100%
Ulster Bank Limited (3) Banking Northern Ireland 100%
RBS Holdings N.V. (4) Banking The Netherlands 98% Notes: (1) The company does not hold any of the NatWest preference shares in issue. (2) Coutts & Company is incorporated with unlimited liability. Its registered office is 440 Strand, London WC2R 0QS. (3) Ulster Bank Limited and its subsidiaries also operate in the Republic of Ireland. (4) RFS Holdings B.V. (RFS) owns 100% of the outstanding shares of RBS Holdings N.V. (ABN AMRO Holding N.V. prior to 1 April 2010). RBS Holdings N.V. has one direct
subsidiary, The Royal Bank of Scotland N.V. (RBS N.V.), a fully operational bank within the Group. RBS N.V. is independently rated and regulated by the Dutch Central Bank. On the division of an entity by demerger, Dutch law establishes a cross liability between surviving entities in respect of the creditors at the time of the demerger. RBS N.V.’s cross liability is limited by law to the lower of its equity and the debts of ABN AMRO Bank N.V. on 1 April 2010. The likelihood of any cross liability crystallising is considered remote.
Full information on all related undertakings is shown on page 365.
8 Subordinated liabilities 2015 2014 £m £m
Dated loan capital 7,836 9,255
Undated loan capital 694 659
Preference shares 836 794
9,366 10,708
Certain preference shares issued by the company are classified as liabilities; these securities remain subject to the capital maintenance
rules of the Companies Act 2006.
Dated loan capital Capital 2015 2014
treatment £m £m
US$350 million 4.70% notes 2018 (1) Ineligible 241 229
US$2,250 million 6.13% notes 2022 (1) Tier 2 1,517 1,439
US$750 million 6.80% notes 2042 (callable quarterly) (1,2) Ineligible 506 480
US$650 million 6.43% notes 2043 (callable January 2034) (1,2) Ineligible 436 414
€500 million 4.24% notes 2046 (callable January 2016) (1,2) Ineligible 382 405
£400 million 5.65% notes 2047 (callable June 2017) (2) Ineligible 413 413
US$2,000 million 6.00% notes 2023 Tier 2 1,337 1,268
US$1,000 million 6.10% notes 2023 Tier 2 683 642
€1,000 million 3.63% notes 2024 (callable March 2019) Tier 2 750 795
US$2,250 million 5.13% notes 2024 Tier 2 1,571 1,479
US$675 million 5.05% notes (redeemed January 2015) (1) Ineligible — 443
US$950 million 5.51% notes (redeemed January 2015) (1,2) Ineligible — 608
US$550 million floating rate notes (redeemed March 2015) (1,2) Ineligible — 352
US$450 million floating rate notes (redeemed March 2015) (1,2) Ineligible — 288
7,836 9,255 Notes: (1) On-lent to The Royal Bank of Scotland plc on a subordinated basis. (2) The call is on the underlying security in the partnership, rather than the internal issued debt.

Parent company financial statements and notes
363
Undated loan capital Capital 2015 2014
treatment £m £m
US$106 million floating rate notes (callable semi-annually) Ineligible 72 68
US$762 million 7.65% notes (callable September 2031) (1) Ineligible 519 493
US$150 million 8.00% notes (callable October 2093) Tier 2 103 98
694 659 Note: (1) The company can satisfy interest payment obligations by issuing sufficient ordinary shares to appointed Trustees to enable them, on selling these shares, to settle the interest
payment.
Preference shares (1)
Capital 2015 2014
treatment £m £m
Non-cumulative preference shares of US$0.01
US$156 million 7.65% series F (callable) Ineligible 106 100
US$242 million 7.25% series H (callable) Ineligible 163 155
US$751 million 5.75% series L (callable) Ineligible 506 481
Non-cumulative convertible preference shares of US$0.01 US$65 million 9.12% series 1 (callable) Ineligible 45 42
Non-cumulative convertible preference shares of £0.01
£15 million 7.39% series 1 (callable) Ineligible 15 15
Cumulative preference shares of £1 £0.5 million 11% and £0.4 million 5.5% (not callable) Ineligible 1 1
836 794
Note: (1) Further details of the contractual terms of the preference shares are given in Note 24 on the consolidated accounts.
9 Share capital
Details of the company’s share capital are set out in Note 24 on the consolidated accounts.

Parent company financial statements and notes
364
10 Net cash flow from operating activities
2015 2014 2013
£m £m £m
Operating (loss)/profit before tax (1,805) 1,101 998
Interest on subordinated liabilities 486 641 619
(Decrease)/increase in income accruals (140) 143 22
Recoveries of amounts due from subsidiaries — (15) (44)
Profit on disposal of investments in subsidiaries — — (676)
Write-down of investment in subsidiaries 2,827 16 —
Elimination of foreign exchange differences 265 334 (118)
Other non-cash items 282 75 105
Net cash inflow from trading activities 1,915 2,295 906
Decrease/(increase) in loans and advances to banks and customers 4,274 (302) (225)
(Increase)/decrease in securities in issue (2) (1) 31
Decrease/(increase) in other assets 192 (233) 9
(Increase)/decrease in derivative assets (38) (15) 347
Changes in operating assets 4,426 (551) 162
Decrease in deposits by banks and customers (295) (1,028) (63)
(Decrease)/increase in debt securities in issue (2,461) 495 (2,895)
(Decrease)/increase in other liabilities (202) 169 6
Increase/(decrease) in derivative liabilities 35 (32) 55
Changes in operating liabilities (2,923) (396) (2,897)
Income taxes received/(paid) 175 (168) (186)
Net cash inflow/(outflow) from operating activities 3,593 1,180 (2,015)
11 Interest received and paid
2015 2014 2013
£m £m £m
Interest received 1,103 1,159 1,139
Interest paid (744) (879) (884)
359 280 255
12 Analysis of changes in financing during the year
Share capital,
Subordinated liabilities
share premium, paid-in
equity and merger reserve
2015 2014 2013
2015 2014 2013
£m £m £m £m £m £m
At 1 January 34,701 34,153 33,715 10,708 12,426 11,305
Issue of ordinary shares 307 314 264
Issue of Additional Tier 1 capital notes 2,007 — —
Issue of subordinated liabilities — 2,159 2,216
Repayment of subordinated liabilities (1,745) (4,339) (850)
Net cash inflow/(outflow) from financing 2,314 314 264 (1,745) (2,180) 1,366
Conversion of B shares 4,590 — —
Ordinary shares issued in respect of employee share schemes 225 234 174
Redemption of equity preference shares (1) — —
Transfer on impairment of investment in RBS plc (2,341) — —
Other adjustments including foreign exchange — — — 403 462 (245)
At 31 December 39,488 34,701 34,153 9,366 10,708 12,426
13 Analysis of cash and cash equivalents
2015 2014 2013
£m £m £m
At 1 January - cash equivalents 1,105 1,345 997
Net cash inflow/(outflow) 1,901 (240) 348
At 31 December* 3,006 1,105 1,345
*Comprises loans and advances to banks
14 Directors’ and key management remuneration
Directors’ remuneration is disclosed in Note 37 on the consolidated accounts. The directors had no other reportable related party
transactions or balances with the company.
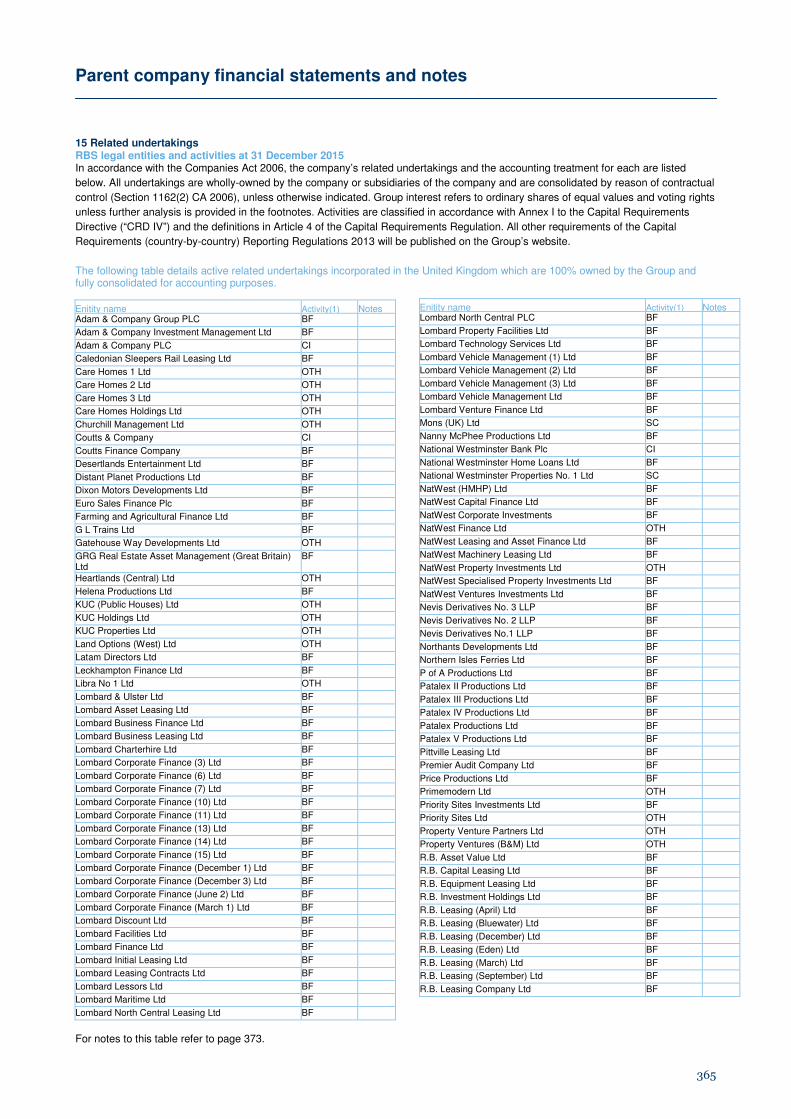
Parent company financial statements and notes
365
15 Related undertakings RBS legal entities and activities at 31 December 2015 In accordance with the Companies Act 2006, the company’s related undertakings and the accounting treatment for each are listed
below. All undertakings are wholly-owned by the company or subsidiaries of the company and are consolidated by reason of contractual
control (Section 1162(2) CA 2006), unless otherwise indicated. Group interest refers to ordinary shares of equal values and voting rights
unless further analysis is provided in the footnotes. Activities are classified in accordance with Annex I to the Capital Requirements
Directive (“CRD IV”) and the definitions in Article 4 of the Capital Requirements Regulation. All other requirements of the Capital
Requirements (country-by-country) Reporting Regulations 2013 will be published on the Group’s website.
The following table details active related undertakings incorporated in the United Kingdom which are 100% owned by the Group and fully consolidated for accounting purposes.
Enitity name Activity(1) Notes Adam & Company Group PLC BF
Adam & Company Investment Management Ltd BF
Adam & Company PLC CI
Caledonian Sleepers Rail Leasing Ltd BF Care Homes 1 Ltd OTH
Care Homes 2 Ltd OTH
Care Homes 3 Ltd OTH
Care Homes Holdings Ltd OTH
Churchill Management Ltd OTH
Coutts & Company CI Coutts Finance Company BF
Desertlands Entertainment Ltd BF
Distant Planet Productions Ltd BF
Dixon Motors Developments Ltd BF
Euro Sales Finance Plc BF
Farming and Agricultural Finance Ltd BF
G L Trains Ltd BF
Gatehouse Way Developments Ltd OTH
GRG Real Estate Asset Management (Great Britain) Ltd
BF
Heartlands (Central) Ltd OTH
Helena Productions Ltd BF
KUC (Public Houses) Ltd OTH
KUC Holdings Ltd OTH
KUC Properties Ltd OTH
Land Options (West) Ltd OTH
Latam Directors Ltd BF
Leckhampton Finance Ltd BF
Libra No 1 Ltd OTH
Lombard & Ulster Ltd BF
Lombard Asset Leasing Ltd BF
Lombard Business Finance Ltd BF
Lombard Business Leasing Ltd BF
Lombard Charterhire Ltd BF
Lombard Corporate Finance (3) Ltd BF
Lombard Corporate Finance (6) Ltd BF
Lombard Corporate Finance (7) Ltd BF
Lombard Corporate Finance (10) Ltd BF
Lombard Corporate Finance (11) Ltd BF
Lombard Corporate Finance (13) Ltd BF
Lombard Corporate Finance (14) Ltd BF
Lombard Corporate Finance (15) Ltd BF
Lombard Corporate Finance (December 1) Ltd BF
Lombard Corporate Finance (December 3) Ltd BF
Lombard Corporate Finance (June 2) Ltd BF
Lombard Corporate Finance (March 1) Ltd BF
Lombard Discount Ltd BF
Lombard Facilities Ltd BF
Lombard Finance Ltd BF
Lombard Initial Leasing Ltd BF
Lombard Leasing Contracts Ltd BF
Lombard Lessors Ltd BF
Lombard Maritime Ltd BF
Lombard North Central Leasing Ltd BF
For notes to this table refer to page 373.
Enitity name Activity(1) Notes Lombard North Central PLC BF
Lombard Property Facilities Ltd BF
Lombard Technology Services Ltd BF
Lombard Vehicle Management (1) Ltd BF
Lombard Vehicle Management (2) Ltd BF
Lombard Vehicle Management (3) Ltd BF
Lombard Vehicle Management Ltd BF
Lombard Venture Finance Ltd BF
Mons (UK) Ltd SC
Nanny McPhee Productions Ltd BF
National Westminster Bank Plc CI
National Westminster Home Loans Ltd BF
National Westminster Properties No. 1 Ltd SC
NatWest (HMHP) Ltd BF
NatWest Capital Finance Ltd BF
NatWest Corporate Investments BF
NatWest Finance Ltd OTH
NatWest Leasing and Asset Finance Ltd BF
NatWest Machinery Leasing Ltd BF
NatWest Property Investments Ltd OTH
NatWest Specialised Property Investments Ltd BF
NatWest Ventures Investments Ltd BF
Nevis Derivatives No. 3 LLP BF
Nevis Derivatives No. 2 LLP BF
Nevis Derivatives No.1 LLP BF
Northants Developments Ltd BF
Northern Isles Ferries Ltd BF
P of A Productions Ltd BF
Patalex II Productions Ltd BF
Patalex III Productions Ltd BF
Patalex IV Productions Ltd BF
Patalex Productions Ltd BF
Patalex V Productions Ltd BF
Pittville Leasing Ltd BF Premier Audit Company Ltd BF Price Productions Ltd BF Primemodern Ltd OTH Priority Sites Investments Ltd BF Priority Sites Ltd OTH Property Venture Partners Ltd OTH Property Ventures (B&M) Ltd OTH R.B. Asset Value Ltd BF R.B. Capital Leasing Ltd BF R.B. Equipment Leasing Ltd BF R.B. Investment Holdings Ltd BF R.B. Leasing (April) Ltd BF R.B. Leasing (Bluewater) Ltd
BF R.B. Leasing (December) Ltd BF R.B. Leasing (Eden) Ltd BF R.B. Leasing (March) Ltd BF R.B. Leasing (September) Ltd BF R.B. Leasing Company Ltd BF
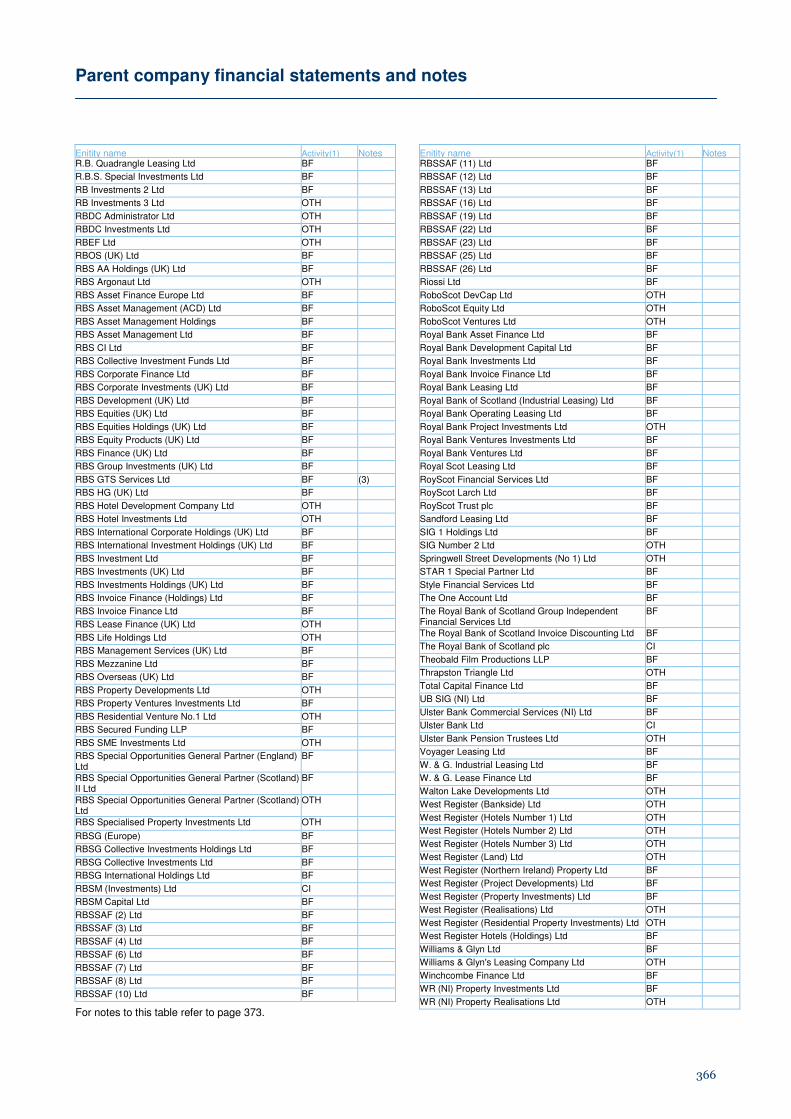
Parent company financial statements and notes
366
Enitity name Activity(1) Notes R.B. Quadrangle Leasing Ltd BF R.B.S. Special Investments Ltd BF RB Investments 2 Ltd BF RB Investments 3 Ltd OTH
RBDC Administrator Ltd OTH
RBDC Investments Ltd OTH
RBEF Ltd OTH
RBOS (UK) Ltd BF
RBS AA Holdings (UK) Ltd BF
RBS Argonaut Ltd OTH
RBS Asset Finance Europe Ltd BF
RBS Asset Management (ACD) Ltd BF
RBS Asset Management Holdings BF
RBS Asset Management Ltd BF
RBS CI Ltd BF
RBS Collective Investment Funds Ltd BF
RBS Corporate Finance Ltd BF
RBS Corporate Investments (UK) Ltd BF
RBS Development (UK) Ltd BF
RBS Equities (UK) Ltd BF
RBS Equities Holdings (UK) Ltd BF
RBS Equity Products (UK) Ltd BF
RBS Finance (UK) Ltd BF
RBS Group Investments (UK) Ltd BF
RBS GTS Services Ltd BF (3)
RBS HG (UK) Ltd BF
RBS Hotel Development Company Ltd OTH
RBS Hotel Investments Ltd OTH
RBS International Corporate Holdings (UK) Ltd BF
RBS International Investment Holdings (UK) Ltd BF
RBS Investment Ltd BF
RBS Investments (UK) Ltd BF
RBS Investments Holdings (UK) Ltd BF
RBS Invoice Finance (Holdings) Ltd BF
RBS Invoice Finance Ltd BF
RBS Lease Finance (UK) Ltd OTH
RBS Life Holdings Ltd OTH
RBS Management Services (UK) Ltd BF
RBS Mezzanine Ltd BF
RBS Overseas (UK) Ltd BF
RBS Property Developments Ltd OTH
RBS Property Ventures Investments Ltd BF
RBS Residential Venture No.1 Ltd OTH
RBS Secured Funding LLP BF
RBS SME Investments Ltd OTH
RBS Special Opportunities General Partner (England) Ltd
BF
RBS Special Opportunities General Partner (Scotland) II Ltd
BF
RBS Special Opportunities General Partner (Scotland) Ltd
OTH
RBS Specialised Property Investments Ltd OTH
RBSG (Europe) BF
RBSG Collective Investments Holdings Ltd BF
RBSG Collective Investments Ltd BF
RBSG International Holdings Ltd BF
RBSM (Investments) Ltd CI
RBSM Capital Ltd BF
RBSSAF (2) Ltd BF
RBSSAF (3) Ltd BF
RBSSAF (4) Ltd BF
RBSSAF (6) Ltd BF
RBSSAF (7) Ltd BF
RBSSAF (8) Ltd BF
RBSSAF (10) Ltd BF
For notes to this table refer to page 373.
Enitity name Activity(1) Notes RBSSAF (11) Ltd BF
RBSSAF (12) Ltd BF RBSSAF (13) Ltd BF RBSSAF (16) Ltd BF RBSSAF (19) Ltd BF RBSSAF (22) Ltd BF
RBSSAF (23) Ltd BF
RBSSAF (25) Ltd BF
RBSSAF (26) Ltd BF
Riossi Ltd BF
RoboScot DevCap Ltd OTH
RoboScot Equity Ltd OTH
RoboScot Ventures Ltd OTH
Royal Bank Asset Finance Ltd BF
Royal Bank Development Capital Ltd BF
Royal Bank Investments Ltd BF
Royal Bank Invoice Finance Ltd BF
Royal Bank Leasing Ltd BF
Royal Bank of Scotland (Industrial Leasing) Ltd BF
Royal Bank Operating Leasing Ltd BF
Royal Bank Project Investments Ltd OTH
Royal Bank Ventures Investments Ltd BF
Royal Bank Ventures Ltd BF
Royal Scot Leasing Ltd BF
RoyScot Financial Services Ltd BF
RoyScot Larch Ltd BF
RoyScot Trust plc BF
Sandford Leasing Ltd BF
SIG 1 Holdings Ltd BF
SIG Number 2 Ltd OTH
Springwell Street Developments (No 1) Ltd OTH
STAR 1 Special Partner Ltd BF
Style Financial Services Ltd BF
The One Account Ltd BF
The Royal Bank of Scotland Group Independent Financial Services Ltd
BF
The Royal Bank of Scotland Invoice Discounting Ltd BF
The Royal Bank of Scotland plc CI
Theobald Film Productions LLP BF
Thrapston Triangle Ltd OTH
Total Capital Finance Ltd BF
UB SIG (NI) Ltd BF
Ulster Bank Commercial Services (NI) Ltd BF
Ulster Bank Ltd CI
Ulster Bank Pension Trustees Ltd OTH
Voyager Leasing Ltd BF
W. & G. Industrial Leasing Ltd BF
W. & G. Lease Finance Ltd BF
Walton Lake Developments Ltd OTH
West Register (Bankside) Ltd OTH
West Register (Hotels Number 1) Ltd OTH
West Register (Hotels Number 2) Ltd OTH
West Register (Hotels Number 3) Ltd OTH
West Register (Land) Ltd OTH
West Register (Northern Ireland) Property Ltd BF
West Register (Project Developments) Ltd BF
West Register (Property Investments) Ltd BF
West Register (Realisations) Ltd OTH
West Register (Residential Property Investments) Ltd OTH
West Register Hotels (Holdings) Ltd BF
Williams & Glyn Ltd BF
Williams & Glyn's Leasing Company Ltd OTH
Winchcombe Finance Ltd BF
WR (NI) Property Investments Ltd BF
WR (NI) Property Realisations Ltd OTH
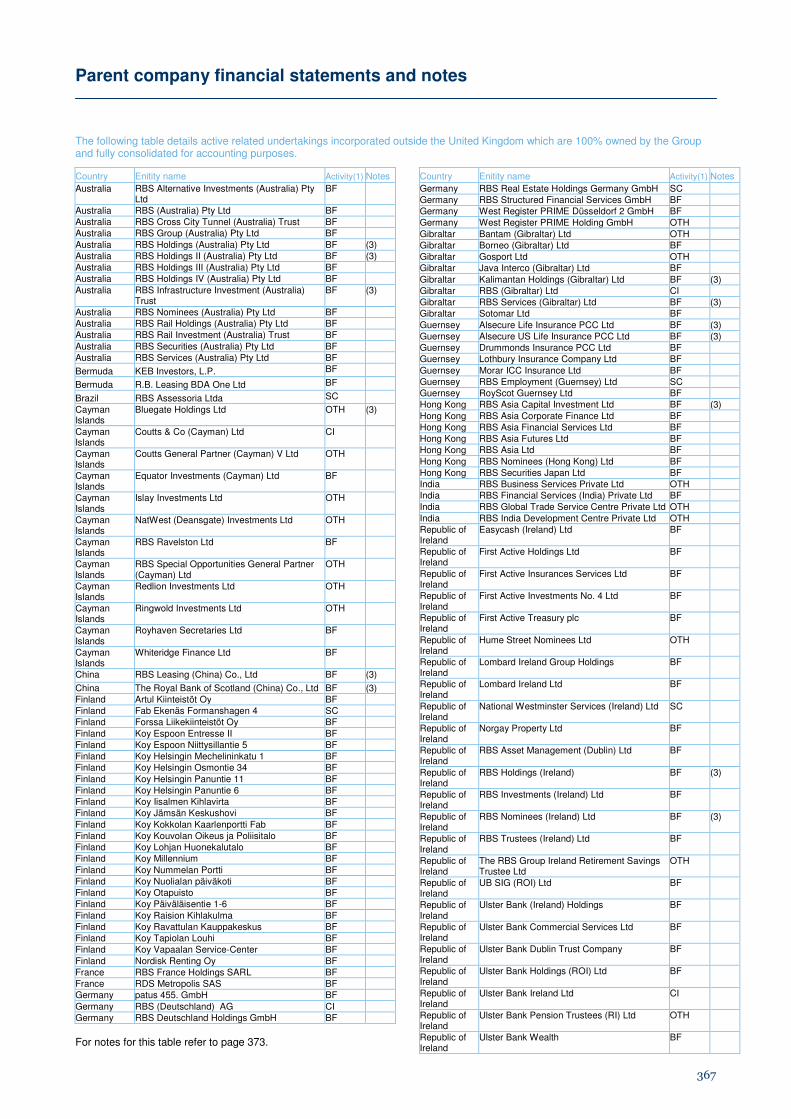
Parent company financial statements and notes
367
The following table details active related undertakings incorporated outside the United Kingdom which are 100% owned by the Group and fully consolidated for accounting purposes.
Country Enitity name Activity(1) Notes
Australia RBS Alternative Investments (Australia) Pty Ltd
BF
Australia RBS (Australia) Pty Ltd BF Australia RBS Cross City Tunnel (Australia) Trust BF Australia RBS Group (Australia) Pty Ltd BF Australia RBS Holdings (Australia) Pty Ltd BF (3) Australia RBS Holdings II (Australia) Pty Ltd BF (3) Australia RBS Holdings III (Australia) Pty Ltd BF Australia RBS Holdings IV (Australia) Pty Ltd BF Australia RBS Infrastructure Investment (Australia)
Trust BF (3)
Australia RBS Nominees (Australia) Pty Ltd BF Australia RBS Rail Holdings (Australia) Pty Ltd BF Australia RBS Rail Investment (Australia) Trust BF Australia RBS Securities (Australia) Pty Ltd BF Australia RBS Services (Australia) Pty Ltd BF
Bermuda KEB Investors, L.P. BF
Bermuda R.B. Leasing BDA One Ltd BF
Brazil RBS Assessoria Ltda SC
Cayman Islands
Bluegate Holdings Ltd OTH (3)
Cayman Islands
Coutts & Co (Cayman) Ltd CI
Cayman Islands
Coutts General Partner (Cayman) V Ltd OTH
Cayman Islands
Equator Investments (Cayman) Ltd BF
Cayman Islands
Islay Investments Ltd OTH
Cayman Islands
NatWest (Deansgate) Investments Ltd OTH
Cayman Islands
RBS Ravelston Ltd BF
Cayman Islands
RBS Special Opportunities General Partner (Cayman) Ltd
OTH
Cayman Islands
Redlion Investments Ltd OTH
Cayman Islands
Ringwold Investments Ltd OTH
Cayman Islands
Royhaven Secretaries Ltd BF
Cayman Islands
Whiteridge Finance Ltd BF
China RBS Leasing (China) Co., Ltd BF (3)
China The Royal Bank of Scotland (China) Co., Ltd BF (3) Finland Artul Kiinteistöt Oy BF Finland Fab Ekenäs Formanshagen 4 SC Finland Forssa Liikekiinteistöt Oy BF Finland Koy Espoon Entresse II BF Finland Koy Espoon Niittysillantie 5 BF Finland Koy Helsingin Mechelininkatu 1 BF Finland Koy Helsingin Osmontie 34 BF Finland Koy Helsingin Panuntie 11 BF Finland Koy Helsingin Panuntie 6 BF Finland Koy Iisalmen Kihlavirta BF Finland Koy Jämsän Keskushovi BF Finland Koy Kokkolan Kaarlenportti Fab BF Finland Koy Kouvolan Oikeus ja Poliisitalo BF Finland Koy Lohjan Huonekalutalo BF Finland Koy Millennium BF Finland Koy Nummelan Portti BF Finland Koy Nuolialan päiväkoti BF Finland Koy Otapuisto BF Finland Koy Päiväläisentie 1-6 BF Finland Koy Raision Kihlakulma BF Finland Koy Ravattulan Kauppakeskus BF Finland Koy Tapiolan Louhi BF Finland Koy Vapaalan Service-Center BF Finland Nordisk Renting Oy BF France RBS France Holdings SARL BF France RDS Metropolis SAS BF Germany patus 455. GmbH BF Germany RBS (Deutschland) AG CI Germany RBS Deutschland Holdings GmbH BF
For notes for this table refer to page 373.
Country Enitity name Activity(1) Notes
Germany RBS Real Estate Holdings Germany GmbH SC Germany RBS Structured Financial Services GmbH BF Germany West Register PRIME Düsseldorf 2 GmbH BF Germany West Register PRIME Holding GmbH OTH Gibraltar Bantam (Gibraltar) Ltd OTH Gibraltar Borneo (Gibraltar) Ltd BF Gibraltar Gosport Ltd OTH Gibraltar Java Interco (Gibraltar) Ltd BF Gibraltar Kalimantan Holdings (Gibraltar) Ltd BF (3) Gibraltar RBS (Gibraltar) Ltd CI Gibraltar RBS Services (Gibraltar) Ltd BF (3) Gibraltar Sotomar Ltd BF Guernsey Alsecure Life Insurance PCC Ltd BF (3) Guernsey Alsecure US Life Insurance PCC Ltd BF (3) Guernsey Drummonds Insurance PCC Ltd BF Guernsey Lothbury Insurance Company Ltd BF Guernsey Morar ICC Insurance Ltd BF Guernsey RBS Employment (Guernsey) Ltd SC Guernsey RoyScot Guernsey Ltd BF Hong Kong RBS Asia Capital Investment Ltd BF (3) Hong Kong RBS Asia Corporate Finance Ltd BF Hong Kong RBS Asia Financial Services Ltd BF Hong Kong RBS Asia Futures Ltd BF Hong Kong RBS Asia Ltd BF Hong Kong RBS Nominees (Hong Kong) Ltd BF Hong Kong RBS Securities Japan Ltd BF India RBS Business Services Private Ltd OTH India RBS Financial Services (India) Private Ltd BF India RBS Global Trade Service Centre Private Ltd OTH India RBS India Development Centre Private Ltd OTH Republic of Ireland
Easycash (Ireland) Ltd BF
Republic of Ireland
First Active Holdings Ltd BF
Republic of Ireland
First Active Insurances Services Ltd BF
Republic of Ireland
First Active Investments No. 4 Ltd BF
Republic of Ireland
First Active Treasury plc BF
Republic of Ireland
Hume Street Nominees Ltd OTH
Republic of Ireland
Lombard Ireland Group Holdings BF
Republic of Ireland
Lombard Ireland Ltd BF
Republic of Ireland
National Westminster Services (Ireland) Ltd SC
Republic of Ireland
Norgay Property Ltd BF
Republic of Ireland
RBS Asset Management (Dublin) Ltd BF
Republic of Ireland
RBS Holdings (Ireland) BF (3)
Republic of Ireland
RBS Investments (Ireland) Ltd BF
Republic of Ireland
RBS Nominees (Ireland) Ltd BF (3)
Republic of Ireland
RBS Trustees (Ireland) Ltd BF
Republic of Ireland
The RBS Group Ireland Retirement Savings Trustee Ltd
OTH
Republic of Ireland
UB SIG (ROI) Ltd BF
Republic of Ireland
Ulster Bank (Ireland) Holdings BF
Republic of Ireland
Ulster Bank Commercial Services Ltd BF
Republic of Ireland
Ulster Bank Dublin Trust Company BF
Republic of Ireland
Ulster Bank Holdings (ROI) Ltd BF
Republic of Ireland
Ulster Bank Ireland Ltd CI
Republic of Ireland
Ulster Bank Pension Trustees (RI) Ltd OTH
Republic of Ireland
Ulster Bank Wealth BF
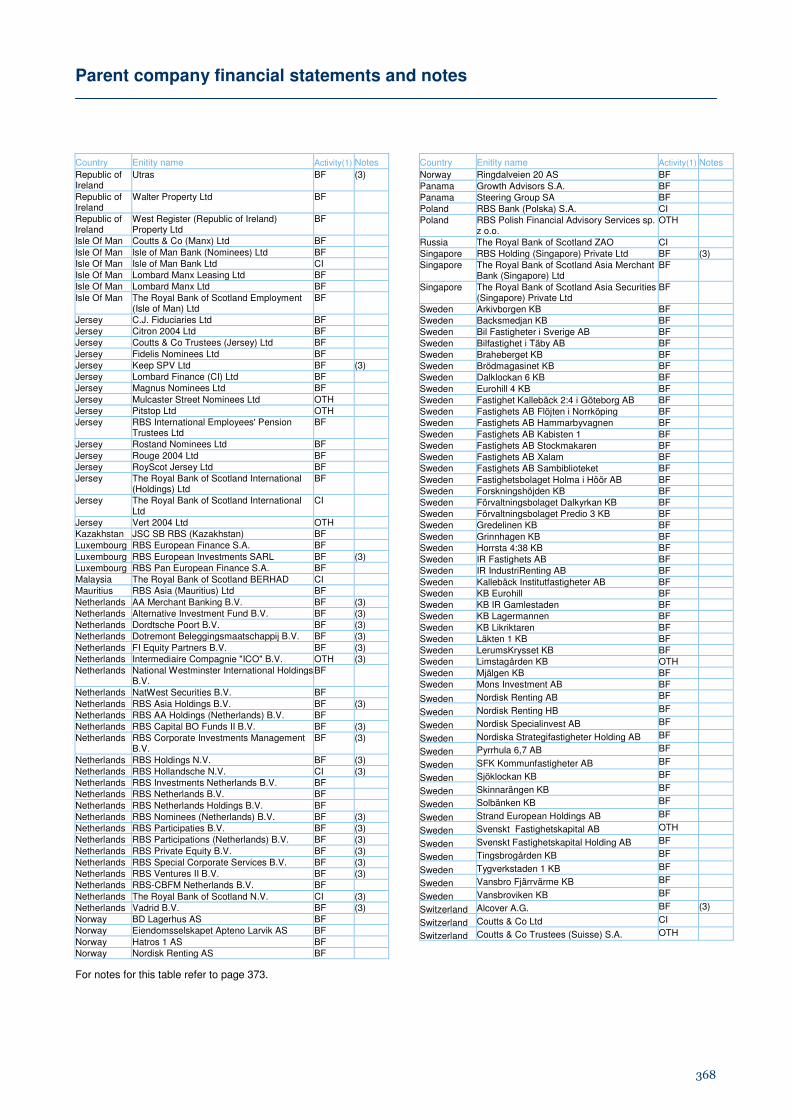
Parent company financial statements and notes
368
Country Enitity name Activity(1) Notes
Republic of Ireland
Utras BF (3)
Republic of Ireland
Walter Property Ltd BF
Republic of Ireland
West Register (Republic of Ireland) Property Ltd
BF
Isle Of Man Coutts & Co (Manx) Ltd BF Isle Of Man Isle of Man Bank (Nominees) Ltd BF Isle Of Man Isle of Man Bank Ltd CI Isle Of Man Lombard Manx Leasing Ltd BF Isle Of Man Lombard Manx Ltd BF Isle Of Man The Royal Bank of Scotland Employment
(Isle of Man) Ltd BF
Jersey C.J. Fiduciaries Ltd BF Jersey Citron 2004 Ltd BF Jersey Coutts & Co Trustees (Jersey) Ltd BF Jersey Fidelis Nominees Ltd BF Jersey Keep SPV Ltd BF (3) Jersey Lombard Finance (CI) Ltd BF Jersey Magnus Nominees Ltd BF Jersey Mulcaster Street Nominees Ltd OTH Jersey Pitstop Ltd OTH Jersey RBS International Employees' Pension
Trustees Ltd BF
Jersey Rostand Nominees Ltd BF Jersey Rouge 2004 Ltd BF Jersey RoyScot Jersey Ltd BF Jersey The Royal Bank of Scotland International
(Holdings) Ltd BF
Jersey The Royal Bank of Scotland International Ltd
CI
Jersey Vert 2004 Ltd OTH Kazakhstan JSC SB RBS (Kazakhstan) BF Luxembourg RBS European Finance S.A. BF Luxembourg RBS European Investments SARL BF (3) Luxembourg RBS Pan European Finance S.A. BF Malaysia The Royal Bank of Scotland BERHAD CI Mauritius RBS Asia (Mauritius) Ltd BF Netherlands AA Merchant Banking B.V. BF (3) Netherlands Alternative Investment Fund B.V. BF (3) Netherlands Dordtsche Poort B.V. BF (3) Netherlands Dotremont Beleggingsmaatschappij B.V. BF (3) Netherlands FI Equity Partners B.V. BF (3) Netherlands Intermediaire Compagnie "ICO" B.V. OTH (3) Netherlands National Westminster International Holdings
B.V. BF
Netherlands NatWest Securities B.V. BF Netherlands RBS Asia Holdings B.V. BF (3) Netherlands RBS AA Holdings (Netherlands) B.V. BF Netherlands RBS Capital BO Funds II B.V. BF (3) Netherlands RBS Corporate Investments Management
B.V. BF (3)
Netherlands RBS Holdings N.V. BF (3) Netherlands RBS Hollandsche N.V. CI (3) Netherlands RBS Investments Netherlands B.V. BF Netherlands RBS Netherlands B.V. BF Netherlands RBS Netherlands Holdings B.V. BF Netherlands RBS Nominees (Netherlands) B.V. BF (3) Netherlands RBS Participaties B.V. BF (3) Netherlands RBS Participations (Netherlands) B.V. BF (3) Netherlands RBS Private Equity B.V. BF (3) Netherlands RBS Special Corporate Services B.V. BF (3) Netherlands RBS Ventures II B.V. BF (3) Netherlands RBS-CBFM Netherlands B.V. BF Netherlands The Royal Bank of Scotland N.V. CI (3) Netherlands Vadrid B.V. BF (3) Norway BD Lagerhus AS BF Norway Eiendomsselskapet Apteno Larvik AS BF Norway Hatros 1 AS BF Norway Nordisk Renting AS BF
For notes for this table refer to page 373.
Country Enitity name Activity(1) Notes
Norway Ringdalveien 20 AS BF Panama Growth Advisors S.A. BF Panama Steering Group SA BF Poland RBS Bank (Polska) S.A. CI Poland RBS Polish Financial Advisory Services sp.
z o.o. OTH
Russia The Royal Bank of Scotland ZAO CI Singapore RBS Holding (Singapore) Private Ltd BF (3) Singapore The Royal Bank of Scotland Asia Merchant
Bank (Singapore) Ltd BF
Singapore The Royal Bank of Scotland Asia Securities (Singapore) Private Ltd
BF
Sweden Arkivborgen KB BF Sweden Backsmedjan KB BF Sweden Bil Fastigheter i Sverige AB BF Sweden Bilfastighet i Täby AB BF Sweden Braheberget KB BF Sweden Brödmagasinet KB BF Sweden Dalklockan 6 KB BF Sweden Eurohill 4 KB BF Sweden Fastighet Kallebäck 2:4 i Göteborg AB BF Sweden Fastighets AB Flöjten i Norrköping BF Sweden Fastighets AB Hammarbyvagnen BF Sweden Fastighets AB Kabisten 1 BF Sweden Fastighets AB Stockmakaren BF Sweden Fastighets AB Xalam BF Sweden Fastighets AB Sambiblioteket BF Sweden Fastighetsbolaget Holma i Höör AB BF Sweden Forskningshöjden KB BF Sweden Förvaltningsbolaget Dalkyrkan KB BF Sweden Förvaltningsbolaget Predio 3 KB BF Sweden Gredelinen KB BF Sweden Grinnhagen KB BF Sweden Horrsta 4:38 KB BF Sweden IR Fastighets AB BF Sweden IR IndustriRenting AB BF Sweden Kallebäck Institutfastigheter AB BF Sweden KB Eurohill BF Sweden KB IR Gamlestaden BF Sweden KB Lagermannen BF Sweden KB Likriktaren BF Sweden Läkten 1 KB BF Sweden LerumsKrysset KB BF Sweden Limstagården KB OTH Sweden Mjälgen KB BF Sweden Mons Investment AB BF
Sweden Nordisk Renting AB BF
Sweden Nordisk Renting HB BF
Sweden Nordisk Specialinvest AB BF
Sweden Nordiska Strategifastigheter Holding AB BF
Sweden Pyrrhula 6,7 AB BF
Sweden SFK Kommunfastigheter AB BF
Sweden Sjöklockan KB BF
Sweden Skinnarängen KB BF
Sweden Solbänken KB BF
Sweden Strand European Holdings AB BF
Sweden Svenskt Fastighetskapital AB OTH
Sweden Svenskt Fastighetskapital Holding AB BF
Sweden Tingsbrogården KB BF
Sweden Tygverkstaden 1 KB BF
Sweden Vansbro Fjärrvärme KB BF
Sweden Vansbroviken KB BF
Switzerland Alcover A.G. BF (3)
Switzerland Coutts & Co Ltd CI
Switzerland Coutts & Co Trustees (Suisse) S.A. OTH

Parent company financial statements and notes
369
Country Enitity name Activity(1) Notes
Switzerland RBS Services (Switzerland) Ltd OTH
United Arab
Emirates
RBS Operations FZ LLC SC
United States Candlelight Acquisition LLC OTH
United States Communications Capital Group I, LLC BF
United States Communications Capital Group II, LLC BF
United States Financial Asset Securities Corp. BF
United States Gil Holdings LLC BF
United States Governor Acquisition Company, LLC OTH
United States Greenwich Capital Derivatives, Inc. BF
United States Harborview Commercial Holdings I, LLC BF
United States Kelts LLC BF
United States Lease Plan North America LLC BF
United States NatWest Group Holdings Corp BF
United States Random Properties Acquisition Corp. I OTH
United States Random Properties Acquisition Corp. II OTH
United States Random Properties Acquisition Corp. III OTH
For notes for this table refer to page 373.
Country Enitity name Activity(1) Notes
United States Random Properties Acquisition Corp. IV OTH
United States RBS Acceptance Inc. CI
United States RBS Americas Property Corp. SC
United States RBS Commercial Funding Inc. BF
United States RBS Equity Corp BF
United States RBS Financial Products Inc. BF
United States RBS Holdings USA Inc. BF
United States RBS Investments USA Corp. BF
United States RBS Securities Inc. BF
United States RBS Smart Products Inc BF
United States RBS WCS Holding Company BF (3)
United States Rimfort Corp BF
United States Surprise Acquisition Company, LLC OTH
Virgin
Islands,
British
Action Corporate Services Ltd BF
Virgin
Islands,
British
Fountainhead Consultants Ltd BF
Virgin
Islands,
British
JMJ Holdings Ltd BF
The following table details active related undertakings incorporated in the United Kingdom where the Group ownership is less than 100%.
Enitity name Activity(1) Accounting treatment(2)
Group interest % Notes
Adam & Company General Partner Ltd
BF IA 50
Aspire Oil Services Ltd BF EAA 28 Attraction Inns Ltd BF IA 30 Ballymore (London Arena) Ltd OTH IA 45 Big Society Capital Ltd OTH IA 10 (4) Business Growth Fund plc BF EAA 24 Cala Campus Ltd OTH EAJV 50 CFN Packaging Group Ltd OTH IA 25 Cloud Electronics Holdings Ltd BF IA 20 Coneworx Ltd OTH IA 40 DF Ventures Ltd BF IA 20 Entaco Group Ltd BF IA 33 Ferrostatics Holdings Ltd BF IA 35 Flats 4 U Ltd OTH IA 30 Forest Garden Group Ltd OTH IA 28 GATX Asset Residual Management Ltd
OTH EAA 50
GWNW City Developments Ltd OTH EAJV 50 Higher Broughton (GP) Ltd BF EAA 41 Isobel AssetCo Ltd SC FC 75 Isobel EquityCo Ltd BF FC 75 Isobel HoldCo Ltd BF FC 75 Isobel Intermediate HoldCo Ltd BF FC 75 Isobel Loan Capital Ltd BF FC 75 Isobel Mezzanine Borrower Ltd BF FC 75 Jaguar Cars Finance Ltd BF FC 50 JCB Finance (Leasing) Ltd BF FC 75 JCB Finance Ltd BF FC 75 Kangaroo Holdings Ltd BF IA 42 (5) Land Options (East) Ltd BF EAJV 50 Lombard GATX Holdings Ltd BF EAJV 50 MSW Ltd OTH IA 20 Omega Warrington Ltd OTH EAJV 50
For notes to this table refer to page 373.
Enitity name Activity(1) Accounting treatment(2)
Group interest % Notes
Pad55 Pickering Commonhold Association Ltd
OTH FC 94
Pollokshields Developments Ltd OTH IA 49 Prestige Walker Ltd OTH IA 30 Race 500 Ltd BF IA 21 RBS Covered Bonds (LM) Ltd BF IA 20 RBS Covered Bonds LLP BF FC 99 RBS Secured Funding (LM) Ltd BF FC 20 (6) RBS Sempra Commodities LLP BF FC 51 RBS Sempra Products Ltd OTH FC 51 Salwan Pharmacy Ltd OTH IA 20 Star Capital Partners Investments LLP
BF IA 40
Sutherland Trading Company Ltd
OTH IA 25
Tay Valley Lighting (Leeds) Ltd OTH EAJV 50 Tay Valley Lighting (Newcastle and North Tyneside) Ltd
OTH EAJV 50
Tay Valley Lighting (Stoke on Trent) Ltd
OTH EAJV 50
Telford Homes (Stratford) Ltd OTH EAJV 50 The Appeal Group Ltd OTH IA 25 The Scottish Agricultural Securities Corporation P.L.C.
BF IA 33
The Storage Pod Ltd OTH IA 48 Topco (No1) Ltd OTH IA 45 Uniconn Ltd OTH IA 30 Vocalink Holdings Ltd BF EAA 21 Wealdland Ltd OTH IA 29 Welsh Industrial Partnership (GP) Ltd
BF FC 51
Yorkmarsh Ltd BF IA 30
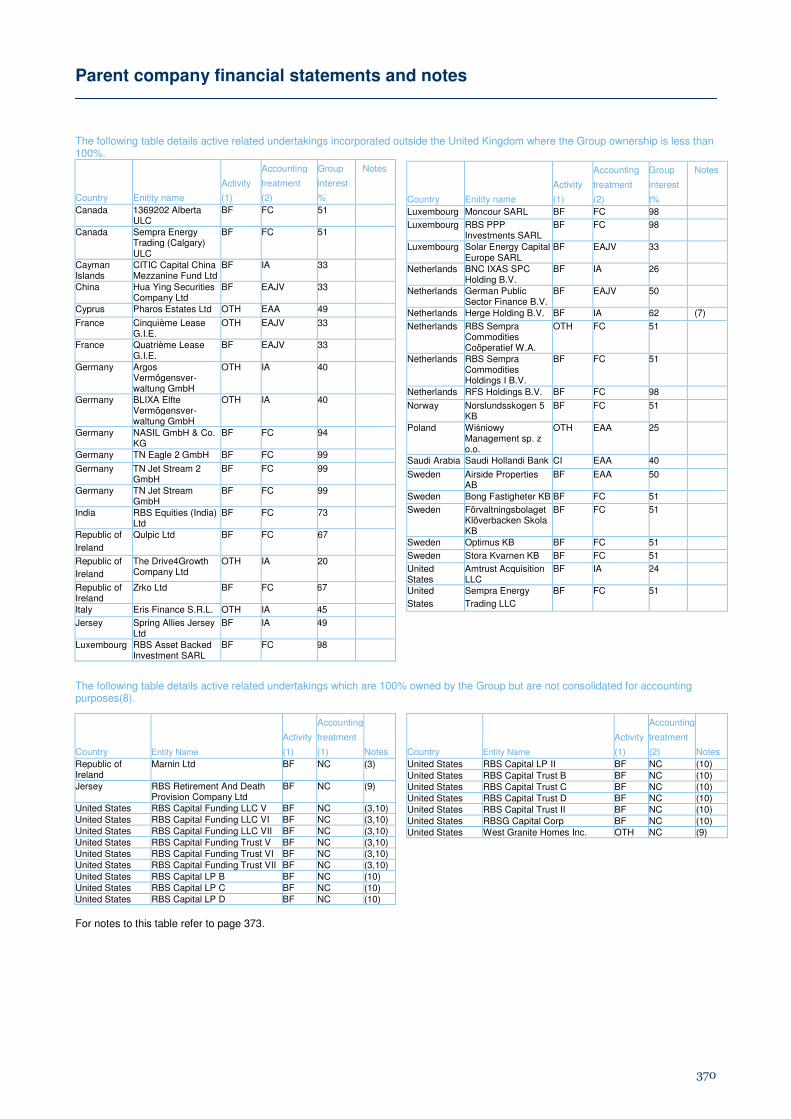
Parent company financial statements and notes
370
The following table details active related undertakings incorporated outside the United Kingdom where the Group ownership is less than 100%.
Country Enitity name
Activity
(1)
Accounting
treatment
(2)
Group
interest
%
Notes
Canada 1369202 Alberta ULC
BF FC 51
Canada Sempra Energy Trading (Calgary) ULC
BF FC 51
Cayman Islands
CITIC Capital China Mezzanine Fund Ltd
BF IA 33
China Hua Ying Securities Company Ltd
BF EAJV 33
Cyprus Pharos Estates Ltd OTH EAA 49
France Cinquième Lease G.I.E.
OTH EAJV 33
France Quatrième Lease G.I.E.
BF EAJV 33
Germany Argos Vermögensver-waltung GmbH
OTH IA 40
Germany BLIXA Elfte Vermögensver-waltung GmbH
OTH IA 40
Germany NASIL GmbH & Co. KG
BF FC 94
Germany TN Eagle 2 GmbH BF FC 99
Germany TN Jet Stream 2 GmbH
BF FC 99
Germany TN Jet Stream GmbH
BF FC 99
India RBS Equities (India) Ltd
BF FC 73
Republic of
Ireland
Qulpic Ltd BF FC 67
Republic of
Ireland
The Drive4Growth Company Ltd
OTH IA 20
Republic of Ireland
Zrko Ltd BF FC 67
Italy Eris Finance S.R.L. OTH IA 45
Jersey Spring Allies Jersey Ltd
BF IA 49
Luxembourg RBS Asset Backed Investment SARL
BF FC 98
Country Enitity name
Activity
(1)
Accounting
treatment
(2)
Group
interest
t%
Notes
Luxembourg Moncour SARL BF FC 98
Luxembourg RBS PPP Investments SARL
BF FC 98
Luxembourg Solar Energy Capital Europe SARL
BF EAJV 33
Netherlands BNC IXAS SPC Holding B.V.
BF IA 26
Netherlands German Public Sector Finance B.V.
BF EAJV 50
Netherlands Herge Holding B.V. BF IA 62 (7)
Netherlands RBS Sempra Commodities Coöperatief W.A.
OTH FC 51
Netherlands RBS Sempra Commodities Holdings I B.V.
BF FC 51
Netherlands RFS Holdings B.V. BF FC 98
Norway Norslundsskogen 5 KB
BF FC 51
Poland Wiśniowy Management sp. z o.o.
OTH EAA 25
Saudi Arabia Saudi Hollandi Bank CI EAA 40
Sweden Airside Properties AB
BF EAA 50
Sweden Bong Fastigheter KB BF FC 51
Sweden Förvaltningsbolaget Klöverbacken Skola KB
BF FC 51
Sweden Optimus KB BF FC 51
Sweden Stora Kvarnen KB BF FC 51
United States
Amtrust Acquisition LLC
BF IA 24
United
States
Sempra Energy
Trading LLC
BF FC 51
The following table details active related undertakings which are 100% owned by the Group but are not consolidated for accounting purposes(8).
Country Entity Name
Activity
(1)
Accounting
treatment
(1) Notes
Republic of Ireland
Marnin Ltd BF NC (3)
Jersey RBS Retirement And Death Provision Company Ltd
BF NC (9)
United States RBS Capital Funding LLC V BF NC (3,10) United States RBS Capital Funding LLC VI BF NC (3,10) United States RBS Capital Funding LLC VII BF NC (3,10) United States RBS Capital Funding Trust V BF NC (3,10) United States RBS Capital Funding Trust VI BF NC (3,10) United States RBS Capital Funding Trust VII BF NC (3,10) United States RBS Capital LP B BF NC (10) United States RBS Capital LP C BF NC (10) United States RBS Capital LP D BF NC (10)
For notes to this table refer to page 373.
Country Entity Name
Activity
(1)
Accounting
treatment
(2) Notes
United States RBS Capital LP II BF NC (10) United States RBS Capital Trust B BF NC (10) United States RBS Capital Trust C BF NC (10) United States RBS Capital Trust D BF NC (10) United States RBS Capital Trust II BF NC (10) United States RBSG Capital Corp BF NC (10) United States West Granite Homes Inc. OTH NC (9)
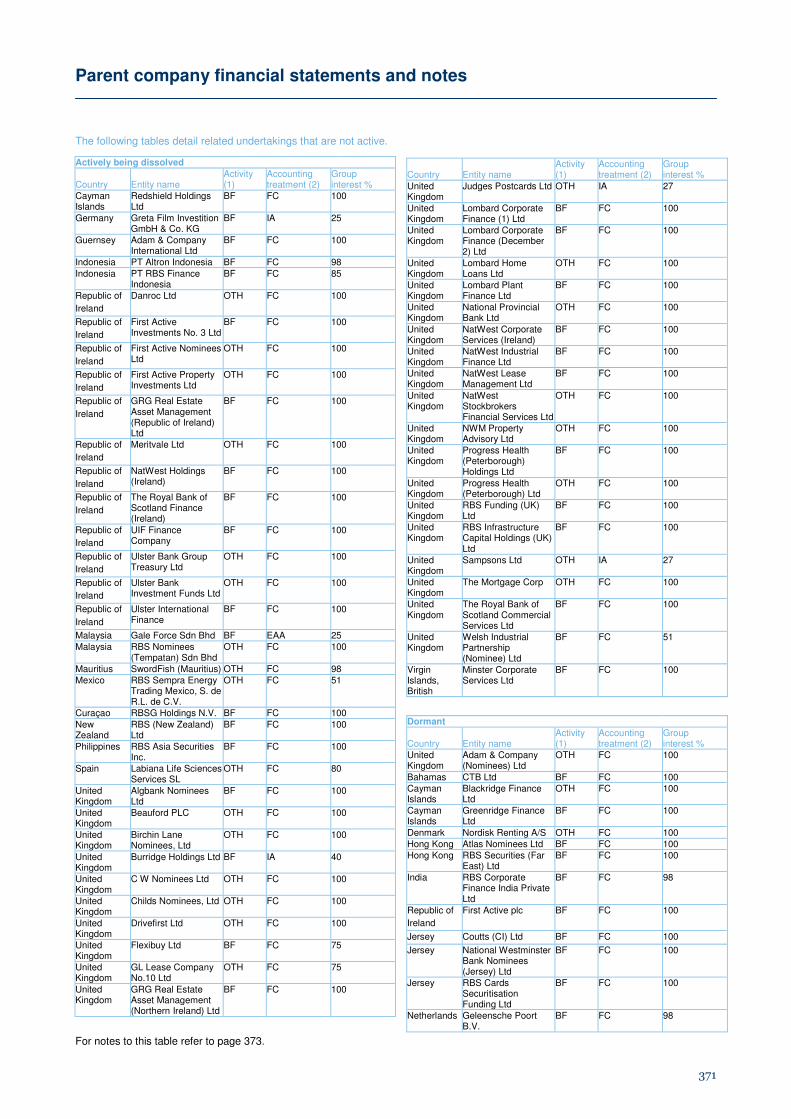
Parent company financial statements and notes
371
The following tables detail related undertakings that are not active.
Actively being dissolved
Country Entity name Activity (1)
Accounting treatment (2)
Group interest %
Cayman Islands
Redshield Holdings Ltd
BF FC 100
Germany Greta Film Investition GmbH & Co. KG
BF IA 25
Guernsey Adam & Company International Ltd
BF FC 100
Indonesia PT Altron Indonesia BF FC 98 Indonesia PT RBS Finance
Indonesia BF FC 85
Republic of
Ireland
Danroc Ltd OTH FC 100
Republic of
Ireland
First Active Investments No. 3 Ltd
BF FC 100
Republic of
Ireland
First Active Nominees Ltd
OTH FC 100
Republic of
Ireland
First Active Property Investments Ltd
OTH FC 100
Republic of
Ireland
GRG Real Estate Asset Management (Republic of Ireland) Ltd
BF FC 100
Republic of
Ireland
Meritvale Ltd OTH FC 100
Republic of
Ireland
NatWest Holdings (Ireland)
BF FC 100
Republic of
Ireland
The Royal Bank of Scotland Finance (Ireland)
BF FC 100
Republic of
Ireland
UIF Finance Company
BF FC 100
Republic of
Ireland
Ulster Bank Group Treasury Ltd
OTH FC 100
Republic of
Ireland
Ulster Bank Investment Funds Ltd
OTH FC 100
Republic of
Ireland
Ulster International Finance
BF FC 100
Malaysia Gale Force Sdn Bhd BF EAA 25 Malaysia RBS Nominees
(Tempatan) Sdn Bhd OTH FC 100
Mauritius SwordFish (Mauritius) OTH FC 98 Mexico RBS Sempra Energy
Trading Mexico, S. de R.L. de C.V.
OTH FC 51
Curaçao RBSG Holdings N.V. BF FC 100 New Zealand
RBS (New Zealand) Ltd
BF FC 100
Philippines RBS Asia Securities Inc.
BF FC 100
Spain Labiana Life Sciences Services SL
OTH FC 80
United Kingdom
Algbank Nominees Ltd
BF FC 100
United Kingdom
Beauford PLC OTH FC 100
United Kingdom
Birchin Lane Nominees, Ltd
OTH FC 100
United Kingdom
Burridge Holdings Ltd BF IA 40
United Kingdom
C W Nominees Ltd OTH FC 100
United Kingdom
Childs Nominees, Ltd OTH FC 100
United Kingdom
Drivefirst Ltd OTH FC 100
United Kingdom
Flexibuy Ltd BF FC 75
United Kingdom
GL Lease Company No.10 Ltd
OTH FC 75
United Kingdom
GRG Real Estate Asset Management (Northern Ireland) Ltd
BF FC 100
For notes to this table refer to page 373.
Country Entity name Activity (1)
Accounting treatment (2)
Group interest %
United Kingdom
Judges Postcards Ltd OTH IA 27
United Kingdom
Lombard Corporate Finance (1) Ltd
BF FC 100
United Kingdom
Lombard Corporate Finance (December 2) Ltd
BF FC 100
United Kingdom
Lombard Home Loans Ltd
OTH FC 100
United Kingdom
Lombard Plant Finance Ltd
BF FC 100
United Kingdom
National Provincial Bank Ltd
OTH FC 100
United Kingdom
NatWest Corporate Services (Ireland)
BF FC 100
United Kingdom
NatWest Industrial Finance Ltd
BF FC 100
United Kingdom
NatWest Lease Management Ltd
BF FC 100
United Kingdom
NatWest Stockbrokers Financial Services Ltd
OTH FC 100
United Kingdom
NWM Property Advisory Ltd
OTH FC 100
United Kingdom
Progress Health (Peterborough) Holdings Ltd
BF FC 100
United Kingdom
Progress Health (Peterborough) Ltd
OTH FC 100
United Kingdom
RBS Funding (UK) Ltd
BF FC 100
United Kingdom
RBS Infrastructure Capital Holdings (UK) Ltd
BF FC 100
United Kingdom
Sampsons Ltd OTH IA 27
United Kingdom
The Mortgage Corp OTH FC 100
United Kingdom
The Royal Bank of Scotland Commercial Services Ltd
BF FC 100
United Kingdom
Welsh Industrial Partnership (Nominee) Ltd
BF FC 51
Virgin Islands, British
Minster Corporate Services Ltd
BF FC 100
Dormant
Country Entity name Activity (1)
Accounting treatment (2)
Group interest %
United Kingdom
Adam & Company (Nominees) Ltd
OTH FC 100
Bahamas CTB Ltd BF FC 100 Cayman Islands
Blackridge Finance Ltd
OTH FC 100
Cayman Islands
Greenridge Finance Ltd
BF FC 100
Denmark Nordisk Renting A/S OTH FC 100 Hong Kong Atlas Nominees Ltd BF FC 100 Hong Kong RBS Securities (Far
East) Ltd BF FC 100
India RBS Corporate Finance India Private Ltd
BF FC 98
Republic of
Ireland
First Active plc BF FC 100
Jersey Coutts (CI) Ltd BF FC 100
Jersey National Westminster Bank Nominees (Jersey) Ltd
BF FC 100
Jersey RBS Cards Securitisation Funding Ltd
BF FC 100
Netherlands Geleensche Poort B.V.
BF FC 98

Parent company financial statements and notes
372
Country Entity name Activity (1)
Accounting treatment (2)
Group interest %
Netherlands Global Infranet B.V. OTH FC 98 Netherlands Gorkumsche Poort
B.V. BF FC 98
Sweden Mons AB OTH FC 100 Sweden Nordisk Renting
Facilities Management AB
OTH FC 100
Sweden Nordisk Renting Kapital AB
BF FC 100
Sweden Svenskt Energikapital AB
BF FC 100
United Kingdom
Acre 146 Ltd BF FC 100
United Kingdom
Beveltop Ltd BF FC 100
United Kingdom
Blydenstein Nominees Ltd
BF FC 100
United Kingdom
British Overseas Bank Nominees Ltd
OTH FC 100
United Kingdom
Buchanan Holdings Ltd
BF FC 100
United Kingdom
CNW Group Ltd BF FC 100
United Kingdom
CNW Nominees Ltd OTH FC 100
United Kingdom
Cornhill Holdings Ltd BF FC 100
United Kingdom
Coutts Group OTH FC 100
United Kingdom
CTL Nominees Ltd OTH FC 100
United Kingdom
District Bank Ltd OTH FC 100
United Kingdom
Dixon Motorcycle Holdings Ltd
BF FC 100
United Kingdom
Dixon Vehicle Sales Ltd
OTH FC 100
United Kingdom
Dormaco (No.12) Ltd OTH FC 100
United Kingdom
Doublemere Ltd OTH FC 100
United Kingdom
Dunfly Trustee Ltd OTH FC 100
United Kingdom
Ecosse Regeneration Ltd
OTH FC 100
United Kingdom
Emperor Holdings Ltd OTH FC 100
United Kingdom
FIT Nominee Ltd OTH FC 100
United Kingdom
FIT Nominee 2 Ltd BF FC 100
United Kingdom
Freehold Managers (Nominees) Ltd
OTH FC 100
United Kingdom
Glyns Nominees Ltd OTH FC 100
United Kingdom
Greenwich NatWest Ltd
BF FC 100
United Kingdom
Honroe (UK) Ltd BF FC 100
United Kingdom
JCB Credit Ltd OTH FC 75
United Kingdom
JCB Finance Pension Ltd
BF FC 88
United Kingdom
Landpower Leasing Ltd
BF FC 75
United Kingdom
Lombard Bank OTH FC 100
United Kingdom
Lombard North Central Wheelease Ltd
BF FC 100
United Kingdom
London Office Royal Bank of Scotland Nominees Ltd
OTH FC 100
For notes to this table refer to page 373.
Country Entity name Activity (1)
Accounting treatment (2)
Group interest %
United Kingdom
Lothbury Property Trust Company Ltd
OTH FC 100
United Kingdom
Marigold Nominees Ltd
OTH FC 100
United Kingdom
Motorsport Dealers International Ltd
BF FC 100
United Kingdom
N.C. Head Office Nominees Ltd
SC FC 100
United Kingdom
N.C. Securities Ltd OTH FC 100
United Kingdom
National Westminster Ltd
BF FC 100
United Kingdom
NatWest Aerospace Trust Company Ltd
BF FC 100
United Kingdom
NatWest FIS Nominees Ltd
OTH FC 100
United Kingdom
NatWest Invoice Finance Ltd
BF FC 100
United Kingdom
NatWest Nominees Ltd
OTH FC 100
United Kingdom
NatWest PEP Nominees Ltd
OTH FC 100
United Kingdom
NatWest Security Trustee Company Ltd
OTH FC 100
United Kingdom
North Central Finance Ltd
OTH FC 100
United Kingdom
Pensman Nominees Ltd
OTH FC 100
United Kingdom
Project & Export Finance (Nominees) Ltd
OTH FC 100
United Kingdom
Pulley’s Nominees Ltd
SC FC 100
United Kingdom
Quoted UK Ltd BF FC 100
United Kingdom
R.B.S. Property (Greenock) Ltd
OTH FC 100
United Kingdom
Raingrove Ltd BF FC 100
United Kingdom
RB Investments 5 Ltd BF FC 100
United Kingdom
RBOS Indices Ltd OTH FC 100
United Kingdom
RBOS Nominees Ltd OTH FC 100
United Kingdom
RBOS Trustees Ltd BF FC 100
United Kingdom
RBS CIF Trustee Ltd OTH FC 100
United Kingdom
RBS Health Trustee (UK) Ltd
SC FC 100
United Kingdom
RBS Investment Executive Ltd
OTH NC 100
United Kingdom
RBS Pension Trustee Ltd
OTH NC 100
United Kingdom
RBS Residential Venture No.2 Ltd
OTH FC 100
United Kingdom
RBS Retirement Savings Trustee Ltd
OTH FC 100
United Kingdom
RBS Secretarial Services Ltd
OTH FC 100
United Kingdom
RBS Shelf Nominees Ltd
BF FC 100
United Kingdom
RBS Trustees Ltd BF FC 100
United Kingdom
RBSG Collective Investments Nominees Ltd
BF FC 100
United Kingdom
Riossi Motorcycles Ltd
OTH FC 100
United Kingdom
RoboScot (64) Ltd OTH FC 100
United Kingdom
Rover Finance Holdings Ltd
BF FC 100
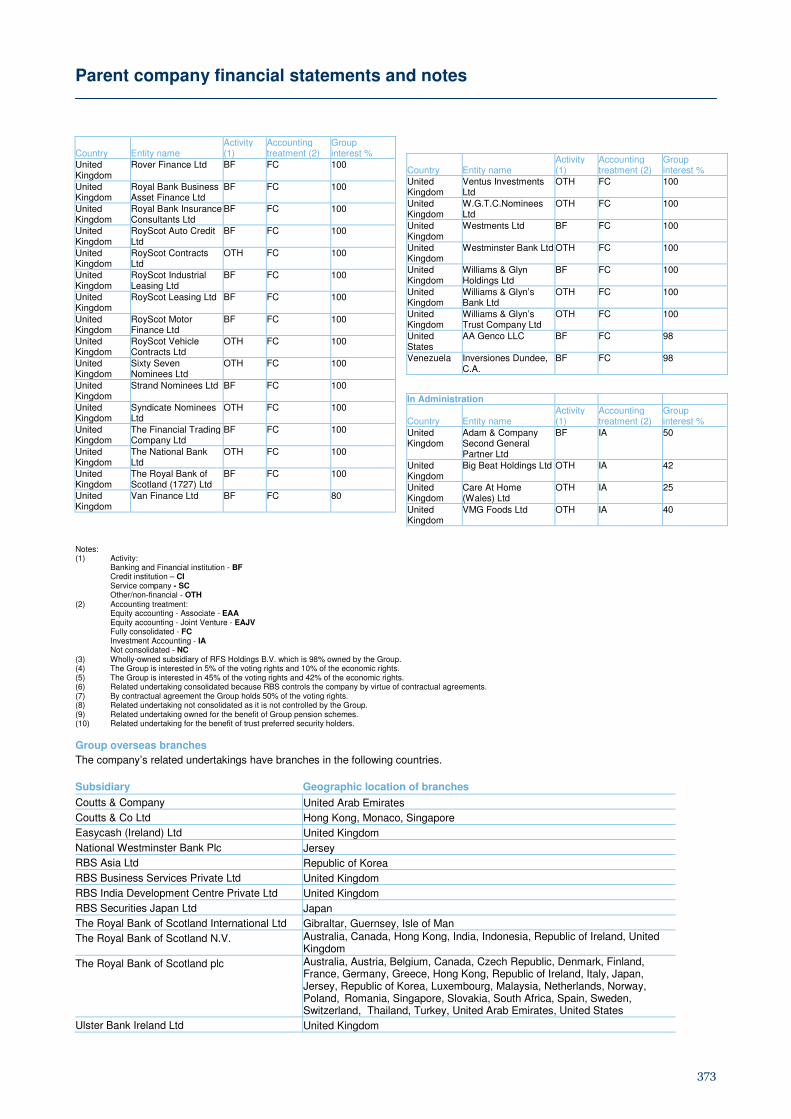
Parent company financial statements and notes
373
Country Entity name Activity (1)
Accounting treatment (2)
Group interest %
United Kingdom
Rover Finance Ltd BF FC 100
United Kingdom
Royal Bank Business Asset Finance Ltd
BF FC 100
United Kingdom
Royal Bank Insurance Consultants Ltd
BF FC 100
United Kingdom
RoyScot Auto Credit Ltd
BF FC 100
United Kingdom
RoyScot Contracts Ltd
OTH FC 100
United Kingdom
RoyScot Industrial Leasing Ltd
BF FC 100
United Kingdom
RoyScot Leasing Ltd BF FC 100
United Kingdom
RoyScot Motor Finance Ltd
BF FC 100
United Kingdom
RoyScot Vehicle Contracts Ltd
OTH FC 100
United Kingdom
Sixty Seven Nominees Ltd
OTH FC 100
United Kingdom
Strand Nominees Ltd BF FC 100
United Kingdom
Syndicate Nominees Ltd
OTH FC 100
United Kingdom
The Financial Trading Company Ltd
BF FC 100
United Kingdom
The National Bank Ltd
OTH FC 100
United Kingdom
The Royal Bank of Scotland (1727) Ltd
BF FC 100
United Kingdom
Van Finance Ltd BF FC 80
Country Entity name Activity (1)
Accounting treatment (2)
Group interest %
United Kingdom
Ventus Investments Ltd
OTH FC 100
United Kingdom
W.G.T.C.Nominees Ltd
OTH FC 100
United Kingdom
Westments Ltd BF FC 100
United Kingdom
Westminster Bank Ltd OTH FC 100
United Kingdom
Williams & Glyn Holdings Ltd
BF FC 100
United Kingdom
Williams & Glyn’s Bank Ltd
OTH FC 100
United Kingdom
Williams & Glyn’s Trust Company Ltd
OTH FC 100
United States
AA Genco LLC BF FC 98
Venezuela Inversiones Dundee, C.A.
BF FC 98
In Administration
Country Entity name Activity (1)
Accounting treatment (2)
Group interest %
United Kingdom
Adam & Company Second General Partner Ltd
BF IA 50
United Kingdom
Big Beat Holdings Ltd OTH IA 42
United Kingdom
Care At Home (Wales) Ltd
OTH IA 25
United Kingdom
VMG Foods Ltd OTH IA 40
Notes: (1) Activity:
Banking and Financial institution - BF Credit institution – CI Service company - SC Other/non-financial - OTH
(2) Accounting treatment: Equity accounting - Associate - EAA Equity accounting - Joint Venture - EAJV Fully consolidated - FC Investment Accounting - IA Not consolidated - NC
(3) Wholly-owned subsidiary of RFS Holdings B.V. which is 98% owned by the Group. (4) The Group is interested in 5% of the voting rights and 10% of the economic rights. (5) The Group is interested in 45% of the voting rights and 42% of the economic rights. (6) Related undertaking consolidated because RBS controls the company by virtue of contractual agreements. (7) By contractual agreement the Group holds 50% of the voting rights. (8) Related undertaking not consolidated as it is not controlled by the Group. (9) Related undertaking owned for the benefit of Group pension schemes. (10) Related undertaking for the benefit of trust preferred security holders.
Group overseas branches
The company’s related undertakings have branches in the following countries.
Subsidiary Geographic location of branches
Coutts & Company United Arab Emirates
Coutts & Co Ltd Hong Kong, Monaco, Singapore
Easycash (Ireland) Ltd United Kingdom
National Westminster Bank Plc Jersey
RBS Asia Ltd Republic of Korea
RBS Business Services Private Ltd United Kingdom
RBS India Development Centre Private Ltd United Kingdom
RBS Securities Japan Ltd Japan
The Royal Bank of Scotland International Ltd Gibraltar, Guernsey, Isle of Man
The Royal Bank of Scotland N.V. Australia, Canada, Hong Kong, India, Indonesia, Republic of Ireland, United Kingdom
The Royal Bank of Scotland plc Australia, Austria, Belgium, Canada, Czech Republic, Denmark, Finland, France, Germany, Greece, Hong Kong, Republic of Ireland, Italy, Japan, Jersey, Republic of Korea, Luxembourg, Malaysia, Netherlands, Norway, Poland, Romania, Singapore, Slovakia, South Africa, Spain, Sweden, Switzerland, Thailand, Turkey, United Arab Emirates, United States
Ulster Bank Ireland Ltd United Kingdom