financial transaction taxes in theory and practice · financial transaction taxes in theory and...
TRANSCRIPT
FINANCIAL TRANSACTION TAXES IN THEORY AND PRACTICELeonard E. Burman, William G. Gale, Sarah Gault, Bryan Kim, Jim Nunns, and Steve RosenthalJune 2015
DISCUSSION DRAFT - COMMENTS WELCOME

Acknowledgments 1
Section 1: Introduction 2
Section 2: Background 5
FTT Defined 5
History of FTTs in the United States 5
Experience in Other Countries 6
Proposed FTTs 10
Other Taxes on the Financial Sector 12
Section 3: Design Issues 14
Section 4: The Financial Sector and Market Failure 19
Size of the Financial Sector 19
Systemic Risk 21
High-Frequency Trading and Flash Trading 22
Noise Trading 23
Section 5: Effects of an FTT 24
Trading Volume and Speculation 24
Liquidity 26
Price Discovery 27
Asset Price Volatility 28
Asset Prices and the Cost of Capital 29
Cascading and Intersectoral Distortions 30
Administrative and Compliance Costs 32
Section 6: New Revenue and Distributional Estimates 33
Modeling Issues 33
Revenue Effects 34
Distributional Effects 36
Section 7: Conclusion 39
Appendix A 40
References 43
CONTENTS

TAX POLICY CENTER | URBAN INSTITUTE & BROOKINGS INSTITUTION 1
ACKNOWLEDGMENTS
Burman, Gault, Nunns, and Rosenthal: Urban Institute; Gale and Kim:
Brookings Institution. Please send comments to [email protected] or
[email protected]. We thank Donald Marron and Thornton Matheson
for helpful comments and discussions, Elaine Eldridge and Elizabeth Forney
for editorial assistance, Lydia Austin and Joanna Teitelbaum for preparing
the document for publication, and the Laura and John Arnold Foundation
for funding this work.
The findings and conclusions contained within are solely the responsibility
of the authors and do not necessarily reflect positions or policies of the
Tax Policy Center, the Urban Institute, the Brookings Institution, or their
funders.

TAX POLICY CENTER | URBAN INSTITUTE & BROOKINGS INSTITUTION 2
The Great Recession, which is largely thought to be due to financial market failures, has prompted renewed calls for a financial transactions tax (FTT) to discourage excessive risk taking and recoup the costs of the crisis. The chorus of FTT advocates includes Bill Gates, Jr., George Soros, and Pope Benedict XVI (Greenhouse and Bowley 2011). The idea is not new, however. Keynes proposed an FTT in 1936 as a way to discourage the kind of speculation that fueled the stock market bubble that led to the Great Depression. More recently, leading economists Tobin (1978), Stiglitz (1989), and Summers and Summers (1989) have advocated similar taxes.
Taxes on financial transactions have a long history. The British stamp duty was enacted in 1694 and remains in effect today. The United States imposed a nontrivial stock transactions tax from 1914 to 1965, as did New York State from 1905 to 1981. An extremely small securities transfer tax currently funds the Securities and Exchange Commission (SEC). FTTs have long been popular in less developed countries as a way to raise significant revenue from a small number of relatively sophisticated financial entities.
The FTT is experiencing a resurgence in the developed world. Eleven European Union (EU) countries have agreed to enact a coordinated FTT that is scheduled to go into effect in January 2016 (assuming participant countries can work out some significant differences). France adopted an FTT in 2012 that will be integrated with the EU tax if and when it takes effect. In the United States, several recent Congressional proposals for FTTs have been introduced by Representative Peter DeFazio (D-OR) and Senator Tom Harkin (D-IA), by Representative Keith Ellison (D-MN), and by Democratic presidential primary candidate Bernie Sanders (I-VT).
Proponents advocate the FTT on several grounds. The tax could raise substantial revenue at low rates because the base—the value of financial transactions—is enormous. An FTT would curb speculative short-term and high-frequency trading, which in turn would reduce the diversion of valuable human capital into pure rent-seeking activities of little or no social value. They argue that an FTT would reduce asset price volatility and bubbles, which hurt the economy by creating unnecessary risk and distorting investment decisions. It would encourage patient capital and longer-term investment. The tax could help recoup the costs of the financial-sector bailout as well as the costs the financial crisis imposed on the rest of the country. The FTT—called the “Robin Hood Tax” by some advocates—would primarily fall on the rich, and the revenues could be used to benefit the poor, finance future financial bailouts, cut other taxes, or reduce public debt.
1. INTRODUCTION
TAX POLICY CENTER | URBAN INSTITUTE & BROOKINGS INSTITUTION 3
Opponents counter that an FTT is an “answer in search of a question” (Cochrane 2013). They claim it would be inefficient and poorly targeted. An FTT would boost revenue, but it would also spur tax avoidance. As a tax on inputs, it would cascade, resulting in unequal impacts across assets and sectors, which would distort economic activity. Although an FTT would curb uniformed speculative trading, it would also curb productive trading, which would reduce market liquidity, raise the cost of capital, and discourage investment. It could also cause prices to adjust less rapidly to new information. Under plausible circumstances, an FTT could actually increase asset price volatility. An FTT does not directly address the factors that cause the excess leverage that leads to systemic risk, so it is poorly targeted as a corrective to financial market failures of the type that precipitated the Great Recession. Opponents claim that even the progressivity of an FTT is overstated, as much of the tax could fall on the retirement savings of middle-class workers and retirees.
This paper addresses these issues, with particular attention to the question of the potential applications of such a tax in the United States. Our review and analysis of previous work suggests several conclusions. First, the extreme arguments on both sides are overstated. At the very least, the notion that an FTT is unworkable should be rejected. Most EU countries have or are planning to adopt FTTs, and many world financial centers, including Hong Kong, Switzerland, Singapore, South Africa, and the United Kingdom, thrive despite the presence of FTTs. Similarly, the idea that an FTT can raise vast amounts of revenue—1 percent of gross domestic product (GDP) or more—has proved inconsistent with actual experience with such taxes.
Second, a wide range of design issues are critical to formulation of an FTT and can help explain why some FTTs are thought to be successful (United Kingdom), while some are widely acknowledged to have been failures (Sweden).
Third, although empirical evidence shows clearly that FTTs reduce trading volume, as expected, it is unclear how much of the reduction occurs in speculative or unproductive trading versus transactions necessary to provide liquidity. The evidence on volatility is similarly ambiguous: empirical studies have found both reductions and increases in volatility as a result of the tax.
Fourth, the efficiency implications of an FTT are complex, depending on the optimal size of the financial sector, its impact on the rest of the economy, the structure and operation of financial markets, the design of the tax, and other factors.
We also present new revenue and distributional estimates of a hypothetical broad-

TAX POLICY CENTER | URBAN INSTITUTE & BROOKINGS INSTITUTION 4
based FTT in the United States by using the Tax Policy Center microsimulation model. We find that an FTT could raise a maximum of about $50 billion per year currently in the United States, allowing for behavioral responses in trading. We also find the tax would be quite progressive.
The plan of the paper is as follows. Section II provides background information on FTTs. Section III discusses design issues, and section IV explores the issues with the financial sector that motivate consideration of FTTs. Section V reviews the effect of FTTs on economic efficiency and administrative and compliance costs. Section VI presents our estimates of the revenue and distributional effects of an FTT, and the last section offers conclusions. Appendix A provides additional detail on the methodology and data we used to estimating FTT revenue and distributional effects.

TAX POLICY CENTER | URBAN INSTITUTE & BROOKINGS INSTITUTION 5
2. BACKGROUND
FTT DEFINED
An FTT is simply a tax imposed on the purchase and/or sale of financial securities. The tax may be assessed on the buyer, the seller, or both, and is typically an ad valorem tax, that is, a percentage of the market value of the security that is traded. FTT rates typically range from 0.3 to 0.5 percent, although much smaller taxes have often been levied in the United States.1 In the case of derivative transactions—such as options to buy or sell assets in the future—the tax may be levied on the value of the underlying securities or on the market value of the option.2 Often, the tax is levied only upon resale of an asset, not upon original issuance. The ultimate burden of the tax on a particular security depends on the frequency of trading. Liquid assets like government bonds or shares of blue chip stocks could be taxed many times over the course of a year (before considering behavioral responses), whereas relatively illiquid assets that turn over infrequently would rarely be subjected to the tax.
Matheson (2011) suggests a nomenclature for the variety of such taxes. Securities transaction taxes (STTs) apply to the issuance and/or trading of financial securities and potentially include stocks, debt, and related derivatives.3 Currency transaction taxes (also known as Tobin taxes) apply to transactions involving foreign exchange and related derivatives. Bank transaction taxes or bank debit taxes, which are commonly found in Latin American and Asian countries, apply to deposits and withdrawals from bank accounts, often including checking accounts. In addition, some countries tax insurance premiums, real estate transactions, or additions to business capital. In this paper, we focus on STTs (with some discussion of currency transaction taxes).4
HISTORY OF FTTS IN THE UNITED STATES
Although a significant FTT has not been in effect for decades, the United States actually has a long history with the FTT. Stock transfer taxes existed in the early days of the
1 Sometimes the tax may be expressed in “basis points.” One basis point is 0.01 percent of the value of the underlying financial instrument. The 0.3 to 0.5 percent range noted can therefore be expressed as 30 to 50 basis points.2 More generally, derivatives are financial instruments that derive their value by reference to another asset or index.3 Derivatives include assets such as commodity futures contracts, but we focus our analysis on financial assets because they are the primary target of FTTs.4 For analysis of bank transaction taxes, see Arbelaez, Burman, and Zuluaga (2005) and Baca-Campodónico, Mello, and Kirilenko (2006).

TAX POLICY CENTER | URBAN INSTITUTE & BROOKINGS INSTITUTION 6
Republic, during the Civil War, and during the Spanish-American war (Thorndike 2008).
From 1914 to 1966, a federal FTT was levied on sales and transfers of stock. The rate was originally 0.02 percent of the stock’s par value (the value stated in the charter, which is usually lower than current market value). In 1932, the tax rose to between 0.04 and 0.06 percent depending on the type of transaction. In 1959, after firms had become practiced at manipulating par value to avoid tax, the base was changed to market value, and the rate was cut to 0.04 percent. From 1960 to 1966, stocks were taxed at the rate of 0.10 percent at issuance and 0.04 percent on transfer (Keightley 2010).
Three historical points about the American FTT are worth noting. First, this tax was in place during the 1920s; whatever its effects, it did not reduce speculation sufficiently to avert the stock market crash in 1929. The tax, however, was only 0.02 percent at that time, which might not have been large enough to deter speculation. Second, it was in place at 0.04 to 0.06 percent when Keynes called for a more substantial FTT in the 1930s. Third, US Treasury economist Carl Shoup studied the tax and, in a 1934 report, found it did not raise much revenue and “except as a check on speculative activity, the tax probably has little to justify it” (Thorndike 2008).
In 1934, the Securities Exchange Act (Section 31) granted the SEC the authority to fund its oversight operations with fees on self-regulatory bodies such as the New York Stock Exchange. At present, a 0.00184 percent fee is levied on sales of securities, and a $0.0042 fee per transaction is levied on futures transactions.5 Debt instruments are exempt from the tax.
The State of New York imposed a stock transfer tax from 1905 to 1981. The tax is still levied, but since 1981 it has been refunded upon request. The tax is $0.0125 per share for stocks with prices under $5, rising in steps to $0.05 per share for stocks with prices of $20 or more.6
EXPERIENCE IN OTHER COUNTRIES
Many G20 countries tax some financial transactions (see table 1). The most common form is a tax on secondary market equity sales at a rate of 0.10 to 0.50 percent. Such
5 SEC, “Fee Rate Advisory #4 for Fiscal Year 2015,” news release, February 27, 2015, http://www.sec.gov/news/pressrelease/2015-42.html.6 “Stock transfer tax,” New York State Department of Taxation and Finance, last modified November 29, 2010, accessed June 25, 2015, http://www.tax.ny.gov/bus/stock/stktridx.htm.

TAX POLICY CENTER | URBAN INSTITUTE & BROOKINGS INSTITUTION 7
Table 1. Status of Financial Transactions Taxes in G-20 and Major Economies Worldwide
Country FTT Type
Argentina 0.60 percent on stocks, corporate, and government bonds, and futures
Australiaa N/A at a federal level; states may levy transaction taxes.
Brazil 1.5 percent on equity issued abroad and bonds, 2 percent on capital inflows to stocks and bond markets
Canada N/A
China 0.5 to 0.8 percent on bonds
European Union 0.1 percent on stocks and bonds assessed on buyer and seller (total 0.2 percent), 0.01 percent on derivatives (forthcoming)
Franceb 0.2 percent on stocks
Germany N/A
Hong Kongc 0.2 percent on stocks and 5 HKD stamp duty
Indiad 0.1 percent on stocks assessed on buyer and seller (total 0.2 percent), 0.017 to 0.025 percent on sale of op-tions, 0.01 percent on sale of futures
Indonesiae 0.1 percent on stocks
Ireland 1 percent on stocks
Italyf 0.1 percent on stocks, 0.2 percent for over-the-counter transactions
Japan N/A
Mexico N/A
Netherlands N/A
Portugalf 0.3 percent on stocks and derivatives, 0.1 percent on HFT
Russia 0.2 percent on value of new share and bond issues
Saudi Arabiag N/A
Singapore 0.2 percent on stocks
South Africa 0.25 percent on stocks
South Korea 0.3 percent on stocks and corporate bonds
Sweden N/A
Switzerland 0.15 percent on stocks, corporate and government bonds
TAX POLICY CENTER | URBAN INSTITUTE & BROOKINGS INSTITUTION 8
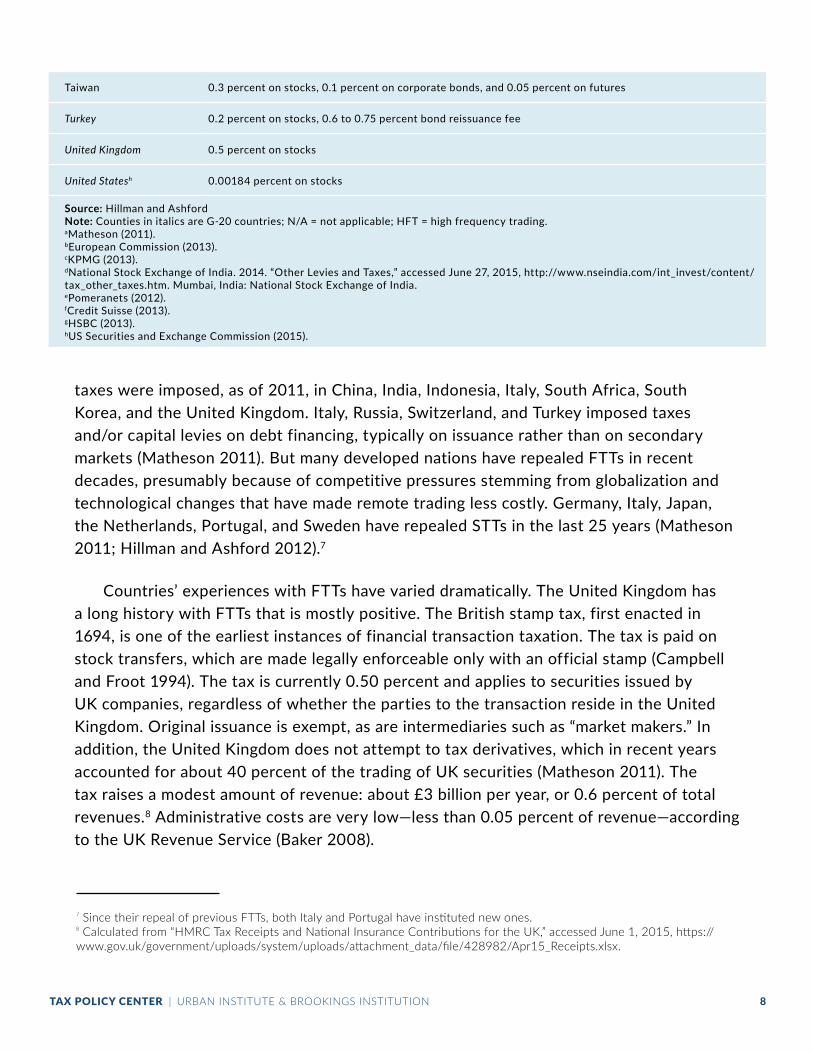
taxes were imposed, as of 2011, in China, India, Indonesia, Italy, South Africa, South Korea, and the United Kingdom. Italy, Russia, Switzerland, and Turkey imposed taxes and/or capital levies on debt financing, typically on issuance rather than on secondary markets (Matheson 2011). But many developed nations have repealed FTTs in recent decades, presumably because of competitive pressures stemming from globalization and technological changes that have made remote trading less costly. Germany, Italy, Japan, the Netherlands, Portugal, and Sweden have repealed STTs in the last 25 years (Matheson 2011; Hillman and Ashford 2012).7
Countries’ experiences with FTTs have varied dramatically. The United Kingdom has a long history with FTTs that is mostly positive. The British stamp tax, first enacted in 1694, is one of the earliest instances of financial transaction taxation. The tax is paid on stock transfers, which are made legally enforceable only with an official stamp (Campbell and Froot 1994). The tax is currently 0.50 percent and applies to securities issued by UK companies, regardless of whether the parties to the transaction reside in the United Kingdom. Original issuance is exempt, as are intermediaries such as “market makers.” In addition, the United Kingdom does not attempt to tax derivatives, which in recent years accounted for about 40 percent of the trading of UK securities (Matheson 2011). The tax raises a modest amount of revenue: about £3 billion per year, or 0.6 percent of total revenues.8 Administrative costs are very low—less than 0.05 percent of revenue—according to the UK Revenue Service (Baker 2008).
Taiwan 0.3 percent on stocks, 0.1 percent on corporate bonds, and 0.05 percent on futures
Turkey 0.2 percent on stocks, 0.6 to 0.75 percent bond reissuance fee
United Kingdom 0.5 percent on stocks
United Statesh 0.00184 percent on stocks
Source: Hillman and AshfordNote: Counties in italics are G-20 countries; N/A = not applicable; HFT = high frequency trading.aMatheson (2011).bEuropean Commission (2013).cKPMG (2013).dNational Stock Exchange of India. 2014. “Other Levies and Taxes,” accessed June 27, 2015, http://www.nseindia.com/int_invest/content/tax_other_taxes.htm. Mumbai, India: National Stock Exchange of India.ePomeranets (2012).fCredit Suisse (2013).gHSBC (2013).hUS Securities and Exchange Commission (2015).
7 Since their repeal of previous FTTs, both Italy and Portugal have instituted new ones.8 Calculated from “HMRC Tax Receipts and National Insurance Contributions for the UK,” accessed June 1, 2015, https://www.gov.uk/government/uploads/system/uploads/attachment_data/file/428982/Apr15_Receipts.xlsx.

TAX POLICY CENTER | URBAN INSTITUTE & BROOKINGS INSTITUTION 9
United Kingdom (current)
France (current)
Sweden (repealed)
Proposed Taxes
European Union Harkin-DeFazio Baker
Tax based on:
Issuer Yes Yes No Yes Yes Yes
Buyer/Seller No Yes No Yes Yes Yes
Location of Transaction No Yes Yes (brokerage) Yes Yes Yes
Tax Rate:a
Equities 0.5 percent 0.2 percent 1.0 percentb 0.2 percent 0.03 percent 0.5 percent
Debt N/A N/A 0.002-0.03 percent 0.1 percent 0.03 percent 0.01 percent/
year
Currency N/A N/A N/A N/A N/A N/A
Derivatives 0.5 percent 0.01 percent 2.0 percent 0.01 percent 0.03 percent 0.02, 0.5 percentc
Value Premium price Notional value Premium price Notional value Actual value Variesc
OTC subject to tax? Yes Yes d Yes Yes Yes
Tax on original issuance? No No No No No No
Tax on secondary markets? Yes Yes Yes Yes Yes Yes
Market makers included? No No d Yes Yes Yes
Government debt included? Yes Yes Yes Yes Yes Yes
International coordination? No No No Yes No No
Notes: N/A = not applicable; OTC = over the counter.aThe rates listed reflect the total combined rate on both buyers and sellers.bIncreased from 1 to 2 percent in 1986.c0.02 percent points on futures, 0.5 percent on options. Notional value used for futures, premium price used for options.dInformation not available.
Table 2. Major Features of Selected Financial Transactions Taxes and Proposals

TAX POLICY CENTER | URBAN INSTITUTE & BROOKINGS INSTITUTION 10
In contrast, Sweden’s FTT is widely considered to have been a failure (see table 2). Beginning in January 1984, Sweden levied a tax of 0.50 percent on purchases and sales of equities. The tax rate and other details changed over time, but the key design element remained in place, namely that the tax was imposed on registered Swedish brokerage services. The tax was easy to avoid and base erosion was a serious problem, as discussed below. In the face of substantially declining trade volume and revenue far below projected levels, Swedish authorities repealed the tax in 1991, but it did lasting harm to the Swedish stock market (Campbell and Froot 1994; Umlauf 1993).
In 2012, France introduced a 0.20 percent tax on stock purchases of French publicly traded companies with a market value over €1 billion, a tax of 0.01 percent on high-frequency trading,9 and a tax of 0.01 percent of the nominal value on some sovereign credit default swaps.10 The equity transfer tax was seen as a way to raise revenue, and the high-frequency trading and credit default swap taxes were seen as ways to reduce rent seeking and speculation. The French government was sensitive to the possibility of transaction flight to other EU states. As a result, the French FTT exempts market makers and excludes corporate bonds, sovereign bonds, and derivatives. Despite these efforts, evidence suggests that the FTT reduced trading volume significantly, as discussed below.
PROPOSED FTTS
Eleven EU states agreed to adopt an FTT scheduled to begin in January 2016. The parties include Austria, Belgium, Estonia, France, Germany, Greece,11 Italy, Portugal, Slovakia, Slovenia, and Spain (European Commission 2013). Details are still being negotiated, and significant issues remain unresolved. Some observers believe delays in implementation are likely.12
Major features of the EU FTT are listed in table 2. The FTT will create taxes of 0.1 percent on both security purchases and sales and 0.01 percent of the notional value of transactions involving derivatives (European Commission 2011).13 Participating member
9 The French Tax Code defines high-frequency trading as “the habitual addressing of orders for own account using an automated mechanism” (article 235 ter ZD, title 2, chapter 1, section 2).10 French Tax Code article 235 ter ZD, title 3, chapter 3, section 3.11 Greece was the only member state not to sign the January 2015 Joint Statement, which came soon after Greece’s recent elections. It is now unclear whether they are still planning to adopt the EU FTT. See EY Tax Services 2015.12 According to Reuters (“Germany Sees Compromise on EU Dealing Tax” 2015), member countries disagree about how to tax derivatives, among other issues.13 Notional value is the total value of a leveraged position’s assets. For example, an option to sell 1,000 shares of XYZ stock at $100 per share in six months has a notional value of $100,000, but the price of the option might be only a fraction of that amount if the current stock price is above $100 per share.

TAX POLICY CENTER | URBAN INSTITUTE & BROOKINGS INSTITUTION 11
states will drop existing FTTs but are permitted to have taxes on financial instruments not covered by the EU FTT. The tax is intended to be very broad, with a so-called “R plus I” (residence plus issuance) base. The tax applies to all financial institutions established in a member state and any institutions conducting transactions or serving clients in that state. The tax is coordinated across countries to prevent the double-tax of transactions. The EU FTT proposal exempts original issuance but not secondary trading, and liquidity on these markets could be reduced. Nevertheless, the EU believes these provisions will result in a “high degree of tax neutrality across instruments, market places, and actors within the financial sector.” The EU further argues that the tax will reduce systemic risk and rent seeking, provide a fair way for the financial sector to pay for bailouts from which it directly or indirectly benefited, and generate annual revenue of about 0.13 to 0.35 percent of GDP of the participating countries (European Commission 2011).
Numerous proposals have been made for new FTTs in the United States over the past several decades and in particular since the recent financial crisis. Support for FTTs has come from a variety of groups. In 2010, a coalition of 50 charities and civil society groups launched a campaign for a Robin Hood Tax on global financial transactions that would finance global development.14
In 2013, Senator Tom Harkin (D-IA) and Congressman Peter DeFazio (R-OR) introduced the “Wall Street Trading and Speculators Tax Act” (H.R. 3313 or S. 1787), having introduced similar bills in 2009 and 2011. Their proposal would impose a 0.03 percent tax on all trades including stocks, bonds, other debt obligations, and derivatives based on these assets. For a derivative transaction, the base would be any payment made under the terms of the contract.15 The tax would exempt initial issuance, trading in debt instruments with fixed maturities of 100 days or less, and currency transactions (although transactions involving currency derivatives would be subject to tax). Unlike the EU tax, the Harkin-DeFazio tax would not exempt market makers. The tax would be imposed on an R plus I basis on trading within the United States and to any transaction outside the country if any party to the transaction is a US business or individual. The Congressional Joint Committee on Taxation estimates the proposal would raise $352 billion (about 0.2 percent of GDP) from 2013 to 2021.
Congressman Keith Ellison (R-MN) introduced a related proposal, the “Inclusive Prosperity Act,” in 2013 (H.R. 1579). Ellison’s bill would impose much higher tax rates than
14 See www.robinhoodtax.org.15 For example, in the “put” option discussed in footnote 12 (option to sell 1,000 shares at $100), the price of the option (i.e., the premium) would be taxable when purchased. If the option is exercised (i.e., if the price of XYZ stock falls below $100) or sold, then the payment received for that contract would also be subject to the tax.

TAX POLICY CENTER | URBAN INSTITUTE & BROOKINGS INSTITUTION 12
Harkin-DeFazio: it would tax stock sales at 0.50 percent, bond sales at 0.1 percent, and payments with respect to derivatives at 0.005 percent.16 Ellison (2013) claims the tax has the potential to raise $300 billion in revenue on an annual basis (1.8 percent of GDP in 2013), or approximately nine times as much as the Harkin-DeFazio proposal on an annual basis.
Baker et al. (2009) propose a tax of 0.50 percent on stock sales, 0.01 percent times each year to maturity on bond sales, 0.50 percent of the premium price for options, and 0.02 percent of the value of futures and forward contracts (table 2). The tax would be split between the buyer and the seller (e.g., each would pay 0.25 percent on a stock sale). Based on 2008 data, when trading volumes and asset values were depressed by the Great Recession, Baker et al. estimate the tax would have raised $177 billion (about 1.2 percent of GDP) in that year, despite assuming it would reduce trading volume by half.
OTHER TAXES ON THE FINANCIAL SECTOR
FTTs in general, and STTs in particular, can be distinguished from other taxes that could be imposed on the financial sector. A financial activity tax (FAT) aims to tax the net value of economic activity in the financial sector rather than the gross value of transactions (International Monetary Fund 2010). One example of a FAT would be a value-added tax (VAT) imposed on financial-sector firms. Typically, VATs are not imposed on financial services because of the difficulty of measuring value added in financial transactions. According to Merrill (1997, 1), “in the more than one hundred countries with value-added (VAT) systems, ‘core’ financial-intermediation services are almost universally exempt from taxation. The exemption method is used not because it is thought to be the theoretically correct method of taxation, but because it has proven difficult to measure the value of many financial services for which separately-stated fees are not charged.”
Unlike an FTT, a VAT would tax the net proceeds of the financial sector and hence would not cascade, whereas an FTT would tax gross financial transactions and would cascade, creating distortions biased against industries or sectors that are more transaction intensive. A financial-sector VAT could generate revenues to help pay for the burden of public bailouts of the financial sector, but it would not target the rent-seeking behavior,
16 The base of the derivatives tax is unclear in the draft legislative language. The low rate—1/100 of the rate on securities—would be consistent with taxing the notional value of the underlying securities, but the draft statute suggests that the base is the value of the derivative itself, which is typically only a fraction of the value of the securities (and often negative). See Text of the Inclusive Property Act of 2013, H.R. 1579, 113th Cong. (2013), https://www.govtrack.us/congress/bills/113/hr1579/text.

TAX POLICY CENTER | URBAN INSTITUTE & BROOKINGS INSTITUTION 13
the excessive leverage, or the implicit public guarantees on large financial institutions (deemed “too big to fail”) that contributed to the excessive risk taking that necessitated the bailouts in the first place.
To address these issues, FATs could be targeted at either profits or leverage in the financial sector.17 For example, since 2010 the Obama administration has proposed a new levy originally dubbed the financial crisis responsibility fee.18 The fee would apply to firms with assets over $50 billion at a rate of 0.17 percent of the covered liabilities. The levy was originally intended to recoup the cost of the Troubled Asset Relief Program and discourage “excessive risk-taking” (US Treasury 2015).19
Former Ways and Means Committee Chairman Dave Camp’s tax reform plan included a somewhat similar bank tax, but it would apply to only very large financial institutions (Camp 2014). The International Monetary Fund has recommended yet another variant, which it calls a financial stability contribution, which all financial institutions would pay to cover the cost of future bailouts (International Monetary Fund 2010).
If the primary objective of the tax is to deter a future financial crisis, an FAT should be related to the systemic risk imposed by each financial institution. It would be a function of size, leverage, and riskiness of portfolio. However, Shackelford, Shaviro, and Slemrod (2010) point out that measuring multidimensional risk is extremely challenging in theory, and even more so in practice.
17 See International Monetary Fund (2010) and Shaviro (2012) for more discussion.18 Office of the Press Secretary, “President Obama Proposes Financial Crisis Responsibility Fee to Recoup Every Last Penny for American Taxpayers,” news release, January 14, 2010. http://www.whitehouse.gov/the-press-office/president-obama-proposes-financial-crisis-responsibility-fee-recoup-every-last-penn.19 The rationale for the new tax has evolved over time. Now called simply a “financial fee,” recouping the costs of the Troubled Asset Relief Program has been removed from Treasury’s list of “reasons for change.”

TAX POLICY CENTER | URBAN INSTITUTE & BROOKINGS INSTITUTION 14
3. DESIGN ISSUES
The vastly different experiences of Sweden and the United Kingdom with FTTs illustrate the importance of careful design. A broader base permits the same revenue to be raised at lower tax rates and reduces the opportunities for tax avoidance and evasion. A broad base and lower tax rate likely reduce the efficiency costs of the tax, although the issue is complicated because an FTT with uniform rates will nonetheless tax different assets at different effective rates because the tax burden depends on how frequently an asset is traded.
The first design question is the geographic reach of the tax. Should the application of the tax turn on the residence of the issuer of the security; the residence of the buyer, seller, or intermediary; or the location of the trade? The UK stamp duty applies (with some exceptions) to stock issued by a UK corporation. Similarly, the French FTT applies to stock issued by large French companies (a market capitalization of more than a billion euros). And both the United Kingdom and France purport to apply their tax to stock traded on exchanges both inside and outside their borders. As a result, the UK and French taxes avoid the giant loophole in the now-repealed Swedish tax, which applied only to transactions made using Swedish brokerages, a very narrow tax base that investors easily avoided by making trades on foreign exchanges.
The draft EU FTT would apply to the purchase of a security issued by a firm in the country that enacts the tax, and it would also apply to other purchases when either party to the transaction is a resident of the taxing country. Thus, either issuance or residence would trigger the tax.
The proposed Harkin-DeFazio FTT applies to a securities transaction when either the purchaser or the seller is a US person (a residence test). It also applies to any purchase that occurs or is cleared in the United States and thus applies to nonresidents who trade on US exchanges. But nonresidents can avoid the Harkin-DeFazio FTT by trading securities on a foreign exchange (even when trading depository receipts of US companies, as the issuer of the security is irrelevant). Harkin and DeFazio could attempt to limit this kind of avoidance by adopting a rule like the UK stamp duty, which applies a 1.5 percent penalty to the transfer of UK equities to a depository receipt facility, as the trading of the receipts would otherwise be free of the UK 0.5 percent stamp duty.
Second, which securities are covered by the tax: stocks, bonds, derivatives? All the FTTs described above apply to stock. The French FTT exempts most debt instruments,
TAX POLICY CENTER | URBAN INSTITUTE & BROOKINGS INSTITUTION 15
but taxes bonds with equity features such as convertible debt.20 The EU FTT applies to a wider range of bonds and loans, excluding noncommercial instruments such as home mortgages and insurance contracts. The Harkin-DeFazio FTT also covers most debt, but excludes bonds with a maturity of up to 100 days. The French FTT, the draft EU FTT, and the Harkin-DeFazio FTT apply to derivatives.
Shaviro (2012) points out that swaps can be created that are economically equivalent to an asset purchase.21 Thus derivatives must be taxed to deter tax avoidance, but it is not obvious how to define the tax base in the case of derivatives. The base for a stock or debt transaction is typically the sales price of the asset. With a derivative, there typically is no payment at the time the transaction is commenced, nor is there necessarily a payment at the end (as the total contract payments might happen to net to zero). The French FTT and the draft EU FTT would use the notional value of a derivative as the base.22 But the notional value of a derivative can be manipulated without changing its underlying economic characteristics. For example, the parties to a swap could halve the notional amount of their derivative and double the payoff formula (i.e., to twice the appreciation and dividends of the underlying stock). Thus, the use of notional value as a base introduces fundamental difficulties.
The French FTT and draft EU FTT acknowledge the challenge of using a notional value and respond by reducing the tax rate for derivatives by an order of magnitude (from 0.2 percent to 0.02 percent). But the rate differential reintroduces a distortion between economically equivalent transactions (e.g., between a total return swap and an outright stock purchase). As a result, in some cases, it encourages the substitution of derivatives for stocks and bonds.
The French FTT and draft EU FTT treat all derivatives in the same manner. For example, they tax the notional value for a put or a call on 100,000 shares of stock the same as a total return swap on 100,000 shares (described in footnote 21). But puts and calls often are used to hedge remote or residual risks (both portfolio and business
20 Convertible debt is debt that a bondholder may elect to convert into a specified number of shares of stock of the issuer.21 For example, an investor might enter a total return swap on the value of 100,000 shares of company XYZ stock (100,000 * the XYZ stock price). The investor is owed payments equal to the dividends paid on the stock quarterly and the rise in value of the stock on the settlement date. If the stock falls in value, the investor must make a payment equal to the decline in value as of the settlement date. In addition, the investor typically owes periodic interest on the notional value of the stock. In most cases, a net settlement is made at the end of the contract. Before tax, the investor’s position is identical to that of an investor who borrowed money at the swap interest rate to purchase 100,000 shares of stock, held the shares for the term of the contract, and then sold the shares and paid off the loan. The difference is that the total return swap involves no upfront payments and technically no change in ownership of the underlying security. If an FTT applied to purchases and sales of financial securities but not derivatives, such as swaps, the latter arrangement would be an ideal tax shelter. (This feature, in part, fueled the growth of “contracts for differences” in the United Kingdom, which are a form of total return swap.)22 In the total return swap discussed in note 20, the notional value would be the market value of the 100,000 shares.

TAX POLICY CENTER | URBAN INSTITUTE & BROOKINGS INSTITUTION 16
operational risks). Overtaxing these risk-managing transactions could result in too much risk taking—and discourage economically useful trades. In theory, the tax for a derivative that transfers only some of the risk and return of owning an asset should be less than the tax for a derivative that transfers all the return. However, it is not clear how to define the asset equivalent of a trade in a consistent way as the risk characteristics of individual instruments—which might be designed as a hedge, for example—could be very different from the risk characteristics of combinations of instruments—which might be designed to mimic the characteristics of other securities, as in the case of the swap discussed above.
The Harkin-DeFazio FTT takes a different approach to derivatives, but it still leaves major challenges. The Harkin-DeFazio FTT uses the same 0.03 percent tax rate for derivatives as it uses for stocks and bonds. But the 0.03 percent tax rate applies only to actual cash flows for derivatives (e.g., upfront payments such as premiums, periodic payments, settlement payments, and so forth), not to notional values. Using the same 0.03 percent rate for derivatives and physicals is, perhaps, less arbitrary than reducing the tax by a factor of 10, and it adjusts somewhat for differences in the value of derivatives. However, under the Harkin-DeFazio FTT, the total tax on a derivative could still be much lower than the tax on an economically equivalent stock or bond, which could lead to substitution of the derivative for the stock or bond.
Another aspect of taxing stocks versus bonds or other assets is that the total tax burden for stocks, bonds, and derivatives depends on how often the assets are exchanged. If the FTT rate is constant, short-term bonds would be overtaxed compared to longer-term bonds, which could distort portfolio and issuance decisions. For example, an FTT might discourage the trading of highly liquid short-term government securities, which are traded frequently as financial institutions use short-term assets to manage cash reserves. The Harkin-DeFazio FTT addresses this problem by exempting short-term debt (e.g., some T-Bills, commercial paper, and credit card issuances). Rather than exempt short-term debt, another approach would be to multiply the FTT on bonds by years to maturity, as proposed by Pollin, Baker, and Schaberg (2003). The basic idea is that a 10-year bond that pays annual interest, for example, is economically equivalent to a series of 10 one-year bonds. Under the Pollin et al. proposal, the equivalent financial instruments would face the same total tax in present value if all bonds were held until maturity.23
23 Assuming the bonds earn simple interest at rate r, which is equal to the discount rate, then the stream of tax payments for the one-year bond with purchase price V (and proceeds reinvested in new bonds each year) and tax rate τ would equal τV(1 + r)/10, τV(1 + r)2/10, τV(1 + r)3/10, . . . , τV(1 + r)10/10. The present discounted value of each year’s tax liability would be τV/10, so the entire stream has a present discounted value of 10τV/10 = τV. The 10-year bond would have a tax liability of τV(1 + r)10 in year 10, which has the same present value, τV. Thus, the present discounted value of tax liabilities is identical in the two cases.

TAX POLICY CENTER | URBAN INSTITUTE & BROOKINGS INSTITUTION 17
A third issue is which financial markets are subject to the FTT. Does the tax apply only to exchange-based transactions or also to over-the-counter transactions? One of the great advantages of an FTT is that collecting levies on exchange-based transactions would be easy and inexpensive. Over-the-counter transactions, in contrast, are private contracts between any two parties and there is no centralized exchange. If over-the-counter transactions are not taxed, however, investors have an obvious way to avoid the tax and the resulting exodus of trades could make markets less transparent. Taxing over-the-counter transactions would be more difficult, but Brondolo (2011) argues it is possible to do. In the United States, the recent Dodd-Frank legislation and other regulatory changes could aid collection of an FTT (e.g., there are new clearing and reporting requirements for many derivatives). Most FTT proposals include over-the-counter sales.
A fourth issue is whether the tax excludes market makers. Although the goal of the tax is to reduce speculative activity, some financial institutions serve as market makers, buying and selling in the market to provide liquidity and hence presumably to reduce volatility. Taxing these agents could raise the burdens imposed by the FTT significantly in some cases, and to the extent it reduced purchases by market makers, the tax could reduce liquidity and increase asset price volatility. The UK stamp duty excludes transactions between financial institutions (and applies only to retail customers). Distinguishing productive from unproductive activities is a fundamental tension in designing FTTs. However, exempting market makers would create a significant loophole. Most recent proposals choose to tax market makers.
A fifth issue is whether the tax exempts government debt. The direct effect of a tax on transactions involving public debt would be to raise government borrowing costs. Government securities tend to be among the most frequently traded because they are used as a substitute for cash (and because regulations require financial institutions to hold cash reserves in the form of Treasury securities). But failure to tax public debt could lead to a shift out of private-sector securities. Many recent proposals tax both corporate and government debt, although, as noted above, the Harkin-DeFazio proposal would exempt debt instruments with a maturity less than 100 days, which would exempt many government securities from the tax.
All the issues above concern the tax base. Turning to the tax rates, there are further questions. Is the tax ad valorem or a flat fee per share traded? Most existing taxes and proposals employ an ad valorem rate. Ad valorem and flat fee taxation have different effects on transactions of different sizes. For example, some sophisticated algorithms submit a large number of small orders (“order shredding”) in an extremely short amount of time to profit from miniscule differences between bids and asks. A very small flat fee

TAX POLICY CENTER | URBAN INSTITUTE & BROOKINGS INSTITUTION 18
would be sufficient to discourage such behavior (Matheson 2011). But a flat fee would implicitly favor assets with relatively high face values—because the tax would be a smaller fraction of value—and thus might discourage stock splits and dividend payments (which, all else equal, reduce asset prices) and encourage stock buy-backs (which have the opposite effect).
A final issue is whether the tax is coordinated internationally. Because capital is highly mobile across national borders, international coordination could significantly reduce the scope for avoidance. The early Swedish experiment with FTTs was doomed in part by the ability of investors to trade Swedish shares on other countries’ stock exchanges where FTTs were small or nonexistent. The pending EU tax is an example of countries trying to coordinate their FTTs.
International cooperation and coordination of tax bases and rates could greatly reduce the scope for tax avoidance. The problem presents a type of “prisoner’s dilemma” in which every country can reap higher revenues with minimal effects on economically productive financial-sector activity if they all cooperate, but each country has an incentive to break from an agreement and reap the potential economic rewards associated with being an FTT tax haven, boosting its financial sector. In practice, this problem could be addressed by having all countries in the EU, the United States, and a few other major countries agree to a coordinated tax.

TAX POLICY CENTER | URBAN INSTITUTE & BROOKINGS INSTITUTION 19
4. THE FINANCIAL SECTOR AND MARKET FAILURE
The financial sector is critical in providing capital to finance business and household investment and providing liquidity to facilitate commerce and manage risks. But there is growing concern that the sector uses too many resources and suffers from structural problems, with the result being a misallocation of resources and undue risk imposed on the economy. The financial market collapse of 2007 illustrated painfully how dependent we are on a well-functioning financial sector and the dire consequences of failure in that market. This section provides a brief overview of some of these concerns.
SIZE OF THE FINANCIAL SECTOR
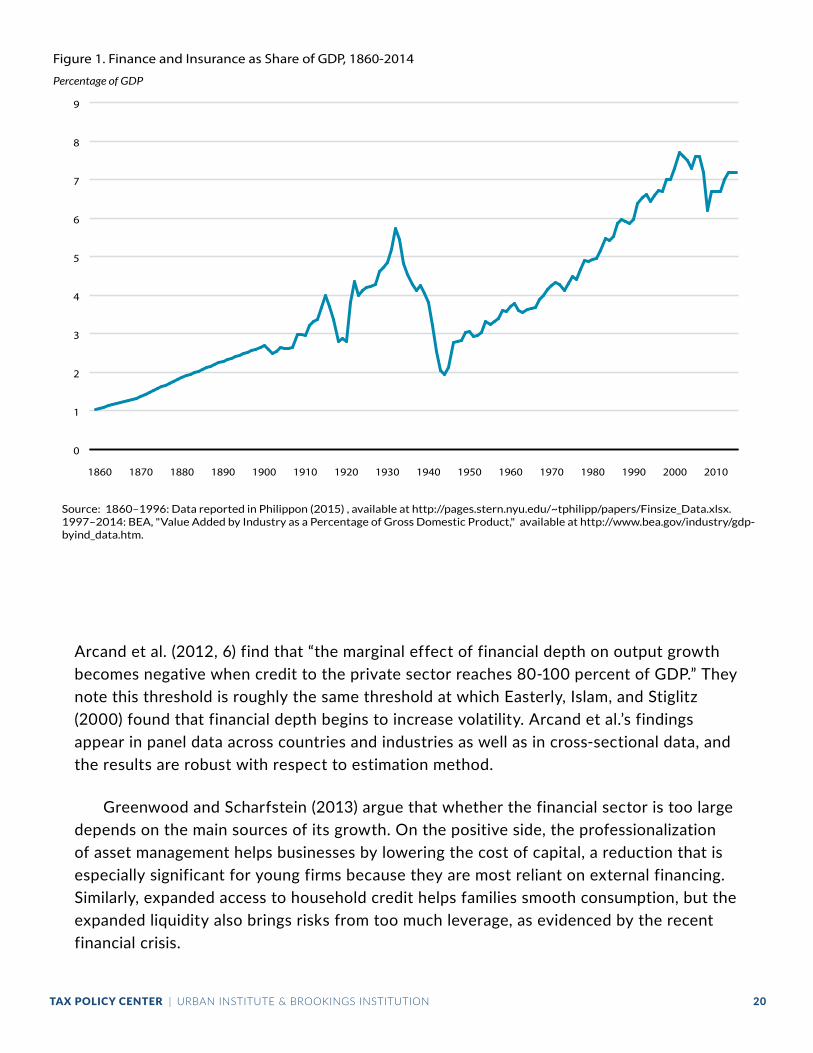
The financial services sector accounted for 7.2 percent of US GDP in 2014, near the all-time high of 7.7 percent in 2001 and up from just 2.5 percent of GDP in 1947 (Bureau of Economic Analysis 2015; Philippon 2008) (see figure 1). Similar trends are evident in other industrial economies (Philippon and Reshef 2013).
Many commentators believe the financial sector has grown inefficiently large (Cœuré 2014; Zingales 2015). Some financial institutions have grown so large their failure would produce ripple effects throughout the entire economy, as evidenced by the shock waves created when Lehman Brothers was allowed to fail (Wessel 2010).
Recent research has found that financial-sector growth leads to increased efficiency up to a point, but beyond the optimal scale, there are higher risks of a crisis (Cœuré 2014). Philippon (2015) estimates the financial sector’s unit costs have increased even while information technology has produced cost savings in other similar industries. Adjusting for quality improvements, he finds that “the unit cost of intermediation has increased since the mid-1970s and is now significantly higher than it was in the 1960s and about as high as it was at the turn of the 20th century. It seems that improvements in information technologies over the past 30 years have not necessarily led to a decrease in the unit cost of intermediation.”
Arcand, Berkes, and Panizza (2012) reexamined a longstanding body of research that has found a monotonically positive relationship between finance and economic growth. The authors posit that previous research found a bigger financial sector always led to more growth because the empirical models did not allow for the possibility of a peak beyond which more finance might entail economic costs. Using a more flexible functional form,
TAX POLICY CENTER | URBAN INSTITUTE & BROOKINGS INSTITUTION 20
Arcand et al. (2012, 6) find that “the marginal effect of financial depth on output growth becomes negative when credit to the private sector reaches 80-100 percent of GDP.” They note this threshold is roughly the same threshold at which Easterly, Islam, and Stiglitz (2000) found that financial depth begins to increase volatility. Arcand et al.’s findings appear in panel data across countries and industries as well as in cross-sectional data, and the results are robust with respect to estimation method.
Greenwood and Scharfstein (2013) argue that whether the financial sector is too large depends on the main sources of its growth. On the positive side, the professionalization of asset management helps businesses by lowering the cost of capital, a reduction that is especially significant for young firms because they are most reliant on external financing. Similarly, expanded access to household credit helps families smooth consumption, but the expanded liquidity also brings risks from too much leverage, as evidenced by the recent financial crisis.
0
1
2
3
4
5
6
7
8
9
2010200019901980197019601950194019301920191019001890188018701860
Source: 1860–1996: Data reported in Philippon (2015) , available at http://pages.stern.nyu.edu/~tphilipp/papers/Finsize_Data.xlsx. 1997–2014: BEA, "Value Added by Industry as a Percentage of Gross Domestic Product," available at http://www.bea.gov/industry/gdp-byind_data.htm.
Figure 1. Finance and Insurance as Share of GDP, 1860-2014
Percentage of GDP

TAX POLICY CENTER | URBAN INSTITUTE & BROOKINGS INSTITUTION 21
Baily and Elliott (2013, 22) express sympathy for the view that the financial sector is too large, but they caution that “it is extremely hard to determine the right size of the financial system based on well-grounded economic theories.” They are concerned that an overreaction in the wake of the financial crisis could harm the economy.
Clearly, if the financial sector is too big, taxes that reduce the size of the financial sector have the potential to raise economic welfare. Whether taxes that reduce the size of the financial sector in the manner that an FTT would are efficiency enhancing is an open question. It is certainly true that an FAT targeted at financial market inefficiencies would be superior, at least in theory. However, if such a tax is infeasible, an FTT may be a second-best option as it would surely result in a smaller financial sector because trading volume would decline significantly (see next section for a discussion of the effects of an FTT). Although the FTT has ambiguous effects on market volatility, it would deter some forms of inefficient rent seeking by making many high-frequency trading strategies unprofitable.
SYSTEMIC RISK
Federal policies, both explicit and implicit, may have led players in the financial sector to take excessive risks. The standard example is deposit insurance, which played a role in the savings and loan crisis in the 1980s. Of greater significance today, however, is the implicit insurance provided to major players in the financial sector based on the notion that they are “too big to fail.” By essentially socializing downside risk, implicit insurance for large financial institutions raises their private expected returns, encourages excessive risk taking, and likely causes the allocation of too much in the way of human and physical capital to be devoted to the financial sector. It also causes smaller firms to grow faster than they otherwise would have in order to place themselves under the implicit protective umbrella (Bernanke 2009).
Depositors acting under the same belief disregard their qualms of an institution’s risky behavior, and both depositors and the institution shirk responsibility for assessing risk (International Association of Deposit Insurers 2013). Risk breeds more risk. Without some form of regulation that would motivate institutions to be more accountable for their decisions or tax that penalizes institutions for size and riskiness, these implicit and explicit guarantees pose the threat of precipitating future crises.
TAX POLICY CENTER | URBAN INSTITUTE & BROOKINGS INSTITUTION 22
HIGH-FREQUENCY TRADING AND FLASH TRADING
High-frequency traders use computer algorithms to choose and execute trades in mere fractions of a second. Traders often use these algorithms to arbitrage and eliminate differences in prices of identical or similar assets across different markets. Budish, Cramton, and Shim (2015) report that between 2005 and 2011 the median length of an arbitrage opportunity on the Chicago Mercantile Exchange and the New York Stock Exchange declined from 97 to 7 milliseconds. High-frequency trading plays a major role in current financial markets, accounting for over half of trading volume in equity markets (Jones 2013, SEC 2014).
High-frequency trading is the means by which the trade happens, distinct from the various trading strategies that employ it. Passive high-frequency trading strategies have a positive impact on markets by reducing price spreads and volatility (SEC 2014). More aggressive strategies can aid in price discovery, but they also create costs for fellow market participants and may only provide “phantom liquidity” (Shorter and Miller 2014).
Some forms of high-frequency trading involve rent-seeking behavior, which can produce large windfalls for individuals, but no social benefit. For example, highly sophisticated traders sometimes use extremely fast computer algorithms and high tech equipment to get between buyers and sellers to extract rents at the expense of unsuspecting market participants—a practice that has been dubbed “flash trading.” It is a modern variant of the illegal practice of front-running, where a broker enters its own order in front of a client’s to profit at the client’s expense Flash trading, however, has not been challenged by the SEC (Lewis 2014). Enormously talented individuals and real physical capital24 are invested in flash trading. The rents extracted by flash traders also reduce returns on capital for other market participants, which might reduce the supply of investment below optimal levels. Adding even a small FTT could make these trades unprofitable and stop such behavior.25
24 Lewis (2014) described the tremendous expense of laying fiber optic cable between Chicago and New York to gain a time advantage of several microseconds to intercept trades.25 John D. Arnold points out that a “spoofer” may also deploy high-frequency trading to combat modern front runners by making their trades unprofitable. “Spoofers” deliberately send false price signals to trick front runners into making money losing trades. The spoofer outmaneuvers the front runner by proffering a small order, which he will profit from, in conjunction with an offsetting larger order, which he will cancel once the front runner jumps ahead of it. Because spoofing makes front running unprofitable, it could limit the scope of this inefficient high-frequency trading. However, unlike flash-trading, the SEC considers spoofing to be an illegal deceptive practice because spoofers offer trades they never intend to execute. See John D. Arnold, “Spoofers Keep Markets Honest,” Bloomberg View (blog), January 23, 2015. http://www.bloombergview.com/articles/2015-01-23/high-frequency-trading-spoofers-and-front-running.

TAX POLICY CENTER | URBAN INSTITUTE & BROOKINGS INSTITUTION 23
NOISE TRADING
A noise trader bases trades on something other than valid information. Black (1986) believes noise traders are a central feature of financial markets, giving fundamental traders an opportunity to profit and affecting price volatility. He identifies different types of noise traders: those trading on noise they mistakenly believe is information and those trading frequently just for fun. An FTT may not have much influence on the latter, but for the former an FTT would make every trade look a little less profitable and thus discourage them.
Noise traders’ speculation raises market volatility, which harms rational market participants by increasing the risk of holding financial assets. DeLong et al. (1989) conclude that the costs of the higher variance of asset returns and the resulting decline in the size of the capital stock more than offsets the gain to rational investors from exploiting noise traders’ ignorance. Imposing an FTT would curb noise trading, but it would reduce informed trading, too, so the net effect on volatility is unclear (Kupiec 1996). Dávila (2013) finds a nonzero FTT rate is optimal any time investors’ nonfundamental belief systems cause excess trading; his optimal tax rate would strike a balance between the gains from reduced noise trading and the losses from cutting informed trading levels. Subrahmanyam (1998), too, finds a trade-off arising from an FTT: less activity by informed traders would result in less liquidity, but traders would have an incentive to invest in collecting more information about the long-term prospects of businesses (because average holding periods are longer). Stiglitz (1989) suggests an FTT is an appropriate instrument to reduce noise trading. DeLong et al. (1989, 692) propose a short-term capital gains tax, which, in their simplified model of behavior, “would eliminate noise traders’ incentive to speculate on their misperceptions.”

TAX POLICY CENTER | URBAN INSTITUTE & BROOKINGS INSTITUTION 24
5. EFFECTS OF AN FTT
This section examines many of the effects of an FTT on the financial sector as well as issues related to compliance and administration.
TRADING VOLUME AND SPECULATION
An FTT would reduce the volume of trades by raising transaction costs. Some trades that would have been profitable with lower transactions costs would become unprofitable with the addition of an FTT and hence would not be undertaken. Likewise, market participants would look to substitute nontaxable transactions for taxable transactions. Both effects will reduce trading volume for trades subject to an FTT.
Empirical evidence strongly confirms that higher transactions costs in general, and a higher FTT in particular, reduce trading volume (Matheson 2011). Trading in Sweden fell significantly after imposition of its FTT (Campbell and Froot 1994; Umlauf 1993). The French FTT enacted in 2012 was also followed by significant declines in trading (Colliard and Hoffman 2013; Haferkorn and Zimmermann 2013; Buchanan 2012; Meyer, Wagener, and Weinhardt 2013). Both countries saw trades move to other parts of Europe. In France, trading also migrated to smaller firms, which were exempt from the tax. The negative correlation between FTT rates and trading volume was also found in China (Baltagi, Li, and Li 2006), Taiwan (Chou and Wang 2006), Japan (Liu 2007), the United Kingdom (Jackson and O’Donnell 1985), and in cross-national studies (Ericsson and Lindgren 1992; Hu 1998). Pomeranets and Weaver (2013) show that higher tax rates caused by the New York State FTT reduced trading volume on the New York Stock Exchange and induced shifts of trading to other exchanges.
Auten and Matheson (2010) find that increases in the very small SEC fee reduced trading volume in the largest, most liquid US securities. Liquid assets tend to be traded frequently because transaction costs are a negligible part of the price. As a result, an FTT represents a proportionately much larger share of transaction costs and profits for those assets than for illiquid assets.
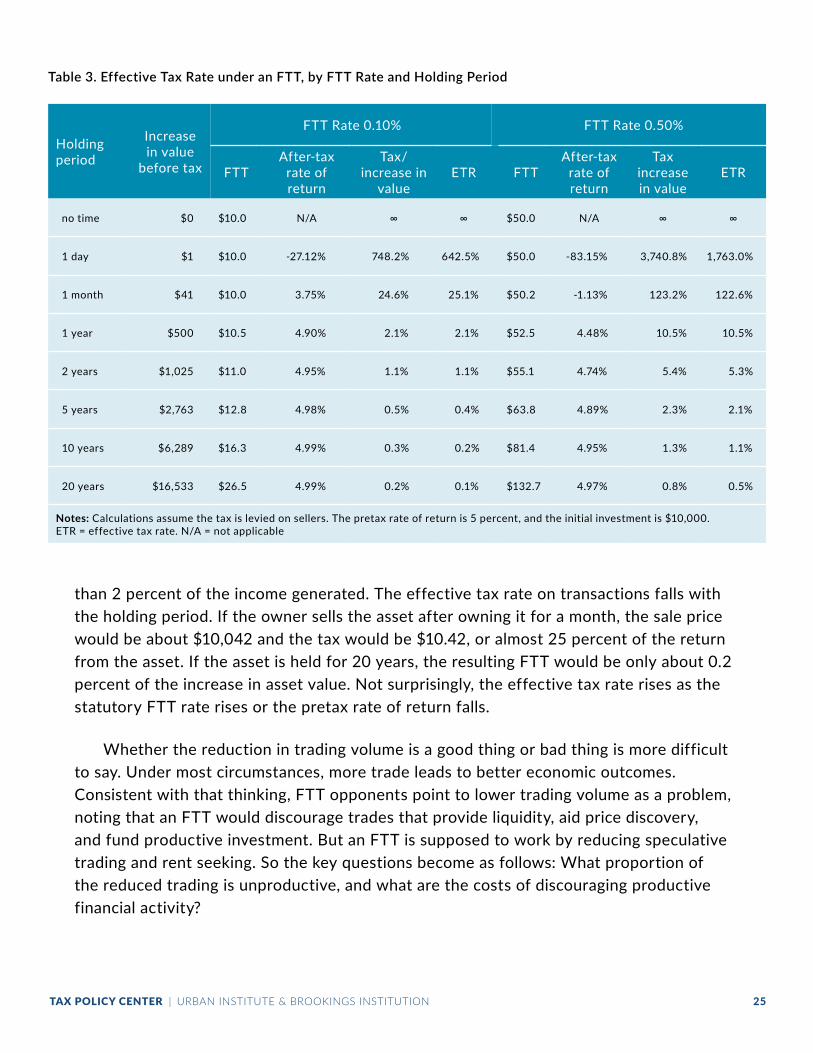
Simple calculations illustrate the point. Suppose an investor purchases an asset for $10,000 that produces a 5 percent annual rate of return. If the asset is held for a year and sold, the pretax return is $500 (see table 3). If a 0.1 percent FTT is assessed upon sale, the tax bill is $10.50 (0.1 percent of $10,500). The 0.1 percent FTT actually represents more
TAX POLICY CENTER | URBAN INSTITUTE & BROOKINGS INSTITUTION 25
than 2 percent of the income generated. The effective tax rate on transactions falls with the holding period. If the owner sells the asset after owning it for a month, the sale price would be about $10,042 and the tax would be $10.42, or almost 25 percent of the return from the asset. If the asset is held for 20 years, the resulting FTT would be only about 0.2 percent of the increase in asset value. Not surprisingly, the effective tax rate rises as the statutory FTT rate rises or the pretax rate of return falls.
Whether the reduction in trading volume is a good thing or bad thing is more difficult to say. Under most circumstances, more trade leads to better economic outcomes. Consistent with that thinking, FTT opponents point to lower trading volume as a problem, noting that an FTT would discourage trades that provide liquidity, aid price discovery, and fund productive investment. But an FTT is supposed to work by reducing speculative trading and rent seeking. So the key questions become as follows: What proportion of the reduced trading is unproductive, and what are the costs of discouraging productive financial activity?
Holding period
Increase in value
before tax
FTT Rate 0.10% FTT Rate 0.50%
FTTAfter-tax
rate of return
Tax/increase in
valueETR FTT
After-tax rate of return
Taxincrease in value
ETR
no time $0 $10.0 N/A ∞ ∞ $50.0 N/A ∞ ∞
1 day $1 $10.0 -27.12% 748.2% 642.5% $50.0 -83.15% 3,740.8% 1,763.0%
1 month $41 $10.0 3.75% 24.6% 25.1% $50.2 -1.13% 123.2% 122.6%
1 year $500 $10.5 4.90% 2.1% 2.1% $52.5 4.48% 10.5% 10.5%
2 years $1,025 $11.0 4.95% 1.1% 1.1% $55.1 4.74% 5.4% 5.3%
5 years $2,763 $12.8 4.98% 0.5% 0.4% $63.8 4.89% 2.3% 2.1%
10 years $6,289 $16.3 4.99% 0.3% 0.2% $81.4 4.95% 1.3% 1.1%
20 years $16,533 $26.5 4.99% 0.2% 0.1% $132.7 4.97% 0.8% 0.5%
Notes: Calculations assume the tax is levied on sellers. The pretax rate of return is 5 percent, and the initial investment is $10,000. ETR = effective tax rate. N/A = not applicable
Table 3. Effective Tax Rate under an FTT, by FTT Rate and Holding Period

TAX POLICY CENTER | URBAN INSTITUTE & BROOKINGS INSTITUTION 26
One piece of evidence is that a large percentage of financial market transactions involve short-term, high-frequency trading. Matheson (2011, 2014) reports that algorithmic, computer-driven trading that relies on high-speed transactions accounted for 60 percent of US equity trading volume in 2009, up from 30 percent in 2006.
Because the margins involved in such trades are often quite small, a tiny FTT would be sufficient to shut down most high-frequency trading, but it would also raise very little revenue. Lepone and Sacco (2013) find that a financial trading fee in Canada led to a significant decline in algorithmic, high-frequency trading.
An FTT at the rates being adopted and proposed, however, would make many short-term investments unprofitable (as illustrated in table 3) without discriminating between rent-seeking or noise-based trading activities and those with positive economic value. Combined with existing taxes on capital gains (and other forms of capital income), the FTT could make many short-term trades unprofitable and substantially raise the bar for others. An assessment of the costs and benefits of an FTT thus would have to balance the gains against the cost to society of suppressing many otherwise productive short- and medium-term trades.
LIQUIDITY
Market liquidity is not a precise term. Intuitively, a liquid market is one in which it is easy to sell or buy an asset at a reasonable price. Liquidity is sometimes defined as the inverse of the price effect of a trade; in a liquid market, particular transactions have small impacts on price. That is, sellers can dispose of substantial holdings without driving down prices much, and buyers can acquire significant stakes in a company without driving up the price. Liquidity can also be assessed by the bid–ask spread, the difference between the highest price buyers are willing to pay and the lowest price sellers are willing to accept. Liquid markets have low bid–ask spreads. Alternatively, liquidity can be defined in terms of market depth, which takes into account not only the bid–ask spread but also the volume of transactions that can be bought or sold at prevailing prices. Typically, liquid markets are also high volume, but volume and liquidity are distinct concepts.
An FTT increases transaction costs and hence would be expected to make markets less liquid. As one example, an FTT would drive a wedge between bids and asks, because tax would have to be paid on the asset sale, and hence it would raise bid–ask spreads. An FTT also may increase the bid–ask spread if it substantially cuts market volume. Empirical evidence generally supports this notion. Pomeranets and Weaver (2013) show
TAX POLICY CENTER | URBAN INSTITUTE & BROOKINGS INSTITUTION 27
that increases in the New York State FTT raised bid–ask spreads. Lepone and Sacco (2013) show that the financial trading fee in Canada led to a significant increase in bid–ask spreads for stocks with larger market capitalization.26
A key question concerns the size of the economic effects of less liquidity. Bid–ask spreads on the New York Stock Exchange averaged 1.3 percent in the mid-1980s and fell to 0.1 percent by 2009 (Matheson 2011).27 An FTT of 0.1 to 0.5 percent would widen the bid–ask spread, but it is unclear by how much. Baker (2008) asserts the new bid–ask spread would be narrower than the levels experienced in the mid-1980s and concludes that the economic costs of an FTT, operating through changes in the bid–ask spread, would be minimal.28
PRICE DISCOVERY
Price discovery is the name given to the process by which asset values are determined via trading. Efficient price discovery implies that asset values are not correlated over time; that is, any errors are short lived as markets align price with fundamental values as all information available at the time is incorporated into each trade. Markets with less efficient price discovery mechanisms are slower to incorporate new information into asset prices.
As a theoretical matter, Matheson (2011) finds that FTTs have the potential to slow price discovery in financial markets, primarily by reducing liquidity. She links this slower price discovery with an informational distortion in which assets are priced on old or outdated information because the transaction costs imposed by the FTT make it unprofitable for market participants to act on small price disequilibria. Habermeier and Kirilenko (2001, 178) similarly conclude that “the presence of even very small transaction costs makes continuous rebalancing infinitely expensive. Therefore, valuable information can be held back from being incorporated into prices. As a result, prices can deviate from their full information values.”29
Empirical work supports the notion that higher FTTs lead to autocorrelation in stock returns—that is, stocks can remain persistently too high or too low—and hence to less
26 Dupont and Lee (2007) argue that the impact on liquidity (market depth in their analysis) can also depend on the presence of asymmetric information, and in certain cases the FTT can increase liquidity.27 Pollin et al. (2003) summarize the substantial declines in transaction costs in various financial markets through 2000.28 Baker and Jorgenson (2012) find a positive and statistically significant correlation between transaction costs in the early 2000s and economic growth from 1990 to 2007 across 33 countries. However, the regression analysis omits a number of factors that may be correlated with transaction costs and growth, so it is impossible to infer a causal link.
TAX POLICY CENTER | URBAN INSTITUTE & BROOKINGS INSTITUTION 28
efficient price discovery. Baltagi et al. (2006) estimate that increases in the STT in China raised the autocorrelation of returns on Chinese stocks. Liu (2007) found that after the reduction in the Japanese STT during the late 1980s, the first-order autocorrelation for Japanese stocks subject to the tax fell until it was in line with untaxed Japanese depository receipts. However, the actual magnitude of the economic costs connected with inefficient price discovery is uncertain.
ASSET PRICE VOLATILITY
Although price discovery refers to the first-order autocorrelation of stock returns, volatility typically refers to the variance of returns. At first glance, the relationship between FTTs and volatility appears to be straightforward. As noted above, FTTs create higher transaction costs and thus reduce trading volume. Moreover, the literature generally shows a positive relationship between trading volume and volatility. Therefore, one would expect that higher FTTs, which reduce volume, would reduce volatility (Matheson 2011). Indeed, this expectation is a key motivation for the FTT proposals by Keynes (1936), Tobin (1978), Stiglitz (1989), and Summers and Summers (1989). However, the theoretical sign of the relationship is unclear, because FTTs can delay market participants’ reaction to new information, as discussed above. This delay means prices may swing substantially before it becomes worthwhile for traders to react and realign prices with fundamentals.
In fact, several studies have found that higher transactions costs and FTTs actually raise volatility. Umlauf (1993) found that the introduction of, and increases in, the Swedish FTT led to increases in daily market volatility. Jones and Seguin (1997) found that deregulation of commissions on the New York Stock Exchange and American Stock Exchange in 1975, which led to lower transaction costs, reduced volatility of stock prices. Similar findings were reported by Hau (2006) for transaction costs and stock price volatility in France, by Lanne and Vesala (2010) for the effects of an FTT on volatility in the currency trading market, and by Liu and Zhu (2009) for commission deregulation in the Japanese stock market. Pomeranets and Weaver (2013) found that increases in the New York State FTT raised the volatility of both individual stocks and portfolios.30
In contrast, Matheson (2014) found increases in the SEC fee over the 2001 to 2010 period reduced volatility, with the effect being larger (in absolute value) in the second half
29 To illustrate this effect, suppose a trader knows the correct price for an asset—that is, the value consistent with all information currently available—is P*, but the market price is P. The trader will only engage in a transaction if |P - P*|≥TC, where TC is total transaction costs, including the FTT. With a substantial FTT (or other transaction costs), significant differences between the market price and true value could persist.

TAX POLICY CENTER | URBAN INSTITUTE & BROOKINGS INSTITUTION 29
of the period. As she notes, algorithmic high-frequency trading rose dramatically over this time period, so the results could be interpreted as showing that transactions taxes reduce volatility when applied to a market with a substantial amount of high-frequency trading.
More generally, the effect of FTTs could raise or reduce volatility depending on how they affect noise traders versus fundamental traders. As one example, at the theoretical level, suppose that fundamental traders drive an asset’s price toward its fundamental value, while noise traders introduce random variation. Having more fundamental traders will reduce volatility, and having more noise traders will raise volatility. If an FTT primarily reduces speculative behavior and hence removes disproportionately more noise traders than fundamental traders, then it could reduce volatility. Deng, Liu, and Wei (2014) report evidence consistent with this hypothesis. They estimate that in less mature markets, which might have more noise trading because information is less readily available, higher FTTs reduce market volatility, but in more mature markets, presumably with more fundamental traders and better information, FTTs increase volatility.
ASSET PRICES AND THE COST OF CAPITAL
Introduction of an FTT is almost certain to reduce asset prices. Matheson (2011) presents a simple model in which the asset price impact of an FTT depends on the tax rate, the turnover rate, and the dividend growth rate. She finds that for assets held for 10 years, even a very large FTT (0.5 percent) has only a modest effect (1.4 percent) on initial asset value. For assets held for one year, a 0.5 percent FTT would reduce the initial asset value by 14 percent. For assets with high turnover rates, even a small tax would reduce value significantly. For assets held 0.10 years, for example, a 0.05 percent FTT would reduce value by 14 percent, and a 0.50 percent FTT would reduce value by 62 percent.
Empirical evidence and other estimates are consistent with a negative impact of an FTT on asset prices. A Congressional Research Service study estimated in the 1980s that the creation of a 0.5 percent tax on stock sales would reduce stock market values by between 9.3 and 14.6 percent (Kiefer 1987). Umlauf (1993) shows that Swedish stocks fell
30 Of the eight events when the New York STT was changed, six had a statistically significant positive correlation with volatility in daily returns (Pomeranets and Weaver 2013). Pomeranets and Weaver also examined portfolio volatility by using a methodology similar to Jones and Seguin (1997). Jones and Seguin argue that portfolio volatility is a better measure of the effects of an STT on investor risk because most investors hold portfolios rather than single stocks. Pomeranets and Weaver looked at the volatility of New York Stock Exchange and American Stock Exchange stock indexes and rejected the hypothesis of a negative correlation with the STT. In other words, they did not find evidence that an STT, at the levels adopted in New York, would reduce overall market volatility, but they found evidence it could increase the volatility of individual stock returns.

TAX POLICY CENTER | URBAN INSTITUTE & BROOKINGS INSTITUTION 30
significantly in the month before the tax took effect. Hu (1998) examined numerous STT changes in Asian countries from 1975 to 1994 and found that increases in transactions costs consistently reduced daily returns. Bond, Hawkins, and Klemm (2004) estimate that the cuts in the stamp duty raised share prices, more for shares with high turnover rates. Amihud and Mendelson (1992) find similar results for high-turnover stocks relative to other stocks.
Matheson (2011) also estimates the impact of an FTT on the cost of capital, with the effects again varying dramatically by holding period and tax rate. A 0.5 percent FTT will raise the cost of capital by 5.0 percentage points for an asset held for just 0.1 years, 0.50 percentage points for an asset held for a year, and 0.05 percentage points for an asset held 10 years.
CASCADING AND INTERSECTORAL DISTORTIONS
The FTT is a tax on an intermediate input in the production process and (unlike a VAT) it is not creditable against future taxes. As a result, it will cascade: the more often an asset is traded, the higher the effective tax rate. Diamond and Mirrlees (1971) showed that under certain conditions such taxes are always less efficient than taxes on final outputs or input taxes that are creditable, such as a VAT.
Other alternatives like an FAT, which only taxes the value added, could reduce the level of cascading compared with that of an FTT, although an FAT would require a higher rate to raise comparable revenues (Matheson 2011). There are attempts to counter cascading under an FTT itself through the exemption of intermediate transactions. The UK stamp duty takes that approach. However, as noted above, this practice may facilitate tax avoidance.
A City of London study on the economic impact of an EU FTT estimated that cascading could convert the statutory 0.1 percent FTT rate on bond transactions into an effective rate of 1.0 percent on income from bonds (London Economics 2013). Gauging the impact of cascading in the production chain can be difficult for policymakers, but Keen (2013) concludes that the welfare losses, via price distortions among different types of assets, may be quite large because of cascading.
One of the rationales for an FTT is to encourage investors to take a longer-term perspective—that is, to create patient capital. If certain investors are overly swayed by rumors and extraneous information, some trades might entail economic costs with little or

TAX POLICY CENTER | URBAN INSTITUTE & BROOKINGS INSTITUTION 31
no gain in individual welfare. Moreover, a short-term perspective by investors may cause corporate managers to pass up profitable long-term investments in favor of less productive strategies that improve the balance sheet in the short run. Thus, discouraging some trades might make some markets work better. However, the capital gains tax already discourages short-term trading. Indeed, many observers have bemoaned the “lock-in effect” whereby capital gains tax discourages investors from making otherwise welfare-improving trades. An FTT would compound the lock-in effect.
Another potential rationale for an FTT would be to reduce excess trading caused by principal–agent problems. Stockbrokers have a personal interest in trading a lot because they get paid to trade. In contrast, research shows the best strategy for most investors is to buy and hold a diversified portfolio of assets (Barber and Odean 2000).
By raising trading costs, an FTT would discourage fund managers and brokers from trading and hence offer a counterweight to overtrading. Pension funds, which turn over a great deal, might be especially affected.31 Absent a change in fund manager behavior, an FTT would impose a substantial tax increase on many pension funds. A study by a UK consulting firm commissioned by critics of the EU plan (Oxera 2011) estimated that a 0.2 percent FTT could reduce pension fund values by more than 5 percent and reduce annual return by 0.2 percent. However, these estimates assume the trades undertaken by pension fund managers are productive—that they raise returns. If a significant amount of trading within funds is unproductive, then part of the burden of the tax might be offset by reductions in trades.
Advocates of an FTT argue that pension churning simply adds costs and actually reduces retirement security. Woolley (2010) argues that pension and charitable fund managers do not behave in the best interest of their beneficiaries, but instead maximize rents for fund managers. Gray, Griffith-Jones, and Sandberg (2012) claim that “the [proposed EU] FTT will help secure pensioners’ investments through reducing short-term speculative activity and encouraging their funds to invest over longer horizons. It will benefit both European pensioners and the pension fund industry.” In sum, although pension funds might appear to be most vulnerable to reduced returns due to an FTT, the tax might discourage inefficient and unproductive trading behavior by fund managers and indirectly benefit fund participants.
31 Daniel Schäfer, “Pension Funds Hide £3.1bn Costs, Says Study,” Financial Times, November 2, 2011. http://www.ft.com/intl/cms/s/0/7cf72b58-1385-11e1-81dd-00144feabdc0.html#axzz3bY41bXzg.

TAX POLICY CENTER | URBAN INSTITUTE & BROOKINGS INSTITUTION 32
ADMINISTRATIVE AND COMPLIANCE COSTS
Administrative costs of existing FTTs tend to be relatively small. The UK tax in particular appears to have extremely low administrative costs (Baker 2008). Gains and losses accrued by individuals and businesses are already taxed according to the type of financial instrument and characteristics of the person or business. It is not unreasonable to imagine the taxation of the transactions themselves carrying relatively small additional administrative costs. The revenue can be raised from a relatively small number of sophisticated entities, making the tax easy to collect and audit.
Still, compliance costs may not be negligible. About 50 billion trades have taken place each year in the United States, on average, since 2003.32 Assuming a 50 percent reduction in volume due to an FTT, it would still require businesses and individuals to report, and the IRS to process, information on 25 billion trades per year. Moreover, the administrative costs will depend on the design of the tax. A tax on exchange-based transactions would be relatively easy to administer, but it would be ripe for avoidance or evasion by moving trades off exchanges. In comparison, as noted above, a tax that included over-the-counter transactions and derivatives would cost more to administer but would be likely to induce less avoidance and evasion.
32 See MarketWatch’s Dow Jones Industrial Average (INDEX) charts, http://bigcharts.marketwatch.com/interchart/interchart.asp?symb=DJIA&insttype=Index&time=8&freq=1.

TAX POLICY CENTER | URBAN INSTITUTE & BROOKINGS INSTITUTION 33
6. NEW REVENUE AND DISTRIBUTIONAL ESTIMATES
In this section, we present new estimates of the revenue and distributional effects of an FTT in the United States by using the Tax Policy Center microsimulation model (Tax Policy Center no date).
MODELING ISSUES
We examine three FTTs, each structured along the lines of proposals by Baker and others.33 The three FTTs would impose a base tax rate of either 0.01, 0.1, or 0.5 percent on stock trades, option premiums, foreign exchange spot transactions, the underlying notional values of financial futures, and the underlying notional values swaps (times number of years to maturity). Rates on options, foreign exchange spot transactions, futures, and swaps would be 1/10th the base rates.
Both government and private bonds would be taxed. Assuming the average years to maturity of traded bonds is two years, the rate set for a one-year bond is one-half the base rate, and rates for longer-term bonds would be taxed at a multiple of that rate based on the number of years to maturity. With a 0.01 percent base rate, the rate on bonds averages out to the same 0.01 percent that applies to stock. A similar adjustment is made to swaps so that the rate across maturities would average out to 0.001 percent.
Our revenue effects take behavioral responses into account. For most transactions, we apply a price elasticity of transactions of -1.5, consistent with Matheson (2011). We also take into account the reductions in payments to owners of capital and labor that would result from an FTT, which would reduce individual and corporate income taxes and payroll taxes. We do not adjust for changes in capital gains or account for FTTs in other countries.
How the revenue is used is also an important aspect of consideration of an FTT that we do not examine. Several uses of FTT revenue have been proposed: to pay back the government for the costs of bailouts provided in the recent financial crisis, to create a fund to finance future bailouts if they are needed, to reduce other distortionary taxes, to pay for the maintenance or expansion of government spending programs, or to reduce the public debt.
33 See Baker et al. (2009) and Pollin et al. (2003).

TAX POLICY CENTER | URBAN INSTITUTE & BROOKINGS INSTITUTION 34
We distribute the FTT by assuming the burden is distributed in the same manner as a corporate tax rate increase. The Tax Policy Center distributes the corporate income tax as falling 80 percent on owners of capital and 20 percent on labor.34 Following convention, our distributional estimates do not take behavioral responses into account, though we discuss how doing so would likely make the tax even more progressive. The offset reductions in income and payroll taxes are also included in the distributional analysis.
REVENUE EFFECTS
The revenue potential of an FTT stems from the fact that the volume of financial transactions is enormous, with face value many times as large as GDP (see figure 2). As a result, even a low tax rate could generate substantial revenue. The actual relation between a given tax rate and the revenue generated, however, will depend on design features as discussed in section III. A broad-based tax will raise more revenue than a narrow one. Coordination among countries can reduce the scope for tax avoidance and thus boost revenue in each country.
Figure 2. Securities Trading Volume, 1998-2014
0
100
200
300
400
500
600
Derivatives
Other bonds
Treasury securities
NASDAQ stocks
NYSE stocks
20142013201220112010200920082007200620052004200320022001200019991998
$Trillions
Source: “NYSE Market Data Factbook,” NYSE, http://www.nyxdata.com/nysedata/asp/factbook/main.asp; monthly data aggregated from “Nasdaq Monthly Market Summary,” NASDAQ, http://www.nasdaqtrader.com/Trader.aspx?id=MonthlyMarketSummary; “Statistics,” Securities Industry and Financial Markets Association, http://www.sifma.org/research/statistics.aspx; “Derivatives statistics,” Bank for International Settlements, http://www.bis.org/statistics/derstats.htm?m=6%7C32.
34 See Nunns (2012) for a complete description of the Tax Policy Center’s distribution methodology.

TAX POLICY CENTER | URBAN INSTITUTE & BROOKINGS INSTITUTION 35
Revenues from FTTs vary widely across countries and are procyclical, meaning they raise more when the economy is booming and less when the economy falters. The UK stamp duty raised 0.45 percent of British GDP in 2000. From 2001 to 2008, it raised between 0.2 and 0.3 percent of GDP, which would be the equivalent of about $44 billion to $65 billion annually in the United States today assuming a similar revenue yield from the tax. As of 2006, before the financial crisis, FTTs raised 0.8 percent of GDP in Taiwan, 0.6 percent in South Africa, and just under 0.5 percent of GDP in Switzerland.
Estimates of the impact of proposed FTTs vary widely. The Joint Committee on Taxation estimates the Harkin-DeFazio proposal would raise about 0.2 percent of GDP (Defazio 2011). Baker et al. (2009) estimate their proposed FTT would raise about 1.2 percent of GDP as of 2008, even if the tax reduced the number of transactions by half.
Tax Rate
Fiscal Year
2016 2017 2018 2019 2020 2021 2022 2023 2024 2025 2016-25
0.01% 12.2 16.7 17.3 17.9 18.5 19.2 19.8 20.5 21.2 21.9 185.0
0.10% 38.4 52.0 53.1 54.0 54.9 55.9 56.9 57.8 58.8 59.7 541.5
0.50% 38.0 51.1 51.7 52.1 52.5 52.9 53.3 53.7 54.1 54.5 514.0
Addendum 1: Baseline financial transactions ($trillions)
Total 630.6 659.5 687.6 716.0 746.7 778.6 811.7 846.0 881.6 918.4 7,676.6
Securities 244.6 255.8 266.7 277.7 289.6 302.0 314.8 328.1 341.9 356.2 2,977.2
Deriva-tives 386.0 403.7 421.0 438.3 457.1 476.6 496.9 517.9 539.7 562.2 4,699.5
Addendum 2: Static revenue ($billions; calendar year)
0.01% 21.4 22.4 23.4 24.3 25.3 26.4 27.5 28.7 29.8 31.0 260.3
0.10% 214.3 224.0 233.8 243.2 253.5 264.2 275.1 286.5 298.3 310.5 2,603.4
0.50% 1,071.5 1,120.1 1,169.1 1,216.1 1,267.5 1,320.8 1,375.7 1,432.6 1,491.6 1,552.3 13,017.2
Source: Urban-Brookings Tax Policy CenterNotes: Tax rate applies to all financial transactions except purchases and sales of derivatives, which are taxed at 1/10 of the rate (i.e., 0.001 percent, 0.01 percent or 0.05 percent respectively) as percentage of notional value of the trade.
Table 4. Revenue Potential of a US Financial Transactions Tax, in Billions of Dollars (Effective January 1, 2016)

TAX POLICY CENTER | URBAN INSTITUTE & BROOKINGS INSTITUTION 36
Schulmeister, Schratzenstaller, and Picek (2008) find that a very small (0.01 percent) tax on worldwide stocks, bonds, and derivatives could raise roughly 0.3 percent of world GDP even if trading volume fell by 40 percent. The Joint Committee on Taxation estimates take into account offsets in income and payroll tax revenues, but the other two estimates do not appear to account for these offsets.
Table 4 displays our revenue estimates. The 0.01 percent base tax would raise $185 billion over the 2016 to 2025 time period, less than 0.1 percent of projected GDP. Raising the base tax rate by a factor of 10 to 0.1 percent would increase the revenue yield to $541 billion, or a little over 0.2 percent of GDP. This less-than-proportionate increase in revenue arises because trading is expected to be substantially reduced as the rate increases. Indeed, if the rate were increased further to 0.5 percent, revenue would be slightly lower than at a 0.1 percent base rate. The reduction in trading as tax rates rise reflects the high (-1.5) elasticity we assume applies to nearly all trades and the continuing decline in transactions costs (we assume transactions costs steadily fall to half their 2010 levels by 2035). With declining transactions costs the reduction in trading volumes rises over time. For example, with a 0.01 percent tax rate, volume declines about 24 percent in the first year (2016), but by 29 percent in the tenth year (2025). At higher tax rates, the declines in trading volume over time are even steeper. Under our behavioral assumptions, revenues increase very slowly at rates above 0.1 percent and actually start to fall at a rate of about 0.2 percent. Thus, the maximum possible revenue from an FTT in the United States would probably be not much more than $50 billion per year—not a huge sum of money, but not insignificant.
DISTRIBUTIONAL EFFECTS
Whether the FTT really is a Robin Hood Tax, as its proponents claim, depends on its economic incidence, on who would actually bear the burden of the tax. Taxes are ultimately borne by people, not by corporations or other businesses. Thus, the notion that the FTT would hit “banks” or “investment houses” is misguided. It may well be remitted by the current owners, executives, or leading traders of such institutions, but they may have little relation to the people who were involved in the choices that led to the financial crisis. Indeed, if the premise of the FTT is that too many assets turn over too quickly, imposing an FTT now as a way to punish the financial-sector institutions at the time of the crisis may be particularly ineffective, because the burden would only fall on those owners of assets who chose to hold their assets in the intervening period, not those who traded away their assets.

TAX POLICY CENTER | URBAN INSTITUTE & BROOKINGS INSTITUTION 37
As noted above, creation of an FTT would lead to a drop in asset values, which would at least initially be borne by existing holders of assets. The distribution of wealth in general is quite skewed in the United States, with distribution of financial assets even more skewed. The top 1 percent of households held almost two-thirds of all financial securities in 2010 (Wolff 2012). As a result, the initial impact of an FTT should be very progressive. In the long run, the tax raises the cost of capital. The burden falls on owners of capital, who get slightly lower after-tax rates of return, and workers, who earn less because productivity-enhancing capital becomes scarcer (Matheson 2011). The longer-
Expanded cash income percentile
Share of total federal tax change
Percent Change in After-Tax Income Average Federal Tax Rate
0.01% tax 0.1% tax Current law 0.01% tax 0.1% tax
First quintile 1.3 -0.1 -0.5 4.3 4.3 4.7
Second quintile 3.0 -0.1 -0.6 8.3 8.4 8.9
Middle quintile 6.5 -0.1 -0.8 13.7 13.8 14.4
Fourth quintile 12.8 -0.1 -1.1 17.4 17.5 18.3
Fifth quintile 75.4 -0.3 -2.7 26.3 26.5 28.3
All 100.0 -0.2 -1.8 20.4 20.5 21.8
Addendum
80-90 10.6 -0.1 -1.3 20.3 20.4 21.4
90-95 9.5 -0.2 -1.7 22.2 22.4 23.6
95-99 15.2 -0.2 -2.3 25.8 26.0 27.5
Top 1 percent 40.1 -0.5 -5.1 34.1 34.4 37.4
Top 0.1 percent 23.7 -0.7 -6.7 35.6 36.1 39.9
Source: Urban-Brookings Tax Policy Center Microsimulation Model (version 0515-1). Notes: Tax rate applies to all financial transactions except purchases and sales of derivatives, which are taxed at 1/10 of the rate (i.e., 0.001 percent or 0.01 percent respectively) as percentage of notional value of the trade. By convention, distributional estimates do not account for behavioral responses (e.g., trading less). The actual tax change and resulting change in after-tax income and change in federal tax rate would be much smaller.
Table 5. Distribution of Tax Change from Imposition of Financial Transactions Tax at 0.01 or 0.1 Percent Rate in 2016

TAX POLICY CENTER | URBAN INSTITUTE & BROOKINGS INSTITUTION 38
term distributional effects would be more mixed than in the short run.
Table 5 shows our estimates of the long-run distribution of the burden of an FTT. The tax is quite progressive; about 75 percent of the burden falls on taxpayers in the highest-income quintile and more than 40 percent falls on the top 1 percent. This pattern is true regardless of the rate chosen because the distribution table, by convention, does not account for behavioral response.
The tax grows as a share of income. The 0.1 percent FTT imposes a tax burden of 0.5 percent of after-tax income in the lowest-income group, rising to 1.0 percent in the fourth quintile. For the top 1 percent, the tax equals a hefty 5 percent of after-tax income. These estimates are static—hence, they overstate the overall tax burden induced by the FTT.
A more complete modeling would likely show an even more concentrated burden. To the extent the tax thwarts rent seeking in the financial sector, those effects would be highly concentrated among taxpayers at the top of the income distribution. If the tax hits pension funds especially hard, though, it could have a disproportionate effect on retirees and workers with relatively moderate incomes. As noted above, however, discouraging trading within funds could indirectly benefit participants to the extent that such trading is unproductive.

TAX POLICY CENTER | URBAN INSTITUTE & BROOKINGS INSTITUTION 39
7. CONCLUSION
FTTs attract interest in part because the base is so large that even a tiny tax rate would raise significant revenue. When combined with the potential to reduce the negative effects of speculation and rent seeking—including both the wasted resources invested in the activity and the potentially negative macroeconomic spillovers—and the potential to have the financial sector pay for some of the benefits it has received and the costs it has imposed on the economy, the case for an FTT is very tempting.
But the key question is whether an FTT is the best option relative to other potential taxes in terms of economic costs and benefits, fairness, and costs of administration and compliance.
An FTT at the rates being proposed and adopted elsewhere would discourage all trading, not just speculation and rent seeking. It appears as likely to increase market volatility as to curb it. It would create new distortions among asset classes and across industries. As a tax on gross rather than net activity, and as an input tax that is not creditable and thus cascades, the FTT clearly can most optimistically be considered a second-best solution. Over the long term, it appears poorly targeted at the kinds of financial-sector excesses that led to the Great Recession. If the goal is to have the financial sector pay the costs of its past or future bailouts and compensate the rest of the country for the costs imposed in the financial crisis, an FAT or VAT might be more effective and less distortionary.
Nevertheless, comparing an FTT (or any real-world tax) against an ideal income or consumption tax would be inappropriate. Most feasible taxes are distortionary. It might well be that the marginal cost of raising revenue via a well-designed FTT is lower than via increases in individual or corporate income taxes.
The ideal tool to measure the efficiency implications of an FTT would be a well-formed general equilibrium model of the economy that included fully specified financial markets with fundamental traders and noise traders, rent seeking behavior, financial institutions with reserve requirements, and firms and households that supply and demand capital. There is thus a great deal of scope for future research.

TAX POLICY CENTER | URBAN INSTITUTE & BROOKINGS INSTITUTION 40
APPENDIX A. REVENUE ESTIMATING AND DISTRIBUTIONAL METHODOLOGY FOR FINANCIAL TRANSACTIONS TAXES
The FTT proposals we examine are structured along the lines proposed by Baker and others.35 The options impose tax on stock trades, bond trades (times number of years to maturity), option premiums, foreign exchange spot transactions, the underlying notional values of futures, and the underlying notional values swaps (times number of years to maturity). Rates on options, foreign exchange spot transactions, futures, and swaps are 1/10th the base rates that apply to stocks and bonds (0.01 percent in option 1, 0.1 percent in option 2, and 0.5 percent in option 3). Assuming the average years to maturity of traded bonds is two years, the rate for a one-year bond is set at one-half the base rate, so the rate on bonds averages out to the same rate that applies to stock. A similar adjustment is made to swaps, so the rate averages out to 1/10th the base rate.
Values of transactions by instrument in 2014 were obtained from the various sources cited in Baker et al. (2009), with some differences in which source was used for a particular transaction.
Transactions costs for futures were generally taken from Schulmeister et al. (2008, 67, table A4), and the same values were used for swaps. Foreign currency transactions costs were taken from Matheson (2011). Transactions costs for stock trades were assumed to be 100 times the cost for a corresponding futures trade in the same instrument,36 with higher costs assumed in smaller markets (e.g., BATS, or Better Alternative Trading System).
The price elasticity applied to all transactions was -1.5, with the exception of futures for agricultural commodities, for which an elasticity of -0.25 was assumed. (The price of a transaction is the estimated transactions cost as a share of the dollar value plus the tax.) These elasticity assumptions are consistent with the various elasticity estimates reported in Matheson (2011, 17, table 5).
Baseline transactions were forecast from 2014 levels through 2025, assuming they would all grow at the same rate as nominal GDP, rather than at the much higher rate preceding the financial crisis that began in 2008.37 Transactions costs were assumed to
35 See Baker et al. (2009) and Pollin et al. (2003).36 Schulmeister et al. (2008, 48) state, “transactions costs in ‘traditional’ spot markets are roughly 100 times higher than in ‘modern’ derivatives markets,” and using this factor provides estimates that appear reasonable relative to the older estimates cited, for example, in Pollin et al. (2003).37 See figure 2 for the recent history of asset trading levels. The GDP forecast is from the Congressional Budget Office (2015).

TAX POLICY CENTER | URBAN INSTITUTE & BROOKINGS INSTITUTION 41
decline at a uniform rate to half their 2010 levels by 2035, continuing (at a much slower rate) the decline in transactions costs over the past several decades.
Static FTT revenue estimates for calendar years 2016 through 2025 were estimated for each option by applying the tax rate for each instrument to the forecasted amount of transactions in that instrument. The first step in developing actual revenue estimates was to estimate FTT tax liabilities on a calendar year basis in the same manner as the static estimates, except that the behavioral response was reflected by adding the tax rate to the price inclusive of transactions costs and applying the elasticity formula.38 These calendar-year FTT liability estimates were then adjusted for the offset that applies to all excise taxes. The offset results from the revenue estimating convention that the price level is fixed, so that imposition of a new excise (like an FTT) must reduce payments to labor (e.g., wages) and capital (e.g., business profits). The reductions in payments to labor and capital in turn reduce revenues from individual income, corporate income, and payroll taxes. Generally, this offset is equivalent to about 25 percent of per offset revenues from an excise tax. These calendar post offset estimates were then converted to a federal fiscal year receipts basis.39
DISTRIBUTIONAL METHODOLOGY
Because the long-run effect of an FTT is likely to raise the user cost of capital (as explained in the text), we assume its burden is distributed in the same manner as the corporate income tax. The Tax Policy Center distributes 20 percent of the corporate income tax burden to labor, 20 percent to the normal return to all capital, and 60 percent to supernormal returns to corporate equity (shareholders). Labor income includes wages, employee retirement contributions, distributions (excluding rollovers) from defined contribution plans and defined benefit plans, and the employer’s share of Social Security and Medicare taxes (i.e., FICA). Labor income also includes the labor component of self-employment and partnership income, assumed to be 80 percent of the Self-Employment Contributions Act (SECA) tax base. The normal return to capital includes all interest income (taxable and nontaxable), the capital income share of the SECA base (the remaining 20 percent of that base), and 40 percent of dividends, all capital gains, and income from pass-throughs not subject to SECA. Supernormal returns to capital include 60 percent of
38 Assuming a constant elasticity, e (in absolute value), the new trading level after imposition of a tax of t per transaction would be Q ((P+t)/P)-e where Q is the initial quantity of transactions and P is the “price” of transactions (i.e., transaction costs).39 We assume 75 percent of calendar-year liabilities (net of the offset) are received in the same fiscal year, and the remaining 25 percent are received in the following fiscal year.
TAX POLICY CENTER | URBAN INSTITUTE & BROOKINGS INSTITUTION 42
dividends and 60 percent of capital gains on stocks.
The offset is also distributed by reducing factor incomes, which reduces individual income, corporate income, and payroll tax revenues. These revenue reductions are distributed in the same manner as the underlying taxes [i.e., individual income taxes to the taxpayer, the corporate income tax as described above, and the payroll tax (both the employee and employer shares) to employees and the self-employed].
TAX POLICY CENTER | URBAN INSTITUTE & BROOKINGS INSTITUTION 43
Amihud, Yakov, and Haim Mendelson. 1992. “Transaction Taxes and Stock Values.” In Modernizing US Securities Regulations, edited by Kenneth Lehn and Robert W. Kamphius, Jr. Burr Ridge, IL: Irwin Professional Publishing.
Arbelaez, Maria A., Leonard E. Burman, and Sandra Zuluaga. 2005. “The Bank Debit Tax in Colombia.” In Fiscal Reform in Colombia, edited by Richard M. Bird, James M. Poterba, and Joel Slemrod. Cambridge, MA: MIT Press.
Arcand, Jean-Louis, Enrico Berkes, and Ugo Panizza. 2012. “Too Much Finance?” IMF Working Paper 12/161. Washington, DC: International Monetary Fund.
Auten, G., and Thornton Matheson. 2010. “The Market Impact and Incidence of a Securities Transaction Tax: The Case of the US SEC Levy.” Paper presented at the 103rd Annual Conference of the National Tax Association, Chicago, IL.
Baca-Campodónico, Jorge, Luiz de Mello, and Andrei Kirilenko. 2006. “The Rates and Revenue of Bank Transaction Taxes.” Economics Department Working Papers No. 494. Paris: Organisation for Economic Co-operation and Development.
Baily, Martin Neil, and Douglas J. Elliott. 2013. “The Role of Finance in the Economy: Implications for Structural Reform of the Financial Sector.” Washington, DC: Brookings Institution. http://www.brookings.edu/~/media/research/files/papers/2013/07/11-finance-role-in-economy-baily-elliott/11-finance-role-in-economy-baily-elliott.pdf.
Baker, Dean. 2008. The Benefits of a Financial Transaction Tax. Washington, DC: Center for Economic and Policy Research.
Baker, Dean, and Helene Jorgensen. 2012. “The Relationship between Financial Transactions Costs and Economic Growth.” Issue Paper. Washington, DC: Center For Economic and Policy Research.
Baker, Dean, Robert Pollin, Travis McArthur, and Matt Sherman. 2009. “The Potential Revenue from Financial Transactions Taxes.” Joint Working Paper No. 212. Washington, DC: Center For Economic and Policy Research; and Amherst, MA: Political Economy Research Institute.
REFERENCES

TAX POLICY CENTER | URBAN INSTITUTE & BROOKINGS INSTITUTION 44
Baltagi, Badi H., Dong Li, and Qi Li. 2006. “Transaction Tax and Stock Market Behavior: Evidence from an Emerging Market.” Empirical Economics 31 (2): 393–408.
Barber, Brad M., and Terrance Odean. 2000. “Trading Is Hazardous to Your Wealth: The Common Stock Investment Performance of Individual Investors.” Journal of Finance 55 (2): 773–806.
Bernanke, Ben S. 2009. “Financial Reform to Address Systemic Risk.” Speech at the Council on Foreign Relations, Washington, DC, March 10. http://www.federalreserve.gov/newsevents/speech/bernanke20090310a.htm.
Black, Fischer. 1986. “Noise.” Journal of Finance 41 (3): 529–43.
Bond, Steve, Mike Hawkins, and Alexander Klemm. 2004. “Stamp Duty on Shares and Its Effect on Share Prices.” IFS Working Paper 04/11. London: Institute for Fiscal Studies.
Brondolo, John D. 2011. “Taxing Financial Transactions: An Assessment of Administrative Feasibility.” IMF Working Paper 11/185. Washington, DC: International Monetary Fund.
Buchanan, Mark. 2012. Impact of French Financial Transaction Tax. Market Commentary, Credit Suisse.
Budish, Eric, Peer Cramton, and John Shim. 2015. “The High-Frequency Trading Arms Race: Frequent Batch Auctions As a Market Design Response.” Chicago, IL: University of Chicago.
Bureau of Economic Analysis. 2015. National Income and Product Accounts: Value Added by Industry As a Percentage of Gross Domestic Product. Washington, DC: Bureau of Economic Analysis.
Camp, Dave. 2014. Tax Reform Act of 2014. Washington, DC.
Campbell, John Y., and Kenneth A. Froot. 1994. “International Experiences with Securities Transaction Taxes.” In The Internationalization of Equity Markets, edited by Jeffrey A. Frankel, 277–303. Chicago, IL: University of Chicago Press.
Chou, Robin K., and George H. K. Wang. 2006. “Transaction Tax and Market Quality of the Taiwan Stock Index Futures.” Journal of Futures Markets 26 (12): 1195–216.

TAX POLICY CENTER | URBAN INSTITUTE & BROOKINGS INSTITUTION 45
Cochrane, John H. 2013. “Finance: Function Matters, Not Size.” Journal of Economic Perspectives 27 (2): 29–50.
Colliard, Jean-Edouard, and Peter Hoffmann. 2013. “Sand in the Chips? Evidence on Taxing Transactions in Modern Markets.” Working Paper. Frankfurt, Germany: European Central Bank.
Cœuré, Benoît. 2014. “The Optimal Size of the Financial Sector.” Speech at the European Central Bank Conference, Frankfurt, Germany, September 2. https://www.ecb.europa.eu/press/key/date/2014/html/sp140902.en.html.
Congressional Budget Office. 2015. The Budget and Economic Outlook: 2015-2025. Washington, DC: Congressional Budget Office.
Credit Suisse. 2013. “Regulatory Update: July 2013 – Financial Transaction Taxes.” https://www.credit-suisse.com/media/pb/docs/ch/unternehmen/institutionalclients/fs-transaktionssteuern-en.pdf.
Dávila, Eduardo. 2013. “Optimal Financial Transaction Taxes.” Job Market Paper. Cambridge, MA: Harvard University.
DeFazio, Peter. 2011. “Memo: Joint Tax Committee Finds Harkin, DeFazio, Wall Street Trading and Speculators Tax Generates More Than $350 Billion.” Press Release. http://defazio.house.gov/media-center/press-releases/memo-joint-tax-committee-finds-harkin-defazio-wall-street-trading-and.
DeFazio, Peter, and Tom Harkin. 2013. Wall Street Trading and Speculators Tax Act (H.R. 3313/S. 1787). Washington, DC.
DeLong, J. Bradford, Andrei Shleifer, Lawrence H. Summers, and Robert J. Waldmann. 1989. “The Size and Incidence of the Losses from Noise Trading.” Journal of Finance 44 (3): 681–96.
Deng, Yongheng, Xin Liu, and Shang-Jin Wei. 2014. “One Fundamental and Two Taxes: When Does a Tobin Tax Reduce Financial Price Volatility?” NBER Working Paper 19974. Cambridge, MA: National Bureau of Economic Research.
Diamond, Peter A., and James A. Mirrlees. 1971. “Optimal Taxation and Public Production I: Production Efficiency.” American Economic Association 61 (1): 8–27.

TAX POLICY CENTER | URBAN INSTITUTE & BROOKINGS INSTITUTION 46
Dupont, Dominique, and Gabriel Lee. 2007. “Effects of Securities Transaction Taxes on Depth and Bid-Ask Spread.” Economic Theory 31 (2): 393–400.
Easterly, William, Roumeen Islam, and Joseph E. Stiglitz. 2000. “Shaken and Stirred: Explaining Growth Volatility.” In Annual World Bank Conference on Development Economics. Washington, DC: The World Bank.
Ellison, Keith. 2013. Inclusive Prosperity Act of 2013. Washington, DC.
Ericsson, J., and R. Lindgren. 1992. Transaction Taxes and Trading Volume on Stock Exchanges: An International Comparison. Working Paper 39. Stockholm: Stockholm School of Economics.
European Commission. 2011. “Impact Assessment: Proposal for a Council Directive on a Common System of Financial Transaction Tax and Amending Directive 2008/7/EC.” Working Paper 1102. Brussels: European Commission.
———. 2013. “Impact Assessment: Proposal for a Council Directive Implementing Enhanced Cooperation in the Area of Financial Transaction Tax, Analysis of Policy Options and Impacts.” Working Document 28. Brussels: European Commission.
EY Tax Services. 2015. “EU Finance Ministers issue statement on renewed commitment to implement EU financial transaction tax.” London: EY Tax Services. http://www.ey.com/Publication/vwLUAssets/ey-eu-fms-issue-statement-on-renewed-commitment-to-implement-eu-ftt/$FILE/ey-eu-fms-issue-statement-on-renewed-commitment-to-implement-eu-ftt.pdf.
French Tax Code. 2012. Article 235 ter ZD. Paris.
“Germany Sees Compromise on EU Dealing Tax.” 2015. Reuters. May 12. http://www.reuters.com/article/2015/05/12/eu-tax-schaeuble-idUSL5N0Y34FT20150512.
Gray, Jack, Stephany Griffith-Jones, and Joakim Sandberg. 2012. No Exemption: The Financial Transaction Tax and Pension Funds. Network for Sustainable Financial Markets.
Greenhouse, Steven, and Graham Bowley. 2011. “Tiny Tax on Financial Trades Gains Advocates.” The New York Times. December 6.
Greenwood, Robin, and David Scharfstein. 2013. “The Growth of Finance.” Journal of Economic Perspectives 27 (2): 3–28.

TAX POLICY CENTER | URBAN INSTITUTE & BROOKINGS INSTITUTION 47
Habermeier, Karl F., and Andrei Kirilenko. 2001. “Securities Transaction Taxes and Financial Markets.” IMF Working Paper 01/51. Washington, DC: International Monetary Fund.
Haferkorn, Martin, and Kai Zimmermann. 2013. “Securities Transaction Tax and Market Quality: The Case of France.” Working Paper. Frankfurt, Germany: Goethe University.
Hau, Harald. 2006. “The Role of Transaction Costs for Financial Volatility: Evidence from the Paris Bourse.” Journal of the European Economic Association 4 (4): 862–90.
Hillman, David, and Christina Ashford. 2012. Financial Transaction Tax: Myth-Busting. London: Stamp out Poverty.
HSBC. 2013. “Saudi Arabia.” Riyadh, Saudia Arabia: HSBC. https://globalconnections.hsbc.com/downloads/treasury_management_profile-sa.pdf.
Hu, Shing-Yang. 1998. “The Effects of the Stock Transaction Tax on the Stock Market: Experience from Asian Markets.” Pacific Basin Finance Journal 6 (3–4): 347–64.
International Association of Deposit Insurers. 2013. Enhanced Guidance for Effective Deposit Insurance Systems: Mitigating Moral Hazard. Basel, Switzerland: International Association of Deposit Insurers, Research and Guidance Committee.
International Monetary Fund. 2010. A Fair and Substantial Contribution by the Financial Sector: Final Report for the G-20. Washington, DC: International Monetary Fund.
Jackson, P. D., and A. T. O’Donnell. 1985. “The Effects of Stamp Duty on Equity Transactions and Prices in the UK Stock Exchange.” Working Paper. London: Bank of England.
Jones, Charles M. 2013. “What Do We Know about High-Frequency Trading?” Columbia Business School Research Paper No. 13-11. New York: Columbia University.
Jones, Charles M., and Paul J. Seguin. 1997. “Transaction Costs and Price Volatility: Evidence from Commission Deregulation.” American Economic Review 87 (4): 728–37.
Keen, Michael. 2013. “Targeting, Cascading, and Indirect Tax Design.” IMF Working Paper 13/57. Washington, DC: International Monetary Fund.

TAX POLICY CENTER | URBAN INSTITUTE & BROOKINGS INSTITUTION 48
Keightley, Mark P. 2010. “A Securities Transaction Tax: Financial Markets and Revenue Effects.” CRS Report 41192. Washington, DC: Congressional Research Service.
Keynes, John Maynard. 1936. The General Theory of Employment, Interest and Money. 2007 Edition. New York and London: Palgrave Macmillan.
Kiefer, Donald W. 1987. “A Stock Transfer Tax: Preliminary Economic Analysis.” Washington, DC: Library of Congress, Congressional Research Service.
KPMG. 2013. “Hong Kong SAR Tax Profile.” Hong Kong: KPMG International. https://www.kpmg.com/Global/en/services/Tax/regional-tax-centers/asia-pacific-tax-centre/Documents/CountryProfiles/HongKong.pdf.
Kupiec, Paul H. 1996. “Noise Traders, Excess Volatility, and a Securities Transactions Tax.” Journal of Financial Services Research 10 (2): 115–29.
Lanne, Markku, and Timo Vesala. 2010. “The Effect of a Transaction Tax on Exchange Rate Volatility.” International Journal of Finance & Economics 15 (2): 123–33.
Lepone, Andrew, and Alexander Sacco. 2013. “The Impact of Message Traffic Regulatory Restrictions on Market Quality: Evidence from Chi-X Canada.” Working Paper. Sydney, Australia: University of Sydney.
Lewis, Michael. 2014. Flash Boys. New York: W. W. Norton & Company.
Liu, Shinhua. 2007. “Securities Transaction Tax and Market Efficiency: Evidence from the Japanese Experience.” Journal of Financial Services Research 32 (3): 161–76.
Liu, Shinhua, and Zhen Zhu. 2009. “Transaction Costs and Price Volatility: New Evidence from the Tokyo Stock Exchange.” Journal of Financial Services Research 36 (1): 65–83.
London Economics. 2013. “The Impact of a Financial Transaction Tax on Corporate and Sovereign Debt.” Special Interest Paper. City of London.
Matheson, Thornton. 2011. “Taxing Financial Transactions: Issues and Evidence.” IMF Working Paper 11/54. Washington, DC: International Monetary Fund.
———. 2014. “The Impact of a Low-Rate Securities Transaction Tax on a Highly Liquid Market.” FinanzArchiv 70 (4): 487–510.

TAX POLICY CENTER | URBAN INSTITUTE & BROOKINGS INSTITUTION 49
Merrill, Peter. 1997. Taxation of Financial Services under a Consumption Tax. Washington, DC: AEI Press.
Meyer, Stephan, Martin Wagener, and Christof Weinhardt. 2013. “Politically Motivated Taxes in Financial Markets: The Case of the French Financial Transaction Tax.” Journal of Financial Services Research 47: 177–202.
Nunns, Jim. 2012. “How TPC Distributes the Corporate Income Tax.” Washington, DC: Urban-Brookings Tax Policy Center. http://www.taxpolicycenter.org/UploadedPDF/412651-Tax-Model-Corporate-Tax-Incidence.pdf.
Oxera. 2011. “What Would Be the Economic Impact of the Proposed Financial Transaction Tax on the EU?” Oxera Consulting Ltd.
Philippon, Thomas. 2008. “The Evolution of the US Financial Industry from 1860 to 2007: Theory and Evidence.” NYU Stern Working Paper. New York: New York University.
———. 2015. “Has the US Finance Industry Become Less Efficient? On the Theory and Measurement of Financial Intermediation.” American Economic Review 105 (4): 1408–38.
Philippon, Thomas, and Ariell Reshef. 2013. “An International Look at the Growth of Modern Finance.” Journal of Economic Perspectives 27 (2): 73–96.
Pollin, Robert, Dean Baker, and Marc Schaberg. 2003. “Security Transactions Taxes for US Financial Markets.” Eastern Economic Review 29 (4): 527–58.
Pomeranets, Anna. 2012. “Financial Transaction Taxes: International Experiences, Issues and Feasibility.” Bank of Canada Review Autumn: 3–13.
Pomeranets, Anna, and Daniel G. Weaver. 2013. “Security Transaction Taxes and Market Quality.” Working Paper. Ottawa: Bank of Canada.
Schulmeister, Stephan, Margit Schratzenstaller, and Oliver Picek. 2008. “A General Financial Transaction Tax: Motives, Revenues, Feasibility and Effects.” WIFO. SSRN Electronic Journal.
SEC (Securities and Exchange Commission). 2014. Equity Market Structure Literature Review Part II: High Frequency Trading. Washington, DC: US Securities and Exchange Commission, Division of Trading and Markets.

TAX POLICY CENTER | URBAN INSTITUTE & BROOKINGS INSTITUTION 50
Shackelford, Douglas A., Daniel Shaviro, and Joel B. Slemrod. 2010. “Taxation and the Financial Sector.” Public Law and Legal Theory Working Paper 199. New York: New York University.
Shaviro, Daniel. 2012. “The Financial Transactions Tax versus the Financial Activities Tax.” Tax Notes 135 (April 23): 453–474.
Shorter, Gary, and Rena S. Miller. 2014. “High-Frequency Trading: Background, Concerns, and Regulatory Developments.” CRS Report 43608. Washington, DC: Congressional Research Service.
Stiglitz, Joseph E. 1989. “Using Tax Policy to Curb Speculative Short-Term Trading.” Journal of Financial Services Research 3: 101–15.
Subrahmanyam, Avanidhar. 1998. “Transaction Taxes and Financial Market Equilibrium.” Journal of Business 71 (1): 81–118.
Summers, Lawrence H., and Victoria P. Summers. 1989. “When Financial Markets Work Too Well: A Cautious Case for a Securities Transactions Tax.” Journal of Financial Services Research 3 (2): 261–86.
Tax Policy Center. n.d. “Brief Description of the Tax Model.” Washington, DC: Urban-Brookings Tax Policy Center. http://taxpolicycenter.org/taxtopics/Brief-Description-of-the-Model-2013.cfm.
Thorndike, Joseph J. 2008. “Speculation and Taxation: Time for a Transaction Tax?” Tax Notes 119 (June): 1367.
Tobin, James. 1978. “A Proposal for International Monetary Reform.” Eastern Economic Journal 4 (3–4): 153–59.
Umlauf, Steven R. 1993. “Transaction Taxes and the Behavior of the Swedish Stock Market.” Journal of Financial Economics 33 (2): 227–40.
US Securities and Exchange Commission. 2015. “Fee Rate Advisory #4 for Fiscal Year 2015.” Press Release. Washington, DC: US Securities and Exchange Commission. http://www.sec.gov/news/pressrelease/2015-42.html.

TAX POLICY CENTER | URBAN INSTITUTE & BROOKINGS INSTITUTION 51
US Treasury. 2015. “General Explanations of the Administration’s Fiscal Year 2016 Revenue Proposals.” Washington, DC: US Treasury. http://www.treasury.gov/resource-center/tax-policy/Documents/General-Explanations-FY2016.pdf.
Wessel, David. 2010. In FED We Trust: Ben Bernanke’s War on the Great Panic. New York: Three Rivers Press.
Wolff, Edward N. 2012. “The Asset Price Meltdown and the Wealth of the Middle Class.” NBER Working Paper 18559. Cambridge, MA: National Bureau of Economic Research.
Woolley, Paul. 2010. “Why Are Financial Markets So Inefficient and Exploitative—And a Suggested Remedy.” In The Future of Finance: The LSE Report, 121–43. London: London School of Economics and Political Science.
Zingales, Luigi. 2015. “Does Finance Benefit Society?” CEPR Discussion Paper No. DP10350. London: Centre for Economy Policy Research.

The Tax Policy Center is a joint venture of the Urban Institute and Brookings Institution.
For more information, visit taxpolicycenter.org or email [email protected]
Copyright © 2015. Urban Institute. Permission is granted for reproduction of this file, with attribution to the Urban-Brookings Tax Policy Center.