financial uk - tourism holdings ltd · 2015-09-27 · cash flow hedge reserve movement net of tax...
TRANSCRIPT

Tourism Holdings LimitedAnnual Financial Statements for the year ended 30 June 2015
USA AUSTRALIA
NEW ZEALAND
FINANCIALSTATEMENTS UK
thl Annual Financial Statements 2015

05 Consolidated Statement of Changes In Equity
08 Reconciliation of Profit after Taxation with Cash Flows from Operating Activities
06Consolidated Statement of Financial Position
09Notes to the Financial Statements
02 Directors’ Statement
03 Consolidated Income Statement
04Consolidated Statement of Comprehensive Income
07Consolidated Statement of Cash Flows
52Independent Auditor’s Report
53Statutory Information
60Board of Directors
01Corporate Information
thl Annual Financial Statements 2015

Corporate Information
Directors
Rob Campbell Christina Domecq Kay Howe David Neidhart Gráinne Troute Graeme Wong
Registered office
Level 1 83 Beach Road Auckland 1010 New Zealand
Share register
Tourism Holdings Limited shares are listed on the New Zealand Stock Exchange (NZX)
Share registrar
Link Market Services Limited
Auditors
PricewaterhouseCoopers
Solicitors
Minter Ellison Rudd Watts
Bankers
Westpac New Zealand Limited
Westpac Banking Corporation
ANZ Bank New Zealand Limited
thl Annual Financial Statements 2015 1

2 thl Annual Financial Statements 2015
Directors’ Statement
The Directors of Tourism Holdings Limited are pleased to present to shareholders the Annual Financial Statements for Tourism Holdings Limited and its controlled entities (together the ‘Group’) for the year to 30 June 2015.
The Directors are responsible for presenting financial statements in accordance with New Zealand law and generally accepted accounting practice, which give a true and fair view of the financial position of the Group as at 30 June 2015 and the results of the Group’s operations and cash flows for the year ended on that date.
The Directors consider the financial statements of the Group have been prepared using accounting policies which have been consistently applied and supported by reasonable judgements and estimates and that all relevant financial reporting and accounting standards have been followed.
The Directors believe that proper accounting records have been kept which enable, with reasonable accuracy, the determination of the financial position of the Group and facilitate compliance of the financial statements with the Financial Markets Conduct Act 2013.
The Directors consider that they have taken adequate steps to safeguard the assets of the Group, and to prevent and detect fraud and other irregularities. Internal control procedures are also considered to be sufficient to provide a reasonable assurance as to the integrity and reliability of the financial statements.
This document, in conjunction with the Shareholder Annual Review, constitutes the 2015 Annual Report to Shareholders of Tourism Holdings Limited.
This Annual Report is signed on behalf of the Board by:
Rob Campbell Graeme Wong Chairman Director
27 August 2015
thl Annual Financial Statements 2015 3
NOTES2015
$000’s2014
$000’s
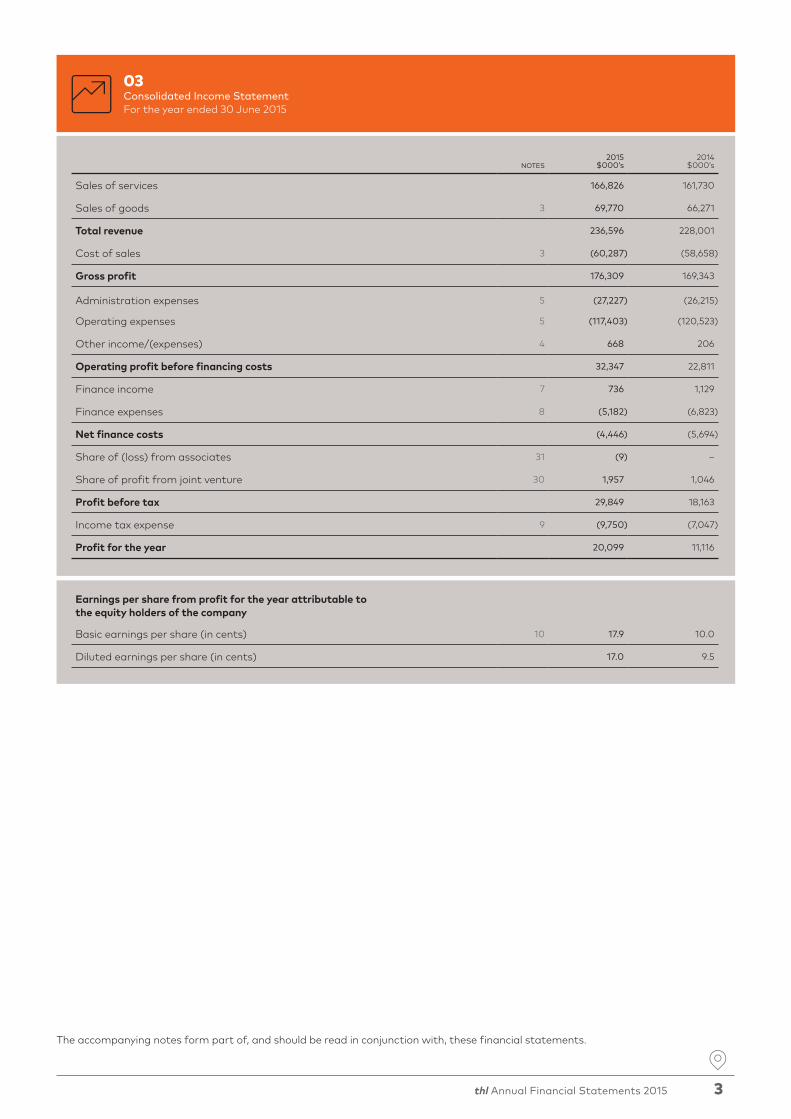
Sales of services 166,826 161,730
Sales of goods 3 69,770 66,271
Total revenue 236,596 228,001
Cost of sales 3 (60,287) (58,658)
Gross profit 176,309 169,343
Administration expenses 5 (27,227) (26,215)
Operating expenses 5 (117,403) (120,523)
Other income/(expenses) 4 668 206
Operating profit before financing costs 32,347 22,811
Finance income 7 736 1,129
Finance expenses 8 (5,182) (6,823)
Net finance costs (4,446) (5,694)
Share of (loss) from associates 31 (9) –
Share of profit from joint venture 30 1,957 1,046
Profit before tax 29,849 18,163
Income tax expense 9 (9,750) (7,047)
Profit for the year 20,099 11,116
Earnings per share from profit for the year attributable to the equity holders of the company
Basic earnings per share (in cents) 10 17.9 10.0
Diluted earnings per share (in cents) 17.0 9.5
03Consolidated Income StatementFor the year ended 30 June 2015
The accompanying notes form part of, and should be read in conjunction with, these financial statements.

4 thl Annual Financial Statements 2015
NOTES2015
$000’s2014
$000’s
Profit for the year 20,099 11,116
Other comprehensive income
Items that may be reclassified subsequently to profit or loss
Foreign currency translation movement 21 6,958 (5,169)
Cash flow hedge reserve movement net of tax 22 (902) 463
Other comprehensive income/(loss) for year net of tax 6,056 (4,706)
Total comprehensive income for year attributable to equity holders of the company 26,155 6,410
04Consolidated Statement of Comprehensive IncomeFor the year ended 30 June 2015
The accompanying notes form part of, and should be read in conjunction with, these financial statements.

thl Annual Financial Statements 2015 5
The accompanying notes form part of, and should be read in conjunction with, these financial statements.
NOTES
SHARE CAPITAL
$000’s
RETAINED EARNINGS
$000’s
CASH FLOW HEDGE
RESERVE $000’s
OTHER RESERVES
$000’s
TOTAL EQUITY $000’s
Opening balance as at 1 July 2014 152,399 9,504 (691) (1,316) 159,896
Comprehensive income
Net profit for the year ended 30 June 2015 23 – 20,099 – – 20,099
Other comprehensive income
Cash flow hedge reserve movement (net of tax) 22 – – (902) – (902)
Foreign currency translation reserve 21 – – – 6,958 6,958
Total comprehensive income – 20,099 (902) 6,958 26,155
Transactions with owners
Dividends on ordinary shares 11 – (14,655) – – (14,655)
Issue of ordinary shares 24 980 – – – 980
Transfer from employee share scheme reserve 21 113 53 – (166) –
Employee share scheme reserve 21 – – – 147 147
Total transactions with owners 1,093 (14,602) – (19) (13,528)
Closing balance as at 30 June 2015 153,492 15,001 (1,593) 5,623 172,523
Opening balance as at 1 July 2013 151,238 4,718 (1,154) 5,246 160,048
Comprehensive income
Net profit for the year ended 30 June 2014 23 – 11,116 – – 11,116
Other comprehensive income
Cash flow hedge reserve movement (net of tax) 22 – – 463 – 463
Foreign currency gain/(loss) on net investment 21 – 547 – (547) –
Foreign currency translation reserve 21 – – – (5,169) (5,169)
Total comprehensive income – 11,663 463 (5,716) 6,410
Transactions with owners
Dividends on ordinary shares 11 – (7,802) – – (7,802)
Issue of ordinary shares 24 1,097 – – – 1,097
Transfer from employee share scheme reserve 21 64 925 – (989) –
Employee share scheme reserve 21 – – – 143 143
Total transactions with owners 1,161 (6,877) – (846) (6,562)
Closing balance as at 30 June 2014 152,399 9,504 (691) (1,316) 159,896
05Consolidated Statement of Changes in EquityFor the year ended 30 June 2015
6 thl Annual Financial Statements 2015
NOTES2015
$000’s2014
$000’s
Assets
Non-current assets
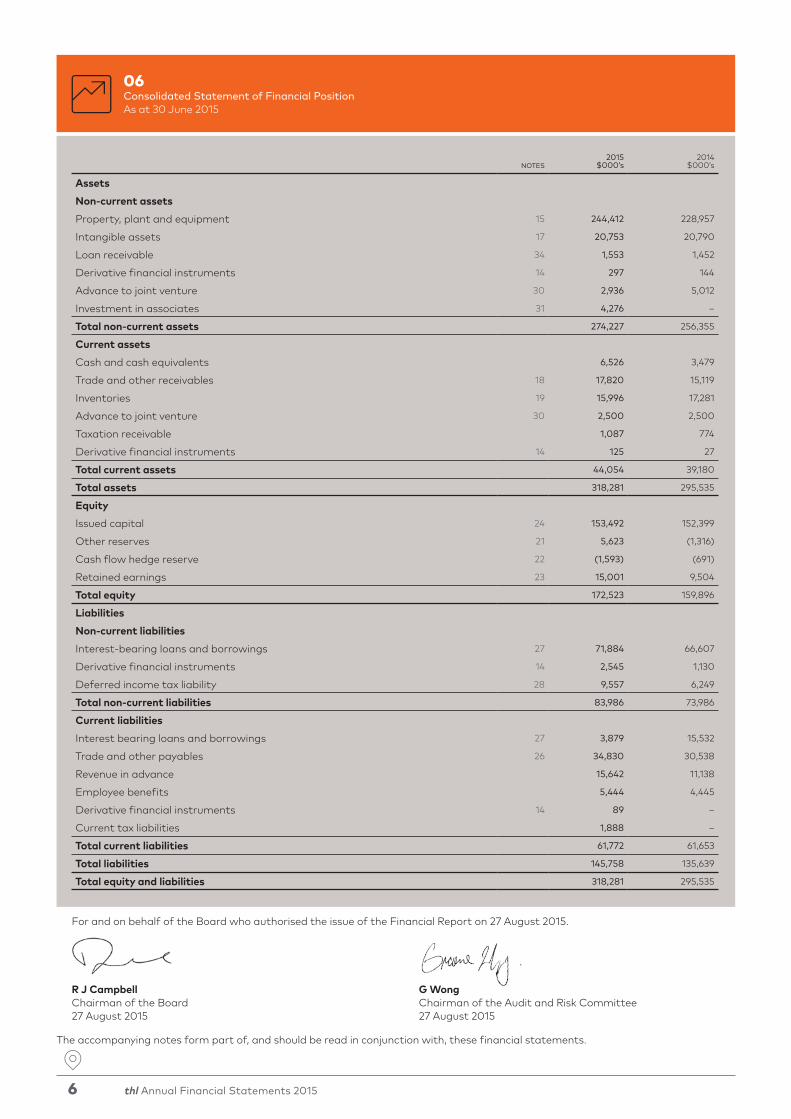
Property, plant and equipment 15 244,412 228,957
Intangible assets 17 20,753 20,790
Loan receivable 34 1,553 1,452
Derivative financial instruments 14 297 144
Advance to joint venture 30 2,936 5,012
Investment in associates 31 4,276 –
Total non-current assets 274,227 256,355
Current assets
Cash and cash equivalents 6,526 3,479
Trade and other receivables 18 17,820 15,119
Inventories 19 15,996 17,281
Advance to joint venture 30 2,500 2,500
Taxation receivable 1,087 774
Derivative financial instruments 14 125 27
Total current assets 44,054 39,180
Total assets 318,281 295,535
Equity
Issued capital 24 153,492 152,399
Other reserves 21 5,623 (1,316)
Cash flow hedge reserve 22 (1,593) (691)
Retained earnings 23 15,001 9,504
Total equity 172,523 159,896
Liabilities
Non-current liabilities
Interest-bearing loans and borrowings 27 71,884 66,607
Derivative financial instruments 14 2,545 1,130
Deferred income tax liability 28 9,557 6,249
Total non-current liabilities 83,986 73,986
Current liabilities
Interest bearing loans and borrowings 27 3,879 15,532
Trade and other payables 26 34,830 30,538
Revenue in advance 15,642 11,138
Employee benefits 5,444 4,445
Derivative financial instruments 14 89 –
Current tax liabilities 1,888 –
Total current liabilities 61,772 61,653
Total liabilities 145,758 135,639
Total equity and liabilities 318,281 295,535
For and on behalf of the Board who authorised the issue of the Financial Report on 27 August 2015.
R J Campbell G WongChairman of the Board Chairman of the Audit and Risk Committee27 August 2015 27 August 2015
06Consolidated Statement of Financial PositionAs at 30 June 2015
The accompanying notes form part of, and should be read in conjunction with, these financial statements.

thl Annual Financial Statements 2015 7
The accompanying notes form part of, and should be read in conjunction with, these financial statements.
NOTES2015
$000’s2014
$000’s
Cash flows from operating activities
Receipts from customers 168,699 164,318
Proceeds from sale of goods 69,770 65,382
Interest received 7 736 1,129
Suppliers and employees (122,847) (116,551)
Purchase of rental assets (82,202) (60,887)
Interest paid (5,282) (6,430)
Taxation paid (4,695) (2,996)
Net cash flows from operating activities 24,179 43,965
Cash flows from investing activities
Sale of property, plant and equipment 15 5,674 61
Sale of assets held for sale – 950
Repayment of advance from joint venture 30 4,033 612
Purchase of property, plant and equipment 15 (3,031) (1,596)
Purchase of intangibles (338) –
Investments in associates (3,722) –
Net cash from investing activities 2,616 27
Cash flows from financing activities
Repayment of borrowings 27 (10,440) (38,621)
Dividends paid 11 (14,655) (7,802)
Proceeds from share issue 24 756 949
Net cash flows used in financing activities (24,339) (45,474)
Net increase/(decrease) in cash balances 2,456 (1,482)
Opening cash 3,479 5,480
Foreign currency translation adjustment 591 (519)
Closing cash 6,526 3,479
07Consolidated Statement of Cash FlowsFor the year ended 30 June 2015

8 thl Annual Financial Statements 2015
NOTES2015
$000’s2014
$000’s
Operating Profit after tax 20,099 11,116
Plus/(less) non-cash items:
Depreciation 15 31,631 35,828
Amortisation of fixed term intangibles 17 1,583 1,637
Amortisation of executive share scheme 34 147 143
Movement in deferred taxation 3,459 2,952
Increase/(decrease) in provision for doubtful debts 18 74 (150)
Interest 8 (100) 393
Deferred consideration settlement 4 (1,744) –
Share of profit from joint venture and associates 30, 31 (1,948) (1,046)
Non-cash director remuneration 220 132
Total non-cash items 33,322 39,889
Plus/(less) items classified as investing activities:
Net loss/(gain) on sale of property, plant and equipment 4 1,441 101
Total items classified as investing activities 1,441 101
Reclassification of cash flows associated with rental assets
Net book value of rental assets sold 51,525 51,421
Purchase of rental assets (82,202) (60,887)
Total cash flows associated with rental assets (30,677) (9,466)
Trading cash flow 24,185 41,640
Plus/(less) movements in working capital:
Increase/(decrease) in accounts payable excluding rental assets (2,518) (4,398)
Increase/(decrease) in revenue received in advance 3,324 785
Increase/(decrease) in provision for taxation 1,580 407
Increase/(decrease) in employee benefits 1,020 1,110
Decrease/(increase) in accounts receivable (2,122) 3,116
Decrease/(increase) in inventories (1,290) 1,305
Total movements in working capital (6) 2,325
Net cash flows from operating activities 24,179 43,965
08Reconciliation of Profit after Taxation with Cash Flows from Operating ActivitiesFor the year ended 30 June 2015
The accompanying notes form part of, and should be read in conjunction with, these financial statements.

thl Annual Financial Statements 2015 9
Index to Notes to the Financial Statements
1 Statement of accounting policies 10
2 Segment note 17
3 Sales of goods 19
4 Other operating income/(expenses) 19
5 Profit before tax includes the following specific expenses 20
6 Employee benefits expense 21
7 Finance income 21
8 Finance expenses 21
9 Income tax expense 21
10 Earnings per share (EPS) 22
11 Dividends 22
12 Financial instruments 23
13 Financial risk management 23
14 Derivative financial instruments 29
15 Property, plant and equipment 30
16 Leased assets in property, plant and equipment 31
17 Intangible assets 31
18 Trade and other receivables 34
19 Inventories 34
20 Investments 35
21 Other reserves 35
22 Cash flow hedge reserve 36
23 Retained earnings 36
24 Share capital 37
25 Share-based payments 38
26 Trade and other payables 40
27 Borrowings 40
28 Deferred income tax 43
29 Imputation credits 44
30 Joint venture – Action Manufacturing LP (AMLP) 45
31 Investments in associates 47
32 Contingencies 47
33 Commitments 48
34 Related party transactions 48
35 Events after the reporting period 51

10 thl Annual Financial Statements 2015
10Notes to the Financial StatementsFor the year ended 30 June 2015
1.1 BASIS OF PRESENTATION
The primary operations of Tourism Holdings Limited (the ‘Company’ or ‘Parent’ or ‘thl’) and its subsidiaries (together ‘the Group’) are the manufacture, rental and sale of motorhomes and other tourism related activities. The Parent is domiciled in New Zealand. The registered office is Level 1, 83 Beach Road, Auckland 1010, New Zealand.
Tourism Holdings Limited is a company registered under the Companies Act 1993 and is an FMC reporting entity under Part 7 of the Financial Markets Conduct Act 2013. The financial statements of the Group have been prepared in accordance with the requirements of Part 7 of the Financial Markets Conduct Act 2013 and the NZX Listing Rules. In accordance with the Financial Markets Conduct Act 2013, because group financial statements are prepared and presented for Tourism Holdings Limited and its subsidiaries, separate financial statements for Tourism Holdings Limited are no longer required to be prepared and presented.
1.2 SUMMARY OF SIGNIFICANT ACCOUNTING POLICIES
The principal accounting policies applied in the preparation of these consolidated financial statements are set out below. These policies have been consistently applied to all the years presented.
a) Basis of preparation
The consolidated financial statements of the group have been prepared in accordance with Generally Accepted Accounting Practice in New Zealand (NZ GAAP). The group is a for-profit entity for the purposes of complying with NZ GAAP. The consolidated financial statements comply with New Zealand equivalents to International Financial Reporting Standards (NZ IFRS), other New Zealand accounting standards and authoritative notices that are applicable to entities that apply NZ IFRS. The consolidated financial statements also comply with International Financial Reporting Standards (IFRS).
The consolidated financial statements have been prepared under the historical cost convention, as modified by the revaluation of certain assets and liabilities as identified in specific accounting policies below.
The preparation of financial statements in conformity with NZ IFRS requires the use of certain critical accounting estimates. It also requires management to exercise its judgement in the process of applying the Group’s accounting policies. The areas involving a higher degree of judgement or complexity, or areas where assumptions and estimates are significant to the consolidated financial statements, are disclosed in the policies below. Tourism Holdings Limited and any other party do not have the power to alter the financial statements after they have been issued.
Comparatives have been restated where needed to conform to current-year classification and presentation. Comparative information has been reclassified to align with the current-year classification for sale of services ($1,490k increase), sales of goods ($889k increase), cost of sales ($653k increase), administration expenses ($8,553k increase) and operating expenses ($6,827k decrease).
The changes were to:
• reclassify credit card charges from operating expenses to revenue;
• reclassify commissions and online marketing costs previously netted against revenue to operating expenses; and
• reclassify certain operating expenses and costs of sales to administrative expenses.
As at 30 June 2015 and 2014 the Group has net current liabilities. This is not reflective of the benefit of rental assets that will be reclassified to inventory from non-current property, plant and equipment and subsequently sold in the normal course of business as part of the operating cycle of the United States, New Zealand and Australian rentals businesses. In addition the balance sheet reflects the seasonality of the tourism businesses, which sees increased New Zealand and Australian tourism activity over the Southern Hemisphere summer.
b) Consolidation
Subsidiaries The Group’s accounting policy for the consolidation of subsidiaries is as follows:
Subsidiaries are all entities (including structured entities) over which the Group has control. The Group controls an entity when the Group is exposed to, or has rights to, variable returns from its involvement with the entity and has the ability to affect those returns through its power over the entity. Subsidiaries are fully consolidated from the date on which control is transferred to the Group. They are deconsolidated from the date that control ceases.
The Group applies the acquisition method to account for business combinations. The consideration transferred for the acquisition of a subsidiary is the fair values of the assets transferred, the liabilities incurred to the former owners of the acquiree and the equity interests issued by the Group. The consideration transferred includes the fair value of any asset or liability resulting from a contingent consideration arrangement. Identifiable assets acquired and liabilities and contingent liabilities assumed in a business combination are measured initially at their fair values at the acquisition date. The Group recognises any non-controlling interest in the acquiree on an acquisition-by-acquisition basis, either at fair value or at the non-controlling interest’s proportionate share of the recognised amounts of the acquiree’s identifiable net assets. Acquisition-related costs are expensed as incurred.
If a business combination is achieved in stages, the acquisition date carrying value of the Group’s previously held equity interest in the acquiree is re-measured to fair value at the acquisition date; any gains or losses arising from such re-measurement are recognised in profit or loss.
Any contingent consideration to be transferred by the Group is recognised at fair value at the acquisition date. Subsequent changes to the fair value of the contingent consideration that is deemed to be an asset or liability is recognised in accordance with NZ IAS 39 either in profit or loss or as a change to other comprehensive income. Contingent consideration that is classified as equity is not re-measured, and its subsequent settlement is accounted for within equity.
1. Statement of Accounting Policies

thl Annual Financial Statements 2015 11
11Notes to the Financial Statements (continued)For the year ended 30 June 2015
The excess of the consideration transferred, the amount of any non-controlling interest in the acquiree and the acquisition-date fair value of any previous equity interest in the acquiree over the fair value of the identifiable net assets acquired is recorded as goodwill. If the total of consideration transferred, non-controlling interest recognised and previously held interest measured is less than the fair value of the net assets of the subsidiary acquired in the case of a bargain purchase, the difference is recognised directly in the income statement.
Inter-company transactions, balances and unrealised gains on transactions between Group companies are eliminated. Unrealised losses are also eliminated but considered an impairment indicator of the asset transferred. Accounting policies of subsidiaries have been changed where necessary to ensure consistency with the policies adopted by the Group.
AssociatesAssociates are all entities over which the Group has significant influence but not control, generally accompanying a shareholding of between 20% and 50% of the voting rights. Investments in associates are accounted for using the equity method of accounting and are initially recognised at cost. The Group’s share of its associates’ post-acquisition profits or losses is recognised in the income statement.
Joint arrangementsInvestments in joint arrangements are classified as either joint operations or joint ventures depending on the contractual rights and obligations of each investor. The Group has assessed the nature of its joint arrangements and determined them to be joint ventures. Joint ventures are accounted for using the equity method.
Under the equity method of accounting, interests in joint ventures are initially recognised at cost and adjusted thereafter to recognise the Group’s share of the post-acquisition profits or losses and movements in other comprehensive income. When the Group’s share of losses in a joint venture equals or exceeds its interests in the joint venture (which includes any long-term interests that, in substance, form part of the Group’s net investment in the joint venture), the Group does not recognise further losses, unless it has incurred obligations or made payments on behalf of the joint venture.
Unrealised gains on transactions between the Group and its joint ventures and associates are eliminated to the extent of the Group’s interest in the joint ventures. Unrealised losses are also eliminated unless the transaction provides evidence of an impairment of the asset transferred. Accounting policies of the joint ventures have been changed where necessary to ensure consistency with the policies adopted by the Group.
c) Segment reporting
Operating segments are reported in a manner consistent with the internal reporting provided to the chief operating decision-maker. The chief operating decision-maker, who is responsible for allocating resources and assessing performance of the operating segments, has been identified as the executive management team together with the Board of Directors, who together make strategic decisions.
d) Foreign currency translation
Functional and presentation currencyItems included in the financial statements of each of the Group’s entities are measured using the currency of the primary economic environment in which the entity operates (‘the functional currency’). The consolidated financial statements are presented in New Zealand dollars, rounded to the nearest thousand, which is the Company’s functional and presentation currency.
Transaction and balancesForeign currency transactions are translated into the functional currency using the exchange rates prevailing at the dates of the transactions. Foreign exchange gains and losses resulting from the settlement of such transactions and from the translation at year-end exchange rates of monetary assets and liabilities denominated in foreign currencies are recognised in the income statement, except when deferred in equity as qualifying cash flow hedges.
Translation differences on non-monetary financial assets and liabilities are reported as part of the fair value gain or loss. Translation differences on non-monetary financial assets and liabilities, such as equities held at fair value, are recognised in the income statement as part of the fair value gain or loss. Translation differences on non-monetary financial assets such as equities classified as available for sale are included in the fair value reserve in equity.
Group companiesThe results and financial position of all the Group entities (none of which has the currency of a hyperinflationary economy) that have a functional currency different from the presentation currency are translated into the presentation currency as follows:
(i) assets and liabilities for each balance sheet presented are translated at the closing rate at the date of that balance sheet;
(ii) income and expenses for each income statement are translated at the average monthly exchange rates; and
(iii) all resulting exchange differences are recognised as a separate component of equity.
Goodwill and fair value adjustments arising on the acquisition of a foreign entity are treated as assets and liabilities of the foreign entity and translated at the closing rate.
e) Property, plant and equipment
Land and buildings comprise mainly buildings and leasehold improvements of rented properties including branches, retail outlets and offices. Land and buildings are shown at historical cost, less subsequent accumulated depreciation for buildings. All other property, plant and equipment are stated at historical cost less accumulated depreciation. Land is not depreciated. Historical cost includes expenditure that is directly attributable to the acquisition of the items.
1. Statement of Accounting Policies (continued)

12 thl Annual Financial Statements 2015
12Notes to the Financial Statements (continued)For the year ended 30 June 2015
Subsequent costs are included in the asset’s carrying amount or recognised as a separate asset, as appropriate, only when it is probable that future economic benefits associated with the item will flow to the Group and the cost of the item can be measured reliably. All other repairs and maintenance are charged to the income statement during the financial period in which they are incurred.
Depreciation on motorhome assets is calculated using the straight-line method to allocate their cost to their residual values at the estimated date of disposal from the fleet. The estimated useful lives of motorhomes on the rental fleet are:
Motorhomes 1 – 6 years
Depreciation on other assets is calculated using the straight-line method to allocate their cost or revalued amounts to their residual values over their estimated useful lives as follows:
Buildings & leasehold improvements 10 – 40 yearsVehicles 5 – 20 yearsOther plant & equipment 3 – 20 years
The assets’ residual values and useful lives are reviewed, and adjusted if appropriate, at each balance sheet date. An asset’s carrying amount is written down immediately to its recoverable amount if the asset’s carrying amount is greater than its estimated recoverable amount.
Gains and losses on disposals are determined by comparing proceeds with carrying amount. These are included in the income statement.
f) Intangible assets
GoodwillGoodwill represents the excess of the cost of an acquisition over the fair value of the Group’s share of the net identifiable assets of the acquired subsidiary at the date of acquisition. Goodwill on acquisition of subsidiaries is included in ‘intangible assets’. Separately recognised goodwill is tested annually for impairment and carried at cost less accumulated impairment losses. Impairment losses on goodwill are not reversed. Gains and losses on the disposal of an entity include the carrying amount of goodwill relating to the entity sold.
Goodwill is allocated to cash-generating units for the purpose of impairment testing. The allocation is made to those cash-generating units or groups of cash-generating units that are expected to benefit from the business combination in which the goodwill arose. The Group allocates goodwill to each business segment in each country in which it operates.
BrandsBrands acquired in a business combination are recognised at fair value at the acquisition date. Brands are deemed to have an indefinite life as the Group has determined that there is no foreseeable limit to the period over which the brands are expected to generate net cash in-flows for the entity. Brands are tested annually for impairment and are carried at cost less any accumulated impairment losses.
Trademarks and licencesTrademarks and licences are shown at historical cost of acquisition by the Group less amortisation over the term of the particular licence.
Computer softwareAcquired computer software licences are capitalised on the basis of the costs incurred to acquire and bring to use the specific software. These costs are amortised over their estimated useful lives (three to five years).
Costs associated with developing or maintaining computer software programmes are recognised as an expense as incurred. Costs that are directly associated with the production of identifiable and unique software products controlled by the Group, and that will probably generate economic benefits exceeding costs beyond one year, are recognised as intangible assets. Direct costs include the software development employee costs and an appropriate portion of relevant overheads.
Computer software development costs recognised as assets are amortised over their estimated useful lives (three to five years).
g) Impairment of non-financial assets
Assets that have an indefinite useful life are not subject to amortisation and are tested annually for impairment. Assets that are subject to amortisation or depreciation are reviewed for impairment whenever events or changes in circumstances indicate that the carrying amount may not be recoverable. An impairment loss is recognised for the amount by which the asset’s carrying amount exceeds its recoverable amount. The recoverable amount is the higher of an asset’s fair value less costs to sell and value in use. For the purpose of assessing impairment, assets are grouped at the lowest levels for which there are separately identifiable cash flows (cash-generating units). Non-financial assets other than goodwill that suffered impairment are reviewed for possible reversal of the impairment at each reporting date.
h) Non-current assets (or disposal groups) held for sale
Non-current assets (or disposal groups) are classified as assets held for sale when their carrying amount is to be recovered principally through a sale transaction and a sale is considered highly probable. They are stated at the lower of carrying amount and fair value less costs to sell if their carrying amount is to be recovered principally through a sale transaction rather than through continuing use.
i) Financial assets
Loans and receivables are non-derivative financial assets with fixed or determinable payments that are not quoted in an active market. They are included in current assets, except for maturities greater than 12 months after the balance sheet date. These are classified as non-current assets. Loans and receivables include trade and other receivables and cash and equivalents in the balance sheet.
j) Offsetting of financial instruments
Financial assets and liabilities are offset and the net amount reported in the balance sheet when there is a legally enforceable right to offset the recognised amounts and there is an intention to settle on a net basis, or realise the asset and settle the liability simultaneously.
1. Statement of Accounting Policies (continued)

thl Annual Financial Statements 2015 13
13Notes to the Financial Statements (continued)For the year ended 30 June 2015
k) Impairment of financial assets
Assets carried at amortised costThe Group assesses at the end of each reporting period whether there is objective evidence that a financial asset or group of financial assets is impaired. A financial asset or a group of financial assets is impaired and impairment losses are incurred only if there is objective evidence of impairment as a result of one or more events that occurred after the initial recognition of the asset (a ‘loss event’) and that loss event (or events) has an impact on the estimated future cash flows of the financial asset or group of financial assets that can be reliably estimated.
The amount of the loss is measured as the difference between the asset’s carrying amount and the present value of estimated future cash flows (excluding future credit losses that have not been incurred) discounted at the financial asset’s original effective interest rate. The asset’s carrying amount is reduced and the amount of the loss is recognised in the income statement. If a loan or held-to-maturity investment has a variable interest rate, the discount rate for measuring any impairment loss is the current effective interest rate determined under the contract. As a practical expedient, the Group may measure impairment on the basis of an instrument’s fair value using an observable market price.
If, in a subsequent period, the amount of the impairment loss decreases and the decrease can be related objectively to an event occurring after the impairment was recognised (such as an improvement in the debtor’s credit rating), the reversal of the previously recognised impairment loss is recognised in the income statement.
l) Derivative financial instruments and hedging activities
The Group enters into interest rate swaps and other derivatives to hedge interest rate risk.
Derivatives are initially recognised at fair value on the date a derivative contract is entered into and are subsequently remeasured at their fair value. The method of recognising the resulting gain or loss depends on whether the derivative is designated as a hedging instrument and if so, the nature of the item being hedged. The Group designates certain derivatives as either: (1) hedges of the fair value of recognised assets or liabilities or a firm commitment (fair value hedge) or (2) hedges of a particular risk associated with a recognised asset or liability or a highly probable forecast transaction (cash flow hedge).
The Group documents at the inception of the transaction the relationship between hedging instruments and hedged items, as well as its risk management objectives and strategy for undertaking various hedge transactions. The Group also documents its assessment, both at hedge inception and on an ongoing basis, of whether the derivatives that are used in hedging transactions are highly effective in offsetting changes in fair value or cash flows of hedged items.
The fair values of various derivative instruments used for hedging purposes are disclosed in the notes. Movements on the hedging reserve in shareholders’ equity are shown in the notes. The full fair value of hedging derivatives is classified as a non-current asset or liability if the remaining maturity of the hedged item is more than 12 months, and as a current asset or liability if the remaining maturity of the hedged item is less than 12 months. Trading derivatives are classified as a current asset or liability.
Cash flow hedgesThe effective portion of changes in the fair value of derivatives that are designated and qualify as cash flow hedges are recognised in equity. The gain or loss relating to the ineffective portion is recognised immediately in the income statement.
Amounts accumulated in equity are recycled in the income statement in the periods when the hedged item affects profit or loss (for instance when the forecast sale that is hedged takes place). The gain or loss relating to the effective portion of interest rate swaps hedging variable rate borrowings is recognised in the income statement within ‘finance expenses’. The gain or loss relating to the effective portion of forward foreign exchange contracts hedging export sales is recognised in the income statement within ‘sales’. However, when the forecast transaction that is hedged results in the recognition of a non-financial asset (for example, inventory) or a non-financial liability, the gains and losses previously deferred in equity are transferred from equity and included in the initial measurement of the cost of the asset or liability.
When a hedging instrument expires or is sold, or when a hedge no longer meets the criteria for hedge accounting, any cumulative gain or loss existing in equity at that time remains in equity and is recognised when the forecast transaction is ultimately recognised in the income statement. When a forecast transaction is no longer expected to occur, the cumulative gain or loss that was reported in equity is immediately transferred to the income statement.
m) Inventories
Inventories are stated at the lower of cost and net realisable value. Cost is determined using the first-in, first-out (FIFO) method. The cost of finished goods and work in progress comprises design costs, raw materials, direct labour, other direct costs and related production overheads (based on normal operating capacity). It excludes borrowing costs. Net realisable value is the estimated selling price in the ordinary course of business, less applicable variable selling expenses.
Rental assets held for sale at balance date have been reclassified as inventory.
1. Statement of Accounting Policies (continued)

14 thl Annual Financial Statements 2015
14Notes to the Financial Statements (continued)For the year ended 30 June 2015
n) Trade receivables
Trade receivables are recognised initially at fair value plus transaction costs and subsequently measured at amortised cost using the effective interest method, less provision for impairment. A provision for impairment of trade receivables is established when there is objective evidence that the Group will not be able to collect all amounts due according to the original terms of receivables. Significant financial difficulties of the debtor, probability that the debtor will enter bankruptcy or financial reorganisation, and default or delinquency in payments are considered indicators that the trade receivable is impaired. The amount of the provision is the difference between the asset’s carrying amount and the present value of estimated future cash flows, discounted at the effective interest rate. The amount of the provision is recognised in the income statement within ‘other operating expenses’.
o) Cash and cash equivalents
Cash and cash equivalents includes cash in hand, deposits held at call with banks, other short-term highly liquid investments with original maturities of three months or less, and bank overdrafts. Bank overdrafts are shown within current liabilities on the balance sheet.
p) Cash flows from operating activities
In accordance with NZ IAS 7 the Group classifies cash flows from the sale and purchase of rental assets as operating cash flows.
q) Share capital
Ordinary shares are classified as equity.
Incremental costs directly attributable to the issue of new shares or options are shown in equity as a deduction, net of tax, from the proceeds.
r) Trade payables
Trade payables are obligations to pay for goods or services that have been acquired in the ordinary course of business from suppliers. Accounts payable are classified as current liabilities if payment is due within one year or less (or in the normal operating cycle of the business if longer). If not, they are presented as non-current liabilities.
Trade payables are recognised initially at fair value net of transaction costs and subsequently measured at amortised cost using the effective interest method.
s) Borrowings
Borrowings are recognised initially at fair value, net of transaction costs incurred. Borrowings are subsequently stated at amortised cost; any difference between the proceeds (net of transaction costs) and the redemption value is recognised in the income statement over the period of the borrowings using the effective interest method.
Borrowings are classified as current liabilities unless the Group has an unconditional right to defer settlement of the liability for at least 12 months after the balance sheet date.
Borrowing costs are recognised as an expense in the period in which they are incurred, except for borrowing costs directly attributable to the acquisition, construction or production of a qualifying asset which are capitalised.
Qualifying assets are those assets that necessarily take an extended period of time (six months or more) to get ready for their intended use.
t) Current and deferred income tax
Income tax expenses in relation to the surplus or deficit for the period comprises current tax and deferred tax.
Current tax is the amount of income tax payable based on the taxable profit for the current year, plus any adjustments to income tax payable in respect of prior years. Current tax is calculated using rates that have been enacted or substantially enacted by balance date.
Deferred tax is the amount of income tax payable or recovered in future periods in respect of temporary differences and unused tax losses. Temporary differences are differences between the carrying amount of assets and liabilities in the financial statements and the corresponding tax bases used in the computation of taxable profit.
Deferred tax liabilities are generally recognised for all taxable temporary differences. Deferred tax assets are recognised to the extent that it is probable that taxable profits will be available against which the deductible temporary differences or tax losses can be utilised.
Deferred tax is not recognised if the temporary difference arises from the initial recognition of goodwill or from the initial recognition of an asset and liability in a transaction that is not a business combination and, at the time of the transaction, affects neither accounting profit nor taxable profit.
Deferred tax is recognised on taxable temporary differences arising on investments in subsidiaries and associates, except where the company can control the reversal of the temporary difference and it is probable that the temporary difference will not be reversed in the foreseeable future.
Deferred tax is calculated at the tax rates that are expected to apply in the period when the liability is settled or the asset is realised, using tax rates that have been enacted or substantially enacted by balance date.
Current tax and deferred tax is charged or credited to the income statement, except when it relates to items charged or credited directly to equity, in which case the tax is dealt with in equity.
u) Employee benefits
Share schemeThe Group operates an equity-settled, share-based long term incentive plan for the Chief Executive and other senior executives under which the Group receives services from the executives as consideration for redeemable ordinary shares of the Group. The fair value of the employee services received in exchange for the grant of the redeemable shares is recognised as an expense in the income statement. The total amount expensed is determined by reference to the fair value of the redeemable shares granted. Refer to note 25 (Share-based payments).
1. Statement of Accounting Policies (continued)

thl Annual Financial Statements 2015 15
15Notes to the Financial Statements (continued)For the year ended 30 June 2015
Amounts accumulated in the executive share scheme reserve are transferred to share capital on redemption of the redeemable shares or to retained earnings where they are forfeited. At the end of each reporting period, the Group revises its estimates of the number of redeemable shares that are expected to vest based on the non-market vesting conditions. It recognises the impact of the revision to original estimates, if any, in the income statement, with a corresponding adjustment to the employee share scheme reserve.
Short term employee benefitsEmployee entitlements to salaries and wages and annual leave, to be settled within 12 months of the reporting date represent present obligations resulting from employees’ services provided up to the reporting date, calculated at undiscounted amounts based on remuneration rates that the Group expects to pay.
v) Provisions
Provisions are recognised when: the Group has a present legal or constructive obligation as a result of past events; it is more likely than not that an outflow of resources will be required to settle the obligations; and the amount has been reliably estimated. Restructuring provisions comprise lease termination penalties and employee termination payments. Warranty provisions relate to repairs of third party motorhomes. Provisions are not recognised for future operating losses.
Where there are a number of similar obligations, the likelihood that an outflow will be required in settlement is determined by considering the class of obligations as a whole. A provision is recognised even if the likelihood of an outflow with respect to any one item included in the same class of obligations may be small.
Provisions are measured at the present value of the expenditures expected to be required to settle the obligation using a pre-tax rate that reflects current market assessments of the time value of money and the risks specific to the obligation. The increase in the provision due to passage of time is recognised as interest expense.
w) Revenue recognition
Revenue comprises the fair value of the consideration received or receivable for the sale of goods and services in the ordinary course of the Group’s activities. Revenue is shown, net of goods and services tax, rebates and discounts and after eliminated sales within the Group. Revenue is recognised as follows:
(i) Sales of servicesSales of services are recognised in the accounting period in which the services are rendered, by reference to completion of the specific transaction. Where the sale of services covers a period of more than one day the sale is assessed based on the number of days of the booking that have occurred by year end as a proportion of the total number of days in the booking.
(ii) Sale of goodsSales of goods are recognised when a group entity sells a product to the customer. Retail sales are usually in cash or by credit card. Sales of motorhomes are recognised when the transfer of risks and rewards takes place and are invoiced at that time. Sales of goods includes sale of rental assets, trade-ins, new vehicles and accessories.
x) Leases
Leases in which a significant portion of the risks and rewards of ownership are retained by the lessor are classified as operating leases. Payments made under operating leases (net of any incentives received from the lessor) are charged to the income statement on a straight-line basis over the period of the lease.
The Group leases certain vehicles, property, plant and equipment (i.e. is the lessee). Leases of vehicles, property, plant and equipment where the Group has substantially all the risks and rewards of ownership are classified as finance leases. Finance leases are capitalised at the lease’s commencement at the lower of the fair value of the leased property and the present value of the minimum lease payments. Each lease payment is allocated between the liability and finance charges so as to achieve a constant rate on the finance balance outstanding. The corresponding rental obligations, net of finance charges, are included in other long-term payables. The interest element of the finance cost is charged to the income statement over the lease period so as to produce a constant periodic rate of interest on the remaining balance of the liability for each period. The vehicles, property, plant and equipment acquired under finance leases is depreciated over the shorter of the useful life of the assets or the lease term.
y) Dividend distribution
Dividend distribution to the Company’s shareholders is recognised as a liability in the Group’s financial statements in the period in which the dividends are approved by the Company’s directors.
z) Fair value estimation
The fair value of financial instruments traded in active markets is based on quoted market prices at the balance sheet date. The quoted market price used for financial assets held by the Group is the current bid price.
The fair value of financial instruments that are not traded in an active market (for example, over-the-counter derivatives) is determined by using valuation techniques.
The Group uses its judgement to select a variety of methods and make assumptions that are mainly based on market conditions existing at the end of each reporting period. See further disclosure in note 13.
The nominal value less impaired provision of trade receivables and payables are assumed to approximate their fair values. The fair value of financial liabilities for disclosure purposes is estimated by discounting the future contractual cash flows at the current market interest rate that is available to the Group for similar financial instruments.
1. Statement of Accounting Policies (continued)

16 thl Annual Financial Statements 2015
16Notes to the Financial Statements (continued)For the year ended 30 June 2015
Interest rate swaps are valued by projecting forward cash flows over the future life of the transaction using the interest rate yield curve as at balance date. The cash flows are then discounted to present value using the same yield curve. The interest rate swap is valued at the sum of all the present value cash flows.
1.3 CRITICAL ACCOUNTING ESTIMATES AND JUDGEMENTS
Estimates and judgements are continually evaluated and are based on historical experience and other factors, including expectations of future events that are believed to be reasonable under the circumstances.
The Group makes estimates and assumptions concerning the future. The resulting accounting estimates will, by definition, seldom equal the related actual results. The estimates and assumptions that have a significant risk of causing a material adjustment to the carrying amounts of assets and liabilities within the next financial year are discussed below.
a) Estimated impairment of goodwill and brands
The Group tests annually whether goodwill and brands have suffered any impairment, in accordance with the accounting policy stated in the notes. The recoverable amounts of cash-generating units have been determined based on value-in-use calculations (refer to note 17). These calculations require the use of estimates.
b) Income taxes
The Group is subject to income taxes in four jurisdictions. Significant judgement is required in determining the worldwide provision for income taxes. There are many transactions and calculations for which the ultimate tax determination is uncertain during the ordinary course of business. The Group recognises liabilities for anticipated tax audit issues based on estimates of whether additional taxes will be due. Where the final tax outcome of these matters is different from the amounts that were initially recorded, such differences will impact the income tax and deferred tax provisions in the period in which such determination is made.
c) Fleet depreciation rates
The Group estimates the residual values of fleet in order to depreciate motorhome assets using the straight-line method. The Group has considered the appropriateness of the residual values that have been used by reviewing the gains/losses made on recent sales of similar motorhomes.
1.4 CHANGES IN ACCOUNTING POLICIES AND DISCLOSURES
a) New and amended standards adopted by the Group
There are no new or amended standards which have been adopted in the year ended 30 June 2015 that have a material impact on the Group.
b) New standards not yet adopted by the Group
The following accounting standards and amendments to existing standards are not yet effective and have not been early adopted by the Group:
(i) NZ IFRS 9, ‘Financial instruments’, addresses the classification, measurement and recognition of financial assets and financial liabilities. The complete version of NZ IFRS 9 was issued in September 2014. It replaces the guidance in NZ IAS 39 that relates to the classification and measurement of financial instruments. NZ IFRS 9 retains but simplifies the mixed measurement model and establishes three primary measurement categories for financial assets: amortised cost, fair value through other comprehensive income and fair value through profit or loss. The basis of classification depends on the entity’s business model and the contractual cash flow characteristics of the financial asset. Investments in equity instruments are required to be measured at fair value through profit or loss with the irrevocable option at inception to present changes in fair value in other comprehensive income not recycling. There is now a new expected credit losses model that replaces the incurred loss impairment model used in NZ IAS 39. For financial liabilities there were no changes to classification and measurement except for the recognition of changes in own credit risk in other comprehensive income, for liabilities designated at fair value through profit or loss. NZ IFRS 9 relaxes the requirements for hedge effectiveness by replacing the bright line hedge effectiveness tests. It requires an economic relationship between the hedged item and hedging instrument and for the ‘hedged ratio’ to be the same as the one management actually use for risk management purposes. Contemporaneous documentation is still required but is different to that currently prepared under NZ IAS 39. The standard is effective for accounting periods beginning on or after 1 January 2018. Early adoption is permitted. The group intends to adopt NZ IFRS 9 on its effective date and has yet to assess its full impact.
(ii) NZ IFRS 15, ‘Revenue from contracts with customers’ deals with revenue recognition and establishes principles for reporting useful information to users of financial statements about the nature, amount, timing and uncertainty of revenue and cash flows arising from an entity’s contracts with customers. Revenue is recognised when a customer obtains control of a good or service and thus has the ability to direct the use and obtain the benefits from the good or service. The standard replaces NZ IAS 18 ‘Revenue’ and NZ IAS 11 ‘Construction contracts’ and related interpretations. The standard is effective for annual periods beginning on or after 1 January 2017 and earlier application is permitted. The group intends to adopt NZ IFRS 15 on its effective date and is currently assessing its full impact.
Other interpretations and amendments are unlikely to have a significant impact on the Group’s financial statements and have therefore not been analysed in detail.
1. Statement of Accounting Policies (continued)

thl Annual Financial Statements 2015 17
17Notes to the Financial Statements (continued)For the year ended 30 June 2015
NEW ZEALAND GROUP
2015RENTALS
$000’s
TOURISM GROUP $000’s
AUSTRALIA RENTALS
$000’s
UNITED STATES RENTALS
$000’s
SUPPORT SERVICES
$000’sTOTAL $000’s
Sales of services 60,786 29,936 55,011 21,093 – 166,826
Sales of goods 29,156 – 11,059 29,555 – 69,770
Revenue from external customers 89,942 29,936 66,070 50,648 – 236,596
Depreciation (12,795) (1,211) (13,114) (4,011) (500) (31,631)
Amortisation (198) (635) (35) – (715) (1,583)
Other costs (62,971) (20,425) (46,816) (37,739) (3,084) (171,035)
Operating profit/(loss) before interest and tax 13,978 7,665 6,105 8,898 (4,299) 32,347
Interest income – – 23 – 713 736
Interest expense (82) – (1,244) (457) (3,399) (5,182)
Share of profit from joint venture and associates – – – – 1,948 1,948
Operating profit/(loss) before tax 13,896 7,665 4,884 8,441 (5,037) 29,849
Taxation (3,710) (2,410) (1,467) (2,908) 745 (9,750)
Operating profit/(loss) – after interest and tax 10,186 5,255 3,417 5,533 (4,292) 20,099
Capital expenditure 33,986 502 21,613 35,168 844 92,113
Non-current assets 127,915 25,636 66,947 44,357 6,436 271,291
Advance to joint venture (non-current portion) – – – – 2,936 2,936
Total non-current assets 127,915 25,636 66,947 44,357 9,372 274,227
Total assets 142,783 28,226 79,744 53,600 13,928 318,281
Net funds employed 109,373 22,142 52,412 44,155 13,675 241,757
The chief operating decision maker (‘CODM’) has been identified as the executive team together with the Board of Directors. The CODM review the Group’s internal reporting in order to assess performance and allocate resources. Management has determined the operating segments based on these reports. The CODM assess the performance of the operating segments based on a measure of operating profit (earnings before interest and tax). The costs of major business acquisitions are reflected within Group Support Services. Interest income and expenditure are not included in the result for each operating segment that is reviewed by the CODM.
As at 30 June 2015 the CODM considers the business from both a geographical and service/product perspective, the CODM considers the performance of business based on the rentals division in Australia, United States of America and New Zealand, as well as the Tourism Group segment in New Zealand. Group Support Services costs are reported separately.
2. Segment Note

18 thl Annual Financial Statements 2015
18Notes to the Financial Statements (continued)For the year ended 30 June 2015
2. Segment Note (continued)
NEW ZEALAND GROUP
2014RENTALS
$000’s
TOURISM GROUP $000’s
AUSTRALIA RENTALS
$000’s
UNITED STATES RENTALS
$000’s
SUPPORT SERVICES
$000’sTOTAL $000’s
Sales of services 60,248 26,141 57,399 17,942 – 161,730
Sales of goods 27,157 - 12,426 26,688 – 66,271
Revenue from external customers 87,405 26,141 69,825 44,630 – 228,001
Depreciation (15,820) (1,139) (15,058) (3,339) (472) (35,828)
Amortisation (253) (656) (48) – (680) (1,637)
Other costs (63,889) (17,782) (51,032) (33,668) (1,354) (167,725)
Operating profit/(loss) before interest and tax 7,443 6,564 3,687 7,623 (2,506) 22,811
Interest income – – 50 – 1,079 1,129
Interest expense (352) – (2,068) (619) (3,784) (6,823)
Joint venture net profit before tax – – – – 1,046 1,046
Operating profit/(loss) before tax 7,091 6,564 1,669 7,004 (4,165) 18,163
Taxation (2,265) (1,956) (495) (2,945) 614 (7,047)
Operating profit/(loss) – after interest and tax 4,826 4,608 1,174 4,059 (3,551) 11,116
Capital expenditure 32,074 360 15,181 26,145 – 73,760
Non-current assets 119,359 27,000 65,677 30,292 9,015 251,343
Advance to joint venture (non-current portion) – – – – 5,012 5,012
Total non-current assets 119,359 27,000 65,677 30,292 14,027 256,355
Total assets 137,522 28,471 75,850 36,650 17,042 295,535
Net funds employed 110,916 25,804 58,194 30,067 13,577 238,558
Inter-segment transactions are entered into under normal commercial terms and conditions that would also be available to unrelated third parties. The CODM does not distinguish between revenue from internal or external customers when measuring the performance of segments. All revenue is reported to the executive team on a basis consistent with that used in the income statement.
Segment assets consist primarily of property, plant and equipment, intangible assets, inventories, receivables and operating cash. They exclude future income tax benefit, deferred taxation, investments and derivatives designated as hedges of borrowings as they are not allocated to segments. Net funds employed are total assets less segment non interest bearing liabilities and cash on hand.

thl Annual Financial Statements 2015 19
19Notes to the Financial Statements (continued)For the year ended 30 June 2015
4. Other Operating Income/(Expense)
In the year ended 30 June 2015 the property at 32 Kaimiro St, Hamilton was sold. The loss on sale of the property of $1,472k has been recognised within Other operating income/(expenses).
In the year ended 30 June 2015 an agreement was reached in relation to the Alpine Bird deferred consideration (refer to note 34). The outstanding balance of principal and interest totalling $1,744k has been recognised within Other operating income/(expenses).
2015 $000’s
2014 $000’s
Net loss on disposal of fixed assets (1,441) (101)
Deferred consideration settlement 1,744 –
Rental income 365 307
Other operating income 668 206
3. Sales of Goods
2015 $000’s
2014 $000’s
Sales of goods 69,770 66,271
Cost of goods (57,031) (55,571)
Vehicle selling expenses (3,256) (3,087)
Cost of sales (60,287) (58,658)
Gain on sale 9,483 7,613
20 thl Annual Financial Statements 2015
20Notes to the Financial Statements (continued)For the year ended 30 June 2015
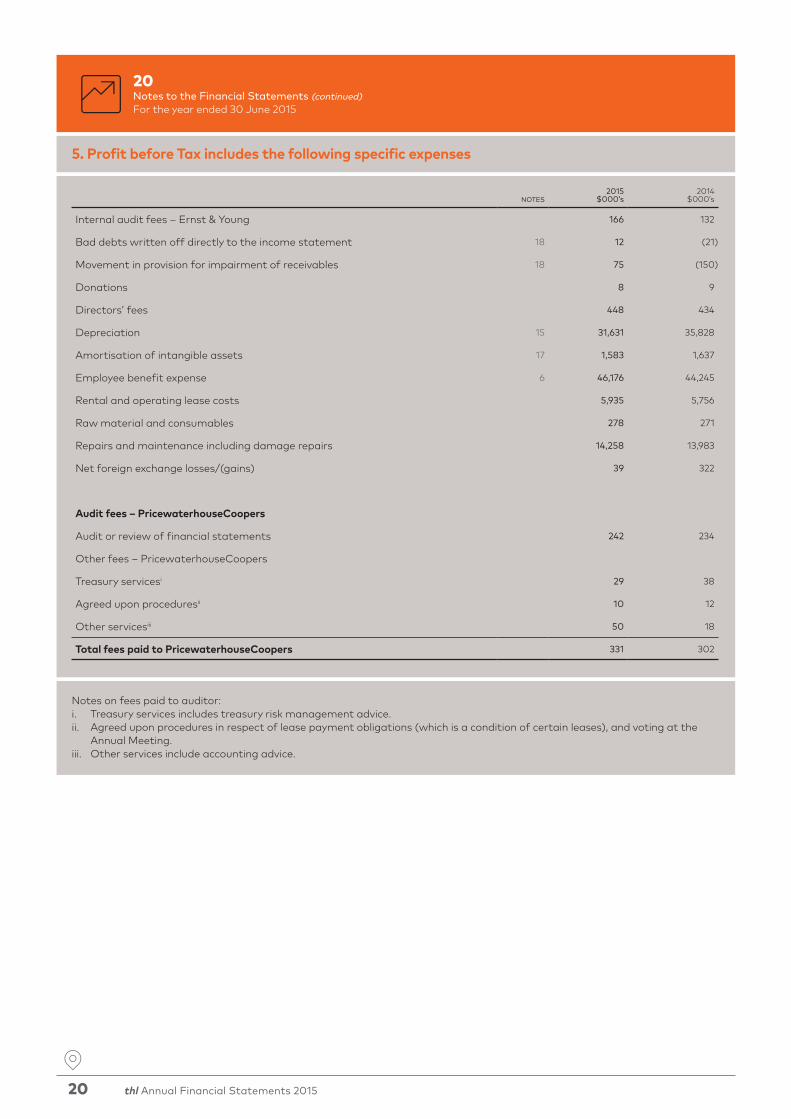
5. Profit before Tax includes the following specific expenses
Notes on fees paid to auditor:i. Treasury services includes treasury risk management advice.ii. Agreed upon procedures in respect of lease payment obligations (which is a condition of certain leases), and voting at the
Annual Meeting.iii. Other services include accounting advice.
NOTES2015
$000’s2014
$000’s
Internal audit fees – Ernst & Young 166 132
Bad debts written off directly to the income statement 18 12 (21)
Movement in provision for impairment of receivables 18 75 (150)
Donations 8 9
Directors’ fees 448 434
Depreciation 15 31,631 35,828
Amortisation of intangible assets 17 1,583 1,637
Employee benefit expense 6 46,176 44,245
Rental and operating lease costs 5,935 5,756
Raw material and consumables 278 271
Repairs and maintenance including damage repairs 14,258 13,983
Net foreign exchange losses/(gains) 39 322
Audit fees – PricewaterhouseCoopers
Audit or review of financial statements 242 234
Other fees – PricewaterhouseCoopers
Treasury servicesi 29 38
Agreed upon proceduresii 10 12
Other servicesiii 50 18
Total fees paid to PricewaterhouseCoopers 331 302

thl Annual Financial Statements 2015 21
21Notes to the Financial Statements (continued)For the year ended 30 June 2015
7. Finance Income
2015 $000’s
2014 $000’s
Interest income 736 1,129
Total finance income 736 1,129
8. Finance Expenses
2015 $000’s
2014 $000’s
Bank borrowings 4,926 6,069
Capitalised lease obligations 245 390
Other loans 11 364
Total interest expense 5,182 6,823
9. Income Tax Expense
NOTES2015
$000’s2014
$000’s
Current tax 7,684 4,671
Deferred tax 28 2,066 2,376
9,750 7,047
6. Employee Benefits Expense
NOTES2015
$000’s2014
$000’s
Wages and salaries 44,405 42,543
Share-based payment costs 25 147 143
Other employee benefits 1,624 1,559
Total employee remuneration 46,176 44,245

22 thl Annual Financial Statements 2015
22Notes to the Financial Statements (continued)For the year ended 30 June 2015
9. Income Tax Expense (continued)
11. Dividends
The tax on the profit before tax differs from the theoretical amount that would arise using the weighted average tax rate applicable to profits of the consolidated companies as follows:
The final and interim dividends paid in the year ended 30 June 2015 was $14,655k (13 cents per share). The final and interim dividends paid in the year ended 30 June 2014 was $7,802k (7 cents per share).
DilutedDiluted earnings per share is calculated by adjusting the weighted average number of ordinary shares outstanding to assume conversion of all dilutive potential ordinary shares.
The weighted average applicable tax rate was 33% (2014: 39%).
2015 $000’s
2014 $000’s
Profit before tax – continuing operations 29,849 18,163
Tax calculated at domestic rates applicable to profits in the respective countries 9,455 6,014
Non-assessable income – other (38) (83)
Expenses not deductible for tax purposes 853 385
Unclaimed foreign tax credits – 293
Prior year tax adjustment (520) 438
Income tax expense 9,750 7,047
10. Earnings per Share (EPS)
2015 $000’s
2014 $000’s
Profit attributable to the equity holders of the Parent 20,099 11,116
Weighted average number of ordinary shares on issue 112,469 110,815
Basic earnings per share (in cents) 17.9 10.0
2015 $000’s
2014 $000’s
Weighted average number of ordinary shares on issue 112,469 110,815
Redeemable shares if exercised 5,730 6,075
Total shares 118,199 116,890
Diluted earnings per share (in cents) 17.0 9.5
thl Annual Financial Statements 2015 23
23Notes to the Financial Statements (continued)For the year ended 30 June 2015
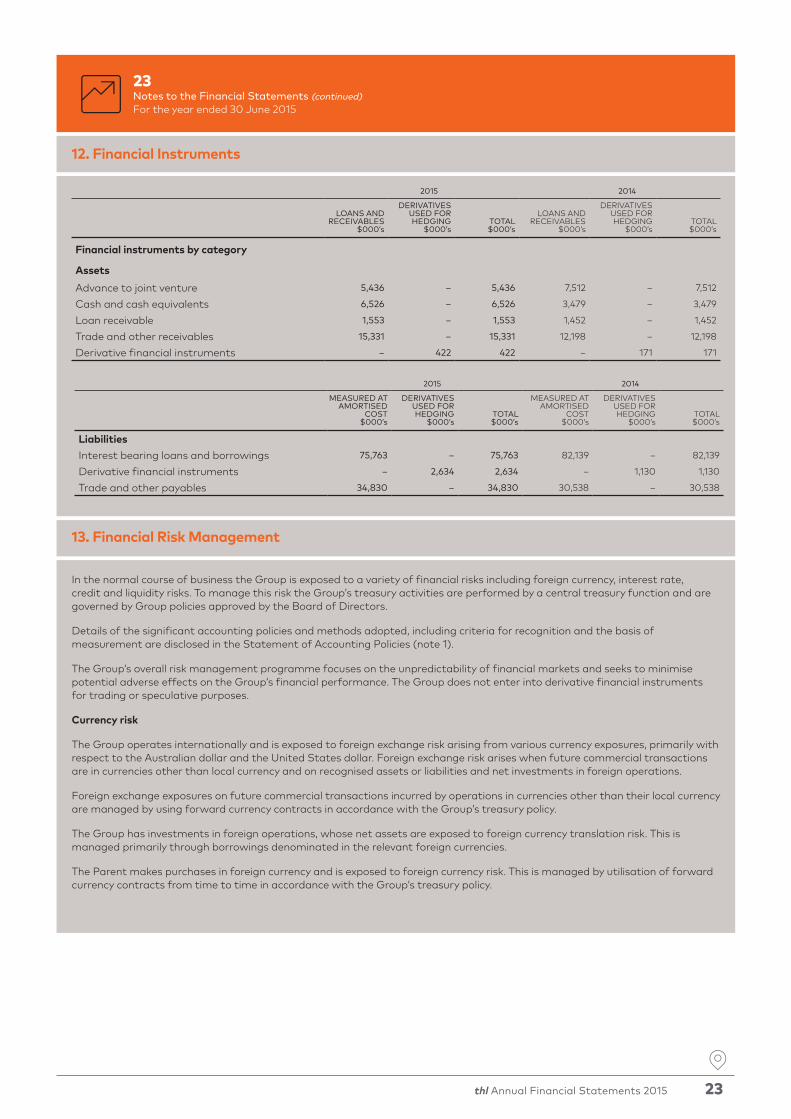
12. Financial Instruments
2015 2014
LOANS AND RECEIVABLES
$000’s
DERIVATIVES USED FOR HEDGING
$000’sTOTAL $000’s
LOANS AND RECEIVABLES
$000’s
DERIVATIVES USED FOR HEDGING
$000’sTOTAL $000’s
Financial instruments by category
Assets
Advance to joint venture 5,436 – 5,436 7,512 – 7,512
Cash and cash equivalents 6,526 – 6,526 3,479 – 3,479
Loan receivable 1,553 – 1,553 1,452 – 1,452
Trade and other receivables 15,331 – 15,331 12,198 – 12,198
Derivative financial instruments – 422 422 – 171 171
13. Financial Risk Management
In the normal course of business the Group is exposed to a variety of financial risks including foreign currency, interest rate, credit and liquidity risks. To manage this risk the Group’s treasury activities are performed by a central treasury function and are governed by Group policies approved by the Board of Directors.
Details of the significant accounting policies and methods adopted, including criteria for recognition and the basis of measurement are disclosed in the Statement of Accounting Policies (note 1).
The Group’s overall risk management programme focuses on the unpredictability of financial markets and seeks to minimise potential adverse effects on the Group’s financial performance. The Group does not enter into derivative financial instruments for trading or speculative purposes.
Currency risk
The Group operates internationally and is exposed to foreign exchange risk arising from various currency exposures, primarily with respect to the Australian dollar and the United States dollar. Foreign exchange risk arises when future commercial transactions are in currencies other than local currency and on recognised assets or liabilities and net investments in foreign operations.
Foreign exchange exposures on future commercial transactions incurred by operations in currencies other than their local currency are managed by using forward currency contracts in accordance with the Group’s treasury policy.
The Group has investments in foreign operations, whose net assets are exposed to foreign currency translation risk. This is managed primarily through borrowings denominated in the relevant foreign currencies.
The Parent makes purchases in foreign currency and is exposed to foreign currency risk. This is managed by utilisation of forward currency contracts from time to time in accordance with the Group’s treasury policy.
2015 2014
MEASURED AT AMORTISED
COST$000’s
DERIVATIVES USED FOR HEDGING
$000’sTOTAL $000’s
MEASURED AT AMORTISED
COST$000’s
DERIVATIVES USED FOR HEDGING
$000’sTOTAL $000’s
LiabilitiesInterest bearing loans and borrowings 75,763 – 75,763 82,139 – 82,139
Derivative financial instruments – 2,634 2,634 – 1,130 1,130
Trade and other payables 34,830 – 34,830 30,538 – 30,538

24 thl Annual Financial Statements 2015
24Notes to the Financial Statements (continued)For the year ended 30 June 2015
13. Financial Risk Management (continued)
Exchange rate sensitivity
The following tables show the impact of a 5 cent movement up or down in the New Zealand dollar vs. the Australian dollar and United States dollar and the impact that this exchange rate change has on reported net profit after tax and equity. A 5 cent change is considered a reasonable possible change based on prior year movements.
Interest rate risk
The Group’s interest rate risk primarily arises from long-term borrowings, cash and cash equivalents, advances to subsidiaries and the joint venture. Borrowings issued at variable rates expose the Group to cash flow interest rate risk. Borrowings issued at fixed rates expose the Group to fair value interest rate risk.
The Group manages its cash-flow interest rate risk by using floating to fixed interest rate derivative contracts. Such interest rate derivative contracts have the economic effect of converting borrowings from floating rates to fixed rates. Generally the Group raises long term borrowings at floating rates that are lower than those available if the Group borrowed at fixed rates directly.
Under the interest rate derivative contracts, the Group agrees with other parties to exchange, at specified intervals (mainly quarterly), the difference between fixed contract rates and floating rate interest amounts calculated by reference to the agreed notional principal amounts.
The Group maintains cash on overnight deposit in interest bearing bank accounts.
The following tables set out the interest rate repricing profile and current interest rate of the interest bearing financial assets and liabilities.
2015 $000’s
2014 $000’s
Post-tax impact on reported profit and equity of:
A 5 cent increase in the NZ dollar vs the AU dollar 36 5
A 5 cent increase in the NZ dollar vs the US dollar (14) (3)
A 5 cent decrease in the NZ dollar vs the AU dollar (36) (5)
A 5 cent decrease in the NZ dollar vs the US dollar 14 3
AS AT 30 JUNE 2015
EFFECTIVE INTEREST
RATEFLOATING
$000’s
FIXED UP TO 1 YEAR
$000’s
FIXED 1-2 YEARS
$000’s
FIXED 2-5 YEARS
$000’s
FIXED >5 YEARS
$000’sTOTAL $000’s
AssetsAdvance to joint venture 9.1% 5,436 – – – – 5,436
Loans receivable 6.6% 1,553 – – – – 1,553
Cash and cash equivalents 1.0% 6,526 – – – – 6,526
13,515 – – – – 13,515
LiabilitiesBank borrowings* 6.0% 100 71,824 – – – 71,924
Capitalised lease obligations 4.6% – 3,839 – – – 3,839
100 75,663 – – – 75,763
Interest rate derivative contracts** 4.7% – 7,658 5,642 21,710 11,648 46,658
* Bank borrowing interest rates profile is shown prior to the impact of the interest rate swaps. ** Notional contract amounts.
The effective interest rate of group borrowings is 5.89% including the impact of the interest rate swaps and line fees on facilities.

thl Annual Financial Statements 2015 25
25Notes to the Financial Statements (continued)For the year ended 30 June 2015
13. Financial Risk Management (continued)
* Bank borrowing interest rates profile is shown prior to the impact of the interest rate swaps. ** Notional contract amounts.
Interest rate sensitivity
At year end the floating bank borrowings and cash deposits were subject to interest rate sensitivity risk. The remaining borrowings are fixed using interest rate derivative contracts. If the Group’s floating borrowings and deposits year end balances remained the same throughout the year and interest rates moved by 1.0% then the impact on profitability and equity is as follows:
2015 $000’s
2014 $000’s
Pre tax impact of:
An increase in interest rates of 1% (119) (231)
A decrease in interest rates of 1% 119 231
At year end the value of interest rate derivative contracts used as cash flow hedges were subject to interest rate risk in relation to the value recognised in equity. If interest rates moved by 1.0% across the yield curve then the impact on the fair value of the swaps on equity is shown in the following table. A movement of 1% or 100bps is considered by management as a reasonable estimate of a possible shift in interest rates for the year based on historic movements. As the interest rate swaps were effective as at 30 June 2015 there is no impact on the profit and loss.
2015 $000’s
2014 $000’s
Post tax impact on equity of a 1% move in interest rates
An increase in interest rates if 1% across the yield curve 2,242 1,211
A decrease in interest rates if 1% across the yield curve (2,404) (1,261)
AS AT 30 JUNE 2014
EFFECTIVE INTEREST
RATEFLOATING
$000’s
FIXED UP TO 1 YEAR
$000’s
FIXED 1-2 YEARS
$000’s
FIXED 2-5 YEARS
$000’s
FIXED >5 YEARS
$000’sTOTAL $000’s
AssetsAdvance to joint venture 8.9% 7,512 – – – – 7,512
Loans receivable 6.3% 1,452 – – – – 1,452
Cash and cash equivalents 0.6% 3,479 – – – – 3,479
12,443 – – – – 12,443
LiabilitiesBank borrowings* 6.1% 8,200 57,233 – – – 65,433
Deferred consideration 6.3% 6,839 – – – – 6,839
Other loans 3.1% – 2,788 – – – 2,788
Capitalised lease obligations 4.7% – 3,403 3,676 – – 7,079
15,039 63,424 3,676 – – 82,139
Interest rate derivative contracts** 4.8% – 4,000 7,587 17,733 12,000 41,320

26 thl Annual Financial Statements 2015
26Notes to the Financial Statements (continued)For the year ended 30 June 2015
13. Financial Risk Management (continued)
Credit risk
The Group has a concentration of credit risk in respect of the advance to the joint venture. The Group has no other significant concentrations of credit risk. Policies are in place to ensure that wholesale sales of products are made to customers with an appropriate credit history. Sales to retail customers are made in cash or via major credit cards. Derivative contract counterparties and cash on deposit are limited to high credit rated quality financial institutions.
The Group considers its maximum exposure to credit risk as follows:
The Group has numerous credit terms for various customers. The terms vary from cash, monthly and greater depending on the service and goods provided and the customer relationship. Collateral is not normally required. All trade receivables are individually reviewed regularly for impairment as part of normal operating procedures and, where appropriate, provision is made. Trade receivables less than three months overdue are not considered impaired. Overdue amounts that have not been provided for relate to customers that have a reliable trading credit history and no recent history of default.
2015 $000’s
2014 $000’s
Bank balances 6,526 3,479
Advance to joint venture 5,436 7,512
Trade receivables (net of impairment provision) 10,792 7,555
Other receivables 4,539 4,643
Loan receivable 1,553 1,452
28,846 24,641
NOTES2015
$000’s2014
$000’s
Trade receivable analysis
Debtors past due 1,537 2,220
Impairment provision (166) (91)
Debtors past due but not impaired 1,371 2,129
Debtors current 9,421 5,426
Total trade debtors 18 10,792 7,555
2015 $000’s
2014 $000’s
Ageing of debtors past due
1 – 30 days 867 1,002
31 – 60 days 195 617
61 – 90 days 214 257
91+ days 261 344
Total debtors past due 1,537 2,220

thl Annual Financial Statements 2015 27
27Notes to the Financial Statements (continued)For the year ended 30 June 2015
13. Financial Risk Management (continued)
Liquidity risk
Prudent liquidity risk management implies maintaining sufficient cash and marketable securities, the availability of funding through an adequate amount of credit facilities and the ability to close out market positions. Due to the dynamic nature of the underlying businesses, Group Treasury aims to maintain flexibility in funding by keeping credit lines available.
The table below analyses the Group’s financial liabilities into relevant maturity groupings based on the remaining period at the reporting date to the contractual maturity date.
The amounts disclosed are the contractual undiscounted cash flows.
* The amounts expected to be payable on a net basis in relation to the interest rate swaps have been estimated using forward interest rates applicable at the reporting date.
* The amounts expected to be payable on a net basis in relation to the interest rate swaps have been estimated using forward interest rates applicable at the reporting date.
Capital risk management
The Group’s objectives when managing capital are to safeguard the Group’s ability to continue as a going concern in order to provide returns for shareholders and benefits for other stakeholders and maintain an optimal capital structure to reduce the cost of capital. The Group considers capital to be share capital and interest bearing debt. To maintain or alter the capital structure the Group has the ability to review the amount of dividends paid to shareholders, return capital to shareholders, issue new shares, reduce or increase debt or sell assets.
There are a number of externally imposed bank covenants required as part of seasonal and term debt facilities. These covenants are calculated monthly and reported to banks quarterly. The most significant covenants relating to capital management are Net Interest Bearing Debt to EBITDA ratio, an equity to total assets ratio (net of intangible assets) and minimum shareholders’ equity. There have been no breaches or events of review for the current or prior period.
YEAR ENDED 30 JUNE 2015
UP TO 1 YEAR$000’s
BETWEEN 1-2 YEARS
$000’s
BETWEEN 2-5 YEARS
$000’s
GREATER THAN 5 YEARS
$000’sTOTAL $000’s
CARRYING VALUE $000’s
Trade and other payables 34,830 – – – 34,830 34,830
Bank borrowings 3,407 12,775 64,793 – 80,975 71,924
Capitalised lease obligations 3,908 – – – 3,908 3,839
Interest rate derivative contracts* 757 691 1,258 411 3,117 2,634
42,902 13,466 66,051 411 122,830 113,227
YEAR ENDED 30 JUNE 2014
UP TO 1 YEAR$000’s
BETWEEN 1-2 YEARS
$000’s
BETWEEN 2-5 YEARS
$000’s
GREATER THAN 5 YEARS
$000’sTOTAL $000’s
CARRYING VALUE $000’s
Trade and other payables 30,538 – – – 30,538 30,538
Bank borrowings 7,445 2,893 66,216 – 76,554 65,433
Deferred consideration 5,139 120 1,939 – 7,198 6,839
Vendor loans 2,832 – – – 2,832 2,788
Capitalised lease obligations 3,647 3,742 – – 7,389 7,079
Interest rate derivative contracts* 658 620 1,112 209 2,599 1,130
50,259 7,375 69,267 209 127,110 113,807
28 thl Annual Financial Statements 2015
28Notes to the Financial Statements (continued)For the year ended 30 June 2015
13. Financial Risk Management (continued)
Seasonality
The tourism industry is subject to seasonal fluctuations with peak demand for tourism attractions and transportation over the summer months. The operating revenue and profits of the Group’s segments are disclosed in note 2. New Zealand and Australia’s profits are typically generated over the southern hemisphere summer months and the United States of America’s profits are typically generated over the northern hemisphere summer months. Due to the seasonal nature of the businesses the risk profile at year end is not representative of all risks faced during the year.
Fair values
The carrying amount of financial assets and financial liabilities recorded in the financial statements approximates their fair values:
• Derivative financial instruments are carried at fair value as discussed below.
• Receivables and payables are short term in nature and therefore approximate fair value.
• Interest bearing liabilities re-price at least every 90 days and therefore approximate fair value.
• The fair value of other financial assets and liabilities are calculated using market-quoted rates based on discounted cash flow analysis.
Financial instruments of the Group that are measured in the statement of financial position at fair value are classified by level of the following fair value measurement hierarchy:
Level 1 Quoted prices (unadjusted) in active markets for identical assets or liabilities.
Level 2 Inputs other than quoted prices included within Level 1 that are observable for the asset or liability, either directly (that is, as prices) or indirectly (that is, derived from prices).
Level 3 Inputs for the asset or liability that are not based on observable market data (that is, unobservable inputs).
The level in the fair value hierarchy within which the fair value measurement is categorised is determined on the basis of the lowest input to the fair value measurement. If a fair value measurement uses observable inputs that require significant adjustment based on unobservable inputs, the measurement is a Level 3 measurement.
The Group’s policy is to recognise transfers into and transfers out of fair value hierarchy levels as of the date of the event or change in circumstances that caused the transfer.
As at 30 June 2015 and 30 June 2014 the Group’s only assets and liabilities measured at fair values are derivative financial instruments which are classified within Level 2 of the fair value hierarchy.
The methods used in determining fair value are as follows:
a) Derivative financial instrumentsThe fair value of derivative financial instruments is calculated using quoted prices. Where such prices are not available, use is made of discounted cash flow analysis using the applicable yield curve or available forward price data for the duration of the instruments.
The fair values of the derivative financial instruments are disclosed in note 14.
The following inputs are used for fair value calculations of derivatives:
• Interest rate forward price curve – Published market swap rates
• Foreign exchange forward prices – Published spot foreign exchange rates and interest rate differentials
• Discount rate for valuing interest rate derivatives – The discount rates used to value interest rate derivatives are published market interest rates as applicable to the remaining life of the instrument
• Discount rate for valuing forward foreign exchange contracts – The discount rates used to value interest rate derivatives are published market interest rates as applicable to the remaining life of the instrument
There were no changes to these valuation techniques during the period. There were no transfers of derivative financial instruments between levels of the fair value hierarchy during the year.

thl Annual Financial Statements 2015 29
29Notes to the Financial Statements (continued)For the year ended 30 June 2015
13. Financial Risk Management (continued)
b) Recurring fair value measurementsThe following financial instruments are subject to recurring fair value measurements:
2015 2014
ASSETS $000’s
LIABILITIES $000’s
ASSETS $000’s
LIABILITIES $000’s
Derivative financial instruments (Level 2) 422 2,634 171 1,130
Hedging derivatives are classified as a non-current asset or liability if the remaining maturity of the derivative is more than 12 months and as a current asset or liability, if the maturity of the derivative is less than 12 months.
The ineffective portion recognised in the profit or loss that arises from cash flow hedges in 2015 amount to $Nil (2014: $Nil).
Interest rate swaps
The notional principal amounts of the outstanding interest rate swap contracts at 30 June 2015 were $46,659k (2014: $41,320k).
At 30 June 2015, the fixed interest rates vary from 1.00% to 6.45% (2014: 2.63% to 6.45%).
The liquidity table in note 13 identifies the periods in which the cash flows are expected to occur. The periods in which the cash flows are expected to impact the profit or loss are materially the same.
14. Derivative Financial Instruments
2015 2014
ASSETS $000’s
LIABILITIES $000’s
ASSETS $000’s
LIABILITIES $000’s
Interest rate swaps – current portion – 89 27 –
Foreign currency swaps – current portion 125 – – –
Cash flow hedges – total current portion 125 89 27 –
Interest rate swaps – non current portion 297 2,545 144 1,130
Cash flow hedges – total non current portion 297 2,545 144 1,130
Total cash flow hedges 422 2,634 171 1,130

30 thl Annual Financial Statements 2015
30Notes to the Financial Statements (continued)For the year ended 30 June 2015
15. Property, Plant and Equipment
MOTORHOMES$000’s
MOTOR VEHICLES
$000’s
LAND AND BUILDINGS
$000’s
OTHER PLANT & EQUIPMENT
$000’s
CAPITAL WORK IN
PROGRESS $000’s
TOTAL $000’s
Year ended 30 June 2014At 1 July 2013 219,636 124 15,510 3,987 19,310 258,567
Additions and transfers from work in progress 76,901 658 623 315 (4,737) 73,760
Disposals (51,437) (28) (1,058) (143) – (52,666)
Transfer from assets held for sale – – 8,039 – – 8,039
Exchange differences (9,949) (21) (235) (82) (315) (10,602)
Depreciation charge (33,090) (342) (1,443) (953) – (35,828)
Closing net book amount 202,061 391 21,436 3,124 14,258 241,270
As at 30 June 2014Cost 288,464 838 32,302 11,722 14,258 347,584
Accumulated depreciation (86,403) (447) (10,866) (8,598) – (106,314)
Net book amount 202,061 391 21,436 3,124 14,258 241,270
Reclassification of motorhomes to inventory at balance date
Cost 21,351 – – – – 21,351
Accumulated depreciation (9,038) – – – – (9,038)
Net book amount 12,313 – – – – 12,313
Closing net book amount post reclassification 189,748 391 21,436 3,124 14,258 228,957
Year ended 30 June 2015At 1 July 2014 202,061 391 21,436 3,124 14,258 241,270
Additions and transfers from work in progress 85,180 145 273 1,987 4,528 92,113
Disposals (51,279) (55) (6,647) (226) – (58,207)
Exchange differences 9,915 44 281 44 – 10,284
Depreciation charge (28,721) (139) (1,600) (1,171) – (31,631)
Closing net book amount 217,156 386 13,743 3,758 18,786 253,829
As at 30 June 2015Cost 298,646 831 25,677 12,323 18,786 356,263
Accumulated depreciation (81,490) (445) (11,934) (8,565) – (102,434)
Net book amount 217,156 386 13,743 3,758 18,786 253,829
Reclassification of motorhomes to inventory at balance date
Cost 17,022 – – – – 17,022
Accumulated depreciation (7,605) – – – – (7,605)
Net book amount 9,417 – – – – 9,417
Closing net book amount post reclassification 207,739 386 13,743 3,758 18,786 244,412
The Group depreciation expense of $31,631k (2014: $35,828k) has been recognised within ‘operating expenses’ in the income statement.
Capital work in progress of $18,786k (2014: $14,258k) has been included in the above closing net book amount.
Operating lease rentals amounting to $5,935k (2014: $5,756k ) relating to the lease of equipment and property are included in the income statement.

thl Annual Financial Statements 2015 31
31Notes to the Financial Statements (continued)For the year ended 30 June 2015
16. Leased Assets in Property, Plant and Equipment
17. Intangible Assets
Motorhomes include the following amounts where the Group is a lessee under a finance lease:
2015 $000’s
2014 $000’s
Cost 6,752 9,787
Accumulated depreciation (1,536) (1,635)
Net book amount 5,216 8,152
BRAND VALUE ACQUIRED
$000’sGOODWILL
$000’s
TRADEMARKS, LEASES AND
LICENSES $000’s
OTHER INTANGIBLES
$000’sTOTAL $000’s
Year ended 30 June 2014At 1 July 2013 720 8,341 10,960 2,557 22,578
Exchange differences (92) (651) – (10) (753)
Additions from subsequent expenditure – 125 – 477 602
Amortisation charge – – (586) (1,051) (1,637)
Closing net book amount 628 7,815 10,374 1,973 20,790
As at 30 June 2014Cost 628 54,113 22,744 14,326 91,811
Accumulated amortisation and impairment – (46,298) (12,370) (12,353) (71,021)
Net book amount 628 7,815 10,374 1,973 20,790
Year ended 30 June 2015At 1 July 2014 628 7,815 10,374 1,973 20,790
Exchange differences 178 1,026 – 2 1,206
Additions from subsequent expenditure – – – 340 340
Amortisation charge – – (592) (991) (1,583)
Closing net book amount 806 8,841 9,782 1,324 20,753
As at 30 June 2015Cost 806 55,139 22,744 13,258 91,947
Accumulated amortisation and impairment – (46,298) (12,962) (11,934) (71,194)
Net book amount 806 8,841 9,782 1,324 20,753

32 thl Annual Financial Statements 2015
32Notes to the Financial Statements (continued)For the year ended 30 June 2015
17. Intangible Assets (continued)
Amortisation of fixed term leases and licences is calculated using the straight line method over the life of the various licences. Tourism Holdings Limited has leased the Waitomo Glowworm Caves until 2027. The other caves have licences to operate with terms expiring in 2032, 2033 and 2039.
Software development costs (recognised as ‘other intangibles’) are amortised over their estimated useful lives of three to five years.
Under NZ IAS 38 Intangible Assets intangible assets with an indefinite useful life are not amortised. Instead such assets are tested for impairment under NZ IAS 36 Impairment of Assets by comparing the recoverable amount with the carrying amount annually and whenever there is an indication that the intangible asset may be impaired.
Goodwill is considered to have an indefinite useful life. Based on an analysis of all the relevant factors, there is no foreseeable limit to the period over which the asset is expected to generate net cash flows for the entity.
The brand value acquired relates to the Road Bear brand of United States rentals and was valued using the relief from royalty method. The brand value is included in the net assets of the cash generating units in the impairment test.
The table below details the cash generating units goodwill is attributable to. Both of these cash generating units are profitable (see note 2).
The recoverable amount of a cash generating unit is determined on value-in-use calculations. These calculations use free cash flow projections based on financial budgets approved by management covering a five year period plus a terminal value calculation. These annual free cash flows are then discounted by a country specific pre-tax discount rate to arrive at a net present value (or enterprise value) which is compared to the carrying book value. In addition, carrying values are also tested using alternative valuation metrics, in particular EBIT multiples for similar industry groupings.
2015
RENTALS $000’s
TOURISM GROUP $000’s
TOTAL $000’s
New Zealand – 3,126 3,126
United States of America 5,715 – 5,715
5,715 3,126 8,841
2014
RENTALS $000’s
TOURISM GROUP $000’s
TOTAL $000’s
New Zealand – 3,126 3,126
United States of America 4,689 – 4,689
4,689 3,126 7,815

thl Annual Financial Statements 2015 33
33Notes to the Financial Statements (continued)For the year ended 30 June 2015
17. Intangible Assets (continued)
The divisional models used by Tourism Holdings Limited to generate the free cash flow projections incorporate the expected growth rates from markets the businesses operate in which are compared to Ministry of Business, Innovation and Employment (NZ) and United States Department of Commerce Office of Travel and Tourism Industries forecasts for reasonableness. Capital expenditure and disposal proceeds are projected forward based on current build or purchase costs, realisable sale values and expected fleet rotation by vehicle type (for the rentals operations). Costs and revenues are inflated by an expected inflation rate of 2% unless additional specific information is known.
Key assumptions used for value-in-use calculations:
The calculated recoverable amount provides sufficient headroom over the carrying value such that it is considered that a reasonable change in the assumptions applied will not result in an impairment of the goodwill balance.
2015 2014
Rentals United States of America
Revenue growth rate1 7% p.a 6% p.a
Operating costs growth rate 6% p.a 8% p.a
Terminal growth rate 2.0% 2.0%
Discount rate2 15.2% 15.2%
(1) Weighted average passenger growth rates used to extrapolate cash flows. (2) Pre-tax discount rate applied to the cash flow projections.
2015 2014
Tourism Group New Zealand
Revenue growth rate1 5% p.a 4% p.a
Operating costs growth rate 6% p.a 5% p.a
Terminal growth rate 2.0% 2.0%
Discount rate2 14.6% 14.6%
(1) Weighted average passenger growth rates used to extrapolate cash flows. (2) Pre-tax discount rate applied to the cash flow projections.

34 thl Annual Financial Statements 2015
34Notes to the Financial Statements (continued)For the year ended 30 June 2015
18. Trade and Other Receivables
19. Inventories
There is no concentration of credit risk with respect to trade receivables, as the Group has a large number of customers, internationally dispersed.
The Group has recognised an increase in the provision of $75k (2014: $150k decrease) for the impairment of its trade receivables which has been included in ‘other operating expenses’ in the income statement. The Group has a net write off of trade receivables of $12k (2014: $21k recovery).
NOTES2015
$000’s2014
$000’s
Trade receivables 10,958 7,646
Less provision for impairment of receivables (166) (91)
Trade receivables – net 10,792 7,555
Prepayments 2,489 2,921
Other receivables 4,539 4,643
Total trade and other receivables 17,820 15,119
Provision for impairment of receivables
Opening balance 91 241
Increase/(decrease) in provision for impairment of receivables 5 75 (150)
Closing balance 166 91
Trade receivables written off/(recovered) 5 12 (21)
2015 $000’s
2014 $000’s
Raw materials 1,991 2,298
Rental assets for sale 11,777 13,401
Finished goods 2,476 1,802
Provision for obsolescence (248) (220)
15,996 17,281

thl Annual Financial Statements 2015 35
35Notes to the Financial Statements (continued)For the year ended 30 June 2015
20. Investments
21. Other Reserves
The principal activities of the Parent company and trading subsidiaries are motorhome rental and attractions. All subsidiaries are 100% owned and have 30 June balance dates except JJ Motorcars Inc. which has a 31 December balance date to facilitate US tax legislation compliance. Material subsidiary companies included in the Group Financial Statements at 30 June 2015 are:
NAME COUNTRY OF INCORPORATION
THL Group Australia Pty Limited Australia
Tourism Holdings Australia Pty Limited Australia
Waitomo Caves Limited New Zealand
JJ Motorcars Inc. United States of America
2015 $000’s
2014 $000’s
Foreign currency translation reserve
Balance at beginning of the year (1,789) 3,927
Currency translation differences 6,958 (5,169)
Transfer from retained earnings – (547)
5,169 (1,789)
Employee share scheme reserve
Balance at beginning of year 473 1,319
Value of employee services charged to the income statement 147 143
Transfer to retained earnings (53) (925)
Transfer to share capital (113) (64)
454 473
Total other reserves 5,623 (1,316)
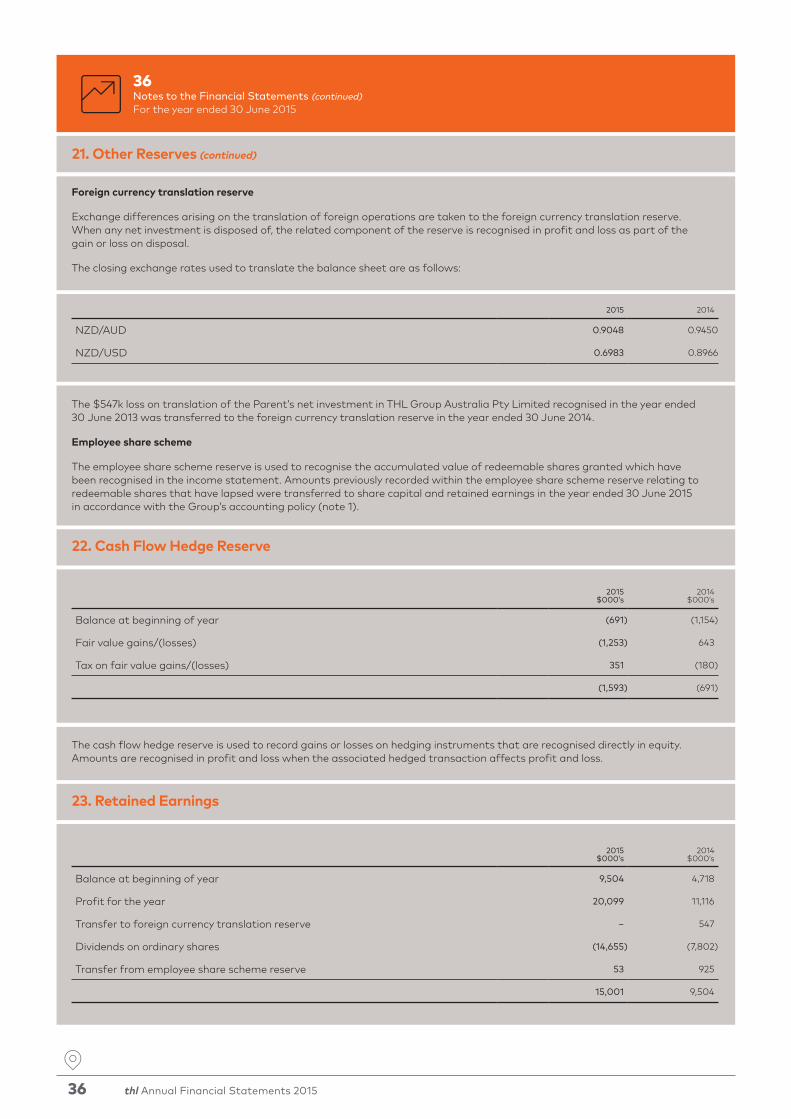
36 thl Annual Financial Statements 2015
22. Cash Flow Hedge Reserve
23. Retained Earnings
The cash flow hedge reserve is used to record gains or losses on hedging instruments that are recognised directly in equity. Amounts are recognised in profit and loss when the associated hedged transaction affects profit and loss.
Foreign currency translation reserve
Exchange differences arising on the translation of foreign operations are taken to the foreign currency translation reserve. When any net investment is disposed of, the related component of the reserve is recognised in profit and loss as part of the gain or loss on disposal.
The closing exchange rates used to translate the balance sheet are as follows:
2015 2014
NZD/AUD 0.9048 0.9450
NZD/USD 0.6983 0.8966
The $547k loss on translation of the Parent’s net investment in THL Group Australia Pty Limited recognised in the year ended 30 June 2013 was transferred to the foreign currency translation reserve in the year ended 30 June 2014.
Employee share scheme
The employee share scheme reserve is used to recognise the accumulated value of redeemable shares granted which have been recognised in the income statement. Amounts previously recorded within the employee share scheme reserve relating to redeemable shares that have lapsed were transferred to share capital and retained earnings in the year ended 30 June 2015 in accordance with the Group’s accounting policy (note 1).
36Notes to the Financial Statements (continued)For the year ended 30 June 2015
21. Other Reserves (continued)
2015 $000’s
2014 $000’s
Balance at beginning of year (691) (1,154)
Fair value gains/(losses) (1,253) 643
Tax on fair value gains/(losses) 351 (180)
(1,593) (691)
2015 $000’s
2014 $000’s
Balance at beginning of year 9,504 4,718
Profit for the year 20,099 11,116
Transfer to foreign currency translation reserve – 547
Dividends on ordinary shares (14,655) (7,802)
Transfer from employee share scheme reserve 53 925
15,001 9,504

thl Annual Financial Statements 2015 37
37Notes to the Financial Statements (continued)For the year ended 30 June 2015
24. Share Capital
The total authorised number of ordinary shares is 112,933,999 shares (2014: 111,802,556). The shares have no par value. All ordinary shares are issued and fully paid. All ordinary shares rank equally with one vote attached to each fully paid ordinary share.
There are 5,730,000 redeemable ordinary shares on issue that are convertible on a 1:1 basis to ordinary shares (2014: 6,075,000). If these convert to ordinary shares per the terms outlined in note 25, total shares on issue will be 118,663,999 (2014: 117,877,556).
In the current year redeemable ordinary shares were converted to ordinary shares in July 2014 (116,666), September 2014 (150,000), October 2014 (200,000), December 2014 (100,000) and March 2015 (425,000). 833,334 redeemable ordinary shares were cancelled in July 2014. Redeemable ordinary shares were issued in October 2014 (200,000) and April 2015 (1,280,000).
In the prior year redeemable ordinary shares were converted to ordinary shares in February 2014 (975,000) and March 2014 (566,667). In March 2014 1,450,000 redeemable ordinary shares were issued. 400,000 redeemable ordinary shares were cancelled in February 2014 and 333,333 redeemable ordinary shares were cancelled in March 2014.
Ordinary shares were issued to directors in lieu of Directors’ fees per the terms outlined in note 34. Shares were issued in October 2014 (79,734) and April 2015 (60,043). In the prior year 60,969 ordinary shares were issued to directors in lieu of Directors’ fees in March 2014. At 30 June 2015 share capital includes an accrual for shares to be issued in lieu of Directors’ fees of $62,000 (2014 $62,000).
2015SHARES
000’s
2014SHARES
000’s2015
$000’s2014
$000’s
Ordinary shares
Opening balance 111,803 110,200 152,399 151,238
Issue of ordinary shares – redeemable ordinary shares converted 991 1,542 760 964
Transfer from employee share scheme reserve for redeemable shares converted – – 113 64
Issue of ordinary shares – in lieu of directors’ fees 140 61 220 71
Ordinary shares to be issued – in lieu of directors’ fees accrued at 30 June – – – 62
Closing balance 112,934 111,803 153,492 152,399
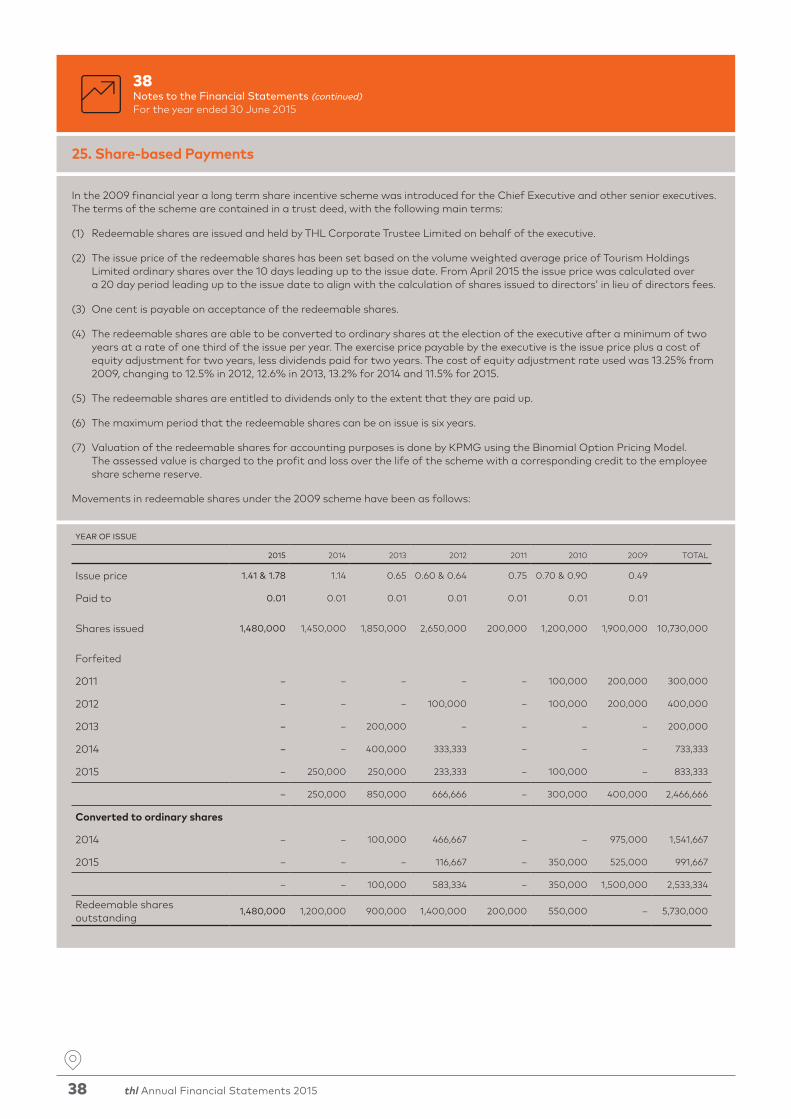
38 thl Annual Financial Statements 2015
38Notes to the Financial Statements (continued)For the year ended 30 June 2015
25. Share-based Payments
In the 2009 financial year a long term share incentive scheme was introduced for the Chief Executive and other senior executives. The terms of the scheme are contained in a trust deed, with the following main terms:
(1) Redeemable shares are issued and held by THL Corporate Trustee Limited on behalf of the executive.
(2) The issue price of the redeemable shares has been set based on the volume weighted average price of Tourism Holdings Limited ordinary shares over the 10 days leading up to the issue date. From April 2015 the issue price was calculated over a 20 day period leading up to the issue date to align with the calculation of shares issued to directors’ in lieu of directors fees.
(3) One cent is payable on acceptance of the redeemable shares.
(4) The redeemable shares are able to be converted to ordinary shares at the election of the executive after a minimum of two years at a rate of one third of the issue per year. The exercise price payable by the executive is the issue price plus a cost of equity adjustment for two years, less dividends paid for two years. The cost of equity adjustment rate used was 13.25% from 2009, changing to 12.5% in 2012, 12.6% in 2013, 13.2% for 2014 and 11.5% for 2015.
(5) The redeemable shares are entitled to dividends only to the extent that they are paid up.
(6) The maximum period that the redeemable shares can be on issue is six years.
(7) Valuation of the redeemable shares for accounting purposes is done by KPMG using the Binomial Option Pricing Model. The assessed value is charged to the profit and loss over the life of the scheme with a corresponding credit to the employee share scheme reserve.
Movements in redeemable shares under the 2009 scheme have been as follows:
YEAR OF ISSUE
2015 2014 2013 2012 2011 2010 2009 TOTAL
Issue price 1.41 & 1.78 1.14 0.65 0.60 & 0.64 0.75 0.70 & 0.90 0.49
Paid to 0.01 0.01 0.01 0.01 0.01 0.01 0.01
Shares issued 1,480,000 1,450,000 1,850,000 2,650,000 200,000 1,200,000 1,900,000 10,730,000
Forfeited
2011 – – – – – 100,000 200,000 300,000
2012 – – – 100,000 – 100,000 200,000 400,000
2013 – – 200,000 – – – – 200,000
2014 – – 400,000 333,333 – – – 733,333
2015 – 250,000 250,000 233,333 – 100,000 – 833,333
– 250,000 850,000 666,666 – 300,000 400,000 2,466,666
Converted to ordinary shares
2014 – – 100,000 466,667 – – 975,000 1,541,667
2015 – – – 116,667 – 350,000 525,000 991,667
– – 100,000 583,334 – 350,000 1,500,000 2,533,334
Redeemable shares outstanding
1,480,000 1,200,000 900,000 1,400,000 200,000 550,000 – 5,730,000

thl Annual Financial Statements 2015 39
39Notes to the Financial Statements (continued)For the year ended 30 June 2015
25. Share-based Payments (continued)
991,667 redeemable shares were converted to ordinary shares in the year to June 2015 which resulted in 991,667 ordinary shares being issued (2014: 1,541,667) at a weighted average price of $0.76 per share (2014: 0.62). 833,333 shares were forfeited as a result of Executives leaving the business (2014: 733,333).
*Exercise price is issue price, less 1 cent paid, less dividends paid for two years, plus a cost of capital adjustment for two years.
Redeemable shares outstanding at year end have the following expiry dates and exercise prices:
*Exercise price is issue price, less 1 cent paid, less dividends paid for two years, plus a cost of capital adjustment for two years.
The value of the redeemable shares calculated using the Binomial Option Pricing Model is being amortised over the life of the redeemable share rights. The 2015 expense of $147k (2014: $143k) will accumulate in the executive share scheme reserve.
Movements in the number of redeemable shares outstanding and their related weighted average exercise prices are as follows:
2015 2014
AVERAGE EXERCISE
PRICE*REDEEMABLE
SHARES
AVERAGE EXERCISE
PRICE*REDEEMABLE
SHARES
At 1 July 0.92 6,075,000 0.75 6,900,000
Granted 2.05 1,480,000 1.38 1,450,000
Forfeited 0.90 (833,333) (0.71) (733,333)
Exercised 0.76 (991,667) 0.62 (1,541,667)
At 30 June 1.19 5,730,000 0.92 6,075,000
Convertible shares at 30 June 1,983,333 2,241,667
EXERCISE PRICE* 2015 2014
Expiry date
June 2015 0.57 – 525,000
October 2015 0.84 150,000 200,000
May 2016 1.09 400,000 800,000
December 2016 0.90 200,000 200,000
September 2017 0.69 500,000 600,000
March 2018 0.71 900,000 1,150,000
March 2019 0.65 900,000 1,150,000
March 2020 1.25 1,200,000 1,450,000
October 2020 1.64 200,000 –
March 2021 2.11 1,280,000 –
Redeemable shares outstanding 5,730,000 6,075,000
Valuation of redeemable shares 831,967 812,050

40 thl Annual Financial Statements 2015
40Notes to the Financial Statements (continued)For the year ended 30 June 2015
25. Share-based Payments (continued)
26. Trade and Other Payables
27. Borrowings
Note: the exercise prices above are adjusted for any dividends paid to date, but make no assumption about future dividends which will be deducted from the exercise price.
In arriving at the value of the redeemable share rights under the Binomial Option Pricing Model the following inputs have been used:
2015 2014 2013 2012 2011 2010 2009
Issue price$1.41 &
$1.78$1.14 $0.65
$0.60 & $0.64
$0.75$0.70 &
$0.90$0.49
Forecast dividend yield over the life of the transfer rights
8.9% 6.0% 6.3%3.0% &
6.0%3.0% 3.0% 3.0%
Risk free rate of interest over the exercise period of the share transfer rights
3.30% 4.63% 3.80%4.68% &
3.89%5.15% 5.15% 4.14%
Volatility of Tourism Holdings Limited share price returns mid point
26.0% 32.5% 29%35% &
28%35% 35% 25%
Cost of capital adjustment p.a. 11.50% 13.20% 12.60%13.25% &
12.50%13.25% 13.25% 13.25%
2015 $000’s
2014 $000’s
Trade payables 26,148 13,673
Accrued expenses and other payables 8,682 16,865
34,830 30,538
2015 $000’s
2014 $000’s
Non-current
Bank borrowings 71,884 61,033
Deferred consideration – 1,898
Capitalised lease obligations – 3,676
71,884 66,607
Current
Bank borrowings 40 4,400
Capitalised lease obligations 3,839 3,403
Vendor loans – 2,788
Deferred consideration – 4,941
3,879 15,532
Total borrowings 75,763 82,139

thl Annual Financial Statements 2015 41
41Notes to the Financial Statements (continued)For the year ended 30 June 2015
27. Borrowings (continued)
2015 $000’s
2014 $000’s
Maturity of non-current portion
Bank loans
One to two years 9,955 –
Two to three years 40,693 5,300
Three to five years 21,236 55,733
71,884 61,033
Other loans
One to two years – –
Two to three years – 1,898
Three to five years – –
– 1,898
Capitalised finance lease obligations
One to two years – 3,676
Two to three years – –
Three to five years – –
– 3,676
2015 $000’s
2014 $000’s
Capitalised finance lease liabilities – minimum lease payments
No later than 1 year 3,908 3,647
Later than 1 year and no later than 5 years – 3,742
Minimum lease payments 3,908 7,389
Future finance charges on finance leases (69) (310)
Present value of finance lease liabilities 3,839 7,079
An Australian subsidiary has commercial hire purchase loans secured over its motorhome fleet. These loans are repayable over the next twelve months.
The finance leases are taken out under a non-renewable contract with a 50% balloon on the final payment.
Interest rates applicable at 30 June 2015 on the bank term loans and the Australian capitalised lease obligations ranged from 1.99% to 6.50%p.a. (2014: 2.77% to 6.33%p.a.).
The Group had other loans repayable to the vendors of JJ Motorcars Inc. (trading as Road Bear) that Tourism Holdings Limited acquired on 31 December 2010. These loans were repaid during the year.
The guaranteeing group consisting of Tourism Holdings Limited and all New Zealand, Australian and United States 100% owned subsidiaries had, at balance date, a working capital and a multi-option facility with Westpac Banking Corporation, Westpac New Zealand Limited and ANZ Banking Group (New Zealand) Limited and has provided a composite first ranking debenture over the assets and undertakings of the Group in New Zealand and in Australia.
The facilities are split into term facilities and working capital facilities with annual review and subject to covenant compliance extended annually. The renewal of all of the facilities, excluding the Interchangeable Working Capital Facility occurred in June 2014.

42 thl Annual Financial Statements 2015
42Notes to the Financial Statements (continued)For the year ended 30 June 2015
27. Borrowings (continued)
2015 $000’s
2014 $000’s
New Zealand dollar 42,261 52,789
Australian dollar 9,907 12,899
United States American dollar 19,658 16,451
Pounds sterling 3,937 –
75,763 82,139
2015 $000’s
2014 $000’s
Floating rate
– Expiring within one year 6,309 9,853
– Expiring beyond one year 20,245 20,893
26,554 30,746
Included in the working capital facilities is a facility that is interchangeable between overdraft, trade finance loans and documentary letter of credit. The documentary letter of credit facility is utilised for the purchase of fleet from Action Manufacturing LP. This facility is reviewed annually on 1 November.
Current expiry dates are:
Interchangeable Working Capital Facility 1 November 2015Other Working Capital Facilities 6 October 2016Term Facilities 6 October 2017 & 1 July 2019
The facilities cannot be called for repayment by the banks at a date earlier than the facility’s expiry date above unless there is a breach of the bank covenants. There have been no breaches of bank covenants during the current or prior period.
The carrying amounts of the Group’s borrowings are denominated in the following currencies:
The Group has the following undrawn borrowing facilities:
No borrowing costs were capitalised in 2015 (2014: nil).
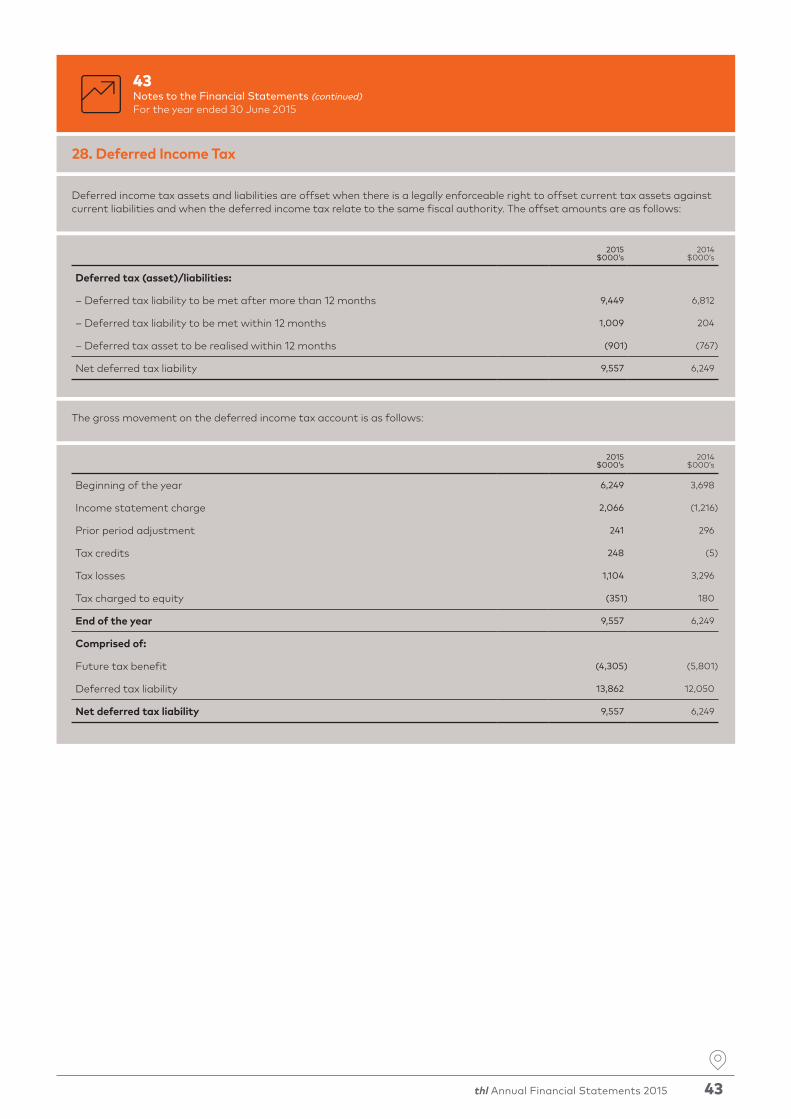
thl Annual Financial Statements 2015 43
43Notes to the Financial Statements (continued)For the year ended 30 June 2015
28. Deferred Income Tax
2015 $000’s
2014 $000’s
Deferred tax (asset)/liabilities:
– Deferred tax liability to be met after more than 12 months 9,449 6,812
– Deferred tax liability to be met within 12 months 1,009 204
– Deferred tax asset to be realised within 12 months (901) (767)
Net deferred tax liability 9,557 6,249
Deferred income tax assets and liabilities are offset when there is a legally enforceable right to offset current tax assets against current liabilities and when the deferred income tax relate to the same fiscal authority. The offset amounts are as follows:
2015 $000’s
2014 $000’s
Beginning of the year 6,249 3,698
Income statement charge 2,066 (1,216)
Prior period adjustment 241 296
Tax credits 248 (5)
Tax losses 1,104 3,296
Tax charged to equity (351) 180
End of the year 9,557 6,249
Comprised of:
Future tax benefit (4,305) (5,801)
Deferred tax liability 13,862 12,050
Net deferred tax liability 9,557 6,249
The gross movement on the deferred income tax account is as follows:

44 thl Annual Financial Statements 2015
44Notes to the Financial Statements (continued)For the year ended 30 June 2015
28. Deferred Income Tax (continued)
29. Imputation Credits
2015 $000’s
2014 $000’s
Amounts recognised in income statement
Provisions (1,677) (1,904)
Property, plant and equipment 13,806 11,541
Tax losses (1,813) (3,077)
Tax credits – (248)
Other (139) 205
Amounts recognised directly in equity
Derivative financial instruments (620) (268)
Net deferred tax liability 9,557 6,249
2015 $000’s
2014 $000’s
The amount of imputation credits available for use in subsequent reporting periods 300 –
The balance comprises temporary differences attributable to:
The above amounts represent the balance of the imputation credit account as at the end of the reporting period adjusted for:
• Imputation credits that will arise from the payment of the amount of the provision for income tax;
• Imputation debits that will arise from the payment of dividends recognised as a liability at the reporting date; and
• Imputation credits that will arise from the receipt of dividends recognised as receivables at the reporting date.
Deferred income tax assets are recognised for tax loss carry-forwards to the extent that the realisation of the related tax benefit through the future taxable profits is probable.
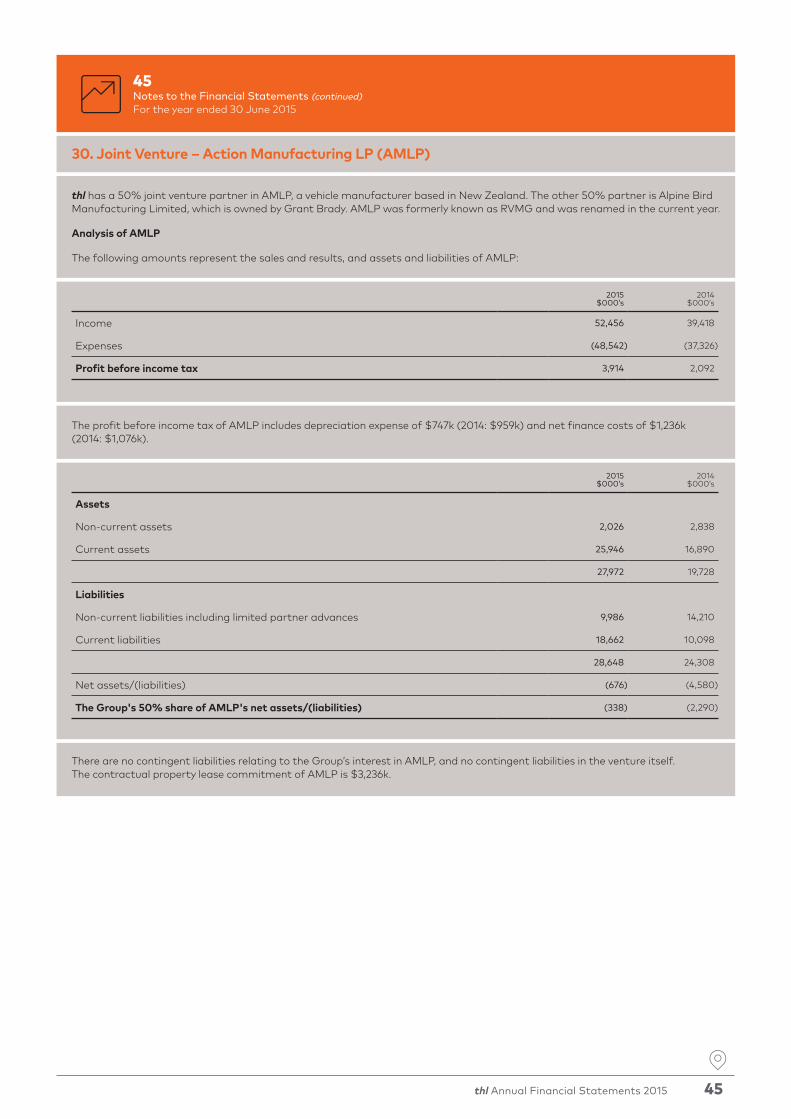
thl Annual Financial Statements 2015 45
45Notes to the Financial Statements (continued)For the year ended 30 June 2015
30. Joint Venture – Action Manufacturing LP (AMLP)
2015 $000’s
2014 $000’s
Income 52,456 39,418
Expenses (48,542) (37,326)
Profit before income tax 3,914 2,092
2015 $000’s
2014 $000’s
Assets
Non-current assets 2,026 2,838
Current assets 25,946 16,890
27,972 19,728
Liabilities
Non-current liabilities including limited partner advances 9,986 14,210
Current liabilities 18,662 10,098
28,648 24,308
Net assets/(liabilities) (676) (4,580)
The Group's 50% share of AMLP's net assets/(liabilities) (338) (2,290)
thl has a 50% joint venture partner in AMLP, a vehicle manufacturer based in New Zealand. The other 50% partner is Alpine Bird Manufacturing Limited, which is owned by Grant Brady. AMLP was formerly known as RVMG and was renamed in the current year.
Analysis of AMLP
The following amounts represent the sales and results, and assets and liabilities of AMLP:
The profit before income tax of AMLP includes depreciation expense of $747k (2014: $959k) and net finance costs of $1,236k (2014: $1,076k).
There are no contingent liabilities relating to the Group’s interest in AMLP, and no contingent liabilities in the venture itself. The contractual property lease commitment of AMLP is $3,236k.

46 thl Annual Financial Statements 2015
46Notes to the Financial Statements (continued)For the year ended 30 June 2015
30. Joint Venture – Action Manufacturing LP (AMLP) (continued)
2015 $000’s
2014 $000’s
Investment in AMLP 250 250
Losses recognised against the investment balance (250) (250)
Net investment recognised – –
Advance opening balance 9,557 10,169
Net cash advances/(repayment) during the period (4,033) (612)
Advance closing balance 5,524 9,557
Opening losses/impairment recognised against the advance (2,045) (3,091)
Share of profit for the period 1,957 1,046
Total losses/impairment recognised against the advance (88) (2,045)
Net interest in AMLP 5,436 7,512
2015 $000’s
2014 $000’s
Current 2,500 2,500
Non-current 2,936 5,012
5,436 7,512
The Group’s recognised interest in AMLP
The following table sets out the Group’s interest in AMLP:
The advances from the Group are payable on demand but the directors do not expect full repayment in the next 12 months, therefore only $2.5million is presented as a current asset as at 30 June 2015 (2014: $2.5million). Interest is payable at a rate of 9.0% per annum.
The share of profit recognised represents a reduction in the impairment of the investment and the advances. The impairments recognised against the advance represent the share of prior year accumulated losses of AMLP. The remaining balance of the advance is deemed to be recoverable based on AMLP’s forecast profitability.
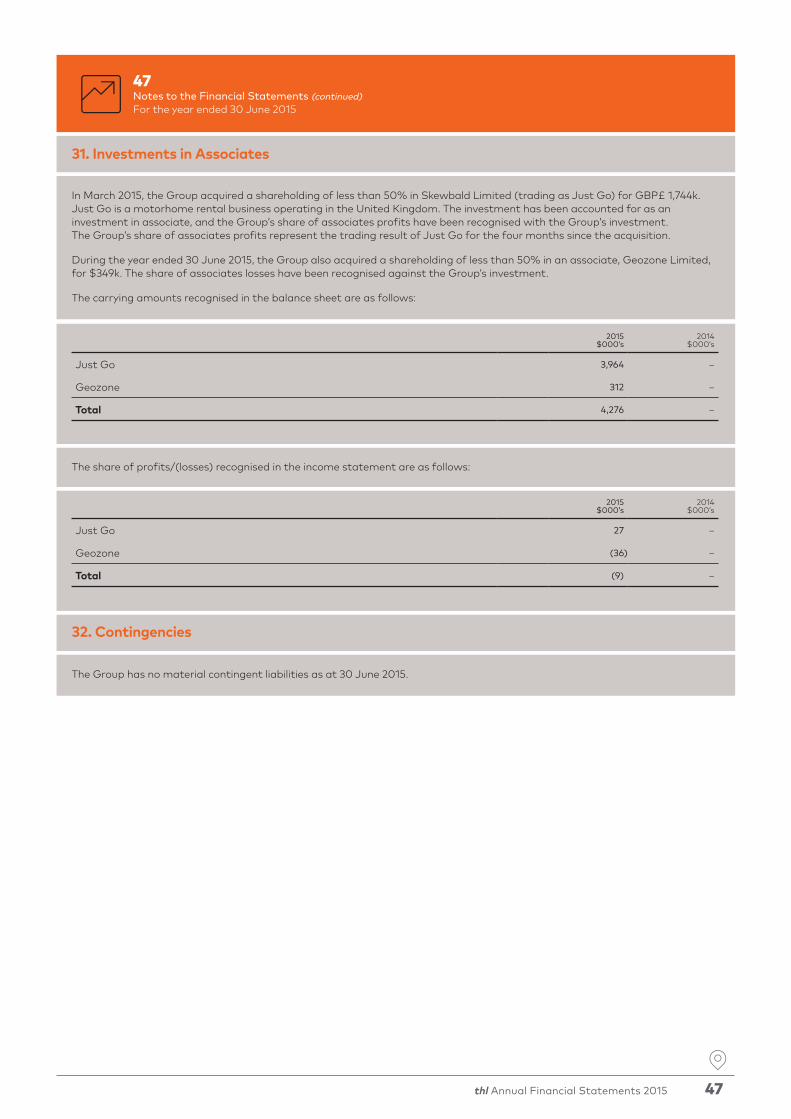
thl Annual Financial Statements 2015 47
47Notes to the Financial Statements (continued)For the year ended 30 June 2015
31. Investments in Associates
2015 $000’s
2014 $000’s
Just Go 3,964 –
Geozone 312 –
Total 4,276 –
2015 $000’s
2014 $000’s
Just Go 27 –
Geozone (36) –
Total (9) –
In March 2015, the Group acquired a shareholding of less than 50% in Skewbald Limited (trading as Just Go) for GBP£ 1,744k. Just Go is a motorhome rental business operating in the United Kingdom. The investment has been accounted for as an investment in associate, and the Group’s share of associates profits have been recognised with the Group’s investment. The Group’s share of associates profits represent the trading result of Just Go for the four months since the acquisition.
During the year ended 30 June 2015, the Group also acquired a shareholding of less than 50% in an associate, Geozone Limited, for $349k. The share of associates losses have been recognised against the Group’s investment.
The carrying amounts recognised in the balance sheet are as follows:
32. Contingencies
The Group has no material contingent liabilities as at 30 June 2015.
The share of profits/(losses) recognised in the income statement are as follows:

48 thl Annual Financial Statements 2015
48Notes to the Financial Statements (continued)For the year ended 30 June 2015
33. Commitments
34. Related Party Transactions
2015 $000’s
2014 $000’s
Property, plant and equipment 30,531 25,034
2015 $000’s
2014 $000’s
Salaries and other short term employee benefits 3,343 3,475
Share based payments benefits 147 143
2015 $000’s
2014 $000’s
Within one year 6,499 5,315
One to five years 18,515 17,219
Beyond five years 16,865 11,465
41,879 33,999
Capital commitments
Capital expenditure contracted for at balance date but not yet incurred is as follows:
Key management compensation
Operating lease commitments – where a group company is the lessee
The Group leases various retail outlets, branches and offices under non-cancellable operating lease agreements. The leases have varying terms, escalation clauses and renewal rights.
The future aggregate minimum lease payments under non-cancellable operating leases are as follows:
Executive management do not receive any directors’ fees as directors of subsidiary companies.
In the current year the term of the lease at Bush Rd, Albany has been extended (refer to note 34) and a new lease was entered into for the new depot and RV Supercentre site in Christchurch.
Commitment under Documentary Letter of Credit
As at 30 June 2015 the Group has a $20million Documentary Letter of Credit facility. The amount drawn at 30 June 2015 was $13,590k (2014: $5,746k).
The outstanding documents are in favour of AMLP and are due for payment within 12 months. This is recognised within ‘trade and other payables’ (note 26).

thl Annual Financial Statements 2015 49
49Notes to the Financial Statements (continued)For the year ended 30 June 2015
34. Related Party Transactions (continued)
2015 $000’s
2014 $000’s
Loans from key management personnel – 2,788
2015 $000’s
2014 $000’s
Total deferred consideration liability – 4,941
Deferred consideration due and payable to Hauraki Motorhomes Limited – 380
Interest included in deferred consideration due & payable – 27
Loans to directors and key management of the Company
There were no loans during the current or previous year by the Group to Directors or key management with the exception of the loan to Alpine Bird (New Zealand) Limited, a business associated with Grant Brady (refer below).
Loans from directors, key management or related parties
Loan provided as part of the acquisition of JJ Motorcars Inc. in the USA (trading as Road Bear) to fund fleet. The loan was repaid during the year.
Directors’ fees (share issue in lieu of cash)
At the 2013 annual meeting of shareholders, shareholder approval was obtained for thl to issue shares in whole or in part payment of directors’ remuneration. From 1 October 2013, Rob Campbell elected to receive 100% of his director fee in shares and Graeme Wong has elected to receive 33% of his director fee in shares. From 1 February 2014 Christina Domecq has elected to receive 100% of her director fee in shares. From 1 February 2015 Gráinne Troute elected to receive 100% of her director fee in shares. Shares issued in lieu of directors’ fees are as follows:
Kay Howe (Non–executive Director)
As part of the transaction with KEA Campers and United Campervans, Kay Howe (a shareholder and director of United Vehicle Rentals Limited which was later renamed Hauraki Motor Homes Limited) was appointed as an executive director of thl on 31 October 2012. Kay Howe had executive responsibilities relating to the integration of the businesses until 30 April 2013 at which point she became a non-independent director.
Under the terms of the transaction, thl had a liability to pay deferred consideration to Hauraki Motor Homes Limited in accordance with the deferred consideration agreement. The table below details the total deferred consideration liability to Hauraki Motor Homes Limited and the amount due and payable based on sales of United motorhomes. In September 2014 thl exercised a right under the agreement to repay all of the remaining deferred consideration balance.
SHARES VALUE
2015SHARES
000’s
2014SHARES
000’s2015
$000’s2014
$000’s
Shares issued in lieu of cash 140 61 220 71
Accrual of shares to be issued to directors at 30 June – – 62 62

50 thl Annual Financial Statements 2015
50Notes to the Financial Statements (continued)For the year ended 30 June 2015
34. Related Party Transactions (continued)
2015 $000’s
2014 $000’s
Payments to Supreme including purchase of motorhomes and caravans 361 378
2015 $000’s
2014 $000’s
Consulting and software development fees paid to ORA 375 –
2015 $000’s
2014 $000’s
Total deferred consideration owing – 1,898
2015 $000’s
2014 $000’s
Cost of sub-licenses and operating expenses 508 497
ORA HQ Limited (ORA)
ORA is a company in which thl directors Rob Campbell and Christina Domecq are shareholders. ORA has provided consulting and software development services to thl. The chair of the audit and risk committee has approved the provision of these services.
Grant Brady (shareholder and director of Alpine Bird (New Zealand) Limited)
As part of the transaction with KEA Campers and United Campervans, Grant Brady (a shareholder and director of KEA Campers (New Zealand) Limited which was later renamed Alpine Bird (New Zealand) Limited (“Alpine Bird”)) was appointed as the General Manager of RV Super Centre in New Zealand on the 31 October 2012. Grant Brady is a member of the thl executive team. Grant Brady is paid a salary by thl for his role on the thl executive team and by Action Manufacturing (formerly RVMG) as Managing Director of Action Manufacturing.
Under the terms of the transaction, thl had a liability to pay deferred consideration to Alpine Bird in accordance with the deferred consideration agreement. In April 2015 agreement was reached with Alpine Bird that no further payments would be payable under the deferred consideration agreement. The outstanding balance of principal and interest at April 2015 totalling $1,744k has been recognised as income in the current year. The table below details the total deferred consideration liability to Alpine Bird at 30 June 2014 and the amount due and payable based on sales of KEA motorhomes:
A minor component of the transaction included certain transactions with Supreme Motorhomes Limited (Supreme) relating to the sale of caravan brands from thl and the acquisition of intellectual property and moulds by AMLP relating to the construction of United Motorhomes. Supreme is owned by entities associated with Kay Howe.
Also included in the terms of the transaction was a requirement for thl to take a sublease on a property in Bush Road and pay rent and other operating expenses for a maximum of two years and 364 days. The lease on this property was renewed for a further term of six years in April 2015. The property was formerly operated by KEA and is owned by Bush Road Enterprises Limited (of which Grant Brady is a minority shareholder and director). The cost of the sublease and operating expenses are set out in the table below:

thl Annual Financial Statements 2015 51
51Notes to the Financial Statements (continued)For the year ended 30 June 2015
34. Related Party Transactions (continued)
35. Events after the Reporting Period
2015 $000’s
2014 $000’s
Alpine Bird Loan 1,553 1,452
2015 $000’s
2014 $000’s
Purchase of motorhomes by the Group from joint venture 42,000 26,747
Interest charged to joint venture 712 830
Net interest in Action Manufacturing LP (note 30) 5,436 7,512
Under the terms of the transaction thl made an advance of $1,371k to Alpine Bird. This loan is interest bearing at commercial rates and is secured over the shares held by Alpine Bird in thl. Interest is accruing on the loan.
A dividend was declared after balance date at 8 cents per share payable on 15 October 2015.
The amount outstanding is payable on demand at an interest rate of 9.0%.
Grant Brady is a shareholder in another entity Alpine Bird Manufacturing Limited that owns 50% of Action Manufacturing Limited Partnership (“AMLP”) that was set up in March 2012. AMLP was formerly known as RVMG LP, and was renamed in the current year. thl owns the other 50%. AMLP manufactures the motorhomes and campervans used by Rentals New Zealand, manufactures motorhomes and parts for Rentals Australia, and manufactures specialty vehicles for external customers. Pricing is based on the cost of manufacture plus an agreed margin set out in the Limited Partnership Agreement. AMLP also subleases part of the Bush Road property described above.
At balance date, $13,590k (2014: $5,746k) is outstanding under a Documentary Letter of Credit in favour of AMLP. This amount is included in the purchase of motorhomes shown above, and the outstanding amount is included in ‘trade and other payables’.
Just Go
In the year ended 30 June 2015 the Group acquired a shareholding in Just Go (refer to note 31). Prior to the acquisition the Group purchased motorhomes from Just Go with a value of $1,502k. Furthermore, at 30 June 2015, the Group had a commitment to purchase motorhomes from Just Go with a value of $4,140k. These are included within the capital commitments in note 33.
Action Manufacturing LP

52 thl Annual Financial Statements 2015
52Independent Auditors’ Report
Independent Auditors’ Report to the shareholders of Tourism Holdings Limited
Report on the Financial Statements
We have audited the Group financial statements of Tourism Holdings Limited (“the Company”) on pages 3 to 51, which comprise the statement of financial position as at 30 June 2015, the income statement, the statement of comprehensive income, the statement of changes in equity and the statement of cash flows for the year then ended, and the notes to the financial statements that include a summary of significant accounting policies and other explanatory information for the Group. The Group comprises the Company and the entities it controlled at 30 June 2015 or from time to time during the financial year.
Directors’ Responsibility for the Financial Statements
The Directors are responsible for the preparation and fair presentation of these financial statements in accordance with New Zealand Equivalents to International Financial Reporting Standards and International Financial Reporting Standards and for such internal controls as the Directors determine are necessary to enable the preparation of financial statements that are free from material misstatement, whether due to fraud or error.
Auditors’ Responsibility
Our responsibility is to express an opinion on these financial statements based on our audit. We conducted our audit in accordance with International Standards on Auditing (New Zealand) and International Standards on Auditing. These standards require that we comply with relevant ethical requirements and plan and perform the audit to obtain reasonable assurance about whether the financial statements are free from material misstatement.
An audit involves performing procedures to obtain audit evidence about the amounts and disclosures in the financial statements. The procedures selected depend on the auditors’ judgement, including the assessment of the risks of material misstatement of the financial statements, whether due to fraud or error. In making those risk assessments, the auditors consider the internal controls relevant to the Company’s preparation and fair presentation of the financial statements in order to design audit procedures that are appropriate in the circumstances, but not for the purpose of expressing an opinion on the effectiveness of the Company’s internal control. An audit also includes evaluating the appropriateness of accounting policies used and the reasonableness of accounting estimates, as well as evaluating the overall presentation of the financial statements.
We believe that the audit evidence we have obtained is sufficient and appropriate to provide a basis for our audit opinion.
We are independent of the Group. Our firm carries out other services for the Group in the areas of treasury services, agreed upon procedures and other services. The provision of these other services has not impaired our independence.
Opinion
In our opinion, the financial statements on pages 3 to 51 present fairly, in all material respects, the financial position of the Group as at 30 June 2015, and its financial performance and cash flows for the year then ended in accordance with New Zealand Equivalents to International Financial Reporting Standards and International Financial Reporting Standards.
Restriction on Use of our Report
This report is made solely to the Company’s shareholders, as a body, in accordance with the Companies Act 1993. Our audit work has been undertaken so that we might state those matters which we are required to state to them in an auditors’ report and for no other purpose. To the fullest extent permitted by law, we do not accept or assume responsibility to anyone other than the Company and the Company’s shareholders, as a body, for our audit work, for this report or for the opinions we have formed.
Chartered Accountants Auckland27 August 2015
PricewaterhouseCoopers, 188 Quay Street, Private Bag 92162, Auckland 1142, New Zealand T: +64 9 355 8000, F: +64 9 355 8001, www.pwc.com/nz

thl Annual Financial Statements 2015 53
53Statutory InformationFor the year ended 30 June 2015
Corporate Governance
Tourism Holdings Limited (‘thl’) operates under a set of corporate governance principles designed to ensure that thl is effectively managed. thl’s corporate governance principles do not materially differ from the NZX Corporate Governance Best Practice Code.
Role of the Board
The Board is committed to managing thl in an ethical and professional manner, and in the best interests of the company and its shareholders. Specific responsibilities of the Board, as set out in the Board Charter adopted by thl, include the following:
• Oversight of thl, including its control and accountability procedures and systems;
• Appointment, performance and removal of the Chief Executive Officer;
• Confirmation of the appointment and removal of the senior executive group (being the direct reports to the Chief Executive Officer);
• Setting the remuneration of the Chief Executive Officer and Chief Financial Officer and approval of the remuneration of the senior executive group;
• Approval of the corporate strategy and objectives and oversight of the adequacy of thl’s resources required to achieve the strategic objectives;
• Approval of and monitoring of actual results against the annual business plan and budget (including the capital expenditure plan);
• Review and ratification of thl’s risk management framework, internal compliance and control, codes of conduct, and legal compliance;
• Approval and monitoring of the progress of capital expenditures, capital management initiatives, and acquisitions and divestments; and
• Approval of the annual and half-year financial statements.
Board Composition
The Board of Directors currently comprises six directors, all of whom are non-executive directors.
Graeme Bowker retired from the Board in February 2015. Gráinne Troute was appointed to the Board from 1 February 2015.
The policy for appointment and retirement of directors is contained within thl’s constitution. At each annual meeting, one-third of the directors shall retire by rotation. Rob Campbell and David Neidhart retire by rotation at the 2015 Annual Meeting and, being eligible, offer themselves for re-election.
Gráinne Troute was appointed after the 2014 Annual Meeting; therefore, she will retire at the 2015 Annual Meeting and, being eligible, offers herself for election.
NZX has determined that a component of good corporate governance is the identification of independent directors. As at 30 June 2015, being the balance date, the following directors are independent within the meaning of the NZX listing rules:
Rob Campbell Chairman & Chair Market Disclosure CommitteeGraeme Wong Chair Audit & Risk CommitteeGráinne Troute Chair Remuneration & Nomination CommitteeChristina Domecq Chair Marketing & Customer Experience Committee
Kay Howe and David Neidhart are not independent within the meaning of the NZX listing rules.
As at 30 June 2015, being the balance date, the Board of thl comprised three female directors and three male directors, compared to two female directors and four male directors at 30 June 2014. As at 30 June 2015 the senior management (being the CEO and those who report directly to the CEO) of thl comprised two female employees and eight male employees, compared to three female employees and eight male employees at 30 June 2014.

54 thl Annual Financial Statements 2015
54Statutory Information (continued)For the year ended 30 June 2015
Corporate Governance Framework
The Board is committed to continued development of thl’s corporate governance practices. The Board continues to review and develop its corporate governance policies and monitor developments to keep abreast of corporate governance best practice.
thl’s corporate governance framework includes the constitution of thl, the Board Charter, a Code of Ethics, and various policies including a Delegated Authority Policy, Market Disclosure Policy and Securities Trading Policy.
There are four standing committees described as below. The performance of the standing committees is reviewed annually against written charters.
thl’s corporate governance policies and charters are available on its website at www.thlonline.com
Audit & Risk Committee
The Audit & Risk Committee is comprised solely of non-executive directors of the Board and must include not less than three independent non-executive directors.
The Committee meets a minimum of three times each year. The Audit & Risk Committee has oversight of, and assists the Board to fulfil its responsibilities in the areas of financial reporting, audit functions, and risk management and control.
The current composition of the Audit & Risk Committee is Graeme Wong (Chairman), Rob Campbell, and Gráinne Troute. Also in attendance by invitation are Kay Howe, David Neidhart, Christina Domecq, Grant Webster (Chief Executive Officer) and Mark Davis (Chief Financial Officer).
Remuneration & Nomination Committee
The Remuneration & Nomination Committee is comprised of at least three non-executive directors of the Board, a majority of whom must be independent directors.
The Committee meets a minimum of two times each year. The Remuneration & Nomination Committee supports the Board on matters relating to human resources and remuneration. It assesses the role and responsibilities, composition, training and membership requirements and remuneration for the Board, including recommendations for the appointment and removal of directors.
The current composition of the Remuneration & Nomination Committee is Gráinne Troute (Chair), Kay Howe, Rob Campbell, Graeme Wong and David Neidhart. Also in attendance by invitation are Christina Domecq and Grant Webster (Chief Executive Officer).
Market Disclosure Committee
The Market Disclosure Committee is comprised of the Board Chairman and the Chair of the Audit & Risk Committee. Also in attendance are Grant Webster (Chief Executive Officer) and Mark Davis (Chief Financial Officer). The Committee monitors compliance with the Group’s Market Disclosure Policy which covers compliance with NZX Listing Rules, the Companies Act 1993 and guidelines issued by the Financial Markets Authority and the NZX.
The Committee meets as required and approves all market disclosures.
Marketing & Customer Experience Committee
The Marketing & Customer Experience Committee is comprised of at least two non-executive directors of the Board, and must be chaired by an independent director. The current composition of the Marketing & Customer Experience Committee is Christina Domecq (Chair) and Kaye Howe. The Committee supports the Board and management on strategy around brand, marketing and customer experience. The Committee meets as required.
Independent Professional Advice
With the approval of the Chairman, each Director has the right to seek independent legal and other professional advice at the Company’s expense concerning any aspect of the Company’s operation or undertakings in order to fulfil their duties and responsibilities as Directors.

thl Annual Financial Statements 2015 55
55Statutory Information (continued)For the year ended 30 June 2015
Table of Board Attendances
The above shows the spread of shareholders as at 30 June 2015. The shareholding of New Zealand Central Securities Depository Limited (NZCSD) has been reallocated to the applicable members of NZCSD.
Share Trading Protocol
thl has in place a formal securities trading policy and guidelines which applies to all Directors, officers and employees of thl and its subsidiaries who intend to trade in thl listed securities.
All individuals defined as “restricted persons” under that policy, being the Directors, Chief Executive Officer and all persons reporting directly to the Chief Executive Officer, must notify thl of their intention to trade and obtain approval from the Board before trading in thl’s shares. Trading is permitted, provided the restricted person confirms that they do not hold any material information and that they are not aware of any reason that would prohibit them from trading. Any trading must be completed within 10 trading days of Board approval being given.
Diversity Policy
In June 2014 the Board adopted a Diversity Policy that requires diversity in Board representation encompassing differences including but not limited to gender, ethnicity, race, marital status, sexual orientation, age, employment status, religious belief, ethical belief or political opinion. When making appointments the Board is committed to considering diversity as well as the mix of skills and experience needed to expand the perspective and capability of the Board as a whole.
The Board considers that it has the appropriate mix of skills, experience and diversity to discharge its responsibilities.
The ordinary shares of Tourism Holdings Limited are listed on the NZX Main Board.
As at 30 June 2015 the total number of voting securities on issue was 112,933,999.
Spread of Shareholders
(FY2015 JULY 14 - JUNE 15)BOARD
MEETINGS
AUDIT & RISK COMMITTEE
MEETINGS
REMUNERATION & NOMINATION
COMMITTEE MEETINGS
DISCLOSURE COMMITTEE
MEETINGS
MARKETING & CUSTOMER EXPERIENCE COMMITTEE
MEETINGS
Total number of meetings held 8 4 5 1 2
Rob Campbell 8 4 5 1 –
Graeme Bowker 5 3 3 – –
Christina Domecq 8 1 4 – 2
Kay Howe 8 3 5 – 2
David Neidhart 8 2 5 – –
Gráinne Troute 4 2 3 – –
Graeme Wong 8 3 5 1 –
*Only one Disclosure Committee meeting was required outside of the full Board or Audit and Risk Committee meetings.
NUMBER OF HOLDERS
NUMBER OF SHARES HELD
% OF TOTAL ISSUED SHARES
1 - 1,000 800 534,149 0.5%
1,001 - 5,000 1,946 5,482,518 4.8%
5,001 - 10,000 772 5,948,071 5.3%
10,001 - 50,000 691 14,219,543 12.6%
50,001 - 100,000 81 5,982,763 5.3%
100,001 and over 52 80,766,955 71.5%
4,342 112,933,999 100.0%
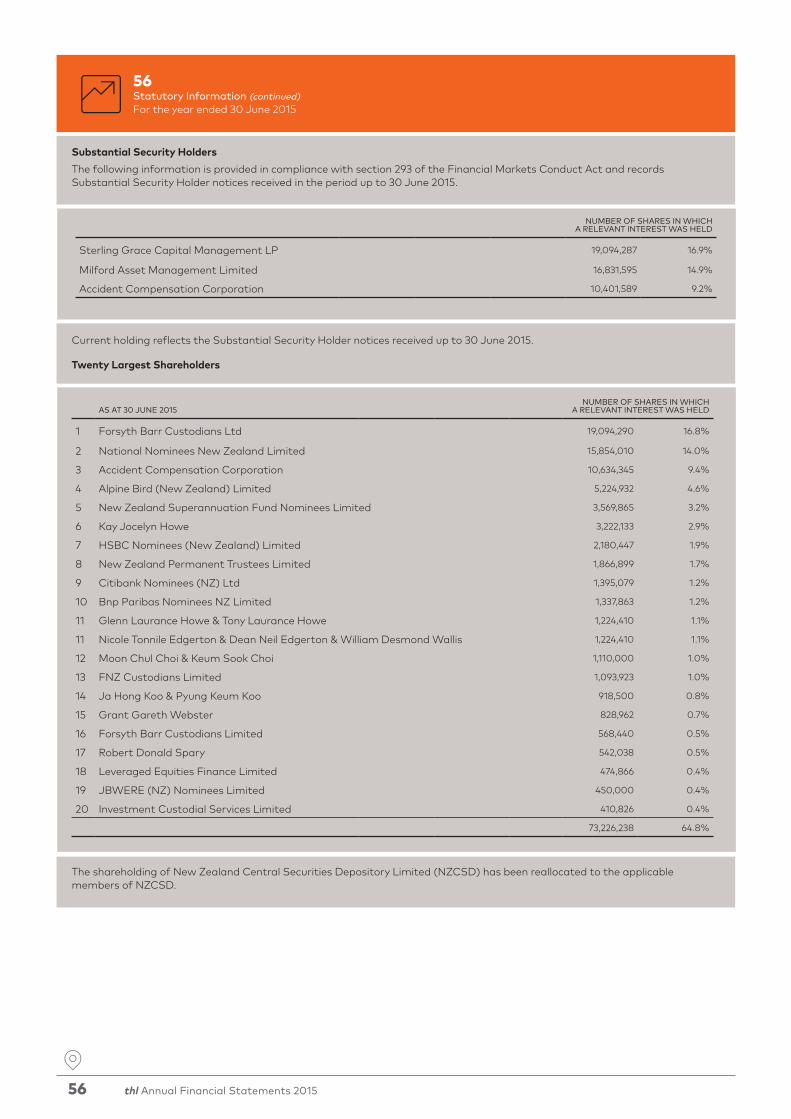
56 thl Annual Financial Statements 2015
56Statutory Information (continued)For the year ended 30 June 2015
Substantial Security Holders
The following information is provided in compliance with section 293 of the Financial Markets Conduct Act and records Substantial Security Holder notices received in the period up to 30 June 2015.
The shareholding of New Zealand Central Securities Depository Limited (NZCSD) has been reallocated to the applicable members of NZCSD.
Current holding reflects the Substantial Security Holder notices received up to 30 June 2015.
Twenty Largest Shareholders
NUMBER OF SHARES IN WHICH A RELEVANT INTEREST WAS HELD
Sterling Grace Capital Management LP 19,094,287 16.9%
Milford Asset Management Limited 16,831,595 14.9%
Accident Compensation Corporation 10,401,589 9.2%
AS AT 30 JUNE 2015NUMBER OF SHARES IN WHICH
A RELEVANT INTEREST WAS HELD
1 Forsyth Barr Custodians Ltd 19,094,290 16.8%
2 National Nominees New Zealand Limited 15,854,010 14.0%
3 Accident Compensation Corporation 10,634,345 9.4%
4 Alpine Bird (New Zealand) Limited 5,224,932 4.6%
5 New Zealand Superannuation Fund Nominees Limited 3,569,865 3.2%
6 Kay Jocelyn Howe 3,222,133 2.9%
7 HSBC Nominees (New Zealand) Limited 2,180,447 1.9%
8 New Zealand Permanent Trustees Limited 1,866,899 1.7%
9 Citibank Nominees (NZ) Ltd 1,395,079 1.2%
10 Bnp Paribas Nominees NZ Limited 1,337,863 1.2%
11 Glenn Laurance Howe & Tony Laurance Howe 1,224,410 1.1%
11 Nicole Tonnile Edgerton & Dean Neil Edgerton & William Desmond Wallis 1,224,410 1.1%
12 Moon Chul Choi & Keum Sook Choi 1,110,000 1.0%
13 FNZ Custodians Limited 1,093,923 1.0%
14 Ja Hong Koo & Pyung Keum Koo 918,500 0.8%
15 Grant Gareth Webster 828,962 0.7%
16 Forsyth Barr Custodians Limited 568,440 0.5%
17 Robert Donald Spary 542,038 0.5%
18 Leveraged Equities Finance Limited 474,866 0.4%
19 JBWERE (NZ) Nominees Limited 450,000 0.4%
20 Investment Custodial Services Limited 410,826 0.4%
73,226,238 64.8%

thl Annual Financial Statements 2015 57
57Statutory Information (continued)For the year ended 30 June 2015
Directors’ Shareholdings
(1) G W Bowker retired as a Director in February 2015. (2) C Domecq appointed as a Director in February 2014. (3) G Troute appointed as a Director in February 2015.
Directors’ Share Dealings
Details of the Directors’ acquisitions and disposals of relevant interests in the ordinary equity securities issued by the Parent company are as follows:
Tutanekai Investments Limited (an entity beneficially associated with R Campbell), acquired 101,202 ordinary shares in the Company over the period 28 October 2014 to 23 March 2015 at an average price of $1.74 per share. In addition, Tutanekai Investments Limited was issued with 42,253 ordinary shares in the Company on 1 October 2014 at $1.42 per share as part of R Campbell’s director remuneration for the six months ended 30 September 2014, and 33,707 ordinary shares in the Company on 1 April 2015 at $1.78 per share as part of his director remuneration for the six months ended 31 March 2015.
Wild Logic Limited (an entity beneficially associated with C Domecq) was issued with 29,929 ordinary shares in the Company on 1 October 2014 at $1.42 per share as part of C Domecq’s director remuneration for the six months ended 30 September 2014 and 18,258 ordinary shares in the Company on 1 April 2015 at $1.78 per share as part of her director remuneration for the six months ended 31 March 2015.
Hauraki Motor Homes Limited (an entity beneficially associated with K Howe) was wound up in March 2015 and the ordinary shares it holds in the Company were distributed in specie to its shareholders proportionate to their shareholdings in Hauraki Motor Homes Limited. Accordingly, K Howe is now the registered holder and beneficial owner of 3,222,133 ordinary shares in the Company.
G Troute was issued with 2,038 ordinary shares in the Company on 1 April 2015 at $1.78 per share as part of her director remuneration for the period ended 31 March 2015.
G Wong was issued with 7,552 ordinary shares in the Company on 1 October 2014 at $1.42 per share as part of his director remuneration for the six months ended 30 September 2014, and 6,040 ordinary shares in the Company on 1 April 2015 at $1.78 per share as part of his director remuneration for the six months ended 31 March 2015.
In addition to the share dealings described above, the following entries were made in the Directors’ interests register during the year:
G Bowker Nil.
R Campbell General notice of interest as a director of NZ Market Limited, Urban Sherpa Limited and G3 Group Limited.
C Domecq General notice of interest as a director of Urban Sherpa Limited.
K Howe General notice of interest as a director of Hauraki Farm Investments Limited.
D Neidhart Nil.
G TrouteNotice of particulars of indemnity and directors’ and officers’ insurance put in place upon appointment and entry into the company’s standard form of Deed of Indemnity and Insurance.
G Wong Nil.
SHARES BENEFICIALLY OWNED, HELD SOLELY OR
AS A JOINT HOLDER
SHARES BENEFICIALLY OWNED, HELD BY ASSOCIATED PERSONS (INCLUDING FAMILY INTERESTS)
2015 2014 2015 2014
At 30 June 2015
G W Bowker1 15,000 15,000 – –
R Campbell – – 498,886 321,724
C Domecq2 – – 48,187 –
K Howe 3,222,133 – 3,222,132 6,444,265
D Neidhart – – – –
G Troute3 2,038 – – –
G Wong 122,837 109,245 – –
3,362,008 124,245 3,769,205 6,765,989

58 thl Annual Financial Statements 2015
58Statutory Information (continued)For the year ended 30 June 2015
General Notice of Directors’ Interest
R Campbell is Chair of Summerset Group Holdings Limited, Localist Limited, Ora HQ Limited, NZ Market Limited, Urban Sherpa Limited, G3 Group Limited, King Tide Asset Management Limited and Tutanekai Investments Limited and is a director of the following companies: Precinct Properties New Zealand Limited, T & G Global Limited, Aotearoa Financial Investments Limited, Foundry Innovations Limited, Foundry Limited, THL Corporate Trustee Limited, FDJ Murrary & Company Holdings Limited, Truescape Limited, Harmoney Corp Limited and Brand Developers Limited.
C Domecq is a director of Foundry Innovations Limited, Foundry Limited, Localist Limited, Ora HQ Limited, International Trading Cartel Limited, MexiKai Limited, NZ Market Limited, Umajin Limited, Urban Sherpa Limited, Wild Logic Limited, and Harmoney Corp Limited.
K Howe is a director of THL Corporate Trustee Limited and Hauraki Farm Investments Limited.
D Neidhart: nil.
G Troute: nil.
G Wong is chairman of Harbour Asset Management Limited and a director of the following companies: Aerograph Limited, Clyde Court Limited, Glaisnock Limited, Henry Wong Limited, Jaguar Nominees Limited, Kaihiku Rural Properties Limited, Mt Acernus Holdings Limited, Paretai Dairy Farm Limited, Precinct Properties New Zealand Limited, Radius Lint Limited, SAL Limited, Silver Earth Nominees Limited, Southern Capital Partners (NZ) Limited, Totara Island Farms Limited and Wong & Company Supermarket Limited.
NZX Waiver
On 26 April 2013 thl obtained a waiver from NZX Regulation (“NZXR”) from NZSX Listing Rule (“Rule”) 7.6.1 (which relates to the acquisition or redemption of equity securities by an Issuer). The waiver relates to thl’s long term incentive scheme for senior executives. thl had previously been granted a waiver for its 2006 long term incentive scheme in July 2009.
NZXR revoked the 2009 waiver and granted thl a new waiver from Rule 7.6.1 to allow thl to redeem:
Any redeemable shares issued for the purposes of the thl 2006 long term incentive scheme or the thl 2009 long term incentive scheme (‘Scheme’), and any further redeemable shares issued for the purposes of the Scheme, which may no longer be required for the purposes of the Scheme because:
• an executive has ceased to be employed by the thl Group before requiring a transfer of those shares; or
• because an executive does not call for a transfer of shares within the time allowed by the Scheme; or
• an executive otherwise surrenders or forfeits any rights under the Scheme, including the right to call for a transfer.
Directors’ Loans
There were no loans by the Group to Directors.
Directors’ Insurance
The Group has arranged insurance cover and provided deeds of indemnity for Directors’ and Officers’ liability.

thl Annual Financial Statements 2015 59
59Statutory Information (continued)For the year ended 30 June 2015
Directors’ Remuneration
Directors’ remuneration received, or due and receivable during the year is as follows:
(1) G W Bowker retired as a Director in February 2015. (2) C Domecq appointed as a Director in February 2014. (3) K R Smith retired as a Director in November 2013. (4) G Troute appointed as a Director in February 2015.
Each of R Campbell, C Domecq, G Wong and G Troute were issued ordinary shares in thl as part of their director remuneration, as described in the section titled “Directors’ share dealings” above.
Employee Remuneration
The number of employees in the Group or former employees (not including Directors) whose remuneration (including severance pay) was within the specified bands is as follows:
Auditors
In accordance with section 196 of the Companies Act 1993, PricewaterhouseCoopers are appointed as the Group’s auditors. Auditors’ remuneration is detailed in note 5 of the financial statements.
2015 2014
DIRECTORS OF TOURISM HOLDINGS LIMITEDDIRECTORS’
FEESOTHER
REMUNERATIONDIRECTORS’
FEESOTHER
REMUNERATION
G W Bowker1 51,067 – 75,600 –
R Campbell 120,000 – 108,583 –
C Domecq2 65,000 – 26,667 –
K Howe 60,000 – 59,000 –
D Neidhart 65,320 – 64,320 –
K R Smith3 – – 31,500 –
G Wong 65,333 – 62,833 –
G Troute4 21,667 – – –
448,387 – 428,503 –
REMUNERATION IN $000’S
NUMBER OF EMPLOYEES
100 – 109 12
110 – 119 8
120 – 129 4
130 – 139 9
140 – 149 9
150 – 159 3
160 – 169 1
170 – 179 3
180 – 189 2
200 – 209 2
210 – 219 1
240 – 249 1
290 – 299 3
300 – 309 1
360 – 369 1
410 – 419 1
470 – 479 1
770 – 779 1
Total 63
60 thl Annual Financial Statements 2015
Rob Campbell (Auckland) Chairman
Independent Director appointed in May 2013. Appointed Chairman of thl in August 2013 and Chair of Market Disclosure Committee in April 2014. Rob has over 30 years experience in investment management and corporate governance. Currently Chair of Summerset Group Holdings Limited (NZ), and a director of Precinct Properties and Turners and Growers. He is a director of substantial private companies based in Australia and New Zealand. In addition he is a director of or advisor to a number of hedge and private equity funds in a number of countries. Rob trained as an economist and has worked in a variety of capital market advisory and governance roles over a long period.
Christina Domecq (Auckland)
Independent Director appointed in February 2014. Appointed Chair of Marketing & Customer Experience Committee in February 2014. Currently the CEO of Ora, winner of the Westpac Supreme Business Excellence Award in 2013. Christina has operated internationally as a technology entrepreneur as well as an investor and a director in a variety of premium New Zealand brands including Harmoney, Stolen Rum, Umajin, Localist, The Market NZ and Urban Sherpa. Starting her first company at the age of 20, Christina has owned and invested in a large variety of companies around the world. Christina has broad skills in strategic assessment, monetising ideas from concept to viable commercial entities and decisively seizing competitive advantage. Christina holds a Bachelor of Arts & Science from Boston College and Master of Finance from Notre Dame University and has won a raft of awards including Ernst & Young UK, ‘Young Entrepreneur of the Year’ and ‘Science and Technology Entrepreneur of the Year’ in 2006 and CNBC Entrepreneur of the Year in 2009.
Kay Howe (Auckland)
Non Independent Director appointed in October 2012. With a background in a variety of industries Kay entered into the tourism market in 1978 starting her first motorhome rental business as a small family operation. An industry pioneer, Kay is experienced in the operational, financial, sales and marketing of a rental motorhome business in New Zealand and has established strong industry relationships in many European markets. Kay founded United Vehicle Rentals in 1994 which was sold to thl on the 31st October, 2012. Kay is a non independent director under the NZX listing rules due to previously being a director of an entity that was a substantial security holder in thl.
David Neidhart (Switzerland)
Non Independent Director appointed in June 2013. David was proposed for appointment by the Sterling Grace funds, an entity that is a substantial security holder in thl. David accumulated more than four years of experience in vehicle rental industry as a Director of Strategy for the International business unit of Hertz. During his professional career, David has operated across a number of international markets across various disciplines and industries. David has managed strategy and M&A for large international companies such as Hertz as well as being active in asset management and private equity industries, Valartis and Bisange. David holds a Master of Finance of the Sciences-po University in Paris and a Diploma from the Geneva University.
Gráinne Troute (Auckland)
Independent Director appointed in February 2015. Appointed Chair of Remuneration & Nomination Committee in February 2015. Gráinne is currently General Manager Corporate Services for SKYCITY Entertainment Group and her portfolio includes Human Resources, Corporate Communications and Corporate Social Responsibility (CSR) including the SKYCITY Community Trusts. Gráinne joined SKYCITY in May 2008. Previously, she was Managing Director of HR consultancy Right Management and, prior to that, Managing Director of McDonald’s Restaurants (New Zealand) Ltd. She joined McDonald’s in the early 1990’s establishing the Human Resources function, progressing through to Executive Vice-President, and then to Managing Director. Prior to this, she led the HR function for Coopers and Lybrand Auckland (now PwC). In addition to her extensive HR expertise, Gráinne has had wide experience in board and charitable trust governance roles in New Zealand including having been Chair of Ronald McDonald House Charities NZ for five years.
Graeme Wong (Wellington)
Independent Director appointed in November 2007. Appointed Chairman of Audit & Risk Committee in February 2015. Background in stock broking, capital markets and investment. Founded and became Executive Chairman of Southern Capital Limited which listed on the NZX and evolved into Hirequip New Zealand Limited. The business was sold to private equity interests in 2006. Previous directorships include New Zealand Farming Systems Uruguay Limited, Sealord Group Limited, Tasman Agriculture Limited, Magnum Corporation Limited, and At Work Insurance; alternate director of Air New Zealand. Currently Chairman of Harbour Asset Management Limited; Director of Areograph Limited, Precinct Properties New Zealand Limited and shareholder and Director of Southern Capital Partners (NZ) Limited. Member of the Trust Board of Samuel Marsden Collegiate School and Member of the Management Board of The Bible Society Development (New Zealand) Incorporated.
60Board of Directors

05 Consolidated Statement of Changes In Equity
08 Reconciliation of Profit after Taxation with Cash Flows from Operating Activities
06Consolidated Statement of Financial Position
09Notes to the Financial Statements
02 Directors’ Statement
03 Consolidated Income Statement
04Consolidated Statement of Comprehensive Income
07Consolidated Statement of Cash Flows
52Independent Auditor’s Report
53Statutory Information
60Board of Directors
01Corporate Information
thl Annual Financial Statements 2015

Tourism Holdings LimitedAnnual Financial Statements for the year ended 30 June 2015
USA AUSTRALIA
NEW ZEALAND
FINANCIALSTATEMENTS UK
thl Annual Financial Statements 2015