financial view: a sustainable business model - roche.com · pdf filesolid margins with a high...
TRANSCRIPT

Financial view:A sustainable business model
Alan Hippe, CFO

Capital allocation and R&D
Continuous productivity improvements
Focus on cash generation and allocation

Solid margins with a high risk / high reward model
3Source: Company reports, Roche analysis; 1 Based on average of fiscal years 2009 - 2011 financials; 2 Based on 2010 data
Core operating profit margin (%)1
Branded pharma sales as % of Group2
Pfizer Astra
Sanofi
Merck
GSK
Novartis
Eli Lilly
Bayer
BMS
Amgen
Abbott
R² = 0.6198
15%
25%
35%
45%
30% 40% 50% 60% 70% 80% 90% 100%

The P&L reflects Roche’s innovation based strategy Low on Marketing, General and Administration
4
33%32%
29%29%
29%29%
28%26%
24%24%
23%18%
Eli LillyNovartis
PfizerBayer
MerckGSK
AstraAbbott
BMSSanofiRoche
Amgen
R&D % sales Core operating profit margin% sales
M&D+G&A % sales
21%20%
19%18%
17%16%
15%14%14%
13%10%
8%
Eli LillyAmgenRoche
BMSMerck
NovartisAstra
SanofiGSK
PfizerAbbottBayer
43%
39%
37%
36%
34%
34%
33%
31%
27%
27%
23%
17%
Pfizer
Astra
Amgen
Roche
Sanofi
Merck
BMS
GSK
Novartis
Eli Lilly
Abbott
Bayer
Source: Company reports, Roche analysis; Figures based on fiscal year 2011 financials

Return on R&D: Historically Roche has delivered
51 Incl. recovery of cost of capital, Roche Pharma. Criteria includes: late stage portfolio, risk adjusted revenues, average profitability
assumed, standard erosion curves
Average # NMEs per year
Required performance to breakeven1, at actual R&D expenses (1996-2005)
Actual Launches 2001-2010
CHF 2.1 bn
1.1
Required peak sales per NME(CHF bn)

R&D productivity: Our plans tell us that we will also be delivering in the future
6
Required peak sales per NME(CHF bn)
Required performance to breakeven1, at actual R&D expenses 2011 onwards
Illustrative
Planned launches 2011-2016
1 Incl. recovery of cost of capital at planning exchange rates, Roche Pharma. Criteria includes: late stage portfolio, risk adjusted revenues, average profitability assumed, standard erosion curves
Average # NMEs per year

Roche: R&D well balanced from a risk & disease point of view
7Source: Bernstein Equity Research, Tufts University and Roche analysis
Industry average probability of success – Phase 0 to Registration
Oncology
Virology
CNS
0% 5% 10% 15% 20% 25% 30%
InflammationMetabolism
2012 Roche budget

R&D spend: Balance between short and long term
8
Research/Discovery
Phase 0 Phase 1 Phase 2 Phase 3 Filing Phase 4
R&D spend by phase
~50% ~50%
Invest for the near term
Invest for the future
Note: Based on 2012 budget

Capital allocation and R&D
Continuous productivity improvements
Focus on cash generation and allocation

Base Increasesuccess rate
Reduce timeto market
"Innovation" Reduce costbase
Innovation+ Efficiency
Productivity improvements: Through Innovation AND continuous Efficiency programs
10Source: Nature Reviews (Eric David, Tony Tramontin and Rodney Zemmel (McKinsey & Co.), Vol. 8, 609, Nature Reviews | Drug Discovery), Roche analysis
Innovation Efficiency
Innovation
Efficiency
Base
Illustrative return

Example: Optimise research at pRED
11
Reduce complexity
Nutley
• Increase investment in late stage
• Leverage support functions
Optimise resource allocation
• Reduce infrastructure costs (support functions / site infrastructure)
• Unify sites for ‘non clinical safety and chemistry’
Re-fine infrastructure
• Close R&D centres (Nutley)
• Co-locate managementTCRC
ShanghaiBasel
Welwyn PenzbergSchlieren
Support CentersStrategic sites
35 3647 42 38
16 18
21 23 238 8
11 11 11
0
20
40
60
80
2009 2010 2011 HY 2012before R&D
prioritisation
HY 2012after R&D
prioritisationPhase I Phase II Phase III + Registration
New Molecular Entities
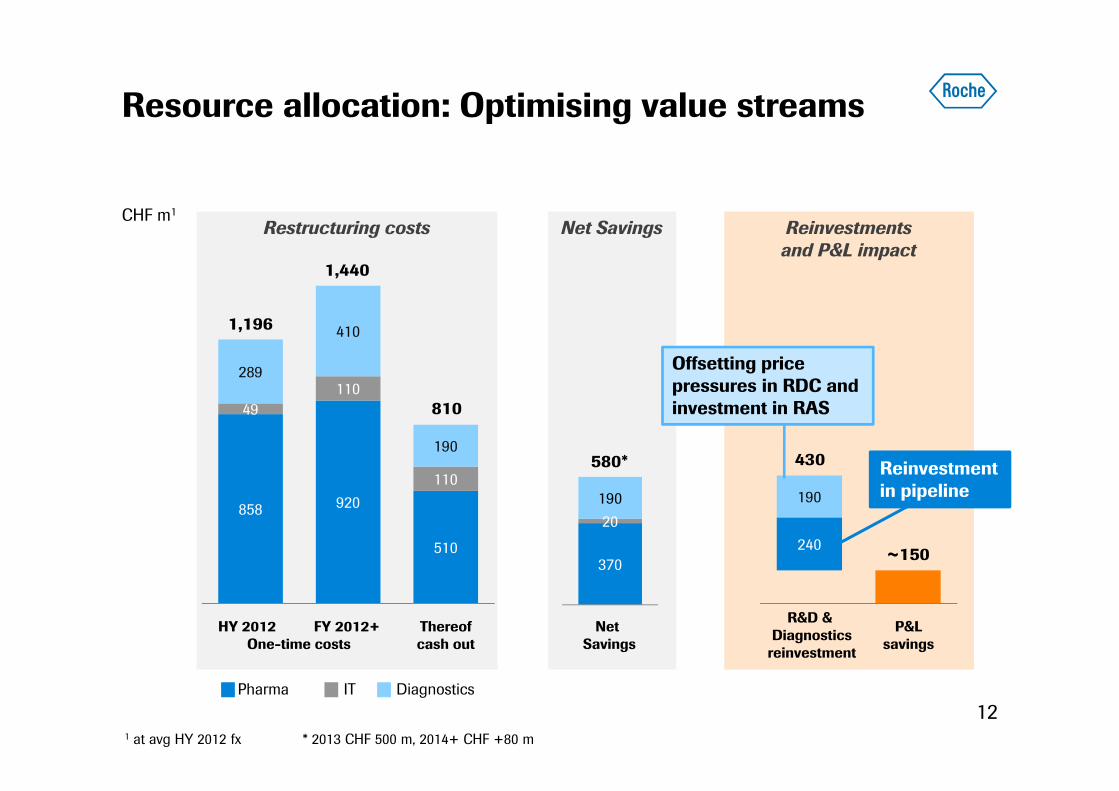
Resource allocation: Optimising value streams
12
Reinvestments and P&L impact
Net SavingsRestructuring costs
858 920
510
49110
110
289
410
190
1,440
810
Thereof cash out
Net Savings
HY 2012 FY 2012+One-time costs
CHF m1
240
190
DiagnosticsPharma IT
R&D & Diagnostics
reinvestment
P&Lsavings
430
~150
1 at avg HY 2012 fx * 2013 CHF 500 m, 2014+ CHF +80 m
370
20190
580*
1,196
Offsetting price pressures in RDC and investment in RAS
Reinvestment in pipeline

Example Development: Productivity initiative in development
13
Roche Genentech Integration
Transactional Outsourcing
Completed efficiency initiatives
-15%
Jan 2010Cost/LIP
2011Cost/LIP
2012Target
Cost/LIP
2015Plan
Ongoing RETHINK D initiativesImprove probability of technical success / reduce risk in trials read outs (ex: use predictive endpoints)
Using modern tools to speed up processes and bring trials closer to patients (ex: collect data directly from patients etc.)
LIP refers to Lifecycle Investment Point

Example: Roche Diabetes Care securing long-term profitability
14
6%4%
2%
2009 2010 2011
Blood GlucoseMonitoring (bGM)
Insulin DeliverySystems
Streamline PortfolioMaximise market uptake
InvestInsulin pumps and CGM
RDC salesGrowth (CER*)
• Restructure and consolidate R&Dorganisation
• "One Global Operations" structure
• Optimise M&D investments
CER=Constant Exchange Rates

Capital allocation and R&D
Continuous productivity improvements
Focus on cash generation and allocation

High operating free cash flow and margin
16
4.81
6.78 6.436.86
7.1721.8%
28.2%26.1%
31.6% 32.0%
HY 2008 HY 2009 HY 2010 HY 2011 HY 2012
Group operating free cash flow (CHF bn) and margin
CER=Constant Exchange Rates
+7% at CER

Managing risks: Accounts receivables in S. Europe
17

Credit Management & Receivables: Managing riskGreece - learning from the past to reduce future risk
18
• Roche experienced strong sales growth trebling in size
• Accounts Receivables (AR) increased too, significantly
• Government had established a pattern of payment every 5 years
AR balance mEUR
• Government issued bonds as payment
• Locally: fast execution to receive bonds ahead of our competitors
• Treasury: anticipated risk and sold into the market
AR balance mEUR AR balance mEUR
History1
• New Credit Policy introduced –Cash on Delivery in Pharma and Dia
• Bonds write down impact 26% however avoided 70% write down experienced by many still holding
Action Impact
1 Situation as of 2010

Credit Management & Receivables: Managing riskSpain – learning from the past to reduce future risk
19
• AR rose significantly with an increase in sales, plus bias of portfolio to hospital sector
• Growing delay of payments from public accounts
• No issues with private accounts
• Escalation of tools used, including
– Individual regional account plans
– Change of commercial policy (CoD)
– Forfaiting (local banks and international funds)
History
• Significant reduction in AR due to “Montoro Plan” (June 2012)
• Focus: avoid future build up
Action Impact
AR balance mEUR AR balance mEURDSO – Public debt

Roche: Favorable risk profile due to sustainable cash flows leading to lower interest expenses
20
0
100
200
300
400
500
600
700
2006 2007 2008 2009 2010 2011 2012
RocheDeutsche BankBNPCitiJPMCredit SuisseUBS
5 year Credit Default Swap (CDS)

Aiming for a sustainable net debt leverage of 0-15%
21
302520151050
Roche
35
S&P rating
Leverage1 (%)
-15 -10 -5-35 -30 -25 -20
TakedaSanofi
Biogen
AZ
Merck
BMSBecton D
NovartisEli Lilly
Pfizer
BayerGilead
Amgen
Abbott
GSK
1 Net Debt / Total Assets (%); 2011 figures for all companies except Roche; Company reports; Bloomberg (June 14; 2012)
2010 (31%)
2011 (25%)
J&J
AA+
AA
AAA
AA-
A+
A
A-
BBB+
BBB
BBB-
BB+

Continuous increase in dividends and pay-out ratio historically
22
0.18 0.20 0.28 0.37 0.48 0.55 0.64 0.75 0.83 0.87 1.00 1.15 1.30 1.451.65
2.00
2.50
3.40
4.605.00
6.00
6.606.80
0%
1%
2%
3%
4%
5%
6%
0
2
4
6
8
'89 '90 '91 '92 '93 '94 '95 '96 '97 '98 '99 '00 '01 '02 '03 '04 '05 '06 '07 '08 '09 '10 '11
Pay-out ratio calculated as dividend per share divided by core earnings per share (diluted)
Dividend per share (CHF)
2011Payout ratio
of 55.3%
Dividend yield (%)

Cash
ProfitabilitySalesgrowth
We will continue to show strong commitment to Innovation AND Efficiency
23
Value
Innovation Efficiency