financial year 2018 first half investor update - avation · lse: avap 26 february 2018 jeff...
TRANSCRIPT
LSE: AVAP
26 February 2018
Jeff ChatfieldExecutive Chairman
Robert HeeseChief Financial Officer
Richard WolanskiFinance Director
Presented by:
Iain CawteTreasury & Risk
Duncan ScottGeneral Counsel
Financial Year 2018 – First Half Investor Update
Important Notice
2
Some of the statements in this presentation constitute “forward-looking statements” that do not directly or
exclusively relate to historical facts. These forward-looking statements reflect the Company’s current intentions,
plans, expectations, assumptions and beliefs about future events and are subject to risks, uncertainties and other
factors, many of which are outside the Company’s control. Important factors that could cause actual results to
differ materially from the expectations expressed or implied in the forward-looking statements include known and
unknown risks. Because actual results could differ materially from the Company’s current intentions, plans,
expectations, assumptions and beliefs about the future, you are urged to view all forward-looking statements
contained in this presentation with caution.
Neither the issue of this Presentation nor any part of its contents is to be taken as any form of commitment on the
part of the Company to undertake or proceed with any transaction. In no circumstances will the Company be
responsible for any costs, losses or expenses incurred in connection with any appraisal or investigation of the
Company. No reliance may be placed for any purpose whatsoever on the information or opinions contained in or
given during this Presentation. The information and opinions contained in or given during this Presentation are
provided as at the date hereof, are not necessarily complete and are subject to change without notice. No
representation, warranty or undertaking is given by or on behalf of the Company or its directors, officers,
shareholders, employees, agents and advisors as to the accuracy, completeness or reasonableness of the
information or opinions contained in or given during this Presentation and no liability is accepted or incurred by
any of them for or in respect of any such information or opinions, provided that nothing in this paragraph shall
exclude liability for any representation or warranty made fraudulently.
3
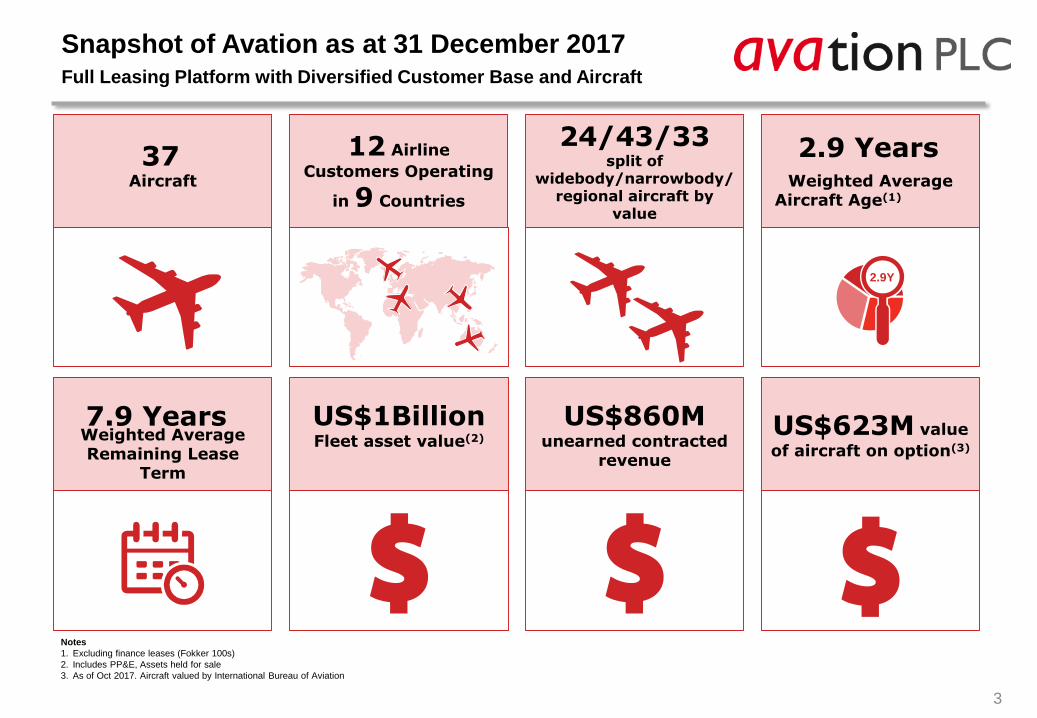
Snapshot of Avation as at 31 December 2017Full Leasing Platform with Diversified Customer Base and Aircraft
Notes
1. Excluding finance leases (Fokker 100s)
2. Includes PP&E, Assets held for sale
3. As of Oct 2017. Aircraft valued by International Bureau of Aviation
Aircraft Weighted Average Aircraft Age(1)
2.9Y
12 Airline
Customers Operating
in 9 Countries
Weighted Average Remaining Lease
Term
37 2.9 Years
7.9 Years US$1BillionFleet asset value(2)
US$860Munearned contracted
revenue
24/43/33split of
widebody/narrowbody/regional aircraft by
value
US$623M value
of aircraft on option(3)

Financial Year 2018 – First Half Summary
4
Lease Revenue
US$41.7 million
(8%) YoY
Earnings per Share
US 10.9 cents
(15%) YoY
Total Profit after Tax
US$6.7 million
(8%) YoY
Fleet Assets(1)
US$1,008 million
+35% since FY2017
Average Cost of Debt(2)
4.8%
FY 2017 : 5.1%
Operating Profit (EBIT)
US$25.1 million
(9%) YoY
Revenue
US$52.4 million
+16% YoY
1. PP&E plus Assets held for sale2. Weighted average as at 31 December 2017
Average Cost of Secured Debt(2)
4.3%
FY 2017 : 4.5%
Operational Highlights
5
Growth, Fleet Diversification and Renewal
• Record growth with four aircraft added in Dec 17 (>US$286 million)
• Annualized lease rental run rate >US$115 million
• Airbus A320 transitioned from Air Berlin to easyJet in Dec 17
• First twin aisle aircraft delivered into the fleet
• Four airline customers added
Funding
• GMTN tap of US$30 million unsecured debt issued priced at 100.83
Corporate
• Approval at AGM of share buyback
Aircraft Leasing Business Objectives
6
Strong Fleet
Metrics
Scale & Growth
Diversify revenue
IncreaseProfit
ControlCosts
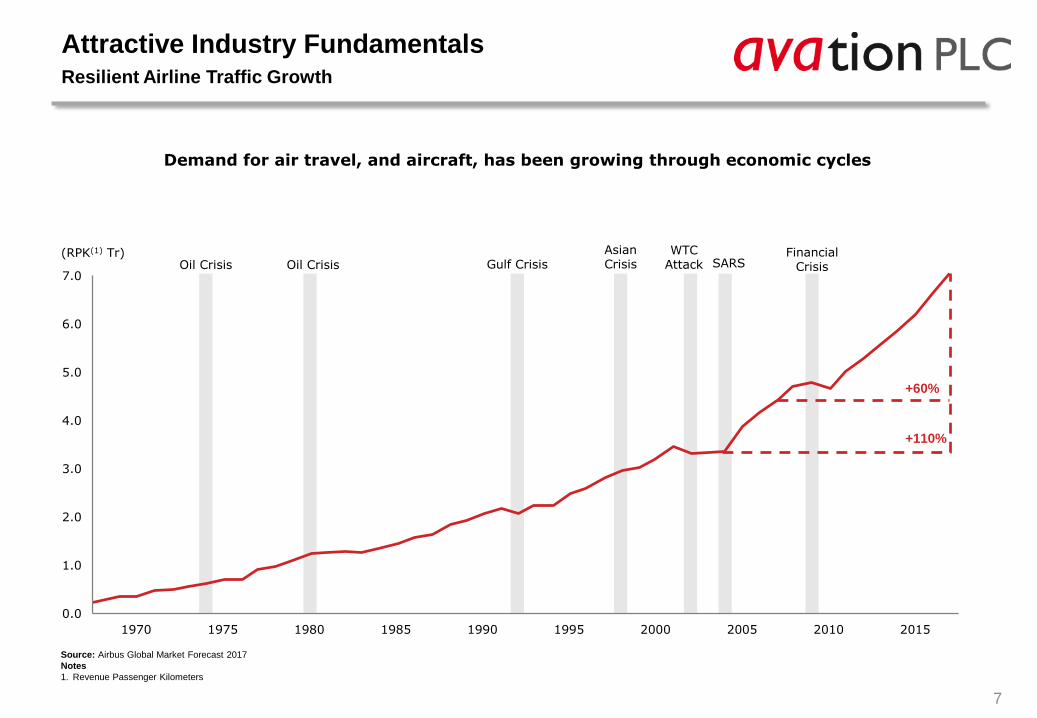
Demand for air travel, and aircraft, has been growing through economic cycles
Attractive Industry Fundamentals Resilient Airline Traffic Growth
7
(RPK(1) Tr)Oil Crisis Oil Crisis Gulf Crisis
AsianCrisis
Financial Crisis
WTC Attack SARS
+60%
+110%
0.0
1.0
2.0
3.0
4.0
5.0
6.0
7.0
1970 1975 1980 1985 1990 1995 2000 2005 2010 2015
Source: Airbus Global Market Forecast 2017
Notes
1. Revenue Passenger Kilometers

Aircraft Type Fleet Orders Options
Regional Aircraft
ATR 72-600 13 6 30
ATR 72-500 6 - -
Narrowbody Aircraft
A321-200 8 - -
A320-200 3 - -
Fokker 100 5 - -
Widebody Aircraft
A330-300 1 - -
B777-300ER 1 - -
Total 37 6 30
8
Attractive Fleet Portfolio as at 31 December 2017Balanced Portfolio of Young Aircraft
Balanced Fleet with Orderbook and Options to Retain Expansion Flexibility
9
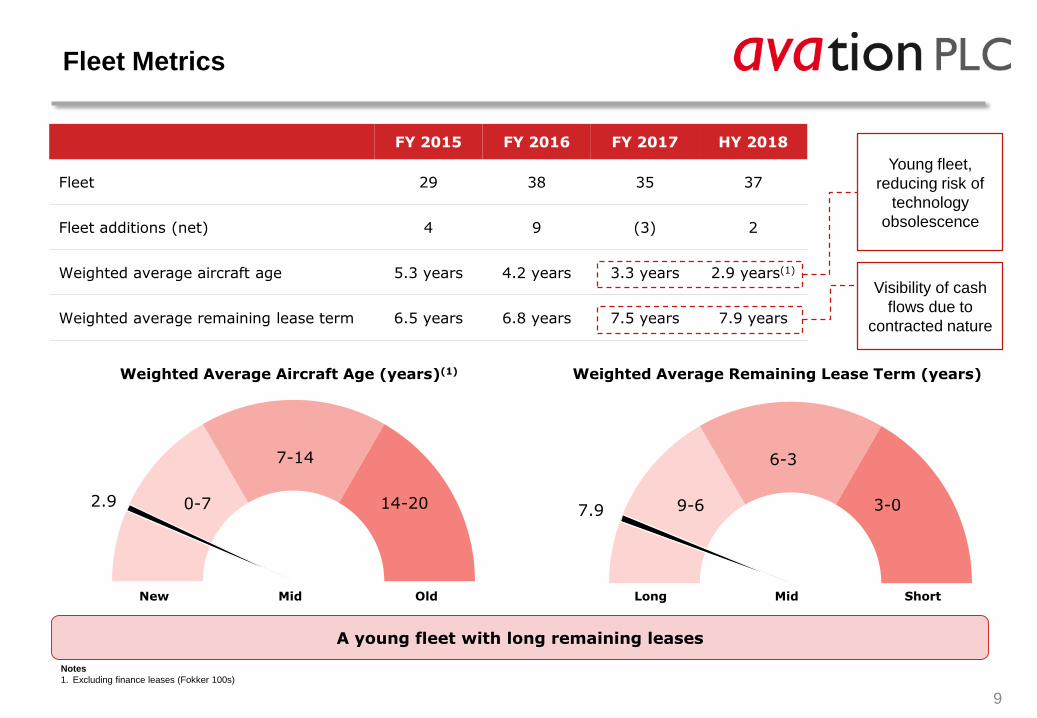
Fleet Metrics
FY 2015 FY 2016 FY 2017 HY 2018
Fleet 29 38 35 37
Fleet additions (net) 4 9 (3) 2
Weighted average aircraft age 5.3 years 4.2 years 3.3 years 2.9 years(1)
Weighted average remaining lease term 6.5 years 6.8 years 7.5 years 7.9 years
Young fleet,
reducing risk of
technology
obsolescence
Visibility of cash
flows due to
contracted nature
Notes
1. Excluding finance leases (Fokker 100s)
14-200-7
7-14
2.9
Weighted Average Aircraft Age (years)(1)
3-09-6
6-3
7.9
Weighted Average Remaining Lease Term (years)
New Mid Old Long Mid Short
A young fleet with long remaining leases
10
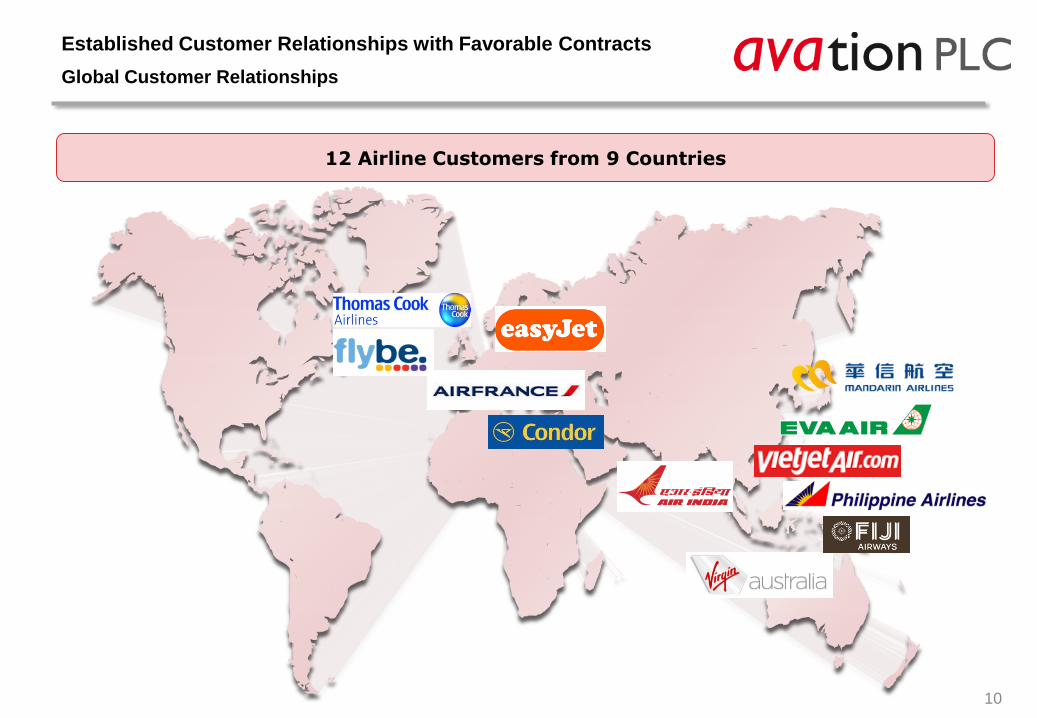
Established Customer Relationships with Favorable Contracts
Global Customer Relationships
12 Airline Customers from 9 Countries

Virgin Australia26%
VietJet21%
PAL13%
EVA10%
Thomas Cook8%
Flybe4%
Air India Regional 4%
Mandarin4%
Air France3%
Condor3%
EasyJet2%
Air Pacific2%
Increasing Customer Diversification
11
Established Customer Relationships with Favorable Contracts (Cont’d)
…with Increasing Scale & Customer Diversification
By Revenue
Virgin Australia67%
Thomas Cook13%
Condor6%
UNI Airways5%
Air India Regional4%
Fiji Airways4% Quick Duck
2%
FY 2015 –Revenue US$ 56.9 million(1)
Top 1 Customer Share – 67%Top 3 Customers Share – 86%
Notes
1. FY ending 30 Jun, excluding income from finance leases which is not accounted for under revenue but including contingent rents
2. Annualized lease rental collection of 31 December 2017 fleet
31 December 2017 Annualised Revenue Run Rate US$ 115.0 million(2)
Top 1 Customer Share – 26%Top 3 Customers Share – 60%

Fleet Growth
12
0
200
400
600
800
1,000
1,200
2011 2012 2013 2014 2015 2016 2017 HY2018
Fleet assets (US$m)

Profit & Loss Summary
13
Profit & Loss Summary (US$ million) HY2018 HY2017 Growth
Total revenue and Other income 52.6 45.6 16%
Depreciation expense (14.6) (15.9) (9%)
Gains on sale (net of impairment) (8.0) 2.0
Administrative expense (4.9) (3.9) 25%
Operating Profit/EBIT 25.1 27.6 (9%)
Finance expenses (18.6) (19.7) (6%)
Finance income 0.7 0.5 52%
Profit before tax 7.3 8.4 (13%)
Tax (0.5) (1.0) (48%)
Total profit after tax 6.7 7.4 (8%)
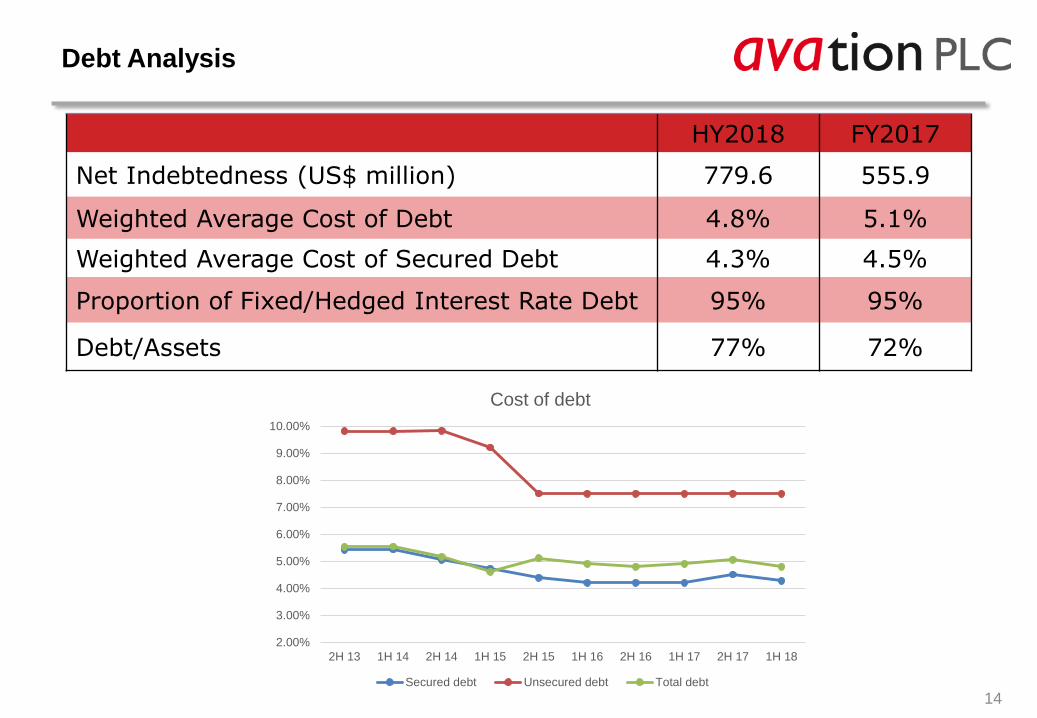
Debt Analysis
14
HY2018 FY2017
Net Indebtedness (US$ million) 779.6 555.9
Weighted Average Cost of Debt 4.8% 5.1%
Weighted Average Cost of Secured Debt 4.3% 4.5%
Proportion of Fixed/Hedged Interest Rate Debt 95% 95%
Debt/Assets 77% 72%
2.00%
3.00%
4.00%
5.00%
6.00%
7.00%
8.00%
9.00%
10.00%
2H 13 1H 14 2H 14 1H 15 2H 15 1H 16 2H 16 1H 17 2H 17 1H 18
Cost of debt
Secured debt Unsecured debt Total debt

Key Ratios
15
Comparative Ratios HY2018 FY2017
Book Value per Share (A) $3.32 $3.21
Administrative Expense/Total Revenue 9.3% 8.4%
Credit Ratios
Net Leverage (B) 3.6 3.0
Operating Cashflow/Debt 7.5% 9.8%
EBITDA/Interest Expense 2.2 2.5
A. BV/Share = Net Equity/Shares on Issue
B. Average Net Leverage = Average Net debt/ Average Equity
16
Avation Summary
Attractive Industry Dynamics
Record Fleet Growth
Leading Fleet Metrics
Increased Airline and Aircraft Diversification
Targeting Lower Cost of Debt
Opportunity for Further Growth
17
Avation PLC65 Kampong Bahru Road
Singapore 169370
Phone: + 65 6252 2077
www.avation.net
Jeff ChatfieldExecutive Chairman
Richard WolanskiFinance Director
Robert HeeseChief Financial Officer
Iain CawteTreasury & Risk
Question & Answer Section
Duncan ScottGroup General Counsel