financing and delivery of social service in indonesia · “financing and delivery of social...
TRANSCRIPT

LondonOctober 2012
Izuru KIMURA & RINGORINGO AchmadiJapan International Cooperation Agency (JICA) &
LPEM - University of Indonesia
“Financing and Delivery of Social Service in Indonesia”
Status of Study
11
<Not for Quote, for Discussion Only>

ContentsI. Background: Overview of Policy Agenda
(Summary of Previous Presentation in Feb. 2012)1. Decentralization2. Social Service Delivery3. Issues & Points to be Analyzed4. Time to Draw Grand-Design
II. Outline of the Study1. Objectives and Scope of Studies2. Implementing Structure3. Schedule4. Methodology (Hypothetical)5. Indicators to be collected
III. Preliminary Result of Data Collection1. Fiscal and Social Indicators in Yogyakarta and S outh Sulawesi2. Active National Social Protection Program3. Social Service Provision
IV. Way Forward1. Points to be analyzed2. Expected Policy Implications
22

- Drastic decentralization started in 2001:one of outcomes produced by the regime change from Soeharto era
- “Successful,” from the political perspective:recent stability of the political scene and steady growth
I. Background: Overview of Policy Agenda
1. Decentralization: History & Legal BasisSub-National Governments (SNGs) becomesKey Players since 2001
33

44
Law no. 22/1999 Law no. 32/2004
-gives the province authority over inter-regency/municipality areas of responsibilities
-province to manage functions that the local governments are not able to conduct
-management of functions delegated to the province as administrative region
-management of 11 mandatory affairs at provincial scale-management of optional affairs corresponding to local
conditions
(a) Provincial Authorities
(b) Fiscal EqualizationLaw no. 25/1999 Law no. 33/2004
-governs sharing of revenues between national. Provincial, and local governments
-adds stipulations on income tax revenue sharing-accommodates slight changes in sharing of revenues. The
province gets about 16% and regencies/cities get about 64% of all revenue sharing including property tax, except for the various mining revenues which are predominantly for the national government
GR no. 25/2000 GR no. 38/2007
-the GR refers to Law no. 22/1999: provincial government manages cross regional affairs that are not performed by local governments and delegated administrative affairs of the nationalgovernment
-the provincial government is responsible for 108 functions in 20sectors (compared to 202 functions of the central government in 25 sectors)
-the provincial government is also responsible for other functions: those that cannot be accomplished by a regency/city
-the GR defines 31 shared areas of responsibilities to be co-managed by the national provincial and regency/city governments. Each sector to be regulated by the relevant ministry.
-the GR determines mandatory affairs and optional of affairs (optional affairs are those most relevant to local economic and political characteristics.)
- the GR specifies the possibility of the province to take over or return affairs to local governments
(c) Provincial Authorities & Distribution
Source: UNDP (2009)
1. Decentralization: History & Legal BasisI. Background: Overview of Policy Agenda

55
Government Expenditure Patterns
Source: World Bank 2010
1. Decentralization(2) Fiscal Flow & Capacity of Sub-National Governme nt
I. Background: Overview of Policy Agenda

66
Indicators of Non Income Poverty by Province in 200 9 (%)
Source: JICA (based on SUSENAS Panel data 2007-2009)
Indicator
Province
Less than Primary School (Head of
Household)
Illiterate (Head of Household)
None or Shared Toilet
Low Quality of Drinking Water
Source
No Electricity
Aceh 21.34 6.62 44.13 32.95 9.98
Sulawesi Selatan 29.45 17.43 36.09 26.39 6.89
Papua 16.76 26.17 52.04 74.64 54.99
Yogyakarta 17.48 11.82 29.96 19.11 0.93
Jakarta 9.35 1.63 23.80 0.27 0.07
Nation Average 25.21 8.63 37.61 11.67 9.03
2. Social Service Delivery- Disparity by Region is Observed
I. Background: Overview of Policy Agenda

77
Profile of Four Tiers of Local Government
Tier Type of Local Government Number of Units(*) Population Range
1st Provincial 30 777,500 – 35,500,610
2nd Districts and Municipals 348 23,650 – 4,147,000
3rd Kecamatan 4,038 1,394 – 892,540
4th Village / Lehurahan / Desa 68,783 38 – 436,483
Source: Central Statistics Agency, Indonesia
3. Issues & Points to be Analyzed
(1) Decentralization Still in Transition Period (Bambang Brodjonegoro, 2009)- Local Politics: cause delay in local budget ratification- Slow Local budget absorption: not spent optimally for improving local public services- Low Participation and Influence of local people during planning and budgeting process- Necessity of Reform: Intergovernmental Transfer & Local Taxing- Variety in SNGs
(2) Capacity of SNGs matters. Disparity in Social Service Delivery.Analyze correlation between SNGs Capacity and Social Indicators
(*) The number is in 2004.The number of Province is 33, and District/Municipality is 524 in 2011.
I. Background: Overview of Policy Agenda

4157
4092
4102
3743
3018
2062
1218
860
0 1000 2000 3000 4000 5000
0-9
10-19
20-29
30-39
40-49
50-59
60-69
70-
(Age)
(
35% of total population is U-20!
88Source: UN World population prospects 2010
Under Age 20: 35% of Total Population in 2010Under Age 30: 53% of Total Population in 2010
(10 thousand)
2. Time to Draw Grand-Design(1) Meet Policy Measures: Universal Coverage of Hea lth Insurance
- Social Security Providers Bill (BPJS) approved by the Parliament on October 28, 2011.- GOI is moving forward to universal coverage of the health insurance by 2014.
(2) Comprehensive Policy Design well before enterin g into “Aging Society”, while enjoying “Population Bonus”
<Population Structure>
I. Background: Overview of Policy Agenda
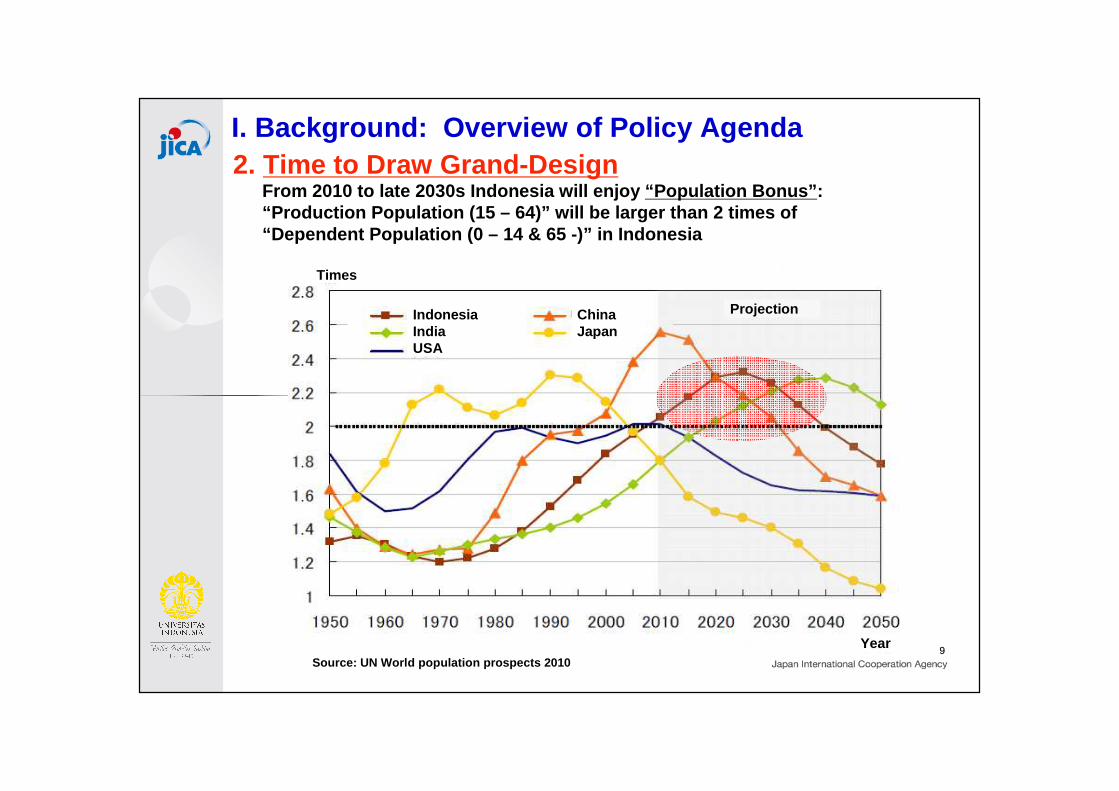
99Source: UN World population prospects 2010
From 2010 to late 2030s Indonesia will enjoy “Population Bonus” :“Production Population (15 – 64)” will be larger than 2 times of“Dependent Population (0 – 14 & 65 -)” in Indonesia
IndonesiaIndiaUSA
ChinaJapan
Projection
Year
Times
2. Time to Draw Grand-DesignI. Background: Overview of Policy Agenda
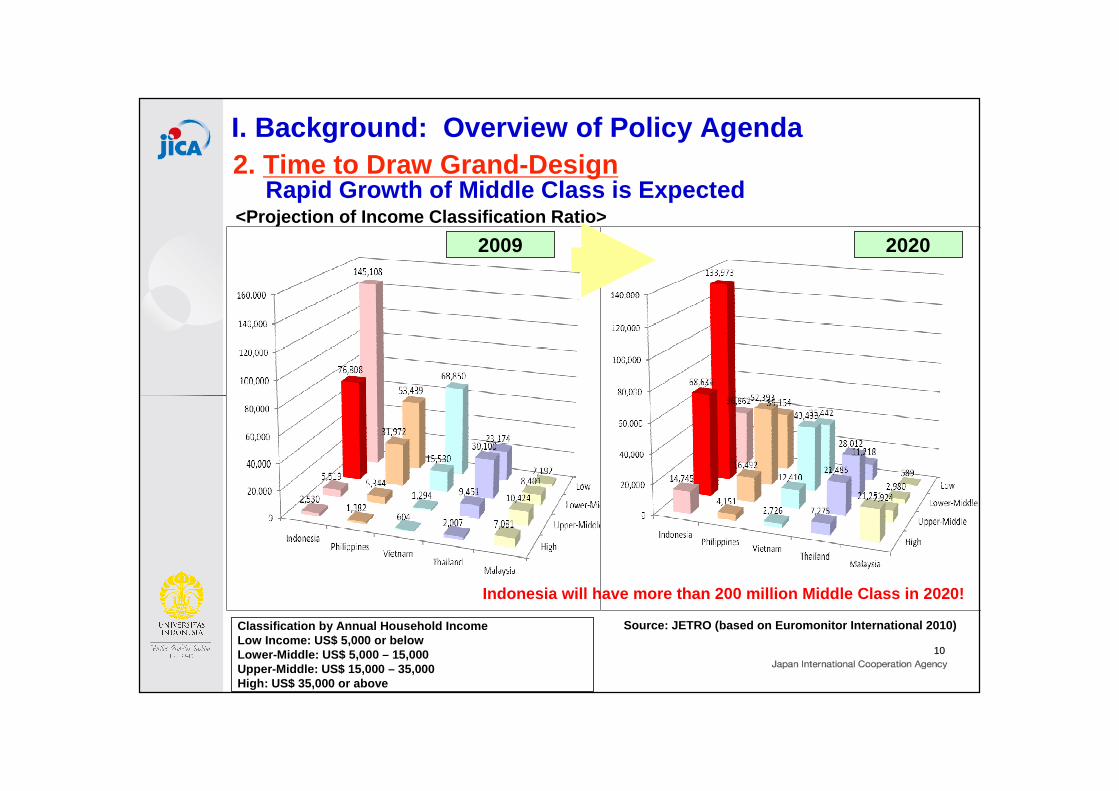
<Projection of Income Classification Ratio>
1010
Rapid Growth of Middle Class is Expected
Source: JETRO (based on Euromonitor International 20 10)Classification by Annual Household IncomeLow Income: US$ 5,000 or belowLower-Middle: US$ 5,000 – 15,000Upper-Middle: US$ 15,000 – 35,000High: US$ 35,000 or above
2009 2020
Indonesia will have more than 200 million Middle Cl ass in 2020!
2. Time to Draw Grand-DesignI. Background: Overview of Policy Agenda

1. Objectives and Scope of studies
(1) Objectives� To provide policy implications on
� Optimal government system of subsidization for Sub-National Governments (“SNGs”) under decentralization;
� Capacity development of SNGs’ administration of social security programs; and
� Social security system� To identify suggestions for JICA’s future cooperation in these areas
(2) Scope� Study on SNGs Fiscal Capacity� Study on Current Situation of the Social Security Programs in Indonesia� Correlation analysis on several aspects related to the SNGs capacity in
implementing the social security programs
1111
II. Outline of the Study

JICA Indonesia Office
Target Sub-National Governmentsin Indonesia
JICA Tokyo HQ
Central Governmentof Indonesia
(focal: FPO-MOF)
Research Institute
Development Partner 2
Development Partner 1
LocalResearch Institute
<Advisory Committee>
<Study Team>
II. Outline of the Study
2. Implementing Structure
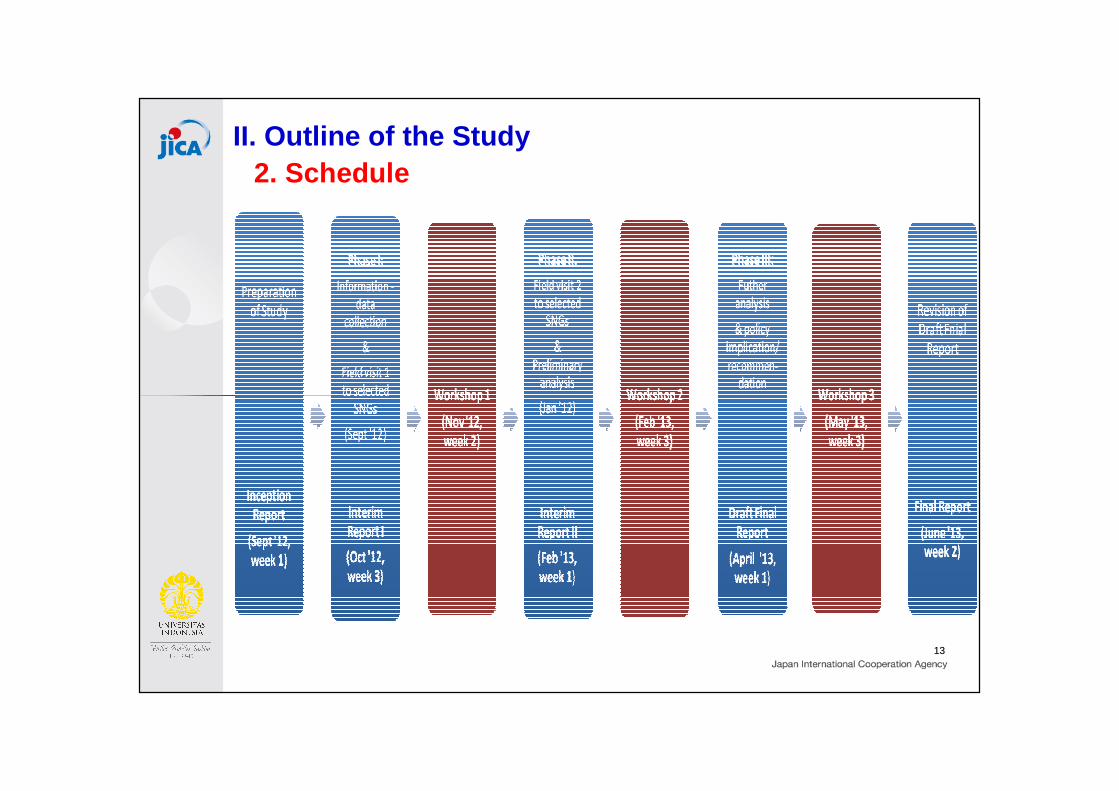
2. Schedule
1313
II. Outline of the Study

3. Schedule
1414
3 4 1 2 3 4 1 2 3 4 1 2 3 4 1 2 3 4 1 2 3 4 1 2 3 4 1 2 3 4 1 2 3 4 1 2 3 4 1 2
I Preparation of the study
Des ign s tudy pl an, methods, format of reports
Submit Inception Report
II Phase I: Data Collection & Field Visit 1
Li terature revi ews & secondary data col lection
Des ign s urvey i ns truments (semi -s tructured questionnai re)
Preparation of fiel d survey 1
Fi el d s urvey 1: da ta col l ecti on to sel ected SNGs
Develop Interim Report 1
Submit Interim Report 1 & Presentation doc. For Workshop 1
Preparation of Workshop 1 in Jakarta
Workshop 1 in Jakarta
III Phase II: Field Visit 2 & Data Analysis
Des ing s urvey i ns truments (intervi ews guidel i nes )
Preparation of fiel d survey 2
Fi el d s urvey 2: col l ect focused i nformati on to s elected SNGs
Develop Interim Report II : a nal ys i s bas ed on fie ld vi s i t 1 and 2
Submit Interim Report II & Presentation doc. for Workshop 2
Preparation of Workshop 2 in Jakarta
Workshop 2 in Jakarta
IV Phase III: Data Analysis & Policy Recommendation
FGDs for formul ati on pol i cy recommendati on
Develop Dra ft Study Report: futher data anal ys is
Submit Draft Study Report & Photo Documentation
Compil e reference materi a l s & preparing pres entation workshop 3
Submit Presentation doc for Workshop 3 & collected references
Preparation of Workshop 3 in Jakarta
Workshop 3 (Final) in Jakarta
Revis ion of Draft Study Report
V Submit Final Study Report
Idul Fitri 2012 & Christmas-New Year 2013 (public holidays)
June
2013
No Activities
MayAug September October November December January
2012
February March April
II. Outline of the Study
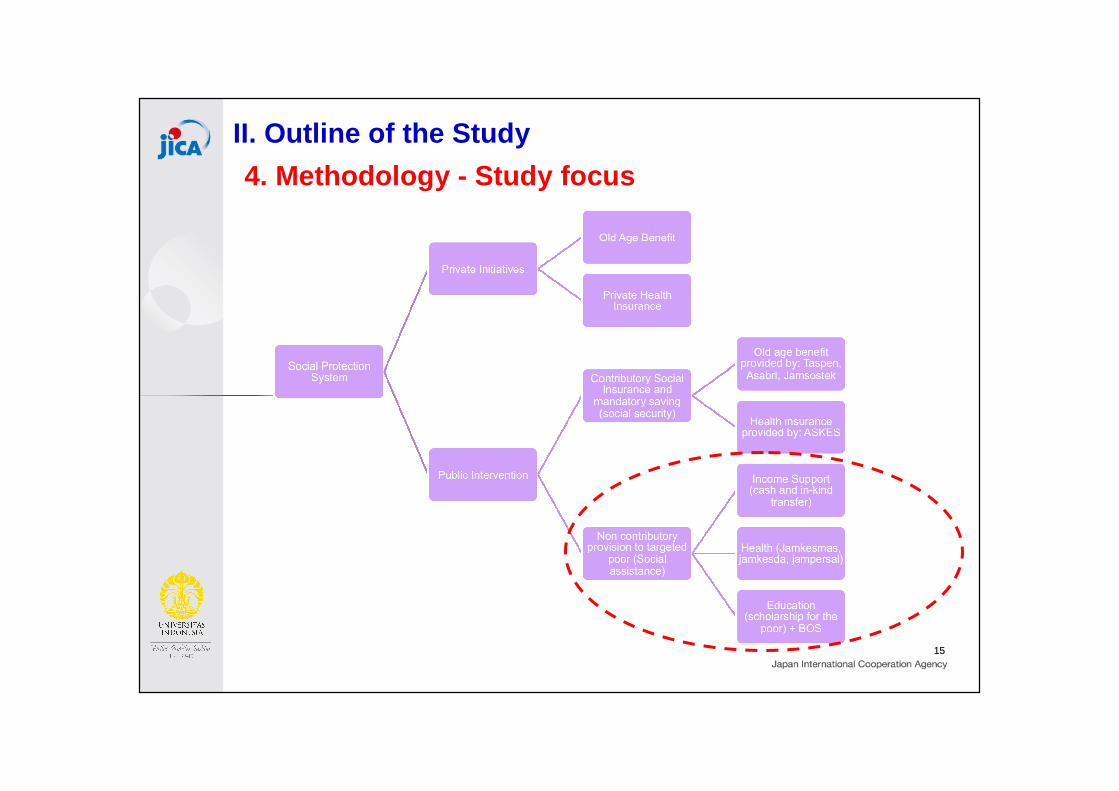
4. Methodology - Study focus
1515
II. Outline of the Study

4. Methodology(1) Data Collection
- A combination of national and local level data will be employed- In-depth interview with national policy makers related to program
interventions chosen to be analyzed- Field visits will be conducted twice to answer the issues related to the SNGs
capacity in implementing the social security programs� 1st Visit: To collect data (quantitative and qualitative – including
regulations, technical manual of programs etc.) to capture individual district variations on local social service intervention
� 2nd Visit: To conduct in-depth interviews with local policy maker on issues raised as a result of data analysis from the first visit
(2) Data Analysis- Correlation will be examined among several indicators
(3) Policy Dialogue and Dissemination- A series of workshops will be held to present the results and collecting
feedback for policy recommendation1616
II. Outline of the Study

4. Methodology – Target Provinces/DistrictsProvinces/Districts
No Provinces Districts
1 South Sulawesi Bone
Takalar
Selayar
2 South East Sulawesi
Wakatobi
TBD
3 Yogyakarta Sleman
Bantul
Kulonprogo
Date of Field Visits
� 1st Field Visit� South Sulawesi and Yogyakarta:
October 1-6, 2012� South East Sulawesi: TBD
� 2nd Field Visit� All three provinces: January 2013
1717
II. Outline of the Study

5. Indicators collected: Health� Central budget allocated for Jamkesmas� Central budget realization for Jamkesmas� Number of beneficiaries of Jamkesmas� Local budget for supporting Jamkesmas� Realization of local budget for supporting Jamkesmas� Number of hospitals and health facilities for Jamkesmas� Third class hospital bed occupancy rate� Number of visits at hospitals� Number of visits at Community Health Center� Infant mortality rate� Child mortality rate� Maternal mortality rate� Proportion of childbirth with official medical treatment� Number of married women of age 15-49 with contraceptives
1818
II. Outline of the Study

5. Indicators collected:Conditional Cash Transfer (CCT) - PKH
� Amount cash received� Number of household beneficiaries� School enrollment ratio (net + gross) for primary school and junior
secondary school� Drop-out rate for primary school and junior secondary school� Number of visits of pregnant women to health facilities ( min four times
during pregnancies and supplied with Fe tablet)� Number of childbirth with official medical treatment� Number of children of age 0-11 month with complete immunization� Number of children of age 12-59 month with additional immunization� Number of children of age 5-6 years attending early childhood education
1919
II. Outline of the Study
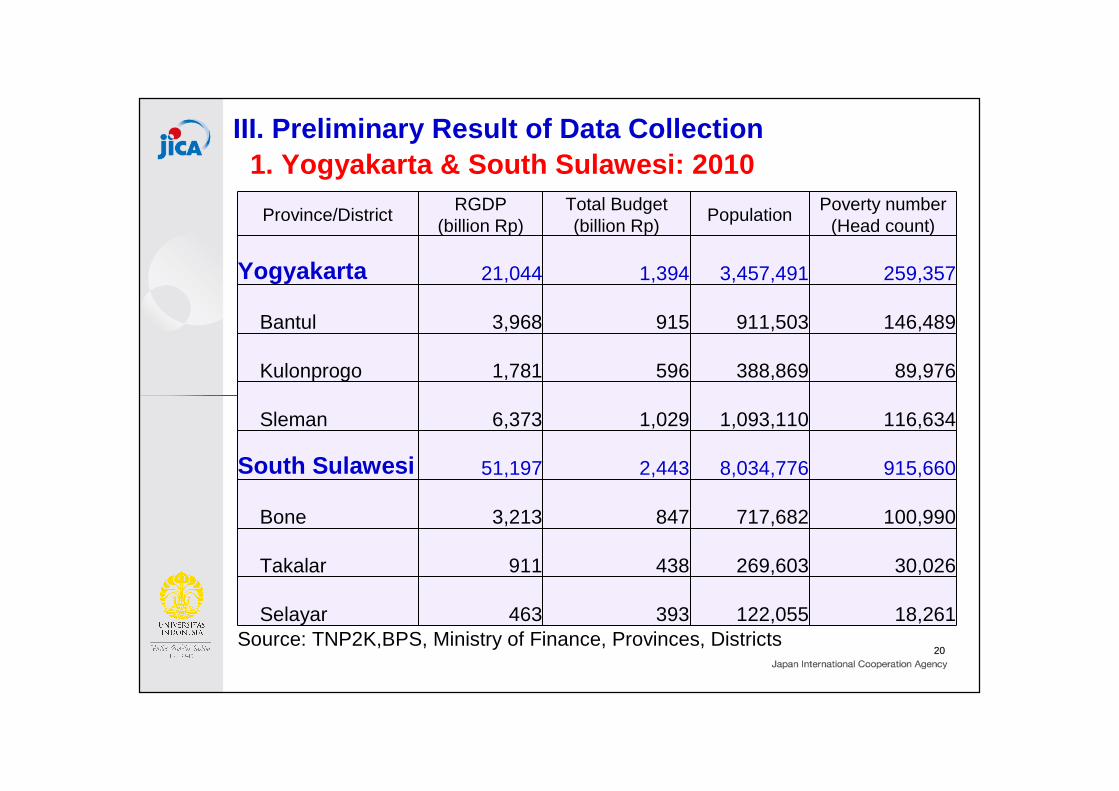
1. Yogyakarta & South Sulawesi: 2010
2020
Province/DistrictRGDP
(billion Rp)Total Budget (billion Rp)
PopulationPoverty number
(Head count)
Yogyakarta 21,044 1,394 3,457,491 259,357
Bantul 3,968 915 911,503 146,489
Kulonprogo 1,781 596 388,869 89,976
Sleman 6,373 1,029 1,093,110 116,634
South Sulawesi 51,197 2,443 8,034,776 915,660
Bone 3,213 847 717,682 100,990
Takalar 911 438 269,603 30,026
Selayar 463 393 122,055 18,261 Source: TNP2K,BPS, Ministry of Finance, Provinces, Districts
III. Preliminary Result of Data Collection

1. Yogyakarta and South SulawesiBudget realization: Actual vs. Budget
2121
III. Preliminary Result of Data Collection

2. Active National Social Protection Program up to 2012
2222
Name Transfer Type Risk Covered Target group Target number of beneficiaries
Population Coverage
Benefit level (average)
Key executing agency
1. BLT* Cash Acute consumptiondifficulty
Poor & near-poor households
18.5mn households (HH)
National Rp 100,000 per month for 9 months
Kemensos
2. Raskin Subsidized Rice
Consumptiondifficulty
Poor & near-poor households
17.5mn HH National 15 kg rice per months
Bureau of Logistics (Bulog)
3. Jamkesmas Health service fees waived
Health shocks; low health utilization
Poor & near-poor households
18.2mn HH National Varies depending on utilization
Kemenkes
4. BSM** Cash & Conditions
Cost of education; low education
Student from poor households
4.6mn students National, but not full scale
Rp 561,759 per year Kemdikbud & Kemenag
5. PKH Cash & Conditions
Low incomes; low health & education utilization
Very poor households
1,516,000 HH National Average: Rp1,390,000; varies between RP600,000 - Rp2,200,000
Kemensos
6. PKSA Cash & Conditions, & services
Quality of life; low education; exclusion
Vulnerable children
160,885 National, but not full scale
Rp1,095,000 per year/child
Kemensos
7. JSPACA Cash & Services
Quality of life; exclusion
Severely disabled
22,000 National, but not full scale
Rp 3,600,000 per year/person
Kemensos
8. JSLU Cash & Services
Quality of life; exclusion
Vulnerable elderly
26,500 National, but not full scale
Rp3,600,000/year/person
Kemensos
Sources and Notes: Updated to 2012 from 2010 data (Worlbank 2012) Program manuals, regulations. *During last usage in 2008-09. ** Target number. A household is a house with one kitchen, disregard how many families live inside, a common situation in poor households.
III. Preliminary Result of Data Collection

3. Social Service Provision: Yogyakarta
(1) Jamkesos:Provide health related additional fund in addition of Jamkesmas for up to 15 million/capita/Year
� Similar program initiated in two out of three districts visited varies from Rp5 million to 15 million
(2) BOSDA: Additional fund to 20% of poorest students in addition of BOS for Senior secondary school student
� No similar program at district level found
Provide additional fund for small school (Primary and Junior Secondary school) at the same BOS level with 20 student per class as standard
� No similar intervention at district level found
2323
III. Preliminary Result of Data Collection

3. Social Service Provision (summary): Yogyakarta
2424
NameTransfer
Type Risk Covered Target group Target number
of beneficiariesPopulation Coverage
Benefi t level (average)
Key executing agency
1. Jamkesos Health service fees waived
Health shocks; low health utilization
Poor & near-poor households
320,000Provincial Varies depending on utilization with maximum amount Rp 15 million per person/year
BapelJamkesos
Health service fees waived
Health shocks; low health utilization
Poor & near-poor households (prov budget and district budget at 50% participation each)
250,000Provincial Varies depending on utilization with maximum amount Rp 15 million per person/year
Bapel Jamkesos
Health service fees waived
Health shocks; low health utilization
All citizens of Yogyakarta by personal premium payment
50,000Provincial Varies depending on utilization with maximum amount Rp 15 million per person/year
Bapel Jamkesos
2. BOSDA Cash & Conditions
Cost of education; low education
Student from poor households
20 percent of the poorest
student in every districts
Provincial Rp 1,050,000 per year for SMA and 1500000 for SMK
Education dinas
Cash & Conditions
Cost of education; low education
School with low enrollment
Provincial Rp 580,000 per year/student for primary school and 710,000 for junior secondary school
Education dinas
Sources and Notes: Field visits Program manuals, regulations. ** Target number. A household is a house with one kitchen, disregard how many families live inside, a common situation in poor households.
III. Preliminary Result of Data Collection

3. Social Service Provision: South Sulawesi
(1) Jamkesda� Province of South Sulawesi provide budget for the poor
that is not included in Jamkesmas or other health insurance scheme (Askes, Asabri etc.)
� Only apply to South Sulawesi residents (ID card)� Co-sharing between Provincial budget (40%) and districts (60%)
(2) BOSDA� Assign dedicated schools for the poor to register� Every student registered in those particular schools is eligible for
additional fund to cover uniform, shoes, book etc.ussually under the term personal cost.
� Co-sharing between Provincial budget (40%) and districts’ (60%)
2525
III. Preliminary Result of Data Collection
2626
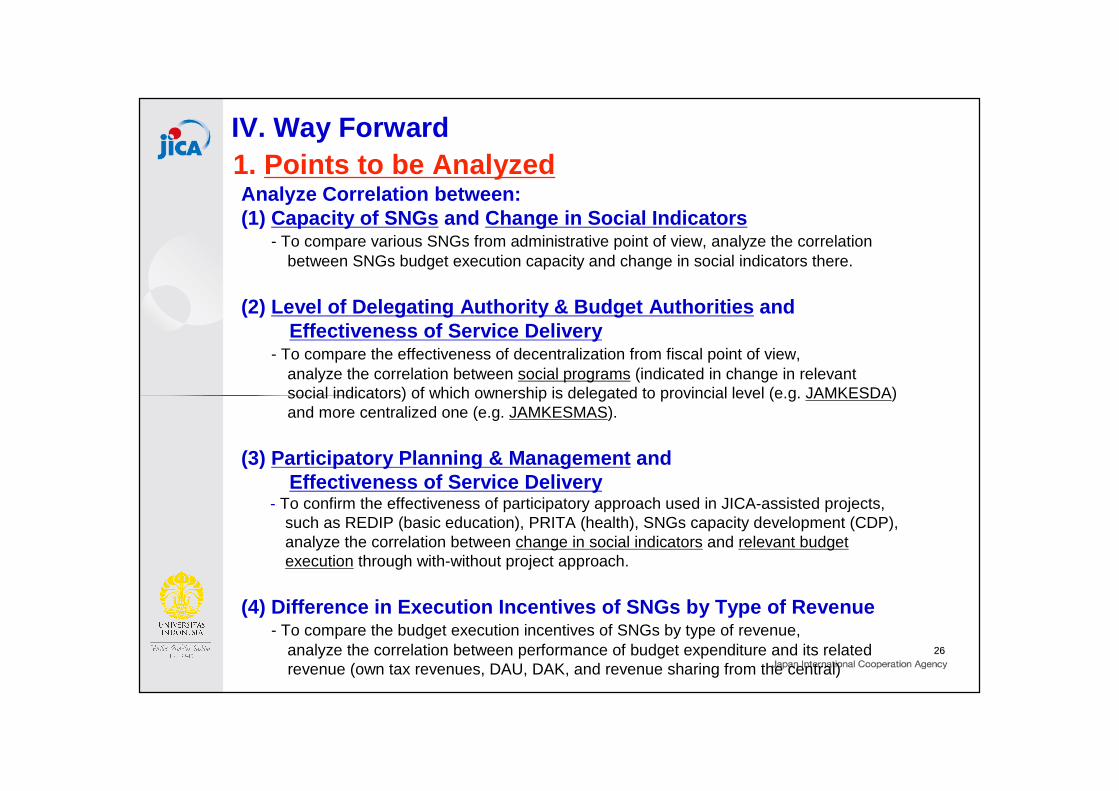
IV. Way Forward1. Points to be AnalyzedAnalyze Correlation between:(1) Capacity of SNGs and Change in Social Indicators
- To compare various SNGs from administrative point of view, analyze the correlationbetween SNGs budget execution capacity and change in social indicators there.
(2) Level of Delegating Authority & Budget Authorit ies andEffectiveness of Service Delivery
- To compare the effectiveness of decentralization from fiscal point of view,analyze the correlation between social programs (indicated in change in relevantsocial indicators) of which ownership is delegated to provincial level (e.g. JAMKESDA)and more centralized one (e.g. JAMKESMAS).
(3) Participatory Planning & Management andEffectiveness of Service Delivery
- To confirm the effectiveness of participatory approach used in JICA-assisted projects,such as REDIP (basic education), PRITA (health), SNGs capacity development (CDP),analyze the correlation between change in social indicators and relevant budgetexecution through with-without project approach.
(4) Difference in Execution Incentives of SNGs by T ype of Revenue- To compare the budget execution incentives of SNGs by type of revenue,
analyze the correlation between performance of budget expenditure and its relatedrevenue (own tax revenues, DAU, DAK, and revenue sharing from the central)

2727
Through correlation analysis and supplemental in-de pth interviews, implications on the following aspects are expected:
- Subsidy- Optimal government system of subsidization for SNGs under decentralization(size, flow, financial resources, etc.)
- SNGs’ Capacity Development- Optimal way to strengthen SNGs’ capacity
(planning, financing, budget execution, etc.)- Good practice of participatory approach to be replicated
- Social Security Program/System- Optimal responsible entity (central/province/district) of related social programs
IV. Way Forward
2. Expected Policy Implications