financing the sustainable development goals in asean · this report was commissioned by undp’s...
TRANSCRIPT

Financing the Sustainable Development Goals in ASEANStrengthening integrated national financing frameworks
to deliver the 2030 Agenda


Financing the Sustainable Development Goals in ASEANStrengthening integrated national financing frameworks
to deliver the 2030 Agenda
Financing the SuStainable Development goalS in aSean
ii
Disclaimer
The views presented in this report do not necessarily represent those of ASEAN, China or UNDP.
Design and layout: Inis Communication – www.iniscommunication.com
AcknowledgementsThis report was commissioned by UNDP’s Regional Bureau for Asia and the Pacific as part of the preparations for the ASEAN-China-UNDP Symposium on Financing the Implementation of the Sustainable Development Goals in ASEAN held 21-22 August, 2017 in Chang Rai, Thailand. This report draws from 10 ASEAN country specific Development Finance Assessments, and from a specific China-ASEAN study. All studies were overseen and supported by UNDP, with generous support from China, while the ASEAN Secretariat facilitated government consultations on the report.
The report was written by Tim Strawson from Development Initiatives under the guidance of Tom Beloe (Governance, Climate Change Finance and Development Effectiveness Advisor) and Emily Davis (Policy Specialist, Development Finance and Effectiveness) from the UNDP Bangkok Regional Hub. The Development Finance Assessment methodology has been developed by the Asia-Pacific Development Effectiveness Facility (AP-DEF) managed by UNDP with generous support from the Australian Department of Foreign Affairs and Trade. The report was supported with inputs from a team at Development Initiatives including Sam Ashby, Jordan Beecher, Katie Brooker, Cecilia Caio, Zach Christensen, Daniel Coppard, Sarah Dalrymple, Harold Evans, Matthew Johnson, Rémi de Lassus, Alex Millar, Niklas Rieger, Alexandra Spencer, Dan Walton, Richard Watts and Sheena Wynne as well as Joseph Bell, Vu Cuong, Greg De Paepe, Jake Jooshandeh and Junjie Zhai (independent consultants). Chapter 3 of the report is based on a paper authored by Prof Zhang Chun from the Shanghai Institute for International Studies.
The author would like to recognize the valuable comments on earlier drafts of the report received from ASEAN Secretariat, ASEAN government representatives and participants at the August 2017 ASEAN-China-UNDP Symposium on Financing the Implementation of the Sustainable Development Goals, as well as colleagues from UNDP including: Cengiz Cihan, Ashley Palmer, Andrew Parker, Michaela Prokop, Richard Marshall, Jakob Schemel, Bishwa Nath Tiwari and Zheng Yuan.

iii
Strengthening integrated national financing frameworks to deliver the 2030 Agenda
H.E. Mr. Vongthep Arthakaivalvatee Deputy Secretary-General of ASEAN
Socio-Cultural Community
Haoliang Xu UN Assistant Secretary-General and
UNDP Director of Asia-Pacific
H.E. Mr. Xu BuAmbassador of
the People’s Republic of China to ASEAN
ForewordRealizing and financing the Sustainable Development Goals (SDGs) by 2030 is a daunting task by all accounts. But only through partnerships can we strengthen global efforts toward eradicating poverty, and meeting the other 16 goals that cut across it.
Nowhere is that case for partnerships more critical than in the ASEAN region, because the force of partnerships here, like the one between ASEAN, China and UNDP, will ripple across the region serving as a model for change across the world.
ASEAN countries face new challenges and mega trends, such as urbanization, rapid technological advances and emerging demographic shifts, which will shape the region’s development landscape, and therefore, its future.
ASEAN, China and UNDP have been working together to support the implementation of the Sustainable Development Goals in ASEAN countries and on 21–22 August 2017 we held the ASEAN-China-UNDP Symposium on Financing the Implementation of the Sustainable Development Goals in Chang Rai, Thailand. Working together with ASEAN and with generous support from China, UNDP prepared this report for the Symposium. In the report we hear how the scale and mix of financing in the ASEAN region is changing, and what challenges and opportunities await. The regional story is complemented also by findings from the national level studies which were also undertaken as a part of the preparations and follow up to the Symposium.
According to this regional study, extreme poverty has fallen significantly across ASEAN, however, there still remain many working poor for whom vulnerability of falling back into poverty is high. Among other recommendations, the study encouraged countries to establish a stronger basis for financing policies through the systematic costing of development plans and policies and establishing comprehensive long-term financing strategies.
The good news is that overall, finance is growing and diversifying rapidly – domestic resources, intra-regional flows and finance from China and other countries outside the region are being scaled up.
Alongside this growth, innovation is creating new opportunities. Countries are aiming to use an increasingly diverse set of instruments such as blended finance, impact investing, public-private partnerships, borrowing, bond issuances and others.
This offers significant potential to drive regional progress toward the ASEAN Community Vision 2025 and the 2030 Agenda – if these resources can be mobilised and channelled into investments that will yield sustainable development results for people, prosperity and planet.
Ultimately, moving forward as a single integrated Community to achieve the ambitions of of the 2030 Agenda and ASEAN Community Vision 2025, will require bold action and innovative partnership at national, regional and global levels. It will require collaboration and communication across countries, sectors and disciplines. All actors – public, private, domestic, international – have a role to play in ensuring that it is ‘not just more financ-ing but better’ financing for sustainable development results.
Our three organizations are pleased to partner to support achievement of the 2030 Agenda at all levels of governance in our region, and we hope that this report provides useful insights into opportunities for making progress.
While ASEAN, China and UNDP are working together to meet the goals, we appreciate that our partnership is just one step on an important journey to bring prosperity and peace across the world and to protect our planet. We hope our partnership and this report will be a catalyst for other collaboration and innovation across sectors, disciplines and borders, to ensure that we achieve the 2030 Agenda together.

ContentsAcknowledgements ii
Foreword iii
Acronyms vi
Executive summary 1
Introduction 9
PART I: ASEAN REGIONAL CONTEXT 10
Chapter 1: The sustainable development outlook 10
Social development 10
Leaving no one behind 14
Economic development 16
Environmental vulnerability and sustainability 17
Demographic trends 18
ASEAN 2025: Forging ahead together 19
Sustainable development challenges and policy priorities 21
PART II: FINANCING OPPORTUNITIES AND CHALLENGES 22
Chapter 2: The finance outlook 22
Regional finance trends 22
Domestic public finance 25
Domestic and international private finance 30
Chapter 3: Chinese financing and ASEAN 42
Existing patterns of investment 42
From Going Global to the Belt and Road Initiative 45

PART III – MANAGING ALL FINANCING FOR SUSTAINABLE DEVELOPMENT 48
Chapter 4: Integrated national financing frameworks for complex financing landscapes 48
1. Leadership and institutional coherence 50
2. Vision for results 51
3. Financing strategy 53
4. Financing policies 56
5. Monitoring and review 60
6. Accountability and dialogue 62
Chapter 5: Integrated national financing frameworks for key policy areas 65
Private sector development 65
Leaving no one behind 69
PART IV – RECOMMENDATIONS 72
Recommendations and follow-up 72
Recommendations to mobilize greater volumes of finance 72
Recommendations to maximize the impact of specific types of finance on sustainable development outcomes 73
Recommendations to strengthen integrated national financing frameworks 75
Regional mechanisms to facilitate knowledge sharing 76
Annex 78
Data and methodological notes 78

Financing the SuStainable Development goalS in aSean
vi
AcronymsADB Asian Development Bank
AEC ASEAN Economic Community
ASEAN Association of Southeast Asian Nations
BEPS Base erosion and profit shifting
BRI Belt and Road Initiative
CLMV Cambodia, Lao PDR, Myanmar and Viet Nam
CPEIR Climate Public Expenditure and Institutional Review
FDI Foreign direct investment
GDP Gross domestic product
GNI Gross national income
Lao PDR Lao People’s Democratic Republic
LDC Least developed country
MDG Millennium Development Goal
ODA Official development assistance
OECD Organisation for Economic Co-operation and Development
OOF Other official flows
PPP Public–private partnerships
PPP$ Purchasing power parity dollars
SAARC South Asian Association for Regional Cooperation
SDG Sustainable Development Goal
SEZ Special economic zone
SME Small and medium-sized enterprise
TIWB Tax Inspectors Without Borders
UK United Kingdom
UNDP United Nations Development Programme
US United States

1
Strengthening integrated national financing frameworks to deliver the 2030 Agenda
Executive summaryHome to over 600 million people, the Association of Southeast Asian Nations (ASEAN) is a diverse and rapidly changing region that is experiencing progress across many aspects of the 2030 Agenda for Sustainable Development. Extreme poverty is falling rapidly across much of the region, from 17 percent of the regional population in 2005 to 7 percent in 2013. Progress is being made in key areas of health such as maternal mortality and tuberculosis prevalence, which are falling in almost all countries. Access to education has grown and is now above 95 percent at primary level in all countries.
Yet the scale of the challenges ahead to achieve the Sustainable Development Goals (SDGs) is significant. Even in the countries and regions where extreme poverty has fallen significantly, there remain many working poor, vulnerability to falling back into poverty is high and a ‘missing middle’ is experiencing rising incomes, but lacks access to basic services. Ninety percent of people have access to improved water sources though only 72 percent to improved sanitation sources. Access to health care and quality secondary education remain challenges in many parts of the region; only four countries have achieved universal health coverage and in six countries secondary school enrolment rates are at or below 75 percent. Many countries have a way to go in moving to greener growth paths, indeed emissions per capita are rising in six countries. Myanmar, Lao People’s Democratic Republic (Lao PDR), Thailand and others are at key junctures in their economic development paths. The extent to which they are able to move into higher value-added activities, and how this happens, will have a significant bearing on how far economic growth continues to drive wider sustainable development progress.
The interconnectedness of the 2030 Agenda highlights the complexity of the challenges that remain. The 2030 Agenda and ASEAN 2025 (‘Vision 2025’) encapsulate a vision of progress across the economic, environmental and social dimensions of sustainable development in which there are many interlinkages. Climate change, for example, cuts across the whole 2030 Agenda and climate or environmental shocks can derail progress toward many of the SDGs. ASEAN is among the most disaster-prone regions in the world: four ASEAN countries are among the ten countries most exposed to natural hazards worldwide. Progress in gender equality too can be a catalyst for progress across many other SDGs, including nutrition, education and health care – yet significant progress is needed on gender equality in the region. While trends are positive, most ASEAN countries score as more unequal than the global average on the United Nations Development Programme (UNDP)’s Gender Inequality Index.
Mobilising the right scale and mix of finance – and leveraging the synergies between flows – is essential for achieving the SDGs. Increasing domestic revenue mobilization and managing public debt effectively can create the fiscal space for governments to invest in social protection, health care, education, green infrastructure and other key services and infrastructure. Mobilising private investments by improving the business environment, using incentive schemes, guarantees, public–private partnerships (PPPs) or other instruments designed to ‘crowd in’ and maximize the impact of private investment, can create decent jobs and drive growth, skills development and innovation. International public finance can support investments in services and infrastructure to reach the poorest people and those isolated from public services, and be a catalyst for investments that can expedite progress. Countries will need to harness all these resources, ensure that they work to their comparative advantages, and are brought together in a mix and sequence that leverages the synergies between them.
Financing the SuStainable Development goalS in aSean
2
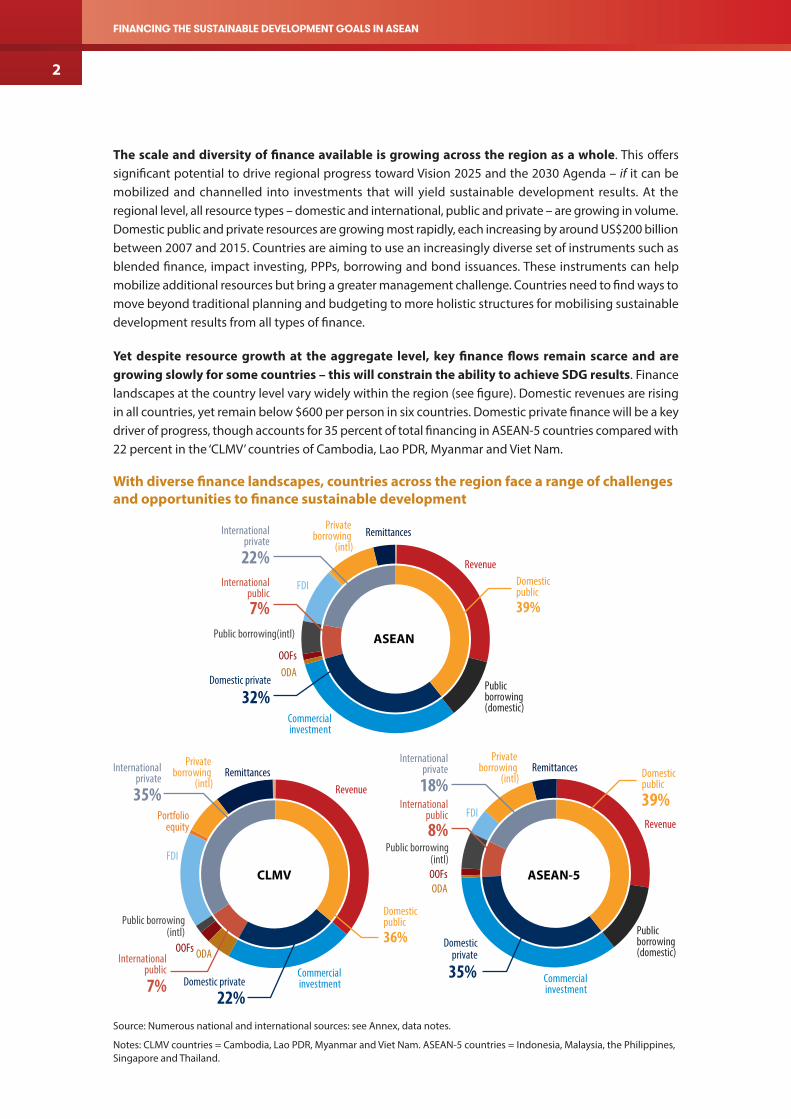
The scale and diversity of finance available is growing across the region as a whole. This offers significant potential to drive regional progress toward Vision 2025 and the 2030 Agenda – if it can be mobilized and channelled into investments that will yield sustainable development results. At the regional level, all resource types – domestic and international, public and private – are growing in volume. Domestic public and private resources are growing most rapidly, each increasing by around US$200 billion between 2007 and 2015. Countries are aiming to use an increasingly diverse set of instruments such as blended finance, impact investing, PPPs, borrowing and bond issuances. These instruments can help mobilize additional resources but bring a greater management challenge. Countries need to find ways to move beyond traditional planning and budgeting to more holistic structures for mobilising sustainable development results from all types of finance.
Yet despite resource growth at the aggregate level, key finance flows remain scarce and are growing slowly for some countries – this will constrain the ability to achieve SDG results. Finance landscapes at the country level vary widely within the region (see figure). Domestic revenues are rising in all countries, yet remain below $600 per person in six countries. Domestic private finance will be a key driver of progress, though accounts for 35 percent of total financing in ASEAN-5 countries compared with 22 percent in the ‘CLMV’ countries of Cambodia, Lao PDR, Myanmar and Viet Nam.
With diverse finance landscapes, countries across the region face a range of challenges and opportunities to finance sustainable development
ASEAN
CLMV ASEAN-5
Domestic public39%
Private borrowing
(intl)
Domestic public36%
Private borrowing
(intl)Domestic public
39%
Private borrowing
(intl)
FDI
FDI
FDI
Revenue
Revenue
Revenue
22%Domestic private
Public borrowing (domestic)
Internationalpublic8%
Internationalprivate
18%
Commercial investment
ODAOOFs
Public borrowing(intl)
Remittances
35%
Domestic private
Internationalpublic7%
Internationalprivate
22%
Public borrowing (domestic)
Commercial investment
ODAOOFs
Public borrowing(intl)
Remittances
32%Domestic private
Internationalpublic
7%
Internationalprivate
35%
Commercial investment
ODAOOFs
Public borrowing(intl)
Remittances
Portfolio equity
Source: Numerous national and international sources: see Annex, data notes.
Notes: CLMV countries = Cambodia, Lao PDR, Myanmar and Viet Nam. ASEAN-5 countries = Indonesia, Malaysia, the Philippines, Singapore and Thailand.

3
Strengthening integrated national financing frameworks to deliver the 2030 Agenda
Low levels of domestic revenue mobilization limit the ability of governments to fund services and public investment. While domestic revenues are rising, they remain below $600 per person (less than $2 a day) in six ASEAN countries.1 This compares with over $15,000 in high-income countries. Revenues this low limit the services and public investments that government can offer. In Cambodia for example, over 70 percent of public investment is funded from international sources. Even where revenues are growing, countries must ensure that models of revenue mobilization are inclusive and ‘sustainable development friendly’, that is, designed considering their distributional impact or incentives on other aspects of sustainable development, for example tax on carbon emissions and overall growth. Volatility in natural resource revenues also impacts on revenue mobilization and the ability to plan public investment, particularly in some resource-rich countries.
Stimulating sufficient quantities of quality private investment is a key challenge to unlocking private contributions toward the SDGs. Private investment has been highly volatile in contexts such as Myanmar and Lao PDR, characterized by low underlying levels of investment and major one-off projects, typically in energy or natural resources. In Thailand private investment is growing but has plateaued as a proportion of national income; in Viet Nam it remains roughly constant in absolute terms but is declining relative to growing national income. Foreign direct investment (FDI) to the region is growing but remains highly concentrated: half goes to Singapore. Both the quantity and quality of private investment are a concern for policymakers – stimulating a sufficient volume of investment to create jobs and grow new industries in Cambodia, Myanmar and Lao PDR, for example, while attracting investments in Thailand and elsewhere that can help drive a shift into higher value-added industry (and out of a middle-income trap). In all contexts, managing the trade-offs between attracting or stimulating private investment, for example with incentives or relaxed regulations, while maximising its sustainable development impact – the jobs created, skills developed, innovation spurred on, green growth generated and so on – is a challenge. At the regional level, and beyond, it is important to manage competition between countries for investment, to ensure many of the benefits are not lost in a ‘race to the bottom’.
Using international public finance catalytically, by planning for future reductions in concessional finance in particular, is the key to ensuring it contributes effectively to the SDGs in the region. International public finance can play a vital role by continuing to support investment and service delivery in some CLMV contexts, and catalysing support for investment in niche areas such as climate finance and global and regional public goods across the region. For many countries access to international concessional financing is falling, or is likely to in the future, and it is important to take steps to prepare for this transition, including investing in domestic capacity building and accessing alternative domestic sources of funding. At the same time, however, countries should prepare to take advantage of new opportunities such as the establishment of the Asian Infrastructure Investment Bank.
The increasing growth of South-South cooperation and investment in the region, particularly from China, offers an opportunity to narrow financing gaps in areas such as infrastructure. Chinese investment to the region has grown rapidly in recent years and China and ASEAN have set a target of two-way investment reaching $150 billion by 2020. The Belt and Road Initiative and growth of funds such as the China-ASEAN Investment Cooperation Fund offer significant potential for funding of infrastructure and related areas. Ensuring that this growing portfolio of investment is aligned to regional and national development priorities will be vital for maximising its contribution to the SDGs.
1 These six countries are: Cambodia (government revenues equivalent to $210 per person in 2015), Indonesia ($505), Lao PDR ($330), Myanmar ($210), Philippines ($495) and Viet Nam ($490).

Financing the SuStainable Development goalS in aSean
4
Country contexts vary and ultimately efforts to strengthen the financing of the implementation of national development priorities and the SDGs will need to be country driven. Governments can strengthen their policy and institutional frameworks to manage these challenges. Mobilising sufficient resources, leveraging the synergies between them, and ensuring that investments of all types are contributing toward the SDGs are the overarching challenges for governments in financing for sustainable development.
ASEAN countries recognize the importance of mobilizing a greater volume and broader set of resources through integrated national financing frameworks to contribute to national development priorities. The Addis Ababa Action Agenda, to which all ASEAN countries are signatories, calls for integrated national financing frameworks to be at the heart of efforts to support cohesive, nationally-owned sustainable development strategies. The Inter-Agency Task Force on Financing for Development recognises this impetus as one of two main elements of the Addis Ababa Action Agenda.2 Integrated national financing frameworks bring together six elements of a cohesive, holistic financing strategy: leadership and institutional coherence, a vision for results, a financing strategy, financing policies for specific flows, monitoring and evaluation, and accountability and dialogue.
All ASEAN countries are making progress in strengthening aspects of an integrated national financing framework and though policy and institutional contexts vary widely, there are opportunities for reform that can increase overall effectiveness in all countries. The extent of coordinated, senior-level leadership over financing in government differs considerably. In many cases there are clear mechanisms for managing public finance investments in sustainable development, but there are few examples of this extending to policy toward private sector development. Most countries have clear visions for results in national development plans, but vastly different degrees of understanding and consensus about them among key stakeholders. Few are costed and the strength of the links between long-term visions and medium and short-term plans and implementation varies widely. In the Philippines, cabinet-level committees scrutinize budget proposals to ensure alignment between annual budgets and the medium-term vision. No ASEAN governments have developed comprehensive financing strategies, though some have taken steps toward such a strategy or have developed comprehensive financing strategies at the sector or thematic level. Indonesia’s green budgeting and planning policy is one example at the thematic level. Despite its crucial role in driving forward progress, finance does not feature centrally in many national monitoring frameworks and where it does the focus is on public finance. Finally, platforms for public–private dialogue could be strengthened in most contexts as a means for developing more responsive and targeted policy for stimulating impactful private sector development. Malaysia has developed an innovative system of ‘Labs’ for multi-stakeholder consultative planning and Myanmar has recently set up a private sector development committee to coordinate public–private dialogue.
The report highlights recommendations about how countries could strengthen the policies and institutional structures that govern their approach to finance, as well as specific steps to mobilize and maximize the impact of finance on the SDGs.
2 United Nations, Report of the Inter-agency Task Force on Financing for Development 2017, UN, New York, 2017, page 1. https://developmentfinance.un.org/sites/developmentfinance.un.org/files/Report_IATF-2017.pdf

5
Strengthening integrated national financing frameworks to deliver the 2030 Agenda
Recommendations to mobilize greater volumes of financeEstablish a code of conduct for tax competition in FDI promotion, to reduce losses to tax revenue. Harmful tax incentives are a feature of intra-regional competition for foreign investment and could be reduced by establishing a code of conduct for tax competition in FDI promotion. Countries in the region often compete with one another for foreign investment and while much of this may be healthy competition, the use of harmful tax practices is common. Evidence shows that tax incentives are often fairly low on the list of priorities for investors choosing where to locate their investment, and they are costly for governments in terms of foregone revenues. In line with the practice among some other regional groupings, ASEAN could establish a code of conduct in which countries agree not to compete using the most harmful practices. There is scope for such a code to be designed in a way that removes the most harmful tax incentive competition, building on international initiatives such as the base erosion and profit shifting (BEPS) inclusive framework, without reducing ASEAN countries’ competitiveness with respect to other countries in the rest of Asia or worldwide.
Strengthen the capacity of tax authorities to raise revenue with support from Tax Inspectors Without Borders. The ability to develop, implement and enforce effective tax policy is limited by low capacity in tax or revenue authorities in several countries. This has an impact on the revenues that countries are able to collect. In 2015 the Organisation for Economic Co-operation and Development (OECD) and UNDP launched the Tax Inspectors Without Borders initiative to meet the need among many countries for capacity building support. Two countries in the region, Cambodia and Viet Nam, are already engaging with the initiative; other countries could consider doing so too.
Reduce the cost of sending intra-regional remittances to 5 percent or less. Remittances are a key resource for many communities across the ASEAN region yet the cost of transferring remittances is very high in some corridors. The cost of intra-regional transfers varies significantly, from less than 3 percent in some corridors to more than 14 percent in others. Other international groupings, notably the G20,3 have established targets to reduce the cost of transferring remittances to a maximum of 5 percent. ASEAN could consider establishing a similar target, while ensuring costs remain unchanged where they are already below 5 percent.
Establish a regional framework for coordinating to reduce illicit finance. Illicit finance is a major drain on resources, impacting public revenues and reducing investment levels. Some countries in the region have signed up to international initiatives such as the BEPS initiative. Yet not all ASEAN countries are active in this agenda and implementation of measures to reduce illicit finance is at an early stage. To expedite this and broaden coverage across the region, ASEAN countries could consider a regional agreement to implement certain measures such as the automatic exchange of tax information and sharing of country-by-country reports within the region as a first step.
3 See: G20, ‘2014 Brisbane. The G20: Australia’s 2014 host year’, 2015. http://g20.org.tr/about-g20/past-summits/2014-brisbane/

Financing the SuStainable Development goalS in aSean
6
Recommendations to maximize the impact of specific finance flowsCountries could improve their policies toward private investment by establishing targets for its impact on all aspects of sustainable development and strengthening coordination in government. Private investment has important impacts on many aspects of sustainable development, though governments often emphasize economic gains and job creation over others such as skills development, technology and innovation, resilience and environmental protection. Establishing more holistic policy that addresses the contributions from private investment on these wider aspects of sustainable development can help maximize its impact. Relatedly, governments could centralize or strengthen coordination on policy toward the business environment to ensure that reforms in one area are not limited by lack of progress in others.
With Chinese investment set to be scaled up in coming years, now is the time for the region to agree a framework with China that can maximize its sustainable development impact. ASEAN and China have agreed to develop a joint vision for the China-ASEAN strategic partnership to 2030 and work toward a target of two-way investment totalling $150 billion by 2020.4 This represents a significant scaling up of current levels: Chinese investment in ASEAN totalled $14.6 billion in 2015. Ensuring the strategies that govern how this financing is invested align with existing ASEAN regional and national strategies is essential for enhancing its effectiveness. Putting in place a strong, jointly managed monitoring and review framework is important to make sure that the impact of investments is understood and maximized. Such a framework should monitor the impact on all aspects of sustainable development and align with SDG indicators. The joint vision for 2030 could also consider measures to channel investment to the ASEAN countries most in need of infrastructure and other investment.
Domestic revenue mobilisation is critical for ensuring sufficient resources are available for public services and investment – countries should plan for and monitor the impact of revenue models on sustainable development outcomes as well as on the revenues they raise. Tax and revenue systems can have significant distributional impacts and create incentives that shift the way resources are invested and business models operate. Governments should link the objectives of their revenue authorities and revenue strategies not only to volumes of revenue raised, but also to measures of distributional and wider sustainable development impacts in line with their national development plans.
Governments should plan ahead for the time when international public finance (including climate finance) is likely to be scaled back. As countries graduate from least developed country status or move up income groups they face reduced access to international concessional public finance. Planning ahead is vital to manage the transition sustainably. Building the political will to fund the continuation of key initiatives takes time – and building the technical capacity in areas such as climate adaptation and mitigation can take even longer. It is wise to use international public finance, while it is available, to develop the capacity needed for the long term.
4 This commitment was made at the 23rd China-ASEAN Senior Officials’ Consultations held in Guiyang, Guangxi on 19 May 2017.

7
Strengthening integrated national financing frameworks to deliver the 2030 Agenda
Recommendations to strengthen integrated national financing frameworksGovernments should establish a stronger basis for financing policies by systematically costing development plans and policies, and establishing comprehensive, long-term financing strategies. Estimating the scale of investments and cost of spending and services required to realize the national development plan and the policies designed to implement it is a key foundation for building a structured approach to mobilising the necessary resources. Building on such cost estimates, countries could develop overarching financing strategies that outline the investments and spending that are needed from all resources and types of finance. These would outline the types of finance instruments required, provide a basis for managing trade-offs between debt and non-debt instruments, and address changes of a more structural nature that need to be implemented to unlock new sources of finance.
Countries can strengthen platforms for engaging in dialogue with non-state actors and systems for monitoring the impact and contributions of all types of finance. Dialogue is essential for building trust and shared ownership between government and business, civil society, development partners and other actors. Establishing platforms for systematic dialogue with these actors about the roles they can play in driving forward sustainable development progress and about how government can support them in this is important for refining and strengthening government policy. Developing mechanisms for monitoring the investments made by all resources, the outcomes those investments generate and the contribution those outcomes make toward headline sustainable development targets would further help governments across the region understand and develop policy to maximize the impact of all types of finance.
Countries should complete full development finance assessment processes. The development finance assessment and integrated financing solutions process has been designed to help governments identify areas for strengthening their management of all resources for the SDGs, using the lens of the integrated national financing framework. The development finance assessment offers a ‘big picture’ perspective that aggregates and assesses analysis across all types of finance and the policy and institutional structures used to govern them. This can be followed by ongoing support for priority reforms designed to generate and realign resources, avoid future expenditures, deliver better and strengthen transparency and accountability.5
At the regional level, ASEAN should establish an integrated national financing framework peer review mechanism, and a knowledge sharing platform on financing for sustainable development, to facilitate deeper dialogue and lesson sharing that strengthens the approach to financing across the ASEAN region. Experiences of financing across the region are rich and varied, and there is clearly strong demand for deeper intra-regional dialogue and sharing of knowledge, lessons and experience. Indeed, many governments indicated a desire during the project to learn how their regional neighbours have approached common financing challenges, policies and institutional reform priorities.
An integrated national financing framework peer review mechanism would facilitate direct knowledge sharing between the ministries responsible for managing financing strategies in governments across the region. It would involve peer review teams undertaking a detailed review of the processes, systems and policies governing a country’s overall financing strategy. These teams would include a small group
5 See more at: AP-DEF and UNDP, Development Finance Assessment and Integrated Financing Solutions, 2017. http:// procurement-notices.undp.org/view_file.cfm?doc_id=117734

Financing the SuStainable Development goalS in aSean
8
of senior officials responsible for designing and overseeing the implementation of policy in their own governments, with a spread of officials from multiple governments and specialists covering all areas of financing. Peer reviews would be requested by governments but there would be value in all countries undertaking them, both to learn and to share lessons. Similar mechanisms have been effective in helping OECD countries strengthen budgeting systems, African countries strengthen governance and Pacific Islands countries strengthen mechanisms for public finance management and development effectiveness.
Establishing a knowledge sharing platform on financing for sustainable development that captures trends in financing alongside analysis of policy and institutional issues in the region could further strengthen the exchange of experiences and information. Such a platform would help policymakers better understand trends in the financing landscape and the challenges and opportunities that their neighbours face. It would provide a platform for sharing debate on policy approaches and understanding where and why particular policy or institutional reform approaches have or have not worked in a neighbouring context.

9
Strengthening integrated national financing frameworks to deliver the 2030 Agenda
IntroductionThe Association of Southeast Asian Nations (ASEAN) is a diverse and rapidly changing region. Progress is being made at pace across many aspects of sustainable development, though challenges remain if countries are to realize the visions of the 2030 Agenda for Sustainable Development and ASEAN 2025. Vulnerability is high and access to health care and education and other services is unequal, even among much of the emerging middle class. Transitioning to green growth paths will require investment and structural adjustment.
Realising the visions of the 2030 Agenda and ASEAN 2025 (‘Vision 2025’) necessitates the right scale and mix of finance. It will involve investments and spending from a wide range of public and private, domestic and international resources and financing instruments and leveraging the synergies between them.
The current finance landscape in the region offers both opportunities and challenges for financing sustainable development. Overall, finance is growing and diversifying rapidly – domestic resources, intra-regional flows and finance from China and other countries outside the region are being scaled up. Yet the scale and mix of resources available is uneven across the region – for some countries expediting growth in revenues or stimulating private investment from a low base will be key challenges.
The Addis Ababa Action Agenda calls for countries to establish integrated national financing frameworks that can support cohesive, nationally-owned sustainable development strategies. An integrated national financing framework offers a prompt for governments to review the policies and institutional structures that they have in place, and guide on how to do so. It can also be used to support reforms designed to strengthen a holistic approach toward managing and mobilising all types of financing – domestic, international, public, private – for sustainable development results.
This report draws together findings from a series of development finance assessments undertaken as part of a project to contribute to the ASEAN-China-UNDP Symposium on Financing the implementation of the SDGs in ASEAN, which was held in Chiang Rai, Thailand, in August 2017. The assessments undertaken in ASEAN member states analysed the finance challenges and opportunities that countries face. They used the lens of the integrated national financing framework to assess the policies and institutional structures that governments have in place for financing the Sustainable Development Goal (SDGs). These assessments and this report build on complementary work by the Asian Development Bank, the United Nations Economic and Social Commission for Asia and the Pacific, the International Monetary Fund, World Bank and others, that focus on particular parts of the financing landscape. The report and assessments add value by drawing together analysis of the finance landscape as a whole and using the lens of the integrated national financing framework to focus on the steps that governments can take to finance implementation of the SDGs. The analysis and recommendations presented aim to inform dialogue and thinking about how to strengthen the approach toward financing for the SDGs and Vision 2025 across the region. Recommendations are given at the end of the report about steps that can be taken at the country and regional level to support this objective.

Financing the SuStainable Development goalS in aSean
10
PART I: ASEAN REGIONAL CONTEXT
Chapter 1: The sustainable development outlookHome to over 600 million people, ASEAN is a diverse and rapidly changing region. Rapid advances are being made across the economic, environmental and social dimensions of sustainable development, though significant challenges remain. The 2030 Agenda sets a vision of progress across these three dimensions through 17 SDGs. This agenda provides an ambitious framework for the ASEAN region to strive toward, and aligns closely with the region’s Vision 2025. At the time of writing in 2017 many countries are still in the process of building or adapting structures to enable comprehensive reporting on SDG progress. Four countries from the region have published initial voluntary national reviews of progress against the SDGs.6
This chapter outlines the key trends and outlook against the social, economic and environmental dimensions of the 2030 Agenda and SDG targets and considers where finance is a constraint to further progress. It analyses the challenge of leaving no one behind in the ASEAN region and assesses the implications of demographic trends. It also presents an overview of policy priorities at the regional level compared with the 2030 Agenda. This chapter thereby forms a basis for analysis through the rest of the report about the finance that could be available to address the challenges of this sustainable development outlook and the policies and institutional structures that governments can use to mobilize that finance.
Social developmentThe social development dimensions of the 2030 Agenda and the SDGs overlap strongly with the objectives of the ASEAN Socio-Cultural Community (see chapter 2). ASEAN countries are making rapid progress in areas such as poverty reduction while in others, such as nutrition, aspects of health, education and gender equality, the region has a long way to go or remains behind others globally. Limits to the financing available for these priorities both individually and, given the significant interconnections between them, collectively, may constrain further progress.
Extreme poverty is falling rapidly (Figure 1.1). As measured by the international poverty line, $1.90 a day,7 which forms the basis for SDG 1,8 extreme poverty fell from 17 percent of the regional population in 2005 to 7 percent in 2013. An estimated 132 million people were lifted out of extreme poverty in the ASEAN region in the Millennium Development Goal (MDG) era, 12 percent of the global total.9
6 The Philippines published its first progress report for the 2016 High-Level Political Forum while Indonesia, Malaysia and Thailand published theirs for the 2017 Forum. Lao PDR, Singapore and Viet Nam have indicated that they will submit reports in 2018.
7 Measured in 2011 PPP$ (purchasing power parity).8 Official ASEAN targets on reducing poverty use the international definition of extreme poverty, though Vision 2025 and earlier
commitments use the previous $1.25 a day measure that was updated to $1.90 a day by the World Bank in 2015. The change reflects an update for changing prices and more recent data, rather than an actual shift in the poverty line itself.
9 All data on the international poverty line is sourced from PovcalNet, the online tool for poverty measurement developed by the Development Research Group of the World Bank. Accessed 14 July 2017.

11
Strengthening integrated national financing frameworks to deliver the 2030 Agenda
Indonesia and Viet Nam together accounted for around 90 percent of poverty reduction in the region. Poverty rates are falling in Indonesia by an average 10 to 15 percent a year,10 with over 40 million people lifted out of poverty between 2006 and 2014. In Viet Nam poverty rates fell from over 30 percent of the population before 2004 to 3 percent in 2014, though the pace of poverty reduction has slowed since 2010.
An estimated 36 million people in the region still live below the international poverty line11 (5 percent of the global total). Almost 90 percent of these people live in Indonesia or the Philippines. Poverty rates are on a downward but fluctuating trend in the Philippines having decreased, from 17 percent in 2005 to 12 percent in 2013, a trend that national measures show has continued since.12
Despite rapid progress against income-based measures of poverty, many people remain vulnerable to falling back into extreme poverty. Financing is vital in building resilience and protecting the progress already made, through mechanisms such as social protection measures or in stimulating the kind of private investment that can create decent jobs.
Poverty rates across the region are falling though vulnerability remains high
0
10
20
30
40
50
60
2005 2010 2015
Cambodia
0
5
10
15
20
25
30
2005 2010 2015
Indonesia
0
5
10
15
20
25
30
2005 2010 2015
Lao PDR
0
1
2
3
4
5
2005 2010 2015
Malaysia
0
10
20
30
40
2005 2010 2015
Myanmar
0
5
10
15
20
25
30
2005 2010 2015
Philippines
0
5
10
15
20
25
2005 2010 2015
Thailand
0
5
10
15
20
25
30
2005 2010 2015
Viet Nam
0
5
10
15
20
25
2005 2010 2015
ASEAN
International poverty line ($1.90)
National poverty line
Source: World Bank PovcalNet and national sources
Notes: Figures shown are the proportion of the population living below each poverty line. Data are unavailable for Brunei Darus-salam and Singapore and no data on trends in the international poverty line are available for Myanmar.
10 Based on trends for the last six years for which data exist.11 Based on latest available data that cover 2014 for Indonesia and Viet Nam and 2013 for all other countries.12 Source: National offices of statistics.
Financing the SuStainable Development goalS in aSean
12
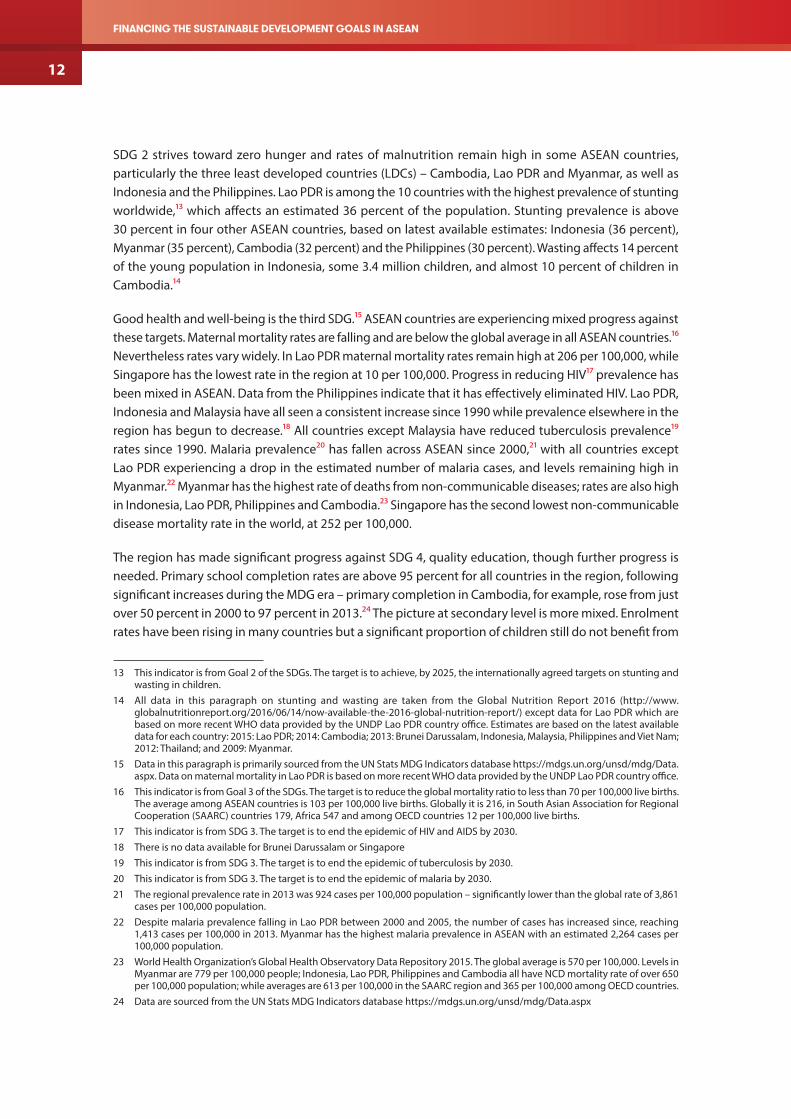
SDG 2 strives toward zero hunger and rates of malnutrition remain high in some ASEAN countries, particularly the three least developed countries (LDCs) – Cambodia, Lao PDR and Myanmar, as well as Indonesia and the Philippines. Lao PDR is among the 10 countries with the highest prevalence of stunting worldwide,13 which affects an estimated 36 percent of the population. Stunting prevalence is above 30 percent in four other ASEAN countries, based on latest available estimates: Indonesia (36 percent), Myanmar (35 percent), Cambodia (32 percent) and the Philippines (30 percent). Wasting affects 14 percent of the young population in Indonesia, some 3.4 million children, and almost 10 percent of children in Cambodia.14
Good health and well-being is the third SDG.15 ASEAN countries are experiencing mixed progress against these targets. Maternal mortality rates are falling and are below the global average in all ASEAN countries.16 Nevertheless rates vary widely. In Lao PDR maternal mortality rates remain high at 206 per 100,000, while Singapore has the lowest rate in the region at 10 per 100,000. Progress in reducing HIV17 prevalence has been mixed in ASEAN. Data from the Philippines indicate that it has effectively eliminated HIV. Lao PDR, Indonesia and Malaysia have all seen a consistent increase since 1990 while prevalence elsewhere in the region has begun to decrease.18 All countries except Malaysia have reduced tuberculosis prevalence19 rates since 1990. Malaria prevalence20 has fallen across ASEAN since 2000,21 with all countries except Lao PDR experiencing a drop in the estimated number of malaria cases, and levels remaining high in Myanmar.22 Myanmar has the highest rate of deaths from non-communicable diseases; rates are also high in Indonesia, Lao PDR, Philippines and Cambodia.23 Singapore has the second lowest non-communicable disease mortality rate in the world, at 252 per 100,000.
The region has made significant progress against SDG 4, quality education, though further progress is needed. Primary school completion rates are above 95 percent for all countries in the region, following significant increases during the MDG era – primary completion in Cambodia, for example, rose from just over 50 percent in 2000 to 97 percent in 2013.24 The picture at secondary level is more mixed. Enrolment rates have been rising in many countries but a significant proportion of children still do not benefit from
13 This indicator is from Goal 2 of the SDGs. The target is to achieve, by 2025, the internationally agreed targets on stunting and wasting in children.
14 All data in this paragraph on stunting and wasting are taken from the Global Nutrition Report 2016 (http://www.globalnutritionreport.org/2016/06/14/now-available-the-2016-global-nutrition-report/) except data for Lao PDR which are based on more recent WHO data provided by the UNDP Lao PDR country office. Estimates are based on the latest available data for each country: 2015: Lao PDR; 2014: Cambodia; 2013: Brunei Darussalam, Indonesia, Malaysia, Philippines and Viet Nam; 2012: Thailand; and 2009: Myanmar.
15 Data in this paragraph is primarily sourced from the UN Stats MDG Indicators database https://mdgs.un.org/unsd/mdg/Data.aspx. Data on maternal mortality in Lao PDR is based on more recent WHO data provided by the UNDP Lao PDR country office.
16 This indicator is from Goal 3 of the SDGs. The target is to reduce the global mortality ratio to less than 70 per 100,000 live births. The average among ASEAN countries is 103 per 100,000 live births. Globally it is 216, in South Asian Association for Regional Cooperation (SAARC) countries 179, Africa 547 and among OECD countries 12 per 100,000 live births.
17 This indicator is from SDG 3. The target is to end the epidemic of HIV and AIDS by 2030.18 There is no data available for Brunei Darussalam or Singapore19 This indicator is from SDG 3. The target is to end the epidemic of tuberculosis by 2030.20 This indicator is from SDG 3. The target is to end the epidemic of malaria by 2030.21 The regional prevalence rate in 2013 was 924 cases per 100,000 population – significantly lower than the global rate of 3,861
cases per 100,000 population.22 Despite malaria prevalence falling in Lao PDR between 2000 and 2005, the number of cases has increased since, reaching
1,413 cases per 100,000 in 2013. Myanmar has the highest malaria prevalence in ASEAN with an estimated 2,264 cases per 100,000 population.
23 World Health Organization’s Global Health Observatory Data Repository 2015. The global average is 570 per 100,000. Levels in Myanmar are 779 per 100,000 people; Indonesia, Lao PDR, Philippines and Cambodia all have NCD mortality rate of over 650 per 100,000 population; while averages are 613 per 100,000 in the SAARC region and 365 per 100,000 among OECD countries.
24 Data are sourced from the UN Stats MDG Indicators database https://mdgs.un.org/unsd/mdg/Data.aspx

13
Strengthening integrated national financing frameworks to deliver the 2030 Agenda
secondary education. In six of the ten ASEAN countries, secondary enrolment is at or below 75 percent. This challenge is particularly pertinent in the CLMV countries, where secondary enrolment rates are lowest.25 Beyond enrolment and completion rates, the quality of education is a major concern in some countries.26 Almost all ASEAN countries have achieved or are close to gender parity in primary education27 and secondary education.28
Financing is a major contributor to health and education outcomes. Where there is sufficient fiscal space governments in Thailand, the Philippines and elsewhere have expanded or are expanding health coverage (see chapter 6). Likewise in education, the availability of finance can be a key driver to increase access, reducing hidden costs and boosting quality.
Challenges remain on gender equality, the fifth SDG, despite progress in some aspects of this goal. While gender equality is a standalone goal in the SDG framework it is also a cross-cutting priority for the 2030 Agenda. Progress in gender equality can be a catalyst for progress across a range of other goal areas. Progress has been achieved in access to education, which sits within SDG 4.29 Female representation in senior private sector management was higher in ASEAN than the wider Asian region, with Viet Nam, the Philippines, Malaysia and Singapore leading the way.30 However the Philippines is the only country in the region (and one of only two in Asia) where there is equality in pay for employment. Levels of domestic violence remain high and judicial and other protections weak in a number of countries.31 Overall gender equality remains higher across the region than in the rest of the world. UNDP’s Gender Inequality Index measures the loss in human potential through gender inequality32 and while the trend is of decreasing inequality in all except two ASEAN nations, the index score of most ASEAN countries remains above the global average of 0.356.33 Singapore, Malaysia and Viet Nam have an index score lower than the world average, while in Viet Nam and Thailand, index scores have risen in recent years. Cambodia, Indonesia and Lao PDR have the highest Gender Inequality Index scores in ASEAN (0.479, 0.467 and 0.468 respectively).
SDG 6 relates to clean water and sanitation; 90 percent of people in ASEAN have access to improved water sources,34 though only 72 percent to improved sanitation sources.35 This is comparable with global averages, which stand at 91 and 68 percent respectively. Rates are lowest in Cambodia where rural access to water and sanitation is particularly low (at 76 and 42 percent respectively). Financing for the necessary infrastructure and services is essential to deliver improved access to clean water and sanitation.
25 These figures are based on the latest available data, sourced from ESCAP Online Statistical Database based on data from the UNESCO Institute for Statistics Data Centre, 25 October 2016. http://data.unescap.org/escap_stat/ (accessed 26 June 2017). The secondary enrolment rate is at or below 75 percent in Indonesia (75 percent in 2014), Malaysia (69 percent in 2014), Philippines (67 percent in 2013), Lao PDR (51 percent in 2014), Myanmar (48 percent in 2014). Cambodia’s latest estimate from this source is 38 percent in 2008. Data for Viet Nam and Singapore are unavailable.
26 UNESCAP, ADB and UNDP, Asia-Pacific Sustainable Development Goals Outlook, UN, ADB and UNDP, 2017. https://www.adb.org/sites/default/files/publication/232871/asia-pacific-sdgoutlook-2017.pdf
27 This indicator is from SDG 4. The target is to provide women and girls with equal access to education, with a >0.95 gender enrolment ratio. Only Thailand fell slightly below the required threshold, and this was only in the most recent year with data, 2015.
28 There is progress to be made in Lao PDR on parity in secondary education.29 UN Stats SDG Indicators Global Database: https://unstats.un.org/sdgs/indicators/database/.30 UNESCAP, ADB and UNDP, Asia-Pacific Sustainable Development Goals Outlook, UN, ADB and UNDP, 2017. https://www.adb.
org/sites/default/files/publication/232871/asia-pacific-sdgoutlook-2017.pdf 31 UNESCAP, ADB and UNDP, Asia-Pacific Sustainable Development Goals Outlook, UN, ADB and UNDP, 2017. https://www.adb.
org/sites/default/files/publication/232871/asia-pacific-sdgoutlook-2017.pdf 32 UNDP, 2016. http://hdr.undp.org/en/content/gender-inequality-index-gii33 A lower score indicates less inequality.34 This indicator is from SDG 6. The target is to achieve universal and equitable access to safe and affordable drinking water.35 This indicator is from SDG 6. The target is to achieve access to adequate and equitable sanitation for all and end open defecation.

Financing the SuStainable Development goalS in aSean
14
Leaving no one behindLeaving no one behind is a key principle of the 2030 Agenda that cuts across all three dimensions of sustainable development and reflects the interconnectedness of the agenda as a whole. It is the poorest and most vulnerable people and communities that are least impacted by the benefits of economic growth, and who are most vulnerable to its risks and shocks. Progress in one aspect of sustainable development can catalyse progress in others – likewise a lack of progress in a particular area can constrain progress elsewhere.
There is no commonly agreed measure for monitoring progress in leaving no one behind – rather it requires disaggregated monitoring across all areas to understand and ensure that progress is being shared by all. However, one way to understand the context and progress of leaving no one behind in ASEAN is to analyse the context for the poorest 20 percent of people across the region. Incomes among the poorest 20 percent of people in ASEAN are rising, though slowly (Figure 1.2). Income for the person at the twentieth percentile rose by $1 (PPP$ prices) a day between 1990 and 2013, from just over $1 to just over $2. Indonesia and the Philippines account for the majority of the poorest 20 percent of people in the region, given rising relative incomes in Viet Nam, particularly over the early and mid-2000s.
Figure 1.2. Income-based measures of progress for the poorest people
2002
Per c
apita
aver
age d
aily
co
nsum
ptio
n 20
11 P
PP$
2.50
2.00
1.50
1.00
0.50
0.00
100%
75%
50%
25%
0%
1990
1990
1993
CambodiaMalaysia
1996
1999
2005
2008
2010
2011
2012
2013
1995 2000 2005 2010VietnamIndonesia*
PhilippinesLao PDR
Thailand
Indonesia and the Philippines account for most of the poorest people in the region
2015
Incomes for the poorest 20 percent of people in ASEAN are rising slowly
Source: World Bank’s PovcalNet and P20 initiative Source: World Bank’s PovcalNet and P20 initiative
Notes: These figures show trends for the poorest 20 percent of people in the region. The left-hand figure shows how the income of the person at the twentieth percentile has changed over time, while the right-hand figure shows the geographic location of the poorest 20 percent of people.
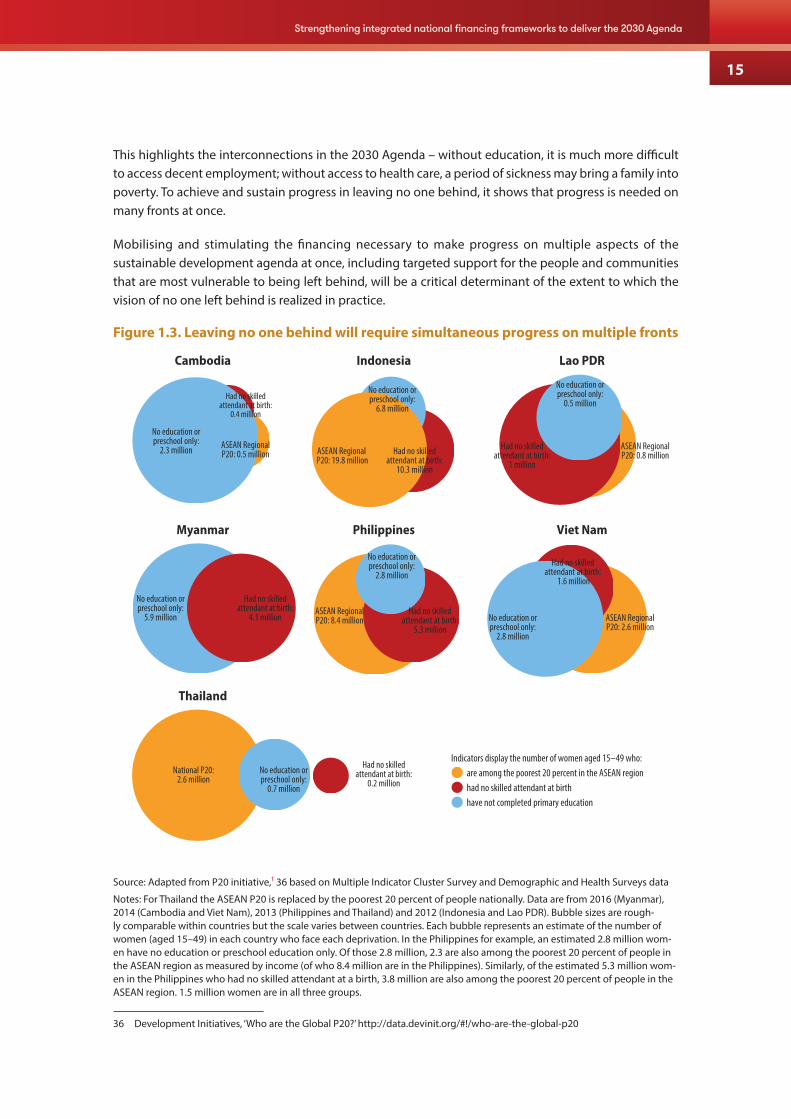
The poorest 20 percent of people face deprivations in multiple areas of sustainable development, highlighting the interconnectedness of the 2030 Agenda and complexity of the challenge of leaving no one behind. Figure 1.3 shows how women among the poorest 20 percent face reduced access to health care (highlighted by the presence of a skilled attendant at birth) and education (highlighted by the number of women who have no education or preschool only) in each country. While the extent of overlap between the variables displayed varies, in almost all cases the women who face deprivation in one area are more likely to in another area as well. And while these indicators are for education, health care and low incomes, the situation is similar when looking at overlapping deprivations in other areas too.
15
Strengthening integrated national financing frameworks to deliver the 2030 Agenda
This highlights the interconnections in the 2030 Agenda – without education, it is much more difficult to access decent employment; without access to health care, a period of sickness may bring a family into poverty. To achieve and sustain progress in leaving no one behind, it shows that progress is needed on many fronts at once.
Mobilising and stimulating the financing necessary to make progress on multiple aspects of the sustainable development agenda at once, including targeted support for the people and communities that are most vulnerable to being left behind, will be a critical determinant of the extent to which the vision of no one left behind is realized in practice.
Figure 1.3. Leaving no one behind will require simultaneous progress on multiple fronts
Indicators display the number of women aged 15–49 who: are among the poorest 20 percent in the ASEAN region had no skilled attendant at birth have not completed primary education
No education or preschool only:
2.3 million ASEAN Regional P20: 19.8 million
Had no skilled attendant at birth:
1 million
No education or preschool only:
0.5 million
ASEAN Regional P20: 0.8 million
No education or preschool only:
6.8 million
Had no skilled attendant at birth:
10.3 million
No education or preschool only:
5.9 million
Had no skilled attendant at birth:
4.1 millionASEAN Regional P20: 8.4 million
National P20: 2.6 million
No education or preschool only:
0.7 million
Had no skilled attendant at birth:
0.2 million
No education or preschool only:
2.8 million
Had no skilled attendant at birth:
5.3 millionNo education or preschool only:
2.8 million
ASEAN Regional P20: 2.6 million
Had no skilled attendant at birth:
1.6 million
ASEAN Regional P20: 0.5 million
Cambodia
Thailand
Indonesia Lao PDR
Myanmar Philippines Viet Nam
Had no skilled attendant at birth:
0.4 million
Source: Adapted from P20 initiative,1 36 based on Multiple Indicator Cluster Survey and Demographic and Health Surveys data
Notes: For Thailand the ASEAN P20 is replaced by the poorest 20 percent of people nationally. Data are from 2016 (Myanmar), 2014 (Cambodia and Viet Nam), 2013 (Philippines and Thailand) and 2012 (Indonesia and Lao PDR). Bubble sizes are rough-ly comparable within countries but the scale varies between countries. Each bubble represents an estimate of the number of women (aged 15–49) in each country who face each deprivation. In the Philippines for example, an estimated 2.8 million wom-en have no education or preschool education only. Of those 2.8 million, 2.3 are also among the poorest 20 percent of people in the ASEAN region as measured by income (of who 8.4 million are in the Philippines). Similarly, of the estimated 5.3 million wom-en in the Philippines who had no skilled attendant at a birth, 3.8 million are also among the poorest 20 percent of people in the ASEAN region. 1.5 million women are in all three groups.
36 Development Initiatives, ‘Who are the Global P20?’ http://data.devinit.org/#!/who-are-the-global-p20
Financing the SuStainable Development goalS in aSean
16
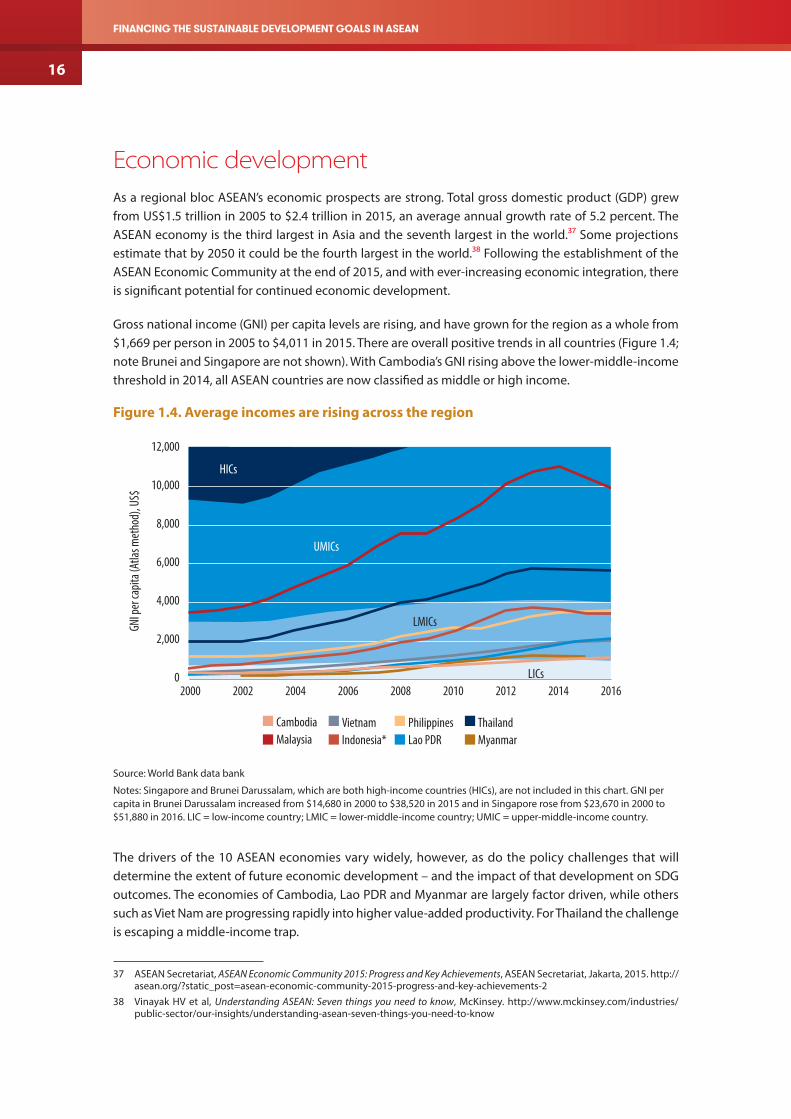
Economic development As a regional bloc ASEAN’s economic prospects are strong. Total gross domestic product (GDP) grew from US$1.5 trillion in 2005 to $2.4 trillion in 2015, an average annual growth rate of 5.2 percent. The ASEAN economy is the third largest in Asia and the seventh largest in the world.37 Some projections estimate that by 2050 it could be the fourth largest in the world.38 Following the establishment of the ASEAN Economic Community at the end of 2015, and with ever-increasing economic integration, there is significant potential for continued economic development.
Gross national income (GNI) per capita levels are rising, and have grown for the region as a whole from $1,669 per person in 2005 to $4,011 in 2015. There are overall positive trends in all countries (Figure 1.4; note Brunei and Singapore are not shown). With Cambodia’s GNI rising above the lower-middle-income threshold in 2014, all ASEAN countries are now classified as middle or high income.
Figure 1.4. Average incomes are rising across the region
12,000
10,000
8,000
6,000
4,000
2,000
0
GNI p
er ca
pita (
Atlas
met
hod)
, US$
2000 2002 2004 2006
HICs
UMICs
LMICs
LICs2008 2010 2012 2014 2016
CambodiaMalaysia
VietnamIndonesia*
PhilippinesLao PDR
ThailandMyanmar
Source: World Bank data bank
Notes: Singapore and Brunei Darussalam, which are both high-income countries (HICs), are not included in this chart. GNI per capita in Brunei Darussalam increased from $14,680 in 2000 to $38,520 in 2015 and in Singapore rose from $23,670 in 2000 to $51,880 in 2016. LIC = low-income country; LMIC = lower-middle-income country; UMIC = upper-middle-income country.
The drivers of the 10 ASEAN economies vary widely, however, as do the policy challenges that will determine the extent of future economic development – and the impact of that development on SDG outcomes. The economies of Cambodia, Lao PDR and Myanmar are largely factor driven, while others such as Viet Nam are progressing rapidly into higher value-added productivity. For Thailand the challenge is escaping a middle-income trap.
37 ASEAN Secretariat, ASEAN Economic Community 2015: Progress and Key Achievements, ASEAN Secretariat, Jakarta, 2015. http://asean.org/?static_post=asean-economic-community-2015-progress-and-key-achievements-2
38 Vinayak HV et al, Understanding ASEAN: Seven things you need to know, McKinsey. http://www.mckinsey.com/industries/public-sector/our-insights/understanding-asean-seven-things-you-need-to-know

17
Strengthening integrated national financing frameworks to deliver the 2030 Agenda
Economic growth is driving rising wages and a falling proportion of employed people living in poverty, highlighting the potential impact of inclusive growth (Figure 1.5). Rising wages in some contexts also highlight part of the challenge for policymakers. Thailand is in a middle-income trap where rising wages are reducing the competitiveness of its established industries relative to other countries in the region, yet it does not have a sufficient critical mass to make an economy-wide move to higher value-added industries. Mobilising the private finance that can help the country move out of this middle-income trap is a key challenge.
Figure 1.5. Rising wages are driving reductions in the proportion of working poor
2007 2015
Myanmar Cambodia Viet Nam Thailand
Monthly wages, US$
% of employed people living below $3.10
Mon
thly
wage
s, co
nsta
nt U
S$ 500
400
300
200
100
0
90%
70%
50%
30%
10%
-10%2007 2015
500
400
300
200
100
0
90%80%70%60%50%40%30%20%10%0%
2007 2015
500
400
300
200
100
0
90%80%70%60%50%40%30%20%10%0%
2007 2015
500
400
300
200
100
0
90%80%70%60%50%40%30%20%10%0%
Sources: Cambodia Socio-Economic Survey 2014, Myanmar labour force, child labour and school to work transition survey 2015, Thailand Labour Force Surveys, Viet Nam Labour Force Surveys; World Bank.
Notes: All figures have been converted from national currencies to constant US$.
The East Asian crisis of the late 1990s severely affected many ASEAN countries and economic vulnerability remains a prescient concern for policymakers. As defined by the UN’s Economic Vulnerability Index, vulnerability is highest, though falling, among the CLMV countries.39 Cambodia and Lao PDR have experienced significant reductions in economic vulnerability since the mid-2000s. This has been driven by greater stability in exports of goods and services in both countries as well as reduced agricultural instability in Lao PDR.
Environmental vulnerability and sustainabilityASEAN is both one of the most disaster-prone and natural resource-rich regions in the world. Both aspects of sustainability – increasing resilience to safeguard developmental progress, and ensuring that growth is green – are high priorities for the region, and financing is an important part of realising these priorities.
Four ASEAN countries (Philippines, Myanmar, Indonesia and Viet Nam) rank in the top ten countries most exposed to natural hazards according to the INFORM Index for Risk Management – the Philippines is ranked as the most exposed to natural hazards.40 Myanmar and Viet Nam are jointly the two countries worldwide with the most physical exposure to floods while the Philippines and Indonesia are the second-most exposed countries to tropical cyclones and tsunamis respectively.
39 Three of the CLMV countries are classified as LDCs. This measure is one of the three determinants of the LDC classification. See Annex.
40 Philippines is ranked as the most exposed country worldwide, Myanmar the fourth, Indonesia the seventh and Viet Nam the tenth.

Financing the SuStainable Development goalS in aSean
18
SDG 7 targets affordable and clean energy.41 Lao PDR, Myanmar and Cambodia have a high proportion of renewable energy42 in total final energy consumption (87, 79 and 73 percent respectively).43 Brunei Darussalam and Singapore have the lowest shares at 0.01 and 0.52 percent. More than half (53 percent) of ASEAN’s population primarily use clean fuels and technology for cooking.44 Lao PDR, Myanmar and Cambodia rely the least on clean fuels and technology for cooking at less than 5, 9 and 13 percent respectively. Brunei, Malaysia and Singapore both have over 95 percent population that primarily relies on clean fuels and technology in cooking.
SDG 13 is about climate action.45 Six ASEAN countries46 have had an increasing trend in emissions per unit of GDP since 1990.47 As a region, however, emissions per unit of GDP have slowly but consistently fallen since 2005. The most recent available data (2013) puts Malaysia and Viet Nam as the two heaviest emitters per capita (0.31 and 0.29 kg per unit of GDP respectively). This places them 37th and 40th internationally, although still below the world average of 0.33 kg per unit of GDP.48 The lowest regional emitter by a distance is Myanmar (0.06 kg per unit of GDP, 2012 data), placing it joint lowest in the world. The global share of emissions from ASEAN nations has increased steadily since 1990, more than doubling from 1.6 to 3.5 percent based on latest data available. The need for financing to underpin and support the transition to greener models of development is essential if ASEAN countries are to fulfil their commitments on climate action.
SDG 15 focuses on life on land. There are mixed trends in forest areas as a proportion of total land area.49 Though they are increasing overall, and the previous MDG target was met in Lao PDR, Philippines, Singapore, Thailand and Viet Nam, in five other countries forest areas are reducing. The greatest increase was in Viet Nam (30 percent in 1990 to 48 percent in 2015). The greatest decrease was in Cambodia (73 percent in 1990 to 54 percent in 2015).
Demographic trendsDemographic trends are a powerful force that exerts strong influence over sustainable development progress.50 At over 620 million in 2014, the population of ASEAN is projected to grow and age slowly over the SDG era. People aged over 60 account for 9 percent of the population in 2015, rising to a projected
41 Data quoted in this paragraph is sourced from the UN Stats SDG Indicators Global Database, accessed June-July 2017. https://unstats.un.org/sdgs/indicators/database/
42 This indicator is from SDG 7. The target is to increase substantially the share of renewable energy in the global energy mix43 Data are for 2012 except for Lao PDR which are for 2011.44 This indicator is from SDG 7. The target is to ensure universal access to affordable, reliable and modern energy services. The
ASEAN average is comparable with the global proportion of 57.4 percent but exceeds SAARC’s value of 32.5 percent and sub-Saharan Africa’s average of 12.9 percent. However, it is significantly lower than the OECD’s value of 98.5 percent.
45 Data quoted are sourced from the UN Stats SDG Indicators Global Database, accessed June-July 2017. https://unstats.un.org/sdgs/indicators/database/.
46 Brunei Darussalam, Cambodia, Indonesia, Malaysia, Thailand and Viet Nam.47 This indicator is from SDG 13. The target is to take urgent action to combat climate change and its impacts by regulating emissions.48 Emissions among SAARC countries are 0.32 kg per unit GDP and among OECD countries 0.3 kg per unit GDP.49 This indicator is from SDG 15. The target is, by 2020, to promote the implementation of sustainable management of all types
of forests, halt deforestation, restore degraded forests and substantially increase afforestation and reforestation globally. Data quoted are sourced from the UN Stats SDG Indicators Global Database, accessed June-July 2017. https://unstats.un.org/sdgs/indicators/database/
50 UNDP, Shaping the future: how changing demographics can power human development, Asia-Pacific Human Development Report 2016, UNDP, New York, 2016. http://hdr.undp.org/sites/default/files/rhdr2016-full-report-final-version1.pdf

19
Strengthening integrated national financing frameworks to deliver the 2030 Agenda
15 percent by 2030 and 21 percent by 2050.51 The working age population is projected to remain broadly constant, from 55 percent in 2015 to 53 percent in 2050.
Yet there are divergent trends across member states (Figure 1.6). In Singapore and Thailand the population is ageing rapidly, while in Lao PDR and Myanmar among other countries young populations now mean that there will be a rising population of people of working age in years to come. Seven of the ten ASEAN countries are in the middle of a transition where the investments made now will determine the extent to which these trends offer a dividend for the future or risk popular frustration that can exacerbate instability and conflict.52
Demographic trends such as these will have a significant impact on the type and scale of finance needed to maintain and continue making progress on sustainable development outcomes. Ageing populations require greater investments in areas such as health care and pensions, while in young populations need investments now in education, skills development and the creation of jobs and markets to ensure the demographic dividend is reaped.
Figure 1.6. Some countries in the region have ageing populations, others young, growing populations
100%
80%
60%
40%
20%
0%2015 20502030 2015 20502030 2015 20502030 2015 20502030 2015 20502030
ASEAN Thailand Singapore Lao PDR Malaysia
0-14 15-64 65+
Source: UN DESA Population Division
ASEAN 2025: Forging ahead together In the context of the regional sustainable development outlook, in 2015 ASEAN launched the ASEAN community vision, ASEAN 2025: Forging ahead together (herein ‘Vision 2025’). This outlines the regional vision for a peaceful, stable and resilient community and pledges the 10 member states to “realise a rules-based, people-oriented, people-centred ASEAN of ‘One Vision, One Identity, One community’”.53 Building on recent successes such as the formal establishment of the ASEAN community at the end of 2015, it commits to increasing integration, enhanced connectivity and strengthened efforts to narrow the development gap between members.
51 Source: UN DESA, World Population Prospects. https://esa.un.org/unpd/wpp/52 UNDP, Shaping the future: how changing demographics can power human development, Asia-Pacific Human Development Report
2016, UNDP, New York, 2016. http://hdr.undp.org/sites/default/files/rhdr2016-full-report-final-version1.pdf 53 The ASEAN Secretariat, ASEAN 2025: Forging Ahead Together, The ASEAN Secretariat, Jakarta, 2015, page 17. http://www.asean.
org/storage/2015/12/ASEAN-2025-Forging-Ahead-Together-final.pdf

Financing the SuStainable Development goalS in aSean
20
Vision 2025 is structured around three communities: the ASEAN Security-Political Community, ASEAN Economic Community (AEC) and ASEAN Socio-Cultural Community. Blueprints for each community set out the objectives and strategic measures to achieve them. These blueprints are supported by sectoral bodies which are responsible for operationalising the strategic measures within them. Cross-pillar and cross-sectoral coordination strategies are used for measures that cut across the ASEAN Socio-Cultural Community and AEC or the ASEAN Security-Political Community. Across the three communities of the vision there are 14 characteristics, 59 elements and results areas, and 561 strategic measures. There are strong complementarities between Vision 2025 and the 2030 Agenda, which are acknowledged in the vision.
The ASEAN Socio-Cultural Community blueprint 2025 outlines a vision for a community that engages and benefits its people, upheld by the principles of good governance. It has five key characteristics: engages and benefits its people, and is inclusive, sustainable, resilient and dynamic. Within these characteristics lie a wide range of results areas that relate to the dimensions of sustainable development.
The AEC was established at the end of 2015, following an agreement made 12 years earlier in the Bali Concord II and a blueprint agreed in 2007. Its establishment created a single market and production base: enabled the free flow of goods, services, investment, capital and skilled labour: and covered aspects such as common frameworks and standards in sectors, competition policy and consumer protection.
The ‘AEC Blueprint 2025’ outlines the vision for the AEC in the first 10 years following its establishment. It includes five characteristics: 1) a highly integrated and cohesive economy, 2) a competitive, innovative, and dynamic ASEAN; 3) enhanced connectivity and sectoral cooperation; 4) a resilient, inclusive, people-oriented and people-centred ASEAN; and 5) a global ASEAN.
The economic objectives of the AEC are to create a more integrated regional economy that supports sustained and inclusive economic growth which narrows the development gap, ends poverty and maintains a rising middle class. The fourth characteristic of the AEC is building a resilient, inclusive, people-oriented and people-centred ASEAN. This includes strategic measures related to strengthening the role of micro, small and medium enterprises; strengthening the role of the private sector; and using of PPPs as a tool to strengthen economic and social development. It also includes objectives on narrowing the development gap, which focus on the CLMV countries through the Initiative for ASEAN Integration policy.
This policy, also known as the ‘Narrowing the Development Gap’ policy, is designed to support the region’s four poorest members – the CLMV countries – to integrate into the ASEAN community and expedite progress toward the objectives of Vision 2025. The other six ASEAN countries and the ASEAN dialogue partners provide support through research, training policy and implementation assistance.
Vision 2025 and the 2030 Agenda
There are significant parallels and common priorities between the ASEAN regional Vision 2025 and the global 2030 Agenda and its results framework, the SDGs.54 These parallels exist in both the principles and overarching objectives of each agenda, and at the level of specific goals and targets. There is a common drive toward balanced economic, social and environmental development. The people-centric approach to Vision 2025, outlined in the ASEAN Socio-Cultural Community blueprint, complements the cross-cutting emphasis on leaving no one behind in the 2030 Agenda. Both agendas emphasise resilience as
54 UNESCAP, ‘Statement at the Developing Complementarities between the 2030 United Nations Agenda for Sustainable Development and the ASEAN Community Vision 2025’, delivered at UNHQ, New York. http://www.unescap.org/ru/node/13627

21
Strengthening integrated national financing frameworks to deliver the 2030 Agenda
a cross-cutting theme and outline steps to move toward sustainable consumption and production. The development of regional and trans-border infrastructure called for by the SDGs aligns closely with the ASEAN drive toward greater connectivity and infrastructure. Beyond these examples of alignment in the agendas themselves, there is commonality in several priority actions – such as improving and harmonising data systems, promoting regional integration and investing in environmental infrastructure. Finally, both agendas recognize the cross-cutting nature of many sustainable development priorities and the need therefore for integrated solutions in response.
Sustainable development challenges and policy prioritiesThe sustainable development outlook for the ASEAN region is mixed, with strong positive trends sitting alongside significant outstanding challenges. The pace of progress will need to be maintained and expedited in some areas if the region is to achieve the SDGs. In particular, realising the vision of leaving no one behind will require substantial concurrent progress across a range of connected areas for the poorest and most vulnerable people.
The pace of progress in reducing extreme poverty has been a key success for ASEAN countries, though vulnerability remains high and there are many working ‘poor or near-poor’. The middle class is growing though many people face limited access to services – being too wealthy to meet the criteria for interventions designed for the very poorest but not wealthy enough to afford paid-for services in a context of rising prices. In nutrition and aspects of health and education the region lags behind others.
While economic growth has been an important driver of progress, many countries are at key junctures in their economic development paths. How far countries such as Thailand succeed in escaping the middle-income trap or CLMV countries develop higher value-added economic activities, and the manner in which this is achieved, will have a significant bearing on the sustainable development results the region is able to realize. Demographics will also affect ASEAN’s sustainable development progress. For younger populations the rising numbers of people of working age in coming years could spur on innovation and development, or exacerbate tensions. For ageing populations rising dependency ratios will place rising demands on healthcare, pensions and related services.55 ASEAN is also among the most disaster-prone regions of the world and the impact of climate change and natural disasters disproportionately affects the poorest people, and can derail progress more widely.
Finally, there is greater recognition of the interconnectedness of this agenda. This means that progress in areas such as gender equality can stimulate progress in others such as health, nutrition and education. But the reverse is also true – lack of progress in some areas will hold back advances in others. Such interconnected challenges require a holistic policy and finance response to advance on multiple fronts concurrently.
Finance is critical to addressing many of these issues. Getting the right mix and sequence of finance will be essential for making the investments and delivering the spending and services needed to address these challenges. The following chapters analyse the finance landscape across the region before assessing the policy and institutional structures that governments use to address the challenges and opportunities to finance progress.
55 UNDP, Shaping the future: how changing demographics can power human development, Asia-Pacific Human Development Report 2016, UNDP, New York, 2016. http://hdr.undp.org/sites/default/files/rhdr2016-full-report-final-version1.pdf

Financing the SuStainable Development goalS in aSean
22
PART II: FINANCING OPPORTUNITIES AND CHALLENGES
Chapter 2: The finance outlookCountries across the region have made substantial progress across many areas of the 2030 Agenda – yet the scale of the challenges ahead is significant. Finance of all types – public and private, domestic and international – will be critical in driving forward the investments, spending and service delivery through which countries will address these challenges.
This chapter presents an overview of the finance landscape across the region and the diversity of contexts that the 10 ASEAN member states face individually. It outlines key ongoing and future trends, unpacks the complex mix of resources and finance modalities at work in the region and analyses the policy challenges and opportunities faced by its countries. Building on the analysis of the sustainable development outlook in chapter 1, this analysis will feed into later discussion about how governments can strengthen their policy and institutional structures to mobilize the necessary scale, mix and sequence of resources to achieve the SDGs.
Regional finance trendsThe overall volume of resources available in the ASEAN region is growing rapidly. Total finance grew from an estimated $855 billion in 2007 to $1.3 trillion in 2015. All major forms of financing have grown in aggregate across the ASEAN region (Figure 2.1), with domestic resources growing particularly rapidly. Domestic public and private finance grew by around $200 billion each between 2007 and 2015.
Rapid growth in finance highlights the potential to drive sustainable development progress
2005 2006 2007 2008 2009 2010 2011 2012 2013 2014 2015
700
600
500
400
300
200
100
0
US$ b
illio
ns
Domestic public
Domestic private
International public
International private
Source: Authors calculations based on national and international sources. See Annex, data notes
Notes. All figures are constant 2015 US dollars prices.
23
Strengthening integrated national financing frameworks to deliver the 2030 Agenda
This growth in the finance available offers significant potential to drive regional progress toward Vision 2025 and the SDGs – if it can be mobilized and channelled in ways that will yield sustainable development results. Domestic public finance, for example, grew from an average $700 per person in 2007 to $940 per person in 2015, yielding additional resources for governments to invest in services and infrastructure that can drive social, environmental and economic progress. Anticipated future growth in investment from China will offer significant additional funds for infrastructure in particular (see chapter 4).
Yet more finance brings more complexity. There is a growing array and diversity of finance instruments, mechanisms and actors at work across the region, all of which could contribute to sustainable development progress – or detract from it. These trends amplify the need for governments to develop coordinated approaches to stimulating impact from all resources, through the institutions they establish and policies they deploy. It heightens the need for integrated frameworks that stimulate the investments that can unlock and accelerate progress, alongside the spending that supports it and underpins service delivery.
Within the region, the challenges and opportunities faced at the national level vary from country to country. The total volume of resources ranges from less than $1,000 per person each year in Cambodia to over $20,000 in Singapore. In four of the ten countries domestic private finance is increasing most rapidly,56 in another four international private finance is and in two domestic public finance is.
Unpacking resources into individual flows (Figure 2.2), domestic public finance is the largest resource flow for the region, accounting for almost a third (32 percent) of all finance in 2015. Next comes domestic commercial investment, which accounts for 31 percent. Yet this mix varies significantly: among CLMV countries, domestic private finance accounts for only just over one fifth of finance while government revenues account for 38 percent of financing. FDI actually accounts for a higher proportion of total finance in CLMV countries than others in the region, at 16 percent of the total in 2015 compared with 9 percent. Beyond these volumes of finance, the impact varies widely.
56 Defined in absolute terms, that is, the resource type that increased by the largest amount (as opposed to that which increased by the greatest proportion). The four countries where domestic private finance accounts for the largest proportion of overall growth in financing are Brunei Darussalam, Indonesia, Lao PDR and the Philippines; the four where it is international private finance are Cambodia, Malaysia, Singapore and Viet Nam; and the two where it is domestic public finance are Myanmar and Thailand.

Financing the SuStainable Development goalS in aSean
24
The mix of resources varies widely in the region
100%
80%
60%
40%
20%
0%2005 2010 2015
100%
80%
60%
40%
20%
0%2005 2010 2015
100%
80%
60%
40%
20%
0%2005 2010 2015
ASEAN
Domestic public39%
Private borrowing
(intl)
FDI
Revenue
Internationalpublic
7%
Internationalprivate22%
Public borrowing (domestic)
Commercial investment
ODAOOFs
Public borrowing(intl)
Remittances
32%
Domestic private
Total resources 2015: $2,138 per person
Total resources 2015: $940 per person
Total resources 2015: $2,149 per person
CLMV
Domestic public36%
Private borrowing
(intl)
FDI
Revenue
22%Domestic private
Internationalpublic
7%
Internationalprivate35%
Commercial investment
ODAOOFs
Public borrowing(intl)
Remittances
Portfolio equity
ASEAN-5
Domestic public39%
Private borrowing
(intl)
FDIRevenue
Public borrowing (domestic)
Internationalpublic
8%
Internationalprivate18%
Commercial investment
ODAOOFs
Public borrowing(intl)
Remittances
35%
Domestic private
Source: Authors calculations based on national and international sources. See Annex, data notes
Notes. All figures are constant 2015 US dollars prices.

25
Strengthening integrated national financing frameworks to deliver the 2030 Agenda
Domestic public financeDomestic revenues are rising across the region (Figure 2.3), though remain low in absolute terms in some countries.57 Revenues per person are rising at more than 10 percent a year on average in three countries58 and at 3 percent or higher in another five. Proportionally, the fastest growth is in some of the countries where levels are lowest: government revenue per person has almost tripled in Cambodia and Lao PDR since 2005.
Yet the countries where revenues are already highest are making the largest absolute gains: Malaysia, Thailand and Singapore have each increased government revenues by more than $400 per person since 2005 – an increase greater than the annual revenues per person in three countries59 in 2015.
Rising government revenues create fiscal space for services and public investment – though the pace of change varies widely between countries
2000 2005 2010 2015
2,000
1,500
1,000
500
0
US$ p
er p
erso
n
Malaysia
Thailand
Indonesia
Lao PDRViet Nam
MyanmarCambodia
Philippines
Source: Authors calculations based on national and international sources. See Annex, data notes
Notes. All figures are constant 2015 US dollars prices. All figures are total government revenues excluding grants (and financing). Singapore and Brunei are not included.
Rising revenues mean greater scope for governments to provide services, invest in infrastructure (alongside other finance instruments) and stimulate private sector development that can impact the lives and environments of their citizens. Thailand introduced a universal health coverage programme in 2002 that has improved access to health care and contributed to improving health across the country. The Philippines has not reached universal health coverage yet but introduced earmarked taxes designed to increase health financing in 2012 (see chapter 5).60
57 There is insufficient data to analyse trends in domestic revenues in Brunei Darussalam so this point refers to the other nine countries.
58 Cambodia, Lao PDR and Myanmar: measured over 2005–2015 for Cambodia and Lao PDR and 2011–2015 for Myanmar (given data availability).
59 Total revenues were less than $400 per person in Cambodia, Lao PDR and Myanmar in 2015.60 85 percent of revenues go toward funding universal health care, upgrading medical facilities and training medical professionals.
The remaining 15 percent goes toward programmes designed to help tobacco farmers find alternative livelihoods.

Financing the SuStainable Development goalS in aSean
26
While revenues are rising, they remain low in many countries – less than $600 per person in six.61 To give a sense of these figures, average government revenues per person of $940 across the ASEAN region compare with over $15,000 per person62 in high-income countries. So while fiscal space is growing, it is still limited in many contexts and constrains service provision and public investment (often alongside other constraints such as capacity and skills shortages).
The question of what is driving this growth in revenues – the model of taxation and other revenues the government uses – is an important one. Different tax systems have implications for both sustainability and the potential for future rises in revenue, and for their distributional impacts in society.
Tax revenues are composed very differently across the region (Figure 2.4). Direct taxes range from over half of total revenue in Singapore (57 percent in 2015) and Malaysia (51 percent) to less than a fifth in Myanmar (14 percent) and Viet Nam (6 percent). Indirect taxes account for over 40 percent of total revenues in four countries.63 Direct taxes are levied on income or profits and therefore can be more progressive as people are taxed according to their ability to pay. Meanwhile indirect taxes are levied on goods and services and can be more regressive as they relate to the price of the good or service – though this depends crucially on how they are structured and which basic goods are excluded.64 Indirect taxes are also often viewed as quicker wins because they do not require as comprehensive an infrastructure to establish and enforce as direct taxes.
Natural resource revenues account for over 10 percent of total revenue in Viet Nam and 6 percent in Indonesia. In Myanmar taxes related to oil, energy, minerals and mines account for almost a third of total revenues in 2015 (though these taxes cut across the categories displayed in Figure 2.4).
Grants account for an important part of overall revenue in Lao PDR and Cambodia, at 22 percent and 12 percent of total revenue in 2015 respectively. In Cambodia international public finance plays is vital in supporting public investment – over 70 percent of public capital expenditure in 2015 was funded internationally.
The drivers of rising overall domestic revenues also vary from country to country, with indirect taxes accounting for the largest proportion of new tax revenue between 2005 and 2015 in Cambodia, Lao PDR and Thailand (Figure 2.4). In Indonesia, Malaysia and Singapore direct taxes were the largest contributor to overall increases.
61 These six countries are: Cambodia (government revenues equivalent to $210 per person in 2015), Indonesia ($505), Lao PDR ($330), Myanmar ($210), Philippines ($495) and Viet Nam ($490). All figures exclude grants, are in constant 2015 US$ prices and are rounded to the nearest $5.
62 In PPP$. Development Initiatives, Investments to End Poverty 2015, Development Initiatives, 2015. http://devinit.org/post/investments-to-end-poverty-2015/
63 These countries are Lao PDR (41 percent), Cambodia (48), Thailand (45) and Philippines (44).64 It is also true that some taxes, such as certain trade taxes, can be a combination of both direct and indirect taxes – the level
of detail reported varies from country to country.

27
Strengthening integrated national financing frameworks to deliver the 2030 Agenda
Figure 2.4. The drivers of rising revenue differ from country to country
Cambodia Lao PDR Thailand
2005
0% 50% 100%
2015
2005
0% 50% 100%
2015
2005
0% 50% 100%
2015
Indonesia Malaysia Singapore
2005
0% 50% 100%
2015
2005
0% 50% 100%
2015
2005
0% 50% 100%
2015
Myanmar Philippines Viet Nam
2005
0% 50% 100%
2015
2005
0% 50% 100%
2015
2005
0% 50% 100%
2015
Malaysia
Thailand
Indonesia
Lao PDRViet Nam
MyanmarCambodia
Philippines
In Cambodia, Lao PDR and Thailand, growth in indirect taxes is driving overall gains in domestic revenue mobilization
In Indonesia, Malaysia and Singapore growing revenue from direct taxes accounts for the largest proportion of rising overall revenues
In Myanmar and the Philippines revenues are rising across direct and indirect taxes, while in Viet Nam other revenue is driving overall gains
Direct tax Indirect tax Other taxes
Subnational tax Non-tax revenue Natural resource revenue
SEEs Other revenue Grants
Source: Authors calculations based on national and international sources. See Annex, data notes
Notes: Natural resource revenue is not always separated from the other categories of revenue – this is the case in Myanmar. SEEs: state economic enterprises. Insufficient data available to calculate comparable statistics for Brunei Darussalam, Myanmar or Singapore.

Financing the SuStainable Development goalS in aSean
28
Looking ahead, reforms and new opportunities may offer potential for higher rates of growth in revenue, but there are challenges to be addressed. For example, in Indonesia tax reforms coupled with an amnesty programme designed to encourage the repatriation of capital as well as business formalization are going some way toward addressing structurally low tax revenues, but further reforms are likely needed. In Cambodia a new law65 was designed to close tax loopholes and strengthening the revenue authority is a central pillar of the country’s revenue mobilization strategy (see chapter 5). But significant revenue gains will be needed to move beyond most public capital expenditure being funded from international sources. In Lao PDR hydropower offers the potential to increase revenue in the future. To maximise their impact, effective governance structures must be in place to manage and invest the proceeds of these revenues.
Beyond revenues, governments borrow to make up the deficit between income streams and spending. Borrowing is a core part of most public finance models in the region, accounting for at least 10 percent of the budget in six ASEAN countries since 2005 on average (Figure 2.5), though with significant fluctuations year on year in most countries. Borrowing enables governments to make investments that would otherwise take longer to fund, working on the basis that greater public investment stimulates development that will generate returns that can be used to repay debts. Many governments have regulated limits to how much they can borrow. Following the East Asian financial crisis in the late 1990s some countries such as Thailand have also emphasized borrowing from domestic sources over international sources to mitigate currency risks.
Governments should assess the long-term prospects for increased revenue mobilization and ask whether their tax and financing systems can provide the resources needed to support the public investments they need to yield the sustainable development results they are striving toward.
Tax Inspectors Without Borders
Tax Inspectors Without Borders66 (TIWB) is a joint initiative between the OECD and UNDP. Launched in July 2015, it seeks to support developing country taxation administrations in developing tax audit expertise and skills, aiming to assist in building administrative capacity through improving the quality and consistency of audits. TIWB offers two main programmes. The full programme involves experts working with local officials directly on current audits and audit-related issues while a partial programme, for those countries not yet ready to adopt the complete partnership agreement, organises technical workshops to provide expert advice on anonymous company audits. By April 2017, 3 TIWB programmes had been completed, 21 were
65 The 2016 Law on Financial Management66 See http://www.tiwb.org/
Figure 2.5. Borrowing is a major source of finance for most governments
Borrowing as % total public �nance0% 5% 10% 15% 20% 25%
Cambodia
Malaysia
Philippines
Lao PDR
Viet Nam
Indonesia
Myanmar
Source: National sources and International Monetary Fund Article IV assessments
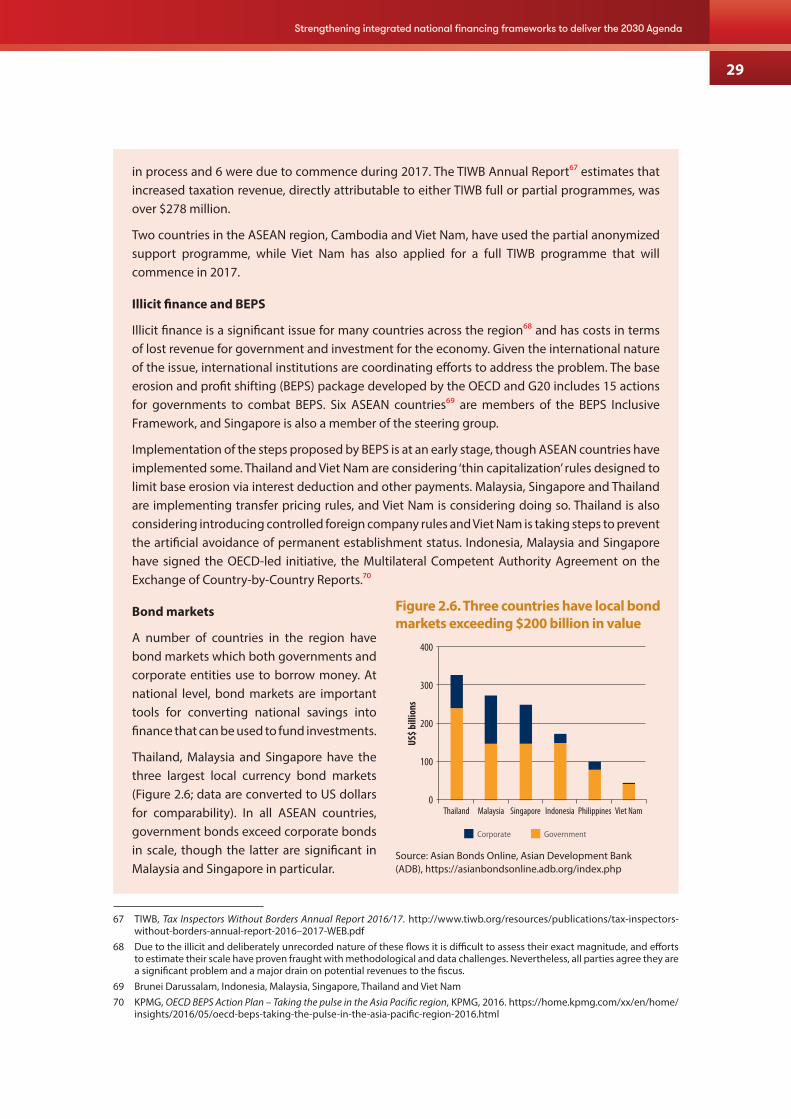
29
Strengthening integrated national financing frameworks to deliver the 2030 Agenda
in process and 6 were due to commence during 2017. The TIWB Annual Report67 estimates that increased taxation revenue, directly attributable to either TIWB full or partial programmes, was over $278 million.
Two countries in the ASEAN region, Cambodia and Viet Nam, have used the partial anonymized support programme, while Viet Nam has also applied for a full TIWB programme that will commence in 2017.
Illicit finance and BEPS
Illicit finance is a significant issue for many countries across the region68 and has costs in terms of lost revenue for government and investment for the economy. Given the international nature of the issue, international institutions are coordinating efforts to address the problem. The base erosion and profit shifting (BEPS) package developed by the OECD and G20 includes 15 actions for governments to combat BEPS. Six ASEAN countries69 are members of the BEPS Inclusive Framework, and Singapore is also a member of the steering group.
Implementation of the steps proposed by BEPS is at an early stage, though ASEAN countries have implemented some. Thailand and Viet Nam are considering ‘thin capitalization’ rules designed to limit base erosion via interest deduction and other payments. Malaysia, Singapore and Thailand are implementing transfer pricing rules, and Viet Nam is considering doing so. Thailand is also considering introducing controlled foreign company rules and Viet Nam is taking steps to prevent the artificial avoidance of permanent establishment status. Indonesia, Malaysia and Singapore have signed the OECD-led initiative, the Multilateral Competent Authority Agreement on the Exchange of Country-by-Country Reports.70
Bond markets
A number of countries in the region have bond markets which both governments and corporate entities use to borrow money. At national level, bond markets are important tools for converting national savings into finance that can be used to fund investments.
Thailand, Malaysia and Singapore have the three largest local currency bond markets (Figure 2.6; data are converted to US dollars for comparability). In all ASEAN countries, government bonds exceed corporate bonds in scale, though the latter are significant in Malaysia and Singapore in particular.
67 TIWB, Tax Inspectors Without Borders Annual Report 2016/17. http://www.tiwb.org/resources/publications/tax-inspectors-without-borders-annual-report-2016–2017-WEB.pdf
68 Due to the illicit and deliberately unrecorded nature of these flows it is difficult to assess their exact magnitude, and efforts to estimate their scale have proven fraught with methodological and data challenges. Nevertheless, all parties agree they are a significant problem and a major drain on potential revenues to the fiscus.
69 Brunei Darussalam, Indonesia, Malaysia, Singapore, Thailand and Viet Nam70 KPMG, OECD BEPS Action Plan – Taking the pulse in the Asia Pacific region, KPMG, 2016. https://home.kpmg.com/xx/en/home/
insights/2016/05/oecd-beps-taking-the-pulse-in-the-asia-pacific-region-2016.html
Figure 2.6. Three countries have local bond markets exceeding $200 billion in value
Source: Asian Bonds Online, Asian Development Bank (ADB), https://asianbondsonline.adb.org/index.php
400
300
200
100
0
Corporate Government
MalaysiaThailand Indonesia Viet NamSingapore Philippines
US$ b
illio
ns

Financing the SuStainable Development goalS in aSean
30
External debt stocks range, as a proportion of national income, from 22 percent of GNI in the Philippines to 99 percent in Lao PDR (Figure 2.7). The public sector is a key borrower in all ASEAN countries, with liability71 for more than half of outstanding external debt in five countries.72 Private non-guaranteed debt accounts for 30 to 40 percent of debt stock in four countries73 but is lower in other ASEAN countries (excluding Singapore and Brunei, for which data are unavailable). Short-term debt is significant in Thailand and Malaysia, where financial markets are more developed, accounting for 40 percent of total external debt stock in both countries.
Figure 2.7. The size and mix of external debts vary widely in the region
Short-term debt PNG PPG
125%
100%
75%
50%
25%
0%Indonesia Cambodia Malaysia Thailand Viet NamLao PDR Philippines
% G
NI
Source: World Bank International Debt Statistics
Notes: PNG = private non-guaranteed debt; PPG = public and publicly guaranteed debt
Domestic and international private financeThe contribution of private finance – domestic commercial investment, FDI, portfolio investment, private borrowing74 and remittances – to sustainable development outcomes is critical through both the investments and recurrent spending it supports. Commercial actors small and large are a key part of all ASEAN economies and how they create jobs, develop skills, treat the environment, drive innovation and stimulate growth affect the development paths that countries ultimately follow. Philanthropic organizations play a critical role in providing services and as advocates for the poorest and most vulnerable communities, people and environments. Migrant workers and the remittances they send are vital for many communities across the region. Understanding the scale and nature of private financing is critical for considering the role that different private actors can play and, from the perspective of government, what partnerships, policies and interventions are needed to realize those roles.
Across the region, private investment is rising, having doubled in real terms from $305 billion in 2005 to $609 billion in 2015 (Figure 2.8). This is equivalent to an increase from around 14 percent of regional income in 2004 to 22 percent in 2015.75
71 The data show public or publicly guaranteed external debt meaning that the public sector is not always the borrower, but has at least provided a guaranteed of repayment.
72 Cambodia (59 percent of total), Indonesia (52), Lao PDR (58), Myanmar (86) and Viet Nam (60).73 Lao PDR (36 percent), Thailand (36), Indonesia (35) and the Philippines (33).74 Comprehensive data are only available for private borrowing from international sources, see Annex, data notes.75 Calculated as total private investment for the region as a whole divided by the sum of GNI for all countries in the region.

31
Strengthening integrated national financing frameworks to deliver the 2030 Agenda
At the national level the picture is mixed. Five countries have seen rises equivalent to a five percentage-point increase in national income or more while in two countries, private investment has increased by more than 10 percentage points. One of these, Indonesia, experienced very rapidly rising investment levels from the late 2000s, with total private investment rising from less than $100 billion a year before 2008 to more than $200 billion a year in 2012. Since then this growth has slowed, though investment levels remain high at over $240 billion in 2015, or around 28 percent of GDP.
In other countries, investment levels are growing in absolute volume but have plateaued relative to the economy. In Thailand private investment has been between 16 and 21 percent of GDP every year since 2005. In Viet Nam, it has remained relatively consistent in absolute terms at around $32 billion to $39 billion a year since 2007,76 but has fallen as a proportion of rising national incomes.
Lao PDR and Myanmar have had fluctuating levels of private investment; both have seen two periods of high investments. In Myanmar there were two years of extraordinary FDI in 2006 and 2010 linked to major investments in power and oil/gas respectively. In Lao PDR domestic and foreign private investment rose sharply up to 2007 before falling and then rising again in 2012.
Figure 2.8. Trends in private investment vary widely from country to country
2000 2005 2010 2015 2000 2005 2010 2015
2000 2005 2010 2015 2000 2005 2010 2015
ASEAN CLMV countries
%GDP (left axis)
USD billions (right axis)
Cambodia
Lao PDR
% G
DP
cons
tant
US$
bill
ions
30%
20%
10%
0%
750
500
250
0
% G
DP
50%
40%
30%
20%
10%
0%
Myanmar
Viet Nam
Singapore and Brunei Darussalam
Brunei Darussalam
Singapore
% G
DP
50%
40%
30%
20%
10%
0%
ASEAN-5 countries (excluding Viet Nam)
Indonesia
Malaysia
% G
DP
40%
30%
20%
10%
0%
Philippines
Thailand
Source: Authors calculations based on national and international sources. See Annex, data notes
Notes: These figures show estimates of total private investment as a proportion of GDP. This is the sum of estimates of domes-tic commercial investment (which is typically derived from gross fixed capital formation figures) and foreign direct investment; therefore all figures are capital flows. Data from some countries are partial, see Annex, data notes.
76 In two years, 2012 and 2013, it dropped to $35 billion and $37 billion respectively.
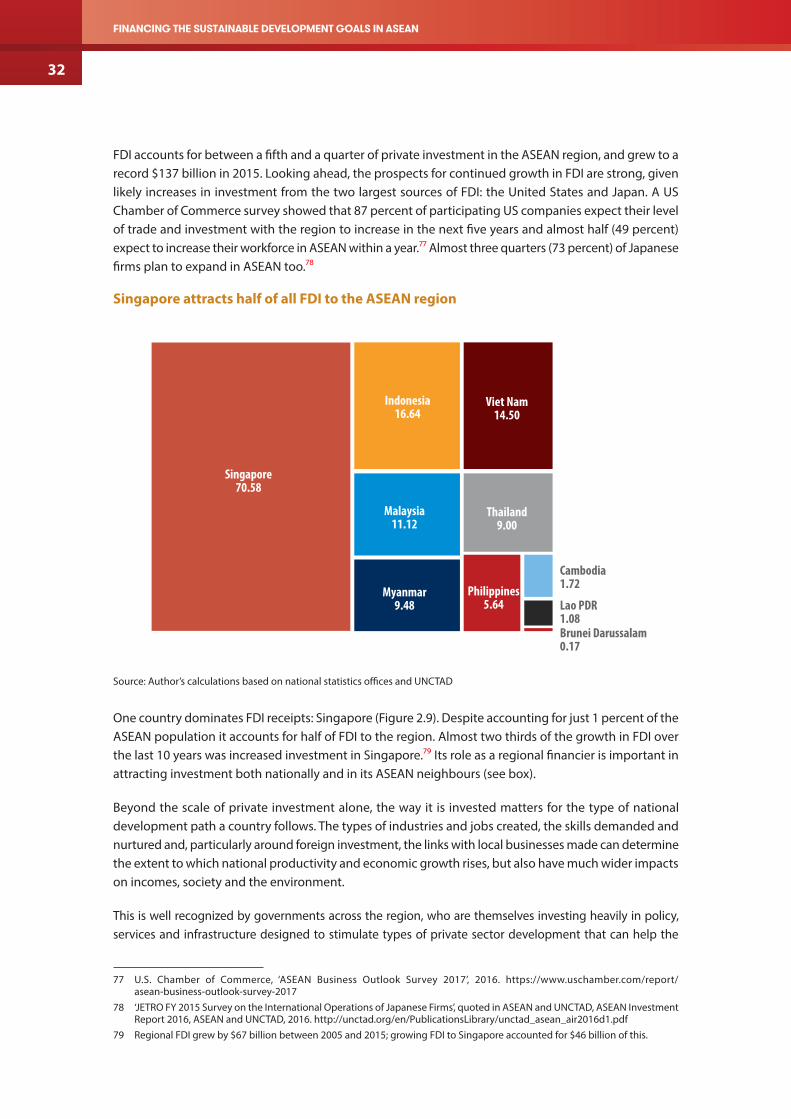
Financing the SuStainable Development goalS in aSean
32
FDI accounts for between a fifth and a quarter of private investment in the ASEAN region, and grew to a record $137 billion in 2015. Looking ahead, the prospects for continued growth in FDI are strong, given likely increases in investment from the two largest sources of FDI: the United States and Japan. A US Chamber of Commerce survey showed that 87 percent of participating US companies expect their level of trade and investment with the region to increase in the next five years and almost half (49 percent) expect to increase their workforce in ASEAN within a year.77 Almost three quarters (73 percent) of Japanese firms plan to expand in ASEAN too.78
Singapore attracts half of all FDI to the ASEAN region
Singapore 70.58
Cambodia 1.72
Lao PDR 1.08Brunei Darussalam 0.17
Philippines 5.64
Thailand 9.00
Viet Nam 14.50
Myanmar 9.48
Malaysia 11.12
Indonesia 16.64
Source: Author’s calculations based on national statistics offices and UNCTAD
One country dominates FDI receipts: Singapore (Figure 2.9). Despite accounting for just 1 percent of the ASEAN population it accounts for half of FDI to the region. Almost two thirds of the growth in FDI over the last 10 years was increased investment in Singapore.79 Its role as a regional financier is important in attracting investment both nationally and in its ASEAN neighbours (see box).
Beyond the scale of private investment alone, the way it is invested matters for the type of national development path a country follows. The types of industries and jobs created, the skills demanded and nurtured and, particularly around foreign investment, the links with local businesses made can determine the extent to which national productivity and economic growth rises, but also have much wider impacts on incomes, society and the environment.
This is well recognized by governments across the region, who are themselves investing heavily in policy, services and infrastructure designed to stimulate types of private sector development that can help the
77 U.S. Chamber of Commerce, ‘ASEAN Business Outlook Survey 2017’, 2016. https://www.uschamber.com/report/asean-business-outlook-survey-2017
78 ‘JETRO FY 2015 Survey on the International Operations of Japanese Firms’, quoted in ASEAN and UNCTAD, ASEAN Investment Report 2016, ASEAN and UNCTAD, 2016. http://unctad.org/en/PublicationsLibrary/unctad_asean_air2016d1.pdf
79 Regional FDI grew by $67 billion between 2005 and 2015; growing FDI to Singapore accounted for $46 billion of this.

33
Strengthening integrated national financing frameworks to deliver the 2030 Agenda
country move on to the next stages of its development. Many governments are targeting investment in certain industries or sectors, or encouraging investment in particular locations within the country (see chapter 5).
The industries in which FDI is concentrated differ markedly from country to country (Figure 2.10), reflecting differing stages of private sector development80 and comparative advantages. Investment in manufacturing accounts for almost 70 percent of FDI to Viet Nam, and the largest proportion of FDI to the Philippines (38 percent of total) and Indonesia (40 percent). In Brunei Darussalam and Indonesia, FDI in mining accounts for 73 and 14 percent of total FDI respectively. Indonesia is the only ASEAN country where FDI in agriculture accounts for a significant proportion of the total, 8 percent in 2015.
Figure 2.10. The nature of FDI varies widely across the region
100%
75%
50%
25%
0%
Brunei D
arussa
lam
Indonesia
Myanmar
Philippines
Viet Nam
Other
Real Estate Activities
Transport, Storage, Information, and Communications
Financial Activities
Wholesale and Retail Trade
Construction
Electricity, Gas, and Water Supply
Manufacturing
Mining
Agriculture and Livestock
Singapore
Thailand
Source: Authors calculations based on national and international sources. See Annex, data notes Note: Comparable data are unavailable for Cambodia, Lao PDR or Malaysia.
As well as the scale and type of FDI, the way that countries attract it can also affect its sustainable development impact. One important mechanism through which this occurs is the tax incentives, breaks and holidays offered to investors. These directly reduce the revenues that government receive, thereby limiting the benefit of investment on public finances and reducing the volume of funds available for public services and investment. There is evidence that much of this tax competition is harmful and unnecessary. Countries in the region regularly offer tax incentives, such as exemptions, that are among the most harmful.81 And surveys from the region and beyond show that tax is often a lower priority for determining where investors will invest than other issues such as the business environment, infrastructure, utilities and availability of skilled labour.82 Other regions around the world have developed or are developing codes of conduct to reduce the most harmful elements of tax competition and six ASEAN countries are members of the BEPS Inclusive Framework which includes actions on harmful tax practices. ASEAN could develop a region-wide code of conduct that builds on these initiatives (see recommendations).
80 One widely used classification groups countries according to whether they are largely factor driven, efficiency driven, innovation driven or wealth driven.
81 Oxfam Novib, Race to the bottom – tax incentives in South East Asia, Oxfam Novib, The Hague, 2017. https://maketaxfair.net/race-bottom-tax-incentives-south-east-asia-2/
82 Ibid. See also for example Farole T, Special Economic Zones in Africa: Comparing Performance and Learning from Global Experiences, World Bank, 2011. https://openknowledge.worldbank.org/bitstream/handle/10986/2268/600590PUB0ID181onomic09780821386385.pdf?sequence=1&isAllowed=y; Asian Development Bank, The Role of Special Economic Zones in Improving Effectiveness of GMS Economic Corridors. 2013, Asian Development Bank, Mandaluyong City, Philippines, 2016. https://www.adb.org/sites/default/files/institutional-document/214316/role-sez-gms.pdf; and UN Industrial Development Organization, Africa Investor Report 2011: Toward evidence-based investment promotion strategies, UNIDO, 2011. https://www.unido.org/fileadmin/user_media/Publications/Pub_free/AIS_Report_A4.pdf

Financing the SuStainable Development goalS in aSean
34
Intra-regional investment
Intra-regional investment is growing. It grew from $16 billion in 2010 to $24 billion in 2016, also rising as a proportion of total FDI from 15 to 25 percent over the same period.
Singapore is the largest source of intra-regional investment followed by Malaysia (Figure 2.11). Singapore accounted for over two thirds of intra-regional FDI in 2015, some $14.5 billion. Malaysian investment in other ASEAN countries totalled $3.5 billion, 16 percent of the total.
Singapore is the largest ASEAN investor in six of the other nine countries; only in Lao PDR and Cambodia are its investment levels low. In Myanmar, Indonesia and Brunei Darussalam it is the largest investor of any country, accounting for 55, 53 and 31 percent of total FDI respectively. Malaysia is the largest ASEAN investor in Viet Nam, as well as in Singapore. Thailand, the third largest source of intra-regional FDI, is a major investor in Myanmar, with FDI totalling $538 million in 2015.
Figure 2.11. Singapore is the largest intra-regional investor in six other countries
Brunei
Cambodia
Indonesia
Lao PDR
Malaysia
Myanmar
Philippines
Singapore
Thailand
Viet Nam
0% 25%% of intra-regional FDI
50% 75%
55%
25%
55%
21%
24%
79%
1%
4%
18%
19%
Intra-regional FDI, % total
100%
Brunei DarussalamMalaysia
CambodiaMyanmar
IndonesiaPhilippines
Lao PDRSingapore
ThailandViet Nam
Source: Author’s calculations based on ASEAN Statistics; data are for 2015.

35
Strengthening integrated national financing frameworks to deliver the 2030 Agenda
Remittances
The Philippines is the largest recipient of remittances
Philippines 25.61
Cambodia 0.3Lao PDR 0.09
Thailand2.93
Viet Nam13.00
Myanmar3.24
Malaysia2.20
Indonesia 9.42
Source: National sources and World Bank; data are for 2015. Note: Data are unavailable for Brunei Darussalam and Singapore.
Remittances are an important part of the financing landscape in various ASEAN countries. The Philippines is the largest recipient (Figure 2.12), with remittances totalling $25.6 billion in 2015, almost double the volume of the second largest recipient, Viet Nam. In the Philippines remittances account for 17 percent of total finance while in Myanmar they account for 13 percent and in Viet Nam 12 percent.
Intra-regional flows totalled an estimated $9.1 billion in 2015 and follow a different pattern. Indonesia is the largest recipient with intra-regional remittances totalling an estimated $2.7 billion, followed by the Philippines and Myanmar at $1.85 billion and $1.83 billion respectively.
Intra-regional remittances flow through many different ‘corridors’ (Figure 2.13). Four exceeded $1 billion in 2015 and a further eight exceeded $100 million. Yet the cost of sending remittances through these corridors varies widely – from less than 5 percent in five of the 15 most-used corridors to more than 10 percent in another three.

Financing the SuStainable Development goalS in aSean
36
Figure 2.13. The cost of sending remittances within ASEAN varies widely
Malaysia – IndonesiaThailand – Myanmar
Malaysia – PhilippinesSingapore – Malaysia
Malaysia – ThailandSingapore – Indonesia
Thailand – CambodiaCambodia – ThailandBrunei D. – Thailand
Cambodia – Viet NamMalaysia – Viet Nam
Singapore – ThailandIndonesia – ThailandMalaysia – Myanmar
Singapore – Philippines
Cost of sending (%) US$ billions15% 10% 5% 0% 0 0.5 1.0 1.5 2.0 2.5
Source: World Bank Migration and Remittances Factbook; Remittance Prices Worldwide website. Data accessed July 2017.
Notes: Blanks on the left-hand side of the graph mean no data is available.
International public finance
International public finance plays an important role supporting countries across the region in various ways. It still provides important volumes of financing in some contexts: for example in Lao PDR international grants account for a significant proportion of total revenue while in Cambodia over 70 percent of public capital investment is funded internationally. In general it is declining as a proportion of total finance, though international financing in key areas such as vaccinations remains important for many countries. Many donors are playing a more catalytic role, for example in providing technical expertise, transferring technology or knowledge and financing pilot projects, for instance UNDP is helping promote energy efficiency in a commercial buildings programme in Thailand.83
While declining as a proportion of total financing, the volume of international public finance is on an upward trend. Official development assistance (ODA) and other official flows (OOF) are rising (Figure 2.14), while the growth of South-South cooperation and climate finance, and the emergence of new development finance institutions are opening the door to further increases in the future. ODA rose from $7.7 billion in 2005 to a peak of $13.6 billion in 2013, falling to $10.1 billion in 2015. This peak and subsequent fall relates to Myanmar: ODA rose from less than $500 million a year before 2013 to over $4 billion in 2013.
OOF rose from less than $7 billion before 2009 to $15 billion in 2015, with a significant increase of over $6 billion in 2015 to Indonesia. This means that for the first time, non-concessional finance from the donors that report their figures to the OECD exceeded concessional finance.
83 UNDP piloted a scheme that demonstrated the benefits of improving energy efficiency in commercial buildings that has since been taken up and expanded by government, who is establishing an on-budget matching fund.

37
Strengthening integrated national financing frameworks to deliver the 2030 Agenda
Beyond these flows, investment from China and institutions such as the Asian Infrastructure Investment Bank (AIIB) and New Development Bank are expected to grow and become an important source of finance, particularly for infrastructure, in the future.
ASEAN and China have committed to achieving two-way investment totalling $150 billion by 2020,84 covering a mixture of public and private finance (see chapter 3).
The AIIB has to date committed $441 million to three projects in Indonesia and is considering a $20 million project in Myanmar and a $208 million proposal from the Philippines (see chapter 2).85
Viet Nam is the largest recipient of ODA in 2015, receiving 37 percent ($3.9 billion) of the regional total (Figure 2.15). Lao PDR and Cambodia were the second and third largest; these three countries together accounted for 68 percent of ODA to the region.
Concessional loans accounted for 52 percent of ODA in 2015, followed by mixed project aid and technical cooperation at 18 and 12 percent respectively. Indonesia and Viet Nam are the largest recipients of technical cooperation. Governance and security, and education were the largest sectors for technical cooperation in the region.
Indonesia was the largest recipient of OOF in 2015, receiving 59 percent of the regional total. The Philippines and Viet Nam received $2.6 billion and $2.3 billion respectively. OOF to these three largest recipients represented 92 percent of total OOF to the region.
Distribution of ODA and OOF to ASEAN countries
L.0.09
Viet Nam2.58Lao PDR
2.03Cambodia
1.34
Philippines 2.33
Philippines 1.20
Myanmar0.44
Myanmar0.53
Thailand0.33
Malay.0.33
Thai.0.28
C.0.11
L.0.09
Indonesia 8.86
Indonesia 0.76
Malaysia0.54
Viet Nam3.89
ODA OOFs
Source: OECD DAC. Data are for 2015
84 This commitment was made at the 23rd China-ASEAN Senior Officials’ Consultations held in Guiyang, Guangxi on 19 May 2017.85 Asian Infrastructure Investment Bank website. Accessed July 2017.
International public finance is increasing
2000 2005 2010
OOF
ODA
2015
US$ b
illio
ns
20
15
10
5
0
Source: OECD DAC
Notes: figures are gross ODA excluding debt relief and gross OOF.

Financing the SuStainable Development goalS in aSean
38
Development cooperation within the region
Several ASEAN countries provide development cooperation. Thailand has the most developed programme, though Singapore, Malaysia and Indonesia all provide cooperation as well.
Following a Cabinet decision in 2003 Thailand decided to become a provider of assistance and to scale back its own receipt of concessional finance. Thai ODA has three components: soft loans disbursed through the Neighbouring Countries Economic Development Cooperation Agency; training, scholarships and other capacity building assistance through the Thailand International Cooperation Agency; and funding for international organizations. Thai ODA in 2015 totalled $79 million, of which 82 percent went to other ASEAN countries. The vast majority of finance went to neighbouring countries: $41.2 million to Lao PDR (of which $34.6 million was concessional loans) and $18.5 million to Myanmar. One explicit aim is to support the Initiative for ASEAN Integration (see chapter 1).
Singapore, Malaysia and Indonesia have all established programmes focused on human resource and capacity development. The Singapore Cooperation Programme offers training based on its own developmental experience, with a focus on support for others in the ASEAN region. Under the Initiative for Asian Integration it established training centres in Cambodia, Lao PDR, Myanmar and Viet Nam. The Malaysia Technical Cooperation Programme also focuses on technical cooperation, alongside scholarships that focus on sharing its development experience too. Part of Malaysian cooperation is also explicitly linked to the Initiative for ASEAN Integration; Malaysia provided support for 33 capacity building projects under its first work plan. Indonesia has a programme of cooperation focused on technical cooperation rooted in the Jakarta Commitment of 2009.86 A range of ministries and departments provide technical cooperation with partners in the region and beyond within a framework designed to support Southern countries to achieve ‘collective self-reliance’, and to support Indonesia’s own foreign policy objectives.87
ASEAN Infrastructure Fund
The ASEAN Infrastructure Fund is an innovative mechanism that aims to use countries’ own savings to promote infrastructure development across the region in line with the ASEAN Master Plan on Connectivity. It will issue debt that is targeted for purchase by ASEAN central banks who hold foreign exchange reserves. Following the East Asian financial crisis of the late 1990s many countries hold significant reserves, which total over $700 billion across the whole region. Currently these are largely invested outside the region, but the ASEAN Infrastructure Fund offers an avenue to use them in the region while helping meet its need for infrastructure.
The ASEAN Infrastructure Fund aims to provide loans of around $300 million a year to finance infrastructure investment projects in the transport, energy, water and sanitation, environment and rural development, and social infrastructure sectors. It is administered by the Asian Development Bank, who invested in core equity alongside ASEAN member states. The Asian Development Bank will also provide technical assistance, for example in offering due diligence support for projects and pipeline development or conducting dialogues and consultations among stakeholders for consensus building.88
86 Asia Pacific Development Effectiveness Facility, Asia-Pacific Effective Development Cooperation Report 2014, UNDP, 2014. http://www.asia-pacific.undp.org/content/rbap/en/home/library/democratic_governance/effective-dev-cooperation-report-2014.html
87 Ministry of National Development Planning/BAPPENAS and UNDP, ‘South-South and Triangular Cooperation Stocktaking and Strategic Review’, BAPPENAS and UNDP, 2014. http://www.asia-pacific.undp.org/content/dam/rbap/docs/dg/dev-effectiveness/UNDP-IDN-DG-2014-SSTC-Strategic-Review-of-Indonesia.pdf
88 Asian Development Bank, ASEAN Infrastructure Fund, 2016. https://www.adb.org/sites/default/files/publication/221281/aif-brochure-2016.pdf
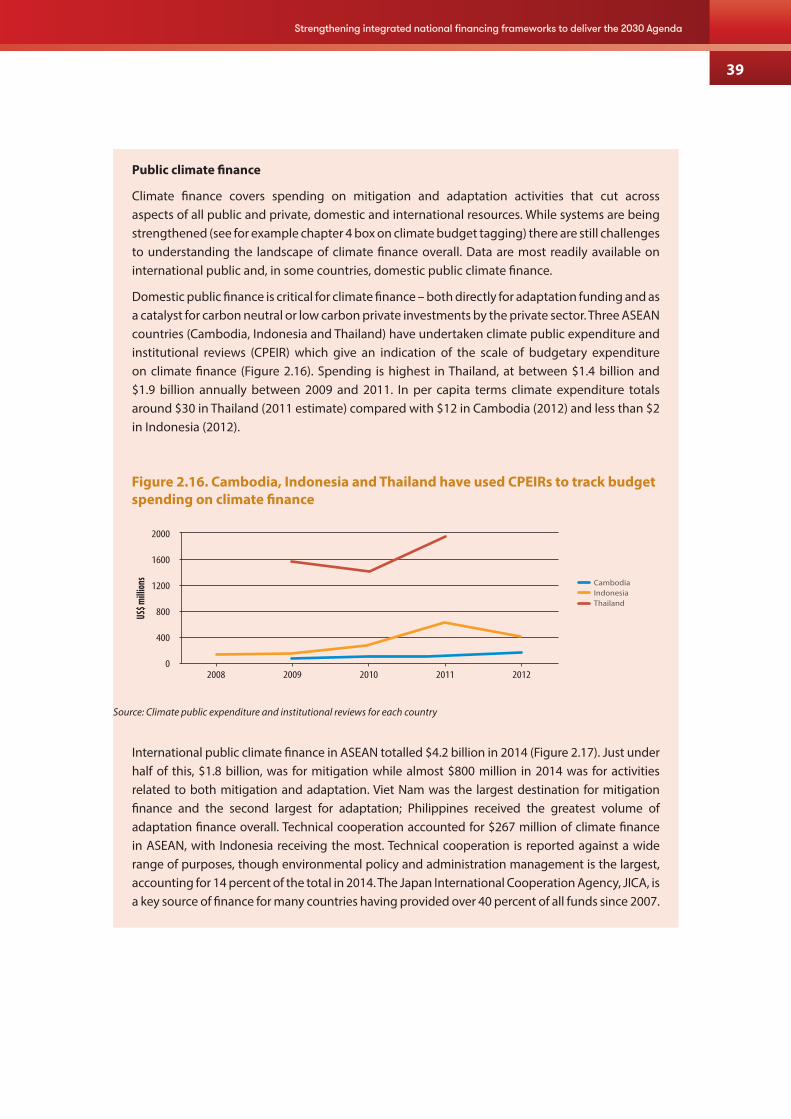
39
Strengthening integrated national financing frameworks to deliver the 2030 Agenda
Public climate finance
Climate finance covers spending on mitigation and adaptation activities that cut across aspects of all public and private, domestic and international resources. While systems are being strengthened (see for example chapter 4 box on climate budget tagging) there are still challenges to understanding the landscape of climate finance overall. Data are most readily available on international public and, in some countries, domestic public climate finance.
Domestic public finance is critical for climate finance – both directly for adaptation funding and as a catalyst for carbon neutral or low carbon private investments by the private sector. Three ASEAN countries (Cambodia, Indonesia and Thailand) have undertaken climate public expenditure and institutional reviews (CPEIR) which give an indication of the scale of budgetary expenditure on climate finance (Figure 2.16). Spending is highest in Thailand, at between $1.4 billion and $1.9 billion annually between 2009 and 2011. In per capita terms climate expenditure totals around $30 in Thailand (2011 estimate) compared with $12 in Cambodia (2012) and less than $2 in Indonesia (2012).
Figure 2.16. Cambodia, Indonesia and Thailand have used CPEIRs to track budget spending on climate finance
2008 2009 2010 2011 2012
2000
1600
1200
800
400
0
US$ m
illion
s
CambodiaIndonesiaThailand
Source: Climate public expenditure and institutional reviews for each country
International public climate finance in ASEAN totalled $4.2 billion in 2014 (Figure 2.17). Just under half of this, $1.8 billion, was for mitigation while almost $800 million in 2014 was for activities related to both mitigation and adaptation. Viet Nam was the largest destination for mitigation finance and the second largest for adaptation; Philippines received the greatest volume of adaptation finance overall. Technical cooperation accounted for $267 million of climate finance in ASEAN, with Indonesia receiving the most. Technical cooperation is reported against a wide range of purposes, though environmental policy and administration management is the largest, accounting for 14 percent of the total in 2014. The Japan International Cooperation Agency, JICA, is a key source of finance for many countries having provided over 40 percent of all funds since 2007.

Financing the SuStainable Development goalS in aSean
40
Figure 2.17. International public climate finance to the ASEAN region is rising
Both
Adaptation
Mitigation
4500
4000
3500
3000
2500
2000
1500
1000
500
02008 2009 2010 201320122011 2014
US$ m
illion
s
Source: Development Initiatives, 201689
Mobilising the right scale and mix of financing
Finance has a critical role to play in delivering the 2030 Agenda and Vision 2025 and countries will need to mobilize the right scale and mix of all resources – public and private, domestic and international – while ensuring that the synergies between them are leveraged.
The financing outlook for the region is mixed. Rapid growth in the availability of finance for the region offers significant potential to drive regional progress toward Vision 2025 and the 2030 Agenda – if it can be mobilized and channelled into investments that will yield sustainable development results.
Yet despite growth in the scale and diversity of finance available at the regional level, the picture is uneven at the country level and key finance flows remain scarce and are growing very slowly for some countries. Left unchecked, this will constrain the ability to achieve SDG results.
Low levels of domestic revenue mobilization mean governments are less able to fund services and public investment: six countries in the region raise revenues of less than $600 per person each year. In Cambodia over 70 percent of public investment is funded from international sources. Stimulating sufficient quantities of quality investment will be critical and several countries are at a juncture in their economic models as they attempt to transition to higher value-added economic structures that can help drive sustainable development progress. Using international public finance catalytically, while planning ahead for reductions in concessional finance in particular, is important for maximising its contribution.
Most of all countries must find effective ways of mobilising the right mix and sequence of all resources. This means creating mechanisms or incentives that encourage the use of public and private financing instruments according to their comparative advantages in each area of sustainable development. It means developing holistic policy that addresses the wider impacts of each type of finance – for example maximising the societal and environmental contribution of private investment beyond economic gains alone. And it means finding the mix of resources that can leverage the synergies between them. This is at
89 Climate finance and poverty, Development Initiatives, 2016. http://devinit.org/post/climate-finance-and-poverty/
41
Strengthening integrated national financing frameworks to deliver the 2030 Agenda
the instrument level, for example in mixing public and private investments during the lifecycle of a major infrastructure investment, and the macro-level, for example in using public finance to deliver the services and infrastructure that can stimulate private investment that drives green growth in key industries.
Managing finance strategies in such a way requires holistic, integrated approaches from government that address policies toward all resources in a coherent framework. The following chapter uses the lens of an integrated national financing framework to explore the policies and institutional structures that governments have in place to address the challenges and opportunities of the finance landscape and to develop approaches that generate the mix and sequence of resources that can realize the visions of the 2030 Agenda and Vision 2025.

Financing the SuStainable Development goalS in aSean
42
Chapter 3: Chinese financing and ASEANBeyond finance sourced in the ASEAN region itself, South-South finance is becoming increasingly important, particularly from China. China is an increasingly significant source of investment across the region: by some estimates its investment has grown almost 100-fold in the last 10 years.90 The relationship is set to grow and deepen further as China expands its global presence, particularly as the Belt and Road Initiative is implemented in the region.
In 2017 ASEAN and China agreed to a joint goal of reaching two-way investment of $150 billion by 2020 as well as the formulation of a joint 2030 Vision of China-ASEAN strategic partnership that deepens strategic bilateral ties and contributes toward achieving the SDGs in the region.91 In this context, and given the significant potential of a strategic scaling up in financing, this chapter explores China’s role as an investor in ASEAN to understand current patterns of Chinese investment, explore the contributions this financing can play in ASEAN’s sustainable development progress and identify ways to strengthen these contributions.92
Existing patterns of investmentChinese investment (see definition in box) in ASEAN has grown rapidly in the last 10 years, rising from $158 million in 2005 to $14.6 billion in 2015 (Figure 3.1). Levels jumped sharply in 2015, rising almost 90 percent on 2014 values. Since 2013 Chinese investment in ASEAN has exceeded investment from ASEAN in China.93 In 2015 investment in ASEAN was equivalent to 10 percent of total Chinese outward investment worldwide. The stock of Chinese investment in ASEAN rose from $1.3 billion to $63 billion between 2005 and 2015 (Figure 3.2).
Figure 3.1. Annual Chinese investment in ASEAN is increasing rapidly
Figure 3.2. The stock of Chinese investment stock is growing at pace
15.0
10.0
5.0
0.02005 2010 2015
US$ b
illio
ns
US$ b
illio
ns
80
60
40
20
0
US$ b
illio
ns
2005 2010 2015
Source: China’s Financial Support for ASEAN Sustainable Development, 2017, Shanghai Institutes for International Studies
90 Shanghai Institutes for International Studies, China’s Financial Support for ASEAN Sustainable Development, forthcoming.91 These commitments were made at the 23rd China-ASEAN Senior Officials’ Consultations held in Guiyang, Guangxi on 19 May
2017. See: ASEAN, Joint Press Briefing on the 23rd ASEAN-China Senior Officials’ Consultation (ACSOC), 19 May 2017, Guiyang, China, http://asean.org/storage/2017/05/23rd-ACSOC-Joint-Press-Briefing-Singapores-remarks-checked-against-delivery.pdf and Philippine News Agency, ‘China, ASEAN Agree to Formulate 2030 Vision to Deepen Strategic Ties’, 19 May 2017, http://news.mb.com.ph/2017/05/19/china-asean-agree-to-formulate-2030-vision-to-deepen-strategic-ties/.
92 This chapter draws heavily from the forthcoming paper China’s Financial Support for ASEAN Sustainable Development (Shanghai Institutes for International Studies), which was commissioned for the same ASEAN-China-UNDP Symposium.
93 Shanghai Institutes for International Studies, China’s Financial Support for ASEAN Sustainable Development, forthcoming.

43
Strengthening integrated national financing frameworks to deliver the 2030 Agenda
Chinese investment: a mixture of public, private and public–private investment
Chinese investment is made by a mixture of public, private and joint public–private investors. While figures specific to the ASEAN region are not available, data on Chinese investment globally shows that state-owned enterprises accounted for just over half of the total in 2015 (50.4 percent). Non-state enterprises accounted for the rest. Yet within these non-state figures are provincial collectives which are significant worldwide and likely to play a proportionally larger role in investment in ASEAN given its close geographic proximity to three provinces in particular: Guangdong, Guangxi and Yunnan. Investments by private enterprises then are a minority of overall Chinese investments worldwide and this is likely true of Chinese investments in ASEAN, though they are likely to remain significant in volume. However, there is also private involvement in the investments of state-owned enterprises and provincial collectives. The structure of over 80 percent of Chinese state-owned enterprises is one that involves both public and private financial resources and both state-owned enterprises and provincial collectives regularly engage in PPPs when investing abroad.94
As such these Chinese investments cut across the international public and private categories used elsewhere in this report though it is not possible to know the exact breakdown in the ASEAN region. This structure of Chinese investment matters when considering the role of Chinese policy toward investment in ASEAN and the rest of the world, and the influence of key Chinese policies on patterns of investment in the future.
Singapore received over 70% of Chinese investment in ASEAN in 2015
Malaysia
Thailand
Indonesia
Lao PDR
MyanmarCambodia
Singapore71%
2%
10%
3%3%
3%4%
Vietnam4%
Brunei
Philippines
0%
0%
Source: China’s Financial Support for ASEAN Sustainable Development, 2017, Shanghai Institutes for International Studies
94 Shanghai Institutes for International Studies, China’s Financial Support for ASEAN Sustainable Development, forthcoming.
Financing the SuStainable Development goalS in aSean
44
In 2015 Singapore accounted for over 70 percent of Chinese investment in ASEAN (Figure 3.3). A significant spike in investment in Singapore meant an overall increase in investment in ASEAN in 2015 – up from $2.8 billion in 2014 to $10.5 billion in 2015, though Singapore received the most Chinese investment in ASEAN every year since 2006.
Chinese investment in Singapore is heavily concentrated in two sectors – financial and insurance services, and wholesale and retail trade. Since 2005 these two sectors have accounted for more than 90 percent of Chinese investment in Singapore.95 This highlights how, for much of this investment, Singapore is not the final destination. A significant proportion is invested in the rest of the ASEAN region by firms operating from Singapore, though the exact amounts are not traceable.
Three sectors account for three quarters of Chinese investment in ASEAN
Manufacturing
Water Conservancy, Environment and Public
Facility Management
Leasing and Business Services46%
18%
5%
Others13%
Financial Services6%
Wholesale and Retail Trade
12%
Source: China’s Financial Support for ASEAN Sustainable Development, 2017, Shanghai Institutes for International Studies
Indonesia is the second largest destination for Chinese investment, accounting for $1.5 billion in 2015. Chinese investment in Indonesia has historically centred on the country’s natural resources, particularly oil, gas and mining. But the focus is starting to shift toward investment in infrastructure. China is a key player in Indonesia’s first high-speed rail project, for example, and is investing significantly in the electricity sector. Indonesia is followed by Viet Nam and Lao PDR as the third and fourth largest destinations for Chinese investment, at $560 million and $517 million respectively in 2015.
Three sectors (leasing and business services, manufacturing, and wholesale and retail trade) account for 76 percent of total Chinese investment in ASEAN in 2015 (Figure 3.4).
95 Ibid

45
Strengthening integrated national financing frameworks to deliver the 2030 Agenda
From Going Global to the Belt and Road Initiative China’s increasing presence on the international financing stage and in the ASEAN region has been guided by what can be seen as a series of ‘going global’ initiatives. The original ‘going global’ initiative was proposed in 2000, focusing on sectors such as natural resources and energy. Following the global financial crisis in 2007–2008 this focus broadened to sectors such as manufacturing and the construction of infrastructure and saw increasing participation of private companies in the ‘going global’ approach.
The Belt and Road Initiative (BRI) is designed for a new phase of ‘opening up’ and international activity. First proposed in 2013, it consists of the Silk Road Economic Belt and the 21st century Maritime Silk Road and is designed to focus on connectivity and cooperation. It combines domestic and international imperatives. Domestically, it will help stimulate the economies of inland Chinese provinces, and provides an outlet for the industrial overcapacity in China.96 Internationally it aims to boost the connectivity of many of China’s partners and support greater involvement in global value chains.97
The framing of China’s financing policy toward ASEAN under the BRI, and before it, is primarily grounded in foreign affairs. This contrasts with other regions, such as Africa, where there has been a more prominent focus on the MDGs and now the SDGs in the relationship.
Nevertheless, there are significant overlaps between the BRI and the 2030 Agenda in ASEAN, and the agreement to formulate a joint vision for the relationship to 2030 that links to the SDGs may place them more centrally in the ongoing relationship.98
Infrastructure is a central theme of the BRI and this emphasis, with the anticipated volumes of financing behind it, could significantly impact sustainable development in the ASEAN region. The most direct contributions are likely to be in SDGs 7 and 9, affordable and clean energy, and industry, innovation and infrastructure. There is significant overlap between the emphasis in the BRI on energy infrastructure connectivity, clean energy technology, green and low carbon infrastructure and telecommunication cooperation and the corresponding SDGs, among other areas.
Ongoing investments show the potential contribution. Many investors from Yunnan province, for example, focus on industrial capacity and infrastructure and the provincial strategy for contributing toward China’s larger going global approach has focused on these sectors in the five ASEAN countries in the Greater Mekong region.99 Investments from the province in these countries totalled $582 million in 2013 and included projects to build a power station in Yangon that will increase the city’s energy capacity by one third, and to develop industrial development zones in Lao PDR and Myanmar and an international airport in Cambodia that will help stimulate growth and investment.
Financing from various funds and other financial institutions will also include a significant focus on infrastructure among other issues. The China-ASEAN Investment Cooperation Fund targets investments in infrastructure, energy and natural resources in ASEAN countries. Its first phase, from 2009 to 2015, involved capital investment totalling $1 billion in ten projects related to the port, airport, communication, energy, construction and health care sectors in eight ASEAN countries. The fund will be scaled up to
96 Shanghai Institutes for International Studies, China’s Financial Support for ASEAN Sustainable Development, forthcoming.97 Ibid.98 Ibid.99 Cambodia, Lao PDR, Myanmar, Thailand and Viet Nam.

Financing the SuStainable Development goalS in aSean
46
$10 billion in the second phase, running from 2016 to 2023. A $40 billion Silk Road Fund, which is open to ASEAN countries but has a wider geographic focus, has started investing funds.100 A RMB 50 million annual fund was launched in 2013 to support the ASEAN Agreement on Disaster Management and Emergency Response.101
The Asian Infrastructure Investment Bank is a multilateral institution that was initiated by China and in which China will continue to play an important role. While still in its early stages, it has already approved or is considering a number of infrastructure projects in the ASEAN region. In Indonesia, projects to improve the operations and safety of dams, upgrade urban infrastructure and services in poorer communities and operationalise a regional infrastructure development fund that will lend to local governments have been approved. A gas-fired power plant in Myanmar is under consideration and the Philippines have submitted a proposal to improve flood management in Manila by improving pumping station and waste management infrastructure.
Moving forward
The BRI was established fairly recently and many of the details of the initiative are still being developed. Given its prominence, however, alongside the specific commitment to scale up two-way China-ASEAN financing, and the generally important role of state-owned and state-linked organizations in Chinese investment in ASEAN, it is likely to have a substantial impact on the nature of this investment in the future.
The contribution of BRI and Chinese financing to ASEAN’s sustainable development is, then, likely to be significant. By way of comparison, some estimates of the infrastructure financing gap in Southeast Asia estimate it to be around $150 billion a year.102 While Chinese investments cover a range of sectors beyond infrastructure alone, they could help the region make a substantial contribution toward closing that gap.
While there are unknowns, what is known is that the BRI will follow a principle of ‘jointly consult, jointly construct and jointly enjoy (results)’, highlighting the room that exists for ASEAN countries to work closely with China on the nature of the initiative and implementation plan as they are established.103
In this light, the early stages of the BRI are an important time to install principles that will guide its implementation into the future. Of particular importance is the need to align plans for Chinese investment in the region with regional and national strategies, and to establish strong monitoring and review frameworks.104
Alignment between strategies for Chinese investment in ASEAN, particularly the BRI, will help ensure it maximizes its contribution to the results the region is targeting. Alignment can occur on at least three levels: 1) aligning BRI strategy and activities with the Master Plan on ASEAN Connectivity 2025 and the 2030 Agenda; 2) aligning relevant strategies of Chinese provinces, namely Guangxi, Yunnan and
100 Initial investments by the Silk Road Fund have focused on countries outside the ASEAN region, such as Pakistan, Russia and Saudi Arabia. However, the fund is open more widely to investment in countries including ASEAN members and initial discussions have been held with countries such as Cambodia (see: http://www.silkroadfund.com.cn/enweb/23809/23812/32722/index.html).
101 Remarks by HE Ambassador Xu Bu at the ASEAN-China Seminar on Disaster Management & Emergency Response, February 2015. http://www.fmprc.gov.cn/mfa_eng/wjb_663304/zwjg_665342/zwbd_665378/t1336920.shtml. RMB = Chinese yuan.
102 Asian Development Bank, Meeting Asia’s Infrastructure Needs, Asian Development Bank, 2017. The figure quoted is taken from page 50 and is the climate-adjusted estimate of infrastructure investment needs.
103 Shanghai Institutes for International Studies, China’s Financial Support for ASEAN Sustainable Development, forthcoming.104 These recommendations also feature in the paper: Shanghai Institutes for International Studies, China’s Financial Support for
ASEAN Sustainable Development, forthcoming.

47
Strengthening integrated national financing frameworks to deliver the 2030 Agenda
Guangdong, with ASEAN regional and members’ development plans, especially Vision 2025, taking the 2030 Agenda as the referring framework, and; 3) aligning BRI investment plans with ASEAN countries’ national development plans.
The impact of Chinese investment can only be understood and maximized if systems are established to monitor what is invested, how it is invested, the outcomes those investments generate and the contribution they make toward sustainable development results. Such a monitoring framework should be harmonized with regional and national systems with indicators and data collection processes determined and managed jointly. It could cover three aspects of the relationship: the impact of Chinese investment on economic, environmental and social dimensions of sustainable development (drawing heavily from SDG indicators); the impact of the relationship on global development; and the impact on the bilateral relationship.
Financing the SuStainable Development goalS in aSean
48
PART III – MANAGING ALL FINANCING FOR SUSTAINABLE DEVELOPMENT
Chapter 4: Integrated national financing frameworks for complex financing landscapesThe financing outlook for the region is a mixed picture. Rapid growth in financing in some areas offers significant potential to drive regional progress toward Vision 2025 and the 2030 Agenda – if it can be mobilized and channelled into investments that will yield sustainable development results. But for many countries the level and trajectory for key finance types remain low and there is an urgent need to expedite growth in the resources available, while ensuring they are used effectively.
The challenge of sustainably expediting the growth in government revenues, and ensuring that these resources are invested effectively, is critical for improving service delivery and infrastructure that can directly impact the lives and environments of citizens across the ASEAN region. On private finance, the challenge for government is to develop policies and partnerships that can stimulate greater volumes of investment in priority areas, while ensuring that it contributes positively to all aspects of sustainable development without prioritising economic progress at the expense of social or environmental progress. And on international public finance, a key challenge for government is to build partnerships with relevant actors in areas where they can be a catalyst for sustainable development progress, while developing the skills, capacity and resources to be able to continue implementation after international public finance declines.
Overall the challenge for governments is to develop and implement a policy and institutional framework that can tackle these challenges in parallel, leveraging the synergies between them and ensuring that investments across all aspects of the financing landscape contribute toward sustainable development results.
This chapter uses the lens of an integrated national financing framework to examine the policies and institutional structures that governments have in place to manage their approach toward all types of financing. It takes the six building blocks of an integrated national financing framework and highlights examples where ASEAN countries are making progress.
The concept of an integrated national financing framework can support governments as they tackle this challenge. This is recognized in the Addis Ababa Action Agenda, which states that “cohesive nationally-owned sustainable development strategies, supported by integrated national financing frameworks, will be at the heart of our efforts”.105
105 UN, ‘Addis Ababa Action Agenda’, 2015, paragraph 9. http://www.un.org/esa/ffd/wp-content/uploads/2015/08/AAAA_Outcome.pdf

49
Strengthening integrated national financing frameworks to deliver the 2030 Agenda
An integrated national financing framework is a holistic, integrated system of policies and institutional structures that government has in place to manage its financing strategies across all resources in a coordinated, aligned manner (Figure 4.1). The concept is built around six building blocks that are designed to help governments evaluate their existing structures holistically and determine what reforms can strengthen the functioning of the system as a whole.
The six building blocks of an integrated national financing framework are:106
1. Leadership that facilitates coherence across government: leadership from the highest levels of government to bring together key actors and build an integrated, aligned approach to mobilising the investments necessary to achieve the country’s goals.
2. A clear vision for results: the foundation of an integrated national financing framework is clarity on the direction and desired sustainable development outcomes that the country wants to achieve in the long term. This may link to the regional Vision 2025 agenda or the international 2030 Agenda and may include estimates about the costs of the investments needed to realize it.
3. An overarching financing strategy: an overarching strategy for mobilising, channelling and investing the resources needed to make the vision for results a reality that incorporates the contributions that all resources (public and private, domestic and international) can make to sustainable development outcomes.
4. Aligned financing policies: the annual and medium-term plans that build on the financing strategy to invest public finance and mobilize and stimulate financing from other actors. This covers a range of policies such as medium-term expenditure frameworks, tax revenue strategies, industrial development strategies, small and medium enterprise strategies, national aid strategies among many others.
5. A strong monitoring, review and evaluation system: an integrated system for planning for and monitoring the contributions that different types of financing can make toward sustainable development outcomes.
6. Participatory processes for accountability and dialogue: mechanisms to build the trust necessary to mobilize contributions from stakeholders outside government, to make sure financing policies are designed and delivered effectively, and ensure a voice for citizens, civil society, business, development partners and other actors in financing sustainable development progress.
106 Based on: Asia-Pacific Development Effectiveness Facility, Achieving the Sustainable Development Goals in the era of the Addis Ababa Action Agenda: Progress in Establishing Integrated National Financing Frameworks, UNDP AP-DEF, 2016. http://www.asia-pacific.undp.org/content/rbap/en/home/library/democratic_governance/achieving-the-sustainable-development-goals.html

Financing the SuStainable Development goalS in aSean
50
Figure 4.1: An integrated national financing framework for delivering sustainable development results
1 Leadership and institutional coherence
2 Vision for results
Gove
rnm
ent i
n�ue
nce o
ver in
vestm
ents
Government action Investment outputs Investment outcomes Results
Less direct
More direct
Privatesector
Internationalcommunity
Civilsociety
Long-termvision
Link toSDGs
Medium-termdevelopment plans
Annual resultsplans
Costedtargets
Internationalprivate�nance
Domesticprivate�nance
Domesticpublic
�nance
Internationalpublic
�nance
5 Monitoring and evaluation
3 Overarching �nancing strategy
4 Financing policies for specific flows
6 Accountability and dialogue
Source: Achieving the Sustainable Development Goals in the era of the Addis Ababa Action Agenda, AP-DEF, 2016107
1. Leadership and institutional coherence Leadership over financing strategies from the highest levels of government is necessary to bring all actors together with a common vision of how financing will contribute to results and drive forward implementation.
In Malaysia a Performance Management and Delivery Unit (PEMANDU) was established in 2009 to implement key aspects of the National Transformation Plan. It was set up by the Prime Minister as a standalone team to ensure the delivery of key priorities for the government, using the Prime Minister’s authority to find ways to overcome any challenges. With a focus on a limited number of headline priorities, PEMANDU has succeeded in ensuring delivery of projects across government. This success is derived in the authority it has from the Prime Minister, the defined set of priorities it works toward (it focuses on a small subset of the national development plan) and finding a balance between its top-down drive and feedback from colleagues in the implementing arms of government.
In the Philippines two Cabinet-level committees, one of which is chaired by the President, review budget proposals for the annual development budget. They scrutinize the outputs of these proposals to ensure there is clear alignment to the medium-term plan.108
107 Asia-Pacific Development Effectiveness Facility, Achieving the Sustainable Development Goals in the era of the Addis Ababa Action Agenda: Progress in Establishing Integrated National Financing Frameworks, UNDP AP-DEF, 2016. http://www.asia-pacific.undp.org/content/rbap/en/home/library/democratic_governance/achieving-the-sustainable-development-goals.html
108 Ibid.

51
Strengthening integrated national financing frameworks to deliver the 2030 Agenda
Such leadership is necessary for an integrated national financing framework if it is to effectively incorporate policies for all types of financing into a coherent overall system. Implementation involves ministries and agencies from across government working together with a clear sense of the overall direction and a shared understanding of delineated responsibilities and objectives. These ministries and agencies must understand the desired impacts from the finance they focus on and where their role fits in the larger picture. They must also have effective mechanisms for coordinating with each other.
Sustainability in the private sector: maize farming in Thailand
Charoen Pokphand Group is one of Thailand’s largest companies and has played a leading role in developing and implementing sustainability principles in the private sector in Thailand. The company has installed ‘3-Benefit’ sustainability principles that underpin its business models, by aiming to create benefits for the country, community and company.109 These include targets to reduce its greenhouse gas emissions and water consumption by 10 percent, and to reach 100 percent responsibly sourced materials and supply chain management by 2020. The company has been an active member of the UN Global Compact since 2003.
The company is Thailand’s largest producer of poultry and as such also the largest purchaser of maize. Maize farming supports over 400,000 households in Thailand and over 5 million tonnes are produced annually.110 However certain practices in the industry have negatively impacted biodiversity, contributed to air pollution and contaminated water. Land degradation is a further issue, particularly farming on steep slopes in Thailand’s mountainous northern areas. In response to this issue, Charoen Pokphand Group developed a policy of only purchasing maize that could be proven to have been grown on slopes with an incline of less than 30 degrees. The aim was to encourage farming on flatter land, thereby reducing the erosion and degradation of land on steeper slopes. While there were some problems with the initial implementation of this policy, which had been announced suddenly, the company is now working with the government and farmers to identify and move relevant farmers onto flatter land.
2. Vision for resultsClarity and consensus about the sustainable development path that a country wants to achieve is the best foundation for designing a strategy to mobilize the financing that can make it happen. The core of an integrated national financing framework is developing an integrated approach that provides coherence to the planning and finance systems.111 Establishing a clear planning vision for results is essential for determining a financing strategy designed to achieve those results.
Indonesia’s planning system consists of a 20-year long-term national development plan, which is implemented through four 5-year medium-term national development plans. The latter run in parallel with the timelines for the taking office of a new government thus enabling different administrations to set their own priorities, while maintaining these anchored to a common long-term vision. The medium-term national development plans are elaborated into Annual Government Work Plans, which are used by line ministries to set their own strategic plans and by regional authorities to set Regional Development Plans.
109 See Charoen Pokphand Group, ‘CP Group Sustainability Principles’. http://www.cpgroupglobal.com/sustainability110 UNDP briefing note on sustainable maize farming.111 Asia-Pacific Development Effectiveness Facility, Building integrated national financing frameworks: a compendium of country
experiences, UNDP AP-DEF, forthcoming.

Financing the SuStainable Development goalS in aSean
52
Malaysia’s long-term plan, Vision 2020, has been the foundation of the country’s development planning and policy for over 25 years (Figure 4.2). Established in 1991, it has underpinned three 10-year plans and six medium-term plans. The challenges outlined in Vision 2020 have informed the priorities of the 10-year plans which in turn inform the strategic thrusts of the medium-term plan. Annual budgets are linked to the medium-term plan on a rolling two-year basis. This cascading planning hierarchy has produced a consistent foundation that is balanced with a system of mid-term reviews of the medium-term plans that allow for adjustments in the policy. The system is credited with playing an important role in driving the significant progress that Malaysia has achieved since Vision 2020 was established.112
Figure 4.2. Malaysia’s Vision 2020
Vision 2020
1st Malaya Plan2nd Malaya Plan1st Malaysia Plan
Post Independence, 1956-1970
Growth with equity Balanced development A resilient and competitive nation
New Economic Model
2nd Malaysia Plan3MP4MP5MP
6MP7MP
8MP9MP
10MPEleventh Malaysia Plan
2011-2020
New Economic
Policy
1971-1990
National Development
Policy
1991-2000
National Vision Policy
National Transformation
Policy
1991-2020
2001-2010 2001-2010
Source: Presentation by Prime Minister’s Department, National development planning practices in Malaysia. Available at: http://www.unosd.org/content/documents/1276Malaysia_PowerPoint%20Silde%20Abu%20Dhabi.pdf
Notes: MP = Malaysia Plan.
The Philippines has recently introduced its first ever long-term vision, AmBisyon Natin 2040, which will form a foundation for the existing system of six-year, term-based national development plans (Philippine Development Plans). The 2040 vision113 is the result of a consultative and participatory process which began in 2015, guided by an Advisory Council composed of representatives from government, private sector, academia and civil society, and led by the National Economic and Development Authority. Focus group discussions targeted at poor and marginalized groups were used to initiate the process and their results formed the basis of a survey that was shared across the country and to which around 10,000 people responded. Alongside identifying the aspirations of the Filipino people, the consultations sought to explore the means of implementation to achieve them. With support from the Asian Development Bank, thematic studies were undertaken to ascertain the constraints and possibilities of attaining the goal.114
112 UNDP, Integrating Sustainable Development Goals in Development Planning: Malaysia case study, UNDP, forthcoming113 The long-term vision formulated in AmBisyon Natin 2040 is two-faceted; it includes both a vision of Filipinos for self and one
for the country, slides 2 and 12 respectively. http://2040.neda.gov.ph/wp-content/uploads/2016/04/Realizing-the-Vision.pdf 114 FAQs: ‘How did NEDA come up with AmBisyon Natin 2040? What was the process behind it?’ and ‘Were all stakeholders involved
in the visioning process?’ http://2040.neda.gov.ph/faqs/; http://2040.neda.gov.ph/2016/04/05/hello-world/
53
Strengthening integrated national financing frameworks to deliver the 2030 Agenda
These vision documents provide clarity about the longer-term sustainable development pathway that a country wants to follow and are crucially not just paper documents, but represent a shared understanding of and buy-in to a vision of the country’s future. On this basis they can act as a foundation for policymaking over the short and medium term. They outline tangible results to strive toward and can provide a basis for balancing the trade-offs between competing priorities. The examples from Malaysia and Indonesia show how a long-term vision for results can cascade into medium and short-term planning, with greater detail at each level. The experience of the Philippines in establishing AmBisyon 2040 highlights the importance of building a shared sense of national priorities and ownership over the development plan. These examples may have relevance for countries whose development plans will be renewed in coming years or who want to deepen the ownership over their national development plan.
3. Financing strategyAn overarching financing strategy can provide a foundation on which to implement policies related to each type of finance individually. Such a financing strategy guides the resources and financing instruments that are needed to achieve the national development plan. It outlines the comparative advantages of each resource in the national context, and guides policymakers on which aspects of the national development plan it can contribute toward. It provides a basis for managing trade-offs between debt and non-debt instruments and addresses changes of a more structural nature that need to be implemented to unlock new sources of finance.
No countries in the ASEAN region have established overarching financing strategies, though some countries are taking steps toward them or have established policies with elements that are useful for understanding the concept and how it could be applied more broadly – such as Indonesia’s Green Planning and Budgeting Strategy. This aims to support more strategic management of the country’s natural resources in order to move to a more sustainable economic growth model characterized by reduced pollution and natural resource degradation.
The Green Planning and Budgeting Strategy presents a framework that offers insights into establishing a financing strategy that applies a wide range of financing types to a diverse set of policy challenges. It cuts across and relates to many of the objectives of Indonesia’s medium-term development plan for 2015–2019. While it is not an overarching financing strategy for the medium-term plan as a whole, it relates to many important aspects of it, covering policy in areas from education to energy, urban planning and agriculture.
The strategy envisages using an array of financing instruments and applying these to specified policy challenges (Figure 4.3). The financing instruments covered range from direct government expenditure to tax incentives, loan guarantees for finance institutions among others. These (alongside other policy instruments) are applied to 21 priorities under 6 policy clusters.
Developing the Green Planning and Budgeting Strategy involved several steps. Initially estimates were made of the scale of the challenge and investments needed to address it.115 The most important policy and programme areas for the green economy overall were identified. A review of existing instruments was
115 Referred to in the policy as the ‘green economy gap’.

Financing the SuStainable Development goalS in aSean
54
undertaken to understand the impact and leverage ratios116 that they offer.117 This was used to determine which instruments should be applied to each policy priority. Finally, sequencing of instruments was agreed, and the strategy emphasises public finance in the early stages of the policy, moving toward greater emphasis on leveraging private finance over time.
In this way the strategy has clear parallels with the structure of an overarching financing strategy, which identifies the scale and types of investments needed across a national development plan as a whole.
Cambodia, Malaysia and Thailand have all developed estimates of the scale of financing needed to realize their medium-term (4–5 year) plans.118 These include varying degrees of detail on which to delineate responsibilities and objectives into targets and policies for different types of finance.
The core features of an overarching financing strategy that would be new in most countries contexts can be summarized as:
• Establishing long-term finance goals. A finance vision should also propose quantitative targets for mobilizing the resources needed to provide financial feasibility to the national development strategy.
• Widening the scope of finance planning to cover both public and private resource mobilization. The vision should recognize that the resources to be mobilized may be public, for which government has direct control, and also private, where government may incentivize their development and align them with national priorities.
• Projecting structural transformations. The long-term finance strategy should project the strategic transformation of the existing finance base and changes of the relative weight of individual flows in the economy (public and private, domestic and international), with the aim of mobilising a wider variety of resources, using them more efficiently or aligning them with national results.
• ‘Back-casting’ and forecasting. The approach proposed is different and complementary to the macro framework forecasts currently in use that project current finance into the future. This additional procedure starts by ‘backcasting’119 from a desired status of the economy – the one that would provide general feasibility to the national plans – to the present state and defining the main stages in this process, key milestones and specific targets for individual finance flows.
116 The ratio by which public expenditures leverages or stimulates private expenditure or investment.117 For the full methodology see Ministry of Finance of Republic of Indonesia ‘Green Planning & Budgeting Strategy for Indonesia’s
Sustainable Development 2015–2019’, Ministry of Finance of Republic of Indonesia, 2015. http://fiskal.depkeu.go.id/pkppim/en/public/2000/studies/download/GPB%20Update%202015.pdf
118 Source: Development Finance Assessment papers for each country respectively.119 A planning method that starts from the desired goal and works backwards to identify steps to connect the goal with the present.
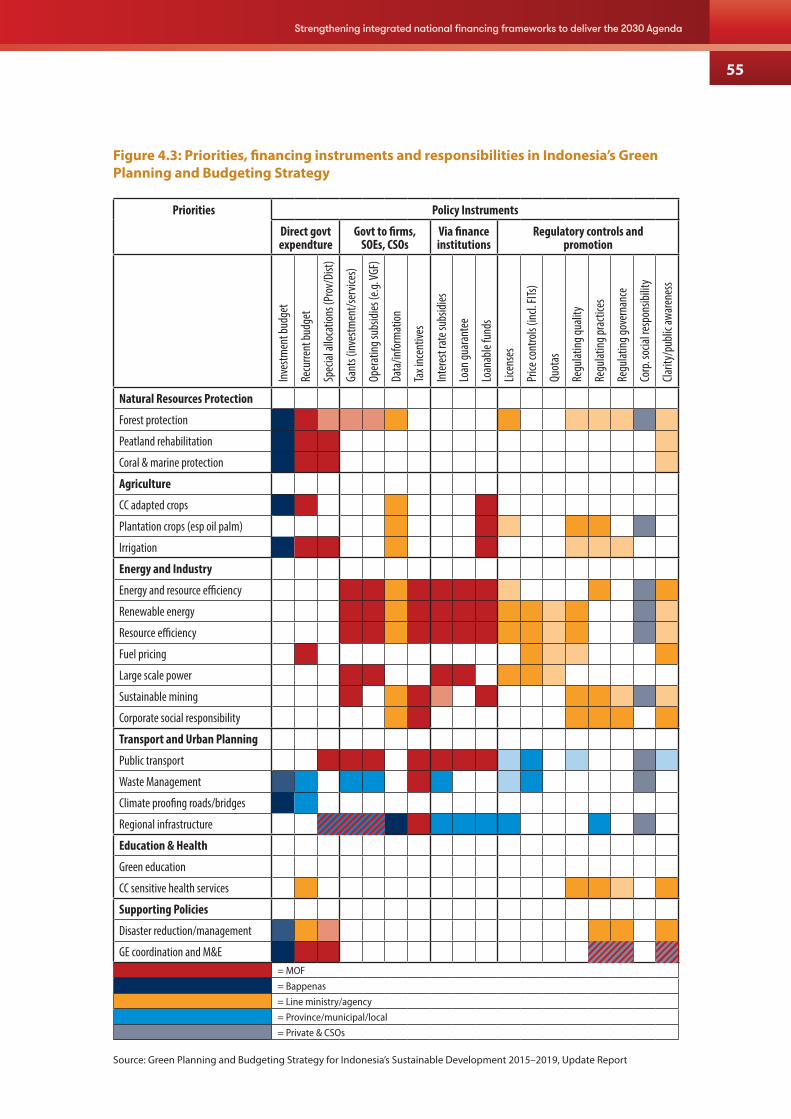
55
Strengthening integrated national financing frameworks to deliver the 2030 Agenda
Figure 4.3: Priorities, financing instruments and responsibilities in Indonesia’s Green Planning and Budgeting Strategy
Priorities Policy Instruments
Direct govt expendture
Govt to firms, SOEs, CSOs
Via finance institutions
Regulatory controls and promotion
Inve
stmen
t bud
get
Recu
rrent
budg
et
Spec
ial al
locat
ions (
Prov
/Dist
)
Gant
s (inv
estm
ent/s
ervic
es)
Oper
ating
subs
idies
(e.g.
VGF)
Data
/info
rmat
ion
Tax i
ncen
tives
Inte
rest
rate
subs
idies
Loan
guar
ante
e
Loan
able
fund
s
Licen
ses
Price
cont
rols
(incl.
FITs)
Quot
as
Regu
lating
quali
ty
Regu
lating
prac
tices
Regu
lating
gove
rnan
ce
Corp
. soc
ial re
spon
sibilit
y
Clarit
y/pu
blic a
ware
ness
Natural Resources Protection
Forest protection
Peatland rehabilitation
Coral & marine protection
Agriculture
CC adapted crops
Plantation crops (esp oil palm)
Irrigation
Energy and Industry
Energy and resource efficiency
Renewable energy
Resource efficiency
Fuel pricing
Large scale power
Sustainable mining
Corporate social responsibility
Transport and Urban Planning
Public transport
Waste Management
Climate proofing roads/bridges
Regional infrastructure
Education & Health
Green education
CC sensitive health services
Supporting Policies
Disaster reduction/management
GE coordination and M&E= MOF
= Bappenas
= Line ministry/agency
= Province/municipal/local
= Private & CSOs
Source: Green Planning and Budgeting Strategy for Indonesia’s Sustainable Development 2015–2019, Update Report

Financing the SuStainable Development goalS in aSean
56
4. Financing policiesFrom the perspective of government, financing is raised, mobilized and catalysed, and spent and invested through a complex network of policies that are implemented by actors across government and its agencies.
While an overarching financing strategy can provide guidance on the scale and types of investments to be mobilized, implementation happens through policies focused on individual types of finance. Different ministries and agencies, or the departments within them, specialize in particular types of finance. With such an array of resources and financing instruments that can contribute toward sustainable development, there are many such specialized units focused on extracting the maximum impact from the particular instruments they focus on.
This presents a two-fold challenge for the integrated national financing framework. Government must design policies for each type of financing that are efficient in mobilising and maximising its impact. And it must build mechanisms to ensure coherence and alignment vertically, between policies and longer-term objectives, and horizontally, between policies focused on different types of financing.
Domestic public
There are two sides to policy governing domestic public finance: how funds are raised and how they are spent. On the revenue and financing side, governments raise revenue from taxes and non-tax income, through state-owned enterprises and natural resource royalties, and borrowing. On the spending side, the annual budget sets out government policies, programmes and public investments to be made (though the latter is sometimes laid out in a separate development budget). State-owned enterprises also raise revenue and invest and have a major impact on economic, social and environmental progress in many ASEAN countries.
Revenue
Revenue mobilization is critical to the impact public finance can have on sustainable development results. It provides the major source of funding for most ASEAN governments120 to provide services, infrastructure and investments for sustainable development. Yet beyond the volume of revenue, the way in which revenues are raised can impact the delivery of sustainable development objectives. Different types of taxation have varying impacts on the distribution of income in a country. In general indirect taxes are often more regressive than direct taxes, which are proportionate to the ability to pay (though the extent of progressivity depends crucially on the exact configuration of a particular direct or indirect tax policy). They can also create powerful incentives for private actors to behave or invest in a particular way; indeed many governments actively forego tax revenue in certain industries or locations to try and attract private investment. Yet in most instances tax or revenue authorities do not develop strategic plans beyond a short-term horizon – Malaysia and Cambodia are exceptions in the ASEAN region.121 And the performance
120 For 7 of the 10 ASEAN countries taxes accounted for most government income in 2015 (see chapter 2, domestic public finance section).
121 Asian Development Bank, A comparative analysis of tax administration in Asia and the Pacific: 2016, Asian Development Bank, 2016. https://www.adb.org/publications/comparative-analysis-tax-administration-asia-pacific-2016. This publication surveyed 9 of the 10 ASEAN countries (all but Viet Nam) among others in the wider Asia-Pacific region.

57
Strengthening integrated national financing frameworks to deliver the 2030 Agenda
of revenue authorities is typically focused on the volumes of taxation raised, taxpayer satisfaction and administrative efficiency,122 without considering the distributional impact of taxation.
Cambodia’s Revenue Mobilization Strategy 2014–2018 has a headline target of increasing revenue by at least 0.5 percentage points of GDP annually, up from 15.18 percent in 2014 to 17.35 percent in 2018.123 It sets out an approach for doing this which avoids tax increases or the creation of new taxes and focuses on realising four reforms: promoting tax culture, improving tax-paying services, improving tax and non-tax administration, and improving tax and non-tax governance. The strategy aims to achieve these reforms through a programme of strengthening the revenue administration, improving aspects of the policy framework and strengthening monitoring and evaluation. The indicators by which the strategy will be monitored are all revenue targets, meaning it will be difficult to understand the impacts of the policy and revenue collection in general on income distribution or other aspects of sustainable development.
Timor-Leste’s Petroleum Fund
Timor-Leste124 has benefitted from strong management of its natural resource revenues by a sovereign wealth fund. It established the Petroleum Fund in 2005 to manage the revenues from its oil fields and act as a buffer between oil revenues, which fluctuate significantly with changes in global prices, and the fiscus. The fund invests the revenues it receives from oil extraction, generating a return on the more-than $16 billion worth of assets it had built up by 2015. On an annual basis the government withdraws an amount of money to fund government spending. An estimated sustainable income, equivalent to 3 percent of the value of the Petroleum Fund’s assets125 sets the level of withdrawals that would be sustainable indefinitely.126 In practice the government has established a policy of frontloading which sees withdrawals above this level in the short term to fund investments that can stimulate economic diversification and growth in the medium to long term. Nevertheless the Petroleum Fund has successfully helped Timor-Leste manage its resource wealth and protect the budget from fluctuations in revenues as commodity prices rise and fall.
Spending
The extent to which public spending follows the objectives of the national development plan is critical to its realization, both because of the scale of public finance and because of its demonstration effects. If government is not clearly aligning its own investments with long-term objectives then other actors will be less inclined to do so either.
In Malaysia, the government uses a review mechanism to ensure that budget spending is aligned to the Eleventh Malaysia Plan and, as of 2017, to the SDGs. During the budget preparation process, ministries submit their proposed costed projects to the Economic Planning Unit of the Prime Minister’s Department
122 Asian Development Bank, A comparative analysis of tax administration in Asia and the Pacific: 2016, Asian Development Bank, 2016. https://www.adb.org/publications/comparative-analysis-tax-administration-asia-pacific-2016. This publication surveyed 9 of the 10 ASEAN countries (all but Viet Nam) among others in the wider Asia-Pacific region.
123 Royal Government of Cambodia, ‘Medium-term Revenue Mobilization Strategy, 2014–2018’, RGC.124 Timor-Leste is not an ASEAN country but applied for membership in 2011, which is being considered by the ASEAN Coordinating
Council and its working group, see http://asean.org/timor-leste-remains-steadfast-to-asean-aspiration/125 Including both investment assets and the net present value of petroleum still to be extracted126 This assumes the Petroleum Fund will make at least a 3% annual return on the investments it makes, something it has achieved
in most but not all years since its establishment.
Financing the SuStainable Development goalS in aSean
58
and the Ministry of Finance for review. These projects are then judged against the six strategic thrusts127 and the national key results areas of the Eleventh Malaysia Plan. For the 2017 budget, which was presented in October 2016, the Economic Planning Unit adapted this process so that submissions from ministries must detail the extent to which their proposed projects contribute toward the targets of the SDGs. Project proposals that further progress toward the SDGs are given higher priority in central government’s budget allocations.128
Private finance
Government has a powerful influence over the extent and way in which commercial finance is invested. By influencing the business environment and creating incentives to invest in certain areas (geographic or sectoral), many governments aim to encourage and stimulate a private sector that can create jobs and drive growth, innovation and environmental sustainability. Governments are also increasingly using mechanisms that involve direct partnership with private actors, such as PPPs, for deliverables such as infrastructure projects and to spur wider investment and development.
Beyond domestic and international commercial investment, other private flows such as remittances and philanthropy also make important contributions to sustainable development and are increasingly recognized in government policymaking.
The new Myanmar Investment Law (2016) brings together previously separate legislation governing domestic and foreign investment. It includes reforms designed to encourage investment, including opening up economic sectors, establishing tax incentives and extending the length of time over which land can be leased. The law has also been linked to the SDGs and a number of priority sectors were identified. Investments in these sectors will be fast tracked and receive preferential treatment under the investment law and related National Export Strategy because of their potential contribution to sustainable development. In addition, the legislation creates tax incentives and other benefits for businesses that invest in the poorest regions, using a definition developed by the Ministry of Planning and Finance. The government is also considering opening up legislation to allow foreign investors to take stakes in domestic companies.
In Thailand, the Board of Investment offers a similar incentive structure, known as the Merit on Decentralization. This offers extended corporate income tax exemptions and other tax-related benefits for investors in the poorest 20 regions of the country.129 These regions are defined by per capita income estimates, aligning to a target of the national development plan to reduce income distribution among regions.130
PPPs are a key instrument used by many governments to directly leverage commercial finance and expertise in service delivery and particularly the provision of infrastructure.
127 The six strategic thrusts of the Eleventh Malaysia Plan (2016–2020) are: enhancing inclusiveness toward an equitable society, improving well-being for all, accelerating human capital development for an advanced nation, pursuing green growth for sustainability and resilience, strengthening infrastructure to support economic expansion and re-engineering economic growth for greater prosperity.
128 UNDP, Integrating Sustainable Development Goals in Development Planning: Malaysia case study, UNDP, forthcoming.129 Thailand Board of Investment, ‘A guide to the Board of Investment’, Thailand Board of Investment. http://www.boi.go.th/
upload/content/BOI-A_Guide_2016-EN-20160930_52508.pdf130 Office of the National Economic and Social Development Board, The Twelfth National Economic and Social Development Plan,
Target 1 of Strategy 9 (Regional, Urban and Economic Zone Development), Office of the Prime Minister, Bangkok, Thailand.

59
Strengthening integrated national financing frameworks to deliver the 2030 Agenda
Indonesia has a well-articulated framework for PPPs in the infrastructure sector. The Ministry of National Development Planning (BAPPENAS), the planning Ministry and the Ministry of Finance share responsibilities in relation to PPPs. BAPPENAS is in charge of prioritising projects to be implemented through this funding modality, while the Ministry of Finance provides options for the financing schemes that can be offered to interested private sector actors – usually guarantees, viability gap funding or viability payments throughout the life of the project. Thus the process by which PPP projects are identified for implementation is to some extent linked to longer-term development plans, through the involvement of BAPPENAS, which is also responsible for managing the national development plan. But the framework that sets out the context in which PPPs are to be used does not directly relate to national development plans or broader financing processes.
The Philippines has long had a programme of PPPs in the infrastructure sector (see chapter 2), yet is moving away from this model to one in which ODA and local finance are favoured in order to speed up implementation.
International public
The role and context of international public finance varies widely from country to country in the ASEAN region. In countries such as Lao PDR and Cambodia it accounts for a significant proportion of total resources, while in others it has declined in volume and is characterized by offering specific support or catalytic assistance in niche areas. Increasing South-South cooperation, the BRI and growing international climate finance are emerging trends. These contexts raise a range of policy challenges for governments looking to maximize the impact of international public finance and plan in advance of likely changes to its scale or composition.
Cambodia is the third largest recipient of ODA in the ASEAN region, receiving an estimated $1.3 billion in 2015 (see chapter 2).131 The country has had significant success working with its development partners to align this development cooperation with the aims of its national development plan. The Development Cooperation and Partnership Strategy 2014–2018 has a primary objective of maximising the effectiveness and impact of development cooperation on the goals set out in the national development plan. It deploys four strategic tools to achieve this.132 Programme-based approaches emphasize comprehensive, coordinated planning among all partners in a given thematic area, within each technical working group. Results frameworks are encouraged in each group to strengthen the monitoring of outputs, outcomes and impact, beyond inputs and activities alone. A series of 20 joint monitoring indicators that are linked to the indicators of the national development plan is used to guide dialogue across the technical working groups. Information management tools, notably the Cambodia ODA database, were strengthened to record and share information on development activities. Through these mechanisms the government and its partners have strengthened the alignment and efficiency of development cooperation in working toward national objectives. For example, 100 percent of the 67 projects assessed as part of the Global Partnership for Effective Development Cooperation 2016 monitoring survey were aligned to the National Development Plan.133
131 Based on data from the OECD Development Assistance Committee.132 Royal Government of Cambodia, ‘Development Cooperation and Partnerships Strategy 2014–2018’, RGC, 2013. http://www.cdc-
crdb.gov.kh/cdc/twg_network/twg_network_november_2013/development_cooperation_partnerships_strategy_draft.pdf133 Global Partnership for Effective Development Cooperation, ‘2016 GPEDC monitoring survey’, GPEDC, 2016. http://
effectivecooperation.org/monitoring-country-progress/explore-monitoring-data/

Financing the SuStainable Development goalS in aSean
60
LDC graduation: lessons from outside ASEAN
Before Samoa’s graduation from LDC status in 2014 there was concern that levels of international public finance would fall, as certain funds were linked to its LDC status (for example the LDC fund for climate change) or that financing received would become considerably more loan-based and raise issues of debt sustainability. These concerns featured alongside others in areas less directly related to financing, such as access to US and EU markets.
To mitigate these risks the Samoan government developed a smooth transition strategy which built directly on its national development plan. A core feature of this strategy was a joint policy matrix which the government and most of its development partners agreed to use as the basis for performance-linked development cooperation. The strength of this matrix has helped ODA levels since graduation to remain stable, without a significant decline in grant financing and even an initial increase in general budget support. In parallel the government has been able to improve its fiscal position by rationalising spending and increasing revenue by 1.5 percent of GDP from 2014/15 to 2015/16. Over time it is likely that the grant–loan mix of international public finance will shift but the strategy has helped to manage this transition and allow time for necessary wider adjustments. This experience may offer lessons for the ASEAN countries graduating from LDC status134 or managing other transitions such as the loss of eligibility for International Development Association funding.
Following Thailand’s ‘graduation’ to upper-middle-income country status in 2010,135 its access to international climate finance was reduced. International official climate finance fell from a peak of $590 million in 2009 to $26 million in 2014. Development partners shifted their approach away from providing large-scale finance toward providing technical assistance and supporting pilot projects designed to test and catalyse domestically-led climate initiatives. Thailand has relatively high volumes of domestic finance and capacity and there is strong national commitment to the sustainability agenda. This is rooted in the Sufficiency Economy Philosophy that underpins national planning and which played a role in influencing the international sustainable development agenda. Yet even in this context, the reduction of international climate finance has impacted the delivery of climate change initiatives. The government is in the process of establishing an on-budget climate fund which will be operational from 2019. Technical capacity is a larger constraint. Many of the initiatives previously funded internationally were supported by international expertise. Some technical cooperation continues and the government has developed a body of training, courses and qualifications. Yet it will take time to build a significant body of people with the technical knowledge and understanding to be able to drive forward climate adaptation and mitigation programmes on an increasing scale.
5. Monitoring and reviewIn the Philippines, a series of results matrices are used to monitor progress against the medium-term plan and support a results-based management approach to implementation. The results matrices track indicators in a hierarchy. The top tier tracks progress against the headline target of the development plan, while indicators related to two intermediate goals sit below it. A third tier tracks progress in key sectors,
134 There are three ASEAN LDCs: Cambodia, Lao PDR and Myanmar.135 World Bank, ‘World Bank Country and Lending Groups’. https://datahelpdesk.worldbank.org/knowledgebase/
articles/906519-world-bank-country-and-lending-groups

61
Strengthening integrated national financing frameworks to deliver the 2030 Agenda
most of which are disaggregated into subsectors. While the results matrices do not comprehensively track financing, the results-based hierarchy that they follow shows how this could be done. The Philippines’ results matrices are being revised to include annual targets, and will be linked to the SDGs.
In Thailand the government has developed a similar hierarchical system which monitors progress on four levels. It tracks progress against the headline targets of the medium-term national development plan and monitors performance against the 10 strategies of this plan using inputs from line ministries. It monitors the development performance in realising the plan against the principles of Thailand’s Sufficiency Economy Philosophy. Finally it tracks the ultimate impact of the policy through the green and happiness index, which measures six components of a green and happy society.136
In Malaysia, the Eleventh Malaysia Plan for the first time broadens the targets that are monitored and used to judge the success of the plan beyond growth-focused targets that have been central to previous Malaysia Plans. The Eleventh Plan includes targets related to family incomes, as well as a ‘Malaysian welfare index’ that has been established to assess the impact of economic growth on the welfare of the population.
Strong monitoring systems are an essential part of an effective approach to financing for sustainable development results. Such systems monitor financing itself, the outcomes it generates and the contribution those outcomes make toward sustainable development. They collect data on what is being invested, how, where, by whom and with what objectives. And they collect data on the outcomes that this finance generates and the contributions those outcomes make toward the sustainable development objectives of the national development plan. In this way an effective monitoring system will build up data, information and evidence over time that allows an understanding of what works and what does not.
As such strong monitoring systems are conducive to more effective policymaking – policymakers can take more informed decisions about which types of financing instruments are best suited to a policy priority. And they are conducive to more targeted policymaking, which is informed by a more precise understanding of sustainable development trends and trajectories that enables more specific measures of success.
Beyond the structure of a monitoring framework, the availability and quality of data for the indicators it includes is crucial to it success.
In Myanmar the government is taking steps to strengthen transparency related to private finance. Under the new Myanmar Investment Law, domestic and international companies must report to the Directorate of Investment and Company Administration on a quarterly basis with investment data (focusing on job creation, the size of investment and machinery imports) and a full dataset will be available in 2018. This is a new process and will strengthen transparency and quality of data on investments and FDI.
The central bank of the Philippines (Bangko Sentral ng Pilipinas) has an advanced system for collecting data on remittances, which are a key feature of the Philippines’ financing landscape. It publishes data monthly with flows disaggregated by the country from which they were sent and by the source (land-based, sea-based) of those funds. It has followed this data publication model since 1989. The Central Bank informs and maintains this database through the International Transaction Reporting System, which collects information on settlements and transactions between banks, enterprises and households.137
136 The six components are health, warm and loving family, community empowerment, democratic society with good governance, surroundings and ecological system, and economic strength and equity.
137 For more information see UN Statistical Division, ‘General description and purpose of the international transactions reporting system’, UN Stats, 2017. https://unstats.un.org/wiki/display/M2CG/B.++General+description+and+purpose+of+the+international+transactions+reporting+system

Financing the SuStainable Development goalS in aSean
62
Monitoring frameworks and the policies they inform can only ever be as strong as the data and information on which they are based. These examples provide lessons for other countries in the region wanting to strengthen their own systems for collecting data and monitoring the contributions of financing to inform more effective policymaking.
Climate budget tagging
Climate budget tagging138 is a budget tool for monitoring and tracking climate-related expenditures in national budget systems. It establishes a system for gathering comprehensive data on climate-relevant spending that allows governments to make informed decisions and prioritize climate investments. It also has important transparency and accountability benefits, as it enables public scrutiny on government and donor spending toward addressing climate change issues. Such a system generally consists of four steps: defining then classifying climate activities, weighing their climate relevance and designing the tagging procedure.
The Philippines mandated climate budget tagging in national budget submissions for all government entities in 2015, through its Climate Change Expenditure Tagging framework. This provides definitions of climate change and a common method for tagging and linking budget allocations and national climate policy priorities. For the 2015 budget, 53 national government agencies prioritized and tagged their budget proposals for climate change spending. The Philippines then piloted climate tagging in its Annual Investment Plan for local government units before scaling up to all units in 2016.
Since 2014, Indonesia has used mitigation budget tagging in key ministries to track resources spent to achieve the national emission reduction target of 26 percent by 2020.139 This has been implemented through its Low Emission Budget Tagging and Scoring System (‘LESS’), which was also implemented in three central provinces to pilot mitigation expenditure tagging at the local level. LESS was developed following a 2012 assessment by the Mitigation Fiscal Framework, which found that Indonesia’s spending path at the time limited its emissions reduction by up to 11 percent. This expenditure tagging gives clarity on what resources are being used, improving the governments’ ability to achieve climate-related targets.
6. Accountability and dialogueTo effectively mobilize the financing and contribution of a wide range of actors toward sustainable development requires strong dialogue on priorities, challenges and progress with those actors.
In Malaysia, the Prime Minister’s delivery unit, PEMANDU, developed an innovative system of ‘Labs’ to design and build shared ownership around key deliverables within the country’s 10-year National Transformation Programme. These consultative processes involve a range of actors who work together over a 6-to-9-week timeframe to design actionable policy objectives and key performance indicators that speed up progress toward the objectives of the National Transformation Plan. Their outputs become official policy and have successfully developed a sense of shared ownership around these key actions.
138 This box is informed by the report UNDP, Climate Budget Tagging, Country-driven initiative in tracking climate expenditure, UNDP, 2015. https://www.climatefinance-developmenteffectiveness.org/sites/default/files/documents/27_08_15/4%20Climate%20Budget%20Tagging%20_Draft.pdf
139 This target is articulated in Indonesia’s National Action Plan for Reducing Greenhouse Gas Emissions (‘RAN GRK’).

63
Strengthening integrated national financing frameworks to deliver the 2030 Agenda
In Myanmar a Private Sector Development Committee has been established to coordinate dialogue between the government and private sector. It is a platform for structured dialogue and played a role in creating key private sector development policies including the Private Sector Development Framework and Action Plan (2016) and the Myanmar Investment Law (2017).
In Lao PDR, a roundtable process is used to facilitate coordination between government and development partners. The process has evolved around the cycle of five-year national plans and has adapted to the changing global focus on aid and development effectiveness. Over time the process has deepened, moving from a focus on mobilising resources to incorporate advocacy and knowledge sharing toward more holistic discussions about policy with a wider range of actors, including participants from the private sector and non-profit associations. The process is structured around annual meetings that take stock of progress achieved toward the National Socio-Economic Development Plan and set priorities for the coming year, with 10 sector working groups that convene more regularly. It is co-chaired by government and development partners.
The examples from Malaysia, Myanmar and others show how countries can establish and configure platforms for dialogue with non-governmental actors. Effective participatory processes for dialogue are essential for building the trust and shared ownership needed to mobilize contributions from stakeholders outside government and ensure that financing strategies are designed and delivered effectively. Dialogue is important for refining government’s understanding about the real constraints to greater private investment, for example, and for developing realistic objectives about what levels and types of investments may be possible. For private or international actors outside government it helps to build an understanding of government’s priorities and ability to act in addressing different challenges.
Strengthening integrated national financing frameworks to deliver sustainable development results
The overarching challenge for governments on financing is to develop a policy and institutional structure that can cohesively mobilize and stimulate investments from a diverse range of actors, while working to maximize the impact of each one on sustainable development outcomes and ensuring the synergies between them are identified and leveraged. The Addis Ababa Action Agenda calls for countries to establish integrated national financing frameworks to help them achieve this.
All ASEAN countries are making progress in establishing and strengthening the building blocks of an integrated national financing framework, yet there are also areas for all countries where further reforms could strengthen the system as a whole.
The extent of leadership and coordination over financing within government varies widely. In many cases there are mechanisms for managing public finance investments in sustainable development, but there are few examples of this extending to policy toward private sector development. Most countries have clear visions for results in national development plans, but the degree of understanding and consensus about them among key stakeholders differs markedly. Few are costed and the strength of the links between long-term visions and medium and short-term plans and implementation varies widely. No ASEAN governments have developed comprehensive financing strategies, though some have taken steps toward such a strategy or have developed comprehensive financing strategies at the sector or thematic level. Despite its important role in driving forward progress, finance does not feature centrally in many national monitoring frameworks and where it does the focus is on public finance alone. Finally, platforms

Financing the SuStainable Development goalS in aSean
64
for public–private dialogue could be strengthened in most contexts as a means for developing more responsive and targeted policy for stimulating impactful private sector development.
Building on these findings about the strength of integrated national financing frameworks, the following chapter applies the lens to two key policy areas for the SDGs: leaving no one behind and private sector development. The report then closes with recommendations about how to improve integrated national financing frameworks and take steps to mobilize finance for the SDGs in the region.

65
Strengthening integrated national financing frameworks to deliver the 2030 Agenda
Chapter 5: Integrated national financing frameworks for key policy areas Previous chapters have shown the scale and complexity of the sustainable development challenges that countries face as well as the finance that is or could be available to address those challenges. Using the lens of an integrated national financing framework, the report has examined the policies and institutional structures that governments have in place to manage their financing strategies.
This chapter focuses on two issues at the heart of the Financing for Development Agenda and the 2030 Agenda – leaving no one behind and stimulating private sector development. Leaving no one behind is an imperative of the global agenda and needs concurrent progress on a number of issues, thereby requiring an integrated financing response. The way the private sector develops will be an important factor in determining progress across many aspects of the 2030 Agenda. These two issues are of major significance and thereby warrant further analysis in their right. Hence this chapter shows how the lens of an integrated financing framework can be applied to specific policy priorities to analyse their comprehensiveness and integration into the wider financing framework.
Private sector developmentMobilising the right scale and kinds of private sector development will significantly impact many countries’ progress toward the SDGs. The private sector can create jobs, drive innovation and develop skills and capacity. It thus has a far-reaching impact on society and the environment. Attracting and stimulating the private investment that leads to progress in these areas is therefore a central financing challenge for governments.
Leadership and institutional coherence are especially important for policy toward private sector development, given the range of policy areas that influence the business environment. Cambodia launched its Industrial Development Policy in 2015. The policy aims to stimulate high levels of sustainable and inclusive growth, particularly in manufacturing and rural development. It builds on lessons from the success of the ‘rice policy’140 introduced by the Prime Minister in 2010.141 This was characterized by a clearer focus, greater degree of coordination and higher-level leadership than previous policies. It had a headline target for the paddy surplus to “reach over 4 million tonnes a year…and at least one million tonnes of rice for export”. Strategically, it focused on particular communities rather than spreading resources too thinly and was clearly associated with the leadership and authority of the Prime Minister, whose office directly supervised its implementation by the Ministry of Agriculture, Forestry and Fisheries.142 The rice policy did not fully achieve the ambitious headline target but succeeded in making significant progress toward it – in 2016, 542 tonnes of milled rice was exported to 26 countries. Some challenges and bottlenecks that
140 Formally the ‘Policy on the Promotion of Paddy Production and Rice Export’ but commonly called ‘the rice policy’.141 The Role of Development Finance in Economic Transformation: Cambodia’s Industrial Development Policy and the
Modernisation of the Rural Economy, 2017, forthcoming.142 UNDP, Building Integrated National Financing Frameworks: A compendium of country experiences, UNDP, 2017, forthcoming.

Financing the SuStainable Development goalS in aSean
66
were faced in implementing the policy, such as a shortage of capital and high energy prices, pointed to the need for a more comprehensive approach to the rural economy that considers wider aspects of the business environment. The Industrial Development Policy was designed to build on this experience, and innovates further in particular by bringing together some of the more structural reforms that affect private sector development under a single policy.
The breadth of the vision that governments have for private sector development is important for developing holistic policies that maximize its impact on all aspects of sustainable development. The way in which the private sector develops impacts on many aspects of social progress and environmental sustainability, as well as on economic development. The vision and objectives that governments have for private sector development have, in many countries, focused narrowly on economic development and job creation, but are increasingly starting to explicitly address these wider dimensions of sustainable development. Thailand, for example, has recently launched a new economic model, ‘Thailand 4.0’, in which the private sector has a central role. It targets the development of 10 ‘future industries.’143 In doing so it aims to overcome three identified ‘traps’ the country faces – an economic middle-income trap, a social inequality trap and an environmental imbalanced trap. While it is an economic policy with private sector development at its core, its four objectives cut across the dimensions of sustainable development. The goal of reaching economic growth of 5–6 percent within five years sits alongside targets to leave no one behind by reducing inequality, raise Thailand’s Human Development Index ranking to be among the top 50 countries in the world and become a liveable, low-carbon society with an economic system capable of adjusting to climate change.144 Explicitly recognising these wider impacts and articulating targets related to society and the environment provides a broader foundation on which more holistic policy toward private sector development can be created.
Governments develop and implement a wide range of policies and projects to try to directly or indirectly stimulate private investment. Improving the business environment is often a central concern and may involve interventions from reducing the bureaucracy around business registration and reporting to improving infrastructure to boost access to markets and supply chains. Special economic zones are used throughout the ASEAN region, and increasingly at a sub-regional level, with countries collaborating on zones to boost regional value chains (see box). And an increasing number of countries are using PPPs as a way to directly mobilize private investments.
Improving the business environment is a key way that governments aim to reduce the cost of setting up or doing business, thereby making investments more attractive. Malaysia has established two bodies to help with this. A Special Task Force to Facilitate Business (‘PEMUDAH)’ is a joint effort between the government and the private sector that aims to improve regulatory frameworks, reduce business licensing requirements and encourage the use of IT by government agencies. The National SME [small and medium-sized enterprise] Development Council, which is chaired by the Prime Minister, builds on targets in the national development plan (Eleventh Malaysia Plan) to increase the contribution of SMEs to GDP. It formulates a range of policies and strategies to facilitate the overall development of SMEs.
143 Five of these build on existing industries, improving innovation and research and development, while the other five are new industries, which are higher value-added and focused on more advanced technology.
144 Royal Thai Embassy, Washington DC, ‘What is Thailand 4.0?’ http://thaiembdc.org/thailand-4–0-2/.

67
Strengthening integrated national financing frameworks to deliver the 2030 Agenda
Special economic zones
Many countries in the region use special economic zones (SEZ) as part of their policies to attract private investment, particularly as part of strategies to stimulate and accelerate industrial development. While each SEZ framework differs, they generally aim to improve competitiveness by providing investment incentives, enhanced infrastructure and an improved business climate. In general, SEZ programmes aim to upgrade and diversify the industrial export base of the economy and stimulate human capital development over the long term, while creating jobs over the shorter term. This is achieved by attracting export-oriented investment, with an historic focus on processing manufacturing. However, many countries are using SEZs now to expand into wider industries. For example, agro-processing is seen as an important objective in Cambodia, Philippines, Myanmar and Indonesia; IT services in the Philippines; electronics in Cambodia, Indonesia and Thailand; and high-technology in Malaysia. While the objectives of SEZs are rarely articulated in relation to the SDGs, there are clear links to SDG 8 on decent work and economic growth, and SDG 9 on industry, innovation and infrastructure. There are also implicit links to a number of SDGs, in particular SDGs 1 and 12 (zero poverty and responsible consumption and production). While SEZs are often discussed with overarching objectives in mind, tangible or quantifiable objectives are rarely stated.
The financing of SEZs differs between countries, and both publicly and privately developed zones exist in the region. In Cambodia, the Philippines and Viet Nam, zones are largely privately developed, while Thailand and Lao PDR have both public and private zones. With respect to public responsibility for SEZs, three roles in particular are significant: public development and operation of zones; public administration and regulation of privately-run zones; and public external infrastructure investment external to zones. Financing data of SEZs across the region is not widely or consistently published, however. Data on initial public investment is in some cases published by the coordinating authorities, such as in Lao PDR and Thailand, although ongoing operating costs are less explicit and the source of funds – whether borrowing, revenue or alternatives – is rarely disclosed. While a share of the operating costs can be expected to be covered by service charges and fees, it is rare that these will cover the overall ongoing costs of operation. The balance of financing between central and local government is also rarely published. In other countries the extent of public investment is unclear, especially around external infrastructure provision.
The monitoring and evaluation of SEZs across the ASEAN region is largely internalized. The most frequently reported statistics focus on three main categories: public investment, foreign direct investment and investment outcomes, typically limited to employment and exports. While these provide overviews of the performance of zones, they tend not to be reported consistently; few zone programmes provide annual reports. Public monitoring and evaluation efforts are likely to be reduced by the long-term nature of SEZs, given the estimated 5-to-10-year incubation period145 and the volatile and unpredictable nature of investment. Many SEZs in the region do however involve certain stakeholders in ongoing monitoring efforts. Private sector representatives are frequently members of the committees responsible for zone performance. For example, in the Philippines the board of the Philippine Economic Zone Authority has one labour and one investor/business representative on a board of 13 people. Yet in a wider context,
145 Farole T, Special Economic Zones in Africa: Comparing Performance and Learning from Global Experience, The World Bank, 2011.

Financing the SuStainable Development goalS in aSean
68
there is significant room for improvement in incorporating civil society actors and concerns within zone operation.
On a regional level, SEZs offer opportunities but also risks. They have already begun to be used in efforts to promote cross-border cooperation through the use of border zones. One example is the use of SEZs in supporting sub-regional projects, such as those used in the Greater Mekong Subregion where SEZs are strategically located along designated economic corridors.146 By reducing frictions to trade, SEZs also enable improved integration in regional production networks; indeed, continuing to deepen these remains an explicit objective of a number of SEZ programmes. However, the use of SEZs does come with risks as cross-border competition for investment is often seen as a zero-sum game. Cross-border cooperation in the context of SEZ frameworks is thus essential for the future.
Many ASEAN countries have PPP programmes or are establishing them. They are typically used to mobilize private finance into investments in areas such as infrastructure, which are often themselves part of wider strategies to attract greater private investment by improving the ease of doing business. While countries such as Malaysia, Thailand and the Philippines have established PPP programmes, others such as Cambodia, Myanmar and Lao PDR are in the earlier stages of establishing or exploring the potential to set PPP programmes.
Systems for monitoring the success of private sector development strategies and the contribution of private sector development toward national priorities are generally less developed. In Lao PDR, the monitoring framework for the national plan, the 8th National Socio-Economic Development Plan, includes indicators to track private sector development. These include monitoring the volumes of FDI and other investment projects as well as certain indicators of the quality of investments linked to financial, economic and environmental impact assessments. Yet there are issues with data collection. Many other countries in the region do not directly incorporate monitoring of financing beyond government finance in their central monitoring frameworks in a way that enables understanding of their contribution to national results.
Some countries have established formal mechanisms for public–private dialogue. In Cambodia, the Government-Private Sector Forum has been supporting public–private dialogue since 1999. Launched by the Prime Minister with support from the International Finance Corporation, the forum enables private sector actors to raise and resolve problems with the Government of Cambodia and discuss both long-term policy issues and day-to-day operations to support private sector development. It is coordinated by eight business associations and the Chamber of Commerce. The forum has been credited147 with driving forward reforms to improve the business environment, yet the private sector requires further strengthening of its advocacy capacity, coordination and analytical skills. Lao PDR established its Lao Business Forum, which is chaired by the Prime Minister, over a decade ago. Myanmar has recently established a forum for public–private dialogue, while Indonesia has an informal platform that was initiated by the private sector.
146 Asian Development Bank, Role of Special Economic Zones in Improving Effectiveness of GMS Economic Corridors, GMS Secretariat, Asian Development Bank, 2016.
147 World Bank, Review of World Bank Group Support to Structured Public-Private Dialogue for Private and Financial Sector Development, World Bank, 2009.

69
Strengthening integrated national financing frameworks to deliver the 2030 Agenda
Private sector development offers significant potential to contribute to and be a driving force behind progress in many aspects of the 2030 Agenda. To realize this governments can take steps to enhance and broaden their policy toward private investment and integrating this area of policy within the wider integrated national financing framework. Some countries are starting to explicitly plan for the impact of private sector development on a wider range of sustainable development outcomes and some are taking steps to bring together interventions into a single policy framework under senior leadership. Countries are establishing a range of policies to attract or stimulate private investment, though some policy areas, such as SEZs, could be strengthened by deepening their integration into wider national planning. Monitoring and evaluation systems, as well as dialogue platforms, could be strengthened in many cases.
Leaving no one behindLeaving no one behind is a fundamental imperative of the 2030 Agenda and the SDGs. It cuts across all aspects of the agenda as it is the poorest and most vulnerable people who typically benefit least from growth and who are most exposed to its risks. It is a complex and overlapping imperative that cannot be simplified into a single sector as the most vulnerable people often face multiple, interlinked deprivations (see chapter 2). Leaving no one behind is therefore a wide-ranging policy agenda and as such this section looks at examples of relevant policies from the region rather than attempting a comprehensive overview of the financing challenges for leaving no one behind. It applies the lens of the integrated national financing framework to these examples.
On national visions for results, while localization of the SDGs is still in its earlier stages, explicit commitments to leaving no one behind are just beginning to feature in national development plans as they are refreshed and renewed.148 Nevertheless all countries have priorities whose objectives relate directly to leaving no one behind and which will contribute to advancing the agenda in practice. In Indonesia such principles are mainstreamed throughout the national development vision, plans, programmes and processes. Three of the priorities in the government’s nine-priority agenda ‘NAWA CITA’ relate to leaving no one behind149 and align to the equity pillar150 of the five-year plan. Specific programmes also reflect government’s integration of this principle in its approach to poverty and inequality reduction. These include the national health insurance scheme, which provides health insurance for the poor; the Conditional Cash Transfers programme; and the new rural electrification programme, which aims to improve access to electricity across the whole country. Elsewhere, in Malaysia and Thailand, there is a strong commitment to the poorest 40 percent of people – both countries have established headline targets to raise the incomes of the poorest 40 percent of people by 15 percent.
No countries have a holistic financing strategy for leaving no one behind, given the wide ranging and cross-cutting nature of interventions in this area. Yet countries are considering and adapting their financing models in key aspects of their policy response. This section looks at two examples: efforts to implement universal health coverage and an innovative use of PPPs designed to reach the poorest people.
148 For example, the Thailand 4.0 policy launched in 2017 makes reference to leaving no one behind under the social well-being heading, see: http://thaiembdc.org/thailand-4–0-2/
149 The three priorities are headed ‘Developing Indonesia’s rural areas’, ‘Improve quality of life’ and ‘Strengthening the spirit of ‘unity in diversity’ and social reform’.
150 This is one of three pillars of the five-year plan: ‘RPJMN 2015–2019’. One of the macro targets of the plan is to reduce the Gini index from 0.41 in 2014 to 0.36 in 2019.

Financing the SuStainable Development goalS in aSean
70
Universal health coverage
Universal health coverage is one important aspect of social protection that, when achieved, disproportionately benefits the poorest people in society and therefore makes an important contribution toward leaving no one behind. As in other areas of social protection, the design and configuration of the financing model used affects how successfully the policy reaches the poorest people, expands the range of services on offer and reduces the costs they face.
ASEAN countries are committed to universal health coverage. Four countries have achieved it, either through systems that are primarily tax-funded (Brunei Darussalam, Malaysia and Thailand) or through a contribution-based system that includes a social assistance component (Singapore).151 Others have committed to the agenda – Indonesia for example has set a target for achieving it by 2019. Myanmar has recently introduced a new National Health Plan that promotes universal healthcare.
Thailand introduced its universal coverage system funded primarily by taxation in 2001. This replaced a subsidized voluntary contributory health insurance system. The contributory scheme had been characterized by challenges around the collection and enforcement of contributions, particularly from the informal sector. Importantly it was significantly less progressive than the new one.152 Coverage of the population was lower: as Thailand moved to a system funded by taxation, coverage increased from under 70 percent of the population in 2001 to over 90 percent in 2002. By 2012, 99.8 percent of the population was covered,153 and the incidence of catastrophic health expenditures reduced.
Public finance is a key driver of increased access to health care for the poorest and most vulnerable people, as well as an emerging middle class that still struggles to afford private healthcare. This highlights again the central importance of sufficient levels of domestic revenue mobilization for achieving the SDGs. Public finance allows risk to be pooled across an entire population as opposed to the proportion that contributes to a health scheme; or it can provide the funds to increase coverage of those outside contributory systems (as is the case in Singapore). This is vital for reaching people who work in the informal economy. Evidence shows that systems driven by private sources of financing are often characterized by households foregoing care, or facing the risks of catastrophic health expenditures.154
Indonesia, the Philippines and Viet Nam have social health insurance systems which are based on contributions or mixed systems based on contributions combined with full or partial subsidies for the poorest people or other groups such as young children.155 Coverage ranges from around 60 percent in Indonesia and Viet Nam to just over 80 percent in the Philippines.156 Steps are being
151 International Labour Organization, The state of social protection in ASEAN at the dawn of integration, ILO, 2015. http://www.ilo.org/jakarta/whatwedo/publications/WCMS_428982/lang – en/index.htm
152 International Labour Office, ‘Thailand’s Universal Health-care Coverage Scheme’ profile. http://www.social-protection.org/gimi/gess/RessourcePDF.action;jsessionid=SGhFYGBKtvwXThkGDMdjnZ4GTp9RgsJW79ySxv62rpnCRn95xJV3!79209976?ressource.ressourceId=54059
153 Ibid.154 World Health Organization, Raising revenues for health in support of UHC: strategic issues for policy makers, WHO, 2015. http://
www.who.int/health_financing/documents/revenue_raising/en/155 This is the case in Viet Nam, for example. Source: International Labour Office, ‘Analysis of the Viet Nam National Social Protection
Strategy (2011–2020) in the context of Social Protection Floor objectives’, 2012.156 International Labour Organization, The state of social protection in ASEAN at the dawn of integration, ILO, 2015. http://www.
ilo.org/jakarta/whatwedo/publications/WCMS_428982/lang – en/index.htm

71
Strengthening integrated national financing frameworks to deliver the 2030 Agenda
taken to increase coverage, with public finance as a key driver. The Philippines introduced a ‘sin tax’ in 2012 that earmarked revenues for health financing.157 This has helped increase funding for public health care from $1.25 billion in 2012 to almost $2 billion in 2014 and reduce out-of-pocket expenditure that accounted for 50 percent of total health spending before the tax was introduced.
Social public–private partnerships
Malaysia has established ‘Social Public-Private Partnerships’ to deliver high impact social services designed to benefit some of the poorest people. Government works with non-governmental organizations and the private sector (at present, seven companies) to design and deliver demand-driven services that are paid for by government based on results achieved. Social PPPs target key social impact areas like training people with disabilities for jobs in virtual call centres and supporting student learning through a peer-tutoring programme. This initiative builds on the ‘Translating Innovation into Wealth’ strategy, which is one of the six ‘game changers’ in the Eleventh Malaysia Plan. The strategy calls for a social financing model to promote investments from the private sector, foundations and individuals in delivering social services.158
Strong monitoring systems are essential for the effective delivery of policies designed to target the poorest people. By the nature of the challenge leaving no one behind requires data and information that can be highly disaggregated in order to identify the most vulnerable and isolated groups and communities. Indonesia’s Unified Database for Social Protection Programmes collects and provides data down to the household level, including names of individuals, and is designed to support the effective targeting of social protection programmes across the country. The programme’s data collection is led by Statistics Indonesia. The data collection and management process involves verification of households by local leaders as well as consultations with poor communities. Data are regularly updated through three main methods: at the programme level via feedback from database users on individuals and households that register or withdraw as programmes beneficiaries; at local level via periodic updates completed by local governments; and at the national level, every 3–4 years, through a more comprehensive process involving central and local governments as well as communities. TNP2K, the agency that coordinates the database, works to build the capacity of regional authorities to use it for effective priority setting and to inform pro-poor budgeting in the regions. Hence the data collection and management system is designed to ensure that all poor households are recorded and eligible for access to social protection programmes. While there is scope to improve the process and integrate its use more widely across government, the database itself is an important step to ensuring that no one is left behind. Without knowing who and where the poor are, and what their needs are, it is not possible to understand if people are being left behind or provide support for those most in need.
Leaving no one behind is a cross-cutting challenge that will require the right scale and adaptation of financing models across a wide range of sustainable development policy. These examples highlight something of the way in which it can be mainstreamed across development visions, examples of how financing models can be adapted to reach the poorest and most vulnerable people, and the role of disaggregated data in monitoring.
157 85% of revenues goes toward funding universal health care, upgrading medical facilities and training medical professionals. The remaining 15% goes toward programmes designed to help tobacco farmers find alternative livelihoods.
158 See Economic Planning Unit, Prime Minister’s Department, Malaysia. Translating Innovation to Wealth. Economic Planning Unit’s Strategy Paper 21.

Financing the SuStainable Development goalS in aSean
72
PART IV – RECOMMENDATIONS
Recommendations and follow-upASEAN countries are making rapid progress in many areas of sustainable development but face significant challenges ahead in achieving the 2030 Agenda. Mobilising the right scale and mix of finance, and ensuring that the synergies between different flows are leveraged, will be essential. This report has examined the challenges and opportunities that the finance landscape in ASEAN presents and the policy and institutional structures that governments have in place to manage their approach to financing. It has identified a range of recommendations that could be implemented to strengthen the ability of countries and the region to mobilize and maximize the impact of finance on sustainable development results.
Recommendations to mobilize greater volumes of finance• Establish a regional code of conduct for competition on tax incentives to avoid unnecessary harmful
competition and losses of tax revenue
Countries in the region often compete with one another to attract foreign investments in key industries. One aspect of this competition is offering investors generous terms on their taxation via lower corporation tax rates or tax breaks and holidays. This can often be a harmful practice, while evidence shows that taxation is not typically a primary reason for investors to choose a destination, with taxation coming behind factors such as the business environment, infrastructure, utilities and skills in many surveys.159 Yet it can cost governments significant volumes of foregone revenue.
This report recommends exploring the potential to establish an ASEAN code of conduct to reduce the harmful element of intra-regional tax competition. Such a code would be agreed at the regional level to remove this element of competition from all countries competing for investors that want to locate in the region. It could cover the most harmful elements of tax competition and be designed to remove this competition from within ASEAN without lowering the competitiveness of ASEAN countries relative to competitors elsewhere in Asia and beyond.
Other regions have developed or are developing similar guidelines. The EU established a code of conduct for business taxation in 1997 that recognises the benefits of many aspects of tax competition, but also established a framework for removing tax practices that were identified as harmful.160 The criteria for potentially harmful tax competition measures include: effective levels of taxation which are significantly lower than the general level in the country concerned; tax benefits reserved for non-residents; tax incentives for activities which are isolated from the domestic economy and therefore have no impact on the national tax base; granting of tax advantages even in the absence of any real economic activity; the basis of profit determination for companies in a multinational group that departs from internationally accepted rules, in particular those approved by the OECD; and lack of transparency. More recently, the East African Community has developed a draft code of conduct against harmful tax competition. This code will freeze the current provision of harmful tax incentives
159 See for example Farole T, Special Economic Zones in Africa: Comparing Performance and Learning from Global Experiences, World Bank, 2011. https://openknowledge.worldbank.org/bitstream/handle/10986/2268/600590PUB0ID181onomic09780821386385.pdf?sequence=1&isAllowed=y; Asian Development Bank, The Role of Special Economic Zones in Improving Effectiveness of GMS Economic Corridors. 2013, Asian Development Bank, Mandaluyong City, Philippines, 2016. https://www.adb.org/sites/default/files/institutional-document/214316/role-sez-gms.pdf; and UN Industrial Development Organization, Africa Investor Report 2011: Toward evidence-based investment promotion strategies, UNIDO, 2011. https://www.unido.org/fileadmin/user_media/Publications/Pub_free/AIS_Report_A4.pdf
160 See European Commission, ‘Harmful tax competition’. http://ec.europa.eu/taxation_customs/business/company-tax/harmful-tax-competition_en

73
Strengthening integrated national financing frameworks to deliver the 2030 Agenda
so new ones are not introduced. Six countries161 are members of the BEPS Inclusive Framework which includes actions on harmful tax practices and a process whereby incentives offered by these countries will be reviewed by a Forum on Harmful Tax Practice to ensure a level playing field internationally.
ASEAN countries are active in their competition with one another for attracting foreign investments.162 There may be benefits to much of this competition, if it creates incentives that help drive forward improvements in infrastructure and services, for example. Yet aspects of this competition are a ‘race to the bottom’ in which increasingly generous tax incentives are offered with significant cost in terms of lost revenues. Establishing a region-wide code of conduct, perhaps building on the BEPS initiative which six countries are already committed to, could help remove this practice.
• Strengthen the capacity of tax authorities to raise revenue with support from Tax Inspectors Without Borders
The ability to develop, implement and enforce effective tax policy is limited by low capacity in tax or revenue authorities in some countries. This has an impact on the revenues that countries are able to collect. In 2015 the OECD and UNDP launched the Tax Inspectors Without Borders initiative to meet the need in many countries for capacity building support. Two countries in the region, Cambodia and Viet Nam, are already engaging with the initiative; others could consider doing so too.
• Reduce the cost of sending intra-regional remittances to 5 percent or less
Remittances play an important role in many communities across ASEAN and intra-regional migration is rising. Yet the cost of sending remittances varies considerably between different corridors in the region, from less than 3 percent in some to more than 14 percent in others. At the regional level, ASEAN countries could commit as a group to reduce the cost to a maximum of 5 percent (without increasing costs where they are currently lower than 5 percent). Among the top five corridors where costs currently exceed 5 percent alone, this could save migrants over $240 million a year. This commitment would be in line with a similar commitment made by the G20 in 2014.163
• Establish a regional framework for coordinating to reduce illicit finance
Illicit finance is a major drain on resources, impacting public revenues and reducing investment levels. Some countries in the region have signed up to international initiatives such as the base erosion and profit shifting initiative. Yet not all ASEAN countries are active in this agenda and implementation of measures to reduce illicit finance is at an early stage. To expedite this and broaden coverage across the region, ASEAN countries could consider a regional agreement to implement certain measures such as the automatic exchange of tax information and sharing of country-by-country reports within the region as a first step.
Recommendations to maximize the impact of specific types of finance on sustainable development outcomes• Establish monitoring/targets that link private investment to its impacts on all aspects of sustainable
development
Private investment has important contributions to make toward sustainable development beyond just the economic gains and job creation that are typically targeted and monitored. Private investment
161 Brunei, Indonesia, Malaysia, Singapore, Thailand and Viet Nam (see also chapter 2, box on illicit finance and BEPS).162 See analysis on this point in the report Oxfam Novib, Race to the bottom – tax incentives in South East Asia, Oxfam Novib, The
Hague, 2017. https://maketaxfair.net/race-bottom-tax-incentives-south-east-asia-2/ 163 See G20, ‘2014 Brisbane. The G20: Australia’s 2014 host year’, 2015. http://g20.org.tr/about-g20/past-summits/2014-brisbane/
Financing the SuStainable Development goalS in aSean
74
can develop skills and technology, spur innovation, build resilience through job security and benefits, contribute to infrastructure and impact the environment. Establishing systems for monitoring these impacts and developing targets about them can help governments weigh up trade-offs and support the development of more holistic policy toward the private sector. Other countries could examine Thailand’s recent Thailand 4.0 policy in this regard.
• Ensure a comprehensive, coordinated approach to influencing the business environment by centralising policy or establishing strong coordination mechanisms
Many aspects of the business environment influence the extent and way in which private investments are made and the impact they have. Responsibility for policy toward these aspects is often spread across a wide range of ministries and agencies. Without strong coordination, the success of reforms in one aspect of the business environment may be constrained by others. Centralising responsibility for the business environment or establishing strong coordination mechanisms can help governments address this. Other countries could learn from Cambodia’s approach toward its Industrial Development Policy in this regard.
• Develop a jointly managed monitoring framework for the 2030 Vision of China-ASEAN Strategic Partnership, and ensure this aligns with ASEAN regional and national priorities
The recent agreement to develop a joint vision for the China-ASEAN strategic partnership to 2030 and work toward two-way investment between China and ASEAN to $150 billion will offer significant sources of additional finance for infrastructure and other aspects of sustainable development. The agreement included the establishment of a vision document that would frame many aspects of the relationship. Building a strong, jointly managed monitoring framework into this agreement would be a key way to monitor and maximize the impact of this financing, ensuring it is invested effectively. ASEAN counterparts should work with China to ensure this vision and the implementation of the BRI in ASEAN aligns with regional and national development plans and infrastructure strategies. The joint vision for 2030 could also consider measures to channel investment to the ASEAN countries most in need of infrastructure and other investment.
• Monitor and set targets for the sustainable development impact of revenue mobilization strategies
The way that revenue is mobilized has important impacts on sustainable development beyond just raising funds for government to invest. The progressivity and sustainability of different revenue models can impact income distribution significantly. It can also create incentives that affect the way businesses and other actors operate which in turn may impact on sustainable development outcomes. As a first step, revenue authorities should establish mechanisms for monitoring the impact of their tax models on income distribution and other aspects of sustainable development, and incorporating this into monitoring systems for national development plans. Countries may also want to consider establishing explicit targets for this wider impact that sit alongside more common targets focused on raising certain amounts of revenue. Ultimately some governments may want to adjust the mandate of their revenue authorities to combine responsibility for raising revenue with managing the impact of revenue models on sustainable development.
• Plan ahead for reductions in international concessional finance
As countries graduate from LDC status or lose eligibility to borrow from multilaterals such as the International Development Association, the reduction in international concessional finance can affect investment and service delivery. This is true even in upper-middle-income contexts such as Thailand, related to international climate finance. Building the case and political consensus to allocate domestic public finance to areas previously funded internationally is one key challenge. Having sufficient domestic technical capacity can be another significant constraint. It can take years to build up a critical mass of people domestically with the relevant knowledge and experience to be able to drive forward an agenda where international experts previously played an important role. Countries should plan ahead for likely reductions in international concessional finance and in particular
75
Strengthening integrated national financing frameworks to deliver the 2030 Agenda
should work with development partners in the short term to put in place any education, skills development programme or other interventions that will make the transition smoother once it does happen.
Recommendations to strengthen integrated national financing frameworks• Estimate the cost of national development plans
Few countries have estimated the cost of their national development plans and where estimates of the scale of resources required exist they are typically based on a projection of existing resource trends into the future. Establishing broad estimates of the resources – the investments and ongoing spending – needed to realize the vision of a national development plan is an important basis for a structured approach to mobilising the necessary scale and mix of resources. Such estimates should account for the synergies and trade-offs between investments in interconnected areas of sustainable development.
• Develop clearer long-term plans about the scale and mix of resources needed to realize national development plans in an overarching financing strategy
An overarching financing strategy is a critical component of an integrated national financing framework as it provides a foundation on which to implement policies related to each type of finance. Based on estimates of the cost of the investments required to realize a national development plan (see previous recommendation), the financing strategy provides guidance about the mix and scale of resources that government should aim to mobilise. It outlines the finance instruments that will be used and the comparative advantages of all instruments and resources in different aspects of the national plan. It provides a foundation for managing trade-offs and balances, for example between debt and non-debt based instruments. And it addresses changes of a more structural nature that may need to be implemented to unlock new sources of finance.
• Integrate finance into central monitoring and evaluation systems
Finance is an important driver of sustainable development results, yet few countries have monitoring systems that are capable of tracking the outputs and outcomes generated by different types of finance. To fully understand the contribution that different types of finance, or different finance instruments, make toward the SDGs, countries could incorporate stronger and more comprehensive indicators that monitor the impact of all resources. For example, some countries have hierarchical monitoring frameworks that link government policy and programme outputs to outcomes, and outcomes to headline national development targets. Incorporating finance into such frameworks, and ensuring the scope is wide enough to monitor the impact of private finance as well as public, could help governments to better understand the contributions that different finance instruments can make.
• Establish stronger platforms for dialogue with non-state actors
Dialogue is essential for building the trust and shared ownership between government and its partners. Establishing platforms for systematic dialogue with partners – business, civil society, development partners and others – about the roles they can play in national sustainable development, and about how government can support them, is an important way to build consensus and mobilize the contributions of different actors. Dialogue is important for refining government’s understanding of the real constraints to greater private investment, for example, and for developing realistic objectives about what levels and types of investments may be possible. For private or international actors outside government, it helps to build an understanding of government’s priorities and ability to act in addressing different challenges.

Financing the SuStainable Development goalS in aSean
76
• Complete full development finance assessment processes
The development finance assessment and integrated financing solutions process has been designed to help governments identify areas for strengthening their management of all resources for the SDGs, using the lens of the integrated national financing framework. The development finance assessment offers a ‘big picture’ perspective that aggregates and assesses analysis across all types of finance and the policy and institutional structures used to govern them. This can be followed by ongoing support for priority reforms designed to generate and realign resources, avoid future expenditures, deliver better and strengthen transparency and accountability.164
Regional mechanisms to facilitate knowledge sharing• Establish an ASEAN integrated national financing framework peer review mechanism
All countries in the region have lessons they can share about their finance policies and institutional structures – and could learn from the experience and knowledge of their regional neighbours. There is strong demand for the knowledge sharing that a peer review mechanism could support (see box for further details).
• Adapt existing and planned ASEAN data platforms to develop a knowledge sharing platform on financing for sustainable development
Regional data hubs are an important mechanism for sharing information between stakeholders and for facilitating knowledge exchange among officials. The AEC has established an online data platform165 and the ASEAN Social-Cultural Community is also planning to do so. These could be brought together and combined with data on integrated national financing frameworks in a financing for sustainable development platform.
Such a platform could help meet the demand for information about common financing and policy challenges that other countries in the region face and the policy and institutional responses they have developed to address them. It could be designed to present data and analysis on these issues in a way that facilitates dialogue and exchange between officials working on these issues. To do so it could draw together the financing data collected by the AEC platform with the sustainable development progress and SDG data that will be collected by the planned ASEAN Socio-Cultural Community platform. These could be combined with data from the integrated national financing framework index being developed by UNDP that aggregates information from existing assessments to give an overview of the status and steps toward establishing an integrated national financing framework. The platform could also bring together relevant policy and institutional analysis and research to stimulate discussion on the reform processes and best practices countries in the region are following.
Such a platform would therefore provide a focal-point for learning and knowledge sharing about the policy and institutional reforms that can be undertaken to strengthen governance of finance for sustainable development results.
Establishing an ASEAN integrated national financing framework peer review mechanism
The examples and case studies highlighted throughout this report and the country papers that sit alongside it highlight an important message about the value of knowledge sharing within the region. All ASEAN countries have knowledge and learning to offer their neighbours about the policies and institutional structures they have developed – and there are areas for every
164 See more at: AP-DEF and UNDP, Development Finance Assessment and Integrated Financing Solutions, 2017. http:// procurement-notices.undp.org/view_file.cfm?doc_id=117734
165 ASEAN Statistics. http://www.aseanstats.org/

77
Strengthening integrated national financing frameworks to deliver the 2030 Agenda
country where they could learn from the experience of others. There is strong demand for this knowledge. In the process of developing this report and the country papers that support it, many governments directly requested information about how their regional neighbours had approached a similar challenge or policy priority.
Bringing these points together, there is a strong case to consider setting up a process for systematically sharing knowledge across the region: a peer review mechanism.
Peer review mechanisms are used globally in various contexts and have contributed to significant improvements in policy and institutions over time. For example, the OECD supports peer reviews among members on budget reforms,166 and the system includes engagement with Asian countries. The OECD also has a peer review mechanism for development cooperation agencies.167 The African Peer Review Mechanism is a specialized agency of the African Union that offers an assessment process focused on governance to support political stability, high economic growth, sustainable development and accelerated sub-regional and continental economic integration.168 And Pacific Islands countries use a peer review mechanism that focuses on public financial management and development effectiveness as part of the Forum Compact.169
Drawing on the experiences of peer review mechanisms elsewhere alongside the needs and opportunities in the ASEAN region, an ASEAN integrated national financing framework peer review mechanism could be established with some of the following characteristics:
• A voluntary system: governments would request peer reviews on a periodic basis, ideally timed to coincide with windows of opportunity for reform in their own national planning cycles, for example to feed into the development of a five-year plan.
• Countries may aim for a review every five years or so. This would allow sufficient time for reforms from previous reviews to have been established and would fit with many countries’ five-year planning cycles. For the region as a whole it may mean undertaking roughly two reviews a year in order for all countries to be reviewed in a five-year period.
• Reviews would use the lens of the integrated national financing framework to assess the strength of a country’s financing system and identify reform priorities. They could use an adapted version of the development finance assessment methodology.
• Reviews would be practically focused: designed to produce recommendations about tangible steps that the government under review could take to strengthen their systems.
• Peer review teams would include specialists from a number of other countries in order to allow lessons to be shared widely across the region.
• Peer review teams would include senior specialists in each area of the integrated national financing framework and be led by someone who is able to take a ‘big picture’ view across an integrated national financing framework as a whole. In the first few reviews this may be someone who has led a development finance assessment oversight team.
166 The Working Party of Senior Budget Officials includes budget directors and senior officials from Ministries of Finance and Treasuries across the OECD. The group undertakes periodic reviews of budgeting systems in member or partner countries. Via the OECD-Asian Senior Budget Officials engagement, reviews of a number of ASEAN countries have been completed, including: Indonesia (in 2009), the Philippines (2010), Singapore (2006) and Thailand (2006). See more at: http://www.oecd.org/gov/budgeting/workingpartyofseniorbudgetofficialssbo.htm
167 Peer reviews of OECD DAC members are undertaken around every five years to help the country think about how it can improve its development strategy and structures to increase the effectiveness of its investments. The process typically takes around six months. See more at: http://www.oecd.org/dac/peer-reviews/
168 See more at: African Peer Review Mechanism, Africa’s Self-Assessment for Good Governance http://www.aprm-au.org/index169 See more at: Pacific Islands Forum Secretariat, Forum Compact Peer Review Reports. http://www.forumsec.org/pages.cfm/strategic-
partnerships-coordination/pacific-principles-on-aid-effectiveness/forum-compact/forum-compact-peer-review-reports.html

Financing the SuStainable Development goalS in aSean
78
Annex
Data and definitionsAnalysis of financing flows has been undertaken from the country perspective, thus national data sources were preferred over international datasets, where adequate coverage and metadata were provided. Across the 10 country papers and regional report included in the project, all financing data and analysis is in constant 2015 US dollars unless otherwise stated. Data from national sources reported in national currencies was converted into constant US dollars using exchange rates and GDP-based deflators following normal practice.
Domestic public finance
Domestic public finance refers to government resources that originate domestically. It covers government revenue (excluding any grants received, to avoid double counting with international resources) and government borrowing from domestic sources (i.e. domestic financing). Both series were sourced from national budget documents where available, with data from International Monetary Fund Article IV Reports used to fill gaps, where needed.
Domestic private finance
Domestic private finance refers to investment by the domestic private sector in the country. Few countries produce data on domestic commercial investments directly so gross fixed capital formation is used as a proxy, with capital expenditure and FDI deducted to obtain a figure for domestic private investment alone. Gross fixed capital formation data excludes certain types of investments such as land sales and purchases and all kinds of financial assets, and it does not make any deductions for depreciation of fixed assets. These estimates should therefore be treated as estimates of the general trends and scale of this financing.
International private finance
International private finance includes FDI, portfolio equity, private borrowing from international sources and remittances. FDI data are based on national sources for all countries. Portfolio equity and remittances were based on national sources for countries with enough coverage, or World Bank data otherwise. Portfolio equity data based on national sources was sourced from the liabilities line of portfolio investments (equity component) in balance of payments tables. Private borrowing from international sources refers to commercial debt (both long- and short-term) and is based on international data from the World Bank International Debt Statistics for all countries. This was done for consistency across the country papers and due to patchy coverage and availability of data on this type of finance in national sources.
International public finance
International public finance includes official development assistance (ODA), other official flows (OOF) and government borrowing from international sources. ODA is sourced from OECD DAC data. OOF data are sourced from OECD DAC Table 2B for all countries as comprehensive data on this type of finance is not readily available from national sources. Government borrowing refers to lending from bilateral and multilateral institutions and private entities received or guaranteed by the state. For consistency across country papers and to ensure that overlaps with ODA loans and OOF could be accounted for, data for this flow was also sourced from international datasets for all countries.

