financing water and sanitation - oecd financing water and sa3 nitation also, this report argues that...
TRANSCRIPT
Financing water and sanitationFinancing water and sanitationFinancing water and sanitationFinancing water and sanitation Key issues in increasing resources toKey issues in increasing resources toKey issues in increasing resources toKey issues in increasing resources to
the sectorthe sectorthe sectorthe sector
A WaterAid briefing paper written byA WaterAid briefing paper written byA WaterAid briefing paper written byA WaterAid briefing paper written by S. Annamraju, B.Calaguas & E.GutierrezS. Annamraju, B.Calaguas & E.GutierrezS. Annamraju, B.Calaguas & E.GutierrezS. Annamraju, B.Calaguas & E.Gutierrez
November 2001November 2001November 2001November 2001
WaterAid Financing water and sanitation2
SUMMARYSUMMARYSUMMARYSUMMARY
Water and sanitation struggle to receive funding in the developing world, wheregovernments are pressed with struggling economies, huge debts and a host of othersocio-political problems. Most often, they have to prioritise other basic social services,such as education and health, over water and sanitation. In general developing countriesspend anywhere between 1% and 3% of government budgets on low cost water andsanitation.
This report looks at the different sources of finance available for the global water andsanitation sector and how the financing gap can be filled to achieve universal access.
Currently, it is estimated that some US$27-30 billion is spent annually on the water andsanitation sector in developing countries. Of this amount, close to 70% come from thedomestic public sector. A further 20% come from international aid flows, and theremaining 10% come from international private sector and community/householdinvestments.
However, these current levels of spending are woefully inadequate. It has beenestimated that if international development targets of halving the number of peoplewithout access to water and sanitation are to be met by 2015, a further US$25 billioneach year is needed on top of what is already being spent. Of this amount, sanitationneeds to be prioritised, taking as much as US$17 billion, with the rest going to watersupply. The financing problem therefore, can be stated as: How can current levels ofspending at US$27-30 billion for water and sanitation at the global level be sustained,while securing an additional US$25 billion per year, of which sanitation gets the priority?
This problem is mainly an international problem and not just a problem of the concerneddeveloping countries. For instance, a most important measure to address the problem isdebt relief – it can provide governments in Africa, some of which spend up to 60% oftheir national budget on foreign debt service payments, with already available funding.On the other hand, official development aid from member countries of the OECDDevelopment Assistance Committee amounts on average to only 0.24% of theircombined GNP. If these donors can meet the UN agreed target of providing aidamounting to 0.7% of GNP for only two years, it will eliminate the US$245 billion debt ofall 41 Highly Indebted Poor Countries. There are a range of other sources of financing –from private sector financing (bank loans and direct investments) to the reallocation ofcurrent government expenditures and to household and community financing. These aresolutions that the international community needs to focus on. The political will necessaryto get a tight grip on the problems and implement the solutions needs to be developed.
This report argues that contrary to current thinking, the private sector cannot fill theinvestment gap. The solution lies in the following three areas: 1) efforts should bedirected towards Northern governments, which should be lobbied to provide more officialaid. 2) Southern governments should be lobbied to increase their financial allocations tothe water and sanitation sector. 3) Further effort should be directed to both Northern andSouthern governments to recognise the investments that are currently (and will continueto be) made by communities and householders.
WaterAid Financing water and sanitation3
Also, this report argues that where financial resources are available, a restructuring ofpublic sector expenditure is needed in order to improve delivery and coverage. In someinstances, the problem has less to do with the absence of financing than with issues ofhow to spend available funds more wisely and sustainably. This, again, is a matter ofpolitical will and of improving the governance of the sector.
This briefing paper is one of a series which analyses policy issues that impact on thewater and sanitation sector. Other papers in the series are:
A human rights-based approach to water, sanitation and hygieneA poverty-reduction approach to water, sanitation and hygiene programmesA gender and development approach to water, sanitation and hygiene programmesBoiling Point: Issues and problems in water security and sanitation
WaterAidPrince Consort House27-29 Albert EmbankmentLondonSE1 7UB
Telephone: 020 7793 4500Fax: 020 7793 4545Email: [email protected]: www.wateraid.org.uk

WaterAid Financing water and sanitation4
List of AcronymsList of AcronymsList of AcronymsList of Acronyms
ADB - Asian Development BankCSD - Commission on Sustainable DevelopmentDAC - Development Assistance Committee (of the OECD)DFID - Department for International Development, UKESAF - Enhanced Structural Adjustment FacilityFfA - Framework for ActionGDP - Gross domestic productGEF - Global Environmental FundHIPC - Highly Indebted Poor CountryIMF - International Monetary FundNGO - Non-government organisationNPV - Net present valueO&M - Operation and maintenanceODA - Official development assistanceOECD - Organisation for Economic Co-operation and DevelopmentOPP - Orangi Pilot ProjectPPI - Private participation in infrastructurePRSP - Poverty Reduction Strategy PaperPSP - Private sector participationSSIP - Small-scale independent providerUNDP - United Nations Development ProgrammeUNFPA - United Nations Population FundUNICEF - United Nations Children’s FundWB - World BankWCD - World Commission on DamsWHO - World Health OrganisationWSS - Water supply and sanitationWSSCC - Water Supply and Sanitation Collaborative Council

WaterAid Financing water and sanitation5
CONTENTSCONTENTSCONTENTSCONTENTS
IntroductionIntroductionIntroductionIntroduction 6
Financial flows to the water and sanitation sectorFinancial flows to the water and sanitation sectorFinancial flows to the water and sanitation sectorFinancial flows to the water and sanitation sector 7 Investments in water-related infrastructure in developing countries 8 International aid and credit flows for WSS 9 International private sector flows 11 Domestic public sector flows in water supply and sanitation 12 Domestic private flows: formal and informal 12
Future financing needs to meet targets for universal coverageFuture financing needs to meet targets for universal coverageFuture financing needs to meet targets for universal coverageFuture financing needs to meet targets for universal coverage 14
Mobilising resources – misconceptions and truthsMobilising resources – misconceptions and truthsMobilising resources – misconceptions and truthsMobilising resources – misconceptions and truths 14 Mobilising bilateral aid 15 Reallocation of public sector resources 16 International private sector investments 17 Debt relief 18 Households/community financing 19
Global initiatives towards financing basic social servicesGlobal initiatives towards financing basic social servicesGlobal initiatives towards financing basic social servicesGlobal initiatives towards financing basic social services 20 The 20/20 Initiative 20 Financing water supply and sanitation under Agenda 21 21 Global innovative mechanisms 21
RecommendationsRecommendationsRecommendationsRecommendations 21
ConclusionsConclusionsConclusionsConclusions 22
References and appendicesReferences and appendicesReferences and appendicesReferences and appendices 24
WaterAid Financing water and sanitation6
I. IntroductionI. IntroductionI. IntroductionI. Introduction
The financing gap is a real and perhaps most immediate problem working against therealisation of universal access to water and sanitation. A sustainable financing strategy isneeded, one that will increase resource allocations to the sector, improve the efficiencyand effectiveness of existing resources wherever they are found, and tap the potential ofalternative financing mechanisms. But huge obstacles stand in the way of such astrategy. Aid flows to developing countries for the water sector has not kept up withpopulation growth, and are largely fragmented. Developing countries, in general, do notprioritise spending on the sector – low cost water and sanitation receive only between1% (Sub Saharan Africa) to 3% (Latin America and the Caribbean) of government budgets(Paris21, 2000). Water and sanitation budgets struggle for allocations, especially wherebasic social services as education and health are prioritised. Lagging economic growth,structural adjustment difficulties and growing pressures to reduce governmentexpenditures further compound the difficulties.
This paper critically examines the different sources of financing available for the waterand sanitation sector at a global level, and outlines the key issues in filling the financinggap. The paper argues that universal access to water and sanitation cannot be achievedwithout increased resources to the sector, and that contrary to donor sentiment, theprivate sector cannot solely fill that investment gap. What is needed are efforts directedtowards Northern governments to lobby for increased official development assistance(ODA), efforts directed towards southern governments to increase governmentallocations, and further efforts directed to northern and southern governments torecognise and facilitate the investments currently being made by households andcommunities.
Over the past two decades, a number of declarations have sought to improve access tosafe water and sanitation services. The UN International Decade for Drinking Water andSanitation (Water Decade) heightened global awareness to the severity of the problem,created innovative solutions to the provision of water and sanitation, increased financialcommitments to the sector and improved the absolute number of people with access.
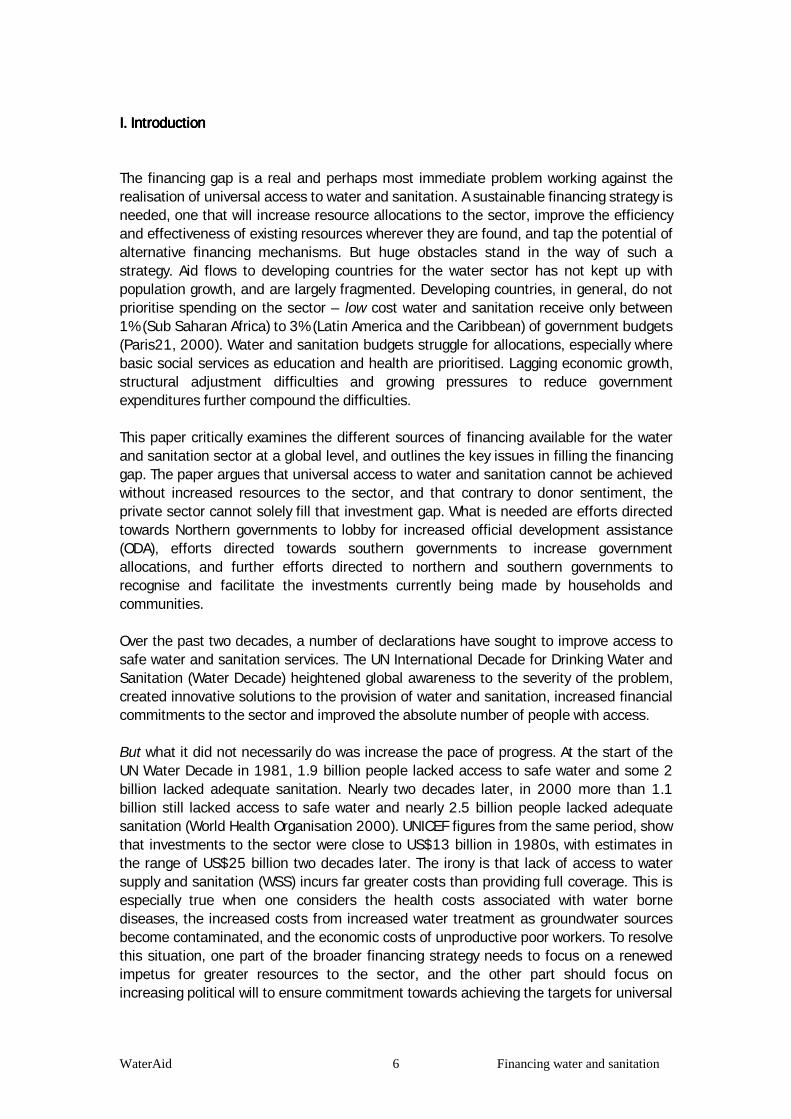
But what it did not necessarily do was increase the pace of progress. At the start of theUN Water Decade in 1981, 1.9 billion people lacked access to safe water and some 2billion lacked adequate sanitation. Nearly two decades later, in 2000 more than 1.1billion still lacked access to safe water and nearly 2.5 billion people lacked adequatesanitation (World Health Organisation 2000). UNICEF figures from the same period, showthat investments to the sector were close to US$13 billion in 1980s, with estimates inthe range of US$25 billion two decades later. The irony is that lack of access to watersupply and sanitation (WSS) incurs far greater costs than providing full coverage. This isespecially true when one considers the health costs associated with water bornediseases, the increased costs from increased water treatment as groundwater sourcesbecome contaminated, and the economic costs of unproductive poor workers. To resolvethis situation, one part of the broader financing strategy needs to focus on a renewedimpetus for greater resources to the sector, and the other part should focus onincreasing political will to ensure commitment towards achieving the targets for universal

WaterAid Financing water and sanitation7
access by 2025. Aid resources and government budget allocations remain the primaryresource for development and an important test of commitment to poverty eradication.
Graph 1: Trends in w ater and sanitation coverage (1980-2000) All developing countries
3.2
4
4.9
1.5
2.7
3.9
1.1
22.7
0
1
2
3
4
5
6
1980 1990 2000
Bill
ion
Population
W ater
Sanitation
II. Financial flows to the water and sanitation sectorII. Financial flows to the water and sanitation sectorII. Financial flows to the water and sanitation sectorII. Financial flows to the water and sanitation sector
From existing analyses in the field, the following profile of the water and sanitation sectorcan be reconstructed. Data inconsistency between countries, sectors and sources hasresulted in different approaches to estimations of water-related infrastructureinvestments. However, the convergence of data patterns from these differentapproaches lends some credence for the analysis of breakdown of water and sanitationflows by sector that is derived in this paper. The profile reveals that the total flows to theWSS sector are converging to a figure of US$27-30 billion (Sunman 1999, Briscoe 1998,GWP 2000).
The task of understanding where the money for water and sanitation comes from iscomplex. Water and sanitation sector components are embedded within overall watersector expenditures (including drainage, irrigation, hydro power investments etc.) andwithin health or infrastructure investments. Furthermore, reports on water and sanitationinvestments do not necessarily differentiate between investments made to improveexisting (largely urban) water and sanitation infrastructure and services, and investmentsto provide facilities and services to populations currently unserved (largely in rural areasand in urban poor areas). The water and sanitation sector is under the authority ofmunicipal, central and regional decision-makers and expenditures are made at all levels.This makes the task of tracking investment decisions and actual expenditure difficult.However, a number of general observations can be made:
♦ Financial flows in the water sector are derived from a large range of sourcesincluding overseas development assistance, loans, grants, international privatesector investments, investments by the domestic small-scale private providers, publicsector expenditures and individual household and community investments. But thedominant sources still remain the public sector and external aid flows.
WaterAid Financing water and sanitation8
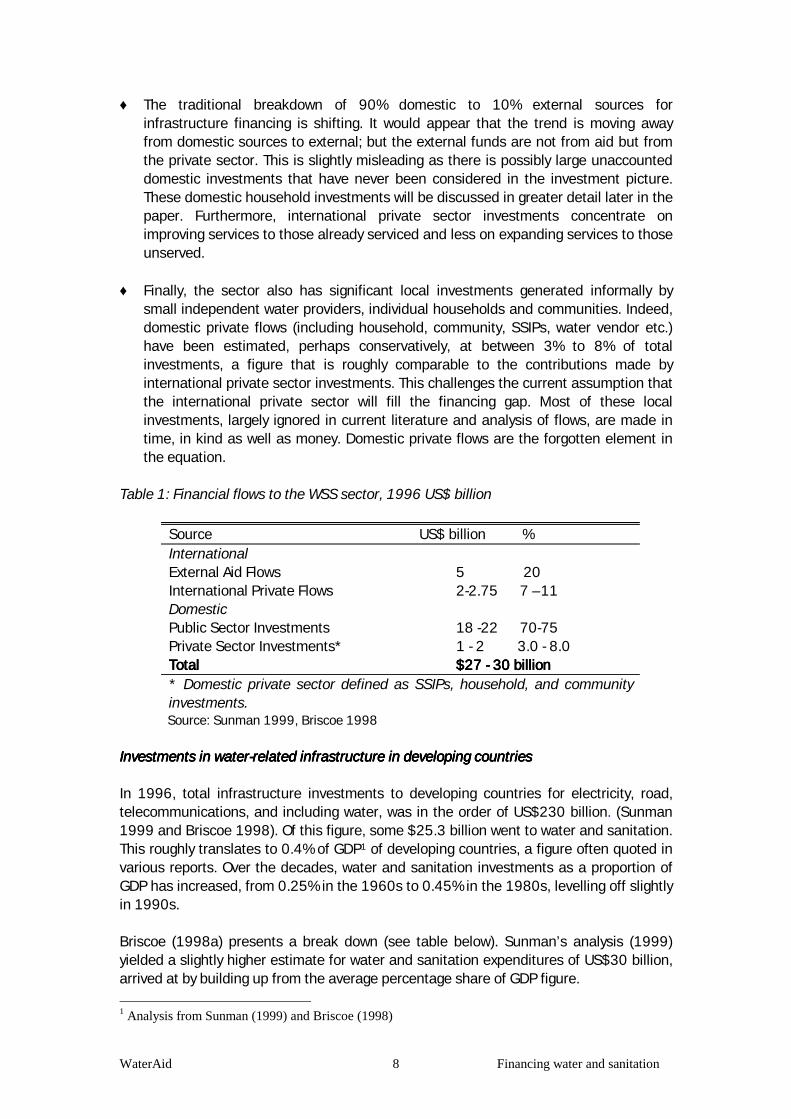
♦ The traditional breakdown of 90% domestic to 10% external sources forinfrastructure financing is shifting. It would appear that the trend is moving awayfrom domestic sources to external; but the external funds are not from aid but fromthe private sector. This is slightly misleading as there is possibly large unaccounteddomestic investments that have never been considered in the investment picture.These domestic household investments will be discussed in greater detail later in thepaper. Furthermore, international private sector investments concentrate onimproving services to those already serviced and less on expanding services to thoseunserved.
♦ Finally, the sector also has significant local investments generated informally by
small independent water providers, individual households and communities. Indeed,domestic private flows (including household, community, SSIPs, water vendor etc.)have been estimated, perhaps conservatively, at between 3% to 8% of totalinvestments, a figure that is roughly comparable to the contributions made byinternational private sector investments. This challenges the current assumption thatthe international private sector will fill the financing gap. Most of these localinvestments, largely ignored in current literature and analysis of flows, are made intime, in kind as well as money. Domestic private flows are the forgotten element inthe equation.
Table 1: Financial flows to the WSS sector, 1996 US$ billion
Source US$ billion % International External Aid Flows 5 20 International Private Flows 2-2.75 7 –11 Domestic Public Sector Investments 18 -22 70-75 Private Sector Investments* 1 - 2 3.0 - 8.0 TotalTotalTotalTotal $27 - 30 billion$27 - 30 billion$27 - 30 billion$27 - 30 billion * Domestic private sector defined as SSIPs, household, and communityinvestments.
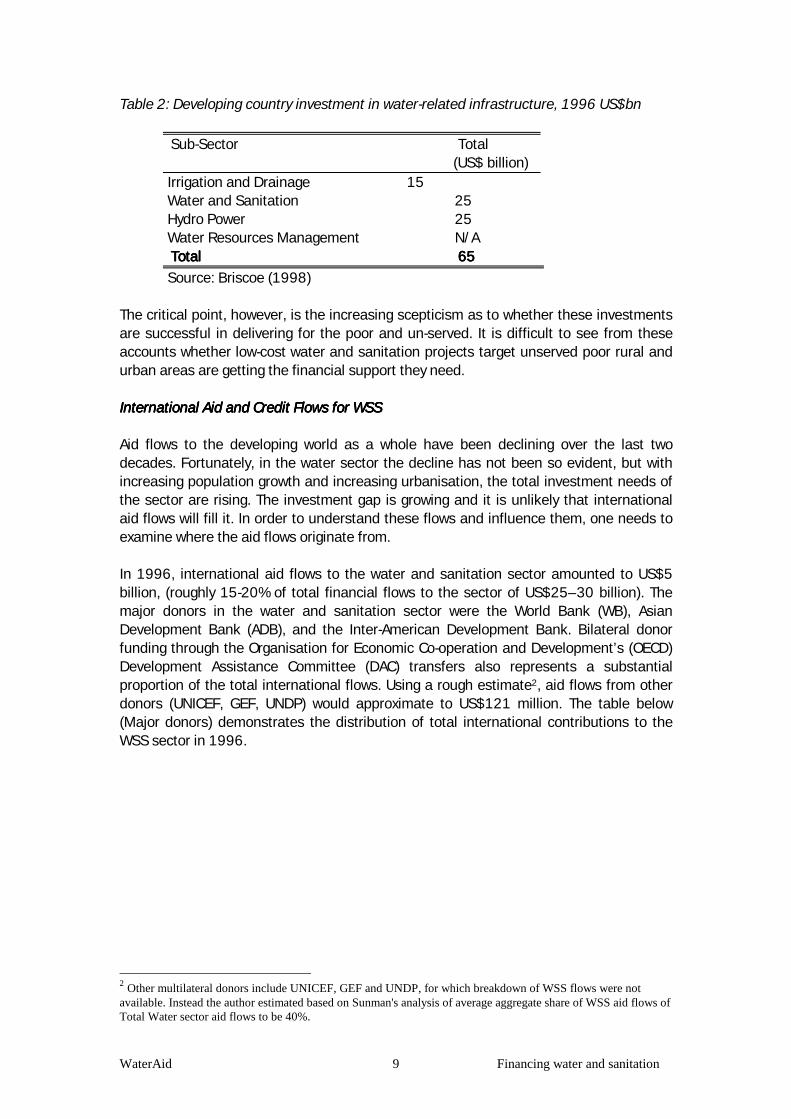
Source: Sunman 1999, Briscoe 1998 Investments in water-related infrastructure in developing countriesInvestments in water-related infrastructure in developing countriesInvestments in water-related infrastructure in developing countriesInvestments in water-related infrastructure in developing countries In 1996, total infrastructure investments to developing countries for electricity, road,telecommunications, and including water, was in the order of US$230 billion. (Sunman1999 and Briscoe 1998). Of this figure, some $25.3 billion went to water and sanitation.This roughly translates to 0.4% of GDP1 of developing countries, a figure often quoted invarious reports. Over the decades, water and sanitation investments as a proportion ofGDP has increased, from 0.25% in the 1960s to 0.45% in the 1980s, levelling off slightlyin 1990s. Briscoe (1998a) presents a break down (see table below). Sunman’s analysis (1999)yielded a slightly higher estimate for water and sanitation expenditures of US$30 billion,arrived at by building up from the average percentage share of GDP figure. 1 Analysis from Sunman (1999) and Briscoe (1998)
WaterAid Financing water and sanitation9
Table 2: Developing country investment in water-related infrastructure, 1996 US$bn
Sub-Sector Total (US$ billion) Irrigation and Drainage 15 Water and Sanitation 25 Hydro Power 25 Water Resources Management N/A TotalTotalTotalTotal 65656565
Source: Briscoe (1998) The critical point, however, is the increasing scepticism as to whether these investmentsare successful in delivering for the poor and un-served. It is difficult to see from theseaccounts whether low-cost water and sanitation projects target unserved poor rural andurban areas are getting the financial support they need. International Aid and Credit Flows for WSSInternational Aid and Credit Flows for WSSInternational Aid and Credit Flows for WSSInternational Aid and Credit Flows for WSS Aid flows to the developing world as a whole have been declining over the last twodecades. Fortunately, in the water sector the decline has not been so evident, but withincreasing population growth and increasing urbanisation, the total investment needs ofthe sector are rising. The investment gap is growing and it is unlikely that internationalaid flows will fill it. In order to understand these flows and influence them, one needs toexamine where the aid flows originate from. In 1996, international aid flows to the water and sanitation sector amounted to US$5billion, (roughly 15-20% of total financial flows to the sector of US$25–30 billion). Themajor donors in the water and sanitation sector were the World Bank (WB), AsianDevelopment Bank (ADB), and the Inter-American Development Bank. Bilateral donorfunding through the Organisation for Economic Co-operation and Development’s (OECD)Development Assistance Committee (DAC) transfers also represents a substantialproportion of the total international flows. Using a rough estimate2, aid flows from otherdonors (UNICEF, GEF, UNDP) would approximate to US$121 million. The table below(Major donors) demonstrates the distribution of total international contributions to theWSS sector in 1996.
2 Other multilateral donors include UNICEF, GEF and UNDP, for which breakdown of WSS flows were notavailable. Instead the author estimated based on Sunman's analysis of average aggregate share of WSS aid flows ofTotal Water sector aid flows to be 40%.

WaterAid Financing water and sanitation10
Table 3: Major donors (US$ million, current prices, 1996 figures)
Donors Total WaterInvestments3
Water &sanitationInvestments
WSS as a % ofTotal WaterInvestments
InvestmentsWSS as a % ofTotal Aid
Total ODA from DAC members (1) 4695 3034 64.7% 6.6% World Bank 1682.6 366.1 7.8% 1.7% Asian Development Bank (2) 1313 609.2 45.8% 11.3% European Union (1995) 249 89.2 35.8% (3) - Inter-American Dev’t Bank(1998)
820(4) 820 - -
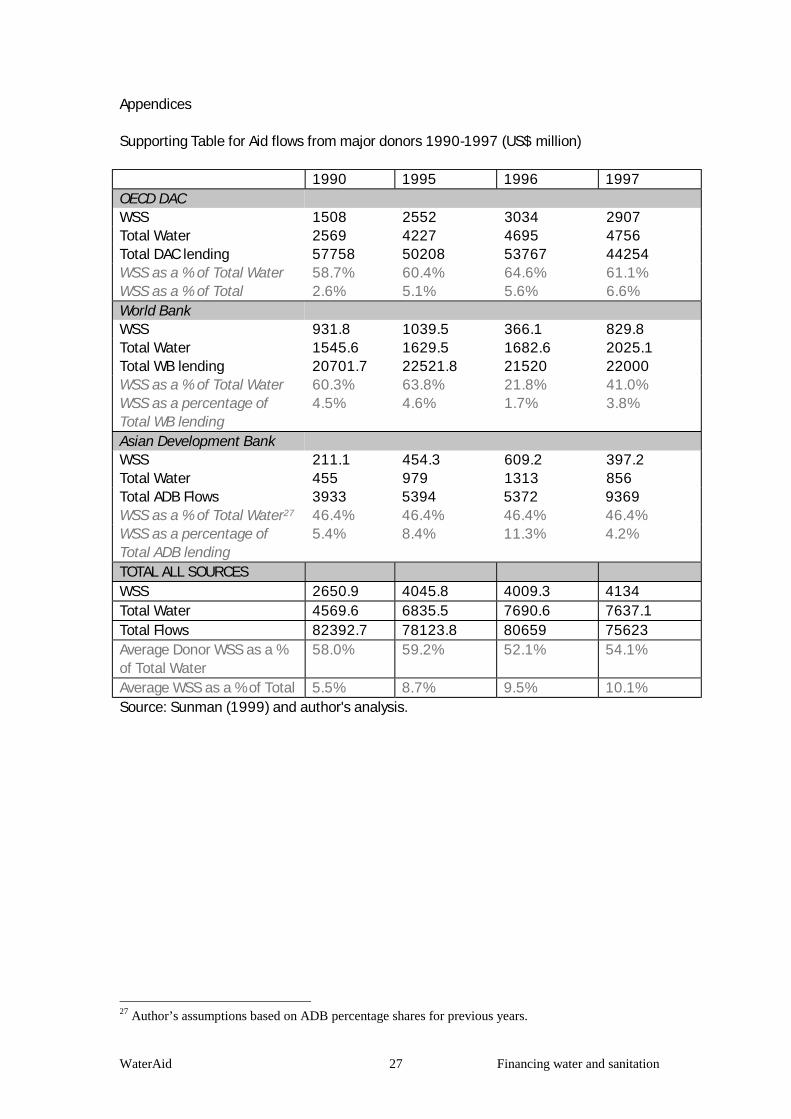
UNDP } 192 40%- - Global Environment Facility } 121.2 39.6 40% - UNICEF } 75 40% - TOTAL 9066.2 5039.7 56% 1. Source: OECD DAC Member Water Supply and Sanitation - Total ODA 1986-1996,OECD/DCD/DAC. 2. Source: data extrapolated from Asian Development Bank, "The Bank's Policy on Water", 1998. 3. 1995 WSS share extracted from 1980-1995 period share % presented. 4. Sanitation only lending. 5. Source: Extrapolated from Sunman (1999), pp 5-8. 6. Source: All other data from Sunman (1999) Table 1.3 The World Bank, bilateral ODA and Asian Development Bank contributions represent thelargest proportion of donor funding at 85% of total donor flows to WSS accounting forbetween $4-4.5 billion. The largest bilateral donors to water and sanitation are Japan,the US, France and Germany4. Sixty percent of DfID's expenditure on water relatedprojects (£50 million in 1998/1999) went into urban and rural water supply andsanitation. In 1998, that amounted to approximately £30 million (some $46 million).5Despite current trends, ODA could possibly rise with a greater push for additional aid tomeet the highly indebted poor country (HIPC) II initiative financing requirements (seelater sections). Though documented, donor flows to the water and sanitation sector arefragmented and must be treated with some caution as they also have beendisaggregated and averaged using broad share percentages over various time periods. OECD and WB analyses of aid flows show that total official development assistancedeclined during the 1990s but that flows to the water and sanitation sector rose. Table 4(See Appendices) illustrates how average donor flows to the WSS sector, as a percentageof total water sector flows, marginally declined over the period of 1990-1997 from 58%to 54% while average WSS flows as a percentage of total aid flows increased over thesame period from 5% to 10%.
3 Includes investments in water supply, sanitation, drainage, irrigation, hydropower. 4 Japan, Germany, France, the Netherlands, Finland, Denmark consistently allocate between 4% - 9% oftheir ODA on water and sanitation over the years. In comparison, the UK government allocated onaverage only 2.4% of ODA to water and sanitation throughout the 1990s. (DAC statistics) 5 Government of UK, Statistical Service, ‘Statistics on International Development 1994/95 – 1998/99’.This figure includes project aid, technical co-operation expenditures, aid and trade provision, grants andother aid in kind, and Common Development co-operation (CDC investments). Aid and trade provisionwas ended in 1997 by the Labour party government, but the carry-overs from the previous year was stillincluded in this figure for 1998/99.

WaterAid Financing water and sanitation11
Graph 3 - Private sector investments in water and sewerage in developing countries, by region 1990-1997 (in US$
millions)
Europe and Central Asia - $1499m in 15
projects
East Asia and the Pacific -
$11,913m in 30 projects
Latin America / Caribbean -
$8225m in 40 projects
Middle East/ North Africa - $3275m in 4
projects
Sub Saharan Africa - $37m in 8
projects
Though overall bilateral OECD DAC aid flows declined from $58 billion in 1990 to $44billion in 1997, the share of WSS increased from 2.2% in 1990 to 6.6% in 1997,suggesting that WSS fared better than other water sub-sectors. World Bank support tothe WSS sector has declined steadily throughout the same period from 4.5% to 3.8% oftotal WB flows, congruent with the decline in WB support for all water sectors.6. For theADB, the share of WSS declined in the face of increasing aid flows. EU patterns ofspending in WSS are also consistent with that of the World Bank. Sunman (1999) andBriscoe (1995) contend however, that though public sector spending and aid flowsdeclined over the first half of the 1990s, international private sector investmentsincreased over the same period, thus the total spending on WSS from all sourcesremained at 0.4% of GDP. International private sector flowsInternational private sector flowsInternational private sector flowsInternational private sector flows There has been a marked increase in the level of corporate private investments in theWSS over the past two decades. However, large proportions of these investments havebeen to middle-income countries rather than the developing countries that are most inneed of investments (see Graph 3). Sunman (1999) demonstrates that between 1984and 1990, only US$297 million was invested in 8 WSS World Bank contracts in thedeveloping world. Between 1990 and 1997, this increased to US$24.9 billion covering97 contracts7. These investments were made primarily in Latin America and East Asia.Only 8 contracts valued at $37 million were in Sub Saharan Africa, which is a negligibleshare of the total investment. These contracts include all types of private sectorinvestments (management contracts, leases and concessions)8. Of these, concessionsare the most common arrangement of private sector participation (PSP) both in terms ofnumber and size of investment. Source: Silva, et al 1998, from PPI Project Database 6 1998 figures are not shown for the multilaterals, preliminary scans of available data show a markeddecline in overall total aid flows in that year for all three agencies. 7 Data obtained from World Bank Private Participation Infrastructure (PPI) Project Data Base only 8 Large discrepancies exist between what is constituted as private sector investments and World Bank'scontracts in WSS in their PPI database. It is unclear whether there is double counting from World Bankflows to the sector and lending to the private sector.
TOTAL: US$ 24,950 million in97 projects

WaterAid Financing water and sanitation12
In 1996, private investment in infrastructure amounted to US$ 25 billion, accounting for15% of all investment in developing countries’ infrastructure (Briscoe 1998b). Of thisamount, only 11%9 or US$2.75 billion were invested in the WSS sector.10
The World Bank's agenda for the water and sanitation sector promotes private sectorinvolvement as a means of improving efficiency and closing the investment gap. The roleof the private sector in operating and financing water and sanitation facilities will deepenand mature in coming years, but its impact on poorer developing countries is yet to beseen. What is certain is that currently, the international private sector has investedprimarily in middle-income countries in East Asia and Latin America where the enablingenvironment exists for higher profitability and reduced risks. Domestic public sector flows in water supply and sanitationDomestic public sector flows in water supply and sanitationDomestic public sector flows in water supply and sanitationDomestic public sector flows in water supply and sanitation As Table 1 shows, public sector flows are estimated to be between 70% and 75% of totalinvestments in the WSS sector. This is estimated to be in the order of US$18-22 billion.National governments therefore remain as the chief and most important source of WSSfinancing. Further analysis needs to be done on how this money is invested, and whatpercentage of these investments go to improving services to those already servedagainst expanding services to those unserved. Many of these governments, whileproviding for these amounts are under tremendous political and economic burdens. It isnot unusual to find national governments in sub-Saharan Africa allocating up to 60% oftheir national budgets for debt service payments. These governments need to besupported, and enabled, as they will remain to be the key investors and principal playersmoving water and sanitation projects on the ground. Domestic private flows: formal and informalDomestic private flows: formal and informalDomestic private flows: formal and informalDomestic private flows: formal and informal Water and sanitation services have traditionally been seen as the domain of the publicsector and public finance. However a new model is now emerging with changing roles forthe public sector, and new emerging institutions. The recognition that public utilities arefailing to meet their social goal of universal access has prompted the search for newsolutions. In this context, the role of the domestic private sector (small scaleindependent providers, water vendors, public tankers) and household and communityinvestments, largely ignored by the policy makers, is starting to attract attention andscrutiny from policy analysts. Previously, water vendors, public tap managers, and publictankers were seen as part of the informal economy, but in some cases they are nowbeing recognised as legitimate players within the service delivery arena. In mostdeveloping countries, the informal sector is servicing more than 50% of the overallmarket (Solo 1998). Examples of their investments to the sector are rare and moststudies use localised case studies to extrapolate widely.
9 Source: http://www.worldbank.org/html/fpd/water/projectlending.html 10 This figure is in the ballpark of both Sunman's and Briscoe's figures.

WaterAid Financing water and sanitation13
Case Study: Low Cost Sanitation model replicated in Faisalabad, Pakistan The Orangi Pilot Project’s model for low cost sanitation in Karachi has often been cited as difficult toreplicate due to mitigating geographical factors in Karachi. However, in Faisalabad, with someadjustments, the Anjuman Samaji Behbood (ASB), was able to replicate the model of low costsanitation piloted by the OPP. This model necessitates communities to be responsible for mapping,building and paying for lane sewers on the one hand (what the project terms as internal work) and forthese sewer lines to connect to trunk sewers that were the responsibility of government (termedexternal work). ASB pursued negotiations with the Faisalabad Water and Sanitation Authority, as well as conductedsocial mobilisation work with the communities. Unlike Karachi, Faisalabad was on flat terrain, thus itwas necessary for a collector sewer to be constructed. This increased the costs to the households totwice that in the OPP project. ASB extended further credit to the households to continue to pump-prime their involvement. With the successful construction of the first lane sewers, households fromother lanes took interest and approached ASB for loans to build their own lane sewers. Communities, with ASB’s help, have now installed 52,120 feet of sewerage lines, connected to trunksewers of FWASA, serving 2,578 households at a cost to the community of Rs7,182,137 (£81,615). (Zaidi, A. 2001)
For example in Burkina Faso where 50% of the countries' water supply has been"concessioned" to private operators, water vendors invest up to US$500 for animaldrawn water carts and US$150 for hand-drawn ones. The formal sector of small privateoperators also invests significantly in diesel engines, pump equipment, and pump repairsfor their enterprise.11
Parts of domestic private investments in the sector are made by individual households;either in community-managed and constructed facilities or individual householdinvestments in WSS. For example, many rural water supply and sanitation projects haveaspects in their project design that mobilise community investments in kind, in time, orcash. (See case study on the ASB in Faisalabad, Pakistan) These investments are rarely included in most investment measures, but are seen to bea sizeable component in water infrastructure investments. In Jakarta, 53% of thehouseholds rely on private wells and 32% on water vendors. Household investments inseptic tanks alone are estimated at $400 million12. Extrapolated over all the other majorcities in Indonesia, and over all developing countries, these investments amount to asignificant proportion of overall infrastructure investment in the sector. However, inIndonesia as in most countries, the financial flows to the sector do not normally containestimates of these investments. Globally, Sunman (1999) provides a crude estimation ofthe value of these investments at US$800 million a year for urban households. Thisprobably underestimates the value of the private informal sector and does not includethe investments made by households in private wells and septic tanks in both urban andrural areas.
11 Collignon, Bernard (1999). 12 Briscoe (1998a)
WaterAid Financing water and sanitation14
While there have been serious efforts to bring in formal private sector investments intoWSS, little has been done internationally to recognise such contributions, especiallythose made by poor people themselves, in solving their water and sanitation problems.The ASB experience in Faisalabad, Pakistan shows that this can be organised at a largescale, and lead to very promising results. III. Future financing needs to meet targets for universal coverageIII. Future financing needs to meet targets for universal coverageIII. Future financing needs to meet targets for universal coverageIII. Future financing needs to meet targets for universal coverage The Framework for Action (FfA) report estimated future financing needed for the sector. Itsuggested that an additional US$8 billion per year for water supply and US$17 billion per yearfor sanitation13 was needed in addition to the estimated US$30 billion currently being investedin the sector (GWP 2000). Other estimates within the 20/20 Initiative (see later section) placethe future financing needs at US$16 billion for both water and sanitation. The figures in the FfAwere derived by using estimates per beneficiary for rural and urban populations without watersupply and sewered and networked sanitation, each representing a quarter of the totalinvestment needs. The rural per-beneficiary cost estimates were drawn from Water andSanitation Collaborative Council (WSSCC) estimates in Vision 21 and are for low-cost technologysolutions14. By all accounts, these global financing estimates need to be refined andsupplemented by country-specific targets and investment needs. The critical assumption used in the FfA calculations is an increase in real costs for watersupply and sanitation as a result of increased population, increasing urbanisation,increasing water scarcity, decreasing renewable water resources and decades ofmismanagement. Studies have shown that for some cities, costs per capita will be asmuch as three times the current cost levels when these effects are compounded. Agenda 21 (see later section) estimated the additional cost of achieving water security atUS$56 billion per year, while the World Bank suggests that between US$600 andUS$800 billion is needed over the next 25 years for universal water and sanitation needsto be met. Mobilising resources - misconceptions and truthsMobilising resources - misconceptions and truthsMobilising resources - misconceptions and truthsMobilising resources - misconceptions and truths For universal water and sanitation needs to be met the task ahead is enormous. Recentstatistics published by WHO reveal that to improve access to drinking water an additional1 billion people need to be served, while an additional 2.4 billion people need access toadequate sanitation. Despite heavy efforts in the 80s and 90s, coverage is still woefullyinadequate. When one considers that spending in basic social services (primaryeducation, health, water and sanitation and nutrition) still amounts to only 13% ofgovernment budgets15 it is clear that the political will is still lacking.
13 These estimates were modelled using assumptions for urban/rural population growth, rate ofurbanisation, existing coverage levels for WSS and a host of cost assumptions for urban and rural watersupply and sanitation schemes. 14 Costs of urban supply and sanitation provision ranged from $300 per person for new seweragesystems to $25 per person for basic pit latrine. For urban water supply, costs ranged from $50 perperson for standpipe to $200 per person for household connection. Rural figures for sanitation andhygiene were estimated at $10 per person and for potable water $15 per person. O & M costs werecapped at 15% capital cost per year. 15 UNDP, et al (1998)

WaterAid Financing water and sanitation15
Broadly speaking, obtaining resources for the water and sanitation sector is similar tomany of the social sector agendas or environmental agendas except for a fewdifferences: ♦ Water and sanitation delivery is entering into a new era, an era where the prolonged
inefficiencies in government-run utilities, quality of services, coverage andenvironmental impacts are creating a pressure to change the institutions governingthe sector.
♦ These inefficiencies are manifested in increasing numbers of small private operators,
water vendors, and community managed and built systems. The surge ininternational private sector activity and public-private partnerships and public-private-community tri-sector partnerships has also made way for new operating andfinancing arrangements.
♦ Under decentralisation and privatisation, the public sector role is being transformed
to one of regulation and facilitation of an enabling environment and policy-making. ♦ Unchallenged in this new scenario is the fact that water and sanitation are basic
needs, essential to life and development and that the association between poverty, ill-health and poor water supplies and sanitation is firmly embedded in popularconceptions within developing country stakeholders.16
The challenge for financing mechanisms is to marry the new policy directions and itsimplications with the fundamental goal of universal access to water and sanitation. IV. Meeting the financing gapIV. Meeting the financing gapIV. Meeting the financing gapIV. Meeting the financing gap What are the prospects for each of the proposed solutions for increasing and mobilisingresources to the sector? Mobilising bilateral aidMobilising bilateral aidMobilising bilateral aidMobilising bilateral aid The challenge of closing the gap is unlikely to be met through bilateral aid, although thepotential for increases are enormous. For example, lobbying donor countries to achievethe target of 0.7% of GNP for official development purposes would generate roughlyUS$100 billion per year. The reality is that in 1998, only the Netherlands and the Nordiccountries reached or surpassed the UN target.17 In the same year, the average effort ofall Development Assistance Committee (DAC) members was only 0.24% of GNP, far shortof the UN target. Though a decade of lobbying to encourage increases in bilateral aid have failed so far tostop the decline in aid, in the UK, overall development assistance has started to slowlyrise since 1998. What is important, however, is to make sure that allocations towardsWSS do not decline, but instead increase. On a positive note, the World
16 Nicol (1999) 17 They have now been joined by Luxembourg. Five other countries have already set timetables forachieving the 0.7% of GNP target.
WaterAid Financing water and sanitation16
Bank/International Monetary Fund’s (IMF) HIPC Initiative, with its poverty reductionfocus, may provide a new impetus for financing WSS as long as committed aid does notsimply get re-channelled towards meeting financing requirements for HIPC. In fact, ifdonor countries met the UN target for just two years it would eliminate the $245 billiondebt of all 41 HIPC countries. (Woodward, 1998) Relieved of debt servicing, developingcountries would then be in a position to allocate more resources to basic social servicesincluding water and sanitation. Reallocation of public sector resourcesReallocation of public sector resourcesReallocation of public sector resourcesReallocation of public sector resources The unfavourable external financing environment facing developing countries (especiallythe poorer ones) makes domestic resource mobilisation and effective allocation of theseresources all the more important for achieving water and sanitation targets and othersocial and sustainable development agendas. This means, apart from aid and debt relief,increased fiscal revenues through more effective taxation and efficient revenuecollection, and increased exports. In some countries, although there may not be adequate resources for the social sectorsto achieve their development targets, the problem could be lessened through bettergovernance and appropriate intra-sectoral allocation of resources. Channelling moreresources towards basic social services and basic WSS depends on strengthening thefiscal capacity of national governments. This entails the following: ♦ Good governance:Good governance:Good governance:Good governance: To quote from Cagatay et al (2000), “Good governance is the
'missing link' between anti-poverty plans and poverty reduction.” Ensuringaccountability and transparency may require: (1) improving financial accountabilitythrough social auditing by citizens’ movements, auditors, press, and democraticallyelected parliaments. (2) Democracy in action: participatory budgeting wherebudgetary powers are decentralised to the municipal or village levels, a process thatis ongoing in India and Brazil.
♦ Tax reforms:Tax reforms:Tax reforms:Tax reforms: Strengthening the revenue collecting mechanisms in developing
countries and determining ways of broadening tax bases. On its own, strengthening the fiscal capacity of developing country government won’tensure increasing resources for water and sanitation. This will only be assured ifspending on basic social sectors become the priority of government. This may pave theway for both inter-sector and intra-sector reallocations. ♦ Inter-sector reallocation/social sector spendingInter-sector reallocation/social sector spendingInter-sector reallocation/social sector spendingInter-sector reallocation/social sector spending. The recent push for poverty
reduction strategic plans and national strategies for sustainable developmentprovide an opportunity for governments, civil society, and private sector to prioritisesocial sector spending and ensure that new development policies prioritise socialspending.
♦ Intra-sector reallocationIntra-sector reallocationIntra-sector reallocationIntra-sector reallocation. In practice inter-sector reallocation means shifting
resources from lower efficiency to higher efficiency programmes such as investmentsthat promote human development. For example moving expenditures out of high-capital intensive projects to low-cost technology options or restructuring subsidies tobe pro-poor.

WaterAid Financing water and sanitation17
There are two broad views on reallocation of public sector expenditures. One suggeststhat the composition of total government expenditures should be restructured to promotehuman capital formation (water and sanitation, basic health and nutrition, education andtraining) and reduce budgets earmarked for non-development contributions. The secondsuggests that it is not enough to earmark expenditures for social sectors, instead itneeds to be further disaggregated into greater shares for basic social sector spending.The basic premise behind these strategies is that the social rate of returns on investmentin human development or basic social sector expenditures should increase bothefficiency and the growth rate of personal incomes.
For example, the UNDP suggests that "some policies deserve priority because theyfacilitate the successful implementation of other policies. Providing access to potablewater, for example, is important in its own right and also because it has “multiplier”effects on such things as a person's ability to maintain good health and engage inproductive activity".
These inter-sectoral and intra-sectoral reallocations pose the question of what areas ofpublic expenditure should bear the burden of substantial reduction. This question cannotbe answered in the abstract since the details of government spending will vary from onecountry to another, but areas worth investigating are subsidies for the non-poor, debtrepayments, military expenditures, and internal security. Public sector expenditures thatare targeted in a manner which promotes spending in basic WSS will place the poor atthe centre of development and achieve poverty reduction.
International private sectorInternational private sectorInternational private sectorInternational private sector
International private sector is estimated to contribute between 8 to 10% of developingcountry WSS flows. Currently, the private sector is estimated to reach 5% of the globalpopulation. Further estimates reveal that 35% will be reached by the year 2015. Privatesector estimates on the increase of private sector finance needed to bridge theinvestment gaps are in the order of US$20-35 billion per annum. Such financialcommitments will not be in place unless adequate investment conditions exist. Theseexpectations are further misleading precisely because the future of private sectorinvolvement is so dependent on these conditions. Private sector involvement ininfrastructure investments during the 1990s showed that compared with other sectorssuch as telecommunications, power, gas, and hydro, the water sector lagged behind ininternational private investments. The main reasons are (1) returns on investment islower than in other infrastructure and (2) high capital intensity means that the paybackperiods are longer making the investment vulnerable to political risks18.
Apart from these, there are other reasons to believe that the international private sectoris unlikely to fill the financing gap. The prospect for private sector investment in the WSS
18 The private investor success factors will be looking at potential profitability and return on capital,manageable risks (concerning contracts, regulations, foreign direct investment (FDI) regulations, etc),political risk, economic risks (exchange rates etc.) and confidence in cost recovery structures.
Intra-sectoral and inter-sectoral allocation of resources towards greater social sector spending thatpromotes human development is likely to achieve the greatest impact in terms of achieving water andsanitation development targets for many of the developing countries.

WaterAid Financing water and sanitation18
is conditional on many factors. The nature of the water industry itself is different fromother major infrastructure environments in that it is highly capital intensive, has lowprofitability associated with a relatively competitive industry, and has low returns toassets associated with a mature, low-risk industry. In terms of obtaining projectfinancing, the implication is high debt-equity ratios. Therefore, future growth in this sectorcomes down to debt financing (Briscoe 1998a).
The problem with commercial financing of infrastructure development in the South is thatfor poorer countries international financing is relatively expensive in foreign exchangeterms when compared to other forms of capital. As a result, these investments willrequire a continual and increasing supply of new capital flow, resulting in a rapid build upof foreign exchange debt.
These forms of capital are also strongly skewed away from poorer countries and effortsto compete for foreign direct investments (in the form of tax concessions, easingrestrictions on profit remittances etc.) may reduce overall benefits to the host country(Woodward 1998). This suggests that with the current structure and a history of beingsubstantially under-priced, heavily subsidised, capital intensive and with long paybackperiods, the water sector has very little scope for attracting private capital especially tothe poorer countries. Whether or not the involvement of the international private sectorwould be key to providing equitable, affordable and sustainable services to the poor andunserved is another matter that is beyond the scope of this paper.
Debt reliefDebt reliefDebt reliefDebt relief
The seriousness of the debt problem in low-income countries has dragged on for morethan a decade. The 'debt hangover' of many developing countries and particularly of theheavily indebted poor countries has not been resolved despite important efforts andmeasures adopted by creditors at the national and multilateral levels19. The servicing ofdebt20 absorbs budgetary and foreign exchange resources, hampering a government'sability to fund its social expenditure programmes including the water and sanitationsector. In 1996, 30% of long term debt for the highly indebted poor countries was owedto multilaterals, 45% to bilaterals, and 16% to domestic private sources (UNDP 1999). 19 The seriousness of the problem was realised by the creditor community in 1987 when the Paris Clubof bilateral creditors first decided to apply for more concessional rescheduling terms to the low-incomedebtor countries in Africa (Venice Terms). This meant that debtor countries were allowed to rescheduletheir debts on a continued concessional terms basis (lower rates of interest than commercial loans), butthe debts were not written off. In subsequent years, more and more of the debts were rescheduled onconcessional terms.20 The nature of problems in repayment of debt may vary from acute balance of payment difficultiesrequiring immediate action to structural, financial and transfer of resources problems requiring longer-term measures. These problems have been categorised as instances of liquidity and insolvency. Aliquidity problem may arise because of a bunching of debt obligations at a particular time, which cannotbe fulfilled due to revenue shortfalls. In the case of insolvency, the inability to make payments resultsfrom a structural problem. Distinguishing between liquidity or insolvency problems is very difficult.
International private sector investments in WSS are likely to increase over the next decade butexpectations of it filling the financing gap to achieve universal access may be misplaced. Growth ininternational private investment is unlikely in the poorer countries where the government’s own fiscalsituation and returns on investment are low.
WaterAid Financing water and sanitation19
The Highly Indebted Poor Country (HIPC) Initiative was launched in 1996 and representsa step forward in the international community’s efforts to relieve poor countries debtburdens. The HIPC process was envisaged to take 6 years to complete and 41 countrieswere initially identified as HIPC countries21. The Enhanced HIPC Initiative was launched in1999 to provide faster and deeper debt relief and was linked to poverty reduction. Thetotal costs for the HIPC Initiative are now estimated at US$28.2 billion in 1999 netpresent value (NPV) terms, but commitments from the creditors have not matched thisamount. The total external debt of the HIPC countries was US$200 billion in nominal orface value terms at the end of 1997. Thus, there are continuing calls for deeper debtrelief. At present, Uganda is the only country that has benefited from debt relief atcompletion point, while 9 others have reached decision point22. Uganda will channelUS$2 billion of debt relief into poverty reducing measures including the water andsanitation sector, which is expected to receive a five fold increase in public expendituresin the first year alone.23
It is a matter of concern that the implementation process of the enhanced HIPC Initiativehas been so slow24. Eligibility conditions are too stringent. There are also concernssurrounding the limited number of countries to be included in the HIPC category.
And finally, debt relief will remain just that, temporary relief. Unless there is somefundamental structural change both within the economies of poor countries and theglobal economic relations between rich and poor countries, poor countries will notachieve debt sustainability which could enable them to continuously invest in their basicsocial services.
Household/community financingHousehold/community financingHousehold/community financingHousehold/community financing
Household financing in the water and sanitation sector includes personal investments inseptic tanks, hand-dug wells and latrines. On the other hand community investmentsrefer to investments that the community as a whole makes towards a collective scheme.Studies have shown that local communities place water supply and sanitation among
21 Of which only India, Nepal, Pakistan, Nigeria, and Bangladesh of the countries in which WaterAidworks are not HIPC Countries. There are discussions on modifying the definition of inclusion of HIPCcountries, which would then make Bangladesh eligible for HIPC status.22 Decision point is the point at which a country is deemed eligible for debt relief. The Enhanced HIPCprocess requires the implementation of 2 consecutive enhanced structural adjustment facility (ESAF)(now restructured as the Poverty Reduction Growth Facility), a debt sustainability analysis followed bya decision point for eligibility. If successful, this is followed by a second stage of interim debt relief andthen completion point and full commitment of creditor’s resources.23 The increase in resources is welcome. But without addressing the government water and sanitationagencies’ capacity to absorb the increase in resources, this may result in a range of inefficiencies andineffective spending.24 In addition, the process requires a draft Poverty Reduction Strategic plan (PRSP) developednationally to ensure that debt relief is linked with national priorities and the poverty reduction needs oftheir people.
Debt relief, on the face of it sounds like the solution for increasing resources to the water andsanitation sector for many of the poorest countries. However, there are challenges associated with debtrelief. It will be important to ensure that the countries’ poverty reduction programs associated with theHIPC initiative effectively prioritise water and sanitation needs.

WaterAid Financing water and sanitation20
their highest priorities. Comparative country priority studies in Senegal, China, Tanzania,Colombia and Malawi have also revealed similar evidence showing 40% of communitybudgets expended in water and sanitation activities over health (7%) and educationactivities (14%) (Klugman 1994). This indicates that as long as local community prioritiesdiffer from central and local government priorities, community investments in the sectorwill rise accordingly.
New innovative ways of community financing are also being developed for communityand self-help initiatives. Some of these, for example the Grameen Bank, are now wellestablished as a provider of credit, providing small loans for income generating activities.They have proven that one of the first uses of net income from income-generatingactivities is the payment of capital costs for water supply development. Similar examplesof this can be found on WaterAid projects in India and Bangladesh. In one example apartnership with a micro-credit partner NGO resulted in the combination of micro-creditprovision with community-managed water supply and sanitation. Other models haveconsisted of revolving funds for covering capital costs where a portion of thecontributions were given by NGOs or donors and the remainder by communities or localwater authorities. An example of this can be found in Honduras where the communitydecided how quickly the payback to the revolving fund would be made (Ghosh and Nigam1998). The scope for using alternative credit mechanisms is growing, as they can play acrucial role in increasing access to the single greatest hindrance for poor communities,access to finance and the inability to pay for services in the absence of municipalcoverage.
V. Global initiatives towards financing basic social servicesV. Global initiatives towards financing basic social servicesV. Global initiatives towards financing basic social servicesV. Global initiatives towards financing basic social services
The 20/20 InitiativeThe 20/20 InitiativeThe 20/20 InitiativeThe 20/20 Initiative
The 20/20 Initiative was initially conceived in 1994, by UNDP, UNESCO, United NationsPopulation Fund (UNFPA), UNICEF and WHO. It was established as a pragmatic way ofaccelerating the mobilisation of resources from national and external sources by callingfor the reallocation of 20% of the total government budget and 20% of ODA to basicsocial services. It was endorsed25 at the World Summit for Social Development inCopenhagen in 1995 and provides a framework for translating the need of increasedinvestments in basic social services - basic health, basic education, low-cost water andsanitation, and nutrition programmes into reality. It also aims for greater efficiency andequity in the use of these resources. Current estimates reveal that that ratio is roughly13/1026.
25 It was reaffirmed in Beijing in 1995 at the World Conference on Women26 Targets are based on government budget expenditures and ODA instead of GNP because of theability of governments to control the size of their budgets through parliament.
This paper is not advocating that communities bridge the financing gap, but it does advocate forgreater recognition of community and household investments as significant in the overall investmentsin the sector. This recognition of these investments implies the inadequate public provision of waterservices. It could be used as a measure of comparative efficiency between developing countries.
WaterAid Financing water and sanitation21
The basic tenet of the compact is that access to basic social services not only forms thecore of development and poverty reduction, but is increasingly recognised as a humanright. It also distinguishes between government spending on social services as opposedto basic social services to encourage greater pro-poor spending and greater distributionalequity.
Putting this commitment into practice has not proved easy. The data required forverifying commitments are often lacking. Monitoring mechanisms for both governmentand ODA expenditures is fragmented and ill-documented for basic social services. Forthese reasons, the 20/20 initiative has not gained political and actual momentum.
Financing water supply and sanitation under Agenda 21Financing water supply and sanitation under Agenda 21Financing water supply and sanitation under Agenda 21Financing water supply and sanitation under Agenda 21
The World Summit on Sustainable Development in 2002 will review the progress ofAgenda 21, which is the global plan of action on environment and development. Chapter18 of Agenda 21 deals primarily with managing and protecting freshwater. Freshwaterissues are expected to be one of the key areas of focus and review for this next summit.The growing concern over the freshwater crisis will highlight the inequities in water andsanitation coverage.
Agenda 21 has called for specific increases in resource needs for water and sanitationand water resources management in general, amongst other priorities. These resourceallocations are to be prioritised under the framework of national strategies forsustainable development. It was hoped that supporting the formulation of NSSDs willprovide additional commitment to the financing agenda and is likely to increaseresources to the WSS sector (Serageldin 1994), as the costs of inaction of poor WSSfrom an environmental point of view are greater than the promotion of its sustainabledevelopment. However, nearly 10 years after Agenda 21 was agreed, only a tiny minorityof countries have formulated NSSDs. Furthermore, the promised financing fromindustrialised countries has failed to materialise.
Global innovative mechanismsGlobal innovative mechanismsGlobal innovative mechanismsGlobal innovative mechanisms
There are individual case examples of new ways of generating public and privateresources. Some including the use of debt swaps (nature for debt), have been used on acase by case basis. The feasibility of tradable water permits and the use of watermarkets have been successful in California and other individual pockets of the world buthave yet to be examined as mechanisms which can be appropriately scaled up. Theimpact of voluntary contributions both from corporate and private individuals (NGOfinancing) are likely to grow as corporate social responsibility takes its course within theinternational private sector companies in developing countries and as developmentawareness and education rises. At present, it is estimated that nearly 10% ofdevelopment aid come from voluntary contributions. Other less tried global mechanismssuch as water bonds and guarantees need to be explored.
VI. RecommendationsVI. RecommendationsVI. RecommendationsVI. Recommendations
Further analysis of available data, including work towards dis-aggregating data todetermine WSS expenditure is clearly needed to improve our understanding of financingin the sector. On the basis of what is presented here, however, we can pull out the
WaterAid Financing water and sanitation22
following recommendations to increase financing in the sector towards achievinguniversal access to WSS:
1. Reverse the decline and increase development assistance to the agreed UN target of0.7% of GNP, and prioritise WSS within aid increases and expenditure.
2. Promote reallocation of public investments so that these prioritise basic socialservices, including WSS.
3. Promote reallocation of WSS investments so that these start to prioritise expandingservices to reach the unserved, whilst improving existing services so that the needsof the under-served are also addressed.
4. Ensure that private sector investments in water and sanitation serve the poor.5. Recognise and facilitate individual and community investments in WSS, for example,
through micro-credit schemes, and other fiscal instruments.6. Investigate revitalisation or creation of new global initiatives to achieve universal
access to WSS.7. Promote inclusion and prioritisation of WSS within poverty reduction strategies, local
agenda 21 plans, and other national planning and development frameworks.8. Encourage and ensure participation of poor communities and civil society
organisations in decision-making over priority spending in water and sanitation.
ConclusionsConclusionsConclusionsConclusions
The intention of this paper was to build a picture of financial flows for the water andsanitation sector in developing countries. It set out to demonstrate the gaps in the sectorin terms of future investment needs and to analyse the potential for each of the sourcesof financing to achieve universal access to WSS.
The financing gap is huge, but not unbridgeable. But to ensure that the investment is puttowards achieving sector targets, and prioritising within those targets services for thepoor and unserved, much restructuring and reallocation of investments is necessary.Fundamentally, this is a matter of political will, improving governance of the sector, andensuring participation of the poor and unserved in investment decisions, developmentand infrastructure plans. Water sector stakeholders and unserved communities haveresponsibility for creating that will and ensuring participation. This will require WSS sectorstakeholders:
♦ Entering into the global discourse on financing for development, for example as partof the UN process.
♦ Increasing their awareness of both micro and macro-economic issues in WSS and
relating this to national macro-economic issues, for example, public sectorexpenditures, debt, trade.
♦ Getting involved in the process of national budget debates to ensure that WSS is duly
prioritised, as part of the democratic process that takes into account the real needsfor development.
♦ Understanding how bilateral and multilateral aid is spent, allocated and decided, and
getting involved in trying to influence those decisions.
WaterAid Financing water and sanitation23
♦ Understanding the status of debt relief in their country, PRSP processes in those
countries where the HIPC initiative is active and participating in the processes ofdeliberation, implementation and monitoring.
♦ Doing original documentation, research and analysis on the makeup of investments
in each of their own countries, on the trends in bilateral aid, the direction of aid andother sources, in collaboration with other agencies engaged in this analysis.
♦ Monitoring private sector activities in the sector to ensure that the process involves
stakeholders and provides access to the poorest. ♦ Concerted, intelligent, co-ordinated lobbying of governments and relevant donor
officials on issues relating to financing of the sector.
This is an enormous task for WSS stakeholders and will take us beyond our usualboundaries. It will require building relationships with other sectors and actors who workon these issues, and helping these other sectors and actors to understand water andsanitation realities.
WaterAid Financing water and sanitation24
References
Akbar, Zaidi (April 2001) From the Lane to the City: The Impact of the Orangi PilotProject’s Low Cost Sanitation Model. A WaterAid Report. WaterAid, London.
Asian Development Bank (1998) The Bank's Policy on Water, Working Paper, August1998
Briscoe, J. (1998a) The Financing of Hydropower, Irrigation, and Water SupplyInfrastructure in Developing Countries, Submitted for publication International Journal ofWater Resources Development, September 1998. Originally prepared for the UN DESAExpert Group Meeting on Strategic Approaches to Freshwater Management, Harare.
Briscoe, John (1998b) The Changing Face of Water Infrastructure Financing inDeveloping Countries. Submitted for publication International Journal of Water ResourcesDevelopment, September 1998.
Briscoe, John (1995) Financing Water and Sanitation Services: The Old and NewChallenges, Keynote address to The World Congress of the International Water SupplyAssociation, Durban 1995.
Briscoe, John and Harvey A. Garn (1995), Financing water supply and sanitation underAgenda 21, Natural Resources Forum Vol.19 No.1 pp 59-70.
Brikke, Francois, Jan Teun Visscher and Willem Ankersmit (1998) Towards Water andSanitation as Sustainable Basic Social Services for All, Prepared for the UN Departmentof Economic and Social Affairs for the Expert Group Meeting on Strategic Approaches ToFreshwater Management, January 1998, Harare.
Cagatay, Nilufer, Mumtaz Keklik, Radhika Lal, and James Lang (2000), Budgets as ifPeople Mattered: Democratizing Macroeconomic Policies, UNDP/SEPED ConferencePaper Series #4. Contributions to the five-year review of the Fourth World Conference onWomen (Beijing) and the World Summit for Social Development (Copenhagen), May2000.
Collignon, Bernard (1999) The Potential and the Limits of Private Water Providers:Independent Sellers in Francophone Africa, UNDP Water and Sanitation Programme,January 1999.
DFID (2000) Addressing the Water Crises - Healthier and More Productive Lives for PoorPeople, Consultative Document. Part of a Series of Strategies for Achieving theInternational Development Targets, March 2000.
Ghosh, Gourisankar and Ashok Nigam (1995), Comments on 'Financing water supply andsanitation under Agenda 21' by John Briscoe and Mike Garn, Natural Resources ForumVol.19 No.1 pp 161-165.
Global Financing Trends: Developing Countries Get More Private Investment, Less Aid.Article based on World Bank (1997) Global Development Finance, World Debt Tables.
WaterAid Financing water and sanitation25
Griffin, K and McKinley, T. (1992) Towards a Human Development Strategy. UNDPOccasional Paper 6.
Haarmeyer, David and Ashoka Mody (1998), Financing Water and Sanitation Projects -The Unique Risks, Public Policy for the Private Sector, Note no. 151, September 1998,The World Bank Group - Finance, Private Sector and Infrastructure Network.
IMF, et al. 2000. Paris21 (Partnerships in Statistics for development in the 21st century).A Better World for Us All – Progress towards the International Development Targets. Ajoint publication of IMF, UN, OECD and the World Bank Group. June 2000.
Klugman, J. (1994) Decentralisation: A Survey of Literature from A Human DevelopmentPerspective, UNDP Occasional Paper 13
Silva, G, Tynan, N and Yilmaz Y. (1998) Private Participation in the Water and SewerageSector – Recent Trends. Public Policy for the Private Sector. Note no. 147, August 1998.www.worldbank.org/html/fpd/notes/147/147silva.pdf
Solo,Tova Maria (1998) Competition in Water and Sanitation - The Role of Small-ScaleEntrepreneurs, Public Policy for the Private Sector December 1998. The World BankGroup - Finance, Private Sector and Infrastructure Network.
Sunman, Hilary (1999) Towards an Assessment of Financial Flows in the Water Sector,Background paper prepared for the Global Water Partnership Framework for Actionpaper.
UN CSD Agenda 21 - Chapter 33 Financial Resources and Mechanisms.
UNCSD Agenda 21 - Chapter 2 International Co-operation to Accelerate SustainableDevelopment in Developing Countries and Related Domestic Policies August 1999.
UNDP (1999) The Debt Burden & Sustainable Human Development. MDGD TechnicalAdvisory Paper No. 4, May 1999.
UNDP et al 1998. Implementing the 20/20 Initiative – Achieving universal access tobasic social services. A joint publication of UNDP, UNESCO, UNFPA, UNICEF, WHO andWorld Bank. http://www.unicef.org/2020/2020.pdf
UN Executive Committee on Economic and Social Affairs (1999), Finding Solutions to thedebt problems of developing countries, Report of the Executive Committee. May 20,1999.
UNRISD (1999) Financing Social Development: Issues for Discussion, Spring/Summer1999.
Woodward, David (1998) Drowning by Numbers - The IMF, The World Bank and North-South Financial Flows, Bretton Woods Project, September 1998.
WaterAid Financing water and sanitation26
World Bank and IMF (1999), Heavily Indebted Poor Countries (HIPC) Initiative--Update onCosting the Enhanced HIPC Initiative, Approved by Masood Ahmed and Jack Boorman,December 7, 1999.
World Bank, 1994. Infrastructure for Development, World Development Report, 1994,Washington DC.
World Commission on Dams (2001), Dams and Development: A New Framework forDecision-Making, WCD Report on CD-ROM. (www.dams.org)
WSSCC (1999), Water Supply and Sanitation, Basic Social Service for All, DiscussionPaper. October 1999.
WaterAid Financing water and sanitation27
Appendices
Supporting Table for Aid flows from major donors 1990-1997 (US$ million)
1990 1995 1996 1997OECD DACWSS 1508 2552 3034 2907Total Water 2569 4227 4695 4756Total DAC lending 57758 50208 53767 44254WSS as a % of Total Water 58.7% 60.4% 64.6% 61.1%WSS as a % of Total 2.6% 5.1% 5.6% 6.6%World BankWSS 931.8 1039.5 366.1 829.8Total Water 1545.6 1629.5 1682.6 2025.1Total WB lending 20701.7 22521.8 21520 22000WSS as a % of Total Water 60.3% 63.8% 21.8% 41.0%WSS as a percentage ofTotal WB lending
4.5% 4.6% 1.7% 3.8%
Asian Development BankWSS 211.1 454.3 609.2 397.2Total Water 455 979 1313 856Total ADB Flows 3933 5394 5372 9369WSS as a % of Total Water27 46.4% 46.4% 46.4% 46.4%WSS as a percentage ofTotal ADB lending
5.4% 8.4% 11.3% 4.2%
TOTAL ALL SOURCESWSS 2650.9 4045.8 4009.3 4134Total Water 4569.6 6835.5 7690.6 7637.1Total Flows 82392.7 78123.8 80659 75623Average Donor WSS as a %of Total Water
58.0% 59.2% 52.1% 54.1%
Average WSS as a % of Total 5.5% 8.7% 9.5% 10.1%Source: Sunman (1999) and author's analysis.
27 Author’s assumptions based on ADB percentage shares for previous years.
WaterAid Financing water and sanitation28
Appendix 1
Key Definitions
AidThe words "aid" and "assistance" in the report refer only to flows which qualify as OfficialDevelopment Assistance (ODA) or Official Aid.
The OECD's Development Assistance Committee (DAC) is the principal body throughwhich the Organisation deals with issues related to co-operation with developingcountries. The DAC is one of the key forums in which the major bilateral donors of 29countries work together to increase the effectiveness of their common effort to supportsustainable development.
Multilateral Operational AgenciesIn DAC statistics, these are international institutions with governmental membershipwhich conduct all or a significant part of their activities in favour of development and aidrecipient countries. They include multilateral development banks (e.g. World Bank,regional development banks), United Nations agencies, and regional groupings (e.g.certain European Union and Arab agencies). A contribution by a DAC Member to such anagency is deemed to be multilateral if it is pooled with other contributions and disbursedat the discretion of the agency.
Private FlowsConsist of flows at market terms financed out of private sector resources (includingdirect investment) and private grants (i.e. grants by NGOs, net of subsidies received fromthe official sector. However it is not easy to obtain these statistics so it is not clear towhat extent NGOs have contributed to the sector). In presentations focusing on thereceipts of recipient countries, flows at market terms are shown as follows:
Official Development Assistance (ODA) Concessional (aid) and other loans providedmainly for developmental purposes by the 22 member countries of the OECDDevelopment Assistance Committee. These countries include: Australia, Austria, Belgium,Canada, Denmar, Finland, France, Germany, Greece, Ireland, Italy, Japan, Luxembourg,Netherlands, New Zealand, Norway, Portugal, Spain, Sweden, Switzerland, UnitedKingdom and the USA.
Grants or Loans to countries and territories on Part I of the DAC List of Aid Recipients(developing countries) which are:- undertaken by the official sector;- with promotion of economic development and welfare as the main objective;- at concessional financial terms [if a loan, having a Grant Element of at least 25 percent].
LLDCs: Least Developed Countries. Group established by the United Nations. To qualifyfor admission, countries must fall below thresholds established for income, economicdiversification and social development. The DAC List is updated immediately to reflectany change in the LLDC group.
WaterAid Financing water and sanitation29
The DAC List of Aid Recipients 28
Used for 1997, 1998 and 1999 flows
Part I. Developing Countries and Territories(Official Development Assistance)
Least Developed CountriesLeast Developed CountriesLeast Developed CountriesLeast Developed Countries (LDCs)
Afghanistan, Angola, Bangladesh, Benin, Bhutan, Burkina Faso, Burundi, Cambodia,Cape Verde, Central African Republic, Chad, Comoros, Democratic Republic of Congo,Djibouti, Equatorial Guinea, Eritrea, Ethiopia, Gambia, Guinea, Guinea-Bissau, Haiti,Kiribati, Laos, Lesotho, Liberia, Madagascar, Malawi, Maldives, Mali, Mauritania,Mozambique, Myanmar, Nepal, Niger, Rwanda, Samoa, Sao Tome and Principe, SierraLeone, Solomon Islands, Somalia, Sudan, Tanzania, Togo, Tuvalu, Uganda, Vanuatu,Yemen, Zambia
Other Low Income CountriesOther Low Income CountriesOther Low Income CountriesOther Low Income Countries (OLICs, per capita GNP <$765 in 1995)
Albania, Armenia*, Azerbaijan*, Bosnia and Herzegovina, Cameroon, China, Republic ofConge, Cote D’Ivoire, Georgia*, Ghana, Guyana, Honduras, India, Kenya, KyrgyzRepublic*, Mongolia, Nicaragua, Nigeria, Pakistan, Senegal, Sri Lanka, Tajikistan*,Vietnam, Zimbabwe
Lower Middle Income Countries & TerritoriesLower Middle Income Countries & TerritoriesLower Middle Income Countries & TerritoriesLower Middle Income Countries & Territories (per capita GNP $766-$3035 in 1995)
Algeria, Belize, Bolivia, Botswana, Colombia, Costa Rica, Cuba, Dominica, DominicanRepublic, East Timor, Ecuador, Egypt, El Salvador, Fiji, Grenada, Guatemala, Indonesia,Iran, Iraq, Jamaica, Jordan, Kazakstan*, Democratic Republic of Korea, Lebanon,Macedonia, Marshall Islands, Federated States of Micronesia, Moldova*, Morocco,Namibia, Niue, Palau Islands, Palestinian Administered Areas, Panama, Papua NewGuinea, Paraguay, Peru, Philippines, St Vincent & Grenadines, Suriname, Swaziland,Syria, Thailand, Tokelau, Tonga, Tunisia, Turkey, Turkmenistan*, Uzbekistan*,Venezuela, Wallis and Futuna, Federal Republic of Yugoslavia
Upper Middle Income Countries & TerritoriesUpper Middle Income Countries & TerritoriesUpper Middle Income Countries & TerritoriesUpper Middle Income Countries & Territories (per capita GNP $3036-$9385 in 1995)
Brazil, Chile, Cook Islands, Croatia, Gabon, Malaysia, Mauritius, Mayotte, Mexico, Nauru,South Africa, St Lucia, Trinidad and Tobago, Uruguay
(Threshold for World Bank Loan Eligibility - $5295 per capita GNP in 1995)
Anguilla, Antigua and Barbuda, Argentina, Bahrain, Barbados, Libya, Malta, Montserrat,Oman, Saudi Arabia, Seychelles, Slovenia, St Helena, St Kitts and Nevis, Turks andCaicos Islands
High Income Countries & TerritoriesHigh Income Countries & TerritoriesHigh Income Countries & TerritoriesHigh Income Countries & Territories (per capita GNP > $9385 in 1995)
28 Source: http://www.oecd.org/dac/htm/daclst97.htm

WaterAid Financing water and sanitation30
Aruba, French Polynesia, Gibraltar, Republic of Korea, Macao, Netherlands Antilles, NewCaledonia, Northern Marianas, Virgin Islands (UK)
Part II. Countries and Territories in Transition (Official Aid)
Central and Eastern European Countries and New Independent States of the formerCentral and Eastern European Countries and New Independent States of the formerCentral and Eastern European Countries and New Independent States of the formerCentral and Eastern European Countries and New Independent States of the formerSoviet UnionSoviet UnionSoviet UnionSoviet Union
Belarus, Bulgaria, Czech Republic, Estonia, Hungary, Latvia, Lithuania, Poland, Romania,Russia, Slovak Republic, Ukraine
More Advanced Developing Countries and TerritoriesMore Advanced Developing Countries and TerritoriesMore Advanced Developing Countries and TerritoriesMore Advanced Developing Countries and Territories
Bahamas, Bermuda, Brunei, Cayman Islands, Chinese Taipei, Cyprus, Falkland Island,Hong Kong – China, Israel, Kuwait, Qatar, Singapore, United Arab Emirates
Notes:* Central and Eastern European countries and New Independent States of the formerSoviet Union (CEECs/NIS)