finding the mean © christine crisp “teach a level maths” statistics 1
TRANSCRIPT

Finding the MeanFinding the Mean
© Christine Crisp
““Teach A Level Teach A Level Maths”Maths”
Statistics 1Statistics 1

Finding the Mean
The arithmetic mean of a set of numbers is the average.We refer to it simply as the mean.
e.g. Find the mean of the numbers 7, 11, 4, 9, 4
Solution: mea
n
5
4941177
As a formula, we write:mean, n
xx
is the Greek capital letter S and stands for Sum
It is read as “sigma”, so the formula is
“sigma x divided by n”( The s um of the x values divided by the n umber
of xs. )

Finding the Mean
e.g. Find the mean of the following data:
x 1 2 3
Frequency, f
3 5 2
We still need to add up the x values and divide by the number of xs. However, we have more than one of each x value.
The frequencies show we have 1, 1, 1, 2, 2, 2, 2, 2, 3, 3
Adapting the Formula
mean, n
xx
so,10
3322222111
More simply, 10
322513 x
This is written as n
fx
f
fxx

Finding the Mean
x 1 2 3
Frequency, f
3 5 2
mean,
f
xf
f
fxx or
Some of you have textbooks using the 1st of these ways of writing the formula and others the 2nd.I’m going to use the 2nd for 2 reasons:• x comes first in the tables so xf is in a logical
order,• this order should avoid a common error in another formula that we will meet soon.
So, mean,
f
fxx 91
10
235231
Finding the Mean
x 12 16 18 22 27
f 5 8 9 6 2mean,
f
fxx
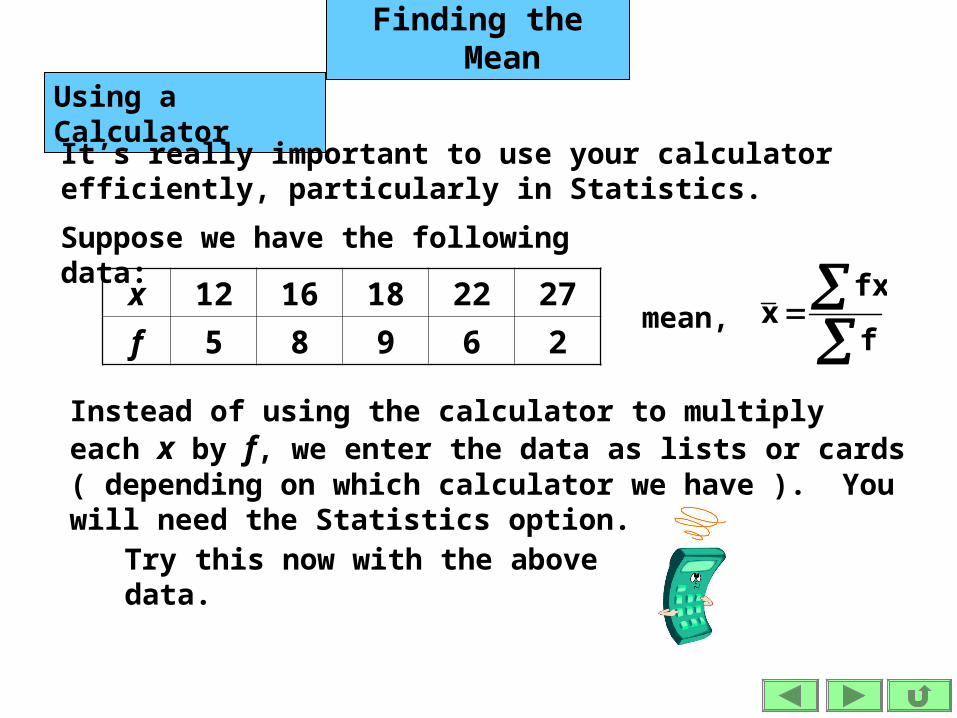
Using a CalculatorIt’s really important to use your calculator efficiently, particularly in Statistics.
Suppose we have the following data:
Instead of using the calculator to multiply each x by f, we enter the data as lists or cards ( depending on which calculator we have ). You will need the Statistics option.
Try this now with the above data.

Finding the Mean
x 12 16 18 22 27
f 5 8 9 6 2mean,
f
fxx
Using a CalculatorIt’s really important to use your calculator efficiently, particularly in Statistics.
Suppose we have the following data:
Now go back through the data to check that you have entered the correct numbers before continuing. This is tedious but essential ( every
time )!Next select the menu that shows the results and you will find and other results we will use later.
x
We get ) s.f. 3(917x
( We usually give answers to 3 s.f. )
Finding the Mean
mean,
f
fxx
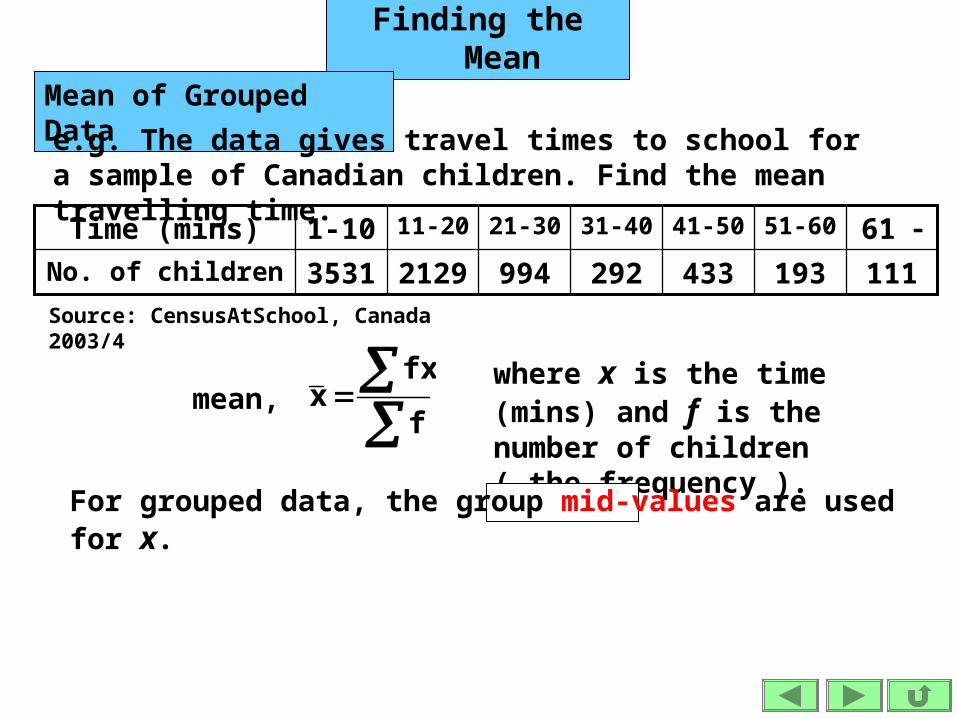
Mean of Grouped Datae.g. The data gives travel times to school for a sample of Canadian children. Find the mean travelling time.
193
51-60
994
21-30
292
31-40
433
41-50
11121293531No. of children
61 11-201-10Time (mins)
Source: CensusAtSchool, Canada 2003/4
where x is the time (mins) and f is the number of children ( the frequency ).
For grouped data, the group mid-values are used for x.
Finding the Mean
mean,
f
fxx
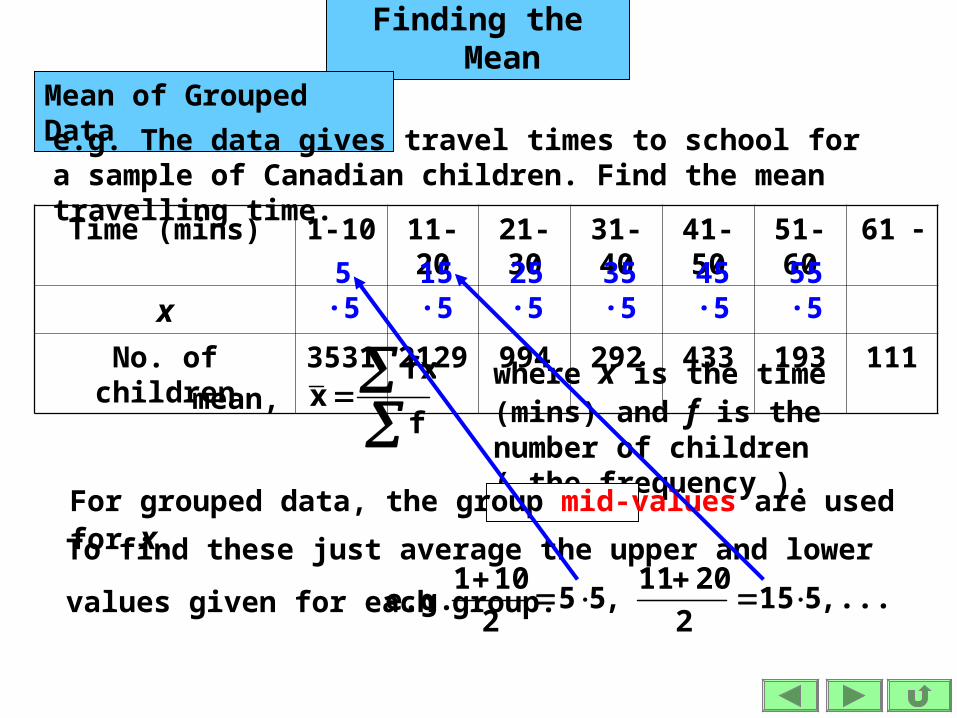
Mean of Grouped Datae.g. The data gives travel times to school for a sample of Canadian children. Find the mean travelling time. Time (mins) 1-10 11-20 21-30 31-40 41-50 51-60 61
x
No. of children
3531 2129 994 292 433 193 111
where x is the time (mins) and f is the number of children ( the frequency ).
For grouped data, the group mid-values are used for x. To find these just average the upper and lower
values given for each group. ...,5152
2011
5 ·5 15 ·5 25 ·5 35 ·5 45 ·5 55 ·5
,552
101
e.g.
Finding the Mean
mean,
f
fxx
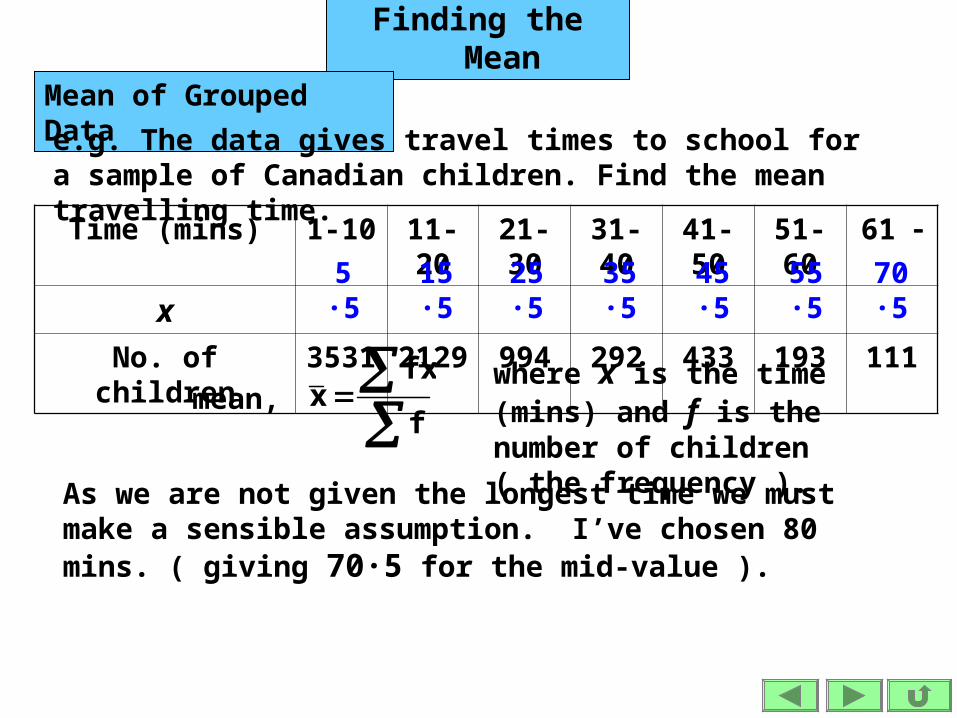
Mean of Grouped Datae.g. The data gives travel times to school for a sample of Canadian children. Find the mean travelling time. Time (mins) 1-10 11-20 21-30 31-40 41-50 51-60 61
x
No. of children
3531 2129 994 292 433 193 111
where x is the time (mins) and f is the number of children ( the frequency ).As we are not given the longest time we must
make a sensible assumption. I’ve chosen 80 mins. ( giving 70·5 for the mid-value ).
70 ·515 ·5 25 ·5 35 ·5 45 ·5 55 ·55 ·5

Finding the Mean
mean,
f
fxx
Mean of Grouped Datae.g. The data gives travel times to school for a sample of Canadian children. Find the mean travelling time. Time (mins) 1-10 11-20 21-30 31-40 41-50 51-60 61
x
No. of children
3531 2129 994 292 433 193 111
where x is the time (mins) and f is the number of children ( the frequency ).
70 ·5
s.f.)( 3416 mins
15 ·5 25 ·5 35 ·5 45 ·5 55 ·55 ·5
We can now enter the data into our calculators and find the mean.
mean,
x
Finding the Mean
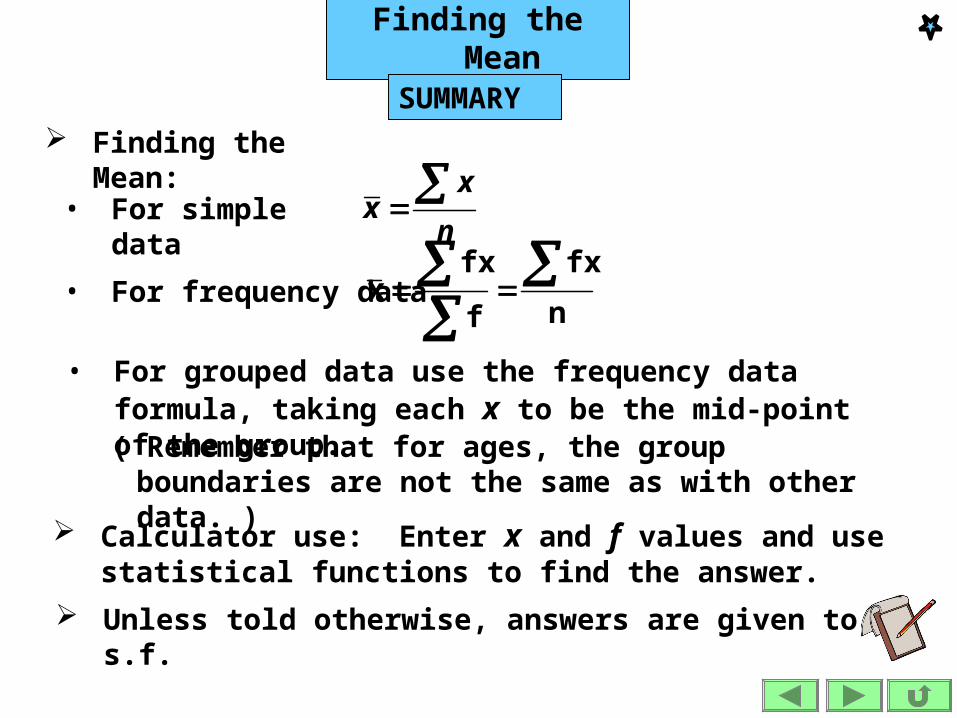
SUMMARY
n
xx
• For simple data
Finding the Mean:
n
fx
f
fxx
• For frequency data
• For grouped data use the frequency data formula, taking each x to be the mid-point of the group.( Remember that for ages, the group
boundaries are not the same as with other data. ) Calculator use: Enter x and f values and use
statistical functions to find the answer.
Unless told otherwise, answers are given to 3 s.f.

Finding the Mean
ExerciseFind the mean of each data set shown:
1. 5, 11, 14, 7, 13
2.
3. Length (cm) 1-10 11-20 21-30 31-40
f 4 7 13 17
4. Age (years) 0-9 10-19 20-59 60-99
f 11 25 16 9
x 1 2 3 4 5 6
f 1 8 13 17 10 11

Finding the Mean
Solutions:1. 5, 11, 14, 7, 13
Solution:
n
xx
f
fxx
10
2.
1110171381f
654321x
Solution:
4

Finding the Mean
35·525·515·55·5
3.
x
171374f
31-4021-3011-201-10Length (cm)
f
fxx )s.f. ( 3026 Solutio
n:
8040155
4.
x
9162511f
60-9920-5910-190-9Age (years)
N.B. Age data so the u.c.bs. are 10, 20, . . . making the mid-points 5, 15, . . .
f
fxx )..3(329 pd

The following slides contain repeats of information on earlier slides, shown without colour, so that they can be printed and photocopied.For most purposes the slides can be printed as “Handouts” with up to 6 slides per sheet.

Finding the Mean
SUMMARY
n
xx
• For simple data
Finding the Mean:
f
xfx• For frequency data
• For grouped data use the frequency data formula, taking each x to be the mid-point of the group.( Remember that for ages, the group
boundaries are not the same as with other data. ) Calculator use: Enter x and f values and use
statistical functions to find the answer.
Unless told otherwise, answers are given to 3 s.f.

Finding the Mean
mean,
f
xfx
Mean of Grouped Datae.g. The data gives travel times to school for a sample of Canadian children. Find the mean travelling time.
193
51-60
994
21-30
292
31-40
433
41-50
11121293531No. of children
>6011-201-10Time (mins)
Source: CensusAtSchool, Canada 2003/4
where x is the time (mins) and f is the number of children ( the frequency ).
For grouped data, the group mid-values are used for x.

Finding the Mean
70 ·5x
193
51-60
994
21-30
292
31-40
433
41-50
11121293531No. of children
>6011-201-10Time (mins)
To find mid-values just average the upper and
lower values given for each group. ...,5152
2011
5 ·5 15 ·5 25 ·5 35 ·5 45 ·5 55 ·5
,552
101
e.g.
As we are not given the longest time we must make a sensible assumption. I’ve chosen 80 mins. ( giving 70·5 for the mid-value ).
mean,
f
xfx s.f.)( 3416 mins