findings from the 2017 native cdfi survey: industry .../media/files/community/indiancountry/... ·...
TRANSCRIPT
CENTER FOR INDIAN COUNTRY DEVELOPMENT Working Paper No. 2017-04
Findings from the 2017 Native CDFI Survey: Industry Opportunities and Limitations Michou Kokodoko Federal Reserve Bank of Minneapolis November 2017 A working paper series from the Federal Reserve System’s Center for Indian Country Development, which is housed at the Federal Reserve Bank of Minneapolis. The views expressed here are those of the authors and not necessarily those of the Federal Reserve Bank of Minneapolis or the Federal Reserve System.

This page is intentionally left blank for pagination purposes.
1
Findings from the 2017 Native CDFI Survey:
Industry Opportunities and Limitations
Michou Kokodoko
November 2017
Abstract: The Center for Indian Country Development at the Federal Reserve Bank of Minneapolis intends to provide energy and coordination to Indian Country development initiatives across the Federal Reserve System. One area of focus is advocating and developing resources for Native community development financial institutions (NCDFIs) working toward strengthening reservation economies. This spring, on behalf of the Center, the Minneapolis Fed’s Community Development Department conducted a survey of NCDFIs to collect data that can be used to inform financial institutions about NCDFI-related investment opportunities. Findings, shared in this report, suggest there are unmet lending opportunities in the industry. These opportunities illustrate both the limits and potential of NCDFIs.
OVERVIEW
Community development financial institutions (CDFIs) are for-profit and nonprofit entities that provide
access to credit and other financial services in low-income and minority markets that have been
traditionally underserved by mainstream institutions. Organizations with at least 50 percent of their
activities in Native American, Alaska Native, and/or Native Hawaiian communities are referred to as
Native CDFIs (NCDFIs). As of July 31, 2017, there were 73 entities in the U.S. certified as NCDFIs by
the U.S. Department of the Treasury’s Community Development Financial Institutions Fund (CDFI
Fund).
In the spring of 2017, the Community Development Department and the Center for Indian Country
Development (CICD) at the Federal Reserve Bank of Minneapolis, with help from the Native CDFI
Network and First Nations Oweesta Corporation, surveyed certified NCDFIs across the U.S. about their
programs and funding. Thirty-nine NCDFIs responded to the survey. They include 2 bank/holding
companies, 4 credit unions, 32 loan funds, and 1 community venture capital fund. See Appendix 1 for the
list of our NCDFI respondents.

2
The survey was designed to create a portrait of NCDFIs—of their resource base, scope of work and
geography, and challenges—and to get some indication of the size of bank investment prospects in
NCDFIs. The survey is part of a Federal Reserve Bank of Minneapolis long-term effort to help increase
the amount of capital that financial institutions, government agencies, and foundations are willing to
commit to NCDFI infrastructure and capacity.
A 2016 report commissioned by the CDFI Fund and titled Access to Capital and Credit in Native
Communities identified at least five factors that are driving the current demand among NCDFIs for more
funding: number of borrowers increasing, demand for longer-term loans growing, demand for larger loans
growing, NCDFIs showing stronger balance sheets, and larger NCDFIs now able to attract more funding.
Findings from our survey corroborate these points. Unmet lending opportunities exist in the NDCFI
sector and they illustrate the potential as well as the limits of NCDFIs.1
Survey results show unmet lending opportunities in the industry. NCDFIs continue and are willing to
pursue sustainable strategies, including investments in technology, staff, operational restructuring, and
partnerships. They are clearly ready to deploy more funds and increase their collective footprint. The
availability of funding is chief among the challenges described by survey respondents. The results also
point to the limits of the industry. Some respondents are challenged by ongoing capacity needs, including
retaining and training staff, adopting new technologies, and increasing their understanding of their target
market. In general, limitations on resources are making it difficult for these respondents to pursue growth
strategies.
This report is organized into five sections:
1. Background. Discusses growth and diversity in the NCDFI sector.
2. Unmet lending opportunities. Discusses current and expected lending opportunities as well as existing
potential to use large amounts of funding in the industry effectively.
3. Challenges. Discusses challenges NCDFIs face as they attempt to scale with limited funding.
4. Partnership opportunities. Discusses ways some NCDFIs and partners are coping with the funding
issues.
5. Conclusion. Suggests ways and approaches to get more funding for NCDFIs.
1 Access to Capital and Credit in Native Communities. Native Nations Institute, 2016.
3
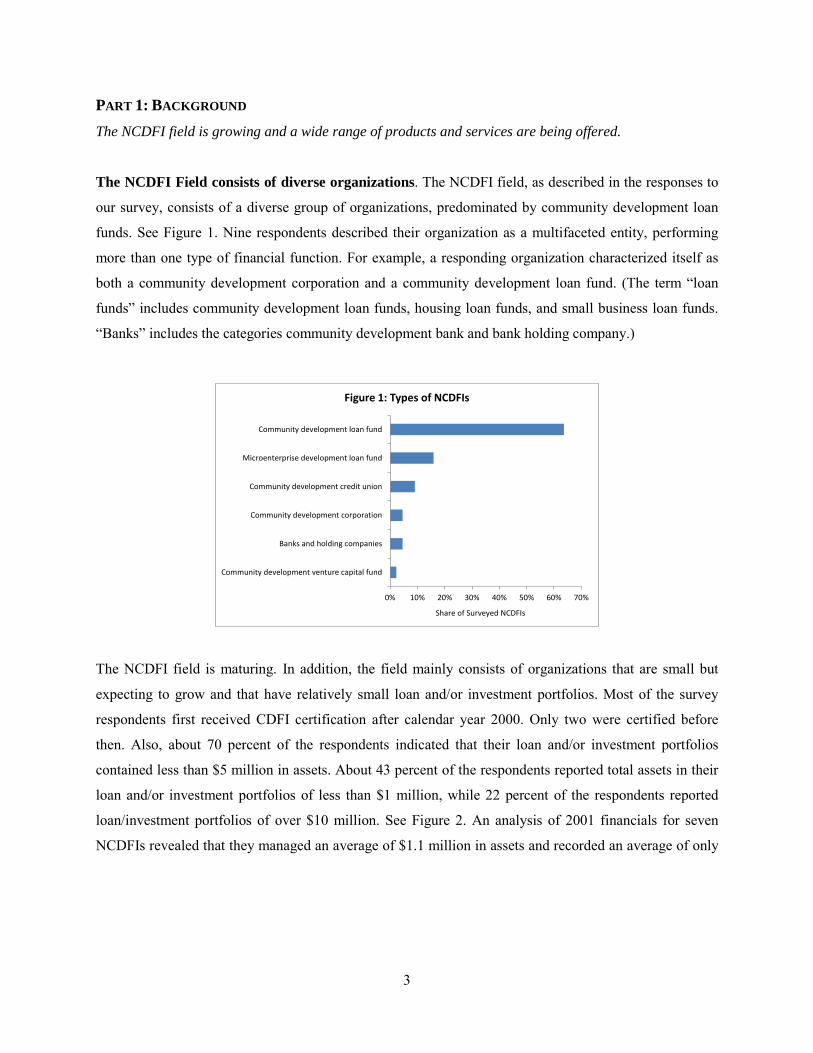
PART 1: BACKGROUND The NCDFI field is growing and a wide range of products and services are being offered.
The NCDFI Field consists of diverse organizations. The NCDFI field, as described in the responses to
our survey, consists of a diverse group of organizations, predominated by community development loan
funds. See Figure 1. Nine respondents described their organization as a multifaceted entity, performing
more than one type of financial function. For example, a responding organization characterized itself as
both a community development corporation and a community development loan fund. (The term “loan
funds” includes community development loan funds, housing loan funds, and small business loan funds.
“Banks” includes the categories community development bank and bank holding company.)
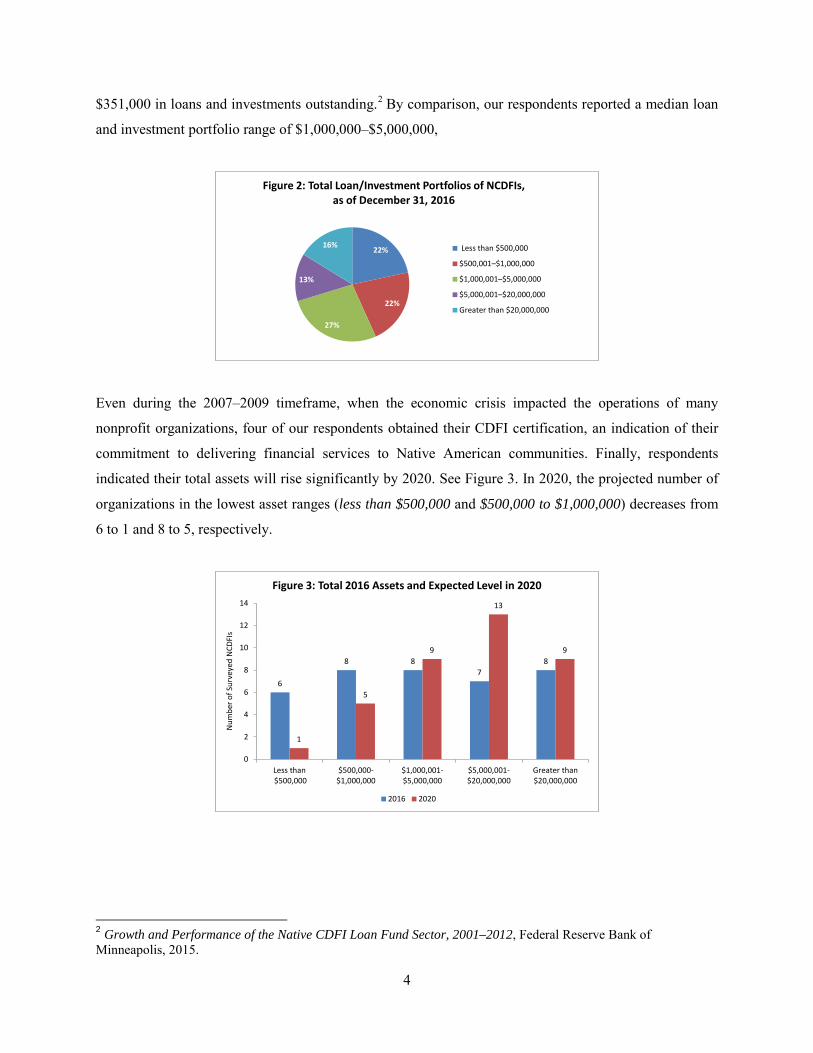
The NCDFI field is maturing. In addition, the field mainly consists of organizations that are small but
expecting to grow and that have relatively small loan and/or investment portfolios. Most of the survey
respondents first received CDFI certification after calendar year 2000. Only two were certified before
then. Also, about 70 percent of the respondents indicated that their loan and/or investment portfolios
contained less than $5 million in assets. About 43 percent of the respondents reported total assets in their
loan and/or investment portfolios of less than $1 million, while 22 percent of the respondents reported
loan/investment portfolios of over $10 million. See Figure 2. An analysis of 2001 financials for seven
NCDFIs revealed that they managed an average of $1.1 million in assets and recorded an average of only
0% 10% 20% 30% 40% 50% 60% 70%
Community development venture capital fund
Banks and holding companies
Community development corporation
Community development credit union
Microenterprise development loan fund
Community development loan fund
Share of Surveyed NCDFIs
Figure 1: Types of NCDFIs
4
$351,000 in loans and investments outstanding.2 By comparison, our respondents reported a median loan
and investment portfolio range of $1,000,000–$5,000,000,
Even during the 2007–2009 timeframe, when the economic crisis impacted the operations of many
nonprofit organizations, four of our respondents obtained their CDFI certification, an indication of their
commitment to delivering financial services to Native American communities. Finally, respondents
indicated their total assets will rise significantly by 2020. See Figure 3. In 2020, the projected number of
organizations in the lowest asset ranges (less than $500,000 and $500,000 to $1,000,000) decreases from
6 to 1 and 8 to 5, respectively.
2 Growth and Performance of the Native CDFI Loan Fund Sector, 2001–2012, Federal Reserve Bank of Minneapolis, 2015.
22%
22%
27%
13%
16%
Figure 2: Total Loan/Investment Portfolios of NCDFIs, as of December 31, 2016
Less than $500,000
$500,001–$1,000,000
$1,000,001–$5,000,000
$5,000,001–$20,000,000
Greater than $20,000,000
6
8 87
8
1
5
9
13
9
0
2
4
6
8
10
12
14
Less than $500,000
$500,000-$1,000,000
$1,000,001-$5,000,000
$5,000,001-$20,000,000
Greater than$20,000,000
Num
ber o
f Sur
veye
d N
CDFI
s
Figure 3: Total 2016 Assets and Expected Level in 2020
2016 2020
5
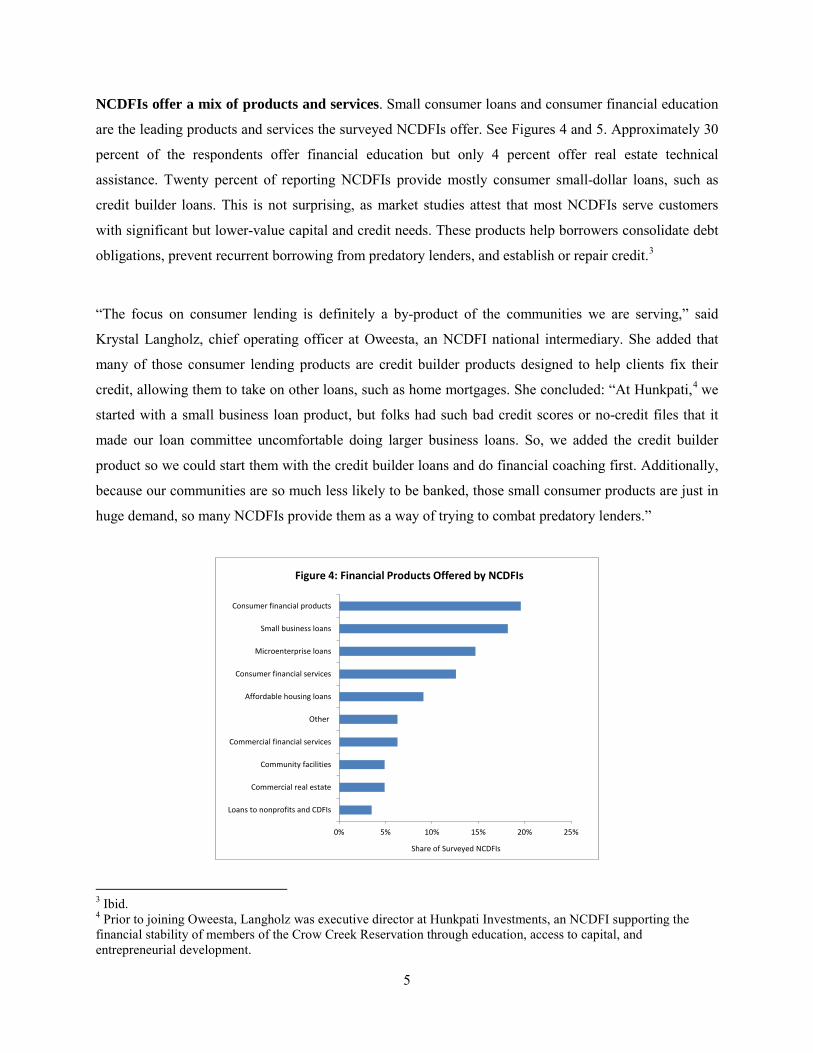
NCDFIs offer a mix of products and services. Small consumer loans and consumer financial education
are the leading products and services the surveyed NCDFIs offer. See Figures 4 and 5. Approximately 30
percent of the respondents offer financial education but only 4 percent offer real estate technical
assistance. Twenty percent of reporting NCDFIs provide mostly consumer small-dollar loans, such as
credit builder loans. This is not surprising, as market studies attest that most NCDFIs serve customers
with significant but lower-value capital and credit needs. These products help borrowers consolidate debt
obligations, prevent recurrent borrowing from predatory lenders, and establish or repair credit.3
“The focus on consumer lending is definitely a by-product of the communities we are serving,” said
Krystal Langholz, chief operating officer at Oweesta, an NCDFI national intermediary. She added that
many of those consumer lending products are credit builder products designed to help clients fix their
credit, allowing them to take on other loans, such as home mortgages. She concluded: “At Hunkpati,4 we
started with a small business loan product, but folks had such bad credit scores or no-credit files that it
made our loan committee uncomfortable doing larger business loans. So, we added the credit builder
product so we could start them with the credit builder loans and do financial coaching first. Additionally,
because our communities are so much less likely to be banked, those small consumer products are just in
huge demand, so many NCDFIs provide them as a way of trying to combat predatory lenders.”
3 Ibid. 4 Prior to joining Oweesta, Langholz was executive director at Hunkpati Investments, an NCDFI supporting the financial stability of members of the Crow Creek Reservation through education, access to capital, and entrepreneurial development.
0% 5% 10% 15% 20% 25%
Loans to nonprofits and CDFIs
Commercial real estate
Community facilities
Commercial financial services
Other
Affordable housing loans
Consumer financial services
Microenterprise loans
Small business loans
Consumer financial products
Share of Surveyed NCDFIs
Figure 4: Financial Products Offered by NCDFIs
6
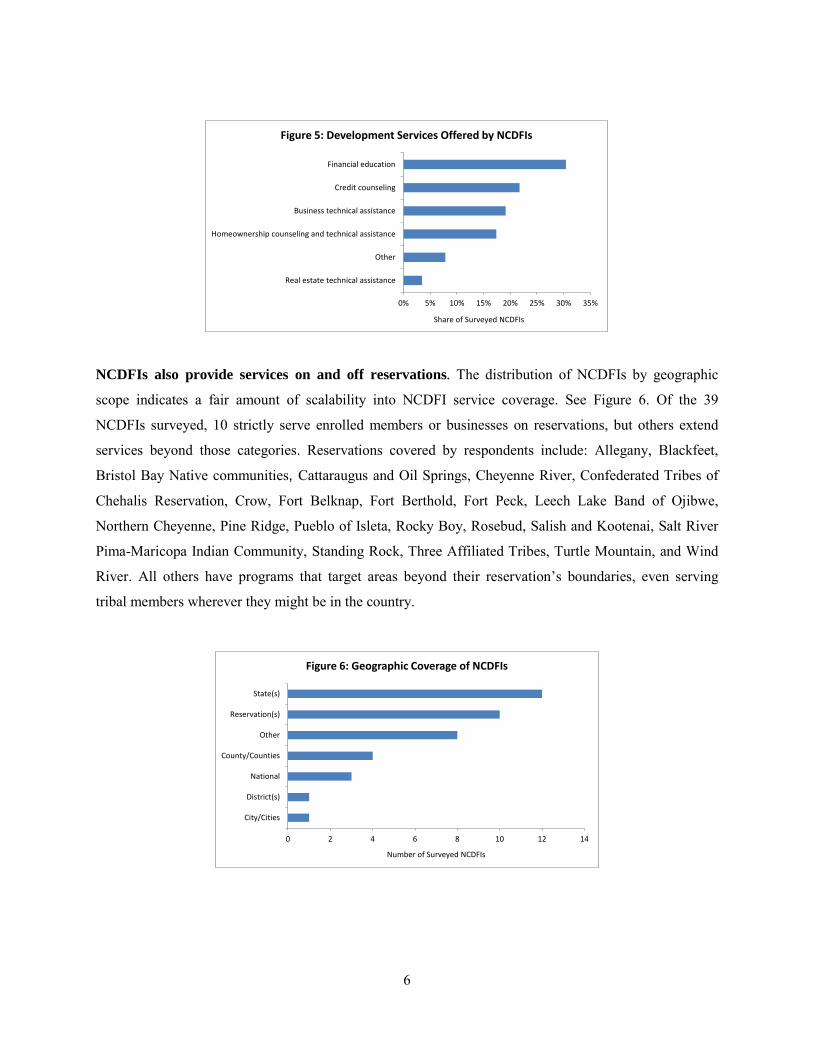
NCDFIs also provide services on and off reservations. The distribution of NCDFIs by geographic
scope indicates a fair amount of scalability into NCDFI service coverage. See Figure 6. Of the 39
NCDFIs surveyed, 10 strictly serve enrolled members or businesses on reservations, but others extend
services beyond those categories. Reservations covered by respondents include: Allegany, Blackfeet,
Bristol Bay Native communities, Cattaraugus and Oil Springs, Cheyenne River, Confederated Tribes of
Chehalis Reservation, Crow, Fort Belknap, Fort Berthold, Fort Peck, Leech Lake Band of Ojibwe,
Northern Cheyenne, Pine Ridge, Pueblo of Isleta, Rocky Boy, Rosebud, Salish and Kootenai, Salt River
Pima-Maricopa Indian Community, Standing Rock, Three Affiliated Tribes, Turtle Mountain, and Wind
River. All others have programs that target areas beyond their reservation’s boundaries, even serving
tribal members wherever they might be in the country.
0% 5% 10% 15% 20% 25% 30% 35%
Real estate technical assistance
Other
Homeownership counseling and technical assistance
Business technical assistance
Credit counseling
Financial education
Share of Surveyed NCDFIs
Figure 5: Development Services Offered by NCDFIs
0 2 4 6 8 10 12 14
City/Cities
District(s)
National
County/Counties
Other
Reservation(s)
State(s)
Number of Surveyed NCDFIs
Figure 6: Geographic Coverage of NCDFIs
7
PART 2: UNMET LENDING OPPORTUNITIES
Responses to questions about current and expected lending opportunities illustrate existing gaps in Indian
Country. Demand for NCDFIs’ products and services continue to grow. When asked to describe the
overall demand for their products and services in 2016, nearly half of the respondents selected the
category “very high.” To further indicate the growing need to expand existing lending services, about half
the respondents said they were unable to fully fund loans that had been already approved by their lending
committees, with the shortfall almost always exceeding 10 percent of the approved loan amount (and
sometimes much more). Going forward, demand for NCDFIs’ products and services is likely to increase
in today’s economic climate, given that some NCDFIs have expanded their work by expanding
geographic reach. Thirty-three respondents expect demand for financing from their organization to
increase in 2017.
In addition to the unmet credit needs, respondents were asked to describe programs that their organization
would like to provide, but cannot at the present time. If they had extra funds, respondents said that they
would use them primarily to expand existing services, but also to expand into either new services or new
service areas. Table 1 summarizes items frequently mentioned by the respondents in their written
comments. It appears that the respondents want to do more in the areas of home loans, including
mortgage origination for acquiring and fixing properties in Native American communities. Recent reports
indicate the need for appropriate amounts and types of housing in these communities. For example,
according to a report issued by the U.S. Department of Housing and Urban Development (HUD), 75
percent of American Indian or Alaska Native households in tribal areas expressed a strong desire to own
their home.5, 6 NCDFIs are willing to step up and use federal programs and others to fill the mortgage
lending gap existing in Indian Country.
5 Nancy, et al. Housing Needs of American Indians and Alaska Natives in Tribal Areas: A Report from the Assessment of American Indian, Alaska Native, and Native Hawaiian Housing Needs. U.S. Department of Housing and Urban Development, Office of Policy Development and Research, January 2017. p. 15–18. 6 In another example, the Access to Capital and Credit in Native Communities report indicates that 11 percent of all American Indians and Alaska Natives in larger tribal areas met the HUD definition of overcrowding, compared to 3 percent for all U.S. households. (For information on how HUD defines overcrowding, see www.huduser.gov/publications/pdf/measuring_overcrowding_in_hsg.pdf).
8
Table 1: Summary of Survey Respondents’ Written Comments
Numbers in parentheses indicate the number of respondents who commented on the specified topic
Topic Credit Needs Development Services Banking Services
Small business
Micro loans (4) Larger business loans (3) Ag loans (2)
Technical assistance satellite office locations (4) Business incubator (2) Bookkeeping services (2) Customized technical assistance (2) Hire client service coordinator (1) Use online lending platform (1) Financial planning (1)
Housing Home loans (17) Down payment assistance (2) Product for homeowners with mortgage arrears (1) Construction loan (1)
Homeowner education (3)
Other consumer products
Individual development accounts (4) Auto loans (3) First and last month rent (2) Credit builder loans (2) Utilities (1) Employee loans (1) Bonding for contractors (1)
Financial education (4) Native Credit Union (2) Debit and credit cards (1) Depository services on the reservation (1)
Other New Markets Tax Credit (3) Lending to other CDFIs (1) Secondary market for Native loans (1) HEARTH (Helping Expedite and Advance Responsible Tribal Home Ownership) Act leasehold mortgage (1) Debt consolidation loan (1) Community facilities loans (1)
Financial coaching, train the trainer (2)

9
Finally, NCDFIs are projecting a substantial loan capital need to satisfy financing demand in 2017. As
stated in the previous section, the vast majority of the respondents cited limited financial resources as an
impediment to achieving what they aspire to do. Collectively, among those who provided a figure, the
estimated additional amount needed to meet funding needs in 2017 alone was about $48 million. These
extra funds would be used primarily to expand existing services, but also to expand into either new
services or new service areas. See Figure 7. And, to emphasize the point, as we previously mentioned, in
a strong indication of the need for funds just to expand existing services, about half of the respondents
said they were unable to fully fund all loan requests submitted and approved by their loan committees.
PART 3: CHALLENGES
The unmet lending opportunities also point to issues of scale and limited funding. Several respondents
reported operating with capacity constraints and relatively limited resources. As shown in Figure 8, when
asked about what prevents their organization from providing programs that it aspires to provide,
respondents cited limited financial resources (36 percent) and limited staffing (26 percent) as the two
leading factors. While limited staffing is often mentioned as an issue in the CDFI community in general,7
it is more pronounced in the NCDFI field. Eighteen of the 39 respondents employ fewer than three
people.
7 In a survey of CDFI small business lenders conducted by Opportunity Finance Network (a national membership organization for CDFIs), respondents cited lack of quality deals and insufficient staff capacity as the most common barriers to deployment of loan capital. The average respondent has a staff size of eight to ten. Additional information: https://www.cdfifund.gov/Documents/Deployment_Strategies_TA_Memo.pdf
0 5 10 15 20 25 30
Serve new targeted population(s)
Support special projects
Expand operations into new investment area(s)
Provide additional or new products or services
Increase the volume of current products and services
Number of Surveyed NCDFIs
Figure 7: Unmet Needs

10
Fundraising is an ongoing endeavor for CDFIs in general, but especially for NCDFIs because of the
growing financing needs in Native American communities. As indicated by some of our respondents in
their written comments, the expansion of NCDFIs is principally based on available capital to meet
increased demand. Capitalization planning becomes, therefore, an essential activity for any NCDFI
interested in growing in a smart and responsible manner. From the responses that we collected, we
observe the following capitalization trends and challenges.
The CDFI Fund constituted the most significant source of operating and lending funds for certified
NCDFIs. When asked to rank their CDFIs’ top three sources of operational funds, out of the 37
organizations that responded to this question, 22 ranked the CDFI Fund the highest. Federal government
programs other than the CDFI Fund came in second (10 organizations) and loan interests and other fees
came in third (7 organizations). Regarding the top three sources of lending funds, the CDFI Fund came in
first again, with 18 organizations utilizing that source. The Native American CDFI Assistance (NACA)
Program is the main program the CDFI Fund uses to provide financial and technical assistance awards to
expand and build the capacity of NCDFIs. The NACA Program is funded through an annual
appropriation from the U.S. Congress, and the awards are made each year through a competitive process
that spans several months. NCDFI practitioners in their comments noted that growth in the industry has
outstripped the growth of NACA, so that demand continues to outpace the resources. In the future,
industry experts expect direct federal appropriations to decline and to be replaced by tax credits and bond
guarantee programs. Our respondents are interested in exploring the New Markets Tax Credit program as
a way to expand program activities and generate more earned revenues. From Figure 9, we see that our
respondents are less likely to use federal government programs such as the Small Business
Administration and the CDFI bond guarantee.
0% 5% 10% 15% 20% 25% 30% 35% 40%
Institution charter
Banking regulations
Tribal politics
Other
Lack of necessary skills
Limited staffing
Limited financial resources
Share of Surveyed NCDFIs
Figure 8: Challenges to Achieving Scale

11
Respondent lending capacity varies greatly. In Tables 2 and 3, we observe that 29 of our respondents
held under $10 million in assets in 2016, and of that group, 6 held under $500,000. In addition, one entity,
certified in 2003, reported a total asset and total loan portfolio size of less than $500,000 in 2016.
According to some CDFI experts, the staff capacity and technology resources needed to operate a
$500,000 CDFI loan fund are about the same as operating a $10 million loan fund. Other CDFI
practitioners also say that $10 million is the minimum size to operate an efficient loan fund. 8 We
conclude that the majority of our respondents may be struggling to achieve operating efficiencies. As
already noted in the written comments, our respondents recognize the need to build capacity in new
sectors, such as community facilities and New Markets Tax Credit financing. Healthy food financing is
another sector that could build the lending capacity of NCDFIs. Only two respondents mentioned it as a
product line. The NCDFI industry could partner with experts in healthy food financing to codify the best
practices to share in capacity building efforts in Indian Country.
8 These two opinions were shared at a CDFI Fund capacity building initiative webinar held on March 14, 2016.
0 5 10 15 20 25 30 35
New Markets Tax Credit
State Small Business Credit Initiative
CDFI Bond Guarantee Program
Bank Enterprise Awards Program
Small Business Administration Programs
Other
CDFI Fund Capacity Building Initiative
CDFI Program
USDA grant or loan programs
NACA Program
Number of Surveyed NCDFIs
Figure 9: Federal Programs Used by NCDFIs

12
Table 2: Respondents by Asset Size, Institution Type, and Certification Year
LF = loan fund, CU = credit union, VC = venture capital fund
LF
LF
LF
LF
2016
2013
2007 2016
2014
2013
2002
2016
2013
2013
2002 2014
2013
2012
2002
2010
2012
2009
2001
LF
LF 2009
2012 CU
2006 CU
1998
2003 CU
2013 CU VC Bank
2003
2011 2016
2004 2012
1998
2001 2003
2010 2016 2013 2003
< $5
00K
$500
K–$1
M
$1M
–$5M
$5M
–$10
M
$10M
–$50
M
$50M
–$10
0M
>$10
0M
Table 3: Respondents by Portfolio Size, Institution Type, and Certification Year
LF = loan fund, CU = credit union, VC = venture capital fund
LF
LF 2013
2016
LF
2013 2016
2016
2012
2014
2014
2006
2013
2013
2004
2012
2013
2002
LF 2012
2011
2002
2007
LF
LF
2010
2009 CU
2001 CU
2002
2003 CU
Bank
2013 CU VC
2003
2009 2016
1998 2012
1998
2001 2003
2003
2010 2016 2013
< $5
00K
$500
K–$1
M
$1M
–$5M
$5M
–$10
M
$10M
–$50
M
$50M
–$10
0M
>$10
0M
13
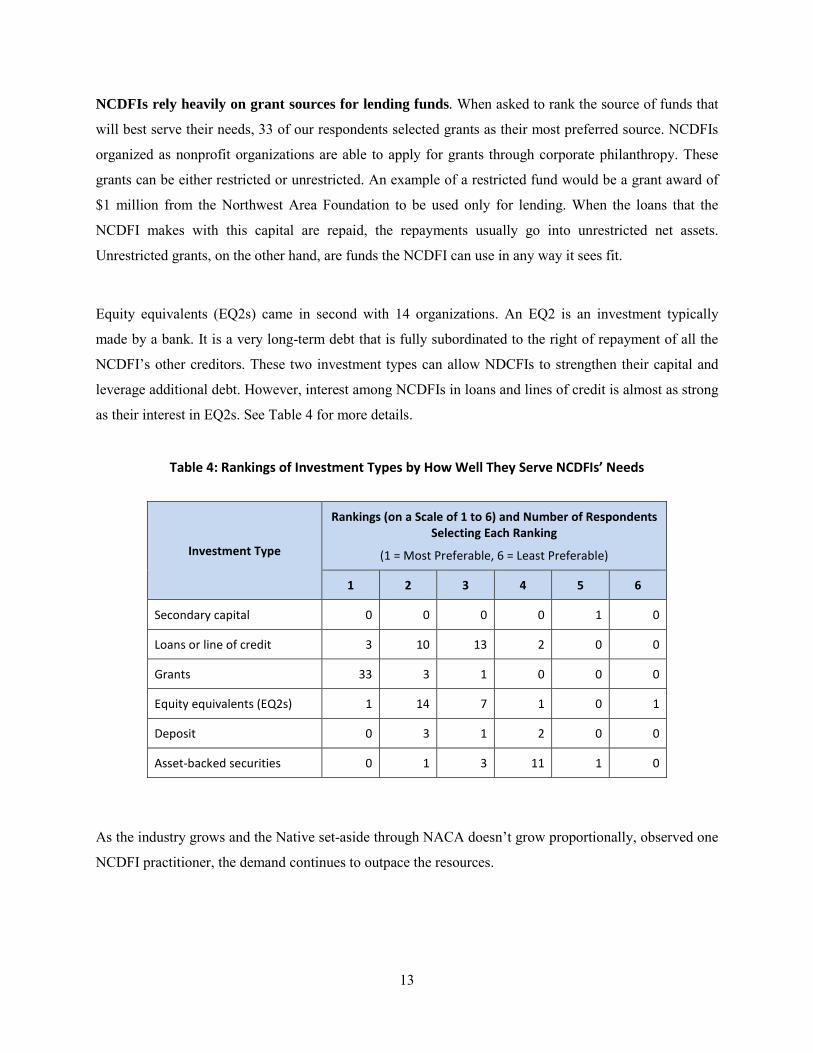
NCDFIs rely heavily on grant sources for lending funds. When asked to rank the source of funds that
will best serve their needs, 33 of our respondents selected grants as their most preferred source. NCDFIs
organized as nonprofit organizations are able to apply for grants through corporate philanthropy. These
grants can be either restricted or unrestricted. An example of a restricted fund would be a grant award of
$1 million from the Northwest Area Foundation to be used only for lending. When the loans that the
NCDFI makes with this capital are repaid, the repayments usually go into unrestricted net assets.
Unrestricted grants, on the other hand, are funds the NCDFI can use in any way it sees fit.
Equity equivalents (EQ2s) came in second with 14 organizations. An EQ2 is an investment typically
made by a bank. It is a very long-term debt that is fully subordinated to the right of repayment of all the
NCDFI’s other creditors. These two investment types can allow NDCFIs to strengthen their capital and
leverage additional debt. However, interest among NCDFIs in loans and lines of credit is almost as strong
as their interest in EQ2s. See Table 4 for more details.
Table 4: Rankings of Investment Types by How Well They Serve NCDFIs’ Needs
Investment Type
Rankings (on a Scale of 1 to 6) and Number of Respondents Selecting Each Ranking
(1 = Most Preferable, 6 = Least Preferable)
1 2 3 4 5 6
Secondary capital 0 0 0 0 1 0
Loans or line of credit 3 10 13 2 0 0
Grants 33 3 1 0 0 0
Equity equivalents (EQ2s) 1 14 7 1 0 1
Deposit 0 3 1 2 0 0
Asset-backed securities 0 1 3 11 1 0
As the industry grows and the Native set-aside through NACA doesn’t grow proportionally, observed one
NCDFI practitioner, the demand continues to outpace the resources.
14
Finally, NCDFIs are challenged with assessing the impact of their work. Survey respondents reported
wide use of output measurement. More and more investors in NCDFIs organized as loan funds are
interested in generating social impact, earning revenue, and being repaid. Our respondents are not
equipped to produce performance reports that could help investors balance their social impact goals and
risk tolerance. The majority of our respondents (32) reported measuring mainly both operational activities
(such as the number of loans made) and economic impact (such as the net number of jobs created or
retained) to assess their progress toward serving the needs of Native American communities. Remarkably,
13 respondents confirmed using methods that allow them to assess changes in conditions of the
communities they serve or in the lives of their clients. When asked to describe the challenges their
organizations face when measuring the results of their programs and services, our respondents cited
mostly staff capacity and limited resources.
PART 4: PARTNERSHIP OPPORTUNITIES
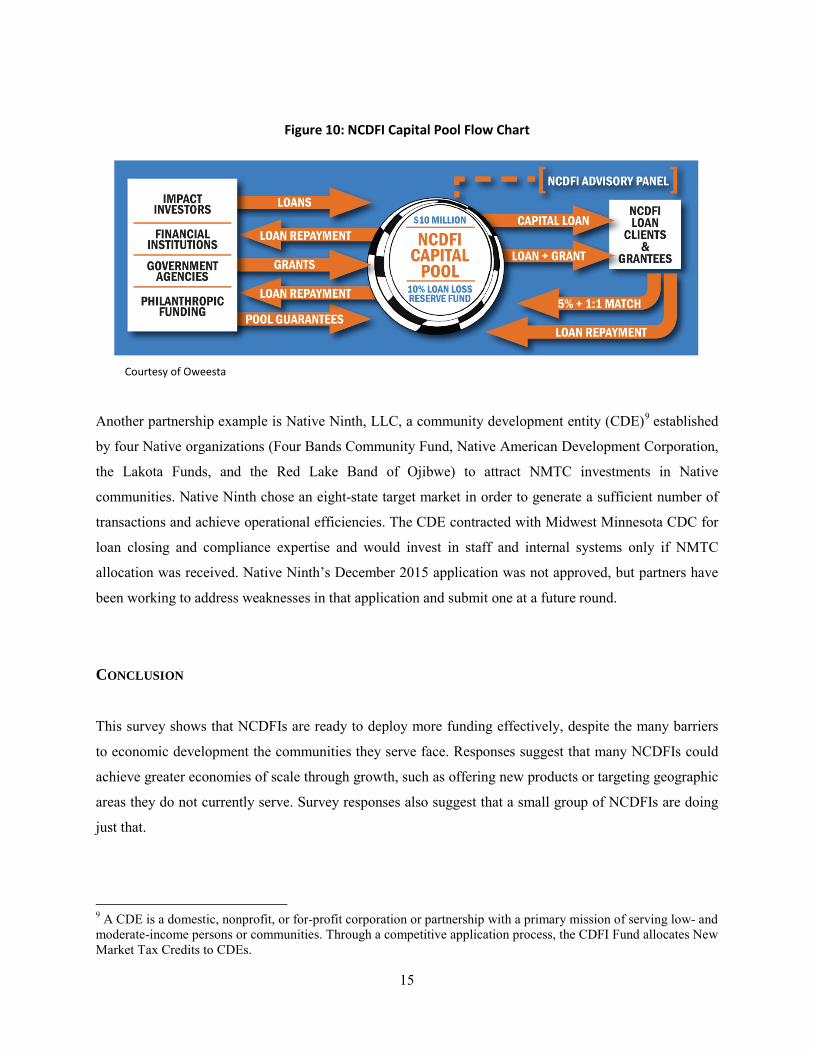
To address the unmet credit needs in the industry, intermediary lending organizations see themselves as a
major part of the solution. For example, Oweesta, in partnership with the Northwest Area Foundation and
the Native CDFI Network, is creating the NCDFI capital pool to address the shortage of lending capital.
The intent is to leverage larger amounts of lending funds for NCDFIs. The pool will be structured as a
membership, where members will invest 5 percent of their overall loan request into the pool as a cash
reserve. In return, members will receive up to $1,000,000 in lending funds. Partners in the project include
one NCDFI intermediary, loan funds focusing on microenterprise and/or small business development as
well as homeownership opportunities, and a credit union. They all went through rigorous underwriting
prior to being selected. See Figure 10.
15
Figure 10: NCDFI Capital Pool Flow Chart
Another partnership example is Native Ninth, LLC, a community development entity (CDE)9 established
by four Native organizations (Four Bands Community Fund, Native American Development Corporation,
the Lakota Funds, and the Red Lake Band of Ojibwe) to attract NMTC investments in Native
communities. Native Ninth chose an eight-state target market in order to generate a sufficient number of
transactions and achieve operational efficiencies. The CDE contracted with Midwest Minnesota CDC for
loan closing and compliance expertise and would invest in staff and internal systems only if NMTC
allocation was received. Native Ninth’s December 2015 application was not approved, but partners have
been working to address weaknesses in that application and submit one at a future round.
CONCLUSION
This survey shows that NCDFIs are ready to deploy more funding effectively, despite the many barriers
to economic development the communities they serve face. Responses suggest that many NCDFIs could
achieve greater economies of scale through growth, such as offering new products or targeting geographic
areas they do not currently serve. Survey responses also suggest that a small group of NCDFIs are doing
just that.
9 A CDE is a domestic, nonprofit, or for-profit corporation or partnership with a primary mission of serving low- and moderate-income persons or communities. Through a competitive application process, the CDFI Fund allocates New Market Tax Credits to CDEs.
Courtesy of Oweesta

16
The NCDFI industry has benefited greatly from funding and technical assistance provided by the CDFI
Fund. These practitioners also understand the importance of collaborating with one another to leverage
resources and expertise. The Native CDFI Network and Oweesta continue to work in partnership to
increase visibility of the industry and provide tangible solutions to the shortage of lending capital.
Additional steps that could bring more funding to the NCDFI industry include:
• Organizing training opportunities for NCDFIs’ boards and executive teams to deepen their
understanding of CDFI funding and ways they can use their personal and professional networks to
build relationship with funders.
• Conducting more workshops to explore strategies available for NCDFIs that have to stay in narrow
target markets. Topics may include learning about how to use partnerships to stay lean and to
decrease operating costs and how to access capital from federal programs other than the CDFI Fund.
• Planning a conference to discuss and support increased usage of the New Markets Tax Credit
program in Indian Country.
• Creating a process to establish benchmark metrics for NCDFIs participating in the Oweesta NCDFI
capital pool. These metrics could be used to educate other mission-driven investors about the ability
of the NCDFI industry to absorb more capital.
Philanthropic organizations and financial institutions would likely assist with the implementation of the
steps described above. Ultimately, NCDFIs will benefit and continue to provide critical financial services
in Native communities.
17
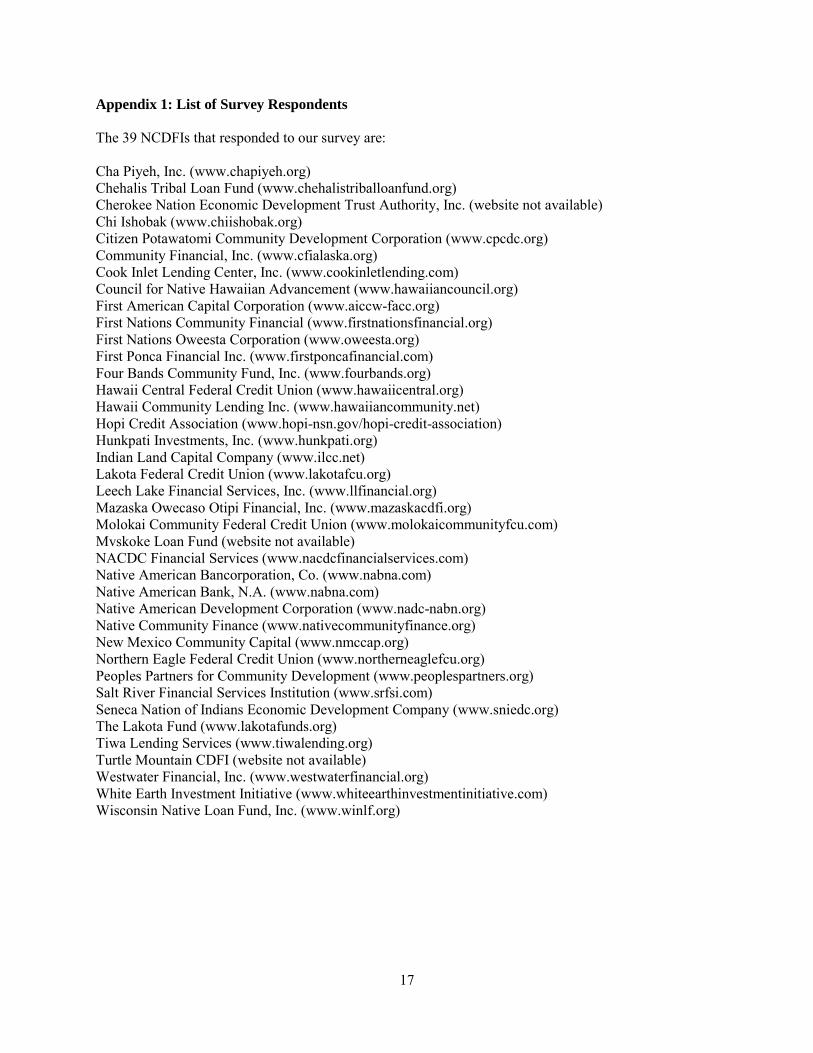
Appendix 1: List of Survey Respondents The 39 NCDFIs that responded to our survey are: Cha Piyeh, Inc. (www.chapiyeh.org) Chehalis Tribal Loan Fund (www.chehalistriballoanfund.org) Cherokee Nation Economic Development Trust Authority, Inc. (website not available) Chi Ishobak (www.chiishobak.org) Citizen Potawatomi Community Development Corporation (www.cpcdc.org) Community Financial, Inc. (www.cfialaska.org) Cook Inlet Lending Center, Inc. (www.cookinletlending.com) Council for Native Hawaiian Advancement (www.hawaiiancouncil.org) First American Capital Corporation (www.aiccw-facc.org) First Nations Community Financial (www.firstnationsfinancial.org) First Nations Oweesta Corporation (www.oweesta.org) First Ponca Financial Inc. (www.firstponcafinancial.com) Four Bands Community Fund, Inc. (www.fourbands.org) Hawaii Central Federal Credit Union (www.hawaiicentral.org) Hawaii Community Lending Inc. (www.hawaiiancommunity.net) Hopi Credit Association (www.hopi-nsn.gov/hopi-credit-association) Hunkpati Investments, Inc. (www.hunkpati.org) Indian Land Capital Company (www.ilcc.net) Lakota Federal Credit Union (www.lakotafcu.org) Leech Lake Financial Services, Inc. (www.llfinancial.org) Mazaska Owecaso Otipi Financial, Inc. (www.mazaskacdfi.org) Molokai Community Federal Credit Union (www.molokaicommunityfcu.com) Mvskoke Loan Fund (website not available) NACDC Financial Services (www.nacdcfinancialservices.com) Native American Bancorporation, Co. (www.nabna.com) Native American Bank, N.A. (www.nabna.com) Native American Development Corporation (www.nadc-nabn.org) Native Community Finance (www.nativecommunityfinance.org) New Mexico Community Capital (www.nmccap.org) Northern Eagle Federal Credit Union (www.northerneaglefcu.org) Peoples Partners for Community Development (www.peoplespartners.org) Salt River Financial Services Institution (www.srfsi.com) Seneca Nation of Indians Economic Development Company (www.sniedc.org) The Lakota Fund (www.lakotafunds.org) Tiwa Lending Services (www.tiwalending.org) Turtle Mountain CDFI (website not available) Westwater Financial, Inc. (www.westwaterfinancial.org) White Earth Investment Initiative (www.whiteearthinvestmentinitiative.com) Wisconsin Native Loan Fund, Inc. (www.winlf.org)

18
Appendix 2: Survey Questionnaire This survey questionnaire was sent to all NCDFIs in the U.S. and non-Native CDFIs located in the Ninth Federal Reserve District, which encompasses Minnesota, Montana, North Dakota, South Dakota, the Upper Peninsula of Michigan, and 26 counties in northwestern Wisconsin.
GENERAL INFORMATION
How would you classify your CDFI?
Certified CDFI (certified by the CDFI Fund) (1)
Non-certified CDFI (not certified by the CDFI Fund) (2)
Don’t know (5)
Other (please specify) (4) ________________________________________________
In what year did your CDFI first receive certification?
________________________________________________________________
Which of the following describes best your CDFI? (Select All That Apply)
Community Development Bank (1)
Community Development Credit Union (2)
Community Development Loan Fund (3)
Community Development Venture Capital Fund (4)
Microenterprise Development Loan Fund (5)
Community Development Corporation (6)
Don’'t know (8)
Other (please specify) (7) ________________________________________________

19
Do you consider your organization to be a Native CDFI?
Yes (1)
No (2)
For target market, please first select the designations that best apply to your organization’s service area. Then select the best choice for the people served in your organization’s geographic area. For example, if your organization serves only Navajo and Hopi Tribal Members in the states of Arizona and New Mexico you would select first, “states” in the geographic region, then, enrolled Tribal members of specific Tribes.
What is your organization’s geographic area?
State(s) (1)
County(ies) (2)
City(ies) (3)
Reservation(s) (4)
District(s) (5)
Other (please specify): (6) ________________________________________________
Select the type of people you serve
All people within geographic region(s) (1)
Enrolled Tribal members of ANY Tribe within geographic region(s) (2)
Enrolled Tribal members of specific Tribe(s) within geographic region(s) (3)
All Native Americans within geographic region(s) (4)
Other (please specify): (5) ________________________________________________
Which American Indian Reservations do you serve?
________________________________________________________________
Q10 List below the city(ies) in which you operate
________________________________________________________________
20
List below the state(s) in which you operate
________________________________________________________________
List below the county(ies) in which you operate
________________________________________________________________
List below the districts in which you operate.
________________________________________________________________
Which of the following categories best describes your organization’s lending area?
We are national in scope (1)
We serve a multi-state area or region of the country (2)
We serve an entire state (3)
We serve multiple counties, but not the entire state (4)
We serve a single county within the state (5)
We serve multiple cities within the state, but do not cover an entire county (6)
We serve a single city within the state (7)
We serve multiple neighborhoods or ZIP Codes, but do not cover an entire city (8)
We serve a single neighborhood or ZIP Code (9)
Other (please specify) (10) ________________________________________________
What states does your CDFI serve?
________________________________________________________________
21
What state does your CDFI serve?
________________________________________________________________
What counties does your CDFI serve? (Please indicate the counties and state(s).)
________________________________________________________________
What county does your CDFI serve? (Please indicate the county and state.)
________________________________________________________________
What cities does your CDFI serve? (Please indicate the cities and state(s).)
________________________________________________________________
What city does your CDFI serve? (Please indicate the city and state.)
________________________________________________________________
What neighborhoods or ZIP Codes does your CDFI serve?
________________________________________________________________
What neighborhood or ZIP Code does your CDFI serve?
________________________________________________________________

22
Which of the following loan products does your CDFI offer? (Select all that apply.)
Affordable Housing (1)
Commercial Financial Services (2)
Commercial Real Estate (3)
Community Facilities (4)
Consumer Financial Products (5)
Consumer Financial Services (6)
Intermediary Lending to Nonprofits and CDFIs (7)
Microenterprise (defined as a business with no more than five employees and start up costs of $35,000 or less) (8)
Small Business (9)
Other (please specify) (10) ________________________________________________
Which of the following other services does your CDFI offer? (Select all that apply)
Business Technical Assistance (1)
Credit Counseling (2)
Financial Education (3)
Homeownership Counseling and Technical Assistance (4)
Real Estate Technical Assistance (5)
Other (please specify) (6) ________________________________________________
How many full-time employees did your CDFI employ as of December 31, 2016?
Less than 3 (1)
4 - 9 (2)
10 - 19 (3)
20 - 39 (4)
40 or more (5)
DEMAND AND CAPACITY

23
Please select the category that best describes the overall demand for your CDFI’s products and services in 2016? (Select one).
Very high (1)
High (2)
Medium (3)
Low (4)
Very low (5)
In 2017, do you expect demand for financing from your CDFI to:
Increase (1)
Decrease (2)
Stay the same (3)
In 2016, did you receive more qualified and approved loan requests than you had funding available?
Yes (1)
No (2)
Would you say that the amount of loan requests approved exceeded available funding by
Less than 10 percent (1)
10 to 19 percent (2)
20 to 29 percent (3)
30 percent or more (4)
Are there programs that your CDFI aspires to provide but currently does not?
Yes (1)
No (2)

24
Briefly describe the programs that your CDFI would like to provide, but cannot at the present time.
________________________________________________________________
________________________________________________________________
________________________________________________________________
________________________________________________________________
________________________________________________________________
What prevents your CDFI from providing programs that it aspires to do? (Select all that apply.)
Limited staffing (1)
Lack of necessary skills (2)
Limited financial resources (3)
Banking regulations (4)
Institution charter (5)
Tribal politics (6)
Other (please specify) (7) ________________________________________________
Please elaborate on the capacity challenges you identified in the question above. What barriers prevent your organization from overcoming these challenges?
________________________________________________________________
________________________________________________________________
________________________________________________________________
________________________________________________________________
________________________________________________________________
CAPITALIZATION

25
Please rank your CDFI’s 2016 top three sources of operational funds with 1 being the highest. ______ Regulated financial institutions (1) ______ Nonregulated financial institutions (2) ______ National foundations (3) ______ Regional foundations (4) ______ State foundations (5) ______ Community foundations (6) ______ CDFI Fund (7) ______ Tribal government (8) ______ Federal government (not CDFI Fund) (9) ______ State government (10) ______ Local government (11) ______ Social impact investment group (12) ______ Private/individual investors (13) ______ Other (please specify) (14)
Please rank your CDFI’s 2016 top three sources of lending funds with 1 being the highest. ______ Regulated financial institutions (1) ______ Nonregulated financial institutions (2) ______ National foundations (3) ______ Regional foundations (4) ______ State foundations (5) ______ Community foundations (6) ______ CDFI Fund (7) ______ Tribal government (8) ______ Federal government (not CDFI Fund) (9) ______ State government (10) ______ Local government (11) ______ Social impact investment group (12) ______ Private/individual investors (13) ______ Deposits (14) ______ Other (please specify) (15)

26
Please help us characterize the size of your organization. Provide an estimate by selecting the nearest dollar range.
What was the total value of your CDFI’s organizational assets as of December 31, 2016? (1)
▼ Less than $500,000 (1) ... Greater than $1,000,000,000 (13)
What was the total value of your CDFI outstanding loan receivables as of December 31, 2016? (2)
▼ Less than $500,000 (1) ... Greater than $1,000,000,000 (13)
What is the total value of organizational assets that your CDFI expects to achieve by December 31, 2020? (3)
▼ Less than $500,000 (1) ... Greater than $1,000,000,000 (13)
Does your CDFI receive funding and/or technical assistance from any of the following federal programs? (Select all that apply.)
U.S. Department of Agriculture grant or loan programs (1)
Bank Enterprise Awards Program (BEA) (2)
Community Development Financial Institutions Program (3)
New Markets Tax Credit (4)
Native American CDFI Assistance Program (NACA) (5)
CDFI Bond Guarantee Program (6)
CDFI Fund Capacity Building Initiative (7)
State Small Business Credit Initiative (U.S. Department of Treasury) (8)
Small Business Administration Programs (9)
Other (please specify) (10) ________________________________________________
Please specify the dollar range of total investment you will need from outside funders in order to meet your obligations in 2017.
Less than $500,000 (1)
$500,000 - $1,000,000 (2)
$1,000,000 - $5,000,000 (3)
Greater than $5,000,000 (4)
27
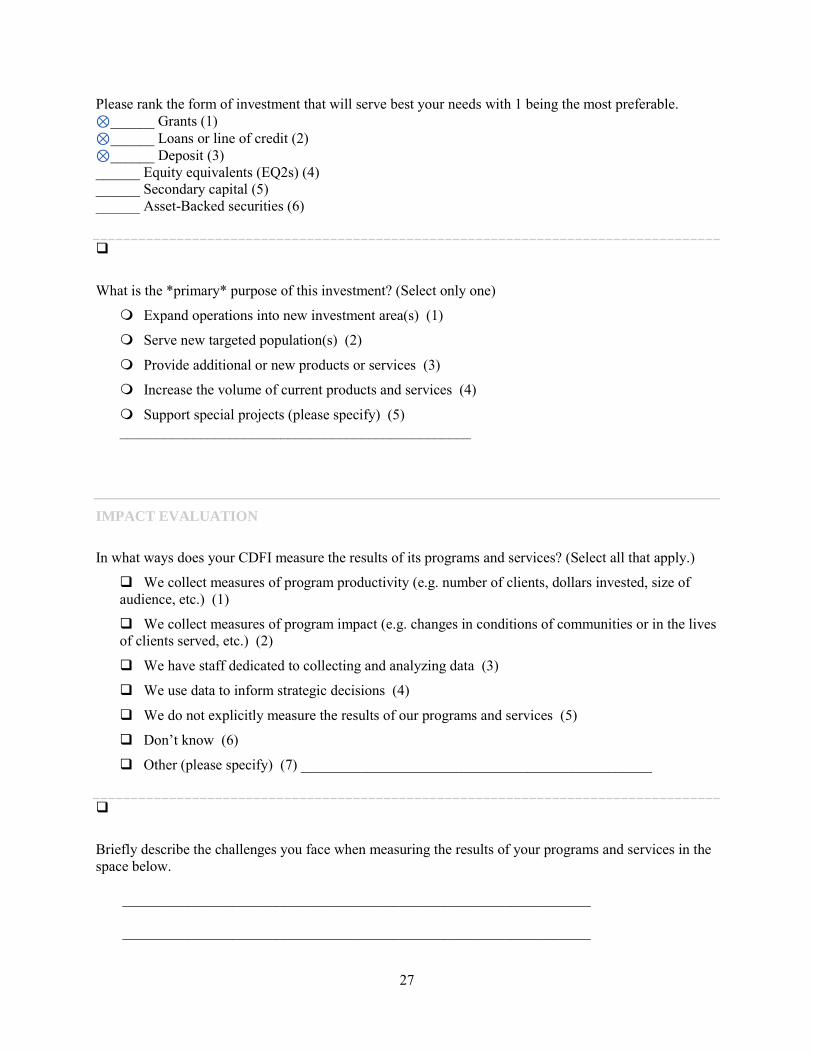
Please rank the form of investment that will serve best your needs with 1 being the most preferable. ⊗______ Grants (1) ⊗______ Loans or line of credit (2) ⊗______ Deposit (3) ______ Equity equivalents (EQ2s) (4) ______ Secondary capital (5) ______ Asset-Backed securities (6)
What is the *primary* purpose of this investment? (Select only one)
Expand operations into new investment area(s) (1)
Serve new targeted population(s) (2)
Provide additional or new products or services (3)
Increase the volume of current products and services (4)
Support special projects (please specify) (5) ________________________________________________
IMPACT EVALUATION
In what ways does your CDFI measure the results of its programs and services? (Select all that apply.)
We collect measures of program productivity (e.g. number of clients, dollars invested, size of audience, etc.) (1)
We collect measures of program impact (e.g. changes in conditions of communities or in the lives of clients served, etc.) (2)
We have staff dedicated to collecting and analyzing data (3)
We use data to inform strategic decisions (4)
We do not explicitly measure the results of our programs and services (5)
Don’t know (6)
Other (please specify) (7) ________________________________________________
Briefly describe the challenges you face when measuring the results of your programs and services in the space below.
________________________________________________________________
________________________________________________________________

28
________________________________________________________________
________________________________________________________________
________________________________________________________________
FOLLOW-UP
Thank you for your participation in this survey. Would you be willing to participate in a follow-up conversation about your responses?
Yes (1)
No (2)
Please enter in the space below your name and a telephone number you could be reached.
________________________________________________________________