findings from the a demographic and national agricultural
TRANSCRIPT

Findings from the National Agricultural Workers Survey (NAWS) 2001-2002
A Demographic and Employment Profile of United States Farm Workers
Research Report No. 9
U.S. Department of Labor Office of the Assistant Secretary for Policy Office of Programmatic Policy
March 2005

Material contained in this publication is in the public domain and may be reproduced, fully or partially, without permission of the Federal Government. Source credit is requested. Permission is required only to reproduce any copyrighted material contained herein.
This material will be made available to deaf and hard of hearing individuals upon request. Voice phone: 202-219-6197 TTY FIRS: 1-800-877-8339

Findings from the National Agricultural Workers Survey (NAWS) 2001-2002
A Demographic and Employment Profile of United States Farm Workers
U.S. DEPARTMENT OF LABOR ELAINE L. CHAO, SECRETARY
OFFICE OF THE ASSISTANT SECRETARY FOR POLICY VERONICA VARGAS STIDVENT, ASSISTANT SECRETARY
OFFICE OF PROGRAMMATIC POLICY RUTH M. SAMARDICK, DIRECTOR
MARCH 2005
This report was produced through a collaboration of the U.S. Department of Labor, Office of the Assistant Secretary for Policy, and Aguirre International, Burlingame, California.
It was written by:
Daniel Carroll, U.S. Department of Labor Ruth M. Samardick, U.S. Department of Labor Scott Bernard, U.S. Department of Labor Susan Gabbard, Aguirre International Trish Hernandez, Aguirre International
The authors are grateful to Jorge Nakamoto and Alberto Sandoval, Aguirre International, for coordinating the field interviews on which the report is based, as well as to the interviewer consultants and support staff of Aguirre International. The authors also thank the 6,472 U.S. crop workers who graciously participated in an interview during 2001-2002, and the agricultural employers who helped survey staff reach the workers.


iii
CONTENTS
Page
EXECUTIVE SUMMARY………………………………………………………….. ix
INTRODUCTION…………………………………………………………………… 1
Topics Covered………………………………………………………………….. 1 Survey Method…………………………………………………………………... 2
CHAPTER 1: Birthplace, Employment Eligibility, and Migrant Types…………… 3
Summary of Findings…………………………………………………………… 3 Place of Birth……………………………………………………………………. 3 Ethnicity and Race………………………………………………………………. 4
Foreign-born Workers’ First Arrival to the United States………………………. 4 Employment Eligibility…………………………………………………………. 6 Migrant Types…………………………………………………………………… 7 International Migrants…………………………………………………………… 8 Domestic Migrants………………………………………………………………. 8
CHAPTER 2: Demographics, Family Size, and Household Structure……………… 9
Summary of Findings…………………………………………………………… 9 Gender…………………………………………………………………………… 9
10Age………………………………………………………………………………. Marital Status and Family Type………………………………………………… 12
Household Structure……………………………………………………………. 13
CHAPTER 3: Education, Literacy, and English Skills……………………………… 17
Summary of Findings……………………………………………………………. 17 Native Language…………………………………………………………………. 17
Education………………………………………………………………………… 18 Adult Education…………………………………………………………………. 19
English Language Skills………………………………………………………… 21

iv
CONTENTS (continued)
Page
CHAPTER 4: Labor Force Participation………………………………………….. 23
Summary of Findings………………………………………………………….. 23 Number of U.S. Farm Employers in Previous 12 Months…………………….. 23 Measuring Labor Force Participation…………………………………………. 24 Time Employed and Not Employed…………………………………………… 24
Farm Workdays………………………………………………………………… 26 Farm Work Experience………………………………………………………… 27 Plans to Remain in Farm Work………………………………………………... 29
CHAPTER 5: Farm Job Characteristics…………………………………………... 31
Summary of Findings………………………………………………………….. 31 Type of Employer……………………………………………………………… 31 Crop and Task of Farm Jobs…………………………………………………… 32 Recruitment and Retention…………………………………………………….. 34 Hours Worked and Basis for Pay………………………………………………. 36 Wages…………………………………………………………………………... 38 Monetary Bonuses and Insurance Benefits…………………………………….. 41 Housing………………………………………………………………………… 43 Worksite Availability of Water and Toilets…………………………………… 45 Distance to Work and Transportation…………………………………………. 45 Tools and Equipment………………………………………………………….. 46
CHAPTER 6: Income, Assets, and Use of Public Programs……………………... 47
Summary of Findings…………………………………………………………. 47 Income………………………………………………………………………… 47
Assets…………………………………………………………………………. 49 Contribution- and Needs-Based Programs……………………………………. 50
APPENDIX A: Statistical Procedures………………………………………………. 53
NAWS Weighting Procedure …………………………………………………… 53 Determining Confidence Intervals……………………………………………… 53
APPENDIX B: Index of Means and Percentages of Key Variables………………… 55

v
TABLES
Table Page
Table 1.1 Change in Migrant Types: 1993-1994 and 2001-2002 Compared… 8
Table 2.1 Average Age by Select Demographic Characteristics……………… 11
Table 2.2 Migrant Types: Crop Workers Living Apart from their Children….. 15
Table 3.1 English Speaking and Reading Ability by Place of Birth and Ethnicity……………………………………………………………. 22
Table 4.1 Weeks of Activity by Legal Status………………………………….. 25
Table 4.2 Weeks Employed and Not Employed by Age Group……………….. 26
Table 4.3 Farm Workdays by Number of U.S. Farm Employers and Years of U.S. Farm Experience …...………………………………………… 29
Table 5.1 Primary Crop at Current Farm Job…………………………………. 32
Table 5.2 Primary Crop by Employment Type……………………………….. 32
Table 5.3 Primary Task at Current Farm Job…………………………………. 33
Table 5.4 Primary Task by Employment Type……………………………….. 34
Table 5.5 Job Characteristics: Foreign-born Newcomers and All Other Workers…………………………………………………………….. 34
Table 5.6 Basis for Pay by Crop Type………………………………………… 38
Table 5.7 Basis for Pay by Task Type…………………………………………. 38
Table 5.8 Average Hourly Earnings …………………………………………. 39
Table 5.9 Average Hourly Wages of Crop Workers, Nominal and Real (2002) Dollars, Calendar Years 1993-2002………………………………….. 40
Table 5.10 Insurance Benefits: Overall and by Seasonality, with Current Farm Employer……………………………………………………………... 42
Table 5.11 Housing Arrangement, by Worker Type…………………………….. 43

vi
TABLES (continued)
Table Page
Table 5.12 Housing Location, by Worker Type………………………………….. 44
Table 5.13 Housing Type, by Worker Type……………………………………… 44
Table 5.14 Worksite Availability of Water and Toilets…………………… 45
Table 5.15 Transportation to Work, by Worker Type……………………………. 46
Table 5.16 Payment for Tools and Equipment, by Employment Type…………. 46
Table 6.1 Family Incomes below Poverty, by Family Size…………………….. 48
Table 6.2 Households Receiving Payments from Contribution-Based Programs……………………………………………………………… 50
Table 6.3 Households Receiving Benefits from Needs-Based Programs………. 51
Table A.1. Confidence Intervals for Continuous Variables ……………………… 54

vii
FIGURES
Figure Page
Figure 1.1 Place of Birth……………………………………………………….. 3
Figure 1.2 Foreign-born Workers: Years Passed Since First U.S. Arrival……. 5
Figure 1.3 Years Since First U.S. Arrival by Birthplace………………………. 6
Figure 1.4 U.S. Employment Eligibility……………………………………….. 7
Figure 2.1 Legal Status by Gender…………………………………………….. 9
Figure 2.2 Age Distribution of Hired Crop Workers…………………………... 10
Figure 2.3 Age Distribution by Legal Status…………………………………... 11
Figure 2.4 Family Type………………………………………………………… 12
Figure 2.5 Number of Children of Hired Crop Farm Workers………………… 13
Figure 2.6 Cohabitation of Farm Worker Parent and Minor Children………… 14
Figure 3.1 Native Language…………………………………………………… 17
Figure 3.2 Highest Grade Completed by Place of Birth………………………. 18
Figure 3.3 Highest Grade Completed by Foreign-born Newcomers………….. 19
Figure 3.4 Participation in Adult Education…………………………………… 20
Figure 3.5 Adult Education by Highest Grade Completed……………………. 21
Figure 4.1 Number of U.S. Farm Employers in Previous 12 Months………… 23
Figure 4.2 Time Employed and Not Employed………………………………... 24
Figure 4.3 Farm Workdays by Legal Status…………………………………… 27
Figure 4.4 Farm Work Experience by Legal Status…………………………… 28
Figure 5.1 Legal Status by Employment Type…………………….…………... 31
viii
FIGURES (continued)
Figure Page
Figure 5.2 Number of Years Working for Current Farm Employer…………… 35
Figure 5.3 Employment Seasonality by Years with Current Farm Employer…… 36
Figure 5.4 Crop Workers’ Average Hourly Wages, Nominal and Real (2002) Dollars, Calendar Years 1993-2002………………………………….. 40
Figure 6.1 U.S. Individual Income from All Sources…………………………… 48
Figure 6.2 Farm Workers’ Assets in the United States…………………………. 49
Figure 6.3 Foreign-born Workers’ Assets in Foreign Country………………….. 50

ix
Executive Summary
This report is the ninth in a series of Department of Labor publications on the demographic and employment characteristics of the nation’s hired crop labor force. The findings come from the National Agricultural Workers Survey (NAWS), a nationwide, random survey that obtains information directly from farm workers. The information summarized herein was collected between October 1, 2000 and September 30, 2002 (federal fiscal years 2001 and 2002), through face-to-face interviews with 6,472 crop farm workers.1
Demographic Characteristics In fiscal years 2001-2002, as in previous periods, the hired farm workforce was predominantly foreign-born. Just 23 percent of all hired crop farm workers were born in the United States; 75 percent were born in Mexico, two percent in Central American countries, and one percent of the crop workers were born in other countries.2
Mexico-born crop workers were from almost every state of their native country. The largest share (46%) were from the traditional sending states of west central Mexico: Guanajuato, Jalisco, and Michoacan. However, an increasing share were from nontraditional states. The share from the southern part of Mexico, comprising the states of Guerrero, Oaxaca, Chiapas, Puebla, Morelos and Veracruz, doubled from nine percent in 1993-1994 to 19 percent in 2001-2002.
In 2001-2002, 53 percent of the hired crop labor force lacked authorization to work in the United States, down from 55 percent in 1999-2000. Another 25 percent of the crop workers in 2001-2002 were U.S. citizens, 21 percent were legal permanent residents, and one percent were employment-eligible on some other basis.
A large share (42%) of the crop workers in 2001-2002 were migrants, defined as having traveled at least 75 miles within the previous year to obtain a farm job. This figure was down from 47 percent in 1993-1994. Among the migrants, 26 percent traveled only within the United States and 35 percent migrated back-and-forth from a foreign country (primarily Mexico). Fully 38 percent of them were newcomers to the United States who had been in the country less than a year when they were interviewed. These foreign-born newcomers comprised 16 percent of all hired crop workers in 2001-2002, an increase of 60 percent from 1993-1994, when they were just ten percent of all crop farm workers. Nearly all (99%) of the foreign-born newcomers were unauthorized.
Crop workers are young: the average age in 2001-2002 was 33, and half were younger than 31. Among all crop workers, 79 percent were male, 58 percent were married, and 51 percent were parents, who reported an average of two children.
1 The population sampled by the NAWS consists of nearly all farm workers in crop agriculture, includingfield packers and supervisors. The sample does not include poultry, livestock and fishery workers, secretaries, mechanics, or H-2A foreign temporary workers.2 The sum of portions is not equal to 100 percent because of rounding.

x
This report uses the term “unaccompanied” to describe workers who were living away from all nuclear family members when interviewed. Thirty-four percent of the parents and 30 percent of childless married workers were “unaccompanied”. Eighty-seven percent of this subset of unaccompanied workers had at least one child and/or a spouse living in Mexico. Work authorized parents were twice as likely to be accompanied by their spouse and children as unauthorized parents (86% vs. 43%, respectively).
The majority (81%) of all crop workers reported that Spanish was their native language. Forty-four percent reported that they could not speak English “at all”; 53 percent said that they could not read English “at all.” On average, the highest grade completed was seventh grade. While 56 percent of the U.S.-born had completed the 12th grade, only six percent of the foreign-born had done so. Twenty percent of all crop workers in 20012002 reported that they had taken at least one kind of adult education class in the United States in their lifetime.
Employment Characteristics In 2001-2002, nine out of ten of all crop workers, including foreign-born newcomers, reported having worked for one or two U.S. farm employers3 in the previous 12 months. Excluding foreign-born newcomers, who have less than 12 months work history in the United States, workers averaged 34 and a half weeks of farm work and five weeks of non-farm work in the previous year. Again excluding foreign-born newcomers, crop workers averaged 190 days of farm work in the 12 months preceding their interview; 77 percent reported working at least 100 days.
Including foreign-born newcomers, crop workers interviewed in fiscal years 2001-2002 had been employed with their current farm employer an average of nearly four and a half years. Thirty-five percent had been working for their current farm employer for one year or less, and 13 percent had been employed at their current job for ten or more years.
Seventy-nine percent of all crop workers were employed directly by growers and packing firms; farm labor contractors employed the remaining 21 percent. The share of workers who were employed by farm labor contractors increased by 50 percent between the periods 1993-1994 and 2001-2002, from 14 to 21 percent, respectively.
NAWS respondents worked an average of 42 hours per week and had average hourly earnings of $7.25. Average hourly earnings increased with years of employment for a particular employer. Crop workers who had been with their employer for one year or less averaged $6.76 per hour; those with their current employer for at least six years averaged $8.05 per hour. Average hourly earnings increased by 25 percent in nominal dollars and by nine percent in inflation-adjusted (real) dollars between the periods 1993-1994 and 2001-2002. The increases, however, were not steady. Real hourly earnings declined between 1993 and 1996, and then fell again slightly between 2000 and 2001.
3 An employer can be either a farm owner or a farm labor contractor. While a worker employed by a farm labor contractor may work on more than one farm in a year, their contractor is counted as one employer.

xi
Insurance Benefits Thirty-nine percent of the workers reported that they would be covered by unemployment insurance (UI) if they lost their job. Fifty-four percent reported not being covered by UI and eight percent did not know.4 Work authorized respondents were much more likely than those not authorized to report that they would receive UI benefits should they lose their job (76% vs. 4%, respectively). A larger share of workers (48%) reported that they would be covered by workers’ compensation for a work-related illness or injury; 20 percent said they would not be covered and 31 percent did not know. Unauthorized workers were half as likely (33%) as authorized workers (65%) to report being covered by workers’ compensation and were twice as likely (41%) as authorized workers (20%) not to know if they were covered.
Twenty-three percent of those interviewed in 2001-2002 said they were covered by health insurance. Among these insured crop workers, the largest share (46%) said their current farm employer paid for it; 19 percent said the government provided it; 15 percent reported that either they or their spouse paid for all of the insurance; 12 percent said they were covered under their spouse’s employer’s plan; and seven percent identified an “other” coverage source.
Housing At the time of the interview, a majority (58%) of the workers lived in housing they rented from someone other than their employer. Twenty-one percent lived in housing that was supplied by their employer (17 percent received it free of charge and four percent paid rent either directly or via payroll deduction); 19 percent lived in housing that either they or a family member owned; and two percent lived, free of charge, with family or friends.
Income, Use of Needs-based Programs, Assets The average individual income of crop workers was between $10,000 and $12,499. Total family income averaged between $15,000 and $17,499. Thirty percent of all farm workers had total family incomes that were below the poverty guidelines. Twenty-two percent said that they or someone in their household had used at least one type of public assistance program in the previous two years. The most common was Medicaid (15%), followed by Women Infants and Children (11%) and Food Stamps (8%). Less than one percent reported that they or someone in their family had received general assistance welfare or temporary assistance to needy families (TANF).
In 2001-2002, 74 percent of all crop workers reported that they owned or were buying at least one asset either in the United States or in their home country. The most commonly held asset in the United States was a car or truck (49%), followed by a home (17%), land (4%), and mobile home (3%). U.S.-born workers were more likely (38%) to own or be buying a home in the United States than were foreign-born workers (11%).
4 The sum of portions is not equal to 100 percent because of rounding.

xii

1
Introduction
This report describes the demographic and employment characteristics of hired crop farm workers – an important segment of the U.S. labor force whose performance of numerous and varied agricultural tasks helps produce a large share of the nation’s food supply and contributes significantly to U.S. exports. The information summarized herein was collected from the U.S. Department of Labor’s National Agricultural Workers Survey (NAWS) between October 1, 2000 and September 30, 2002 through face-to-face interviews with 6,472 crop farm workers.
The NAWS interviews workers engaged in “seasonal agricultural services,” a U.S. Department of Agriculture (USDA) designation of workers who perform “field work” in the vast majority of nursery products, cash grains, and field crops, as well as in all fruits and vegetables. The NAWS also includes persons who work in the production of silage and other animal fodder. As such, the population sampled by the NAWS consists of nearly all farm workers in crop agriculture, including field packers, and supervisors, and even those who simultaneously hold non-farm jobs. The sample does not include poultry, livestock and fishery workers, secretaries, mechanics, or H-2A foreign temporary workers.
The NAWS is the only national information source on the demographic, employment, and health characteristics of this population. Since its inception in 1988, the survey has benefited from the collaboration of multiple federal agencies, which continue to share in the design of the questionnaire. Information provided through the survey informs the policies and programs of the many federal government agencies that protect and provide services to migrant and seasonal farm workers and their dependents.
Topics Covered
This report is organized in six chapters, each beginning with a summary of the chapter’s key findings. The report also contains two appendices: Appendix A describes the statistical procedures used to analyze the data and Appendix B is a table of the means and percentages of the principle variables presented in the report.
Chapters 1 through 3 summarize the demographic characteristics of farm workers, including place of birth, ethnicity and race, employment eligibility, gender, age, marital status, household size and structure, education, and language ability. Chapter 4 gives an overview of farm workers’ participation in U.S. agricultural and non-agricultural sector employment, and Chapter 5 summarizes the characteristics of farm jobs, including crops and tasks, recruitment and retention, hours worked, and wages and benefits. Chapter 6 presents information on crop farm workers’ income, assets, and use of social services. It covers personal and family income, assets in the United States and home country, family poverty status, and use of government programs.

2
Survey Method
NAWS uses multi-stage sampling to account for seasonal and regional fluctuations in the level of farm employment. Seasonal fluctuations in the agricultural work force are captured by three interviewing cycles, each lasting ten to twelve weeks. Cycles begin in February, June, and October. The number of interviews conducted during a cycle is proportional to the amount of crop activity at that time of the year, which is approximated using administrative data from the Department of Labor’s Bureau of Labor Statistics and the USDA’s Census of Agriculture.
NAWS samples workers in 12 regions, which are aggregated from 17 USDA-designated agricultural regions. Within the 12 regions, sampling locations are selected from a roster of 80 clusters. Clusters are either single counties or aggregates of counties that have similar farm labor usage during the particular cycle. The clusters are selected in each region with probabilities proportional to size of farm labor expenses. Within clusters, counties are then selected, also based on probabilities proportional to size of farm labor expenses.
The penultimate sampling stage is the selection of agricultural employers. In order to maintain regionally representative data and yet have an adequate distribution of rare events, simple random sampling is used. The employers are randomly selected from public agency records. Principal among these are unemployment insurance files, Agricultural Commissioners’ pesticide registrations, and lists maintained by the Bureau of Labor Statistics and various state agencies. The availability of these data varies by state. NAWS staff review and update these lists annually.
The end stage of sampling is the selection of farm workers at the establishment. Once the sample of employers is drawn, NAWS interviewers contact the selected growers, explain the purpose of the survey, and obtain access to the work site in order to schedule interviews. Interviewers then go to the farm, ranch, or nursery, explain the purpose of the survey to the workers, and ask a random sample of them to participate. As such, only workers who are employed in agriculture at the time of the interview are included in the sample. Interviews are conducted in the worker’s home or at another location of the worker’s choice.

3
Chapter 1: Birthplace, Employment Eligibility, and Migrant Types U.S. CROP WORKERS’ NATIONAL ORIGIN, ETHNICITY AND RACE; FOREIGN-BORN WORKERS’ FIRST ARRIVAL TO THE U.S.; WORK AUTHORIZATION; INTERNATIONAL & DOMESTIC MIGRANTS
Summary of Findings • Seventy-five percent of the workers were born in Mexico. • Fifty-three percent of all respondents were not authorized to work in the United
States. • Foreign-born newcomers comprised 16 percent of the hired crop labor force.
Place of Birth Foreign-born workers comprised a large share of the hired crop labor force in fiscal years 2001-2002. Among all crop workers, 78 percent were born outside the United States: seventy-five percent were born in Mexico, two percent were from Central American countries, and one percent of the workers were from elsewhere (fig. 1.1).
Other, 1%
i
United States, 23%
Central America, 2%
Mex co, 75%
Figure 1.1 Place of Birth. Note: Sum of portions is not equal to 100 percent because of rounding.

4
Workers born in Mexico were from almost every state of their native country. The largest share (46%) were from the traditional sending states of west central Mexico: Guanajuato, Jalisco, and Michoacan. However, an increasing share were from nontraditional states. For example, the share of Mexican crop workers from the southern part of Mexico, comprising the states of Guerrero, Oaxaca, Chiapas, Puebla, Morelos and Veracruz, doubled from nine percent in 1993-1994 to 19 percent in 2001-2002.
Ethnicity and Race The NAWS uses the following response categories for ethnicity: Mexican-American, Mexican, Chicano, Puerto Rican, other Hispanic, and not Hispanic or Latino. In 20012002, 83 percent of the crop workers identified themselves as members of a Hispanic group: 72 percent as Mexican, seven percent as Mexican-American, one percent as Chicano, and three percent as other Hispanic. Only 16 percent of U.S. crop workers self identified as belonging to an ethnic group that was not Hispanic or Latino. Ethnicity labels, however, are somewhat arbitrary as they are based on multiple characteristics such as cultural heritage, nationality, and racial background. For example, 17 percent of the U.S.-born crop workers self identified as Mexican-American and four percent as Mexican.
Race is a difficult concept for many foreign workers, who often do not use the same concepts in their home countries. Using the Office of Management and Budget’s standard categories for race, crop workers were asked to describe themselves as White; Black or African American; American Indian, Alaskan Native or Indigenous; Asian; Native Hawaiian or Pacific Islander; and other. Forty-seven percent of the respondents answered “other” to this question, while 41 percent self identified as White; eight percent as American Indian, Alaskan Native or Indigenous; four percent as Black, and less than one percent each as Asian and Native Hawaiian or Pacific Islander. Among those who answered “other”, nearly all (99%) identified themselves as members of a Hispanic group: 85 percent self identified as Mexican; nine percent as Mexican-American, four percent as other Hispanic, and one percent as Chicano.
Foreign-born Workers’ First Arrival to the United States NAWS interviewers ask the month and year each foreign-born crop worker first entered the United States. While not a measure of continued residence, data from this question provide important, albeit partial, information about foreign-born workers’ migration history as well a measure of the stability of the farm labor market.
On average, foreign-born crop workers first came to the United States ten years prior to being interviewed. Large shares of the foreign-born, however, had either first entered the United States less than one year ago (17%), or more than 14 years ago (29%) (fig. 1.2).

5
35% Pe
rcen
tage
of F
orei
gn-b
orn
30%
25%
20%
15%
10%
5%
0% < 1 1 - 2 3 - 4 5 - 9 10 -14 15 +
16%
13%
29%
9%
17% 17%
Number of Years
Figure 1.2 Foreign-born Workers: Years Passed Since First U.S. Arrival. Note: Sum of portions is not equal to 100 percent because of rounding.
The period since first arrival varied by birthplace. Crop workers born in Mexico had, on average, first come to the United States ten years ago, compared to five years ago for workers born in Central American countries (fig. 1.3).
Foreign-born newcomers play a particularly significant and growing role in the hired crop workforce. Defined as persons who were in the United States for the first time and who had been in this country for less than a year when they were interviewed, their contribution to the crop workforce increased from 10 percent in 1993-1994 to 16 percent in 2001-2002. Because foreign-born newcomers differ in many respects from other crop workers, they are discussed as a separate group in several parts of this report.

6
Mexico 10
5
0 2 4 6 8 10 12
Average Number of Years
Figure 1.3 Years since First U.S. Arrival by Birthplace.
Employment Eligibility Foreign-born workers may be authorized to work in the United States under various visa categories. While employment eligibility, like all information obtained in the NAWS, is self reported, the NAWS seeks to determine whether foreign-born respondents are authorized to work in the United States by asking a series of related questions that produces a picture of their eligibility status. The questions address the foreign-born worker’s current status (citizen, legal permanent resident, border crossing-card holder, applicant for residency, temporary visa holder, or unauthorized) and, when applicable, the date and program under which the individual applied for legal status. The responses to these questions are examined to determine whether the interviewee is eligible to work in the United States. Each foreign-born respondent is also directly asked if he/she has authorization to work in the United States.
In 2001-2002, 53 percent of the hired crop labor force lacked work authorization, down from 55 percent in 1999-2000. Another 25 percent of the crop workers in 2001-2002 were U.S. citizens, 21 percent were legal permanent residents, and one percent were employment-eligible on some other basis (e.g., the application for residency, via family sponsorship, was pending) (fig 1.4). Among citizens, 91 percent were born in the United States, and nine percent were naturalized.
Central America
Plac
e of
Birt
h

7
Citizen 25%
Legal permanent resident
21%
Other work authorized
1%
Unauthorized53%
Figure 1.4 U.S. Employment Eligibility.
Migrant Types The definition of “migrant” varies among the multitude of federal government agencies and programs that provide services to migrant and seasonal farm workers. In the NAWS, migrants are defined as persons who travel at least 75 miles during a 12-month period to obtain a farm job.5 Overall, migrants comprised 42 percent of crop workers in 20012002, an 11 percent decrease from 1993-1994 when they were 47 percent.
The migrant labor force demonstrates various migration patterns. Some migrants do no U.S. farm work at their home base, but travel 75 miles or more to do farm work in a single U.S. location and work only within a 75-mile radius of that location. In the NAWS, these workers are referred to as shuttle migrants. Workers who travel to multiple U.S. farm locations for work are called follow-the-crop migrants. Follow-the-crop migrants might or might not do U.S. farm work at their home base. These two migration patterns can be further divided between international and domestic migrants, depending on whether they crossed international borders in the 12-months prior to their NAWS interview.
5 An overnight stay is not required to be classified as a migrant.

8
International Migrants Among international migrants, foreign-born newcomers are an important group to consider: in 2001-2002 they made up 16 percent of all hired crop workers, 22 percent of the foreign-born, 38 percent of the migrants, and 72 percent of all workers who were in their first year of U.S. farm employment. At the time of the interview, these workers have often not demonstrated a migration pattern within the United States, therefore they are not classified in this report as shuttle or follow-the-crop migrants. However, they are referred to as migrants in the NAWS by virtue of their having traveled at least 75 miles in their journey to the United States. As discussed in the previous section, the share of foreign-born newcomers, among all hired crop workers, increased by 60 percent between the periods 1993-1994 and 2001-2002. Over the same periods, the share of foreign-born newcomers among migrants increased by 69 percent (table 1.1).
Other international migrants include shuttle and follow-the-crop (FTC) migrants. The share of international shuttle migrants was stable over the ten-year period: they were 13 percent of all workers and 29 percent of the migrants in 1993-1994, and 13 percent of all workers and 30 percent of the migrants in 2001-2002. The share of workers who were international follow-the-crop migrants, on the other hand, decreased substantially: they went from being five percent of all workers and ten percent of migrants in 1993-1994, to just two and five percent, respectively, in 2001-2002.
Domestic Migrants Domestic migrants also include shuttle and follow-the-crop migrants. Unlike international migrants, domestic migrants had not left the United States in the 12 months preceding their interview. Like international migrants, the overall and relative shares of domestic migrants changed between the periods 1993-1994 and 2001-2002. Domestic shuttle migrants comprised nine percent of all crop workers and 18 percent of migrants in the earlier period; their share decreased to six percent of all workers and 13 percent of the migrants in 2001-2002. The share of domestic follow-the-crop migrants also decreased between the two periods. They comprised nine percent of all workers and 20 percent of migrants in 1993-1994, but were six percent of all and 13 percent of migrants in 20012002.
Table 1.1 Change in Migrant Types: 1993-1994 and 2001-2002 Compared 1993-1994 2001-2002 Change in Percent of Percent of Percent of
Migrant Type All Migrants All Migrants Migrants Total 100% 100% 100% 100% -
Foreign-born newcomer 10% 23% 16% 38% + 69% International shuttle 13% 29% 13% 30% + 3% International FTC 5% 10% 2% 5% - 50% Domestic shuttle 9% 18% 6% 13% - 28% Domestic FTC 9% 20% 6% 14% - 30% Non Migrant 53% - 58% - -
Note: Sum of portions is not equal to 100 percent for all categories because of rounding.

9
Chapter 2: Demographics, Family Size, and Household Structure DEMOGRAPHIC CHARACTERISTICS OF U.S. CROP WORKERS: GENDER, AGE AND MARITAL STATUS; FAMILY SIZE; HOUSEHOLD STRUCTURE
Summary of Findings • Farm workers were young: their average age was 33, and half were younger than 31. • Seventy-nine percent were men. • Fifty-seven percent were living apart from all nuclear family members when they
were interviewed.
Perc
enta
ge o
f Cro
p W
orke
rs
Gender Seventy-nine percent of all crop workers, and 90 percent of the foreign-born newcomers,
6were men. Men were more likely than women to be unauthorized (56% vs. 39%) and were less likely than women to be U.S.-born (20% vs. 33%) (fig. 2.1).
60%
50%
40%
30%
20%
10%
0%
Unauthorized Legal Permanent Naturalized Citizen U.S.-born CitizenResident
24%
3%
56%
21%
2%
20%
39%
33%
Legal Status
Women Men
Figure 2.1 Legal Status by Gender. Note: Sum of portions is not equal to 100 percent because of rounding.
6 As discussed in Chapter 1, foreign-born newcomers are defined as persons who first came to the United States less than a year ago. They comprised 16 percent of the hired crop labor force in 2001-2002.

10
Perc
enta
ge o
f Cro
p W
orke
rs
Age U.S. crop workers are relatively young: in 2001-2002 the average age for both men and women was 33. Half of all workers were less than age 31, and a small percentage were younger than 18 (6%) or older than 54 (7%) (fig. 2.2).
35%
30%
25%
20%
15%
10%
5%
0%
14 - 17 18 - 19 20 - 24 25 - 34 35 - 44 45 - 54 55 - 64 65 +
6% 5%
30%
20%
12%
6%
1%
20%
Age Cohort
Figure 2.2 Age Distribution of Hired Crop Workers.
Age varied by legal status, place of birth and, among foreign-born workers, by the number of years since first arriving to the United States. In 2001-2002, unauthorized workers were, on average, ten years younger than authorized workers (28 and 38, respectively). Eighty percent of the unauthorized workers were less than 35, compared to only 40 percent of the authorized workers (fig. 2.3). Workers from Central American countries were, on average, younger than Mexico- and U.S.-born workers (28 vs. 32 and 36, respectively). Among U.S.-born workers, African Americans were the oldest (average age was 43), followed by Whites (36), and Hispanics (33). Among foreign-born workers, newcomers, were, on average, ten years younger than those who had arrived at least one year prior to being interviewed (24 vs. 34) (table 2.1).

11
Perc
enta
ge o
f Cro
p W
orke
rs
40%
35%
30%
25%
20%
15%
10%
5%
0%
4% 3%
10%
23%
9%
3%
8% 7%
37%
4% 3%
0%
29%
20%
28%
12%
14 - 17 18 - 19 20 - 24 25 - 34 35 - 44 45 - 54 55 - 64 65 +
Age Cohort
iAuthorized Unauthor zed
Figure 2.3 Age Distribution by Legal Status. Note: Sum of portions is not equal to 100 percent because of rounding.
Table 2.1 Average Age by Select Demographic Characteristics Percentage of
Group Average
Age Hired Crop Worker
Population
All Crop Workers 33 100% Foreign-born
All Foreign-born 32 77%
Authorized Foreign-born 40 24% Unauthorized Foreign-born 28 53%
Newcomers 24 16% Arrived more than year ago 34 61%
Born in Mexico 32 75% Born in Central American country 28 2%
U.S.-born All U.S.-born 36 23%
African American 43 4% White 36 12% Hispanic 33 7%

12
Marital Status and Family Type Nearly three out of five (58%) crop workers interviewed in 2001-2002 were married, a larger share than in 1993-1994 (52%). Thirty-eight percent had never been married and five percent were either separated, divorced, or widowed. Women were slightly more likely than men to be married (59% vs. 57%, respectively).
Fifty-one percent of all farm workers, married or single, were parents, compared to 41 percent in 1993-1994. A little more than a third (37%) were single and without children, 12 percent were married without children, and six percent were unmarried parents (fig. 2.4).
Married parent 45%
Unmarried parent 6%
Married, no children 12%
Single, no children37%
Figure 2.4 Family Type.
In 2001-2002, parents employed in U.S. crop agriculture had an average of two children. Ninety-six percent of the children were minors (under the age of 18). Nearly a third of the parents (31%) had one child (fig. 2.5).

13
20%
3% 2%
1%
0%
5%
10%
15%
20%
25%
30%
35%
31%
10%
33%
Perc
enta
ge o
f Far
m W
orke
r Par
ents
1 2 3 4 5 6 7 +
Number of Children
Figure 2.5 Number of Children of Hired Crop Farm Workers
Household Structure In the NAWS, crop workers who are living apart from all nuclear family members (parents, spouse, and children) at the time of the interview are defined as “unaccompanied”; those who are living with at least one nuclear family member are “accompanied.”7 In 2001-2002, 57 percent of all crop workers were unaccompanied. The majority of the unaccompanied (61%) were single workers who did not have children; 31 percent were parents and eight percent were married but without children.
Two-thirds (66%) of all parents and 71 percent of childless married workers were accompanied. Of the parents and married workers who were unaccompanied, almost nine out of ten (87%) had at least one child and/or a spouse living in Mexico; eight percent had nuclear family members in other parts of the United States, and four percent in other countries.
Living with nuclear family at the time of the interview varied by gender and legal status. Women were more than twice as likely (75%) as men (35%) to be accompanied. Among the parents, nearly all (97%) of the mothers were accompanied, compared to 55 percent of the fathers. Similarly, among childless married workers, 95 percent of the women and 62 percent of the men were living with their spouse at interview time. Several factors
7 Crop workers under the age of 18 who live with a sibling are “accompanied”.

14
may be related to these differences: female farm workers were more likely than males to be U.S.-born (33% vs. 20%), and non-migrant (71% vs. 55%). Parents who had authorization to work in the United States were twice as likely to be accompanied as parents who lacked authorization (86% vs. 43%, respectively).
In 2001-2002, farm worker parents had an average of two minor children. Sixty-one percent of the parents were living with all of their minor children when they were interviewed; 37 percent were living apart from all of their minor children, and two percent were living with some. The likelihood of parents living away from all of their minor children increased with family size: parents who had five or more minor children were 33 percent more likely to live away from all of their children than were parents who had only one minor child (44% vs. 33%, respectively) (fig. 2.6).
Perc
enta
ge o
f Par
ents
75%
70%
65%
60%
55%
50%
45%
40%
35%
30%
25%
1 2 3 4 5+
49%
63%
67%
44%45%
35%
55% 52%
43%
33%
Number of Children
i ll Minor Chil l Minor ChilParent Lives w th A dren Parent Lives Away from Al dren
Figure 2.6 Cohabitation of Farm Worker Parent and Minor Children.
Among parents, those most likely to be living apart from their minor children were men, migrants, Mexicans, and unauthorized workers. Among the migrant parents who were living away from all of their children, 85 percent were international migrants and 15 percent were domestic migrants (table 2.2).8
8 The designations “international” and “domestic” migrants convey the travel patterns of the parents, not the country where the children were living when their parents were interviewed.

15
Table 2.2 Migrant Types: Crop Workers Living Apart from their Children
Migrant Type Percent of Migrants
Total Migrants 100%
International 85% Newcomer 35%
Shuttle 43% Follow-the-crop 7%
Domestic 15% Shuttle 6% Follow-the-crop 9%

16

17
Chapter 3: Education, Literacy, and English Skills NATIVE LANGUAGE, EDUCATION LEVEL, AND ENGLISH SPEAKING AND READING ABILITY
Summary of Findings • Eighty-one percent of the workers reported that Spanish was their native language. • On average, the highest grade completed by crop workers was seventh grade. • Forty-four percent self-reported that they could not speak English “at all”; 53 percent
could not read English “at all.”
Native Language Spanish9 was the predominant native language of crop workers (81%), followed by English (18%). Two percent reported other languages such as Creole, Mixteco, and Kanjobal (fig.3.1). Twenty-two percent of the mainland U.S.-born crop workers also reported that their native language was Spanish.
Other, 2%
English, 18%
Spanish, 81%
Figure 3.1 Native Language. Note: Sum of portions is not equal to 100 percent because of rounding.
9 The NAWS contractor has observed that it is not uncommon for Native Americans from Mexico and Central American countries to report Spanish as their primary language, even when the first language these same workers spoke as a child was an indigenous one and they are currently somewhat limited in Spanish.

18
Education A large share of crop workers reported having completed relatively few years of formal education. Among all workers in 2001-2002, the mean highest grade completed was
Perc
enta
ge o
f Cro
ps W
orke
rs
seventh and the median was sixth. Four percent reported having never attended school and thirteen percent had completed grade three or less. Sixty-six percent had completed between grades four to eleven, 13 percent had completed the twelfth grade, and just five percent had completed some education beyond high school.
Nearly all workers (97%) completed their highest grade in their country of origin: 72 percent completed their highest grade in Mexico, 26 percent in the United States, two percent in Central American countries, and less than one percent from all other countries. The highest grade completed varied by place of birth: on average, U.S.-born workers had completed the eleventh grade and foreign-born workers had completed the sixth. While 56 percent of the U.S.-born had completed the twelfth grade, only six percent of the foreign-born had done so (fig. 3.2).
50%
45%
40%
35%
30%
25%
20%
15%
10%
5%
0%
4%
28%
13%
5%
0% 2%
8%
40%
5%
16%
27%
5%
1%
38%
33%
13%
16%
47%
0 1 - 3 4 - 7 8 - 11 12 13 +
Highest Grade Completed
iAll Workers U.S.-born Fore gn-born
Figure 3.2 Highest Grade Completed by Place of Birth. Note: Sum of portions may not equal 100 percent because of rounding.
Over time, the education level of foreign-born newcomers entering the hired farm workforce has increased. While six percent of the foreign-born newcomers in 1993-1994 reported never having attended school, only half as many (3%) so reported in 2001-2002. Conversely, the share of the foreign-born newcomers who had completed eight to eleven years of school, rose from 23 percent in 1993-1994 to 37 percent in 2001-2002. On the

19
other hand, compared to 1993-1994, a smaller share of the new foreign-born workers in 2001-2002 had completed the twelfth grade (fig. 3.3).
Perc
enta
ge o
f New
com
ers
60%
50%
40%
30%
20%
10%
0% 0 1 - 3 4 - 7 8 - 11 12 13 +
6%
14%
49%
7%
1% 3%
9%
46%
37%
3% 1%
23%
Highest Grade Completed
1993-1994 2001-2002
Figure 3.3 Highest Grade Completed by Foreign-born Newcomers.
Adult Education Twenty percent of all crop workers reported that they had taken at least one kind of adult education class in the United States in their lifetime. The most popular of these were English (10%) and high school equivalency (GED) classes (5%). Smaller shares reported having taken job training or citizenship classes (2 percent each) (fig. 3.4).

20
Type
of C
lass
Any Adult Education 20%
English 10%
GED 5%
College or University 3%
2%Citizenship
2%Job Training
1%Other
0% 5% 10% 15% 20% 25%
Percentage of Crop Workers
Figure 3.4 Participation in Adult Education.
Crop workers with the most initial education were most likely to attend adult education classes. Much greater proportions of workers who had completed between the eighth and eleventh grade (23%) or the twelfth grade (31%) had taken a class than those who had completed between grades one to three (8%) or four to seven (14%) (fig. 3.5). Authorized workers were three times as likely to have taken some type of adult education (32%) as unauthorized workers (10%).

21
Perc
enta
ge o
f Cro
p W
orke
rs
35%
30%
25%
20%
15%
10%
5%
0% 0 1 - 3 4 - 7 8 - 11 12
7%
31%
23%
8%
14%
Highest Grade Completed
Figure 3.5 Adult Education by Highest Grade Completed.
English Language Skills NAWS respondents are asked, “How well do you speak English?” and “How well do you read English?” Among all crop workers interviewed in 2001-2002, 44 percent responded that they could not speak English “at all,” 26 percent said that they could speak it “a little,” six percent said “some,” and only 24 percent said that they spoke English “well.” The responses were similar regarding the ability to read English: 53 percent could not read it “at all,” 20 percent could read English “a little,” six percent could read “some,” and only 22 percent said that they could read English “well.”10
The ability to speak and read English varied by place of birth and ethnicity. Nearly all (98%) of the US-born, non-Hispanic workers said that they spoke English “well,” and nearly as many (93%) responded that they read English “well.” Among US-born Hispanics, only two-thirds responded that they could speak and read English “well” (66% to both questions). Workers born in Mexico and other foreign-born Hispanics were at the other extreme of the English language ability spectrum, with the majority of both groups responding that they could not speak or read English “at all” (table 3.1).
10 Respondents’ self-reports of English proficiency could be higher or lower than their actual proficiency.

22
Table 3.1 English Speaking and Reading Ability, by Place of Birth and Ethnicity
U.S.-born U.S.-born Other Foreign-born non- Hispanic Hispanic Mexico-born Hispanic Speak Read Speak Read Speak Read Speak Read
Not at all 0% 1% 2% 5% 57% 68% 54% 66% A little 0% 1% 16% 15% 32% 24% 40% 26% Some 1% 5% 16% 14% 6% 5% 4% 4% Well 98% 93% 66% 66% 4% 3% 3% 3%

23
Chapter 4: Labor Force Participation HOW U.S. CROP WORKERS SPENT THEIR TIME OVER THE YEAR AND HOW LONG THEY EXPECT TO REMAIN IN FARM JOBS
Summary of Findings • Seventy-two percent of the workers had one farm employer in the previous 12
months. • The number of farm workdays in the previous year increased with the number of U.S.
farm employers and by years of U.S. farm experience. • The majority of the workers (72%) said that they expected to continue doing farm
work for at least five years.
Number of U.S. Farm Employers in Previous 12 Months NAWS interviewers record each respondent’s work and non-work periods for the 12 months preceding their interview. In 2001-2002, nine out of ten of all crop workers, including foreign-born newcomers, reported having worked for one or two U.S. farm employers11 in the previous 12 months (fig 4.1).
2 Farm employers 18%
3 Farm employers 6%
4 Farm employers 2%
5+ Farm employers 1%
1 Farm employer72%
Figure 4.1 Number of U.S. Farm Employers in the Previous 12 Months. Note: Sum of portions is not equal to 100 percent because of rounding.
An employer can be either a farm owner or a farm labor contractor. While a worker employed by a farm labor contractor may work on more than one farm in a year, their labor contractor is counted as one employer.
11

24
Measuring Labor Force Participation Common employment statistics include the average number of weeks and average number of days persons in the labor force were employed over a one-year period. When measuring such statistics on the hired crop work force, it is important to recognize the relatively large share of crop workers (16%) who were both new to U.S. farm work and new to the United States. These are the foreign-born newcomers who were first discussed in Chapter 1. As these workers can be interviewed just days after their first arrival to the United States, as a group they report fewer days of farm work compared to all other workers: in 2001-2002 foreign-born newcomers averaged 90 days of farm work, compared to 190 days for other workers. Conversely, foreign-born newcomers spent an average of 32 weeks outside of the United States, compared to four weeks for all other workers. Because of the recency of their arrival in the United States, foreign-born newcomers are excluded from the base of statistics reported in this section.
Time Employed and Not Employed Crop workers were employed on U.S. farms in 2001-2002 an average of 34 and one half weeks (66% of the year) and in non-farm activities for a little more than five weeks (10 percent of the year). They were in the United States but not working for approximately eight and a half weeks (16% of the year), and were outside of the United States for nearly four weeks (7% of the year) (fig. 4.2).
Outs
Farm work, 66%
Non-farm work, 10%
In the United States, not working, 16%
ide of the United States, 7%
Figure 4.2 Time Employed and Not Employed. (Excluding foreign-born newcomers) Note: Sum of portions is not equal to 100 percent because of rounding.

25
Time in farm and non-farm jobs, as well as time outside the United States, varied by legal status, place of birth and age.12 U.S. citizens were employed 32 weeks in farm jobs, eight weeks in non-farm jobs, were not employed for 12 weeks, and spent less than one week outside of the country. Compared to citizens, legal permanent residents were employed more weeks in agriculture (35), but only half as many weeks in non-farm employment (4). Legal permanent residents were not working for nine weeks while in the United States and spent four weeks outside of the country. Unauthorized workers (excluding foreign-born newcomers) obtained the most weeks of farm employment (36) 13 and, like legal permanent residents, had four weeks of non-farm employment.14 These unauthorized workers were not employed for six weeks while in the United States and spent the same number of weeks outside of the country (table. 4.1).
Table 4.1 Weeks of Activity by Legal Status (excluding foreign-born newcomers)
Unauthorized Legal permanent resident Citizen Activity Farm work 36 35 32 Non-farm work 4 4 8 In U.S. not working 6 9 12 Outside U.S. 6 4 0
Excluding foreign-born newcomers, 70 percent of the workers were born in Mexico, 27 percent in the United States, two percent in Central American countries, and one percent of the workers were from other countries. Of these groups, workers from Central America were employed the most weeks in U.S. farm jobs. Averaging 40 weeks, they worked four more weeks than the Mexico-born workers, who averaged 36, and nine more than the U.S.-born, who averaged 31. Workers from Central America experienced the fewest weeks not working while in the United States (five vs. seven and 12 for the Mexico- and U.S.-born, respectively) and were also outside of the United States for fewer weeks than the Mexico-born (two vs. five, respectively).
The youngest and oldest NAWS respondents were employed the fewest weeks in farm jobs and also experienced the most weeks not working while in the United States. Fourteen to 17 year-old respondents averaged just 14 weeks of farm work and did not work for fully half the year (27 weeks). This same group, however, averaged nearly six and a half weeks in non-farm jobs. The next age cohort (18- and 19-year-olds) worked 29 weeks in farm jobs, six in non-farm jobs, was in the United States but not working for 14 weeks, and spent less than one week outside of the country.
12 All weeks reported in this section are the average number of weeks in the preceding 12-month period. 13 Sixty-nine percent of all unauthorized workers first came to the United States more than one year prior to the interview. 14 Unauthorized workers were also more likely than authorized workers to have had more than one farmemployer in the previous year (40% vs. 20%, respectively).
26
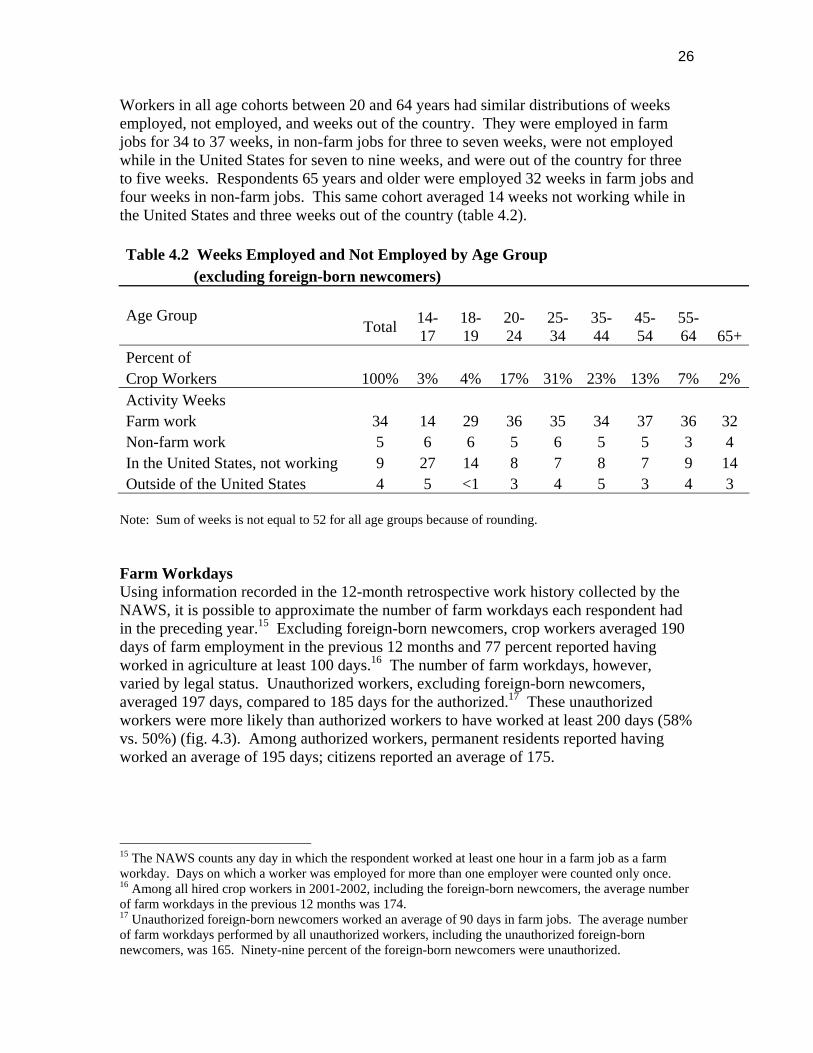
Workers in all age cohorts between 20 and 64 years had similar distributions of weeks employed, not employed, and weeks out of the country. They were employed in farm jobs for 34 to 37 weeks, in non-farm jobs for three to seven weeks, were not employed while in the United States for seven to nine weeks, and were out of the country for three to five weeks. Respondents 65 years and older were employed 32 weeks in farm jobs and four weeks in non-farm jobs. This same cohort averaged 14 weeks not working while in the United States and three weeks out of the country (table 4.2).
Table 4.2 Weeks Employed and Not Employed by Age Group (excluding foreign-born newcomers)
Age Group Total 14
17 1819
2024
2534
3544
4554
5564 65+
Percent of Crop Workers 100% 3% 4% 17% 31% 23% 13% 7% 2% Activity Weeks Farm work 34 14 29 36 35 34 37 36 32 Non-farm work 5 6 6 5 6 5 5 3 4 In the United States, not working 9 27 14 8 7 8 7 9 14 Outside of the United States 4 5 <1 3 4 5 3 4 3
Note: Sum of weeks is not equal to 52 for all age groups because of rounding.
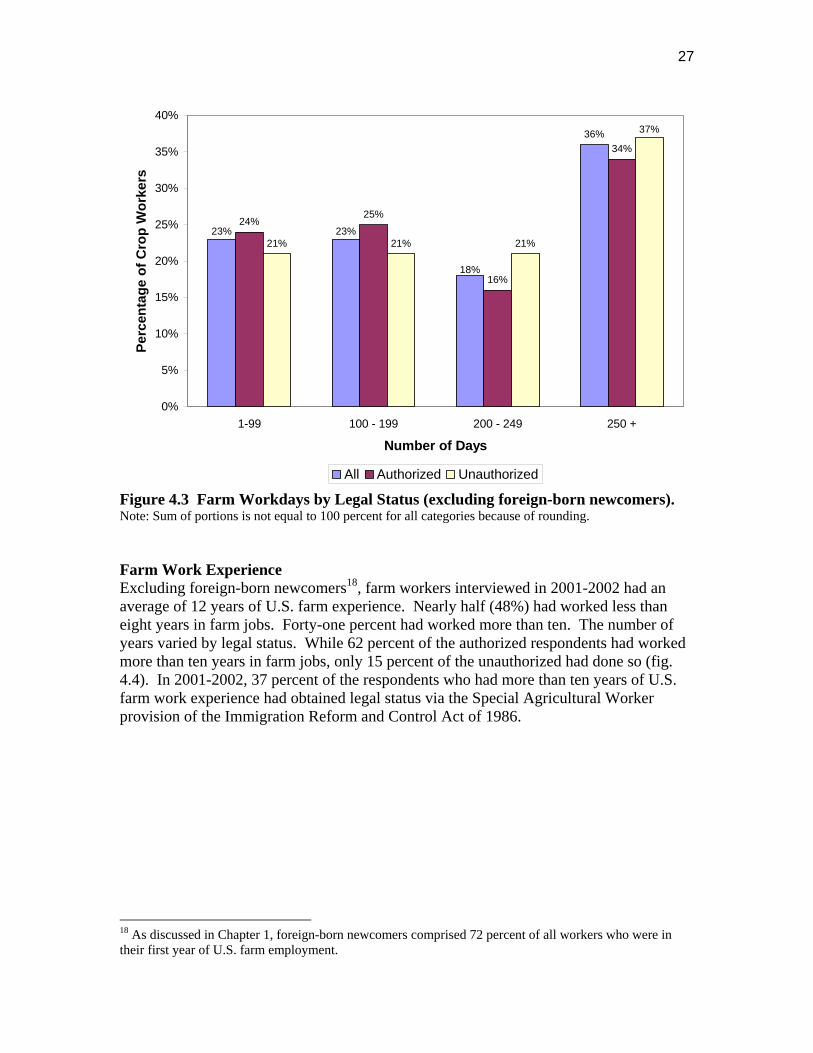
Farm Workdays Using information recorded in the 12-month retrospective work history collected by the NAWS, it is possible to approximate the number of farm workdays each respondent had in the preceding year.15 Excluding foreign-born newcomers, crop workers averaged 190 days of farm employment in the previous 12 months and 77 percent reported having worked in agriculture at least 100 days.16 The number of farm workdays, however, varied by legal status. Unauthorized workers, excluding foreign-born newcomers, averaged 197 days, compared to 185 days for the authorized.17 These unauthorized workers were more likely than authorized workers to have worked at least 200 days (58% vs. 50%) (fig. 4.3). Among authorized workers, permanent residents reported having worked an average of 195 days; citizens reported an average of 175.
15 The NAWS counts any day in which the respondent worked at least one hour in a farm job as a farm workday. Days on which a worker was employed for more than one employer were counted only once. 16 Among all hired crop workers in 2001-2002, including the foreign-born newcomers, the average number of farm workdays in the previous 12 months was 174. 17 Unauthorized foreign-born newcomers worked an average of 90 days in farm jobs. The average number of farm workdays performed by all unauthorized workers, including the unauthorized foreign-born newcomers, was 165. Ninety-nine percent of the foreign-born newcomers were unauthorized.
27
40%
Perc
enta
ge o
f Cro
p W
orke
rs
35%
30%
25%
20%
15%
10%
5%
0%
36%
16%
23% 23%
18%
37%
24% 25%
34%
21% 21% 21%
1-99 100 - 199 200 - 249 250 +
Number of Days
All Authorized Unauthorized
Figure 4.3 Farm Workdays by Legal Status (excluding foreign-born newcomers). Note: Sum of portions is not equal to 100 percent for all categories because of rounding.
Farm Work Experience Excluding foreign-born newcomers18, farm workers interviewed in 2001-2002 had an average of 12 years of U.S. farm experience. Nearly half (48%) had worked less than eight years in farm jobs. Forty-one percent had worked more than ten. The number of years varied by legal status. While 62 percent of the authorized respondents had worked more than ten years in farm jobs, only 15 percent of the unauthorized had done so (fig. 4.4). In 2001-2002, 37 percent of the respondents who had more than ten years of U.S. farm work experience had obtained legal status via the Special Agricultural Worker provision of the Immigration Reform and Control Act of 1986.
18 As discussed in Chapter 1, foreign-born newcomers comprised 72 percent of all workers who were in their first year of U.S. farm employment.

28
40% Pe
rcen
tage
of C
rop
Wor
kers
35%
30%
25%
20%
15%
10%
5%
0%
8%
26%
18%
7%
14%
18%
32% 30%
12%
3%
38%
24% 23%
10%
37%
0 - 1 2 - 4 5 - 10 11 - 20 21 +
Number of Years
All Authorized Unauthorized
Figure 4.4 Farm Work Experience by Legal Status (excluding foreign-born newcomers). Note: Sum of portions is not equal to 100 percent for all categories because of rounding.
Farm workdays also increased with the number of employers and years of experience. Again excluding the foreign-born newcomers, workers who had one employer averaged 183 days, while workers with two employers averaged 200 days and those with three or more employers averaged 215. Respondents who had less than two years of farm work experience (8%) averaged 68 days in farm jobs in the previous 12 months. Workers with 21 years or more of experience (18%), on the other hand, averaged 219 days (table 4.3).

29
Table 4.3 Farm Workdays by Number of U.S. Farm Employers and Years of U.S. Farm Experience (excluding foreign-born newcomers)
Percent of Mean Crop Workers Farm Workdays
Number of U.S. Farm Employers 100% ( ) 1 71% 183 2 18% 200 3 + 11% 215
Years of U.S. Farm Work Reported 100% ( ) less than two years 8% 68 2 - 4 24% 175 5 - 10 26% 202 11 - 20 23% 212 21 + 18% 219
Note: Sum of portions does not equal 100 percent because of rounding.
Plans to Remain in Farm Work The majority of all crop workers19 (72%) expect to remain in farm jobs more than five years.20 Four percent stated that they would continue working in agriculture for less than one year; 12 percent said for two to three more years; five percent stated that they would continue in agriculture four to five years; and seven percent were unsure. Future plans and expectations varied by legal status. A larger share of citizens (21%) expected to leave farm work within three years, compared to permanent residents (9%) and unauthorized workers (16%). Seventy-nine percent of the permanent residents stated that they would continue working in agriculture as long as they were able, compared to 64 percent of the unauthorized and 57 percent of the citizens.
When asked if they believed they could obtain a non-farm job within one month, 42 percent said “no,” 37 percent said “yes,” and seven percent were unsure. Citizens (69%) were twice as likely as permanent residents (32%) and nearly three times as likely as unauthorized workers (23%) to believe that they could obtain a non-farm job within a month.
19 Foreign-born newcomers are included in this section. 20 Ninety-one percent of those who said more than five years qualified their response by also conveying that they would continue working in agriculture as long as they were able to do the work.

30
31
Chapter 5: Farm Job Characteristics EMPLOYER TYPE; CROPS AND TASKS; RECRUITMENT AND RETENTION; HOURS AND WAGES; BENEFITS
Summary of Findings
• The share of workers employed by a farm labor contractor increased by 50 percent between the periods 1993-1994 and 2001-2002.
• Wages increased in both nominal and real terms over the period 1993-2002. • Twenty-three percent of farm workers reported having some type of health insurance;
it was an employment benefit for between eight and 12 percent of the workers.
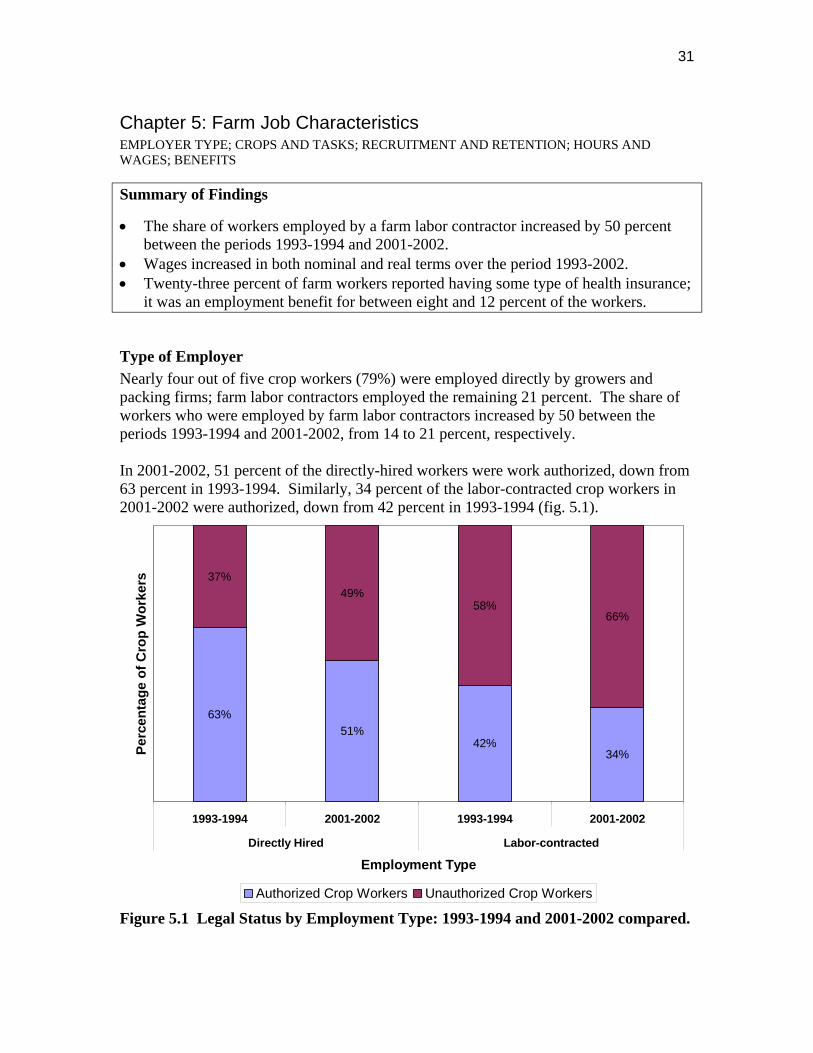
Type of Employer Nearly four out of five crop workers (79%) were employed directly by growers and packing firms; farm labor contractors employed the remaining 21 percent. The share of workers who were employed by farm labor contractors increased by 50 between the periods 1993-1994 and 2001-2002, from 14 to 21 percent, respectively.
In 2001-2002, 51 percent of the directly-hired workers were work authorized, down from 63 percent in 1993-1994. Similarly, 34 percent of the labor-contracted crop workers in 2001-2002 were authorized, down from 42 percent in 1993-1994 (fig. 5.1).
63% 51%
42% 34%
37% 49%
58% 66%
1993-1994 2001-20021993-1994 2001-2002
Directly Hired Labor-contracted
Perc
enta
ge o
f Cro
p W
orke
rs
Employment Type
i iAuthor zed Crop Workers Unauthor zed Crop Workers
Figure 5.1 Legal Status by Employment Type: 1993-1994 and 2001-2002 compared.

32
Crop and Task of Farm Jobs At the time of the interview, 33 percent of all crop workers held jobs in fruit and nut crops. Thirty-one percent worked in vegetable crops, 18 percent in horticultural crops, 13 percent in field crops, and four percent reported working in an unclassified or ‘miscellaneous’ crop (table 5.1).
Table 5.1 Primary Crop at Current Farm Job Primary Percentage of
Crop Type Hired Crop Workers
Total 100% Fruit & nut 34% Vegetable 31% Horticultural 18% Field 14% Miscellaneous 4%
Note: Sum of portions is not equal to 100 percent because of rounding.
Workers engaged in fruit & nut, and vegetable crops were more likely than workers involved with other crops to be employed by farm labor contractors (table 5.2).
Table 5.2 Primary Crop by Employment Type
Primary Employment Type Directly- Labor-
Crop Type Total hired contracted
Fruit & nut 100% 62% 38% Vegetable 100% 78% 22% Horticultural 100% 99% 2% Field 100% 92% 8% Miscellaneous 100% 97% 3%
Note: Sum of portions may not be equal to 100 percent because of rounding.
Taking a crop from field to market encompasses a wide variety of tasks that hired crop workers perform. In 2001-2002, at the time of their interview, 16 percent of the workers were performing pre-harvest tasks, such as hoeing, thinning, and transplanting, 30

33
percent were doing harvest tasks, and nine percent were involved in post-harvest activities, such as field packing, sorting, and grading. Seventeen percent of the crop workers were performing technical production tasks, such as pruning, irrigating, and operating machinery21 (table 5.3).
Table 5.3 Primary Task at Current Farm Job Percentage of
Primary Task Type Hired Crop Workers
100% 16% 30% 9% 17% 27%
Total Pre-harvest Harvest Post-harvest Technical Production Other
Note: Sum of portions is not equal to 100 percent because of rounding.
Workers performing pre-harvest, harvest, and technical-production tasks were more likely than those performing post-harvest and ‘other’ tasks to be employed by a labor contractor (table 5.4).22
Table 5.4 Primary Task by Employment Type
Primary Employment Type Directly- Labor-
Task Type Total hired contracted
Pre-harvest 100% 72% 28% Harvest 100% 70% 30% Post-harvest 100% 94% 6% Technical Production 100% 70% 30% Other 100% 94% 6%
21 Twenty-seven percent of the workers performed a task that was classified as ‘other’. Over half of the respondents (54%) who were performing an ‘other’ task at the time of the interview were employed in a horticultural crop, e.g., in a greenhouse, and it is likely that many of the tasks could be classified as technical production. Tasks are being reviewed to determine how best to categorize them. 22 Previous summaries of NAWS findings reported the share of workers who performed supervisory tasks. While such workers continue to qualify to participate in the survey if they also work directly with crops, they comprised less than one percent of all workers interviewed in fiscal years 2001-2002 and are therefore not reported here.
34
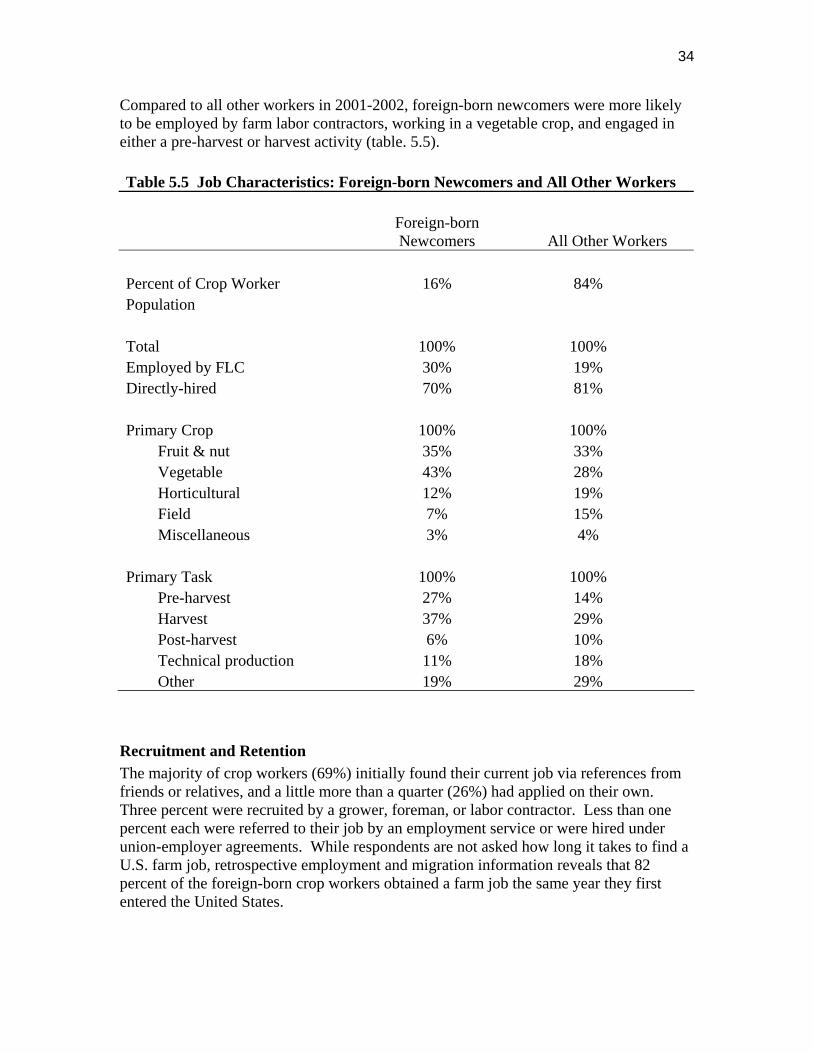
Compared to all other workers in 2001-2002, foreign-born newcomers were more likely to be employed by farm labor contractors, working in a vegetable crop, and engaged in either a pre-harvest or harvest activity (table. 5.5).
Table 5.5 Job Characteristics: Foreign-born Newcomers and All Other Workers
Foreign-born Newcomers All Other Workers
Percent of Crop Worker 16% 84% Population
Total 100% 100% Employed by FLC 30% 19% Directly-hired 70% 81%
Primary Crop 100% 100% Fruit & nut 35% 33% Vegetable 43% 28% Horticultural 12% 19% Field 7% 15% Miscellaneous 3% 4%
Primary Task 100% 100% Pre-harvest 27% 14% Harvest 37% 29% Post-harvest 6% 10% Technical production 11% 18% Other 19% 29%
Recruitment and Retention The majority of crop workers (69%) initially found their current job via references from friends or relatives, and a little more than a quarter (26%) had applied on their own. Three percent were recruited by a grower, foreman, or labor contractor. Less than one percent each were referred to their job by an employment service or were hired under union-employer agreements. While respondents are not asked how long it takes to find a U.S. farm job, retrospective employment and migration information reveals that 82 percent of the foreign-born crop workers obtained a farm job the same year they first entered the United States.

35
In 2001-2002, crop workers, including foreign-born newcomers, had been employed with their current farm employer an average of nearly four and a half years. Thirty-five percent had been working for their current employer for one year or less, and 13 percent
Perc
enta
ge o
f Cro
p W
orke
rs
had been employed at their current farm job for ten or more years (fig. 5.2).23
40%
35%
30%
25%
20%
15%
10%
5%
0% One or less 2 - 3 4 - 5 6 - 7 8 - 9 10 +
7%
4%
13% 13%
28%
35%
Years Working for Current Farm Employer
Figure 5.2 Number of Years Working for Current Farm Employer.
The majority of workers (60%) said that their current job was seasonal; 25 percent said they worked year-round with their current employer and 15 percent were unsure . Among those who had been with their current employer for one year or less, 42 percent did not know if their farm job would be year-round or seasonal. Workers employed by farm labor contractors were more likely (72%) than those hired directly by growers and packing houses (57%) to say that their current job was seasonal. Although the likelihood of working year-round increased as the number of years with the current employer increased, nearly half (45%) of those who had worked at least ten years for their current employer reported being employed seasonally (fig. 5.3).
23 Any employment in the year qualifies as one year.

36
80%
Perc
enta
ge o
f Cro
p W
orke
rs
70%
60%
50%
40%
30%
20%
10%
0%
47%
75% 74% 74%
67% 69%
65%
45%
23% 25%
35%
75%
55%
49%
11%
26% 26%
33% 31%
51%
1 2 3 4 5 6 7 8 9 10+
Years with Current Farm Employer
Seasonal Year-round
Figure 5.3 Seasonality of Employment by Years with Current Farm Employer.
Among those who knew that their current job was seasonal, slightly more than two-thirds (68%) said that their employer notifies them when work is to resume. Notification methods included being personally contacted by a foreman or other agent (35%), telephoning (24%), being verbally advised by the employer at the end of the season (14%), receiving written correspondence (1%), and by other methods (3%).24
Hours Worked and Basis for Pay NAWS respondents are asked how many hours they worked in the previous week at their current farm job. In 2001-2002, the average was 42 hours, compared to 38 in 1993-1994. In 2001-2002, approximately one quarter each worked less than 35 hours, between 35 and 40, 41 and 49, and 50 hours or more.
Agricultural employers’ labor needs vary by season, crop and task, and workers are sometimes needed for longer than normal hours over short periods of time. NAWS data reflect the fluctuating nature of labor use. For example, workers performing skilled production tasks in field crops, such as preparing fields for cultivation, and irrigating, averaged 53 hours per week. Workers harvesting fruit and nut crops, on the other hand, averaged 40 hours per week. Hours worked also varied by payment type. Overall,
Workers who said that they were informed about work with their current employer via ‘other’ methods included those who responded to a newspaper advertisement, lived at the work site, and those, who by custom, knew when it was time to report back to work.
24

37
workers paid an hourly wage averaged 43 hours per week, while workers paid by the piece averaged 36.25
Average hours worked in the previous week also varied by age, gender, and U.S. farm work experience. Not surprisingly, respondents ages 14 to 17 worked the fewest hours per week, averaging 36, compared to 43 for all other workers. Workers ages 45 to 54 averaged the most, at 45 hours. Males averaged 43 hours per week, compared to 39 for females. Respondents with more than 12 years of U.S. farm work experience averaged 46 hours, compared to 40 hours for those with less than four years, and 43 for those with between five and 12 years.
Seventy-nine percent of the workers reported being paid by the hour, 16 percent by the piece, three percent by a combination of hourly and piece rate pay, and two percent by salary. How workers were paid varied by crop and task. Overall, nearly a third (32%) of the workers who were employed in fruit and nut crops were paid a piece rate, compared to eight percent for workers employed in all other crops (field, vegetable, horticulture, and miscellaneous) (table 5.6). Likewise, while 43 percent of those who performed harvesting tasks were paid by the piece, only five percent of the workers who performed all other tasks (pre-harvest, post-harvest, technical production, and ‘other’) so reported (table 5.7).
Thirty-two percent of the labor-contracted workers were paid by the piece, compared to 12 percent of the directly hired workers. This difference, however, might be largely attributed to the crops and tasks performed by labor-contracted workers at the time of the interview: 61 percent were working in fruit and nut crops; 44 percent were doing harvest tasks. When performing the same task on the same type of crop, basis for pay did not differ between directly hired and labor-contracted workers: 56 percent of those who harvested fruit and nut crops while employed by a labor contractor were paid by the piece, compared to 59 percent of the respondents who did the same work but who were directly hired.
These differences persist when controlling for crop and task categories. For example, workers who harvested fruit and nut crops and who were paid an hourly wage averaged 46 hours per week, compared to 35 hours for workers who did the same work but were paid by the piece.
25

38
Table 5.6 Basis for Pay by Crop Type Basis for Pay
Primary Crop Total Hourly Piece rate Combination Salary
Fruit & nut 100% 61% Vegetable 100% 83% Horticulture 100% 97% Field 100% 83% Miscellaneous 100% 99%
32% 5% 1% 13% 2% 2% 1% 0% 2% 7% 2% 8% 0% 1% 0%
Note: Sum of portions is not equal to 100 percent for all crops because of rounding.
Table 5.7 Basis for Pay by Task Type Basis for Pay
Primary Task Total Hourly Piece rate Combination Salary
Pre-harvest 100% 96% Harvest 100% 49% Post-harvest 100% 96% Technical Production 100% 84% Other 100% 94%
3% 0% 1% 43% 8% 1% 2% 1% 0% 13% 0% 4% 0% 0% 6%
Note: Sum of portions is not equal to 100 percent for all tasks because of rounding.
Wages Farm workers were paid an average of $7.25 an hour in fiscal years 2001-2002, compared to $5.52 in 1993-1994.26 Nineteen percent were paid less than $6 per hour; 27 percent were paid between $6 and $6.74; 29 percent were paid between $6.75 and $7.99; and 25 percent were paid $8 per hour or more.
Wages varied by type of pay, i.e., by the hour or piece rate, whether employed seasonally or year-round, years with current employer, and task (table. 5.8). When paid a straight hourly wage, workers earned an average of $6.84 per hour; when paid strictly by the piece, they averaged $8.27 per hour. Year-round workers averaged nearly a dollar more per hour than seasonal workers. Among all workers, those who had worked at least six
26 To construct an average hourly wage, piece rate and combination wages were converted to an hourly basis and then averaged with the wages of workers who were paid by the hour.

39
years with their current employer averaged $8.05 per hour, compared to $6.76 for those who had been with their employer for one year or less. By task, respondents whose work was classified as ‘other’ earned the highest average wage ($7.56). Workers who performed harvest and technical production tasks had similar average hourly earnings ($7.47 and $7.40, respectively). The relatively high average wage earned by harvest workers reflects piece rate wages. When paid strictly by the piece, harvest workers averaged $8.10 per hour.
Table 5.8 Average Hourly Earnings
Category Earnings Overall $7.25
By the hour $6.84 By the piece (converted to hourly) $8.27
By Seasonality Seasonal $6.96 Year-round $7.87
By Years with Employer up to 1 $6.76 2 to 3 $7.14 4 to 5 $7.38 6 + $8.05
By Task Pre-harvest $6.54 Harvest $7.47 Post-harvest $6.59 Technical production $7.40 Other $7.56
Average hourly earnings increased by 25 percent in nominal dollars and by nine percent in inflation-adjusted (real) dollars over the ten-year period (single calendar years) 19932002 (table 5.9).27 The increases, however, were not steady. Real hourly earnings declined between 1993 and 1996, and fell again slightly between 2000 and 2001 (fig. 5.4).
27 Average hourly wages in all other sections of the report are based on fiscal years 2001-2002: October 1, 2000 - September 30, 2002.

40
Table 5.9 Average Hourly Wages of Crop Workers, Nominal and Real (2002) Dollars, Calendar Years 1993-2002
Nominal Real* Year Wage 2002 Dollars 1993 $5.46 $6.69 1994 5.54 6.65 1995 5.72 6.70 1996 5.69 6.49 1997 5.81 6.49 1998 6.40 7.05 1999 6.54 7.06 2000 7.00 7.31 2001 7.11 7.22
2002** 7.30 7.30 * Real dollars are based on the CPI-U-RS deflator, http://www.bls.gov/cpi/cpiurstx.htm ** The average hourly wage for 2002 is based on data from January to September.
Ave
rage
Wag
e
7.50
7.00
6.50
6.00
5.50
5.00 1993 1994 1995 1996 1997 1998 1999 2000 2001 2002
Year
inalNom Real
Figure 5.4 Crop Workers’ Average Hourly Wages, Nominal and Real (2002 Dollars), Calendar Years 1993-2002.

41
Monetary Bonuses and Insurance Benefits Twenty-two percent of crop workers said that their current farm employer gave a cash bonus as part of the compensation package; 65 percent said the employer did not, and 13 percent did not know.28 Of the 22 percent who said that a bonus was given, 51 percent identified it as a holiday bonus, 32 percent as an end-of-season payment, 12 percent as an incentive award, five percent as a bonus contingent on employer profits, and one percent as a transportation stipend.29
Receiving a monetary bonus varied by seasonality of employment and employer type. Among year-round workers, 47 percent said that bonuses were given, compared to 14 percent of those who were employed seasonally. Workers who were directly hired by growers or packing houses were more likely (27%) than those who were employed by farm labor contractors (2%) to say that bonuses were given.
Although the majority of NAWS respondents are selected while working for employers with tax payment records in the unemployment insurance (UI) system database, only 39 percent of the workers interviewed in fiscal years 2001-2002 said they would receive UI benefits should they lose their job. Fifty-four percent reported that they would not receive benefits should they lose their job and eight percent did not know.30 Of the 54 percent who reported that they would not receive UI benefits, 87 percent were unauthorized and would not qualify for the benefit even if the employer paid into the system. Workers who were employment eligible were much more likely (76%) than those who were not (4%) to report that they would receive UI benefits should they lose their job.
A larger share of workers (48%) reported that they would be covered by workers’ compensation for a work-related illness or injury; 20 percent said they would not be covered, and 31 percent did not know.31 Unauthorized workers were half as likely (33%) as authorized workers (65%) to report being covered and were twice as likely (41%) as authorized workers (20%) not to know if they were covered.
In the NAWS, crop workers are asked several questions about health insurance and their responses indicate that 1) twenty-three percent were covered by some type of health
28 Among those who did not know, 93 percent had been with their present employer for less than one year. 29 Multiple responses were permitted. Five percent identified an ‘other’ type of bonus. 30 Unemployment insurance coverage varies by state. In the majority of states, employers of agricultural labor are required to pay unemployment insurance taxes if they have ten or more workers (on at least one day in each of 20 different weeks in the current or immediately preceding calendar year), or exceed a minimum payroll size ($20,000 in the current or preceding calendar quarter) http://workforcesecurity.doleta.gov/unemploy/comparison2002.asp Agricultural workers are concentrated on farms with more than 10 workers. (U.S. Department of Labor Report to Congress. The Agricultural Labor Market–Status and Recommendations. December 2000.) 31 Agricultural workers are covered by workers’ compensation in varying degrees in 40 jurisdictions. In 14, they are covered the same as all other employees. Twenty-six jurisdictions carry limitations that are not applicable to other covered employees, and 13 jurisdictions allow agricultural employers to secure coverage for their workers voluntarily. http://www.dol.gov/esa/regs/statutes/owcp/stwclaw/tables-pdf/table-3.pdf

42
insurance in 2001-2002, and 2) the insurance was an employment benefit for between eight and 12 percent of the workers.32
Near the beginning of the interview, the respondent is asked if he/she has health insurance and, if so, who pays for it.33 In 2001-2002, 23 percent reported that they were insured. Among these insured crop workers, the largest share (46%) said that their current farm employer paid for it; 19 percent said the government provided it; 15 percent reported that either they or their spouse paid for all of the insurance; 12 percent said they were covered under their spouse’s employer’s plan; and seven percent identified an “other” coverage source.34
Later in the interview, respondents are asked if their current farm employer provides insurance or pays for medical treatment for a non work-related illness or injury, regardless of whether or not the worker accepts or uses the insurance or assistance. In 2001-2002, eight percent reported that their employer offered such a benefit; 77 percent said their employer did not offer it, and 15 percent did not know.
Year-round workers were more likely than seasonal workers to have reported being covered by unemployment insurance and workers’ compensation, and to say that their current farm employer either offered or provided health insurance or assistance for a non-work related illness or injury (table 5.10).
Table 5.10 Insurance Benefits: Overall and by Seasonality, with Current Farm Employer
Percent of Crop Workers Reporting Coverage by:
Unemployment Workers' Employer Category Insurance Compensation Health Plan
Overall 39% 48% 8% By Seasonality
Seasonal 39% 47% 5% Year-round 55% 62% 15%
32 While the NAWS also obtains health insurance information for family members (spouse and children), only health insurance coverage for the farm worker respondent is reported here. 33 Unlike the subsequent health insurance question, this one is not asked in the context of the current farm job. 34 Among those who answered “other,” 82 percent identified a parent’s medical plan; seven percent said that they and their employer shared the cost of the premium; and ten percent identified a variety of other sources, such as “clinic,” “church,” “university,” and “other employer.” Based on the combined responses to the question “Who pays for the insurance?”, 12 percent of the workers had health insurance while working for their current farm employer, either outright (the vast majority), or on a shared-cost basis.

43
Housing NAWS respondents are asked about their housing situation (arrangement, location, type, and occupancy), while they are working at their current farm job. For settled (nonmigrant) workers, the information likely reflects the workers’ housing situation for the whole year. For those migrants who live in more than one place in a year, the information is only partial, and most often reflects “on-the-road” rather than “home-base” housing.
In 2001-2002, 58 percent of farm workers lived in housing that they rented from someone other than their employer. Twenty-one percent lived in housing that was supplied by their employer (17 percent received it free of charge and four percent paid rent either directly or via payroll deduction); 19 percent lived in housing that either they or a family member owned; and two percent lived, free of charge, with family or friends. Compared to 2001-2002, a larger share of workers in 1993-1994 lived in employer-supplied housing (33%), while a smaller share (43%), rented from a non-employer.
Migrant workers were more likely than settled workers to live in employer-supplied housing, and were less likely than settled workers to live in housing that either they or a family member owned (table. 5.11).
Table 5.11 Housing Arrangement, by Worker Type
Housing Arrangement Total Migrant Settled
Total 100% 100% 100% Rents from non-employer 58% 61% 56% Employer provides for free 17% 27% 8% Rents from employer 4% 6% 2% Worker or worker's family owns 19% 4% 30% Stays free of charge with family or friend 2% 1% 3%
Note: Sum of portions is not equal to 100 percent for all categories because of rounding.
In 2001-2002, 14 percent of crop workers reported living on the farm where they worked compared to 24 percent in 1993-1994. Six percent of the workers in 2001-2002 lived in employer-supplied housing that was located off the farm, and 80 percent lived in non-employer housing off the farm. Migrant workers were more likely (22%) than settled workers (8%) to have reported living on the farm where they worked (table 5.12).

44
Table 5.12 Housing Location, by Worker Type
Housing Location Total Migrant Settled
Total 100% 100% 100% Off-farm, non-employer administered 80% 68% 89% Off-farm, employer administered 6% 10% 3% On farm 14% 22% 8%
In 2001-2002, a little more than half of all crop workers (55%) reported living in some type of single family home or unit; 22 percent lived in an apartment; and 16 percent lived in a trailer or mobile home. The remaining seven percent lived in various other types of housing: three percent in dormitory or barracks type housing; two percent in a duplex or other conjoined multifamily structure; one percent in a motel or hotel; and one percent in an ‘other’ type of housing.
As with housing arrangement and location, migrant and settled workers differed regarding their housing types. Although migrants were as likely as settled workers to live in a trailer or mobile home (17% and 16%, respectively), they were more likely to live in dormitory or barracks type housing (6% vs. 1%) and apartments (26% vs. 20%), and were less likely than settled workers to live in a single family home or unit (47% vs. 60%) (table 5.13).
Table 5.13 Housing Type, by Worker Type
Housing Type Total Migrant Settled
Total 100% 100% 100% Single family home or unit 55% 47% 60% Apartment 22% 26% 20% Trailer or mobile home 16% 17% 16% Dormitory or barracks 3% 6% 1% Duplex / conjoined multifamily structure 2% 3% 2% Motel / hotel 1% 1% <1%
Note: Sum of portions is not equal to 100 percent for all categories because of rounding.
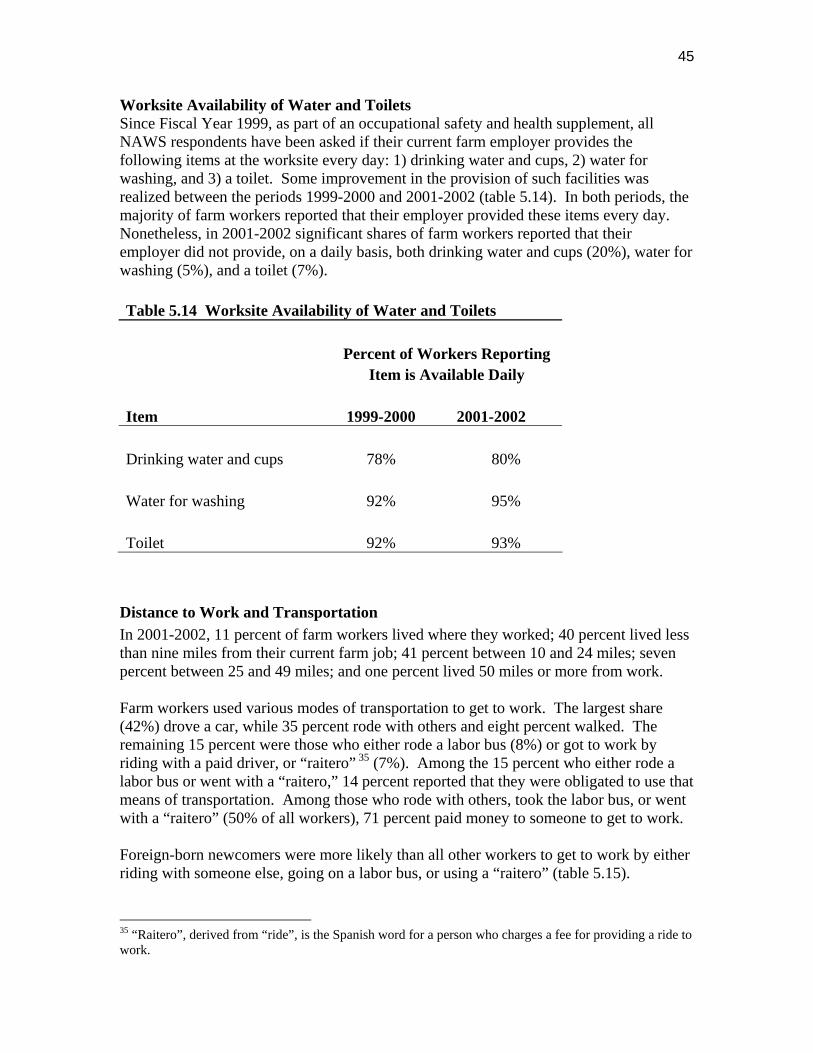
45
Worksite Availability of Water and Toilets Since Fiscal Year 1999, as part of an occupational safety and health supplement, all NAWS respondents have been asked if their current farm employer provides the following items at the worksite every day: 1) drinking water and cups, 2) water for washing, and 3) a toilet. Some improvement in the provision of such facilities was realized between the periods 1999-2000 and 2001-2002 (table 5.14). In both periods, the majority of farm workers reported that their employer provided these items every day. Nonetheless, in 2001-2002 significant shares of farm workers reported that their employer did not provide, on a daily basis, both drinking water and cups (20%), water for washing (5%), and a toilet (7%).
Table 5.14 Worksite Availability of Water and Toilets
Percent of Workers Reporting Item is Available Daily
Item 1999-2000 2001-2002
Drinking water and cups 78% 80%
Water for washing 92% 95%
Toilet 92% 93%
Distance to Work and Transportation In 2001-2002, 11 percent of farm workers lived where they worked; 40 percent lived less than nine miles from their current farm job; 41 percent between 10 and 24 miles; seven percent between 25 and 49 miles; and one percent lived 50 miles or more from work.
Farm workers used various modes of transportation to get to work. The largest share (42%) drove a car, while 35 percent rode with others and eight percent walked. The remaining 15 percent were those who either rode a labor bus (8%) or got to work by riding with a paid driver, or “raitero” 35 (7%). Among the 15 percent who either rode a labor bus or went with a “raitero,” 14 percent reported that they were obligated to use that means of transportation. Among those who rode with others, took the labor bus, or went with a “raitero” (50% of all workers), 71 percent paid money to someone to get to work.
Foreign-born newcomers were more likely than all other workers to get to work by either riding with someone else, going on a labor bus, or using a “raitero” (table 5.15).
35 “Raitero”, derived from “ride”, is the Spanish word for a person who charges a fee for providing a ride to work.

46
Table 5.15 Transportation to Work, by Worker Type
Transportation Mode Total Foreign-born Newcomers
All Other Workers
Total 100% 100% 100% Drives car 42% 3% 50% Walks 8% 9% 8% Rides in car with others 35% 60% 30% Labor bus 8% 10% 7% "Raitero" 7% 17% 5%
Note: Sum of portions is not equal to 100 percent for all worker types because of rounding.
Tools and Equipment Most hired crop workers in 2001-2002 (96%) utilized tools or equipment at work. For the majority of workers who used tools or equipment, the employer paid all the costs associated with their use. Workers employed by farm labor contractors were more likely (19%) than directly hired workers (10%) to have paid all the cost for the tools and equipment they used (table 5.16).36
Table 5.16 Payment for Tools and Equipment, by Employment Type
Tools and Equipment Employment Type Paid for by Total Directly-hired Labor-contracted
Total 100% 100% 100% Worker 12% 10% 19% Employer 84% 86% 77% Both 3% 3% 2%
Note: Sum of portions is not equal to 100 percent because of rounding.
36 One percent each of labor-contracted workers reported that a) they had to pay for the equipment or tools only when they break, and b) that a friend or family member paid for all or part of the cost.

47
Chapter 6: Income, Assets, and Use of Public Programs INDIVIDUAL and FAMILY INCOME; ASSETS in the UNITED STATES and FOREIGN COUNTRY; PAYMENTS from CONTRIBUTION-BASED PROGRAMS; ASSISTANCE from NEEDS-BASED PROGRAMS
Summary of Findings
• Thirty percent of all farm workers had family incomes below the poverty guidelines. • Twenty percent of all farm workers either owned or were buying a home in the
United States. • Twenty-two percent of all farm workers said that they or someone in their household
had received some form of public assistance in the previous two years.
Income NAWS respondents are asked three questions about U.S. income in the previous calendar year: what their individual income was from all sources; how much they made from farm work; and what the total family income was. For each question, the respondent is asked to indicate the range category that includes his/her income, rather than provide a specific sum. As such, average and median income ranges are reported.
For the two calendar-year period 2000-2001,37 the average individual income range from all sources, as well as from farm work only, was $10,000 - $12,499 (fig. 6.1). The average total family income range was $15,000 - $17,499.38 Based on the poverty guidelines that are issued each February by the U.S. Department of Health and Human Services, and which are based on family size, 30 percent of all farm workers had total family incomes that were below the poverty guidelines.39
37 The interviews were conducted in fiscal years 2001-2002 but the responses here are based on income in calendar years 2001-2002. Twenty percent reported not working in the United States in the previous calendar year. The median individual income range, from all sources, was also $10,000 - $12,499. 38 The median total family income range was $12,500-$14,499. 39 Poverty in this analysis requires that the entire NAWS range containing the worker’s family income fall below the poverty guideline for appropriate family size. NAWS family size in this analysis is defined as all family members of the farm worker who are living in the United States and who depend on the farm worker’s income. Poverty status is calculated using the federal poverty guidelines that correspond to the calendar year in which the farm workers were interviewed.

48
2%
4%
7%
11%
14 % 15%
9%
7% 6%
4% 3%
19 %
0%
2%
4%
6%
8%
10%
12%
14%
16%
18%
20%
Perc
enta
ge o
f Cro
p W
orke
rs
$0- $9
99
$1,00
0-$2,4
99
$2,50
0-$4,9
99
$5,00
0-$7,4
99
$7,50
0-$9,9
99
$12,5
00-$1
4,999
$15,0
00-$1
7,499
$20,0
00-$2
4,999
$25,0
00-$2
9,999
$30,0
00+
$10,0
00-$1
2,499
$17,5
00-$1
9,999
Income Range
Figure 6.1 U.S. Individual Income from All Sources. Note: Sum of portions does not equal 100 percent because of rounding.
In families of three or more, the likelihood of total family income being below the poverty guidelines increased with family size. Families of six were more than twice as likely to be living in poverty (50%) than were families of three (22%) (table 6.1). Married crop workers without children were less likely (14%) to be living in poverty than were parents (36%) or single workers (29%).
Table 6.1 Family Incomes Below Poverty, By Family Size Percent of Family
Family Size Percent of Workers in Sample* Type in Poverty Total 100% ( )
1 25% 26% 2 17% 16% 3 18% 22% 4 19% 39% 5 11% 37% 6 5% 50%
7+ 4% 61%
*Note: Sum of portions does not equal 100 percent because of rounding.

49
Assets NAWS respondents are asked about assets they own or are buying in the United States and, if foreign-born, in their home country. In 2001-2002, nearly three quarters (74%) of
Perc
enta
ge o
f Cro
p W
orke
rs
all farm workers stated that they owned or were buying at least one asset either in the United States or in their home country. The most commonly held asset in the United States was a car or truck (49%), followed by a home (17%), land (4%), and mobile home (3%). U.S.-born workers were more likely (38%) to own or be buying a home in the United States than were foreign-born workers (11%) (fig. 6.2).
80%
70%
60%
50%
40%
30%
20%
10%
0% Moblie Home Land Home Car or Truck
2%
11%
41%
6%
38%
3% 4%
49%
2%
11%
75%
17%
Asset
iFore gn-born U.S-born All Workers
Figure 6.2 Farm Workers’ Assets in the United States.
Foreign-born workers were more likely to own or be buying a home (43%) than either land (7%) or a car or truck (3%) in their native country (fig. 6.3). As a group, foreign-born international shuttle and international follow-the-crop migrants, i.e., those who traveled back and forth between the United States and a foreign country in the previous twelve months, were more likely to own or be buying land in their native country (22%) than were the foreign-born newcomers (5%) or foreign-born settled workers (6%).40
40 Four percent of the international migrants (international shuttle and international follow-the-crop) reported owning or buying a home (3%) or mobile home (1%) in the United States. Twenty-three percent of this group reported owning or buying a car or truck in the United States.

50
60%
Perc
enta
ge o
f For
eign
-bor
n 50%
40%
30%
20%
10%
0% 0%
5%
52%
1%2%
54%
1%
6%
2% 0%
7%
3%
22%
11%
33%
43%
Mobile Home Land Home Car or Truck
Asset
i l ) MiNewcomer Internat ona (back-and-forth grant Settled All Foreign-born
Figure 6.3 Foreign-born Workers’ Assets in Foreign Country.
Contribution- and Needs-Based Programs NAWS respondents are asked if they or anyone in their household received benefits from either contribution- or needs-based programs in the two-year period preceding the interview. Twenty-four percent of the crop workers reported that their household had received a benefit from a contribution-based program. The most common contribution-based benefit was unemployment insurance (21%), followed by social security (2%), and disability insurance (1%) (table 6.2).
Table 6.2 Households Receiving Payments from Contribution-Based Programs
Percent of Farm Worker Contribution-Based Households Program Receiving Payments
Unemployment Insurance 21% Social Security 2% Disability Insurance 1%

51
Needs-based benefits include financial assistance through programs such as temporary assistance to needy families (TANF), general assistance or welfare, and publicly provided housing or medical and nutritional assistance, such as Medicaid, Women, Infants and Children (WIC), and Food Stamps. In 2001-2002, 22 percent of the respondents said that they or someone in their household had used at least one type of public assistance program in the previous two years. The most common was Medicaid (15%), followed by WIC (11%) and Food Stamps (8%) (table 6.3). Less than one percent reported that they or someone in their family had received general assistance or TANF.
Table 6.3 Households Receiving Benefits from Needs-Based Programs
Percent of Farm Worker Needs-Based Households Program Receiving Benefits
Medicaid 15% WIC 11% Food Stamps 8% Public Housing 1%

52

53
Appendix A: Statistical Procedures
This section describes the statistical procedures used to analyze NAWS data for this report. Further details on the statistical procedures can be obtained from the NAWS Web site at http://www.dol.gov.dol/asp/programs/agworker/naws.htm
NAWS Weighting Procedure The NAWS sample is drawn with probabilities-proportional-to-size (PPS) and is designed to be self-weighting. According to the sample design, each worker has, in theory, an equal chance of being selected for an interview on any given day. Data limitations, however, make this design difficult to achieve in practice. For example, there is no accurate measure of the number of workers at any given farm for the weeks of data collection. This and other small deviations from the sampling plan make it necessary to implement post-sampling weights. A description of the five post-sampling weights (week, region, cycle, year, and season) and how they are used can be obtained from the NAWS Web site (see URL above).
Determining the Confidence Intervals A confidence interval is an estimated range of values with a given probability of covering the true population value. This section provides information necessary for calculating confidence intervals associated with the reported figures.
For categorical variables (e.g., gender, ethnicity, legal status), the proportion or percentage of workers falling into any defined category is reported. The confidence intervals around the reported survey findings are based on a normal approximation to the binomial distribution. This method implies that, with a 95 percent confidence interval, reported figures vary at most four percentage points from the true value. Hence, for example, if 75 percent of the crop workers in the sample are reported within a given category, there is 95 percent confidence that between 71 and 79 percent of crop workers in the overall population actually fall within that category.
For continuous variables (e.g., age, years of schooling, wage rate), measures of central tendency, such as averages or medians, are generally presented. Confidence intervals for the averages of continuous variables are based on standard errors, which provide a measure of variability of an average value obtained through repeated random sampling from the same population. A small standard error characterizes an average that varies little from sample to sample, while a large standard error indicates greater variance. Boundaries of a 95 percent confidence interval around any sample average are calculated by respectively adding and subtracting from the average roughly three times the standard error. For example, for a variable with a reported sample average of 31 and a standard error of 1, we are 95 percent confident that the true population average is no less than 28 or more than 34.
Table A.1 presents the means, standard errors and confidence intervals for the continuous variables in this report.

54
Table A.1. Confidence Intervals for Continuous Variables
Variable Mean Standard Error
95% Confidence
Level Age 33.08 0.70 31.67 34.48 Highest Grade 7.26 0.21 6.85 7.67 Hours of Work per Week 42.31 0.76 40.78 43.84 Farm Work Days 174.05 5.31 163.38 184.71 Number of Children in Household 0.65 0.05 0.54 0.75 Non-Farm Wage (hourly) $7.41 0.35 6.69 8.12 Farm Wage (hourly) $7.25 0.13 6.98 7.52 Weeks Outside U.S., Last 12 Months (non-newcomers) 3.73 0.33 3.07 4.39 Non-Farm Work Weeks, Last 12 Months (non-newcomers) 5.17 0.64 3.88 6.46 Weeks in U.S. Not Working, Last 12 Months (non-newcomers) 8.56 0.52 7.53 9.60 Farm Work Weeks, Last 12 Months (non-newcomers) 34.45 0.88 32.69 36.21 Years Doing Farm Work (in the United States) 10.32 0.69 8.93 11.71 Years in the United States (foreign-born only) 9.87 0.70 8.46 11.27

55
Appendix B: Index of Means and Percentages of Key Variables Note: Sum of all portions may not equal 100 percent because of rounding.
Chapter 1 Variables Mean or Percentage
Place of Birth 100% Mexico 75%
United States (including Puerto Rico) 23% Central America 2% Other Country 1%
Mexico Sending Region States in Region 100%
Agricultural Northwest Baja California, Sinaloa, Sonora 7%
Northwest Chihuahua, Coahuila 2%
Northeast Nuevo Leon, Tamaulipas 8%
Core North Central Durango, Zacatecas, Aguascalientes 4%
Core Northeast San Luis Potosi, Queretaro, Hidalgo 8%
Pacific Central Nayarit, Colima 3%
West Central Guanajuato, Jalisco, Michoacan 46%
Urban Federal District Estado de Mexico, Mexico Distrito Federal 3%
Pacific South Guerrero, Oaxaca, Chiapas 11%
Gulf
Yucatan, Campeche, Tabasco, Puebla, Tlaxcala, Morelos, Veracruz, Quintana Roo
9%
Ethnicity 100% Mexican American 7% Mexican 72% Chicano 1% Other Hispanic 3%
Not Hispanic or Latino 16%
Race 100% White 41%
Black or African American 4% American Indian / Alaskan Native / Indigenous 8%
Asian <1% Native Hawaiian or Pacific Islander <1% Other 47%

56
Chapter 1 Variables Mean or Percentage
Foreign-born Workers: 100% Years Passed Since First U.S. Arrival
<1 22% 1 – 2 11% 3 – 4 9% 5 – 9 16% 10 – 14 13%
15 + 29%
Foreign-born Workers: Years Passed Since First U.S. Arrival, by Place of Birth Mexico 10 Central America 5
Foreign-born Newcomers: Share Among All Crop Workers 16%
Employment Eligibility (All Workers) 100% Work authorized 47%
Citizens 25% Legal permanent residents 21%
Other 1% Unauthorized 53%
Migrant Types 100% Settled (non migrant) 58%
Migrant 42% Foreign-born newcomer 16% International shuttle 13% International follow-the-crop 2% Domestic shuttle 6% Domestic follow-the-crop 6%

57
Chapter 2 Variables Mean or Percentage
Gender is Male 79%
Age 33
Age cohorts 100% 14 – 17 6% 18 – 19 5% 20 – 24 20% 25 – 34 30% 35 – 44 20% 45 – 54 12% 55 – 64 6%
65 + 1%
Age by Demographic Characteristics All Crop Workers 33
Foreign-born All Foreign-born 32
Authorized Foreign-born 40 Unauthorized Foreign-born 28
Newcomers 24 Arrived more than year ago 34
Born in Mexico 32 Born in Central American country 28
U.S.-born All U.S.-born 36
African American 43 White 36 Hispanic 33
Family Type 100% Married parent 45%
Married, no children 12% Unmarried parent 6%
Single, no children 37%
Number of Children of Parent Respondents Average 2

58
Chapter 2 Variables Mean or Percentage
Number of children 100% 1 31% 2 33% 3 20% 4 10% 5 3% 6 2% 7+ 1%
Cohabitation of Parent and Minor Children 100% Parent lives with all minor children 61% Parent lives away from all minor children 37% Parent lives with some of minor children 2%
Crop Worker: Unity with / Separation from Nuclear Family 100% Accompanied (lives with at least one nuclear family member) 43%
Unaccompanied (living away from all nuclear family) 57%
Among unaccompanied 100% Single, no children 61%
Parents 31% Married, no children 8%
Chapter 3 Variables Mean or Percentage
Native Language 100% Spanish 81% English 18% Other 2%
Education Highest grade completed 7th
Years of Schooling 100% No schooling 4%
1st – 3rd grade 13% 4th – 7th grade 38% 8th – 11th grade 28%
12th grade 13% 13 + years 5%

59
Chapter 3 Variables Mean or Percentage
Highest grade completed by place of birth United States 11th
All foreign-born 6th
Participation in adult education in the U.S. (lifetime) 20%
Type of adult education (multiple responses) English 10%
GED 5% College or university 3% Citizenship class 2% Job training 2%
Other 1%
Ability to Speak English 100% Not at all 44% A little 26%
Some 6% Well 24%
Ability to Read English 100% Not at all 53%
A little 20% Some 6% Well 22%
Chapter 4 Variables Mean or Percentage
Farm Employers Average No. of farm employers in previous year 1.43
Number of farm employers in previous year 100% 1 72% 2 18%
3 6% 4 2%
5 + 1%

60
Chapter 4 Variables Mean or Percentage
Time Employed and Not Employed in Previous Year Activity Weeks (excluding foreign-born newcomers)
farm work 34 non farm work 5 in the United States but not working 9 outside of the United States 4
Number of Farm Workdays in Previous Year All workers 174 All authorized workers 185 All unauthorized workers 165 Foreign-born newcomers 90
U.S. Farm Work Experience (excluding foreign-born newcomers)
Average number of years of U.S. farm work 12
Number of years of U.S. farm work 100% 0 – 1 8% 2 – 4 24% 5 – 10 26% 11 – 20 23% 21 + 18%
Employment Plans and Expectations Number of years planning to do farm work 100%
Less than 1 4% 1 – 3 12% 4 – 5 5% More than 5 6%
More than 5 and as long as able 66% Other 7%
Crop worker believes could obtain non-farm job in one month 100% Yes 37% No 42% Not sure 21%

61
Chapter 5 Variables Mean or Percentage
Employer Type 100% Employer is a grower (direct hire) 79% Employer is a farm labor contractor 21%
Primary Crop at Current Farm Job 100% Fruit and nut 34%
Vegetable 31% Horticultural 18% Field 14% Miscellaneous 4%
Primary Task at Current Farm Job 100% Pre-harvest 16%
Harvest 30% Post-harvest 9% Technical production 17% Other 27%
How Obtained Current Farm Job 100% Applied on own 26% Referred by friend, relative, or fellow worker 70% Recruited by grower, foreman, or labor contractor 3%
Years Working for Current Farm Employer Average number of years 4
Number of years 100% 0 – 1 35% 2 – 3 28% 4 – 5 13% 6 – 7 7% 8 – 9 4% 10 + 13%
Seasonality of Current Farm Job 100% Year-round 60% Seasonal 25% Not sure 15%
Hours Worked in Previous Week at Current Farm Job 42

62
Chapter 5 Variables Mean or Percentage
Basis for Pay, Current Farm Job 100% By the hour 79% By the piece 16% Combination, hourly and piece 3%
Salary 2%
Hourly Wage at Current Farm Job $7.25
Cash Bonus Given 100% Yes 22%
No 65% Not sure 13%
Type of Cash Bonus (when given) (multiple responses)
Holiday bonus 51% Incentive award 12%
Bonus contingent on employer’s profits 5% End-of-season payment 32% Transportation stipend 1% Other 5%
Eligible for Unemployment Insurance 100% Yes 39% No 54% Not sure 8%
Covered by Workers’ Compensation 100% Yes 48%
No 20% Not sure 31%
Covered by Health Insurance 100% Yes 23%
No 76%
Source of Health Insurance (for those covered) 100% Current farm employer 46%
Government 19% Self, spouse, or family 15%
Spouse’s employer 12% Other 7%

63
Chapter 5 Variables Mean or Percentage
Housing Arrangement during Current Farm Job 100% Rents from non employer 58% Employer provides for free 17% Rents from employer 4% Worker or worker’s family owns 19% Stays for free with family or friend 2%
Housing Location during Current Farm Job 100% Off farm, non employer administered 80% Off farm, employer administered 6%
On farm 14%
Housing Type during Current Farm Job 100% Single family home or unit 55%
Apartment 22% Trailer or mobile home 16% Dormitory or barracks 3% Duplex / conjoined multifamily structure 2% Motel / hotel 1%
Daily Worksite Availability of Drinking water and disposable cups 80% Water for washing hands 95%
Toilet 93%
Mode of Transportation to Current Farm Job 100% Drives a car 42%
Walks 8% Rides in car with others 35% Rides a labor bus 8% Pays a driver “Raitero” 7%
Tools and Equipment (when they are utilized) Paid by: Employer 84%
Worker 12% Both 3%

64
Chapter 6 Variables Mean or Percentage
Individual Income, All U.S. Sources, Previous Calendar Year Average individual income range $10,000 -
$12,499
Individual income range 100% $0 - $999 2% $1,000 - $2,499 4% $2,500 - $4,999 7% $5,000 - $7,499 11% $7,500 - $9,999 14% $10,000 - $12,499 19% $12,500 - $14,999 15% $15,000 - $17,499 9% $17,500 - $19,999 7% $20,000 - $24,999 6% $25,000 - $29,999 4% $30,000 + 3%
Family Income, All U.S. Sources, Previous Calendar Year Average family income range $15,000 -
$17,499
Family income range 100% $0 - $999 2% $1,000 - $2,499 3% $2,500 - $4,999 5% $5,000 - $7,499 7% $7,500 - $9,999 11% $10,000 - $12,499 15% $12,500 - $14,999 13% $15,000 - $17,499 8% $17,500 - $19,999 9% $20,000 - $24,999 9% $25,000 - $29,999 7% $30,000 + 13%
Assets Owned or Buying in the United States (all workers, multiple responses)
Plot of land 4% Home 17% Mobile home 3%
Car or truck 49%

65
Chapter 6 Variables Mean or Percentage
Assets Owned or Buying in a Foreign Country (foreign-born workers, multiple responses)
Plot of land 7% Home 43% Mobile home 0%
Car or truck 3%
Households Receiving Payments from Contribution-Based Programs (last two years)
Unemployment Insurance 21% Social Security 2% Disability Insurance 1%
Households Receiving Benefits from Needs-Based Programs (last two years)
Medicaid 15% Women Infants and Children (WIC) 11%
Food Stamps 8% Public Housing 1%

66