findings from the a demographic and national … from the a demographic and national agricultural...
TRANSCRIPT
Findings from the A Demographic andNational Agricultural Employment Profile ofWorkers Survey United States Farmworkers(NAWS) 1997-1998
Research Report No. 8
U.S. Department of LaborOffice of the Assistant Secretary for PolicyOffice of Program Economics
March 2000

Material contained in this publication is inthe public domain and may be reproduced,fully or partially, without permission of theFederal Government. Source credit is requested.Permission is required only to reproduce anycopyrighted material contained herein.
This material will be made available todeaf and hard of hearing individuals upon request.Voice phone: 202-219-6197TTY FIRS: 1-800-877-8339

Findings from the A Demographic andNational Agricultural Employment Profile ofWorkers Survey United States Farmworkers(NAWS) 1997-1998
U.S. DEPARTMENT OF LABORALEXIS M. HERMAN, SECRETARY
OFFICE OF THE ASSISTANT SECRETARY FOR POLICYEDWARD B. MONTGOMERY, ASSISTANT SECRETARY
MARCH 2000
This report was produced through a collaboration of the U.S. Department of Labor, Office of the Assistant Secretary forPolicy, and Aguirre International, San Mateo, California.
It was written by:
Kala Mehta, Aguirre InternationalSusan M. Gabbard, Aguirre InternationalVanessa Barrat, Aguirre InternationalMelissa Lewis, Aguirre InternationalDaniel Carroll, U.S. Department of LaborRichard Mines, U.S. Department of Labor
The authors are grateful to Jorge Nakamoto and Alberto Sandoval, Aguirre International,for coordinating the field interviews on which the report is based, to 4,199 farmworkers inthe United States for graciously participating in interviews during 1997-98, and to theiragricultural employers for helping survey staff reach these workers.
The authors are solely responsible for the contents of this report.

Contents iii
Table of Contents
EXECUTIVE SUMMARY............................................................................................VII
INTRODUCTION............................................................................................................. 1
TOPICS COVERED .............................................................................................................. 1SURVEY METHOD ............................................................................................................. 2
CHAPTER 1: PLACE OF BIRTH AND LENGTH OF STAY IN THE U.S.............. 5
PLACE OF BIRTH ............................................................................................................... 5NUMBER OF YEARS TO DATE IN THE UNITED STATES....................................................... 6
CHAPTER 2: DEMOGRAPHICS, FAMILY AND HOUSEHOLD COMPOSITION…9
AGE................................................................................................................................... 9GENDER.......................................................................................................................... 10HOUSEHOLD STRUCTURE................................................................................................ 10
CHAPTER 3: EDUCATION, LITERACY, AND ENGLISH SKILLS..................... 13
NATIVE LANGUAGE ........................................................................................................ 13EDUCATION .................................................................................................................... 13ADULT EDUCATION ........................................................................................................ 15LITERACY....................................................................................................................... 15ENGLISH FLUENCY (SELF RATED) ................................................................................... 17
CHAPTER 4: LABOR.................................................................................................... 19
NUMBER OF JOBS ............................................................................................................ 19MIGRATION..................................................................................................................... 20LEGAL STATUS OF U.S. FARMWORKERS......................................................................... 22TIME SPENT IN LABOR OVER THE YEAR......................................................................... 24FARM WORK EXPERIENCE……………………………………………………………...26PLANS TO CONTINUE IN FARM WORK............................................................................. 27
CHAPTER 5: CHARACTERISTICS OF FARM JOBS AND FARM CONDITIONS...29
EMPLOYERS .................................................................................................................... 29CROPS............................................................................................................................. 29TASKS............................................................................................................................. 30RECRUITMENT AND RETENTION...................................................................................... 31HOURS WORKED AND BASIS FOR PAY ............................................................................ 32WAGES............................................................................................................................ 33FRINGE BENEFITS............................................................................................................ 36
iv Findings from the National Agricultural Workers Survey: 1997-1998
HOUSING......................................................................................................................... 37MEALS ............................................................................................................................ 37SANITATION.................................................................................................................... 37TRANSPORTATION........................................................................................................... 37EQUIPMENT..................................................................................................................... 37
CHAPTER 6: INCOME AND ASSETS ....................................................................... 39
INCOME........................................................................................................................... 39FARMWORKER ASSETS.................................................................................................... 39USE OF SERVICES ............................................................................................................ 40
APPENDIX: STATISTICAL PROCEDURES ........................................................... 43
NAWS WEIGHTING PROCEDURE.................................................................................... 43DETERMINING STANDARD ERROR................................................................................... 43
Figures v
Table of Figures
Chart 1. Farmworker Ethnicity and Place of Birth...................................................................... 5
Chart 2. Number of Years in the United States, by Birthplace ................................................... 6
Chart 3. Foreign-Born Workers' Length of Residence in the United States ............................... 7
Chart 4. Age Distribution of U.S. Farmworkers ......................................................................... 9
Chart 5. Farmworker Marital Status.......................................................................................... 10
Chart 6. Number of Resident and Non-Resident Children of Farmworker Parents.................. 11
Chart 7. Native Language of U.S. Farmworkers....................................................................... 13
Chart 8. Level of Education by Place of Last Schooling .......................................................... 14
Chart 9. Participation in Adult Education Classes .................................................................... 15
Chart 10. Participation in Adult Education by Years of Schooling ............................................ 16
Chart 11. U.S. Farmworkers With Fluency in English, by Place of Birth and Ethnicity............ 17
Chart 12. Number of Jobs Held by U.S. Farmworkers in One Year........................................... 19
Chart 13. Migration and U.S. Farmworkers................................................................................ 20
Table 1. Defining Migrant Travel Patterns ............................................................................... 21
Chart 14. Farmworkers' Home Base .......................................................................................... 21
Chart 15. Percent Distribution of Farmworkers by Current Legal Status .................................. 22
Chart 16. Percent Distribution of Farmworkers’ Legal Status by Method of Application........ 23
Chart 17. Time Spent in Farm Work in the Year Prior to Interview by Farmworker
Place of Birth.............................................................................................................. 24
Table 2. Distribution of Weeks Spent in Various Activities: Three Periods Compared........... 25
Table 3. Monthly Activity of Farmworkers, 1997 .................................................................... 26
Table 4. Years of Farm Work and Average Age by Method of Legalization........................... 26
Chart 18. Crops in Which Farmworkers are Employed............................................................. 29
Chart 19. Crops in Which FLC Employees Work ..................................................................... 30
Chart 20. Tasks in Which Farmworkers are Employed ............................................................. 31
Chart 21. Basis for Pay, All Farm Jobs...................................................................................... 32
Chart 22. Earnings Per Hour, by Task and Employer Type....................................................... 33
Table 5. Farmworker Nominal and Real Hourly Wages (Based on 1998).............................. 34
vi Findings from the National Agricultural Workers Survey: 1997-1998
Chart 23. Hourly Nominal and Real Wages (Based on 1998)................................................... 34
Table 6. Average Hourly Earnings of Crop Workers and Workers in the Nonfarm Private
Sector........................................................................................................................... 35
Chart 24. Average Hourly Earnings of Crop Workers and Other Workers in the Private Sector
................................................................................................................................................ 35
Chart 25. Workers who Report Receiving Fringe Benefits, by Employer Type ....................... 36
Chart 26. Incomes Below Poverty Level, by Family Size ......................................................... 40
Chart 27. Households Receiving Payments From "Contribution-Based" Programs ................. 40
Chart 28. Households Receiving "Needs-Based" Government Services................................... 41
Table A.1. Means and Standard Errors for Continuous and Dichotomous Variables…………..44

Executive Summary vii
Executive Summary
This is Report Number 8 in a series of publications based on the findings of the NationalAgricultural Workers Survey (NAWS), a nationwide, random survey on the demographic andemployment characteristics of hired crop workers. This report, like those before it, finds thatseveral long-standing trends characterizing the farm labor workforce and the farm labor marketcontinue. It finds that farmworker wages have stagnated, annual earnings remain below thepoverty level, farmworkers experience chronic underemployment and that the farm workforceincreasingly consists of young, single males who are recent immigrants.
In 1997-98, most farmworkers (60%) held only one farm job per year and the majority(70%) had learned about their current job through informal means, such as through a friend, arelative or a workmate. On average, farmworkers were employed in agriculture for less than halfof a year (24 weeks). Even in July, when demand for farm labor peaks in many parts of thecountry, just over half of the total farm labor workforce held agricultural jobs. On average,farmworkers supplemented their agricultural earnings with five weeks of nonfarm employmentin the U.S.
The number of weeks this workforce is employed each year in farm and nonfarm jobs inthe U.S. has been declining. Since 1990-92, the average work year in agriculture has decreasedfrom 26 to 24 weeks while the number of weeks in nonagricultural employment has decreasedfrom eight to five. At the time of the 1997-98 interviews, farmworkers had worked, on average,a total of just eight years in agriculture.
Over the period of the 1990’s, with a strong economy and greater, increasinglywidespread prosperity, farmworker wages have lost ground relative to those of workers in theprivate, nonfarm sector. Since 1989, the average nominal hourly wage of farmworkers has risenby only 18 percent (from $5.24 to $6.18), about one-half of the 32 percent increase fornonagricultural workers. Adjusted for inflation, the average real hourly wage of farmworkers (in1998 dollars) has dropped from $6.89 to $6.18. Consequently, farmworkers have lost 11 percentof their purchasing power over the last decade.
Fifty-two percent of all farmworkers were married, and the majority (61%) had incomesbelow the poverty level. For the past decade, the median income of individual farmworkers hasremained less than $7,500 per year while that of farmworker families has remained less than$10,000. Despite the fact that the relative poverty of farmworkers and their families has grown,their use of social services remains low and, for some programs, has even declined. For instance,in both 1994-95 and 1997-98, just 20 percent of all farmworkers reported having receivedunemployment insurance. Likewise, in both periods, just 10 percent reported receiving benefitsfrom the Women, Infants and Children (WIC) program. Use of Medicaid and food stamps hasdecreased over time. In 1994-95, 15 percent of all those interviewed reported receivingMedicaid and food stamps versus 13 percent and 10 percent, respectively, in 1997-98.

viii Findings from the National Agricultural Workers Survey: 1997-1998
Other measures of economic well being indicate that farmworkers are increasinglydisadvantaged. In 1994-95, nearly half (49%) of all farmworkers owned a vehicle, a figure thatdropped to 44 percent in 1997-98. More workers now rely on employers, contractors, andcoworkers for transportation to work. Another large change was in home ownership. In 1994-95, one third of all farmworkers owned or were buying a home in the U.S. By 1997-98, onlyhalf as many (14%) so reported.
These trends are consistent with the finding that a large share of the farm workforceconsists of recent immigrants. In 1997-98, 27 percent of all those interviewed had entered theU.S. within the previous two years. Many of these new workers (33%) had no previousexperience working in agriculture. Among all farmworkers interviewed in 1997-98, 52 percentlacked work authorization.
NAWS findings of low wages, underemployment, and low annual incomes of U.S. cropworkers are indicative of a national oversupply of farm labor. Low annual income, in turn, mostlikely contributes to the instability that characterizes the agricultural labor market, as farmworkers seek jobs paying higher wages and offering more hours of work.
The National Agricultural Workers Survey profiles characteristics of crop workers andtheir jobs: important components of the supply side of the farm labor market. Labor markets,however, reflect the interaction of labor supply and demand. A study of the demand for farmlabor, and how it would likely change as the farm labor supply changed, is beyond the scope ofthe NAWS. Such a study, however, would complement the farm worker data collected via theNAWS and help point the way to an agricultural labor market that promotes stable employment,higher wages and a legal, domestic workforce.

Introduction 1
Introduction
Farmworkers in the United States perform numerous important tasks necessary forcultivating and harvesting a large share of the nation’s food supply. This report presents currentinformation on the characteristics and work patterns of those who perform crop work in theUnited States (U.S.). It is intended to provide data for policy makers, researchers, agriculturalproducers/employers, employer associations, and organizations providing services tofarmworkers.
The National Agricultural Workers Survey (NAWS) is a national survey of farmworkersin crop agriculture. The NAWS collects extensive data from this population concerning basicdemographics, legal status, education, family size and household composition, wages andworking conditions in farm jobs, and participation in the U.S. labor force. Information for thisreport was obtained from 4,199 interviews with workers in the United States during fiscal years1997 and 1998.
Initially, the NAWS was commissioned by the Department of Labor (DOL) as part of itsresponse to the Immigration Reform and Control Act of 1986 (IRCA). The original purposeswere to monitor turnover of seasonal agricultural service workers in order to identify emergingshortages between 1990 and 1993 and to monitor seasonal agricultural wages and workingconditions. Since that time, several other federal agencies have participated in the developmentof the NAWS questionnaire by contributing questions to assist them in better serving theirfarmworker constituencies.
The NAWS interviews workers performing crop agriculture.1 The definition of cropwork by the U.S. Department of Agriculture (USDA) includes “field work” in the vast majorityof nursery products, cash grains, and field crops, as well as in all fruits and vegetables. Cropagriculture also includes the production of silage and other animal fodder. The populationsampled by NAWS consists of nearly all farmworkers in crop agriculture, including fieldpackers, and supervisors, and even those simultaneously holding nonfarm jobs. However, thesample excludes secretaries and mechanics, and H-2A temporary farmworkers. The NAWS doesnot sample unemployed agricultural workers.
Topics Covered
This report is organized into six chapters. Chapters 1 through 3 provide information aboutthe farmworkers, themselves, including demographic characteristics, family composition,national origin, education, and language proficiency.
1 All crops included in Standard Industrial Classification (SIC) code 01.
2 Findings from the National Agricultural Workers Survey: 1997-1998
Chapters 4 and 5 describe the labor force participation of U.S. crop workers.2 Chapter 4gives an overview of worker participation in the farm labor force. Chapter 5 outlines thecharacteristics of farm jobs held by workers in the survey, including crop and task, weekly hours,wages and benefits, and working conditions.
Chapter 6 contains information on farmworkers’ income, assets, and use of socialservices. It covers personal income, assets in the United States and home country, familypoverty status, and use of government and private social services.
The text and figures summarize worker responses to interview questions, in some casesaggregated by important subgroups of the population. An appendix describes statisticalconventions followed in analyses throughout this report.
Survey Method
During fiscal years 1997 and 1998, the NAWS randomly selected and interviewed morethan 2,000 crop workers across the United States each year. The multi-stage sampling procedureis designed to account for seasonal and regional fluctuations in the level of farm employment.The NAWS is designed to obtain a nationally representative sample of crop workers.
Seasonal fluctuations in the agricultural work force are captured by three interviewingcycles lasting 10 to 12 weeks each. Cycles begin in February, June, and October. The numberof interviews conducted during a cycle is proportional to the amount of crop activity at that timeof the year.
The amount of crop activity during each season of the year is approximated usingadministrative data from the Bureau of Labor Statistics and the Census of Agriculture. All statesin the continental U.S. are divided into 12 regions, aggregated from the 17 agricultural regionsused by the USDA. Within these regions, a roster of 47 Crop Reporting Districts (CRD)containing 288 counties was selected. For each cycle, no fewer than two CRD were selectedrandomly for each region.
Multi-stage sampling is used to choose respondents in each cycle. The number of sitesselected is also proportional to the amount of farm work being done during the cycle. Thelikelihood of a given site being selected varies with the size of its seasonal agricultural payroll.Because some states such as California and Florida have relatively high agricultural payrollsthroughout the year, several CRDs in these states are selected for interviews during each cycle.Within each CRD, a county is selected at random. Farm employers within each of the selectedcounties are chosen randomly from public agency records. Principle among these areunemployment insurance files, Agricultural Commissioners’ pesticide registrations, and lists
2 The terms “farmworker” and “crop worker” are interchangeable in this report.
Introduction 3
maintained by the Bureau of Labor Statistics and various state agencies. The availability of thesedata varies by state. NAWS staff review and update these lists annually in the field.
Once the sample is drawn, NAWS interviewers contact the selected agriculturalemployers, explain the purpose of the survey, and obtain access to the work site in order toschedule interviews. Interviewers then go to the farm, ranch, or nursery, explain the purpose ofthe survey to workers, and ask a random sample of them to participate. Interviews are conductedin the workers’ home or at another location of the worker’s choice.
The 4,199 personal interviews on which this report is based were conducted in 85counties between October 1, 1996 and September 30, 1998.

4 Findings from the National Agricultural Workers Survey: 1997-1998

Chapter 1: Place of Birth and Length of Stay in the U.S. 5
Summary of Findings
Ø 81 percent of all farmworkers in 1997-98 were foreign-bornØ 77 percent of all farmworkers were Mexican-BornØ A disproportionate share of foreign-born farmworkers had either immigrated within
the previous two years or had resided in the U.S. for more than 15 years.
Chapter 1: Place of Birth and Length of Stay in the U.S.
Chart 1. Farmworker Ethnicity and Place of Birth
Place of Birth
Eighty-one percent of all farmworkers were foreign-born. The vast majority of theforeign-born (95%) were from Mexico, comprising three quarters of the farm workforce in 1997-98. The remainder were from other parts of Latin America (2%), Asia (1%), and other countries(1%).
US-Born White7%
US-Born Hispanic9%
US-Born African American1%
Other US-Born2%
Latin American Born2%
Mexican Born77%
Asian Born1%
Other Foreign-Born1%

6 Findings from the National Agricultural Workers Survey: 1997-1998
About 19 percent of all farmworkers were U.S.-born. U.S.-born Whites accounted forjust 7 percent of all farmworkers, while U.S.-born Hispanics, African Americans and othersmade up the remaining 12 percent (see Chart 1).
Number of Years to Date in the United States
Foreign-born farmworkers had spent an average of 10 years in the United States at thetime of the interview. This figure largely reflects the experience of the dominant group, theMexican-born. By comparison, Central Americans averaged 6 years and Southeast Asians 8years in the U.S. In contrast, smaller groups such as Asians, Pacific Islanders, and SouthAmerican individuals typically had been in the U.S. more than 10 years (see Chart 2).
Chart 2. Number of Years in the United States, by Birthplace
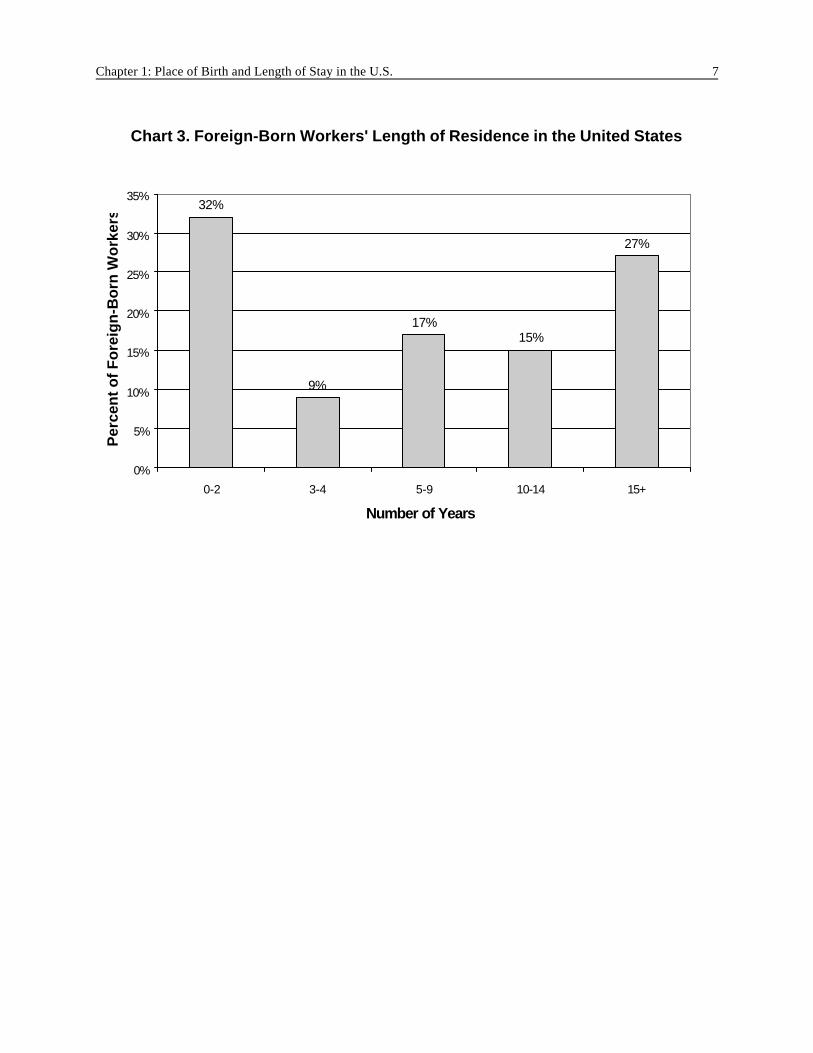
In 1997-98, the foreign-born farm workforce was dominated by two main groups:newcomers who had arrived in the United States within the last two years, and those who hadresided in the U.S. for fifteen years or more. Newcomers accounted for one-third, and thoseresident 15 years or more another quarter of the foreign-born workforce (see Chart 3).
15
10
8
6
0 2 4 6 8 10 12 14 16
Pacific Islands
Mexico
South East Asia
Central America
Pla
ce o
f B
irth
Average Number of Years
Chapter 1: Place of Birth and Length of Stay in the U.S. 7
Chart 3. Foreign-Born Workers' Length of Residence in the United States
32%
9%
17%15%
27%
0%
5%
10%
15%
20%
25%
30%
35%
0-2 3-4 5-9 10-14 15+
Number of Years
Per
cen
t o
f F
ore
ign
-Bo
rn W
ork
ers

8 Findings from the National Agricultural Workers Survey: 1997-1998

Chapter 2: Demographics, Family and Household Composition 9
Summary of Findings
Ø Farmworkers are young: their average age is 31, and half of all farmworkers areunder 29 years of age.
Ø Eighty percent of farmworkers are men.Ø One-half of all farmworkers are married, and slightly less than one-half are
parents.Ø Among farmworker parents, half are not accompanied by their children.
Chapter 2: Demographics, Family and Household Composition
Age
Chart 4. Age Distribution of U.S. Farmworkers
As might be expected in a physically intense occupation, the farmworker population wasrelatively young. Approximately 79 percent of all farmworkers were between the ages of 18 and44. Six percent were between the ages of 14 and 17, and 15 percent were 45 and above (seeChart 4). The median age of all farmworkers was 29.
6%
9%
21%
31%
18%
9%
5%
1%
0%
5%
10%
15%
20%
25%
30%
35%
14-17 18-19 20-24 25-34 35-44 45-54 55-64 65+
Age
Per
cen
t o
f U
S F
arm
Wo
rker
s

10 Findings from the National Agricultural Workers Survey: 1997-1998
Gender
Just 20 percent of U.S. farmworkers were women. Female farmworkers differed in somekey respects from males. They were more likely to be U.S.-born (34% vs. 15%), and tended tobe somewhat older (median age 31 vs. 28).
Household Structure
Slightly over half (52%) of farmworkers were married; another 43 percent were single,while the remaining 5 percent were widowed, separated or divorced (see Chart 5). Femalefarmworkers were more likely than males to be married (60% vs. 50%).
Many married farmworkers did not routinely reside with their nuclear families. Fully 45percent of those with a spouse and offspring were not residing with them at the time of theinterview. Ninety percent of the non-resident families lived in Mexico. Most single, childlessfarmworkers lived with people who were not part of their nuclear family.
Farmworking women were more likely than men to reside with their nuclear families(74% vs. 27%). Ninety-eight percent of childless, married farmworking women lived with theirspouses, as compared with just half of comparable men. Ninety-one percent of mothers, ascompared with just 42 percent of fathers, lived with their children.
Chart 5. Farmworker Marital Status
Widowed/Divorced/ Separated
5%
Single43%
Married 52%

Chapter 2: Demographics, Family and Household Composition 11
Although this is a young population (median age was 29) and 43 percent were single,nearly half (45%) of all farmworkers had children. About 24 percent had children with whomthey resided, 21% had children resident elsewhere, and a small fraction (1%) lived with some,but not all, of their children.
Of those farmworkers who were parents, roughly a third each reported having one, two,and three or more children. The likelihood of separation from their children appears to increasewith family size. Just 5 percent of intact farmworker families, as compared with 11 percent ofthose living apart from their children, had 5 or more offspring (see Chart 6).
Chart 6. Number of Resident and Non-Resident Children of Farmworker Parents
34%
30%
20%
11%
5%
29% 30%
19%
12% 11%
0%
5%
10%
15%
20%
25%
30%
35%
40%
1 2 3 4 5 & over
Number of Children of Farmworker Parents
Per
cen
t o
f U
S F
arm
Wo
rker
s
Resident
Non-Resident

12 Findings from the National Agricultural Workers Survey: 1997-1998
Chapter 3: Education, Literacy, and English Skills 13
Summary of Findings
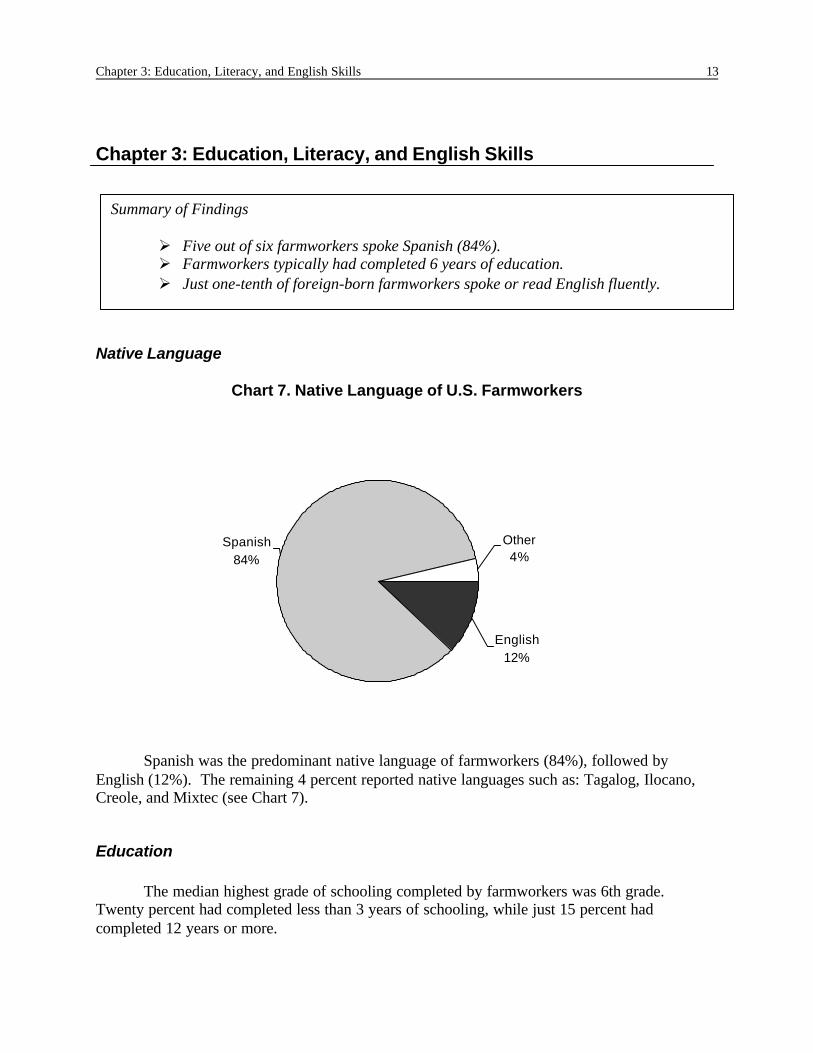
Ø Five out of six farmworkers spoke Spanish (84%).Ø Farmworkers typically had completed 6 years of education.Ø Just one-tenth of foreign-born farmworkers spoke or read English fluently.
Chapter 3: Education, Literacy, and English Skills
Native Language
Chart 7. Native Language of U.S. Farmworkers
Spanish was the predominant native language of farmworkers (84%), followed byEnglish (12%). The remaining 4 percent reported native languages such as: Tagalog, Ilocano,Creole, and Mixtec (see Chart 7).
Education
The median highest grade of schooling completed by farmworkers was 6th grade.Twenty percent had completed less than 3 years of schooling, while just 15 percent hadcompleted 12 years or more.
Spanish84%
Other4%
English12%
14 Findings from the National Agricultural Workers Survey: 1997-1998
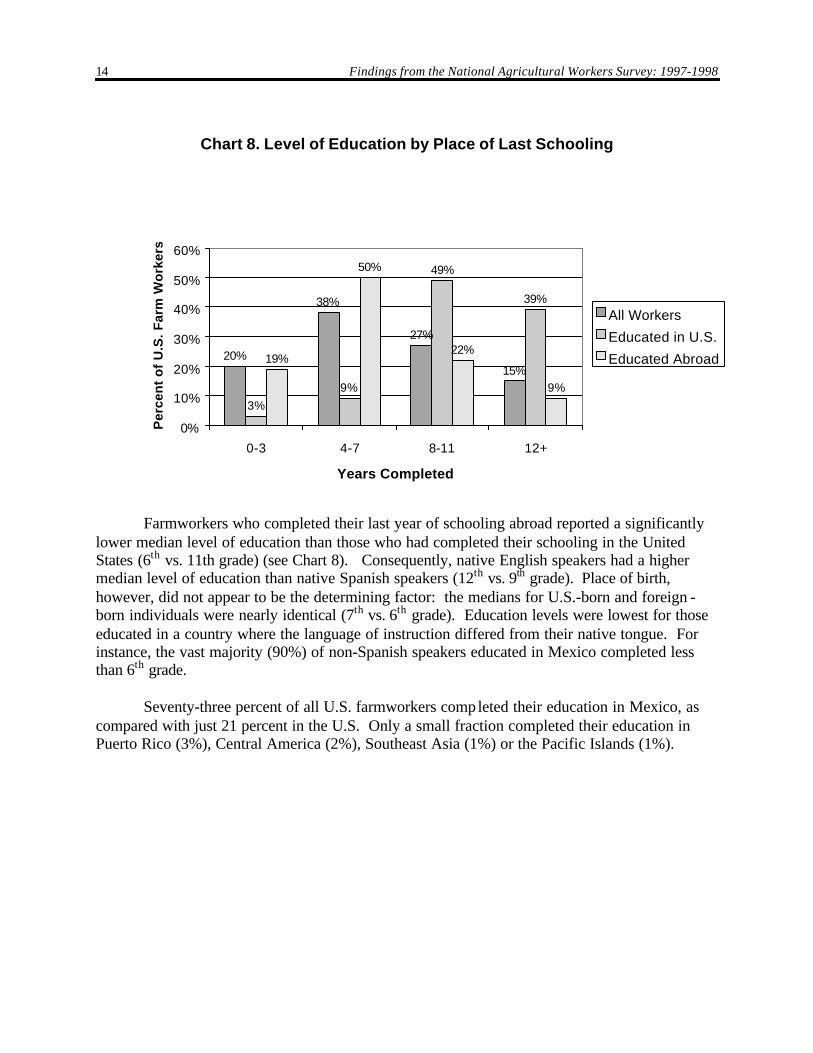
Chart 8. Level of Education by Place of Last Schooling
Farmworkers who completed their last year of schooling abroad reported a significantlylower median level of education than those who had completed their schooling in the UnitedStates (6th vs. 11th grade) (see Chart 8). Consequently, native English speakers had a highermedian level of education than native Spanish speakers (12th vs. 9th grade). Place of birth,however, did not appear to be the determining factor: the medians for U.S.-born and foreign -born individuals were nearly identical (7th vs. 6th grade). Education levels were lowest for thoseeducated in a country where the language of instruction differed from their native tongue. Forinstance, the vast majority (90%) of non-Spanish speakers educated in Mexico completed lessthan 6th grade.
Seventy-three percent of all U.S. farmworkers completed their education in Mexico, ascompared with just 21 percent in the U.S. Only a small fraction completed their education inPuerto Rico (3%), Central America (2%), Southeast Asia (1%) or the Pacific Islands (1%).
20%
38%
27%
15%
3%
9%
49%
39%
19%
50%
22%
9%
0%
10%
20%
30%
40%
50%
60%
0-3 4-7 8-11 12+
Years Completed
Per
cen
t o
f U
.S.
Far
m W
ork
ers
All Workers
Educated in U.S.
Educated Abroad
Chapter 3: Education, Literacy, and English Skills 15
Adult Education
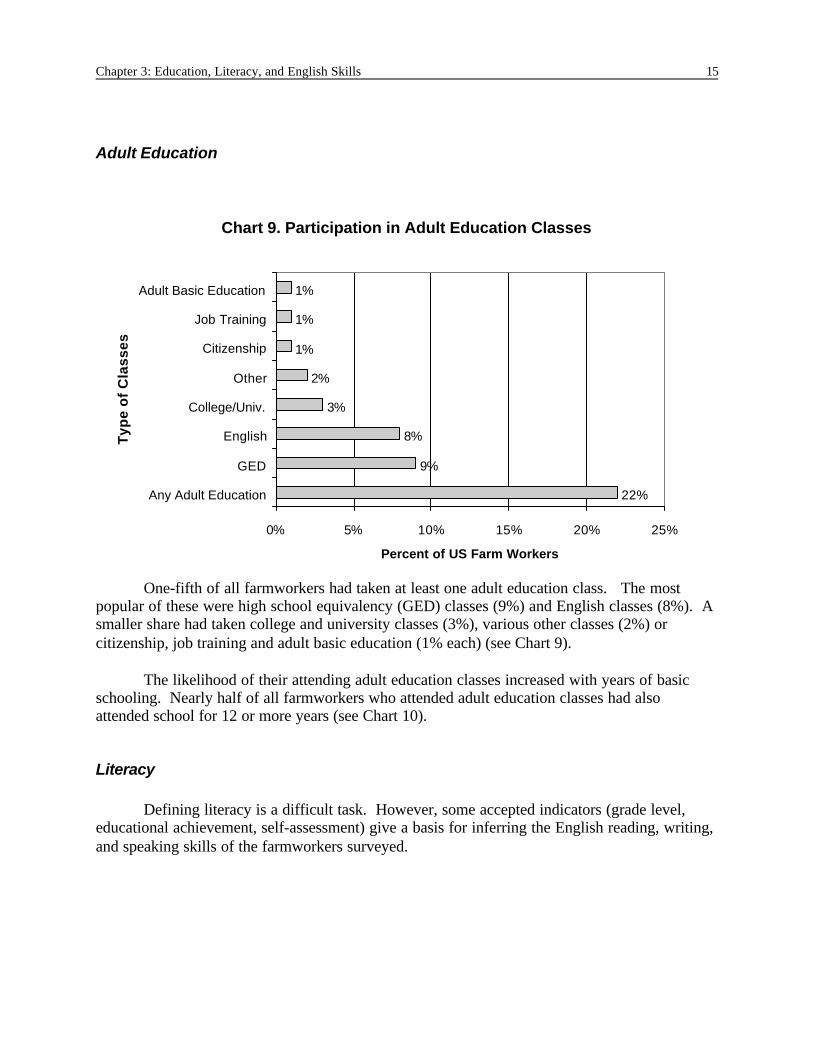
Chart 9. Participation in Adult Education Classes
One-fifth of all farmworkers had taken at least one adult education class. The mostpopular of these were high school equivalency (GED) classes (9%) and English classes (8%). Asmaller share had taken college and university classes (3%), various other classes (2%) orcitizenship, job training and adult basic education (1% each) (see Chart 9).
The likelihood of their attending adult education classes increased with years of basicschooling. Nearly half of all farmworkers who attended adult education classes had alsoattended school for 12 or more years (see Chart 10).
Literacy
Defining literacy is a difficult task. However, some accepted indicators (grade level,educational achievement, self-assessment) give a basis for inferring the English reading, writing,and speaking skills of the farmworkers surveyed.
22%
9%
8%
3%
2%
1%
1%
1%
0% 5% 10% 15% 20% 25%
Any Adult Education
GED
English
College/Univ.
Other
Citizenship
Job Training
Adult Basic Education
Ty
pe
of
Cla
ss
es
Percent of US Farm Workers

16 Findings from the National Agricultural Workers Survey: 1997-1998
Chart 10. Participation in Adult Education by Years of Schooling
Although years of schooling completed do not necessarily correlate with present abilitiesto read and write, school completion data provide some indication of ability to process and useprinted information. Under one method of appraisal, 3 adults are divided into three major groups:
C Totally Illiterate - person has skills below the fourth grade level and cannotacquire information through print.
C Functionally Illiterate - person can read between the fourth and seventh gradelevels.
C Marginally Literate - person can read between the eighth and twelfth grade levels,but lacks the twelfth grade equivalence needed in a complex technologicalsociety.
By this standard, most farmworkers (85%) would have difficulty obtaining informationfrom printed materials in any language. Those with between 8 and 12 years of education (27%)would be considered marginally literate; those with between 4 and 7 years (38%) would beconsidered functionally illiterate, and those with less than a fourth grade education (20%) wouldbe considered totally illiterate.4 Many of these workers, however, have valued qualifications notreflected in grade level or literacy.
3 Jeanne Chall, director of Harvard University’s Reading Laboratory. Source: LSCA Programs: An Action
Report II, U.S. Department of Education, Washington, D.C., April 1989, p. 3.
4 Other classification systems, such as the National Adult Literacy Survey (NALS), through the NationalCenter for Education Statistics (NCES), define literacy broadly, as using printed and written information to function
0%
5%
10%
15%
20%
25%
30%
35%
40%
45%
50%
No schooling 1-3 4-7 8-11 12+
Years of Schooling
Pe
rce
nt
of
US
Fa
rm W
ork
ers
7%9%
10%
34%
47%

Chapter 3: Education, Literacy, and English Skills 17
English Fluency (Self rated)
Chart 11. U.S. Farmworkers With Fluency in English, by Place of Birth andEthnicity
Most crop work does not require English fluency and literacy, since foremen andmanagers commonly hire and supervise in the workers’ native languages. Nonetheless, NAWSrespondents were asked, "How well do you speak English?" and "How well do you readEnglish?" Chart 11 demonstrates how differently various ethnic groups responded to thisquestion. As might be expected, almost all U.S.-born non-Hispanics reported that they could readand speak English "well." Three-fifths of U.S.-born Hispanic farmworkers responded that they
effectively in society, not merely as an ability to read at a particular grade level. The NALS contains severalcategories of literacy, including prose literacy (ability to use information from text sources such as books andnewspapers), document literacy (ability to use information from sources such as maps, tables, and forms), andquantitative literacy (ability to perform arithmetic functions, such as balancing a checkbook). These categories,however, take a battery of tests to evaluate, and are not available through the NAWS instrument.
99%
62%
4% 2%
36%40%
98%
60%
4% 3%
36%40%
0%
20%
40%
60%
80%
100%
120%
U.S., Non-Hispanic
U.S., Hispanic Mexico Non-MexicanBorn Latino
Asia Haiti
Place of Birth
Pe
rce
nt
of
Fa
rmw
ork
ers
Speak Read

18 Findings from the National Agricultural Workers Survey: 1997-1998
could read and speak English well. Less than 5 percent of Mexican-born and other LatinAmerican-born farmworkers reported they could read and speak English well. One-third ofAsian-born farmworkers responded that they could read and speak English well. Almost all ofthe foreign-born farmworkers who said that they could speak (94%) or read (87%) English wellhad lived in the United States for 5 years or more.

Chapter 4: Labor 19
Summary of Findings
Ø Sixty percent of all farmworkers held just one U.S. farm job per year.Ø During the course of the year, they spent approximately half of their time doing
farm work.Ø Fifty-six percent of all farmworkers migrate, whether within the United States
and/or internationally.
Chapter 4: Labor
Number of Jobs
Chart 12. Number of Jobs Held by U.S. Farmworkers in One Year
The 4,199 interviewed farmworkers reported having held a total of 7,697 U.S. farm jobs.Fully 60 percent reported holding just one farm job during the previous year. Thirty-threepercent had held 2 to 3 jobs, and just 7 percent had held four or more (see Chart 12). Two-thirdsof those who had discontinuous work experience left their jobs for reasons beyond their control,i.e., because they were laid off or the season ended. Other work-related reasons includedquitting (no reason specified) (5%), change of jobs (4%) and being fired (less than 1%).
1 job60%
2-3 jobs33%
4-5 jobs6%
6+ jobs1%

20 Findings from the National Agricultural Workers Survey: 1997-1998
Relatively few cited personal reasons such as moving (5%), vacation (5%), familyresponsibilities (3%), school (2 %), health (1%), or retirement (less than 1%).5
Migration
Chart 13. Migration and U.S. Farmworkers
As the figures in Chart 13 demonstrate, the majority (56%) of U.S. farmworkers had totravel to secure employment. The NAWS has defined a migrant farmworker as one who travelsmore than 75 miles to obtain a job in U.S. agriculture.6 Various patterns of migration areelaborated further in Table 1.
5 Because the NAWS only interviews employed farmworkers, it is impossible to determine theexact reason for high farmworker turnover.
6 Migrant Farmworkers: Pursuing Security in an Unstable Labor Market. Research Report 5.U.S. Department of Labor, Office of the Assistant Secretary for Policy, Office of ProgramEconomics (1994).
Non Migrants44%
Shuttle Migrants39%
Follow the Crop17%
Chapter 4: Labor 21
Table 1. Defining Migrant Travel Patterns
Resides in locationless than 75 milesfrom all his/her U.S.farm jobs
Resides in locationmore than 75 Milesfrom any of his/herU.S. farm jobs
All farm jobs areless than 75 milesapart
Non Migrant Shuttle Migrant
Has at least twoFarm Jobs morethan 75 Miles apart
Follow the CropMigrant
Follow the CropMigrant
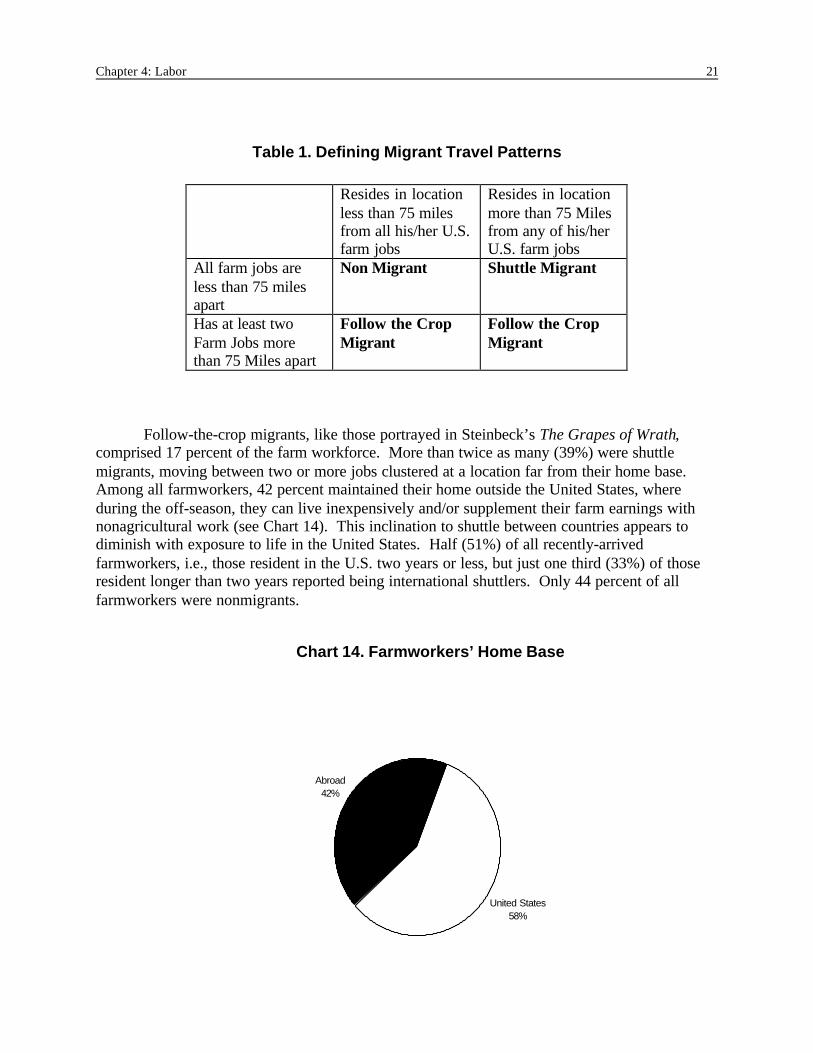
Follow-the-crop migrants, like those portrayed in Steinbeck’s The Grapes of Wrath,comprised 17 percent of the farm workforce. More than twice as many (39%) were shuttlemigrants, moving between two or more jobs clustered at a location far from their home base.Among all farmworkers, 42 percent maintained their home outside the United States, whereduring the off-season, they can live inexpensively and/or supplement their farm earnings withnonagricultural work (see Chart 14). This inclination to shuttle between countries appears todiminish with exposure to life in the United States. Half (51%) of all recently-arrivedfarmworkers, i.e., those resident in the U.S. two years or less, but just one third (33%) of thoseresident longer than two years reported being international shuttlers. Only 44 percent of allfarmworkers were nonmigrants.
Chart 14. Farmworkers’ Home Base
United States58%
Abroad42%

22 Findings from the National Agricultural Workers Survey: 1997-1998
Age and place of birth also appear to influence a worker’s propensity to migrate for employment.Migrant farmworkers were, on average, slightly younger than non-migrants. The median age offollow-the-crop migrants was 26 years, as compared with 27 years for shuttle migrants, and 31for non-migrants. This age differential is echoed in other indices of farmworker activity, sinceolder workers tend to be the most settled.
Nine out of ten follow-the-crop and shuttle migrants, but just two thirds of non-migrantfarmworkers, were foreign-born. Newly migrant farmworkers, with less than one year ofagricultural experience in the U.S., spent an average of 17 weeks per year doing farmwork.Their counterparts, with several years of farm experience, averaged 26 weeks of such workannually. The work schedules of non-migrants were the most stable, averaging 32 weeks peryear of agricultural employment.
Legal Status of U.S. Farmworkers
The NAWS interview requested information on the farmworker’s U.S. citizenship or visatype and status to identify whether the individual was authorized to work in the United States,and, if so, how he or she originally obtained legal status. In 1997-98, 52 percent of hiredfarmworkers lacked work authorization, 22 percent were citizens and 24 percent were legalpermanent residents (see Chart 15). The remaining 2 percent comprised individuals withtemporary work permits, such as foreign students, refugees and asylees, and persons who hadpending applications for adjustment of status under family preference. Between 1996 and 1998,the share of workers who were unauthorized increased by 1 percentage point per year.7
Chart 15. Percent Distribution of Farmworkers by Current Legal Status
Unauthorized52%
Citizen22%
LPR24%
Other2%
7 The unauthorized component increased from 50% in 1996 to 51% in 1997.
Chapter 4: Labor 23
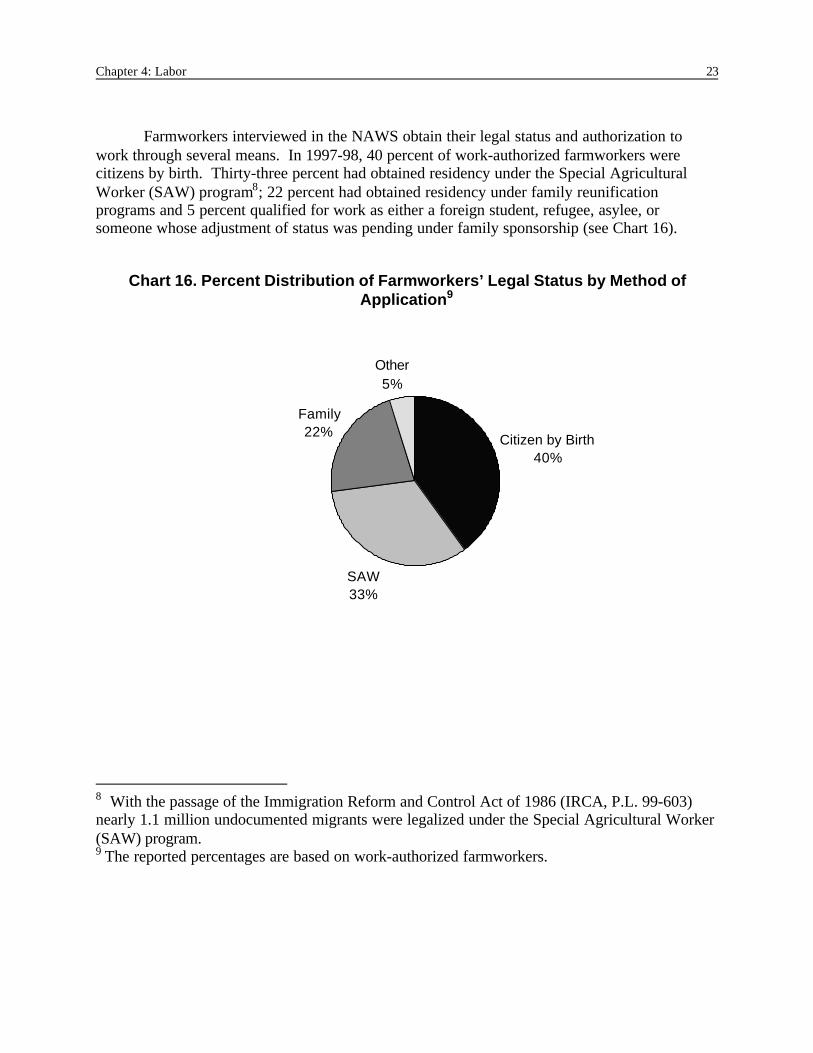
Farmworkers interviewed in the NAWS obtain their legal status and authorization towork through several means. In 1997-98, 40 percent of work-authorized farmworkers werecitizens by birth. Thirty-three percent had obtained residency under the Special AgriculturalWorker (SAW) program8; 22 percent had obtained residency under family reunificationprograms and 5 percent qualified for work as either a foreign student, refugee, asylee, orsomeone whose adjustment of status was pending under family sponsorship (see Chart 16).
Chart 16. Percent Distribution of Farmworkers’ Legal Status by Method ofApplication9
Citizen by Birth40%
SAW33%
Family22%
Other5%
8 With the passage of the Immigration Reform and Control Act of 1986 (IRCA, P.L. 99-603)nearly 1.1 million undocumented migrants were legalized under the Special Agricultural Worker(SAW) program.9 The reported percentages are based on work-authorized farmworkers.

24 Findings from the National Agricultural Workers Survey: 1997-1998
Time Spent in Labor Over the Year
Chart 17. Time Spent in Farm Work in the Year Prior to Interview by FarmworkerPlace of Birth
Underemployment is widespread within the farm workforce. In 1997-98, farmworkersspent, on average, about 47 percent of their time in U.S. farm work, 24 percent of their timeliving abroad, 19 percent of their time residing but not working in the U.S., and 8 percent of theirtime in U.S. nonfarm employment. Time spent working in U.S. agriculture varied by place ofbirth: non-Mexican-born Latinos spent the largest proportion of their year (56%) in farmwork.By comparison, Mexican-born and U.S.-born farmworkers spent 48 and 46 percent of their yearin farmwork, respectively, while Asian-born farmworkers spent just 43 percent (see Chart 17).
Overall, there is evidence that the average number of weeks worked in agriculture hasbeen dropping. Table 2 (below) shows that it has decreased from 26 in 1990-92 to 24 in 1996-98. Over the same period, the average number of weeks worked by U.S.-born farmworkers fellfrom 24 to 23, and that of foreign-born farmworkers fell from 28 to 25.
29%
6%
33%
46%
12%15%
6%
48%
18%
11%
56%
11%9%
32%
43%
15%
0%
10%
20%
30%
40%
50%
60%
Farm Work Non-FarmWork
Not Working Abroad
Activity
Percent of U.S. Farmworkers
U.S.-Born
Mexican-Born
Non-Mexican Latino
Asian-Born
Chapter 4: Labor 25
Table 2. Distribution of Weeks Spent in Various Activities: Three PeriodsCompared
ALL FARMWORKERS
PERIOD N Farmwork Weeks Nonfarm Work Weeks Non-Work Weeks Weeks Abroad
26.2 7.6 11.2 6.5FY 90-92 6596
25.0 6.1 11.1 8.9FY 93-95 7082
24.4 4.6 10.1 12.2FY 96-98 6221
U.S. BORNPERIOD N Farmwork Weeks Nonfarm Work Weeks Non-Work Weeks Weeks Abroad
23.6 11.5 15.0 1.4FY 90-92 1137
21.3 9.9 17.1 2.1FY 93-95 1884
22.5 8.2 18.8 2.0FY 96-98 1054
FOREIGN BORNPERIOD N Farmwork Weeks Nonfarm Work Weeks Non-Work Weeks Weeks Abroad
28.0 5.1 8.7 9.9FY 90-92 5455
26.6 4.4 8.4 12.0FY 93-95 5173
24.9 3.7 8.0 14.8FY 96-98 5159
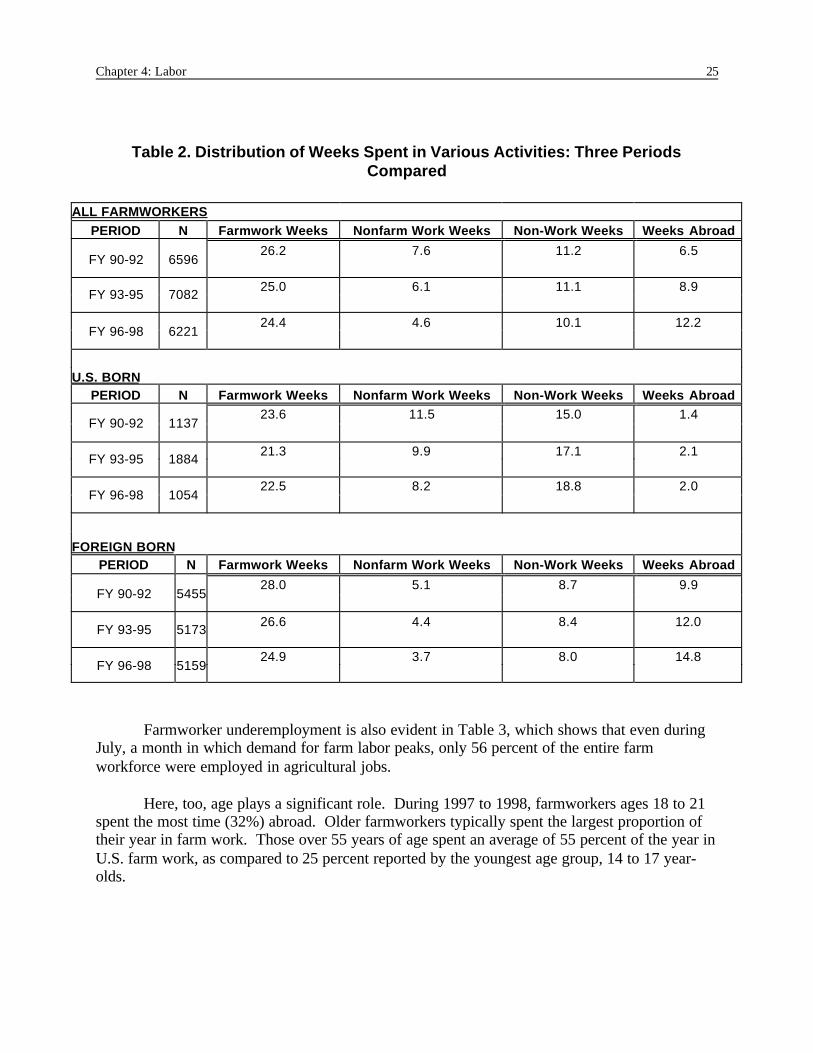
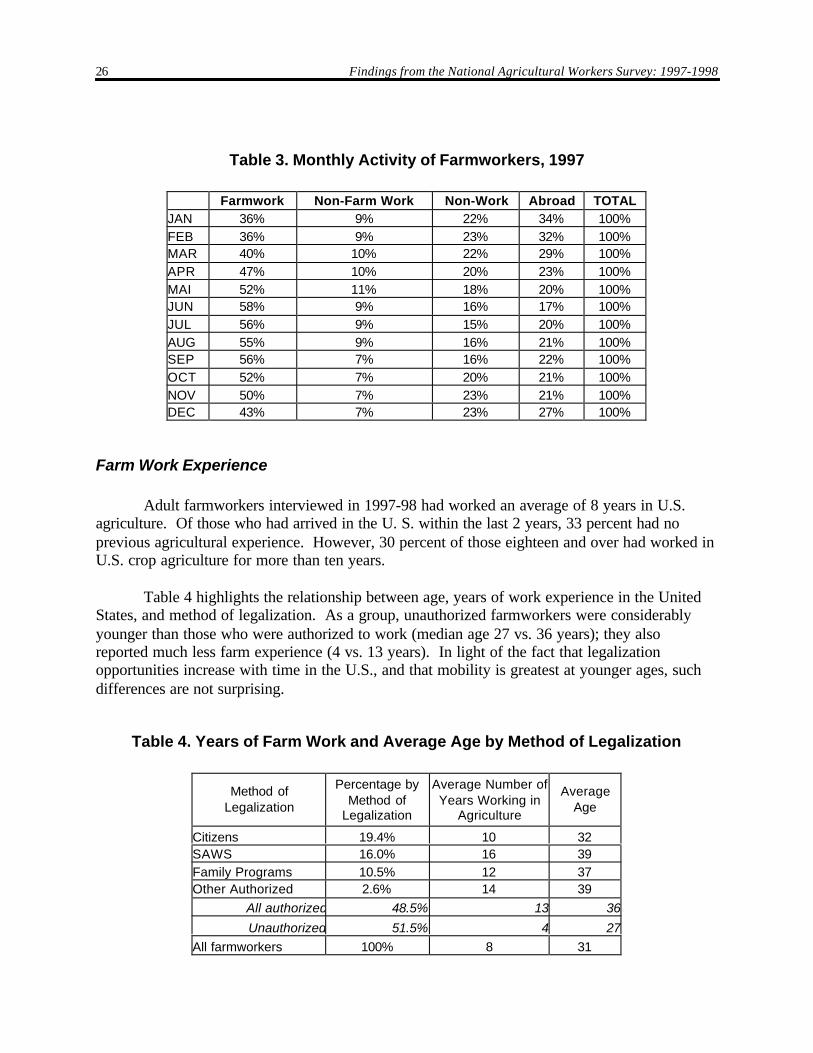
Farmworker underemployment is also evident in Table 3, which shows that even duringJuly, a month in which demand for farm labor peaks, only 56 percent of the entire farmworkforce were employed in agricultural jobs.
Here, too, age plays a significant role. During 1997 to 1998, farmworkers ages 18 to 21spent the most time (32%) abroad. Older farmworkers typically spent the largest proportion oftheir year in farm work. Those over 55 years of age spent an average of 55 percent of the year inU.S. farm work, as compared to 25 percent reported by the youngest age group, 14 to 17 year-olds.
26 Findings from the National Agricultural Workers Survey: 1997-1998
Table 3. Monthly Activity of Farmworkers, 1997
Farmwork Non-Farm Work Non-Work Abroad TOTALJAN 36% 9% 22% 34% 100%FEB 36% 9% 23% 32% 100%MAR 40% 10% 22% 29% 100%APR 47% 10% 20% 23% 100%MAI 52% 11% 18% 20% 100%JUN 58% 9% 16% 17% 100%JUL 56% 9% 15% 20% 100%AUG 55% 9% 16% 21% 100%SEP 56% 7% 16% 22% 100%OCT 52% 7% 20% 21% 100%NOV 50% 7% 23% 21% 100%DEC 43% 7% 23% 27% 100%
Farm Work Experience
Adult farmworkers interviewed in 1997-98 had worked an average of 8 years in U.S.agriculture. Of those who had arrived in the U. S. within the last 2 years, 33 percent had noprevious agricultural experience. However, 30 percent of those eighteen and over had worked inU.S. crop agriculture for more than ten years.
Table 4 highlights the relationship between age, years of work experience in the UnitedStates, and method of legalization. As a group, unauthorized farmworkers were considerablyyounger than those who were authorized to work (median age 27 vs. 36 years); they alsoreported much less farm experience (4 vs. 13 years). In light of the fact that legalizationopportunities increase with time in the U.S., and that mobility is greatest at younger ages, suchdifferences are not surprising.
Table 4. Years of Farm Work and Average Age by Method of Legalization
Method ofLegalization
Percentage byMethod of
Legalization
Average Number ofYears Working in
Agriculture
AverageAge
Citizens 19.4% 10 32SAWS 16.0% 16 39Family Programs 10.5% 12 37Other Authorized 2.6% 14 39
All authorized 48.5% 13 36Unauthorized 51.5% 4 27
All farmworkers 100% 8 31

Chapter 4: Labor 27
Plans to Continue in Farm Work
Farmworkers were asked how long they expected to continue in farm work. Only abouthalf (54%) stated intentions to continue for more than five years or as long as they were able.Twenty-seven percent intended to continue in this line of work for less than 3 years.
To explore their ability to find work elsewhere in the United States, the NAWS askedabout respondents’ contacts in the nonfarm sector. Overall, 59 percent reported having relativesor close friends who performed nonfarm work in the United States. Respondents were alsoasked if they could obtain a U.S.-based nonfarm job within one month. Only 35 percent saidthey could, and 24 percent responded that they did not know.

28 Findings from the National Agricultural Workers Survey: 1997-1998
Chapter 5: Characteristics of Farm Jobs and Farm Conditions 29
Summary of FindingsØ Nineteen percent of the U.S. farmworkers interviewed by the NAWS were
employed by farm labor contractors.Ø Sixty-one percent worked in fruits, nuts, or vegetables.Ø One-third of the jobs were in crop harvest, and one-quarter were in semi-
skilled technical jobs.Ø Three out of four farmworkers were paid by the hour, with an average hourly
wage of $ 5.94.Ø Although 20 percent reported being covered by unemployment insurance, just
5 percent reported being covered by employer provided health insurance.
Chapter 5: Characteristics of Farm Jobs and Farm Conditions
Employers
In 1997-98, four out of five U.S. farmworkers were hired directly by agriculturalemployers or farmers; the remaining one fifth were hired by Farm Labor Contractors (FLC).Farm labor contractors serve as intermediaries, often hiring, firing and supervising work in theworkers' native language.
Crops
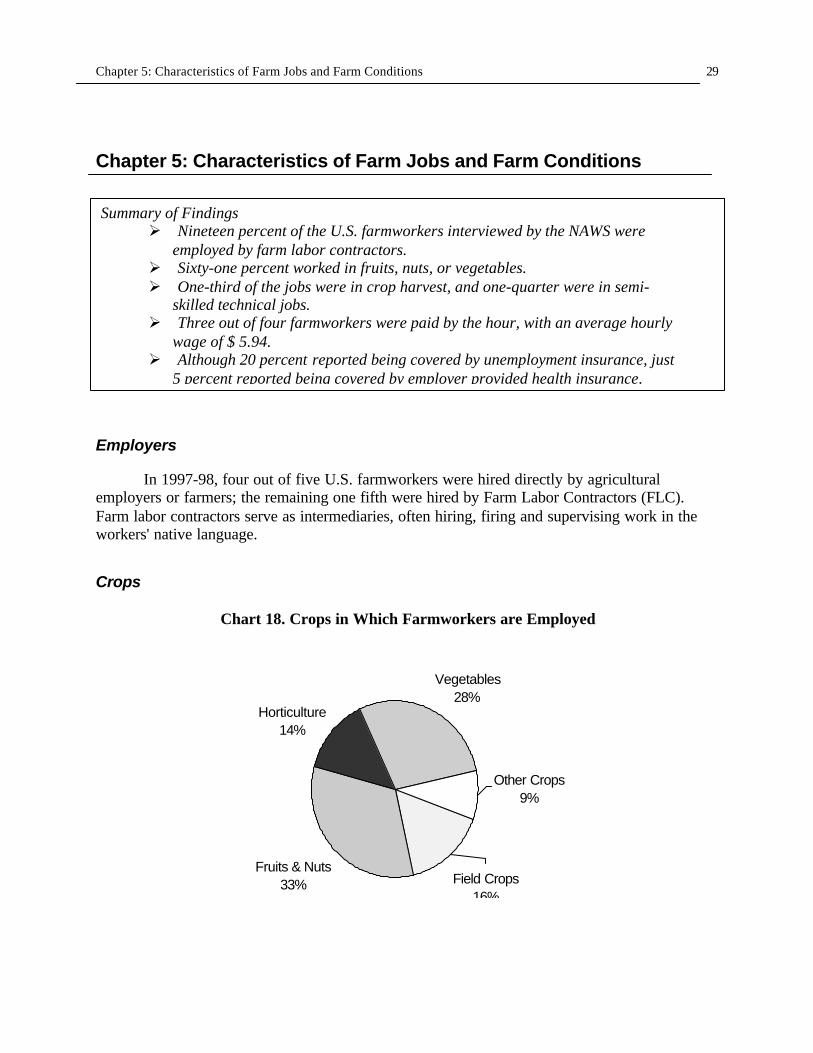
Chart 18. Crops in Which Farmworkers are Employed
Fruits & Nuts33%
Vegetables28%
Horticulture14%
Other Crops9%
Field Crops16%

30 Findings from the National Agricultural Workers Survey: 1997-1998
About 33 percent of all farmworkers worked in fruit and nut crops, 28 percent invegetables, 16 percent on field crops, 14 percent in horticulture and the remaining 9 percent inother crops (see Chart 18). FLC employees were more frequently employed in field crops,horticulture, and other crops, while those hired directly by growers were more likely to work infruits, nuts, and vegetables (see Chart 19).10
Chart 19. Crops in Which FLC Employees Work
Tasks
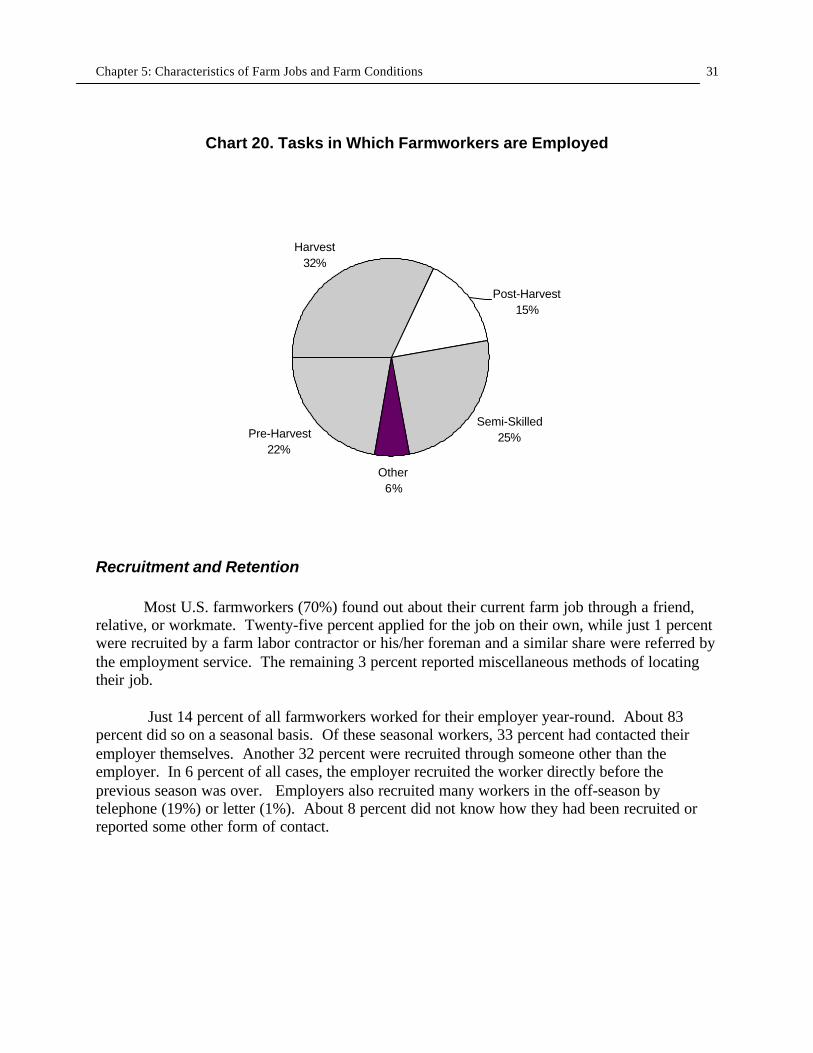
About 32 percent of all workers took part in harvest tasks. Only 22 percent engaged inpre-harvest tasks such as hoeing, thinning, and transplanting; 15 percent engaged in post-harvesttasks such as field packing, sorting, or grading. Twenty five percent did semi-skilled or skilledtechnical production tasks, such as irrigating, operating machinery, and pruning. The remaining6 percent of workers performed other tasks, of which less than 1 percent involved supervision(see Chart 20). Proportionately more directly hired workers than FLC employees engaged inharvest tasks (35% versus 22%).
10 Fourteen percent of directly hired farmworkers worked in field crops, 34 percent in fruits andnuts, 13 percent in horticulture, 31 percent in vegetables, and 8 percent in other crops.
Fruits & Nuts26%
Other Crops12%
Horticulture 19%
Vegetables19%
Field Crops24%
Chapter 5: Characteristics of Farm Jobs and Farm Conditions 31
Chart 20. Tasks in Which Farmworkers are Employed
Recruitment and Retention
Most U.S. farmworkers (70%) found out about their current farm job through a friend,relative, or workmate. Twenty-five percent applied for the job on their own, while just 1 percentwere recruited by a farm labor contractor or his/her foreman and a similar share were referred bythe employment service. The remaining 3 percent reported miscellaneous methods of locatingtheir job.
Just 14 percent of all farmworkers worked for their employer year-round. About 83percent did so on a seasonal basis. Of these seasonal workers, 33 percent had contacted theiremployer themselves. Another 32 percent were recruited through someone other than theemployer. In 6 percent of all cases, the employer recruited the worker directly before theprevious season was over. Employers also recruited many workers in the off-season bytelephone (19%) or letter (1%). About 8 percent did not know how they had been recruited orreported some other form of contact.
Pre-Harvest22%
Harvest32%
Semi-Skilled25%
Other6%
Post-Harvest15%

32 Findings from the National Agricultural Workers Survey: 1997-1998
Hours Worked and Basis for Pay
Farmworkers interviewed in 1997-98 worked an average of 38 hours per week. Themajority (56%) worked between 31 and 50 hours, while nearly a third (30%) worked 30 hours orless and 15 percent worked more than 50 hours. Seventy-seven percent of the farmworkers werepaid by the hour, 20 percent by the piece and a small percentage (2%) by a combination of thesemethods (see Chart 21).
Chart 21. Basis for Pay, All Farm Jobs
Farmers and farm labor contractors do not appear to rely on distinctly different methodsof payment. However, the prevalence of piece rates (as compared with hourly wages) does varyconsiderably by crop. Whereas about 20 percent of all farmworkers were paid by the piece, thisshare varied from 25 percent in fruits, nuts and vegetables to just 10 percent in field crops,horticulture and other crops. The tasks for which farmworkers were most likely to be paid by thepiece were harvest tasks (36%). Almost all of those engaged in pre- and post-harvest tasks werepaid by the hour (95%). Farmworker supervisors were universally paid by the hour.
77%
20%
2%
0%
10%
20%
30%
40%
50%
60%
70%
80%
90%
Hourly Piece Rate Combination
Per
cen
t o
f U
S F
arm
Wo
rker
s
Chapter 5: Characteristics of Farm Jobs and Farm Conditions 33
Wages
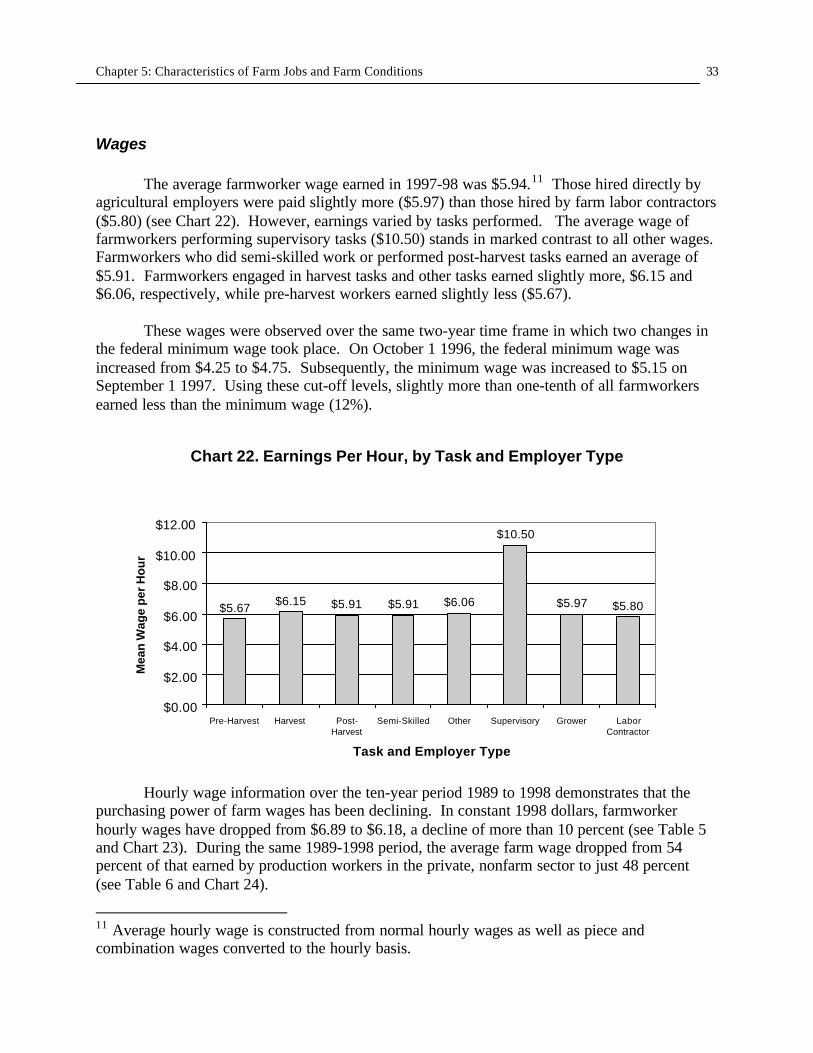
The average farmworker wage earned in 1997-98 was $5.94.11 Those hired directly byagricultural employers were paid slightly more ($5.97) than those hired by farm labor contractors($5.80) (see Chart 22). However, earnings varied by tasks performed. The average wage offarmworkers performing supervisory tasks ($10.50) stands in marked contrast to all other wages.Farmworkers who did semi-skilled work or performed post-harvest tasks earned an average of$5.91. Farmworkers engaged in harvest tasks and other tasks earned slightly more, $6.15 and$6.06, respectively, while pre-harvest workers earned slightly less ($5.67).
These wages were observed over the same two-year time frame in which two changes inthe federal minimum wage took place. On October 1 1996, the federal minimum wage wasincreased from $4.25 to $4.75. Subsequently, the minimum wage was increased to $5.15 onSeptember 1 1997. Using these cut-off levels, slightly more than one-tenth of all farmworkersearned less than the minimum wage (12%).
Chart 22. Earnings Per Hour, by Task and Employer Type
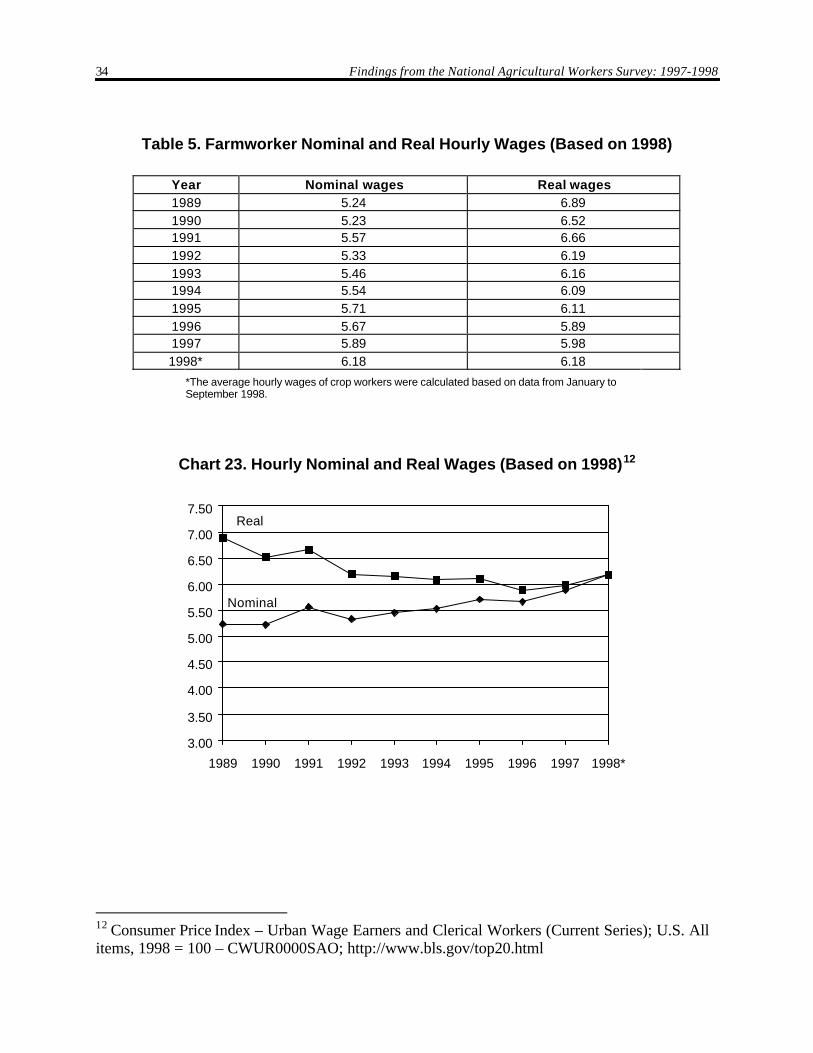
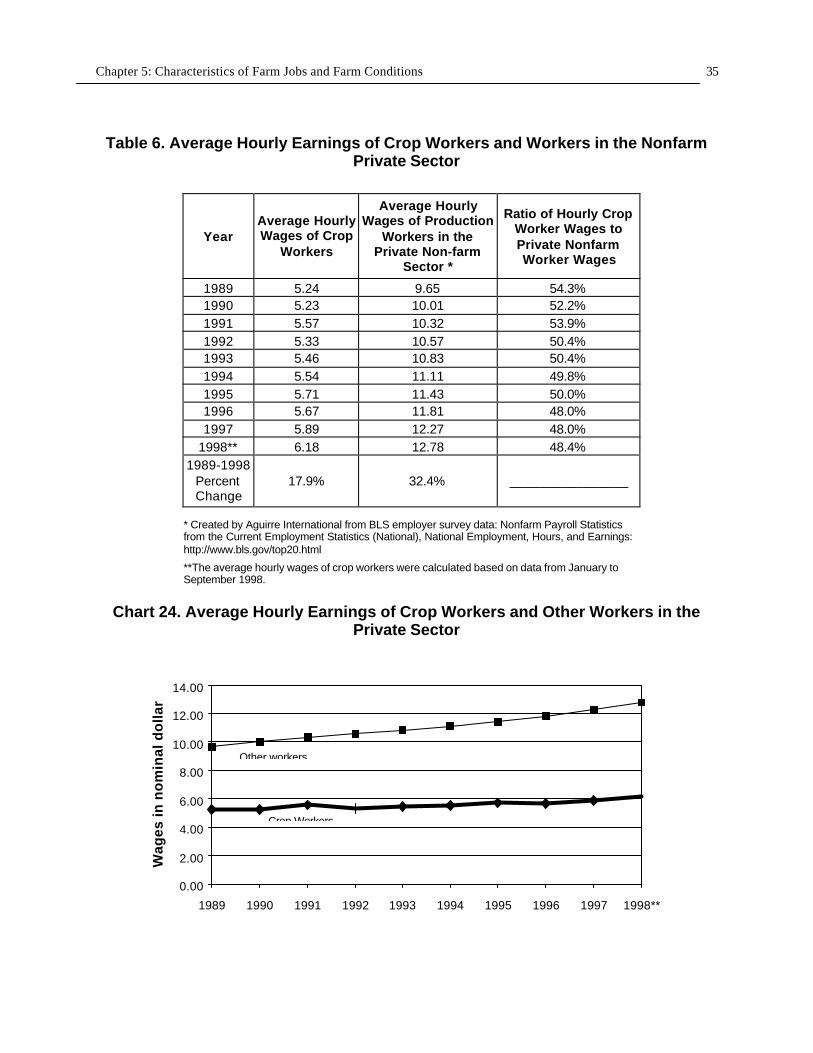
Hourly wage information over the ten-year period 1989 to 1998 demonstrates that thepurchasing power of farm wages has been declining. In constant 1998 dollars, farmworkerhourly wages have dropped from $6.89 to $6.18, a decline of more than 10 percent (see Table 5and Chart 23). During the same 1989-1998 period, the average farm wage dropped from 54percent of that earned by production workers in the private, nonfarm sector to just 48 percent(see Table 6 and Chart 24).
11 Average hourly wage is constructed from normal hourly wages as well as piece andcombination wages converted to the hourly basis.
$5.67$6.15 $5.91 $5.91 $6.06
$10.50
$5.97 $5.80
$0.00
$2.00
$4.00
$6.00
$8.00
$10.00
$12.00
Pre-Harvest Harvest Post-Harvest
Semi-Skilled Other Supervisory Grower LaborContractor
Task and Employer Type
Mea
n W
age
per
Ho
ur
34 Findings from the National Agricultural Workers Survey: 1997-1998
Table 5. Farmworker Nominal and Real Hourly Wages (Based on 1998)
Year Nominal wages Real wages1989 5.24 6.891990 5.23 6.521991 5.57 6.661992 5.33 6.191993 5.46 6.161994 5.54 6.091995 5.71 6.111996 5.67 5.891997 5.89 5.981998* 6.18 6.18
*The average hourly wages of crop workers were calculated based on data from January toSeptember 1998.
Chart 23. Hourly Nominal and Real Wages (Based on 1998)12
3.00
3.50
4.00
4.50
5.00
5.50
6.00
6.50
7.00
7.50
1989 1990 1991 1992 1993 1994 1995 1996 1997 1998*
Real
Nominal
12 Consumer Price Index – Urban Wage Earners and Clerical Workers (Current Series); U.S. Allitems, 1998 = 100 – CWUR0000SAO; http://www.bls.gov/top20.html
Chapter 5: Characteristics of Farm Jobs and Farm Conditions 35
Table 6. Average Hourly Earnings of Crop Workers and Workers in the NonfarmPrivate Sector
YearAverage HourlyWages of Crop
Workers
Average HourlyWages of Production
Workers in thePrivate Non-farm
Sector *
Ratio of Hourly CropWorker Wages toPrivate NonfarmWorker Wages
1989 5.24 9.65 54.3%1990 5.23 10.01 52.2%1991 5.57 10.32 53.9%1992 5.33 10.57 50.4%1993 5.46 10.83 50.4%1994 5.54 11.11 49.8%1995 5.71 11.43 50.0%1996 5.67 11.81 48.0%1997 5.89 12.27 48.0%
1998** 6.18 12.78 48.4%1989-1998
PercentChange
17.9% 32.4% ________________
* Created by Aguirre International from BLS employer survey data: Nonfarm Payroll Statisticsfrom the Current Employment Statistics (National), National Employment, Hours, and Earnings:http://www.bls.gov/top20.html
**The average hourly wages of crop workers were calculated based on data from January toSeptember 1998.
Chart 24. Average Hourly Earnings of Crop Workers and Other Workers in thePrivate Sector
0.00
2.00
4.00
6.00
8.00
10.00
12.00
14.00
1989 1990 1991 1992 1993 1994 1995 1996 1997 1998**
Wag
es i
n n
om
inal
do
llar
s
Other workers
Crop Workers
36 Findings from the National Agricultural Workers Survey: 1997-1998
Fringe Benefits
Fringe benefits are uncommon for farmworkers, and a large share did not know whetherthey were entitled to such benefits. Few farmworkers (15%) received monetary bonuses fromtheir agricultural employers or labor contractors. Among those who did receive monetarybonuses, 56 percent identified them as seasonal bonuses, 24 percent as holiday bonuses, 12percent as incentive bonuses, and 7 percent as a bonus contingent on employer profits.
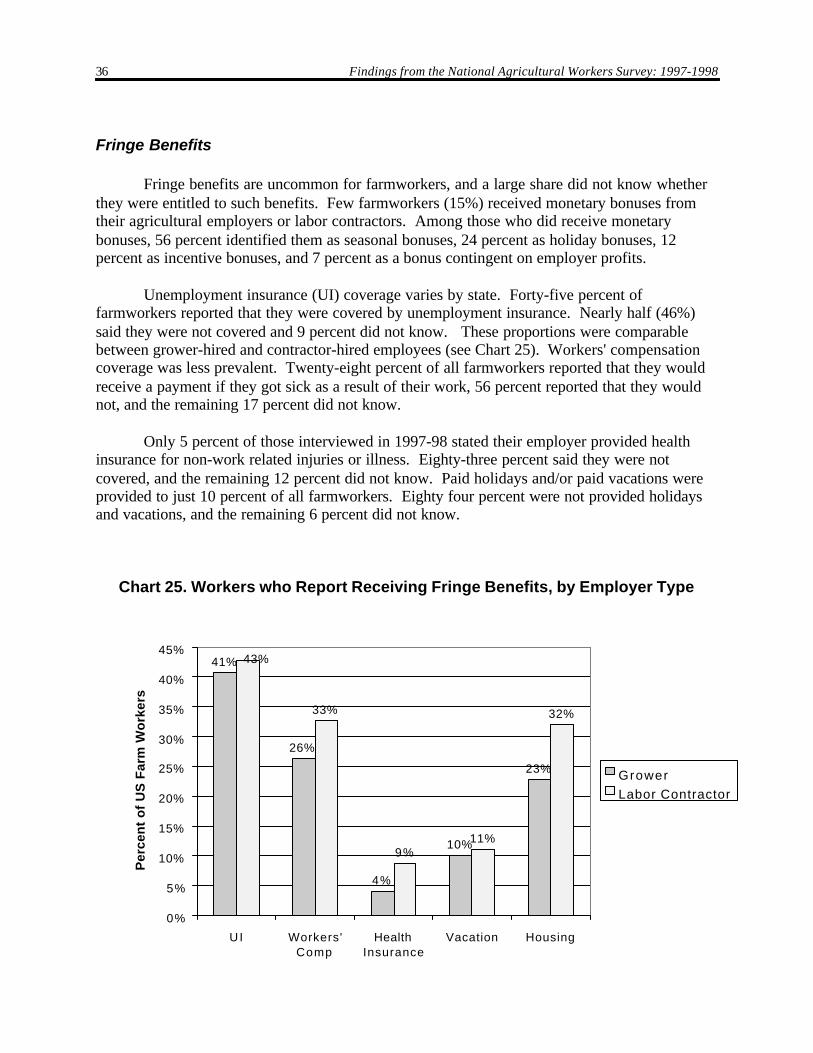
Unemployment insurance (UI) coverage varies by state. Forty-five percent offarmworkers reported that they were covered by unemployment insurance. Nearly half (46%)said they were not covered and 9 percent did not know. These proportions were comparablebetween grower-hired and contractor-hired employees (see Chart 25). Workers' compensationcoverage was less prevalent. Twenty-eight percent of all farmworkers reported that they wouldreceive a payment if they got sick as a result of their work, 56 percent reported that they wouldnot, and the remaining 17 percent did not know.
Only 5 percent of those interviewed in 1997-98 stated their employer provided healthinsurance for non-work related injuries or illness. Eighty-three percent said they were notcovered, and the remaining 12 percent did not know. Paid holidays and/or paid vacations wereprovided to just 10 percent of all farmworkers. Eighty four percent were not provided holidaysand vacations, and the remaining 6 percent did not know.
Chart 25. Workers who Report Receiving Fringe Benefits, by Employer Type
41%
26%
4%
10%
23%
33%
9%11%
32%
43%
0%
5%
10%
15%
20%
25%
30%
35%
40%
45%
UI Workers'Comp
HealthInsurance
Vacation Housing
Per
cen
t o
f U
S F
arm
Wo
rker
s
Grower
Labor Contractor

Chapter 5: Characteristics of Farm Jobs and Farm Conditions 37
Housing
In 1997-98, 21percent of all farmworkers received free housing from their agriculturalemployers, 7 percent rented from their employers, 47 percent rented from someone else, and 18percent owned their own home. The remaining 7 percent had various other arrangements.Farmworkers hired by a farm labor contractor were more likely to live in housing provided bytheir employer.
Meals
Virtually all farmworkers provided and paid for their own meals. Just 1 percent receivedfree meals from their employer and 2 percent paid for meals provided by their employer. In mostinstances, whenever meals were provided for free, the employer was a labor contractor.
Sanitation
Although drinking water was available to most farmworkers (98%), fully 2 percentreported not having access to drinking water at their work place. Sixteen percent reported nothaving water with which to wash, and 13 percent reported that toilets were not available while atwork.
Transportation
Almost all farmworkers (99%) incurred transportation costs. Just 1 percent receivedmoney from the employer for transportation expenses. Forty percent of farmworkers rode withothers to work, while 34 percent drove a car, 15 percent rode a labor bus, 8 percent walked and 3percent used public transportation. Of those who did not drive a car or walk, one-third paid a feeto the agricultural employer or contractor for a ride to work.
Equipment
Crop workers generally do not pay for their own equipment. The practice of requiringfarmworkers to supply their own equipment, however, is more common where a farm laborcontractor has hired the worker than when he/she is employed directly by the grower (33 vs.23%). About 70 percent of those hired directly by farmers reported that the employer suppliedtheir equipment. Of those hired by farm labor contractors, a smaller share (55%) said theiremployer paid for their equipment.

38 Findings from the National Agricultural Workers Survey: 1997-1998

Chapter 6: Income and Assets 39
Summary of Findings
Ø Nearly three-quarters of U.S. farmworkers earned less than $10,000 per year.Ø Three out of five farmworker families had incomes below the poverty level.Ø More than half owned a vehicle; four out of ten foreign-born workers owned a
house in their home country.Ø Few workers received needs-based social services. Nearly all of these received
Food Stamps.
Chapter 6: Income and Assets
Income
The NAWS codes respondent incomes categorically, making it impossible to report exactmedian incomes. Nonetheless, it is clear from these data that one half of all individualfarmworkers earned less than $7,500 per year and that one half of all farmworker families earnedless than $10,000 per year.
Consequently, 61 percent of all farmworkers, and 50 percent of those with 3 to 5 familymembers, had below poverty incomes (see Chart 26). Because this index is calculated for thehousehold rather than the individual, household structure impacts this classification somewhat.About 43% of childless married farmworkers fell below the poverty threshold. However, over60% of single farmworkers, and those who were married with children, and virtually all of thosewith 10 or more family members, fell below the poverty threshold. Foreign-born farmworkerswere considerably more likely to be impoverished than those born in the United States (65% vs.42%).
Farmworker Assets
Most farmworkers (87%) owned some assets in the United States. Forty-four percentowned a vehicle, although U.S.-born farmworkers were more likely to do so than foreign-bornworkers, 63% as compared to less than 40% respectively.
Less than half of all farmworkers owned assets abroad. Forty-three percent owned orwere buying a house abroad, as compared with just 14 percent who owned, or were buying ahouse in the United States.

40 Findings from the National Agricultural Workers Survey: 1997-1998
Chart 26. Incomes Below Poverty Level, by Family Size
Use of Services
Despite the low annual incomes of farmworkers, few used contribution-based services,such as unemployment insurance, disability insurance or social security. The service mostfrequently used by farmworkers was unemployment insurance. One-fifth of all farmworkersreported that they or someone in their family received benefits from unemployment insurancewithin the past two years (see Chart 27). Just 1 percent of all farmworkers utilized disabilityinsurance or social security.
Chart 27. Households Receiving Payments From "Contribution-Based" Programs
0%
10%
20%
30%
40%
50%
60%
70%
80%
90%
100%
1 2 3 4 5 6 7 8 9 10+
Number in Family
Per
cen
t o
f F
arm
Wo
rker
Ho
use
ho
lds
Th
at A
re P
oo
r
20%
1% 1%
0%
10%
20%
30%
40%
50%
60%
70%
80%
90%
100%
Unemployment Ins. Disability Ins. Social Security
Service
Per
cen
t o
f U
S F
arm
Wo
rker
s
Chapter 6: Income and Assets 41
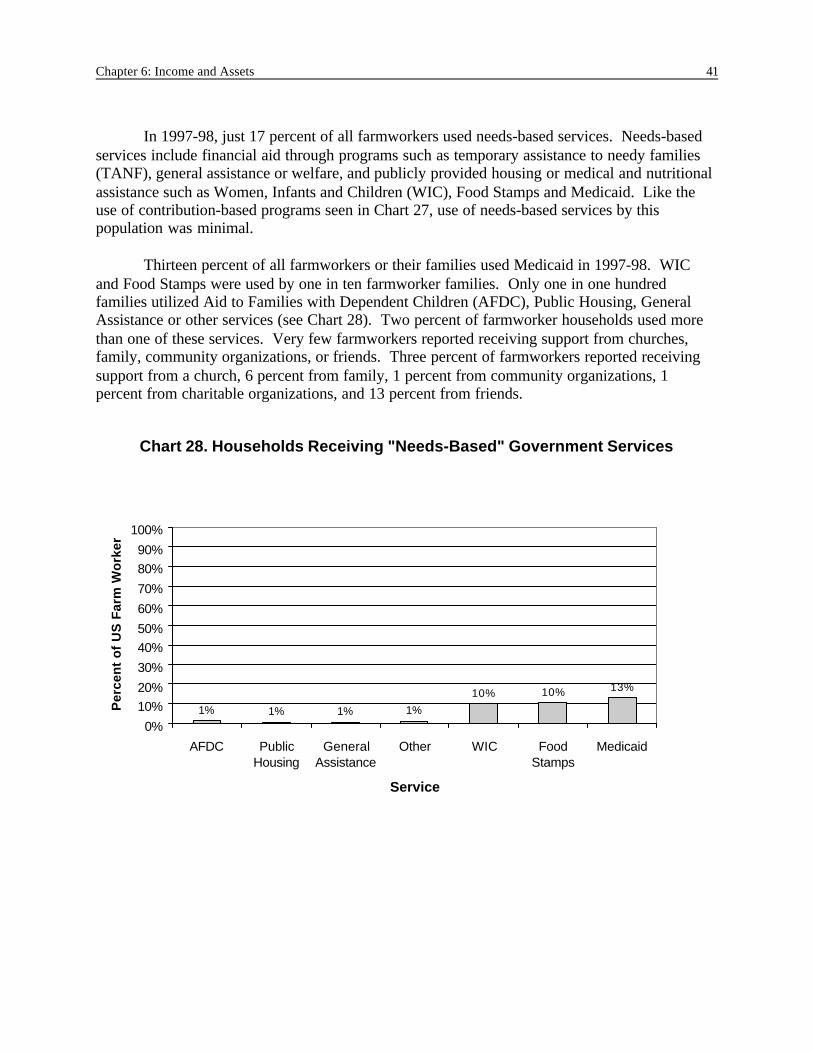
In 1997-98, just 17 percent of all farmworkers used needs-based services. Needs-basedservices include financial aid through programs such as temporary assistance to needy families(TANF), general assistance or welfare, and publicly provided housing or medical and nutritionalassistance such as Women, Infants and Children (WIC), Food Stamps and Medicaid. Like theuse of contribution-based programs seen in Chart 27, use of needs-based services by thispopulation was minimal.
Thirteen percent of all farmworkers or their families used Medicaid in 1997-98. WICand Food Stamps were used by one in ten farmworker families. Only one in one hundredfamilies utilized Aid to Families with Dependent Children (AFDC), Public Housing, GeneralAssistance or other services (see Chart 28). Two percent of farmworker households used morethan one of these services. Very few farmworkers reported receiving support from churches,family, community organizations, or friends. Three percent of farmworkers reported receivingsupport from a church, 6 percent from family, 1 percent from community organizations, 1percent from charitable organizations, and 13 percent from friends.
Chart 28. Households Receiving "Needs-Based" Government Services
1% 1% 1% 1%
10% 10% 13%
0%
10%
20%
30%
40%
50%
60%
70%
80%
90%
100%
AFDC PublicHousing
GeneralAssistance
Other WIC FoodStamps
Medicaid
Service
Per
cen
t o
f U
S F
arm
Wo
rker
s

42 Findings from the National Agricultural Workers Survey: 1997-1998

Appendix: Statistical Procedures 43
Appendix: Statistical Procedures
This section describes the statistical procedures used to analyze NAWS data for thisreport. Further details on the statistical procedures can be obtained from the NationalAgricultural Workers Survey Web site athttp://www.dol.gov/dol/asp/public/programs/agworker/naws.htm.
NAWS Weighting Procedure
According to the probability of inclusion, post-sampling weights are constructed takinginto account the year, season and region in which the farmworker was sampled as well as thenumber of days per week worked by the farmworker. Details on post sampling weights can beobtained in the Public Access Documentation located at the NAWS Web site.
Determining Standard Error
A standard error is a quantitative measure of the accuracy of a given calculation of astatistic, such as a mean or a median. For example, if the parameter we are calculating is theaverage age of the NAWS farmworker population during 1997-98, then the standard errorrepresents the differences between the mean obtained and the means that would be obtained byseveral repetitions of the survey.
The standard error is often confused with the standard deviation. The standard deviationis a measure of the variability relative to the mean, while the standard error is a measure of theaccuracy of a statistic. To clarify, the average age of farmworkers is 31. Calculating thestandard deviation of this variable (12.3) tells us that while the average farmworker is 31 yearsold, 68 percent of all farmworkers fall between the ages of 19 and 44. In contrast to the standarddeviation, the standard error is a measure of the accuracy of the estimated average age offarmworkers (31 years). The standard error obtained using 500 artificial replications produced avalue of 0.19. This means that if the NAWS survey were conducted 500 times, the estimate of31 years as the average age would only change by one-fifth of one year, meaning that theestimate is highly accurate.
Repeating the entire survey, of course, is an unfeasible option. Instead, statisticians use astatistical technique called bootstrapping to perform experiments that simulate several surveysfrom the data obtained through one survey. Table A.1 presents the means and standard errors forthe variables discussed in this report.

44 Findings from the National Agricultural Workers Survey: 1997-1998
Table A.1. Means and Standard Errors for Continuous and Dichotomous Variables
Variable Mean/Percentage Standard ErrorDEMOGRAPHIC VARIABLES
Age 31.30 0.1907Gender is Female 20% 0.0056Hispanic 90% 0.0042Years in U.S. 9.88 0.1718Nuclear Family Member Lives inHousehold 37% 0.0075Foreign born 81% 0.0058Children in Household 0.53 0.0189Total Children 1.06 0.0248Non-Resident Children 0.53 0.0191
Family CompositionFarmworker is a Parent 45% 0.008Lives with Parents 4% 0.0024Married no Children 11% 0.005Other Family Composition 40% 0.0074 100%
Marital StatusMarried 52% 0.0076Separated/Divorced/Widowed 6% 0.0038Single 43% 0.0077 100%
Primary LanguageSpanish 84% 0.0051English 12% 0.0042Other 5% 0.0035 100%
Place of BirthAsian-born (inc. Pacific) 1% 0.0015Caribbean-born Non-Latino 0% 0.0002Haitian 0% 0.0009Mexican-born 77% 0.0068Non-Mexican born Latino 2% 0.0034
Appendix: Statistical Procedures 45
Place of Birth (continued)U.S.-born African American 1% 0.0014U.S.-born Hispanic 9% 0.0045U.S.-born White 7% 0.0032Other U.S.-born 2% 0.0018Other Place of Birth 0% 0.0003 100%
Ethnicity (global)White 63% 0.0076Black/African American 2% 0.0023American Indian/AlaskanNative/Indigenous 9% 0.0035Asian/Pacific Islander 2% 0.0016Other 25% 0.0069 100%
Ethnicity (Hispanic)Chicano 0% 0.001Mexican 79% 0.0065Mexican American 6% 0.0036Other Hispanic 2% 0.0031Puerto Rican 3% 0.0029Other Ethnicity 10% 0.0042 100%
Ability to Read EnglishNot at All 53% 0.0078A Little 22% 0.0069Somewhat 7% 0.0038Well 19% 0.0058 100%
Ability to Speak English (if English is not the primary language)Not at All 45% 0.0077A Little 28% 0.007Somewhat 8% 0.0043Well 19% 0.0057 100%
EducationHighest Grade Completed 6.91 0.0556Adult Education 22% 0.0061

46 Findings from the National Agricultural Workers Survey: 1997-1998
Place of Last SchoolingAsia 0% 0.0004Central America 2% 0.0031Caribbean 0% 0.001Mexico 73% 0.0074Pacific Islands 1% 0.0013Puerto Rico 3% 0.0028South America 0% 0.0003South East Asia 1% 0.001United States 21% 0.0062Other Place of Schooling 0% 0.0004 100%
Farmworker Participation in ClassesEnglish/ESL Classes 8% 0.0043Citizenship Classes 1% 0.0021Literacy Classes 0% 0.0006Job Training Classes 1% 0.0019GED/High School Equivalency Classes 9% 0.004College/University Classes 3% 0.0025Adult Basic Education Classes 1% 0.0017Even Start Classes 0% 0.0005Migrant Education 0% 0.0009Other Classes 2% 0.002
INCOME AND ASSETSFamily Income Below the Poverty Line 61% 0.0077
Percentage of Farmworkers by Personal Income Categories<$500 20% 0.0036$500-$999 3% 0.0021$1,000-$2,499 8% 0.0041$2,500-$4,999 13% 0.0057$5,000-$7,499 16% 0.0066$7,500-$9,999 13% 0.0065$10,000-$12,499 11% 0.0058$12,500-$14,999 6% 0.0049$15,000-$17,499 4% 0.0037$17,500-$19,999 2% 0.003$20,000-$24,999 3% 0.0027$25,000-$29,999 1% 0.0011
Appendix: Statistical Procedures 47
Percentage of Farmworkers by Personal Income Categories (continued)$30,000-$34,999 1% 0.0006$35,000-$39,999 0% 0.001>$40,000 0% 0.0004 100%
Percentage of Farmworkers by Family Income Categories<$500 19% 0.0035$500-$999 2% 0.0018$1,000-$2,499 5% 0.0038$2,500-$4,999 10% 0.005$5,000-$7,499 13% 0.0058$7,500-$9,999 12% 0.0063$10,000-$12,499 11% 0.0057$12,500-$14,999 7% 0.0048$15,000-$17,499 5% 0.0037$17,500-$19,999 4% 0.0036$20,000-$24,999 5% 0.0037$25,000-$29,999 2% 0.0022$30,000-$34,999 2% 0.0023$35,000-$39,999 1% 0.0016>$40,000 3% 0.0022 100%
Assets and DwellingsAny Assets13 87% 0.0048Assets Abroad 45% 0.0076Owns a Vehicle 44% 0.0077Own a Dwelling Abroad 43% 0.0073Own a Dwelling in U.S. 14% 0.006
Aid ReceivedPublic Aid in Past Two Years 17% 0.0056Use of Any Charity 22% 0.0047Use Of Charitable Organizations 4% 0.0033Use of Charity from Individuals 19% 0.0038Use Needs-Based Programs 2% 0.002Use Contribution-Based Programs 22% 0.0066
13 The farmworker owns at least one plot of land, house, mobile home, car/truck, business, orother property in the United States or abroad.
48 Findings from the National Agricultural Workers Survey: 1997-1998
Household Used the Following BenefitsAFDC 1% 0.0018Food Stamps 10% 0.0046Disability Insurance 1% 0.0013Unemployment Insurance 20% 0.0065Social Security 1% 0.0018Veteran’s Pay 0% 0.0004General Assistance or Welfare 1% 0.0012Low Income Housing 1% 0.0014Government Health Clinic 0% 0.0009Medicaid 13% 0.0055WIC 10% 0.0049Disaster Relief 0% 0.0005Legal Services 0% 0Other Social Programs 1% 0.0021
Household Received the Following Types of AidChurch 3% 0.0027Family 6% 0.0023Community Organizations 1% 0.0017Charitable Organizations 1% 0.0014Friends 13% 0.0032
CURRENT LEGAL STATUS AND LEGAL APPLICATIONCurrent Status
Citizen 22% 0.0063Green Card 24% 0.0074Unauthorized 52% 0.0077Work Authorization 2% 0.0024 100%
Legal ApplicationLegalization Applicant 16% 0.0062Family Program 11% 0.0054Other Authorization 3% 0.0035Unauthorized 52% 0.0077Citizen by Birth 19% 0.0058 100%
Farmworkers’ Home BaseAbroad 42% 0.0072United States 58% 0.004

Appendix: Statistical Procedures 49
Migrant TypeFollow-the-Crop 17% 0.0067Non-Migrant/ Settled 44% 0.0082Shuttle 39% 0.0066 100%
WORK CHARACTERISTICSYears in Farmwork 8.15 0.1447Hourly Wage 5.94 0.0255Number of Weeks Spent AbroadDuring year 12.53 0.1847Number of Weeks Doing U.S.Farmwork 24.91 0.2226Number of Weeks Doing Non-Farmwork in U.S. 4.09 0.1027Number of Weeks Not Working in U.S. 9.82 0.1633Hours Worked Per Week in Farmwork 38.05 0.2352Employer is a Grower 81% 0.0053Employer is a Farm Labor Contractor 19% 0.0053Work for Employer on a Seasonal Basis 83% 0.0065Work for Employer Year Round 14% 0.0064
CropField Crop 16% 0.0045Fruit & Nuts 33% 0.0075Horticulture 14% 0.0059Miscellaneous or Multiple Crops 9% 0.0041Vegetables 28% 0.0073
100% Task
Harvest 32% 0.0073Other Tasks 6% 0.004Post-Harvest 15% 0.0048Pre-Harvest 22% 0.006Semi-Skilled 25% 0.0066Supervisory 0% 0.0003
100%
Method of PaymentHourly 77% 0.0069Piece 20% 0.0065

50 Findings from the National Agricultural Workers Survey: 1997-1998
Method of Payment (continued)Combination of Hourly & Piece 2% 0.0029Salary 1% 0.0019 100%
Method of Transportation to WorkCar 34% 0.0075Walk 8% 0.004Car Pool 40% 0.0069Public Transportation 1% 0.0009Labor Bus 15% 0.0052Other 2% 0.0024 100%
Transportation to WorkPay Grower for Rides to Work 34% 0.0106Have to Use Labor Bus (is it obligatory) 9% 0.0066
Equipment Expenses Covered ByGrower 69% 0.0072Farmworker 14% 0.0064Farmworker Pays Some 9% 0.0044Equipment not Needed 8% 0.0038Contractor 0% 0A Friend/Relative 0% 0.0003Other 0% 0.0004 100%
Bonus and InsuranceHealth Insurance for Workplace Injuries 71% 0.0069Unemployment Insurance 45% 0.0078Payment for Workplace Injuries 33% 0.0082
Bonus 15% 0.0065Paid Holidays/Vacation 11% 0.0055Health Insurance for Off the JobInjuries 6% 0.0045
Type of Bonus (if bonus received)End of Season Bonus 56% 0.0177Holiday Bonus 24% 0.0153Incentive Bonus 12% 0.0129Bonus Dependent on Grower Profit 7% 0.0064

Appendix: Statistical Procedures 51
Type of Bonus (continued)Money for Transportation 0% 0.0053
Method of Contact Between Employee and Employer(if farmwork on a seasonal basis)
Employer Contacts Worker for FutureEmployment Before End of the Season 6% 0.0048
Employer Contacts Worker for FutureEmployment by Letter 1% 0.003
Employer Contacts Worker for FutureEmployment by Phone 19% 0.0078
Employer Contacts Worker for FutureEmployment by Someone Else 32% 0.0074Employee Contacts Employer 33% 0.0083
Method of RecruitmentApplied on Own 26% 0.0071Day Laborer/Picked Up at a Shape Up 0% 0.0002Recalled After Layoff 0% 0.0004Standing Agreement 0% 0.0005Recruited by Grower/Foreman 1% 0.0014Recruited by FLC/Foreman 1% 0.0019Referred by Employment Service 1% 0.0017Referred by Welfare Office 0% 0.0005Referred by Relative/Friend orWorkmate 70% 0.0072Referred by Labor Union 0% 0.0006
Source of HousingFarmworker Rents from non-Employer 47% 0.0074Employer Provides Free Housing forFarmworker 21% 0.0058Farmworker Owns the House 18% 0.0064Farmworker Rents from Employer 7% 0.0037
Employer Provides Free Housing forFarmworker and His/Her family 3% 0.0026Farmworker Rents from Government orOther Institution 1% 0.0014Farmworker Receives Free Housingfrom Government or Other Institution 0% 0.0006
52 Findings from the National Agricultural Workers Survey: 1997-1998
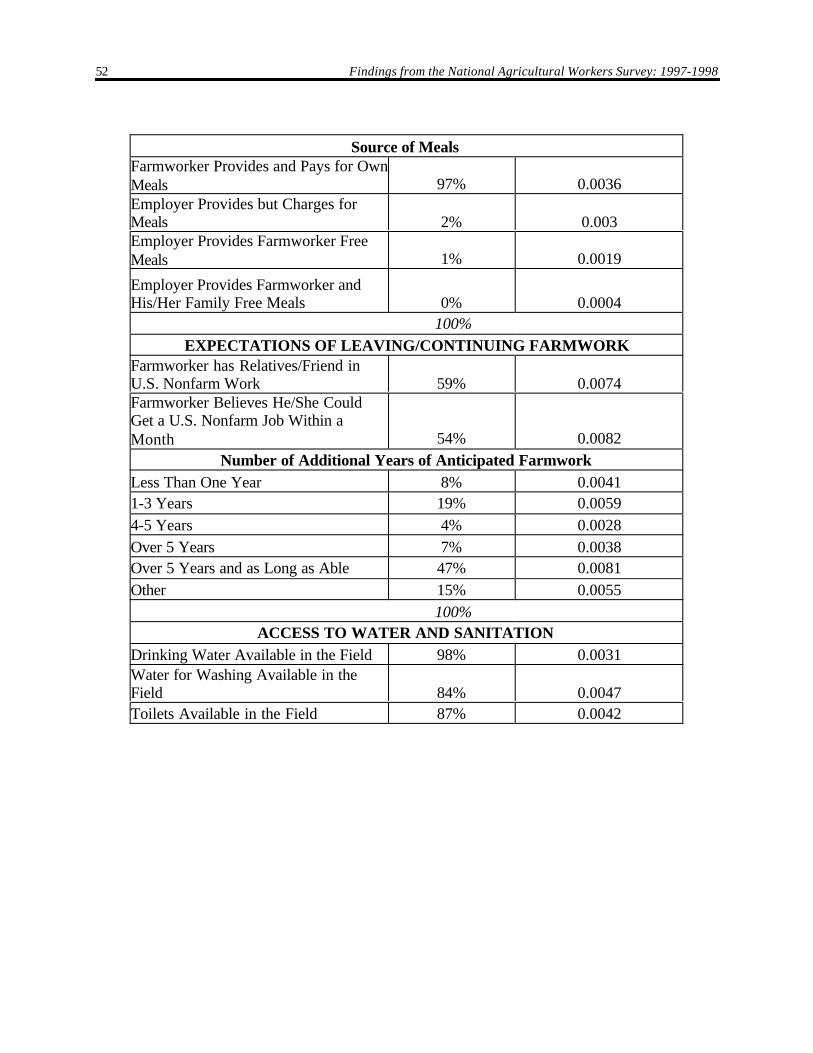
Source of MealsFarmworker Provides and Pays for OwnMeals 97% 0.0036Employer Provides but Charges forMeals 2% 0.003Employer Provides Farmworker FreeMeals 1% 0.0019
Employer Provides Farmworker andHis/Her Family Free Meals 0% 0.0004 100%
EXPECTATIONS OF LEAVING/CONTINUING FARMWORKFarmworker has Relatives/Friend inU.S. Nonfarm Work 59% 0.0074Farmworker Believes He/She CouldGet a U.S. Nonfarm Job Within aMonth 54% 0.0082
Number of Additional Years of Anticipated FarmworkLess Than One Year 8% 0.00411-3 Years 19% 0.00594-5 Years 4% 0.0028Over 5 Years 7% 0.0038Over 5 Years and as Long as Able 47% 0.0081Other 15% 0.0055 100%
ACCESS TO WATER AND SANITATIONDrinking Water Available in the Field 98% 0.0031Water for Washing Available in theField 84% 0.0047Toilets Available in the Field 87% 0.0042